


Abstract
The HEROn magazine was created as an innovation project by the S-TEAM team for the 2024/2025 SUBMERGED season of the FIRST® LEGO® League Challenge category. The primary aim of the HEROn project was to implement game-based learning methods to enhance environmental awareness, particularly concerning the protection of our water resources. This initiative is designed to engage individuals from ages 9 to 99 in a creative and enjoyable manner. At the core of the HEROn project is a well-known game that challenges players to find the differences between two photos. This activity not only provides entertainment but also educates participants about the importance of protecting and preserving the aquatic environment. By discovering subtle differences between images, players become more attuned to environmental issues, which promotes a deeper understanding and appreciation of water conservation. The chapters of the HEROn magazine are thoughtfully organised into themes, each focusing on various aspects of water’s importance, its protection, and sustainable usage. Additionally, a random sample of participants was surveyed to gather opinions and feedback on HEROn magazine as part of the project and this research. This feedback is invaluable for assessing the magazine’s impact and for improving future editions to better serve the goals of raising environmental consciousness. The online HEROn questionnaire consisted of 10 items and employed a 5-point Likert scale for responses. Data were collected over a three-month period (28 January–28 April 2025), with 630 Hungarian respondents participating in the survey. The HEROn magazine was generally well received, with mean scores ranging from 4.2 to 4.6. Age-group differences were examined using nonparametric Kruskal–Wallis tests, with Dunn–Bonferroni post hoc comparisons. These analyses show statistically significant differences between adults (30–89) and the younger cohorts for aggregated awareness, design/engagement, and branding measures, while teenagers (9–15) and young adults (16–29) did not differ significantly from each other. The Find-the-Difference game showed the greatest variability across groups, with young adults giving the lowest mean.
1. Introduction
Water is fundamental to life on Earth. It is crucial for various biological processes and the overall functioning of ecosystems (Westall & Brack, 2018). Water protection is a fundamental issue. Safeguarding water resources is essential to protecting ecosystem health, supporting biodiversity, and providing safe drinking water for human populations. Given the threats posed by pollution, climate change, and over-extraction, prioritising water conservation and sustainable management practices is crucial for maintaining the balance and quality of this vital resource. Effective policies, public awareness, and community involvement are necessary to address these challenges and promote the long-term sustainability of water systems (Makanda et al., 2022). Effective water protection requires education as a key component (Peckumn, 2003). Raising awareness about the importance of water resources and the impact of human activities on these systems helps foster responsible behaviours and practices. Through educational programs, individuals and communities can learn about sustainable water management, pollution prevention, and the significance of preserving aquatic ecosystems (Pahl-Wostl et al., 2008). Providing knowledge can encourage active participation in conservation efforts and foster a culture of stewardship essential for safeguarding water resources for future generations.
In recent decades, many educational programmes have emerged to raise awareness of water-related issues (Amahmid et al., 2019; Pozo-Muñoz et al., 2023). Educational robotics is also a powerful tool to foster environmental awareness among students. An excellent example is the ROBOAQUARIA project, where students actively engage in water conservation by designing and programming robotic platforms to monitor vital aquatic parameters Puškar et al. (2023). These initiatives aim to inform communities about the critical importance of water conservation, the challenges posed by pollution, and the sustainable management of water resources. By engaging students, families, and local organisations, these programs foster a greater understanding of the role water plays in environmental health and human well-being. At the same time, a review of McCarroll and Hamann (2020) underscores that water literacy is inconsistently defined, often biased towards human perspectives, and disproportionately focuses on cognitive knowledge. Their analysis reveals significant and persistent knowledge gaps and misconceptions among students and adults, spanning the scientific, local, functional, and hydrosocial aspects of water. To address this, they propose a holistic framework that integrates diverse knowledge types, attitudes, and behaviours. Key recommendations include using improved visuals, place-based learning, and interdisciplinary curricula to make water education more effective and relevant. The authors also emphasise a reflective, iterative approach linking student and adult programs. Moreover, the conclusions of McCarroll and Hamann (2020) include that game-based learning approaches, such as interactive simulations, have, in many cases, successfully increased water awareness and knowledge.
Game-based learning (GBL) means the use of games for educative purposes and aimed to improve the user knowledge and experience (Debrenti, 2024a). GBL is an extremely promising and, in many cases, proven effective method for disseminating knowledge about water sustainability and raising awareness (Bilancini et al., 2023; Cheng et al., 2019; Despland et al., 2025; Vianna et al., 2026; Yang et al., 2022). In an educational landscape increasingly focused on holistic engagement and the cultivation of 21st-century skills, GBL presents a uniquely potent methodology, particularly in its capacity to simultaneously address and engage diverse age groups. Unlike traditional didactic approaches that often struggle to resonate across diverse stages of cognitive and developmental development, GBL offers a dynamic platform where children, adolescents, and adults can engage with complex topics, such as water sustainability, through a shared, compelling experience. A primary strength of GBL lies in its inherent scalable complexity and universal engagement. Beyond individual involvement, GBL powerfully facilitates intergenerational interaction and collaborative learning (Fonseca et al., 2023; Perim et al., 2024). Moreover, GBL effectively caters to various learning styles, ensuring that individuals in all stages of development can absorb and process information in ways that best suit their preferences. The effectiveness of GBL isn’t confined to a single format; both non-digital (analogue) and digital games offer robust and complementary learning environments, each with distinct advantages that can be leveraged to achieve educational objectives (Debrenti, 2024b). Given the increasingly widespread use of digital learning tools, understanding how non-digital and digital games contribute to the learning process can provide essential insights for developing best practices for integrating games into education (Szörényi et al., 2026). The comprehensive set of these advantages was what informed the creation of the HEROn Magazine, developed during within the framework of an FIRST® LEGO® League (FLL) Challenge innovation project in the SUBMERGED season. A Hungarian FLL team, S-TEAM (University of Miskolc), worked on the HEROn project and created the HEROn Magazine with the involvement of experts. Recognising the power of GBL to transcend age and engagement barriers, the HEROn Magazine was designed to leverage these principles. By integrating game elements, the magazine aims to engage readers from different generations simultaneously, fostering a shared understanding of complex issues and inspiring collective action to connect water.
This paper presents research related to HEROn Magazine, which was widely distributed during the HEROn project and offered opportunities for voluntary responses to assess its impact, user participation, and overall effectiveness as a sustainability tool. The study was conducted in Hungary.
The paper is structured as follows: The next chapter briefly introduces the FLL Challenge category and details the expectations for the SUBMERGED season’s innovation project, followed by presentations on the HEROn project and HEROn Magazine. The Research Objectives and Research Questions section outlines the specific aims and inquiries guiding the analysis of the collected responses, with the goal of understanding how a game-based learning magazine influences water literacy across diverse audiences. The Methodology section describes the research approach used to address the questions, and the Results section presents the findings. The Discussion section provides a comprehensive interpretation of the results and directly answers the research questions. The Conclusions section summarises the study’s key findings and limitations.
2. FIRST® LEGO® League and Seasons
The FLL is a global competition designed to inspire young people to pursue careers in science, technology, engineering, arts, and mathematics (STEAM). It combines robotics, research, and teamwork to address real-world challenges (Graffin et al., 2022). FLL is a STEAM program for kids aged 4–16 that uses LEGO® elements and sets to teach robotics and coding through themed challenges, fostering creativity and problem-solving skills for future tech careers. The program is divided into three divisions (Discover, Explore, Challenge) to cater to different age groups, with a focus on hands-on learning to develop skills and inspire innovation in science, technology, engineering, and mathematics. Discover (ages 4–6) introduces young children to hands-on STEM through playful activities with LEGO® DUPLO bricks; Explore (ages 6–10) builds on that foundation by teaching basic engineering, design thinking, and introductory coding, often using LEGO® Education SPIKE Essential; and Challenge (ages 9–16) engages teams in a cooperative, friendly competition that emphasizes research, creative problem-solving, engineering practices, and programming as they design and operate a LEGO® robot (Figure 1 and Figure 2).
Figure 1.
Official photos from the Hungarian FFL national final in the SUBMERGED season. (a) Team members and judges during the robot game. (b) The judges award points at the end of the run. Publicly available photos from Tamás Földi (https://www.folditamas.com/, accessed on 22 May 2026).
Figure 2.
Competition LEGO® robots of S-TEAM (University of Miskolc). (a) In the MASTERPIECE season. (b) In the SUBMERGED season. The photos were taken by the authors.
Every FLL season is built around a single, real-world theme that guides both the robot missions and the research project teams present to judges. Recent seasons have included Cargo Connect (2021–2022), SUPERPOWERED (2022–2023), MASTERPIECE (2023–2024), SUBMERGED (2024–2025), and UNEARTHED (2025–2026), each giving teams a different context—transportation and logistics; energy and power; the intersection of STEM and the arts; ocean exploration; and archaeology-inspired investigation, respectively. Teams design and program robots to complete theme-related tasks on the mat and also research and present a project that connects to the season’s theme, so when a new theme is announced, many teams immediately start developing project ideas that explore real problems within that topic (Kelly & Daudelin, 2008).
FLL currently involves over 679,000 students in approximately 110 countries (FIRST, 2025). The first FLL competition was held in the 1998/1999 school year (Kelly & Daudelin, 2008). Since then, the FLL community has grown steadily, and its popularity has remained strong worldwide. The history of FLL competitions in Hungary dates back to the early 2010s. Since 2020, it has operated as an independent national region and the official Hungarian championship. Figure 1 shows two photos from the Hungarian championship final of the SUBMERGED season.
2.1. FIRST® LEGO® League Challenge Division
Participants in the Challenge division, typically aged 9–16, work in teams to design, build, and program robots to complete tasks on a themed playing field while also conducting research projects related to the theme. The program encourages creativity, critical thinking, and collaboration. Teams now work with the LEGO® Education SPIKE™ Prime set, although all earlier LEGO® robot kits are still permitted. Robots built from original team designs must be made only from LEGO® elements (Figure 2).
The rules are defined in the official, annual FLL Challenge documents. These include the Robot Game (Mission) rules that specify game play, missions, robot-building limits (e.g., permitted LEGO® elements and motor counts) and scoring; the Project/Innovation Guide that sets requirements for research, solution development and presentation; and the General/Season and Safety Rules that cover eligibility, competition procedures, and safety requirements. The current season’s Challenge documents are authoritative, so teams should download the latest versions from the official or national FLL website.
The four pillars of FLL Challenge Division are designed to develop well-rounded young engineers (Jin et al., 2024). Core Values emphasise teamwork, discovery, and Gracious Professionalism®, guiding how teams collaborate and compete. The Innovation Project encourages research, creativity, and real-world problem-solving as teams identify a challenge and propose an inventive solution. Robot Design focuses on engineering principles, iterative building, and thoughtful documentation of design choices. Programming and the Robot Game test coding skills, strategy, and the ability to reliably complete missions on the game field. Together, these pillars nurture technical skills, communication, and a passion for learning.
Each season begins in early August and runs until the end of July of the following year, aligning with the school year. The official FLL Challenge set includes a playmat and LEGO® models (Figure 3). Nowadays, building instructions are available online.
Figure 3.
Official FLL Challenge set in the SUBMERGED season.
Participants work for several weeks, either as a team or as a class, tackling a shared project like real engineers. They plan, design, and program an autonomous LEGO® robot, conduct research on a self-chosen topic, and create a presentation of their findings (Harris, 2013). A team consists of 3 to 10 members and is guided by at least one adult mentor, such as a teacher or parent (Štefanovič, 2023). Teams can be formed in educational institutions like schools, libraries, and clubs, or within private settings. Over a period of at least 12 weeks, students meet regularly to research, build, and program together. At the end of the season, teams present their results at a regional tournament, where they are evaluated by judges and referees in four categories: Robot Game, Innovation Project, Robot Design, and Core Values. The best teams have the opportunity to qualify for advanced competitions (Figure 1). In Hungary, the regional finals are followed by the national competition in February, and the winner advances to the World Festival.
The World Festival (also known as the FIRST Championship) is FLL’s annual global finale where top teams from national and regional qualifiers, along with invited guests and wild-card entrants, compete and showcase their work. The event features Robot Game competitions, Innovation Project presentations, and Core Values evaluations, plus awards, workshops, keynote talks, exhibitor booths, and networking opportunities. Held once a year in Houston (Texas, USA), the Festival celebrates STEM achievement, shares best practices, and fosters international connections (Kelly & Daudelin, 2008).
2.2. Water-Focused FLL Seasons
Water is a frequent and recurring theme throughout the history of FLL seasons because it relates to real, current, and global issues that bring together the natural and social sciences, engineering, and coding; it can be easily adapted for different age groups; and it offers creative, hands-on project and robotics challenges. FLL has had three seasons with a primary water theme:
- 2005/2006—OCEAN ODYSSEY: focused on ocean and marine environments. Teams explored topics such as marine habitats, shipwreck exploration, underwater vehicles, and pollution cleanup (e.g., oil spills), with Robot Game missions and Projects centered on solving real ocean-related problems.
- 2017/2018—HYDRO DYNAMICS: examined how we find, transport, use, and manage water. Projects required identifying a real-world water challenge and proposing solutions; Robot Game missions simulated tasks like repairing pipes, transporting inspection equipment, watering plants, extinguishing fires, and delivering water-related devices.
- 2024/2025—SUBMEREGED: centred on exploring ocean layers, marine habitats, and ocean sustainability. Robot Game missions and Project prompts target ocean-focused goals, such as coral nursery support, submersible deployment, sonar discovery, sample collection, and feeding/monitoring marine animals. Innovation projects in the SUBMERGED season focused on marine exploration and discovery of the ocean with the help of innovative, realistic solutions.
The logos for each season are shown in Figure 4.
Figure 4.
Water-focused FLL seasons. (a) 2005/2006. (b) 2017/2018. (c) 2024/2025.
2.3. FIRST® LEGO® League Innovation Project
In the FLL innovation project, students are assigned the responsibility of researching, developing prototypes, and presenting an innovative solution to a real-world issue related to the competition’s theme (Chen, 2019). As they work through their project design process, teams must interact with professionals, experts, and individuals impacted by the issue, gathering their feedback on the proposed design solution (Graffin et al., 2022).
Regarding the Innovation Project category, judges assess three core skill areas: research, innovative solution, and solution development. Research covers identifying the problem, finding and evaluating information sources, and analysing the problem. The innovative solution area evaluates the team’s proposed solution, its originality, and the process by which it was developed; solution development refers to the systematic process used to select, refine, test, and improve the solution. The presentation is judged on how well the team shares their work, the creativity of the presentation, and its overall effectiveness. Taken together, these subskills indicate that the Innovation Project category aligns closely with the principles of project-based learning (Usart et al., 2019).
3. HEROn Magazine
Hungary is located in the heart of Europe. There is neither an ocean nor a sea nearby. Therefore, S-TEAM members had difficulty deciding which innovation project to undertake. The identified problem: although younger generations are more environmentally aware than previous generations, those living in the middle of the continent are not aware of many of the problems affecting the seas and oceans. After much brainstorming, the S-TEAM settled on a social innovation: they will create an educational magazine that combines seas and oceans with other forms of water, since even streams originating from the middle of the land flow toward them. This made it possible to address specific Hungarian issues, including the country’s aquatic habitats and national concerns about drinking water, while also considering the international context.
The HEROn Project aimed to promote water protection through game-based learning, offering an engaging and creative approach suitable for participants aged 9 to 99. Centred on safeguarding freshwater and marine environments, the program introduces learners to aquatic ecosystems, the impacts of pollution, and emerging solutions to reduce harm, alongside core concepts of sustainable water management. Using diverse games and activities, it enables both youth and adults to deepen their understanding and take practical steps toward conserving water.
3.1. HEROn Logo and Slogan
The great egret, the largest member of the white heron family, was chosen as the symbol of the HEROn project because it plays an important role in nature conservation in Hungary. The program established to protect it was launched as early as 1922, and the first heron ranger was the first nature conservation officer in Europe. The logo on the cover was designed and drawn by members of the S-TEAM (Figure 5).
Figure 5.
Cover of HEROn Magazine with logo and slogan. (a) Hungarian version (https://www.uni-miskolc.hu/gemprojekt/, accessed on 22 May 2026). (b) English version (https://www.uni-miskolc.hu/gemproject/, accessed on 22 May 2026).
“Think and assess: change starts with you!” For the HEROn project, this phrase links perfectly to its educational goals: encouraging careful observation of water-related issues, fostering understanding through assessment, and motivating personal and community action to protect aquatic environments. It conveys empowerment without blame, inviting learners of all ages to contribute to positive change. The slogan can also be seen on the cover of HERON Magazine (Figure 5). The HEROn magazine was originally published in Hungarian, but is also available in English, because the project was showcased at both Hungarian and international FLL competitions. Both versions are available online in a page-flip version and can be used for free.
The logo appeared on promotional materials and posters advertising the magazine. Eight hundred bamboo coasters were also produced to help HEROn Magazine reach as wide an audience as possible (Figure 6). The bamboo coaster is an accessory designed to encourage water consumption, yet it also serves as a practical, sustainable, and effective channel for spreading information. Coasters are items regularly used in homes and offices, serving as a recurring reminder to visit the educational materials. As an aesthetically pleasing gift, once distributed at the event, there is a greater chance that they will be kept and used rather than thrown away immediately. Furthermore, these gifts evoke positive associations and promote environmental awareness.
Figure 6.
HEROn logo on the double-sided bamboo coaster. The QR code shown on the bamboo coaster links to the HEROn Magazine (https://www.uni-miskolc.hu/gemproject/, accessed on 22 May 2026).
3.2. Description of the HEROn Magazine
HEROn Magazine is A4-size, printed on matte paper, and has a total of 99 pages. Of course, the online digital version is the same size (Figure 5). The chapters of the HEROn magazine are organised into themes that focus on the importance, protection and use of water. Each topic is presented on the right-hand side of the open magazine, while the left-hand side features the Find-the-Difference (FiDi) game: an original photo related to the topic above and a modified version below (see Figure 7). FiDi challenges, with three difficulty levels, offer an engaging way to encourage readers to observe their aquatic environment more closely and reflect on the issues raised. Solutions appear in a separate chapter at the back of HEROn magazine.
Figure 7.
Two-page spread showing a topic page (right) and the FiDi game with original and modified photos (left).
In addition, the publication contains useful information and additional challenges to help readers increase their knowledge and deepen their understanding of water. Each topic includes a “Did you know?” box in the bottom right corner, presenting an interesting data point or fact. In addition, a red-white-green-framed box (the colours of the Hungarian flag) highlights a Hungary-related connection to the topic, as shown in Figure 7. These activities and information are not only fun but also informative, helping to raise awareness of water conservation and important aspects of sustainable water management.
The manipulated photos for the FiDi games and their solutions were created in Adobe Illustrator 27.8.1, as were the other visual elements: the HEROn logo, the number puzzles, and the mazes. The HEROn magazine was produced using Adobe InDesign, which the team used to ensure professional print-ready preparation.
3.3. Didactic and Game Design Elements
Camilleri (2023) highlighted the importance of aligning game design with specific learning objectives during the preparation of the GBL. After reviewing the literature, the members of S-TEAM decided to choose the FiDi game as the basic game for HEROn Magazine and GBL. Numerous studies and classroom trials demonstrate that the FiDi games are an effective tool for learning. They strengthen observational skills and attention to detail by requiring careful comparison of visual elements. The varied, image-based content enhances motivation and enjoyment, while digital FiDi applications, with large image libraries and tiered levels, provide scalable, easily repeatable practice. Blending individual and collaborative tasks further fosters communicative interaction and peer-mediated learning. According to Liu et al. (2011, 2014), playing the FiDi game helps sharpen observational skills by training players to notice subtle visual details and differences between images. Regular play can improve concentration and visual processing speed through repeated focused comparison. The task’s paced, low-stakes nature often produces a relaxing, stress-reducing effect for players. Playing FiDi also offers an opportunity to browse and appreciate aesthetically pleasing images, turning the game into a casual visual-art experience. By combining cognitive training with gentle relaxation and exposure to attractive imagery, FiDi provides both mental exercise and simple entertainment. Eye-tracking evidence shows that FiDi tasks elicit focused visual search patterns (measurable in fixation count and duration) consistent with enhanced attention to detail (Józsa & Hámornik, 2011). Based on the observations of Amalia (2023), playing Find-the-Difference (FiDi) games’ varied picture bank and levels keep students motivated and make learning process more enjoyable than traditional solutions. Using a digital FiDi app reduces printing costs and offers easy access to many images and levels for repeated classroom use. Ahmad et al. (2025) investigated how motivation and engagement affect children’s performance in brain games played in two modes: single-player and face-to-face dual-player on desktop computers. Using a mixed-methods design with questionnaires, observations, and interviews, the authors evaluated three games (including FiDi) targeting memory, analytical reasoning, and visual search. The study compared players’ experiences and behaviour across modes, exploring how competitive and cooperative social dynamics influence motivation, engagement, and task performance. The results discussed differences between modes: single-player sessions tended to produce deeper individual engagement, while dual-player sessions increased motivation through social interaction, collaboration, and competition. Moreover, FiDi is suitable for multigenerational GBL. For example, Bayindir (2021) empirically demonstrated that the FiDi game, when played in a family museum setting, enhances parent–child interactions, increases the frequency of open-ended questions and scaffolding behaviours, and gives the child a more active role.
In the HEROn project, FiDi activities are designed around water-related themes, intended as an enjoyable yet educational tool, as shown in Figure 8. In this game, participants are shown two images that, at first glance, appear identical; each image portrays an aquatic ecosystem or a water-protection scenario. Players are tasked with carefully comparing the pictures to identify subtle discrepancies in the scenes, a process that directs their attention to elements of the environment they might otherwise overlook. By emphasising minute changes—such as litter on a shoreline, altered vegetation, or pollution evidence—the activity teaches that small details can signal significant environmental impacts. Because of the great egret’s importance to Hungarian water and nature conservation, great egrets appear in the images in the first two FiDi games. One of them can be seen in Figure 8.
Figure 8.
The second FiDi game in HEROn Magazine with Great Egrets. (a) Original photo. (b) Modified version with 5 differences. These photos can be found on page 6 of HEROn magazine.
By highlighting small changes (such as trash on the shore, discoloured coral, missing vegetation, or the sudden disappearance of wildlife), the FiDi challenge teaches players to recognise the visual signs that often precede or accompany real-world environmental damage. A small change noticed in a photo (such as a car tyre on the lakeshore, or fish and turtles, or artificial underwater structures) can raise questions about an underlying cause (a source of pollution, an infrastructure failure, or human activity) and its consequences (contamination, habitat loss, or a decline in biodiversity). During classroom or family discussions, these observations serve as a starting point for connecting individual visual cues to broader ecological processes, local environmental measures, and policy responses. As a visual logic exercise, it cultivates observational skills, patience and attentiveness across age groups while simultaneously reinforcing messages about conserving aquatic habitats. The game’s focus on water protection is woven into every image and prompt, encouraging participants to reflect on how everyday actions affect freshwater and marine environments. Ultimately, through repeated play and guided discussion, the HEROn find-the-difference activity aims to build greater awareness, inspire behaviour change, and contribute to the broader mission of creating a greener, more sustainable society that recognises the shared responsibility to protect and cherish water. For example, the chapter titled “New Solutions” on page 69 explains how plastic interceptor systems installed in rivers work. The connecting FiDi game can be seen in Figure 9 and its solution in Figure 10.
Figure 9.
FiDi game in HEROn Magazine on page 68. Above is the original photo; below is the modified version with 5 differences.
Figure 10.
Solution of the FiDi game in HEROn Magazine. (a) Original photo. (b) The solution.
The river plastic interceptor collects debris and contaminants floating on the water’s surface. Among the collected materials are significant amounts of natural wood, as well as human-generated waste: plastic and glass bottles, an aluminium soda can, and a basketball. Removal helps protect aquatic life and improve water quality. Analysis of the materials collected during the operation of the river interceptor under study highlights the dual role of these systems: on the one hand, the efficient collection of natural aquatic debris (e.g., floating wood), and on the other hand, the separation of anthropogenic waste—plastic and glass bottles, aluminium soda cans—and unexpected objects (such as a basketball). Based on this observation, it is recommended to handle the collected materials separately (organic and recyclable fractions), establish a regular emptying schedule to avoid overloading, and implement community awareness-raising measures to reduce the flow of waste.
According to Szigeti and Horváth (2012), the role of play in life is undeniable; therefore, it is worthwhile to use environmental education games to promote environmentally conscious behaviour. A game-inspired approach to learning, combined with social learning and self-motivation, is ideally suited for education aimed at sustainable development and leads to significant learning outcomes (Lindemann-Matthies et al., 2024). When used specifically with photos related to sustainability or environmental protection, the FiDi game can directly influence all three dimensions of environmental awareness: the cognitive, emotional, and behavioural dimensions. Since the game primarily develops visual attention and attention to detail, it is ideally suited for making changes in the environment visible and recordable. The cognitive dimension of the game can primarily help players deepen their visual identification of environmental problems and their understanding of the underlying connections. By comparing the images, participants can directly confront the consequences of human activity on water. This detail-oriented search process can help players internalise and organise basic sustainability concepts, making it easier to integrate positive patterns into their existing knowledge network. The game transforms passive information intake into active, analytical observation, which is the foundation of environmentally conscious critical thinking. The affective dimension centres on an emotional connection to nature and the internal reactions triggered by witnessing environmental damage. When players are confronted with the stark visual contrast between pristine and damaged ecosystems, the experience of discovery can elicit an immediate emotional response, such as empathy or outrage. This visual shock can help ensure that the issue of water protection does not remain merely a dry, theoretical subject for them, but becomes personally meaningful. Positive emotions experienced during the game can strengthen the bond between the individual and aquatic wildlife. This emotional engagement can awaken a sense of inner responsibility, which is essential for the theoretical knowledge they have acquired to develop into genuine inner motivation. The behavioural dimension serves as a bridge between the visual experiences and knowledge gained during the game and real-life, everyday environmentally conscious actions. While successfully identifying differences in FiDi games, players encounter concrete patterns of action that can shape future behavioural intentions, as the game encodes correct practices in memory as positive, solvable tasks. Furthermore, the awareness developed through the game can carry over into real life, enabling participants to more quickly identify water-related activities that harm the environment, as well as wasteful practices, in their daily lives. This heightened awareness can encourage participants to actively engage in water conservation and protection.
Educational initiatives play a crucial role in uncovering the structural causes of environmental degradation (Vianna et al., 2026). GBL should offer a diverse range of game types because learners have varied preferences, learning styles, and motivational triggers; that is why HEROn Magazine does just that. Different games target different skills—problem-solving, collaboration, creativity, repetition, or reflection—so variety ensures broader cognitive and affective engagement. A diverse game portfolio also supports differentiation for age, ability, and cultural background, preventing boredom and habituation. Alongside FiDi games, cross-puzzles are also included in the magazine to test the acquired knowledge. Cross-puzzles reinforce vocabulary and key concepts by encouraging active recall and contextual thinking. They promote problem-solving and pattern recognition while offering a low-pressure, engaging way to review learning material. According to Alika and Radia (2021), the use of cross-puzzles in science education as a GBL tool increases student interest. Cross-puzzles reinforce key concepts and memory through active recall, helping participants sharpen focus and accuracy.
Mathematics is a cornerstone of STEAM education, which is why maths games had to be featured in HEROn magazine. Number puzzles, more precisely image-equation puzzles, can be enjoyed by players aged 9 to 99. The magazine contains seven number puzzles. The image-equation puzzles capture attention quickly through visual cues, making them highly engaging for learners of all ages. Because they require pattern recognition and basic algebraic thinking, these puzzles strengthen reasoning and mental calculation without overwhelming beginners. They are easy to differentiate, and their low-stakes, game-like nature boosts motivation and confidence, offering immediate feedback and encouraging repeated practice.
The word problems are intended for readers who are more experienced in mathematics. Word problems are one of the most challenging types of problems for students of mathematics and have been the subject of extensive research over the past 50 years (Verschaffel et al., 2020). Members of the S-TEAM are maths-oriented, so it was obvious to them that the HEROn publication had to include word problems. Six water-related word problems were created and reviewed by experts.
To add variety, a few mazes have been included to spice up the game selection. The maze games are also based on water-themed concepts. Mazes are widely used in educational settings because they combine cognitive training with low-pressure play. They develop spatial reasoning, planning, and working memory while requiring sustained attention and flexible problem-solving. Mazes also promote persistence and reduce anxiety by offering incremental challenges and immediate success cues. As collaborative tasks, they enhance communication and teamwork and are suitable for a range of ages, learning goals, and subjects (Terzieva, 2026; Wang et al., 2023).
3.4. Contributors to the Creation of HEROn Magazine
The creation of HEROn Magazine is a collaborative effort that includes contributions from diverse age groups, encompassing teenagers, young adults, and adults. This mix of voices ensures that the magazine resonates with a wide audience and reflects various perspectives on environmental issues. The development of HEROn Magazine involved a dedicated team of 15 collaborators, showcasing a blend of perspectives and expertise. This team comprised 6 teenagers, 2 young adults, and 7 adults, including 3 coaches and 4 experts. S-TEAM members and coaches can be seen in Figure 11.
Figure 11.
The official photo of the S-TEAM members and coaches in the SUBMERGED season.
During the innovation project, FLL teams can seek assistance from experts. The work of the S-TEAM was supported by two associate professors of the University of Miskolc, a graphic designer, and a language editor. The participation of teenagers brought youthful energy and innovative ideas to the magazine, while young adults contributed fresh insights on contemporary issues. Adults, with their wealth of experience, provided depth and authority to the content. The coaches played a crucial role in mentoring and guiding younger contributors, ensuring that their voices were effectively represented. Meanwhile, experts shared their specialised knowledge, helping to ensure that the information presented in the magazine is accurate and relevant. Experts involved in the HEROn Project provided a range of valuable contributions, including professional advice, proposal reviews, and assessments upon request. This collaborative approach not only enriched the magazine’s content but also fostered a sense of community among contributors, emphasising the shared responsibility for environmental awareness and action across different age groups.
4. Research Objectives and Research Questions
The primary aim of this study is to analyse how different age groups respond to HEROn Magazine. This research seeks to assess the effectiveness of HEROn Magazine in raising environmental awareness among the three age groups (children, young adults, and adults). Identifying variations in perceptions across demographic groups enables a better understanding of the magazine’s effectiveness in communicating environmental messages. Evaluations of the magazine’s design and structure will also be analysed across age groups. This analysis will help determine how these factors influence reader engagement, particularly with interactive elements such as gamified content. A crucial aspect of our investigation will also involve examining the differences in perceptions of the HEROn Project’s logo and slogan among the three age groups. Gaining insight into how each demographic views these branding elements will enhance our understanding of their overall impressions of the magazine and its effectiveness in creating a memorable identity. Lastly, the study aims to identify strengths and weaknesses within HEROn Magazine based on feedback from each age group. Through these objectives, the study aspires to give a comprehensive understanding of HEROn Magazine’s impact and effectiveness in fostering environmental awareness.
The research questions aim to examine the nuanced responses of different age groups to HEROn Magazine. These questions serve as guidelines for assessing how effectively the magazine engages its readership and raises environmental awareness. Examination of these aspects is intended to yield deeper insights into readers’ perspectives, which can inform the development of targeted sustainability strategies for distinct age groups. The research questions are:
- (RQ1): How do different age groups rate the effectiveness of HEROn magazine in raising environmental awareness?
- (RQ2): How do the different age groups evaluate the design and structure of HEROn Magazine, and how does this relate to their engagement with the content, including games?
- (RQ3): How do the responses of each age group differ regarding the expressiveness of the HEROn Project’s logo and slogan, and how does this influence their overall impression of the magazine?
5. Research Methodology
A voluntary sampling method was used to collect data via an online survey. The voluntary nature of research participation is a cornerstone of ethical practices in studies involving human participants (Hiratsuka, 2025). Volunteer sampling is a non-probability sampling method where participants self-select into a study (Shively, 2012). Importantly, there were no coercive factors that influenced participation; individuals were neither pressured nor incentivised, fostering an open environment for honest feedback. Although this voluntary approach allows authentic insights, it is crucial to acknowledge the potential for self-selection bias. A diverse strategy was employed, using both physical and digital platforms to increase reach and capture a variety of perspectives. This approach enabled inclusion of respondents with different backgrounds and demographic characteristics, thereby mitigating biases inherent in self-selection.
5.1. General Background
The survey responses were collected over a three-month period, spanning from 28 January to 28 April 2025. Collecting data over three months helped mitigate potential biases by including a diverse range of participants, who may respond differently based on their experiences and circumstances during this period. Respondents accessed the online questionnaire via a QR code. This approach provided participants with a convenient and efficient way to engage with the survey, allowing them to quickly scan the code on their mobile devices to access the questionnaire. Utilising QR codes not only simplified access but also increased participation by making it easy for respondents to complete the survey anytime, anywhere. This method also enabled seamless integration of digital tools, enhancing participants’ overall experience and facilitating timely data collection. The QR code was placed on X-banners, bamboo coasters, posters and flyers, making it easily visible and accessible to potential respondents (Figure 12).
Figure 12.
Promoting HEROn at a Hungarian FLL event. The Hungarian name for the HEROn project is GéM. The parents of S-TEAM members have signed a consent form agreeing to the taking of photographs at FLL events, which may appear in the media.
According to Volkova et al. (2021), children can be reached through YouTube, Instagram, and TikTok, while parents should be engaged through Facebook and Instagram. Therefore, the QR code was shared through social media posts on platforms such as Facebook and Instagram, further expanding its reach. This multifaceted approach not only enhanced the questionnaire’s visibility but also encouraged participation across demographics. Utilising both physical and digital marketing channels maximised engagement opportunities and streamlined data collection, enabling efficient gathering of responses. Participation in the survey was entirely voluntary, allowing individuals to choose whether or not to contribute their responses. There were no coercive factors involved. This voluntary nature is crucial to the integrity of the collected data, as it fosters genuine feedback and promotes a more authentic representation of opinions. Encouraging voluntary participation aimed to create an open environment in which individuals could freely express their thoughts on the survey topics.
5.2. Participants
A total of 630 Hungarian people participated in the survey, with no invalid responses. Table 1 presents the gender distribution of the respondents, providing insights into the demographic composition of the surveyed population. The data reveal that there are slightly more female respondents (51.27%) than male respondents (48.73%). This indicates a relatively balanced gender distribution, with females comprising just over half of the sample.
Table 1.
Gender Distribution.
Table 2 presents the age distribution of respondents who completed the HEROn questionnaire. It categorises participants into various age groups, showing both the frequency of respondents in each group and the corresponding percentage of the total population surveyed. The age groups range from 9 to 89 years, with the largest segment being individuals aged 13–15, accounting for 30.79% of the total responses. The second-largest group is those aged 16–18, constituting 21.75% of the respondents. Other age groups, such as 19–21 and 40–49, also show significant representation, while groups like 70–79 and 80–89 have more minor frequencies.
Table 2.
Age Distribution.
To enhance the clarity and interpretability of the demographic data, the original age distribution was consolidated into three broader groups: teenagers (ages 9–15), young adults (ages 16–29), and adults (ages 30–89), as shown in Table 3. The grouping was determined according to the relevant literature (Di Gessa et al., 2022; Kremel, 2024; Urberg & Öhman, 2025). This restructuring serves multiple purposes. Firstly, these broader age groups facilitate the identification of significant trends and patterns, allowing us to observe how different age brackets relate to various factors of the HEROn project. In addition, larger age categories improve the statistical relevance of our findings by increasing sample sizes within each group, thus producing more reliable insights.
Table 3.
Age Distribution with Simplified Groups.
In the field of environmental protection, this age-based grouping appears in the latest research in eco-psychology, youth sociology, and green marketing. The rationale behind this classification is that climate anxiety, sustainable consumption, and green activism manifest themselves in completely different ways among digital natives, young people just starting their careers, and adults who have already established their livelihoods (Skeirytė et al., 2022). The age groups presented in Table 3 also align with a developmental or life-stage ideology commonly used in demographic studies and the social sciences. Group 9–15 typically encompasses pre-teens and teenagers who are in their formative years. This period is characterised by significant physical, emotional, and cognitive development. It often emphasises educational achievements and social interactions crucial for identity formation (Kapur, 2015; Steinberg, 2005). The segment of young adulthood (16–29) includes individuals transitioning into adulthood, who may be establishing independence, pursuing higher education, or beginning careers. Reflects a period of exploration, identity formation, and critical life decisions (Hochberg & Konner, 2020). Adulthood (30–89) is the larger group that includes middle-aged and older adults, highlighting various stages of career advancement, family life, and social responsibilities. It also reflects issues related to ageing, retirement, and contributions to society (Hawkley et al., 2019).
5.3. Ethics
Participants were informed about the purpose of the research and took part on a voluntary basis. Completion of the questionnaire constituted informed consent to the use of responses for the stated research purposes. Only data necessary for the research objectives were collected. Participation was entirely voluntary. Due to the use of Google Forms (Google LLC, Mountain View, CA, USA), respondent e-mail addresses were technically captured. Collection and handling of these e-mail addresses and other data processing were carried out in accordance with the University of Miskolc’s GDPR guidelines. The authors have complied with the ethical standards set out in the Code of Ethics of the University of Miskolc.
A brief introduction appeared at the beginning of the Google Forms survey. In it, participants could read and agree to (a) the purpose of the survey, (b) a statement guaranteeing the anonymity of participants, (c) the analysis information and guidelines related to the survey, and (d) a checkbox where participants had to indicate their consent to participate in the research. Participants spent approximately five minutes completing the survey.
University of Miskolc does not operate an Institutional Review Board. According to the regulations of the University of Miskolc, all research carried out at the University or by the employees (lecturers, researchers) and/or students of the University of Miskolc has to comply with the Code of Ethics. The authors of the article declare that the research and the paper prepared for publication meet all the requirements of ethical research practice.
5.4. Questionnaire
According to Revilla and Ochoa (2017), the ideal web survey length is a median of 10 min, and the maximum survey length is 20 min. Depending on the population of interest, fielding surveys of different lengths might be appropriate (Revilla & Höhne, 2020). Kato and Miura (2021) found that questionnaire length (ranging from 20 to 200 questions) had no significant effect on the accuracy rate of the responses received. This means that, in terms of how correctly people answered, having more questions did not necessarily lead to worse-quality answers from those who completed the survey. However, the article also notes that the response rate did decrease as the questionnaire length increased. Their article implies that while there isn’t a strict “optimal” maximum number of questions for maintaining accuracy, researchers should consider that shorter questionnaires are more likely to yield a higher completion rate. The article does not provide a specific number for optimal total questions, but highlights that designing surveys to encourage completion is important, given the negative impact of length on response rates. Grady et al. (2019) examined the ideal size of matrix-structured questions in online questionnaires, with particular regard to the number of rows and columns and their impact on the participant experience and data quality. Their article suggests that, for matrix-style questions in online surveys, the dropout rate increased as the number of rows increased. For column size, seven columns increased survey completion time, while three columns produced lower scale reliability. For columns, about 5 answer options are recommended.
The questionnaire was designed for people aged between 9 and 99. The questions are shown in Table 4.
Table 4.
Questions.
Based on the recommendations in the literature, the HEROn questionnaire for the online survey comprised 10 questions and used a 5-point Likert scale for responses. Using a 5-point Likert scale offers several benefits: it is simple and intuitive for respondents, allowing them to express varying degrees of agreement or satisfaction. Additionally, it does not require much time to complete, making it convenient for participants. To effectively utilise attitude scales, it’s critical to ensure that the questions are well-constructed, clear, and relevant to the construct being measured (Batterton & Hale, 2017). Moreover, Russo et al. (2021) suggest that the five-point scale may be less confusing for respondents and might even enhance the response rate.
The HEROn questionnaire (Table 4) was developed for this study. Before complete deployment, items were reviewed by an expert group comprising educators and specialists to assess relevance and clarity of the content. Moreover, a cognitive pretest () was conducted to ensure comprehensibility across the target age range (9 to 99). Following revisions, the instrument was administered in the main study (N = 630). The internal consistency of the questionnaire was assessed using Cronbach’s alpha.
6. Data Analysis and Results
This section presents the data collected during the experiment and the statistical analysis. The survey was evaluated using Google Forms, which was used to collect data. The resulting data were imported into Microsoft Excel (Microsoft Corporation, Redmond, WA, USA). The statistics calculator numiqo (numiqo e.U., Graz, Austria) was used for data analysis.
6.1. Overall Responses
In this subsection, data from all respondents were analysed based on their answers to the questions in the HEROn Magazine survey (Table 4). In the questionnaire, respondents were asked to rate their agreement or perception on a scale from 1 to 5. A rating of 1 indicated strong disagreement, while a rating of 5 represented strong agreement. The 10-item scale demonstrated excellent internal consistency in the study sample (Cronbach’s ). Table 5 shows the results of the questionnaire with descriptive statistical data for all participants. Standard notation is used: M denotes the mean, SD the standard deviation, Mdn the median, and IQR the interquartile range.
Table 5.
Results of the questionnaire with descriptive statistical data for the full sample.
Box plots were used for data visualisation (Figure 13). Box plots effectively summarise large datasets by displaying the mean, quartiles, and outliers.
Figure 13.
Box plots for overall responses. The figure was created using the numiqo application.
Table 5 and Figure 13 show that HEROn Magazine was well received, with positive responses to all questions. The mean scores (M) for all questions range from approximately 4.16 to 4.56. The standard deviation (SD) values range from 0.73 to 1.06. Q8 has the highest standard deviation at 1.06. For both Q5 and Q6, the standard deviations are close to but do not exceed 1. In Q5, the standard deviation is 0.95, while for Q6 it is 0.94. These indicates a greater variability in responses, meaning that the opinions of respondents were more diverse for these questions. Although the standard deviations are small given the sample size of 630 and the average values, they still suggest that it is worthwhile to analyse the responses by grouping them. The small standard deviations indicate that most responses are close to average, but group-based analysis can help reveal any differences that participants from various age groups may exhibit.
6.2. Responses by Age Groups
The entire sample was divided into three groups based on participants’ ages. The grouping is shown in Table 3. The next step was to determine the frequencies and descriptive statistics for each group per question. Three new tables and three box-plot figures were produced: Table 6 and Figure 14 for G1; Table 7 and Figure 15 for G2; Table 8 and Figure 16 for G3. Group results were compared with the overall sample and with each other.
Table 6.
Results of the questionnaire with descriptive statistical data for G1.
Figure 14.
Box plots for G1 scores. The figure was created using the numiqo application.
Table 7.
Results of the questionnaire with descriptive statistical data for G2.
Figure 15.
Box plots for G2 scores. The figure was created using the numiqo application.
Table 8.
Results of the questionnaire with descriptive statistical data for G3.
Figure 16.
Box plots for G3 scores. The figure was created using the numiqo application.
The average scores for the G1 group are generally lower than those for the full sample, indicating reduced satisfaction levels. At the same time, the standard deviations for both groups are similar, suggesting that the response variability is consistent between datasets. This consistent variability indicates that, despite differing average satisfaction levels, the degree of agreement within each group remains comparable. The values of standard deviation are highest for Q5 (SD = 1.05), Q6 (SD = 0.98), and Q8 (SD = 1.04). Q5 has the lowest average mean score of 4.04 as seen in Figure 14. The longer whiskers for Q5 in the box plot visually demonstrate that the responses for this question were less uniform compared to other questions in the survey.
The mean scores in the full sample are generally higher, suggesting more favourable responses compared to G2. Q8 has the lowest mean score (3.87). The variability of responses in Group 2 is slightly higher on average, especially observed in Q8. G2 shows a lower percentage of respondents selecting the highest option (5) in multiple questions, indicating less agreement. The values of standard deviation are highest for four questions: Q2 (SD = 0.97), Q5 (SD = 0.96), Q6 (SD = 0.98), and Q8 (SD = 1.14). The longest whisker belongs to Q8 (Figure 15).
When comparing the results of the G1 and G2 groups, the average responses are higher in G1 than in G2 for almost all questions. A particularly significant difference can be seen in question Q8, where G2 scored only 3.87 compared to G1’s average of 4.11. In the case of Q5 and Q6, similar trends can be observed between the total sample and G2, with moderate differences. The standard deviation values are similar in both tables. In general, the two groups have similar opinions on the questions, but G2’s responses show a wider range.
For G3, the percentages for options 1, 2, and 3 are generally quite low in the questions, with the majority of respondents selecting 5 (Table 8). Most questions show that over 85% of respondents rate them positively (4 or 5), indicating a more uniformly positive attitude than in the full sample. The mean scores range from 4.58 to 4.92, indicating that respondents predominantly rated the questions very positively. Standard deviations are relatively low, ranging from 0.38 to 0.81, indicating more consistent responses and smaller differences of opinion compared to the entire sample. G3 displayed a markedly more positive response pattern with higher mean scores and lower variability. Data suggest that respondents in G3 felt more strongly about the questionnaire topics than the full sample. The Q8 question is the most divisive among the G3 group, as the proportions of lower responses and differing opinions among respondents are evident, whereas for the other questions, respondents generally agree.
G3 shows strong consensus among respondents. In contrast, G1 has mean scores between 4.04 and 4.42, while G2 presents moderate positivity with scores ranging from 3.87 to 4.40 and greater variability, especially for Q8. G3 shows a more uniform opinion and higher scores than the more varied responses in G1 and G2.
The bottleneck is clearly Question 8 for all three groups. In G1, this question showed a lower mean score of 4.11, indicating mixed sentiments. G2 also shows a similar trend, with a mean score of 3.87, which is noticeably lower than the other questions in both groups. In G3, while Question 8 had a higher mean score of 4.58, it still showed greater variability than the other questions, suggesting that respondents had differing opinions. Q8 serves as the least favourable and most divisive question across the three groups.
6.3. Question Grouping and Aggregated Rating
Moving forward, the analysis focuses on groups of questions rather than on each question individually. This approach will enable the identification of patterns and trends across related topics, providing a more comprehensive understanding of respondents’ perceptions and experiences with HEROn Magazine. Moreover, the data were prepared for hypothesis testing. Three groups of questions were separated based on the research questions (Table 9).
Table 9.
Question groups.
RQ1 concerns questions Q1, Q7, and Q10 and examines how each age group perceives HEROn Magazine’s effectiveness in raising environmental awareness. RQ2 corresponds to Q2, Q3, Q4, and Q8, which examine how different age groups evaluate the design and structure of HEROn Magazine and their engagement with the content. RQ3 is associated with questions Q5, Q6, and Q9, investigating how responses across age groups differ in the expressiveness of the HEROn Project’s logo and slogan, and how is their overall impression of the magazine.
By determining the arithmetic mean for each question group, a new dataset was created for hypothesis testing. For example, the aggregated rating QG1(G1) represents the arithmetic mean of the scores for Q1, Q7, and Q10, which provides a consolidated view of the overall opinion for these three questions of G1, as shown in Figure 17.
Figure 17.
Box plot visualisation of QG1(G1).
After forming the question groups and computing aggregated scores, internal consistency was assessed using Cronbach’s alpha. The results for G1 and G2 are equal: 0.86. For G3, the Cronbach’s alpha is 0.92. These data demonstrated good internal consistency for all subgroups, based on the acceptability thresholds provided by George and Mallery (2007).
Table 10 shows descriptive statistics for the aggregated rating per question group for all age groups.
Table 10.
Descriptive statistics per question group for all age groups.
6.4. Hypotheses Testing
Hypothesis testing was used to determine whether statistically significant differences existed between age groups for each question set.
To answer the research question RQ1, the following hypotheses were formulated:
- Null hypothesis: There are no differences in responses among the three age groups associated with QG1.
- Alternative hypothesis: There are differences in responses among the three age groups associated with QG1.
The normality condition was assessed using three distinct statistical tests, as shown in Table 11. A p-value below 0.05 suggests that the data significantly deviates from a normal distribution. In our analysis, all four tests confirmed that the data did not follow a normal distribution. Consequently, statistical methods that do not rely on the assumption of normality must be used to test these hypotheses.
Table 11.
Different statistical tests to check the normality for QG1.
Due to the failure of the normality assumptions, the Kruskal–Wallis nonparametric test was used for comparison. The Kruskal–Wallis test results with a value of 141.92, a df of 2, and a p-value of < indicate that there is a statistically significant difference between the three groups. The effect size is . According to (Cohen, 1988), this represents a large effect size. The exact nature of these differences (i.e., which groups differ from which others) required additional post hoc testing. The Dunn–Bonferroni post hoc tests were employed to control for Type I error across multiple comparisons, providing a more stringent evaluation of the differences among groups. This method adjusts the p-values to account for the number of tests conducted, ensuring that the observed significant differences between groups remain valid. Table 12 presents the results of the Dunn–Bonferroni tests.
Table 12.
Results of Dunn–Bonferroni Tests. Adj. p: Values adjusted with Bonferroni correction.
Test results indicate that there is no significant difference between G1 and G2. The p-value of 0.367 is much higher than the conventional significance level of 0.05. However, both G1 and G2 show significant differences compared to G3 for QG1. The p-value is less than 0.001 in both cases, indicating strong evidence against the null hypothesis. The adjusted p-values confirm these findings after applying the Bonferroni correction for multiple comparisons, reinforcing the significance of the observed differences. The null hypothesis was rejected.
Similarly, to answer the research question RQ2, the following hypotheses were formulated:
- Null hypothesis: There are no differences in responses among the three age groups associated with QG2.
- Alternative hypothesis: There are differences in responses among the three age groups associated with QG2.
The normality assumption was evaluated using different statistical tests, as presented in Table 13. All tests yield p-values < 0.001 in all three groups, indicating that the assumption of normal distribution is not met in the data set.
Table 13.
Different statistical tests to check the normality for QG2.
The results of the Kruskal–Wallis test, which yielded a value of 142.95, df of 2, of =0.22 and a p-value of <, demonstrate that there is a statistically significant difference among the three groups. Table 14 presents the results of the Dunn–Bonferroni tests. In conclusion, the situation for QG2 is similar to that for QG1. The Dunn–Bonferroni tests reveal significant differences between G3 and both G1 and G2 for QG2, whereas no significant difference exists between G1 and G2.
Table 14.
Results of Dunn–Bonferroni Tests. Adj. p: Values adjusted with Bonferroni correction.
The steps of the previous protocol were repeated for QG3. The following hypotheses were formulated to answer the research question RQ3:
- Null hypothesis: There are no differences in responses among the three age groups associated with QG3.
- Alternative hypothesis: There are differences in responses among the three age groups associated with QG3.
The normality check has been performed. Table 15 shows the results. All tests produce p-values less than 0.001 for all three groups, suggesting that the data do not satisfy the normality assumption.
Table 15.
Different statistical tests to check the normality for QG3.
The test statistic for the Kruskal–Wallis test () is 145.77. This value indicates significant differences among the groups being compared. With three groups in the analysis, df = 2. The effect size is large (). A p-value less than 0.001 demonstrates a statistically significant difference between at least two of the groups. The Dunn–Bonferroni post hoc tests indicate that there is no significant difference between QG3(G1) and QG3(G2). However, there are significant differences between QG3(G1) and QG3(G3) as well as between QG3(G2) and QG3(G3). Table 16 shows the results.
Table 16.
Results of Dunn–Bonferroni Tests. Adj. p: Values adjusted with Bonferroni correction.
7. Discussion and Answer to Research Questions
Inclusive design promotes the creation of products and environments that anyone can access and use, often spurring innovations that not only serve underserved groups but also improve experiences for the wider population (Søndergaard & Jacobsen, 2026). LEGO® is a good example of how a brand designed for a broad age range can successfully target different age groups. The manufacturer’s recommendation for ages 9–99 is a broad, inclusive message, but the product range is actually tiered: simple, playful sets for children; more complex technical or architectural models for teens and young adults; and detailed, display-oriented sets and collectables for adults and older adults (Zhang, 2025). In addition, well-designed building instructions, modular elements, expandability, and community content (fan builds, online guides) ensure that the same product line remains appealing to users with different skill levels and motivations. For example, LEGO® encourages consumers to share their new building ideas and showcase their creations on the LEGO® Ideas website, where anyone can submit their toy design ideas (Botoric, 2015; Volkova et al., 2021). This approach is a good example of how layering, scalable complexity, and multi-channel support can effectively reach a broad target audience.
In line with FLL’s guidelines, HEROn magazine is designed for the widest possible audience: the creators have made a conscious effort to ensure that the content is diverse yet speaks with a unified voice, is accessible to younger readers, and is informative for adults. The design is multimodal: rich visual material and graphics ensure that it caters to different learning styles and abilities. The creators refined the magazine through regular testing and expert review to ensure that inclusivity is truly maximised. At the same time, creating an educational magazine that appeals to readers aged 9 and 99 alike is a fundamentally difficult task due to the vast differences in development and experience between these age groups: children’s language skills, conceptual understanding, and attention span differ significantly from those of adults, so a single, uniform voice is rarely able to meet the needs of all groups (Mehrotra & Wagner, 2018; Rashidova, 2026; Westwood, 2018). In addition, patterns of interest and motivations also differ; while younger readers are drawn to visual, story-like, or playful elements, older readers often seek deeper analysis and context, so the choice of topics and the use of examples can easily become either too simple or too detailed. Due to the educational nature of the material, particular care must be taken to ensure that the content is formulated accurately yet clearly: simplification must not come at the expense of professional credibility, while an excessive focus on scientific details may deter younger readers. From a formal perspective, typography, illustration types, font sizes, and visual hierarchy serve different purposes, making it difficult to create a design that is comfortable and appealing to all age groups.
7.1. Response to Environmental Awareness: Answer to Research Question RQ1
The survey results show that respondents perceived HEROn Magazine as an effective tool for raising environmental awareness across all age groups, with clear differences in the intensity of that perception. Overall aggregated ratings for the awareness-related items (Q1, Q7, Q10) were positive across cohorts, indicating that respondents generally found the publication necessary, informative, and effective in meeting its stated objective. Adults aged 30–89 consistently rated the magazine higher than younger readers, with a markedly higher aggregated mean than both teenagers and young adults. Teenagers (9–15) and young adults (16–29) scored similarly, suggesting comparable levels of appreciation and perceived impact among those two younger cohorts. Statistical testing confirmed these patterns: differences between teenagers and young adults were not significant, whereas both of these groups rated the magazine significantly lower than the older adult group. These patterns suggest that, although younger audiences perceive the magazine as reaching them, older adults perceive it as more resonant—possibly because they report greater background knowledge about environmental issues, more interest in practical guidance, or stronger motivation to endorse conservation messages. Conversely, younger respondents may engage more with interactive elements or aesthetics than with informational content alone, which could moderate their awareness ratings. The one item that showed the most variability across groups concerned engagement with the Find-the-Difference game, indicating that attention-capturing elements were experienced differently by age. For developers, these results suggest maintaining the magazine’s factual depth while enhancing interactivity and youth-targeted engagement strategies to increase perceived effectiveness among teenagers and young adults.
7.2. Design, Structure, and Engagement: Answer to Research Question RQ2
Respondents reported an aggregated QG2 mean for the full sample of approximately 4.35. Item means were Q2 = 4.29, Q3 = 4.56, Q4 = 4.40, Q8 = 4.16 (see Table 5). These responses reflect strongly positive perceptions of the design, structure, and overall game-related content. Results varied by age group, with older adults (G3) reporting the most positive ratings. Aggregated scores for the design-and-engagement group (QG2) in Table 10 show G3 with a high mean (M = 4.79, SD = 0.43), while teenagers (G1) and young adults (G2) reported lower and similar means (G1: M = 4.20, SD = 0.69; G2: M = 4.15, SD = 0.72). Table 6, Table 7 and Table 8 show that visual design and structure (Q2–Q4) were generally reported as well-received across cohorts, particularly by G3, who most frequently selected the top rating.
The Find-the-Difference game (Q8) was the most variable and least uniformly endorsed element: G2 reported the lowest mean for Q8 (3.87, SD = 1.14), G1 was intermediate (4.11, SD = 1.04), and G3 rated it highest (4.58, SD = 0.81), reflecting divergent reactions among younger respondents. Nonparametric testing (Kruskal–Wallis and Dunn–Bonferroni post hoc) confirmed these differences were statistically significant: G3 differs significantly from both G1 and G2 on QG2, while G1 and G2 do not differ significantly from each other. These patterns indicate that adults tended to report more consistent appreciation of the magazine’s clarity, professional layout, and integrated games, whereas younger readers—particularly young adults—reported more mixed engagement with the chosen FiDi format.
Younger adults (G2) were most critical of the classic FiDi format because their digital expectations are higher than those of older cohorts. They routinely use digital apps and games, so static content can feel inferior. G2 players seek immediate feedback, visible rewards, and measurable progress. Traditional FiDi emphasises quiet observation and delayed cognitive satisfaction. Content that appears too didactic or childlike reduces perceived relevance for G2. Multiplayer and cooperative modes that leverage peer interaction are perceived to increase retention. Converting FiDi into a mobile-friendly, interactive digital experience while retaining its educational core may be perceived as the clearest path to engaging G2. This trend is also clearly evident in the relevant literature (Ahmad et al., 2025; Amalia, 2023). But classic paper-based FiDi games remain useful in schools, museums, and low-tech settings, as well as for offline family activities; due to their simplicity, accessibility, and low production cost, they have not been completely replaced by digital versions.
7.3. Overall Impression: Answer to Research Question RQ3
The survey data indicate that respondents perceived the HEROn Project’s logo and slogan, and the magazine’s overall impression, positively across the sample, with clear age-related differences in intensity and consensus. Aggregated responses for the branding-and-impression group (QG3) show markedly higher means and lower variability among older adults (G3: M ≈ 4.82–4.92, SD ≈ 0.41–0.56) compared with teenagers (G1) and young adults (G2), whose aggregated means cluster near 4.15–4.20 with larger standard deviations. Nonparametric hypothesis testing (Kruskal–Wallis, followed by Dunn–Bonferroni post hoc comparisons) confirmed these differences: G3 scores differ significantly from both G1 and G2, while G1 and G2 do not differ significantly from each other. These patterns indicate that older respondents tended to report the logo and slogan as more expressive and to report a more favourable overall impression of the magazine, with greater agreement within that group.
Several factors may explain why adults perceived the branding and overall impression more positively. Older adults may place greater weight on clarity, professional design cues, and trustworthy messaging when judging expressiveness, and may more readily connect a concise slogan and clean logo to the magazine’s credibility and mission. By contrast, younger cohorts—especially young adults—tend to have higher expectations for novelty, interactivity, and digital polish; static visual branding and text-based slogans may therefore feel less salient or emotionally engaging to them, leading to lower and more variable ratings. Teenagers, while appreciative, may evaluate branding more through the lens of immediate visual appeal and relevance to their peer culture, which can differ from adult criteria.
8. Conclusions, Limitations and Suggestions for the Future
The sample size is substantial. With 630 respondents, statistically reliable analyses can be conducted, and sufficient data are available for comparisons across all age groups (G1 = 224, G2 = 225, G3 = 181). The gender distribution is balanced (approximately 51% female, 49% male), which is favourable. According to the data, respondents perceived HEROn Magazine as well-received and perceived it as an effective tool for raising awareness of water issues: the majority gave high ratings for its necessity, the usefulness of its content, and the publication’s overall impact. The findings indicate that a multimodal, game-based structure (FiDi, crossword puzzles, maths problems, and mazes) was perceived as supporting STEAM and intergenerational goals. By combining visual, mathematical, and reflective elements, the magazine offered a multi-layered learning experience that was appreciated by participants. In large samples spanning a wide age range, aggregated results can differ from age-specific analyses. Therefore, we analysed the data by age group. Differences emerged across age groups: adults aged 30–89 consistently rated the magazine more favourably, while younger groups (9–15 and 16–29) responded less uniformly; in particular, the paper-based FiDi game element received mixed feedback.
This study has several important limitations that should be considered when interpreting the findings. The use of voluntary sampling produced a self-selected sample that likely over-represents individuals already interested in water issues, education, or the FLL community; consequently, the results may be positively biased and not fully generalisable to the broader population of 9 to 99. Moreover, the entire sample is Hungarian, which constrains cross-cultural generalisability: design preferences, game expectations, and environmental attitudes may differ in other national or cultural contexts. While the sample size is large overall, only age distribution was considered, and other demographic covariates (socioeconomic status, education level, urban/rural residence) were neither collected nor controlled for, limiting the ability to adjust for confounding factors or to explore subgroup heterogeneity more precisely. Critically, the study used a single post-exposure survey without a baseline measure or a comparison group, so causal inference is not possible: observed positive ratings reflect respondents’ perceptions after exposure to the magazine and cannot establish that the magazine caused any change in awareness, attitudes, or behaviour.
Recruitment took place at events, in schools, and on social media; these channels tend to over-represent certain groups (such as competition members, school groups, and local communities). The composition of survey participants may also have been skewed by disparities in access, as the survey was primarily accessible via QR codes and online platforms. Individuals without a smartphone or internet access, or those less familiar with digital devices, were likely underrepresented. The survey delivery channels (QR codes, online distribution) and the coexistence of print and digital magazine formats were not experimentally separated, which may introduce mode effects: respondents who experienced only the printed magazine may report different evaluations than those who used the digital version.
When testing similar publications, it is advisable to expand the study to include multiple samples that differ culturally and socially, and to collect additional demographic data (educational attainment, income bracket, urban/rural residence) in order to better control for confounding factors. The effects of print and digital magazines may be separated under distinct experimental conditions, and it is advisable to measure educational effectiveness and behavioural change using quasi-experimental designs. Taking into account the technological needs of young people, it is recommended to incorporate digital interactivity into the design of a similar publication and to ensure equal access. When conducting a similar survey, it is advisable to provide respondents with an opportunity to add their comments at the end of the questionnaire. Furthermore, additional textual explanations accompanying individual responses can also provide information suitable for analysis.
The authors note that the HEROn project was evaluated by judges at two Hungarian and one international FLL competitions. It placed first in the regional finals at Miskolc and fourth in the Hungarian national finals. At the FIRST® LEGO® League Open International Championship Greece 2025, the head judge praised the creators verbally. Most of the judges’ comments align with the survey results. The lack of technology was highlighted not only by young adults’ responses but also by the judges at the Hungarian Finals and the Greek Open. At the same time, the judges praised the initiative, the concept, and the quality of execution.
Ensuring environmental protection and sustainability is a shared interest, supported by the preservation and continuous refinement of best practices. Building on the positive reception of HEROn Magazine, stakeholders may consider institutionalising and scaling such multimodal, game-based approaches—while adapting them to digital formats and intergenerational needs—to increase perceived reach and potential impact. Future iterations should prioritise inclusive design, experimental separation of print and digital modes, richer demographic data collection, and quasi-experimental evaluation of learning and behavioural outcomes to address current sampling and generalisability limits. With iterative development, evidence-informed evaluation, and attention to equitable access, similar initiatives may help strengthen water literacy and contribute to long-term, community-wide sustainability.
Author Contributions
Conceptualisation, S.S., Z.T. and A.K.; methodology, S.S. and Z.T.; software, S.S. and A.K.; resources, Z.T.; writing—original draft, S.S. and Z.T.; writing—review and editing, S.S., A.K. and Z.T.; visualisation, S.S.; project administration, Z.T. All authors have read and agreed to the published version of the manuscript.
Funding
Prepared in the “National Laboratory for Social Innovation” project (RRF-2.3.1-21-2022-00013), within the framework of Hungary’s Recovery and Resilience Plan, with the support of the Recovery and Resilience Facility of the European Union.
Institutional Review Board Statement
Ethical review and approval were waived for this study according to the ethical regulations of the University of Miskolc.
Informed Consent Statement
Informed consent was obtained from all participants involved in this study.
Data Availability Statement
The data presented in this study are available upon request from the corresponding author due to ethical reasons.
Acknowledgments
AI-powered tools were used for language editing and grammar correction.
Conflicts of Interest
The authors declare no conflicts of interest.
Abbreviations
The following abbreviations are used in this manuscript:
| GBL | Game-Based Learning |
| FLL | FIRST® LEGO® League |
| FiDi | Find-the-Difference (game) |
| M | Mean |
| SD | Standard Deviation |
| Mdn | Median |
| IQR | Interquartile Range |
References
- Ahmad, F., Ahmed, Z., Obaid, I., Shaheen, M., Rahman, H., Singh, G., & Anjum, M. J. (2025). Motivation, engagement, and performance in two distinct modes of brain games: A mixed methods study in children. International Journal of Human–Computer Interaction, 41(15), 9652–9666. [Google Scholar] [CrossRef] [Scilit]
- Alika, O., & Radia, E. H. (2021). Development of learning media based on cross puzzle game in science learning to improve learning outcomes. Jurnal Penelitian Pendidikan IPA, 7(2), 173–177. [Google Scholar] [CrossRef] [Scilit]
- Amahmid, O., El Guamri, Y., Yazidi, M., Razoki, B., Kaid Rassou, K., Rakibi, Y., Knini, G., & El Ouardi, T. (2019). Water education in school curricula: Impact on children knowledge, attitudes and behaviours towards water use. International Research in Geographical and Environmental Education, 28(3), 178–193. [Google Scholar] [CrossRef] [Scilit]
- Amalia, I. F. P. (2023). The effect of using the “Find the Difference Game” application on improving students’ speaking ability. New Language Dimensions, 4(1), 23–31. [Google Scholar] [CrossRef] [Scilit]
- Batterton, K. A., & Hale, K. N. (2017). The Likert scale: What it is and how to use it. Phalanx, 50(2), 32–39. [Google Scholar]
- Bayindir, S. (2021). Find the difference: Parent–child interactions at Ankara University Toy Museum. Global Journal of Guidance and Counselling in Schools: Current Perspectives, 11(2), 088–097. [Google Scholar] [CrossRef] [Scilit]
- Bilancini, E., Boncinelli, L., & Di Paolo, R. (2023). Game-based education promotes practices supporting sustainable water use. Ecological Economics, 208, 107801. [Google Scholar] [CrossRef] [Scilit]
- Botoric, V. (2015). When ideas generate value: How LEGO profitably democratized its relationship with fans. In N. Zagalo, & P. Branco (Eds.), Creativity in the digital age (pp. 159–170). Springer. [Google Scholar] [CrossRef] [Scilit]
- Camilleri, V. (2023). Designing GBL for higher education: Pitfalls & recommendations. In Proceedings of the 17th european conference on games based learning, ECGBL 2023 (pp. 869–875). University of Twente. [Google Scholar]
- Chen, X. (2019). How does participation in FIRST LEGO League robotics competition impact children’s problem-solving process? In W. Lepuschitz, M. Merdan, G. Koppensteiner, R. Balogh, & D. Obdržálek (Eds.), Robotics in education (pp. 162–167). Springer International Publishing. [Google Scholar] [CrossRef] [Scilit]
- Cheng, P.-H., Yeh, T.-K., Tsai, J.-C., Lin, C.-R., & Chang, C.-Y. (2019). Development of an issue-situation-based board game: A systemic learning environment for water resource adaptation education. Sustainability, 11(5), 1341. [Google Scholar] [CrossRef] [Scilit]
- Cohen, J. (1988). Statistical power analysis for the behavioral sciences. Routledge. [Google Scholar] [CrossRef] [Scilit]
- Debrenti, E. (2024a). Game-based learning experiences in primary mathematics education. Frontiers in Education, 9, 1331312. [Google Scholar] [CrossRef] [Scilit]
- Debrenti, E. (2024b). Using digital game-based learning in mathematics education: A case study with teacher training students. International Journal for Technology in Mathematics Education, 31(3), 153–162. [Google Scholar] [CrossRef] [Scilit]
- Despland, L. M., Kumar, S., & Fraser, S. (2025). Using a place-based catchment water game to teach concepts and skills for sustainable water management. Teaching Science, 71(1), 24–45. [Google Scholar]
- Di Gessa, G., Xue, B., Lacey, R., & McMunn, A. (2022). Young adult carers in the UK—New evidence from the UK household longitudinal study. International Journal of Environmental Research and Public Health, 19(21), 14076. [Google Scholar] [CrossRef] [Scilit] [PubMed]
- FIRST. (2025). Get started with FIRST® LEGO® League. Available online: https://www.firstinspires.org/programs/fll/get-started (accessed on 22 May 2026).
- Fonseca, I., Caviedes, M., Chantré, J., & Bernate, J. (2023). Gamification and game-based learning as cooperative learning tools: A systematic review. International Journal of Emerging Technologies in Learning (iJET), 18(21), 4–23. [Google Scholar] [CrossRef] [Scilit]
- George, D., & Mallery, P. (2007). SPSS® for Windows® step by step: A simple guide and reference, 14.0 update. Pearson Education. [Google Scholar]
- Grady, R. H., Greenspan, R. L., & Liu, M. (2019). What is the best size for matrix-style questions in online surveys? Social Science Computer Review, 37(3), 435–445. [Google Scholar] [CrossRef] [Scilit]
- Graffin, M., Sheffield, R., & Koul, R. (2022). ‘More than robots’: Reviewing the impact of the FIRST® LEGO® League challenge robotics competition on school students’ STEM attitudes, learning, and twenty-first century skill development. Journal for STEM Education Research, 5(3), 322–343. [Google Scholar] [CrossRef] [Scilit]
- Harris, S. (2013). Building skills brick by brick. Engineering & Technology, 8(3), 38–41. [Google Scholar] [CrossRef] [Scilit]
- Hawkley, L. C., Norman, G. J., & Agha, Z. (2019). Aging expectations and attitudes: Associations with types of older adult contact. Research on Aging, 41(6), 523–548. [Google Scholar] [CrossRef] [Scilit] [PubMed]
- Hiratsuka, T. (2025). The volunteer participation paradox: Ethical tensions between self-selection and targeted sampling. Research Methods in Applied Linguistics, 4(2), 100206. [Google Scholar] [CrossRef] [Scilit]
- Hochberg, Z., & Konner, M. (2020). Emerging adulthood, a pre-adult life-history stage. Frontiers in Endocrinology, 10, 918. [Google Scholar] [CrossRef] [Scilit] [PubMed]
- Jin, J., Olkowski, P., Lu, J., Liu, V., Bakri, I., Rao, A., Jin, Y.-F., & Xu, I. (2024, June 23–26). Eight-year journey with the FIRST program: How robots build kids. 2024 ASEE Annual Conference & Exposition (pp. 23.666.1–23.666.16), Portland, OR, USA. [Google Scholar]
- Józsa, E., & Hámornik, B. (2011). Find the difference!: Eye tracking study on information seeking behavior using an online game. Journal of Eye Tracking, Visual Cognition and Emotion, 2(1), 27–35. [Google Scholar]
- Kapur, S. (2015). Adolescence: The stage of transition. Horizons of Holistic Education, 2(3), 233–250. [Google Scholar]
- Kato, T., & Miura, T. (2021). The impact of questionnaire length on the accuracy rate of online surveys. Journal of Marketing Analytics, 9(2), 83–98. [Google Scholar] [CrossRef] [Scilit]
- Kelly, J. F., & Daudelin, J. (2008). FIRST LEGO League: The unofficial guide. No Starch Press. [Google Scholar]
- Kremel, A. (2024). Consumer behaviour in a circular system–how values promote and hinder the participation of young adults in the Swedish deposit-refund system for beverage packaging. Circular Economy and Sustainability, 4(2), 1427–1446. [Google Scholar] [CrossRef] [Scilit]
- Lindemann-Matthies, P., Heber, E., & Remmele, M. (2024). Find the plant—An educational game fosters plant species literacy. Sustainability, 16(11), 4702. [Google Scholar] [CrossRef] [Scilit]
- Liu, S., Chen, Q., Dong, J., Yan, S., Xu, C., & Lu, H. (2011). Snap & play: Auto-generate personalized find-the-difference mobile game. In MM’11: Proceedings of the 19th ACM international conference on multimedia (pp. 993–996). Association for Computing Machinery. [Google Scholar] [CrossRef] [Scilit]
- Liu, S., Chen, Q., Yan, S., Xu, C., & Lu, H. (2014). Snap & play: Auto-generated personalized find-the-difference game. ACM Transactions on Intelligent Systems and Technology, 5(4), 65. [Google Scholar] [CrossRef] [Scilit]
- Makanda, K., Nzama, S., & Kanyerere, T. (2022). Assessing the role of water resources protection practice for sustainable water resources management: A review. Water, 14(19), 3153. [Google Scholar] [CrossRef] [Scilit]
- McCarroll, M., & Hamann, H. (2020). What we know about water: A water literacy review. Water, 12(10), 2803. [Google Scholar] [CrossRef] [Scilit]
- Mehrotra, C., & Wagner, L. S. (2018). Aging and diversity: An active learning experience. Routledge. [Google Scholar]
- Pahl-Wostl, C., Tàbara, D., Bouwen, R., Craps, M., Dewulf, A., Mostert, E., Ridder, D., & Taillieu, T. (2008). The importance of social learning and culture for sustainable water management. Ecological Economics, 64(3), 484–495. [Google Scholar] [CrossRef] [Scilit]
- Peckumn, G. (2003). Water education: Protecting our future. Journal-American Water Works Association, 95(2), 84–91. [Google Scholar] [CrossRef] [Scilit]
- Perim, C., Sousa, C., & Damásio, M. J. (2024). Game-based learning for fostering digital literacy in older adults: An intergenerational approach. In International conference on human-computer interaction (pp. 242–260). Springer. [Google Scholar] [CrossRef] [Scilit]
- Pozo-Muñoz, M. P., Martín-Gámez, C., Velasco-Martínez, L. C., & Tójar-Hurtado, J. C. (2023). Research and development of environmental awareness about water in primary education students through their drawings. Education Sciences, 13(2), 119. [Google Scholar] [CrossRef] [Scilit]
- Puškar, L., Kržić, A. S., Scaradozzi, D., Pyrini, A. N., Pantela, N., Kosmas, P., Costa, D., & Screpanti, L. (2023, June 5–8). Robots in aquatic environments to promote STEM and environmental awareness. OCEANS 2023-Limerick (pp. 1–6), Limerick, Ireland. [Google Scholar] [CrossRef] [Scilit]
- Rashidova, E. (2026). The role of age differences in the development of teaching materials. Asian Journal of Scientific Research and Innovations, 1(2), 150–153. [Google Scholar]
- Revilla, M., & Höhne, J. K. (2020). How long do respondents think online surveys should be? New evidence from two online panels in Germany. International Journal of Market Research, 62(5), 538–545. [Google Scholar] [CrossRef] [Scilit]
- Revilla, M., & Ochoa, C. (2017). Ideal and maximum length for a web survey. International Journal of Market Research, 59(5), 557–565. [Google Scholar] [CrossRef] [Scilit]
- Russo, G. M., Tomei, P. A., Serra, B., & Mello, S. (2021). Differences in the use of 5-or 7-point Likert scale: An application in food safety culture. Organizational Cultures, 21(2), 1–17. [Google Scholar] [CrossRef] [Scilit]
- Shively, G. (2012). Sampling: Who, how and how many? In Measuring livelihoods and environmental dependence (pp. 51–70). Routledge. [Google Scholar]
- Skeirytė, A., Krikštolaitis, R., & Liobikienė, G. (2022). The differences of climate change perception, responsibility and climate-friendly behavior among generations and the main determinants of youth’s climate-friendly actions in the EU. Journal of Environmental Management, 323, 116277. [Google Scholar] [CrossRef] [Scilit] [PubMed]
- Søndergaard, H. A., & Jacobsen, L. F. (2026). Innovating the marketplace with diversity and inclusion. In Exploring commercial, social, and digital innovation from the customer perspective (pp. 188–198). Routledge. [Google Scholar] [CrossRef] [Scilit]
- Steinberg, L. (2005). Cognitive and affective development in adolescence. Trends in Cognitive Sciences, 9(2), 69–74. [Google Scholar] [CrossRef] [Scilit] [PubMed]
- Szigeti, C., & Horváth, B. (2012). Környezetvédelmi játékok. Információs Társadalom, XII(4), 85–105. (In Hungarian) [Google Scholar] [CrossRef] [Scilit]
- Szörényi, S., Muzsnay, A., Szabó, C., & Zámbó, C. (2026). The impact of commercial board games on secondary school mathematics performance and thinking skills. International Journal of Educational Research Open, 10, 100569. [Google Scholar] [CrossRef] [Scilit]
- Štefanovič, J. (2023). First Lego League in Slovakia. Information Technology Applications, 6(1), 89–94. [Google Scholar]
- Terzieva, V. (2026). Personalized educational maze game—A case study. In D. Durães, A.-C. Caron, S. Karkalas, M. Nakayama, L. Lancia, & Z. Kubincová (Eds.), Methodologies and intelligent systems for technology enhanced learning, workshops—15th international conference (pp. 246–258). Springer Nature Switzerland. [Google Scholar] [CrossRef] [Scilit]
- Urberg, L., & Öhman, J. (2025). Resisting sustainable development: An analysis of young people’s online discussions. Journal of Youth Studies, 28(7), 1021–1037. [Google Scholar] [CrossRef] [Scilit]
- Usart, M., Schina, D., Esteve-Gonzalez, V., & Gisbert, M. (2019). Are 21st century skills evaluated in robotics competitions? The case of First LEGO League competition. In Proceedings of the 11th international conference on computer supported education (Vol. 1, pp. 445–452). SciTePress. [Google Scholar] [CrossRef] [Scilit]
- Verschaffel, L., Schukajlow, S., Star, J., & Van Dooren, W. (2020). Word problems in mathematics education: A survey. ZDM Mathematics Education, 52(1), 1–16. [Google Scholar] [CrossRef] [Scilit]
- Vianna, V. H. C., Silva, E. P., Pazoto, C. E., Duarte, M. R., & Nicola, L. R. M. (2026). An ocean literacy intervention in elementary education: Exploring the society-nature relationship through the case of Guanabara Bay (Rio de Janeiro, Brazil). Marine Policy, 185, 106971. [Google Scholar] [CrossRef] [Scilit]
- Volkova, D., Volkova, J., & Znotiņa, D. (2021). Analysis of LEGO brand communication for the audience of children in social media. Journal of Regional Economic and Social Development, 12, 192–202. [Google Scholar] [CrossRef] [Scilit]
- Wang, X., Cheng, M., & Li, X. (2023). Teaching and learning computational thinking through game-based learning: A systematic review. Journal of Educational Computing Research, 61(7), 1505–1536. [Google Scholar] [CrossRef] [Scilit]
- Westall, F., & Brack, A. (2018). The importance of water for life. Space Science Reviews, 214(2), 50. [Google Scholar] [CrossRef] [Scilit]
- Westwood, P. (2018). Inclusive and adaptive teaching: Meeting the challenge of diversity in the classroom. Routledge. [Google Scholar]
- Yang, H.-C., Lee, M.-T., & Lin, L.-C. (2022). The application of game-based teaching for water resources science learning. Applied Sciences, 12(19), 9920. [Google Scholar] [CrossRef] [Scilit]
- Zhang, X. (2025). A case study on LEGO Group’s marketing strategy. Finance & Economics, 1(6), 1–5. [Google Scholar] [CrossRef] [Scilit]
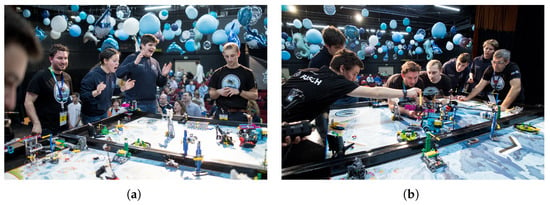
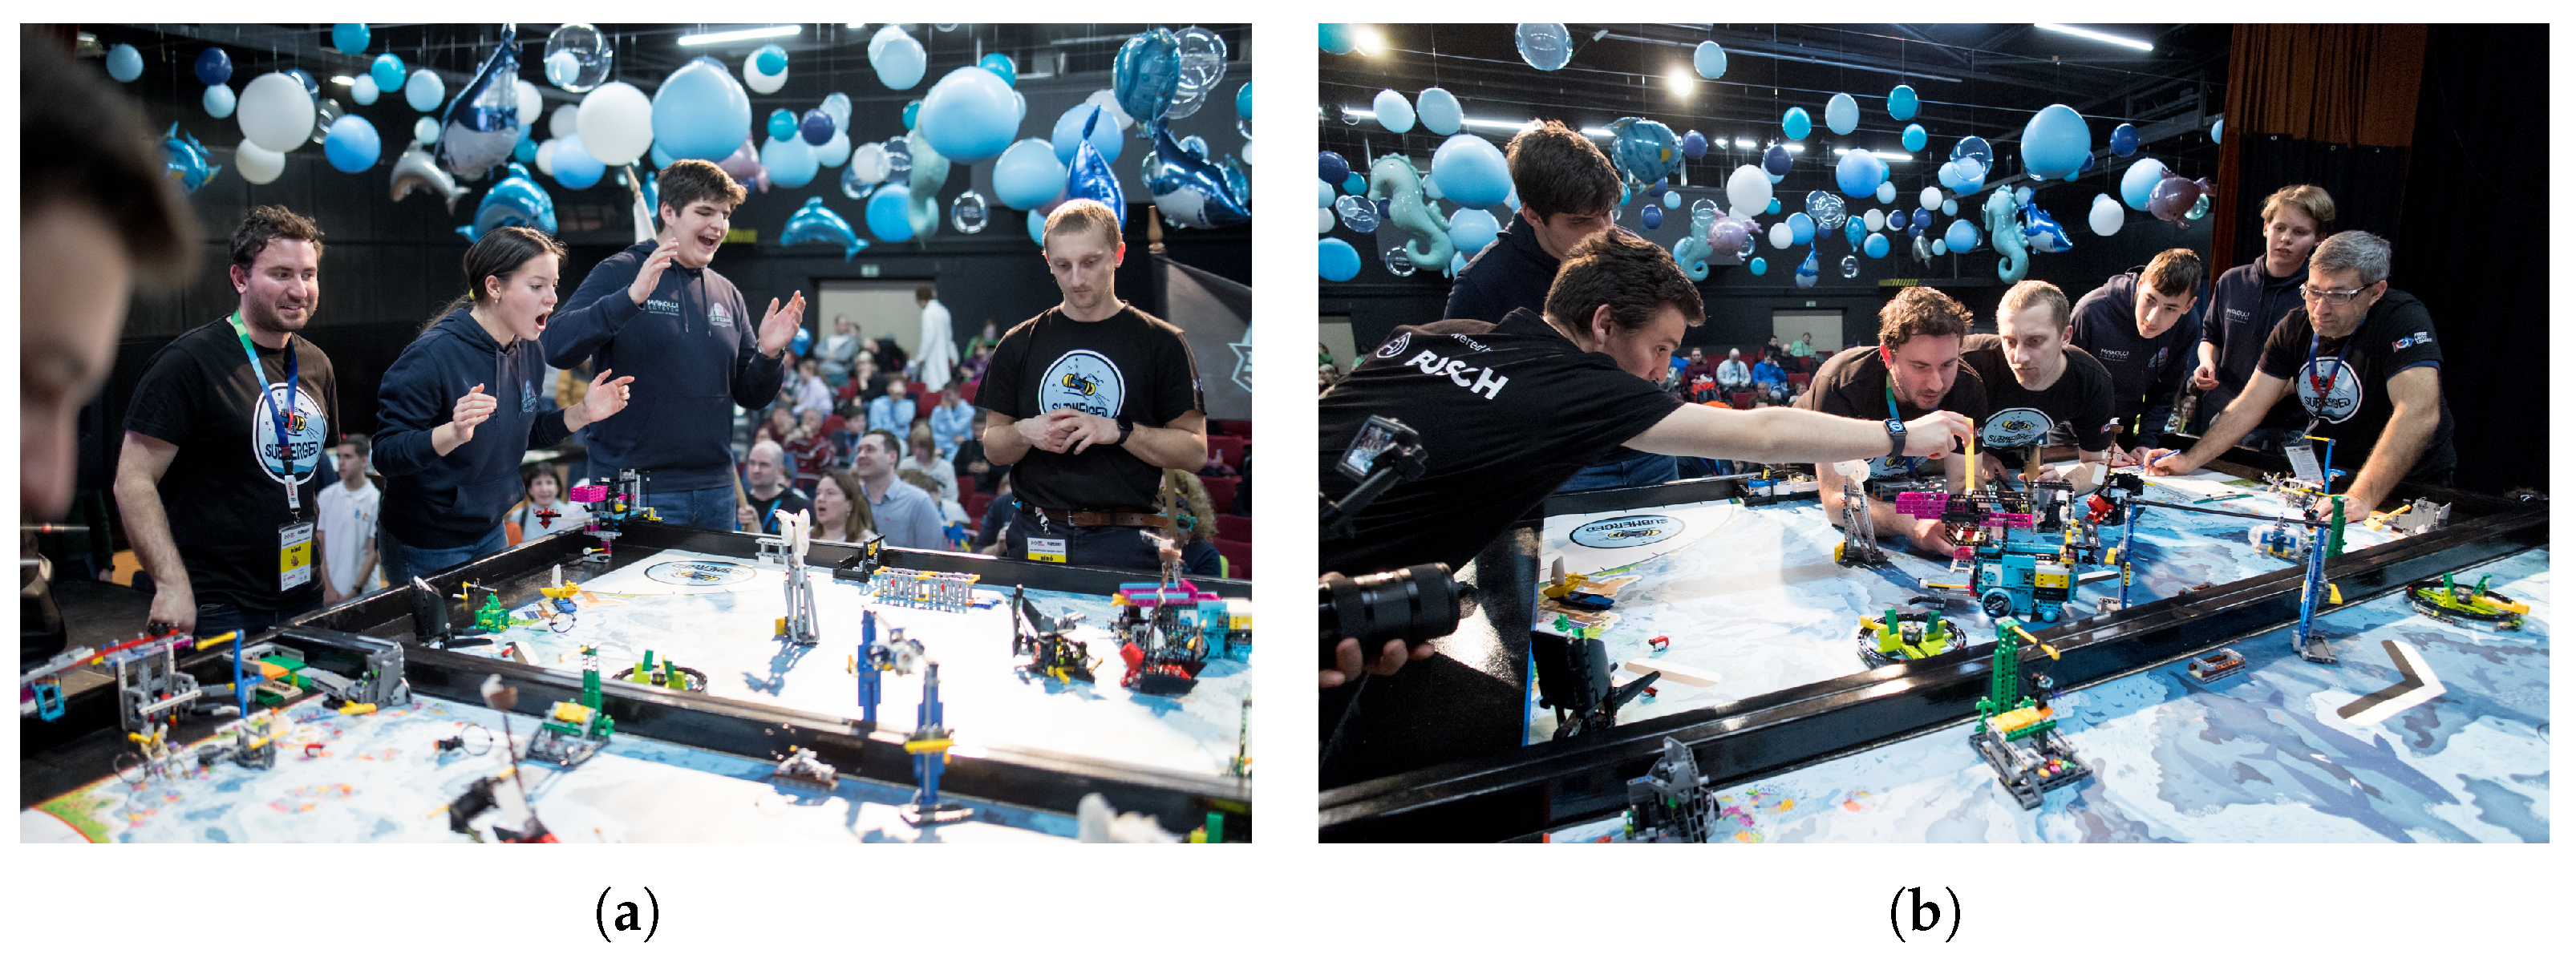
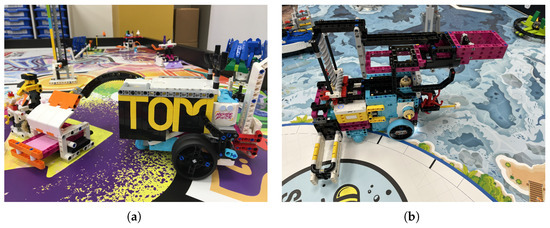
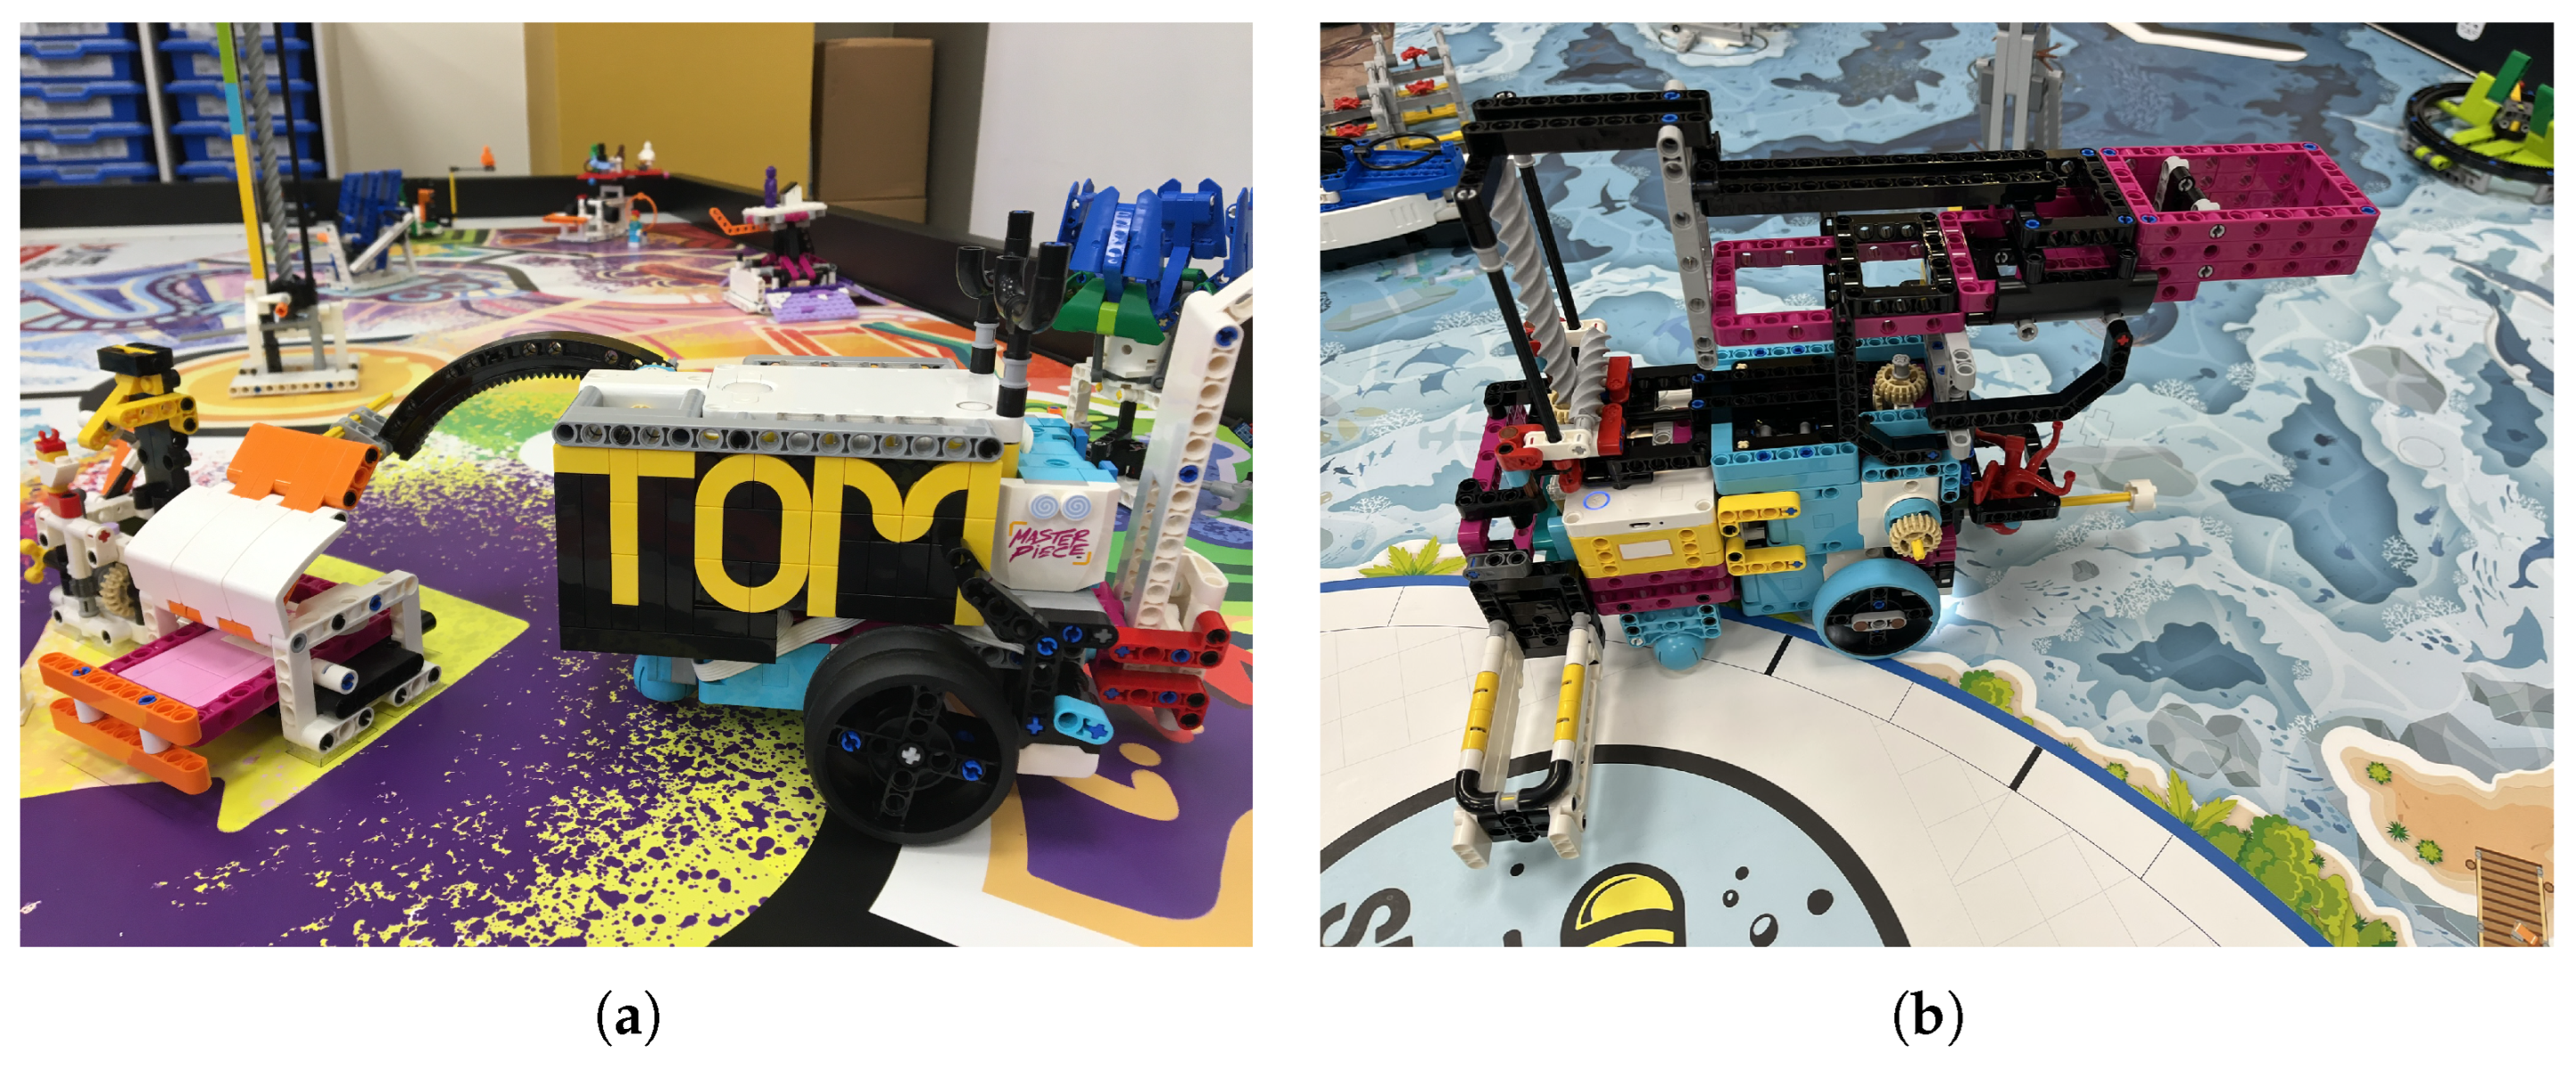
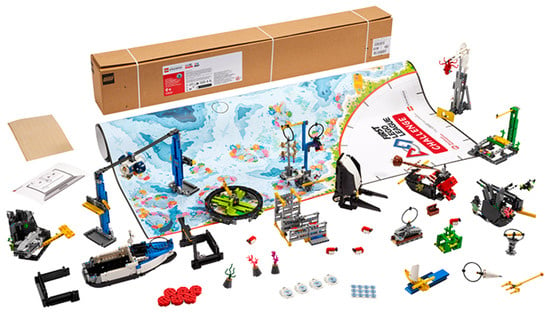
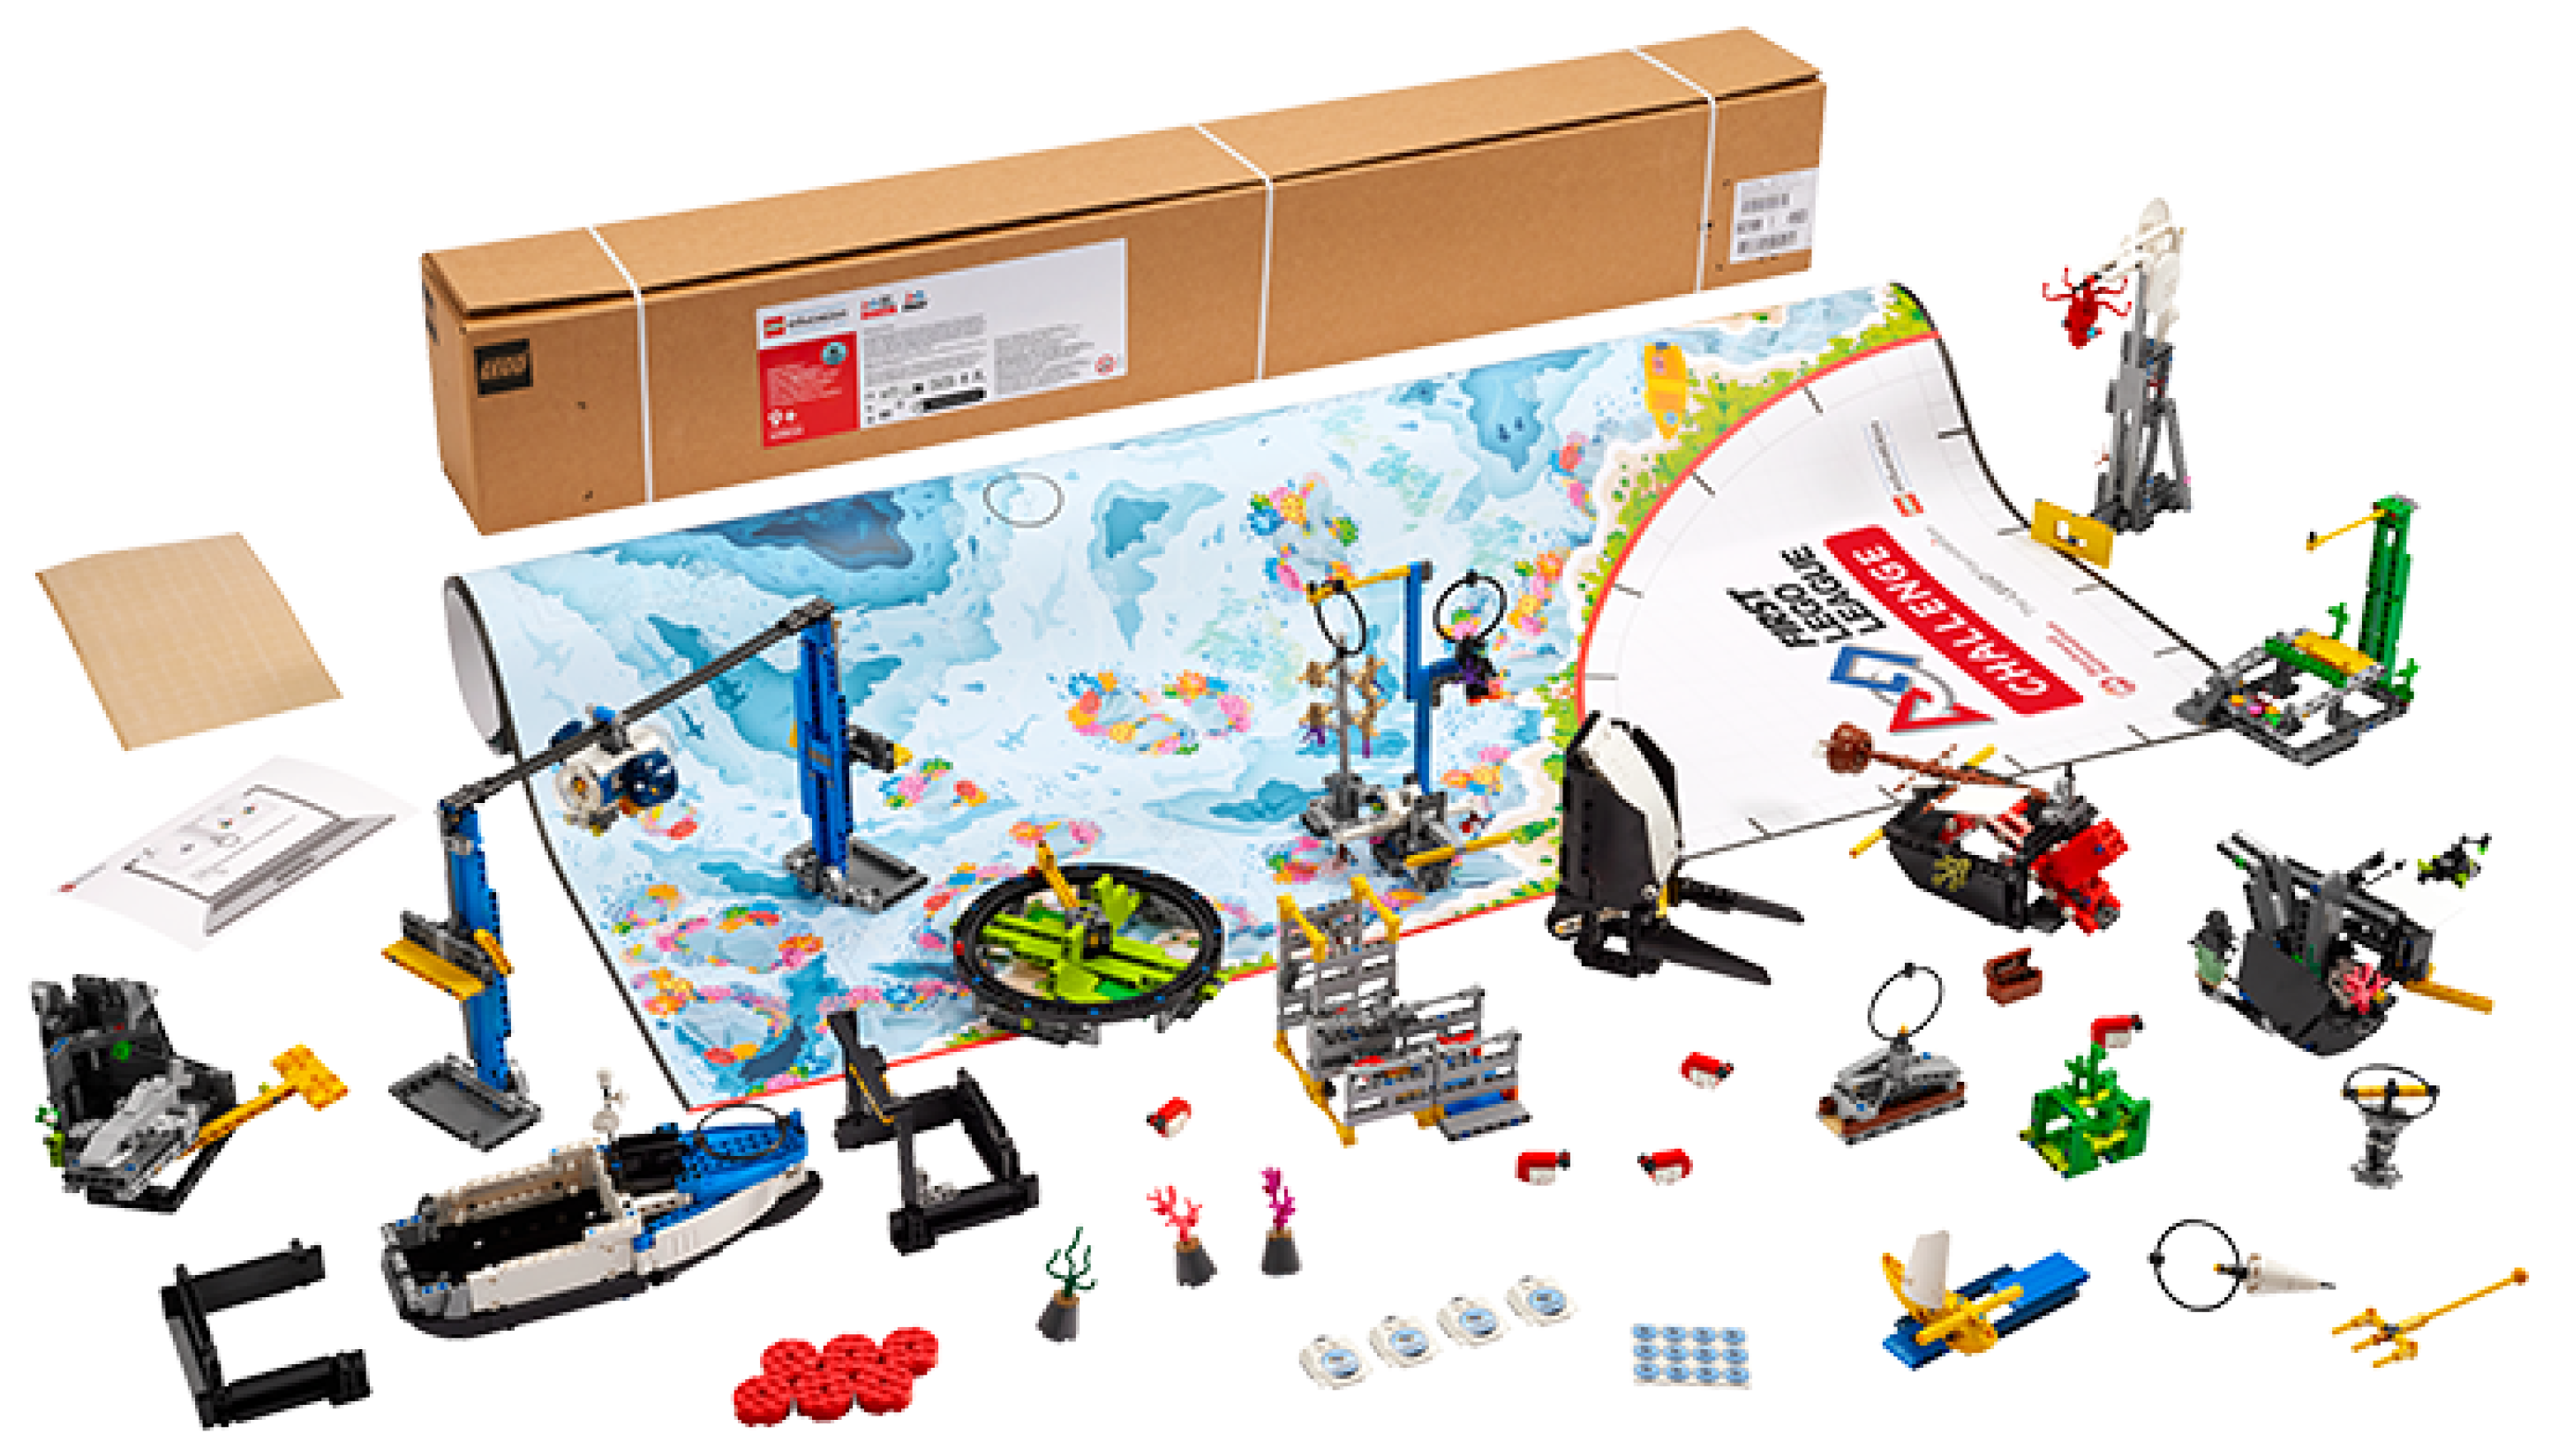
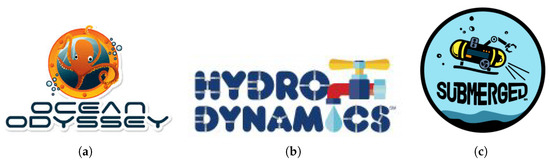
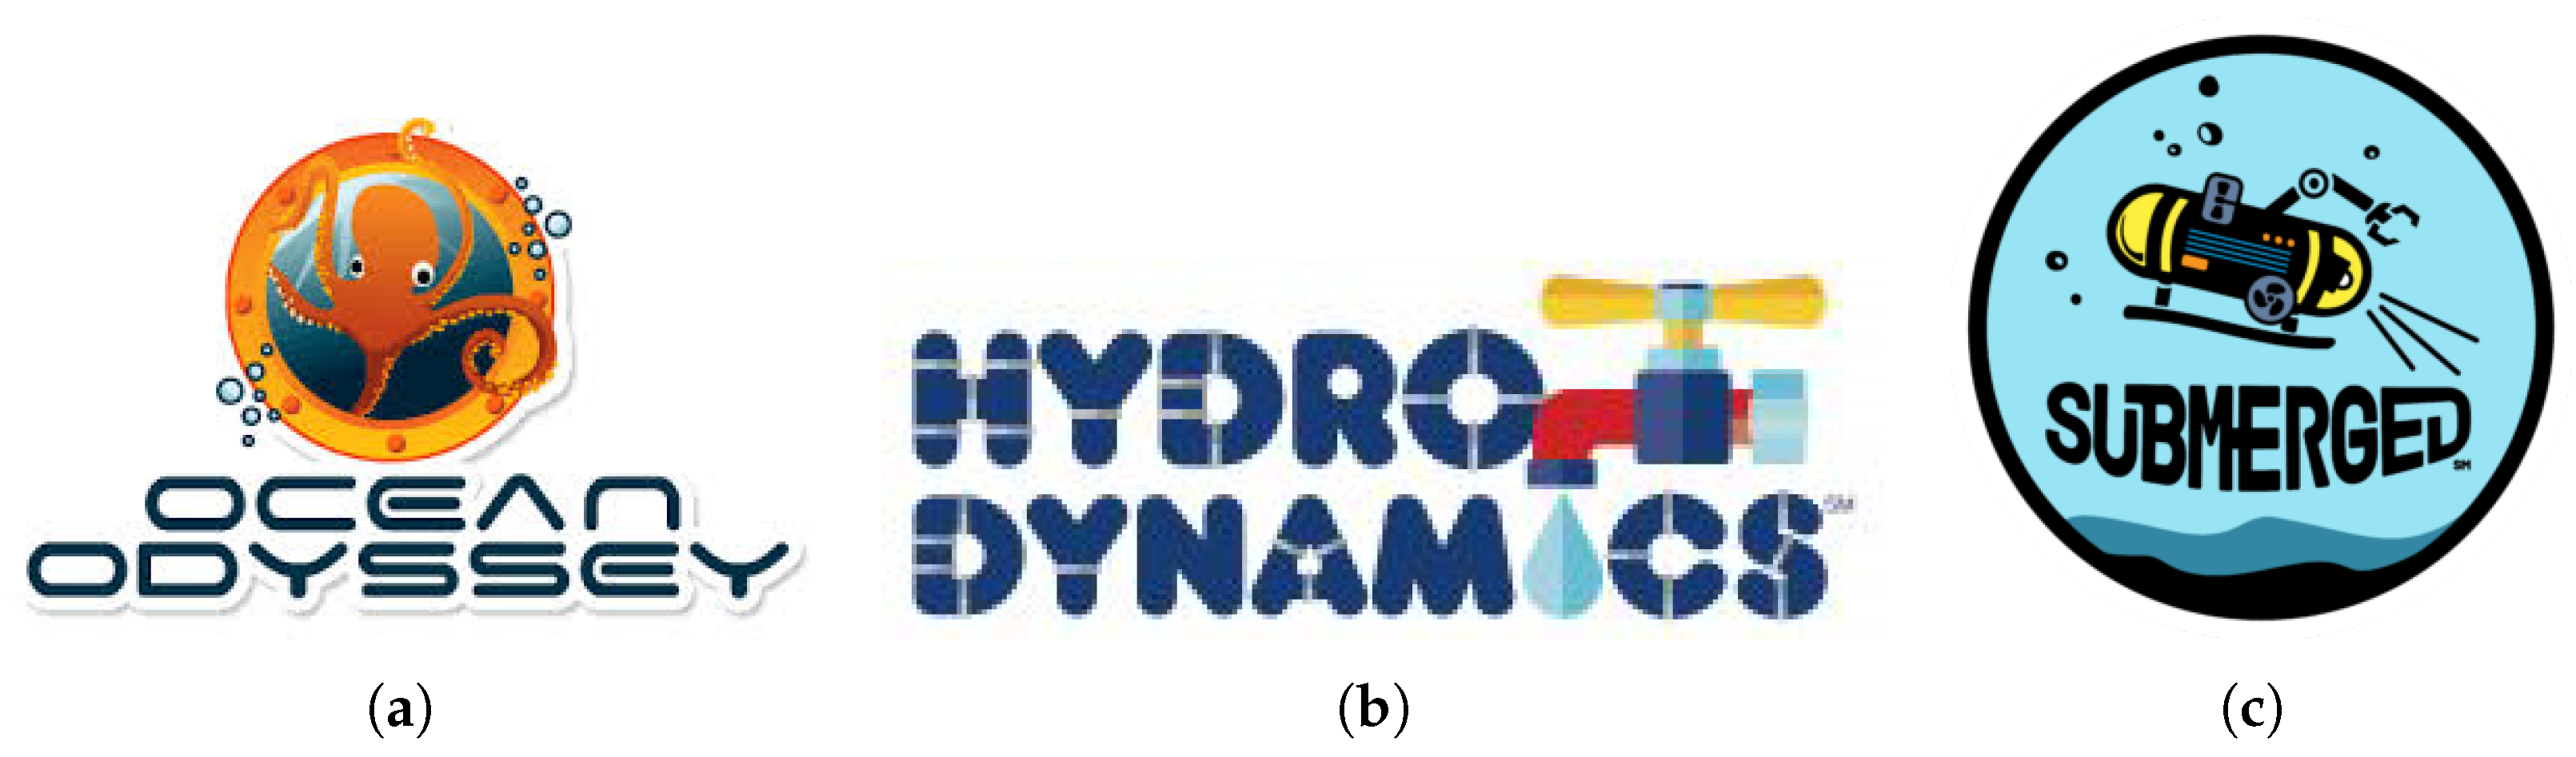
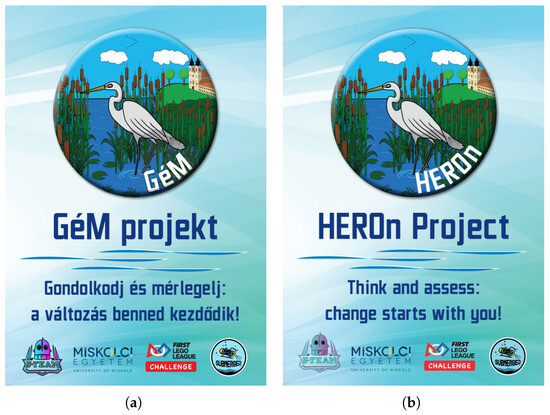
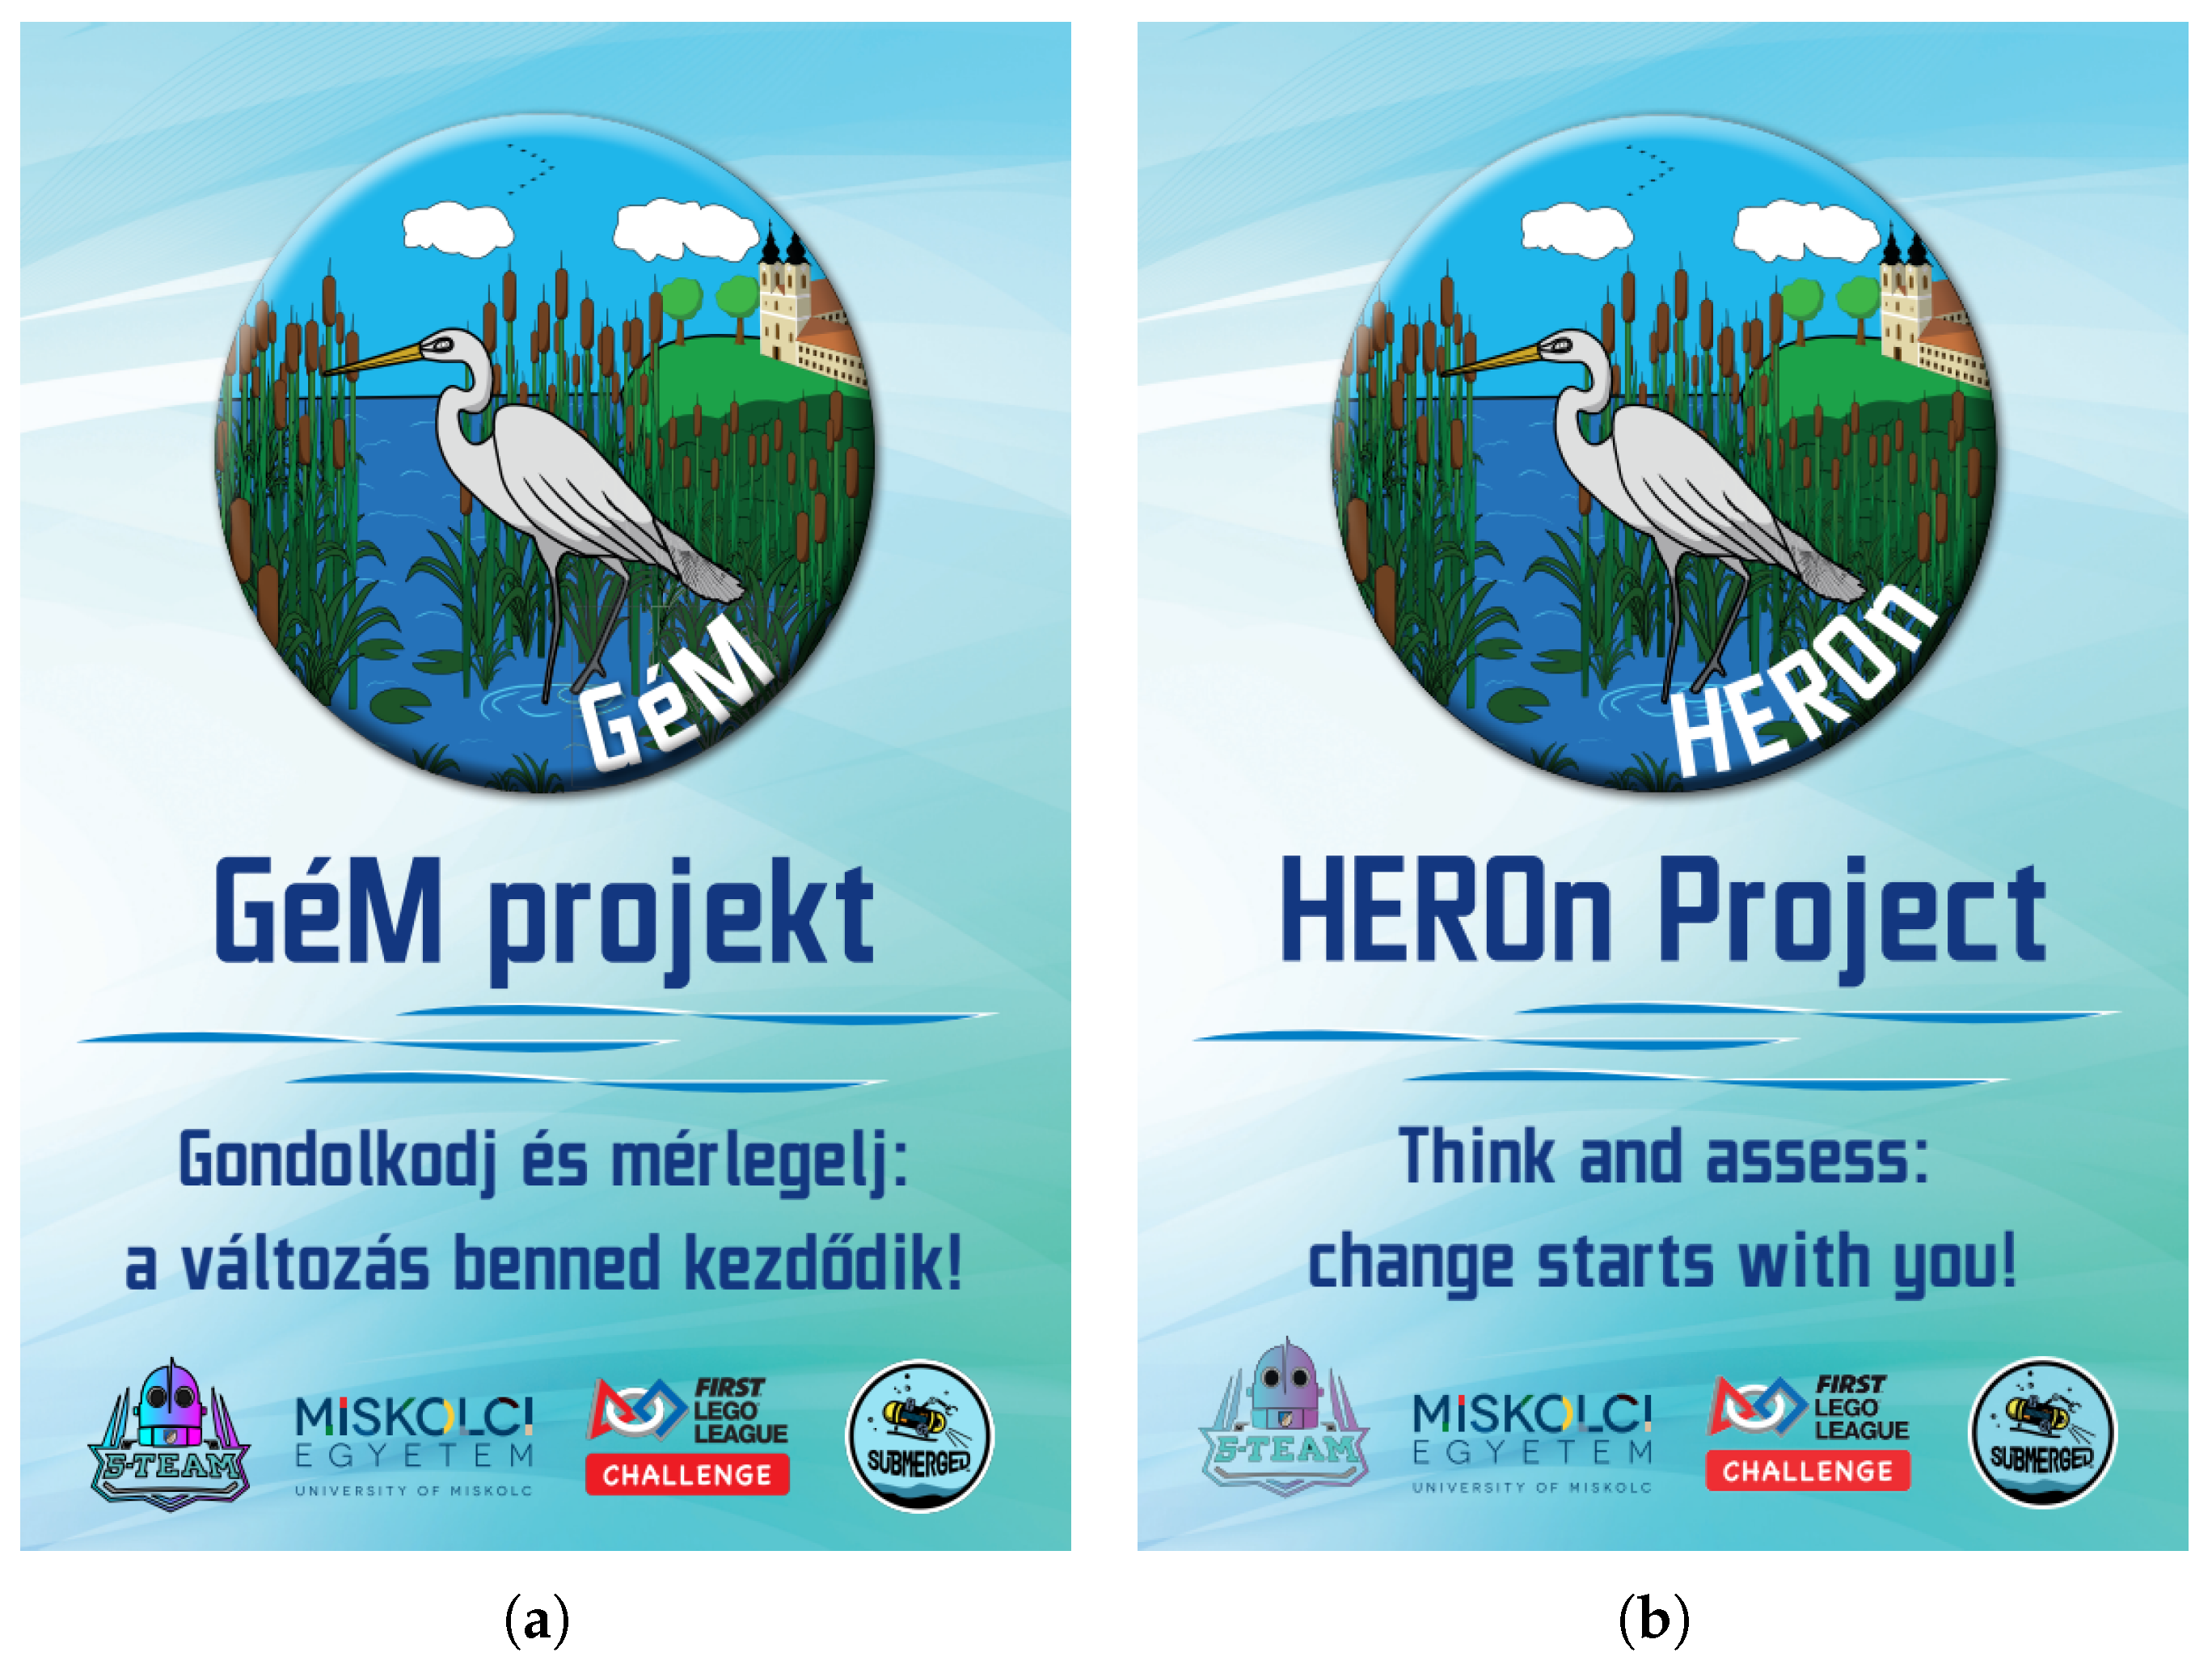
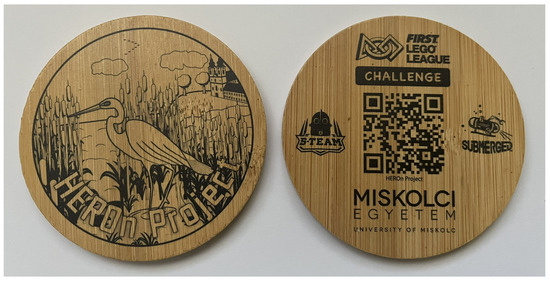
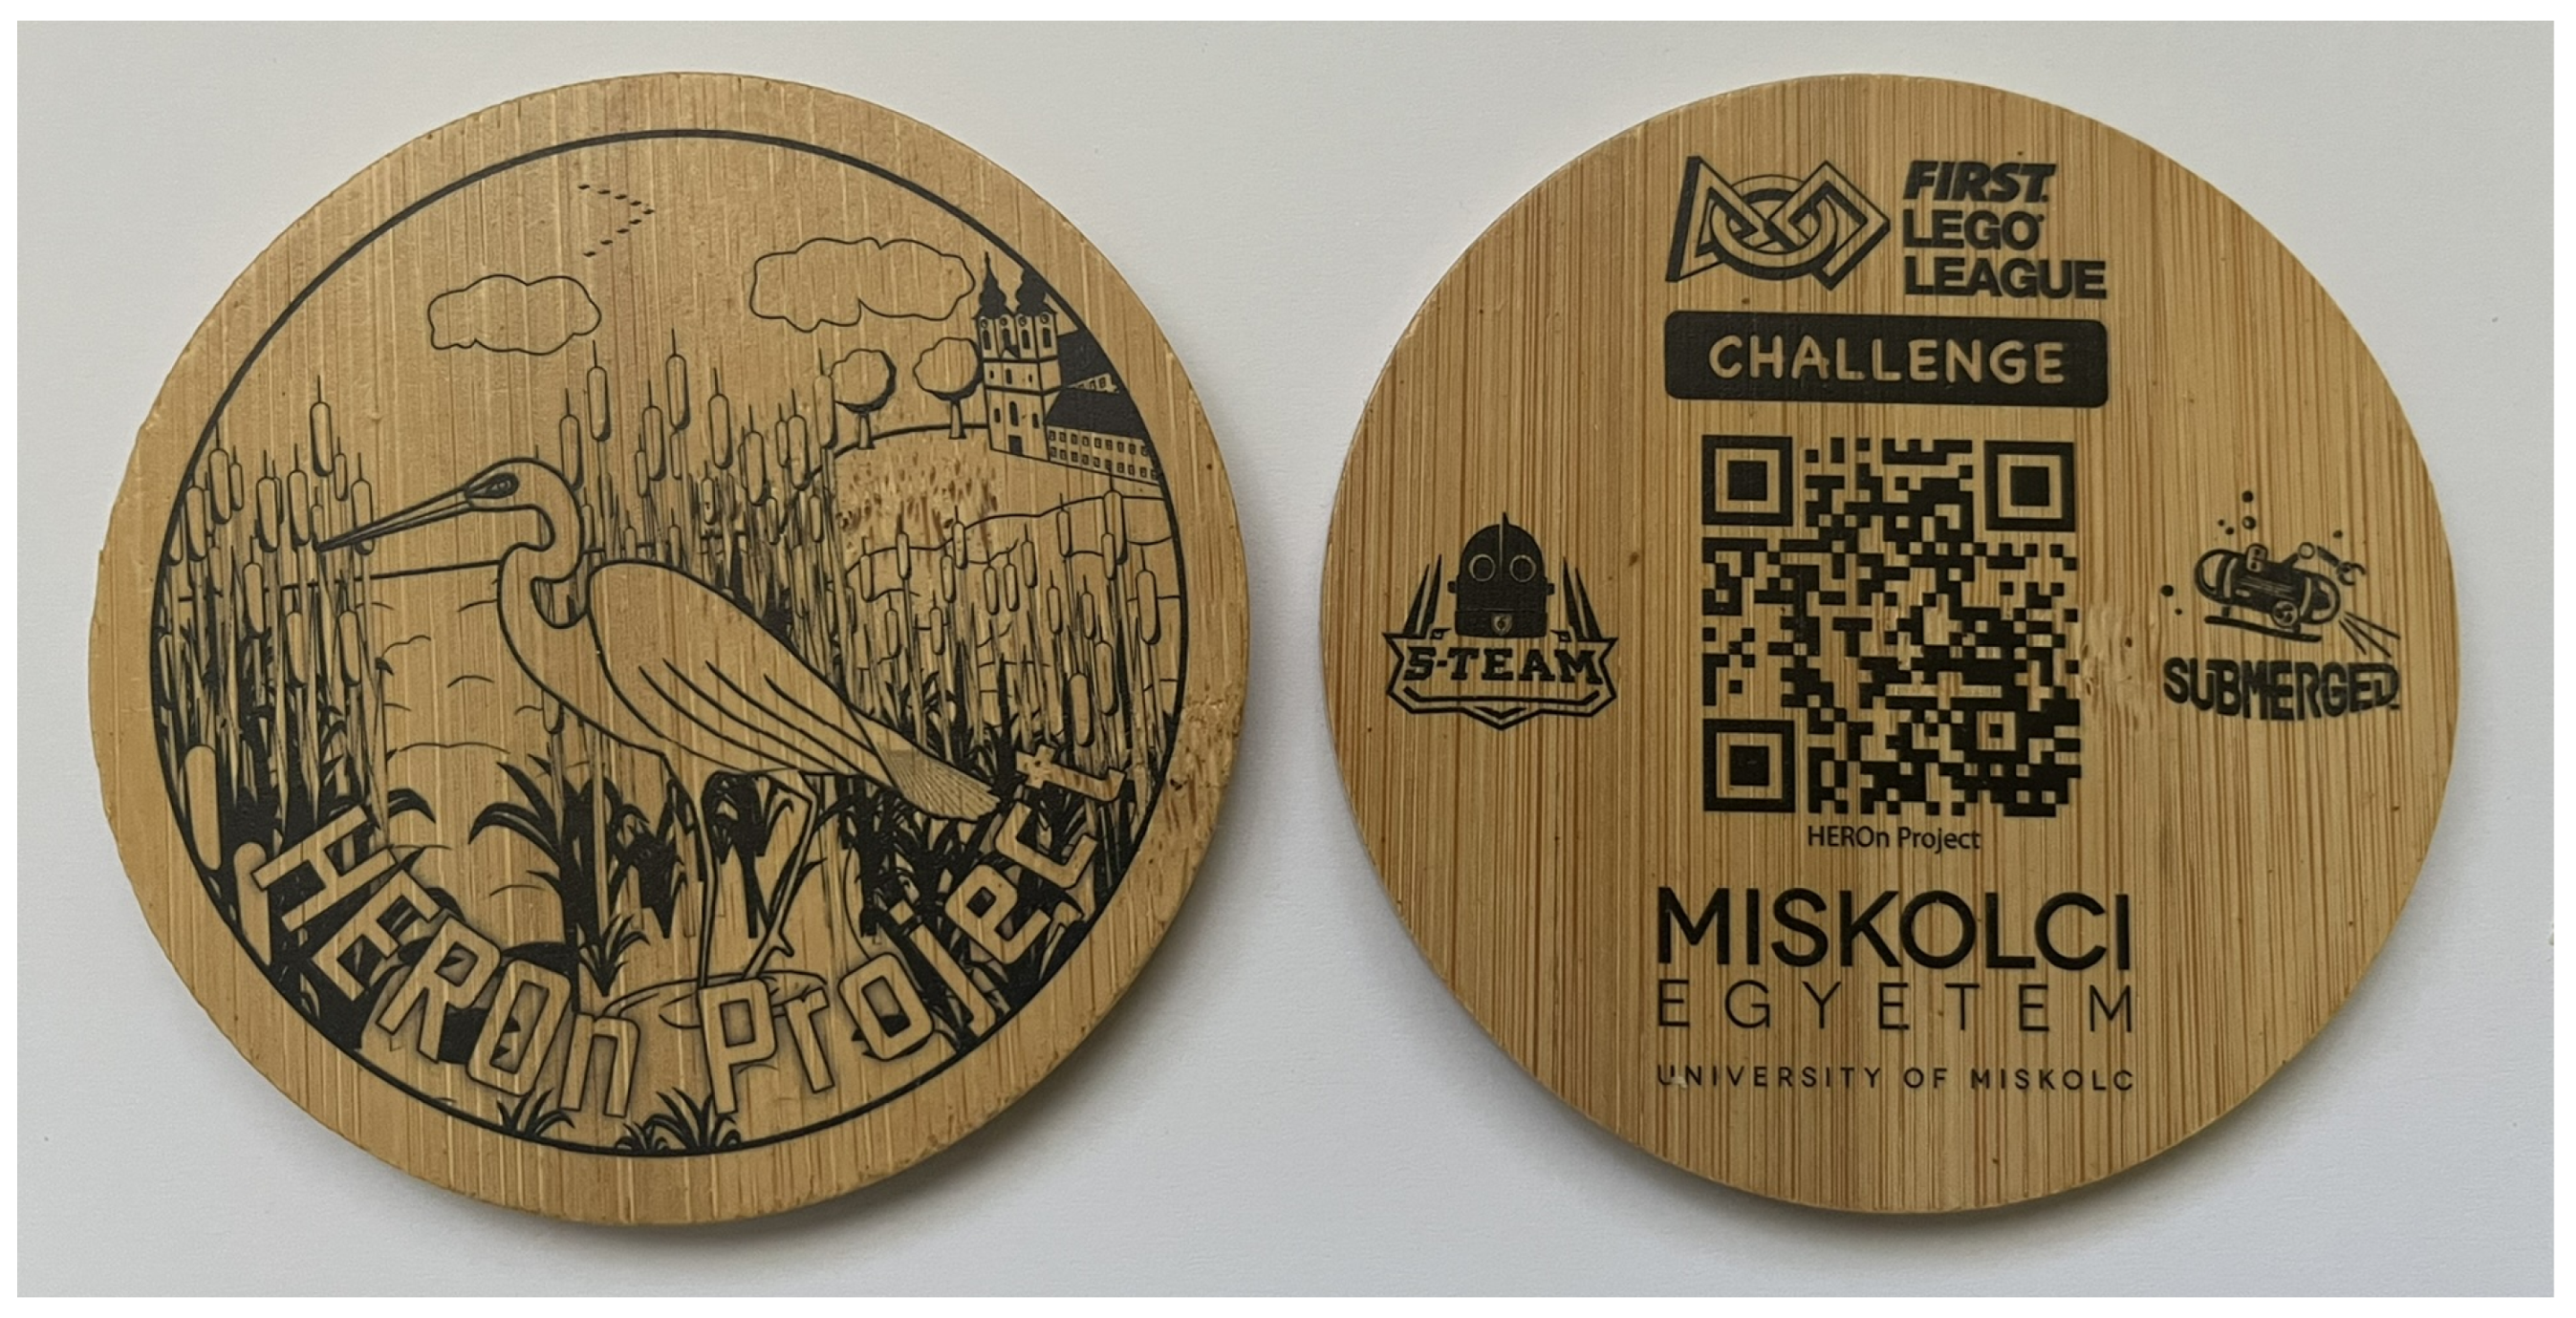
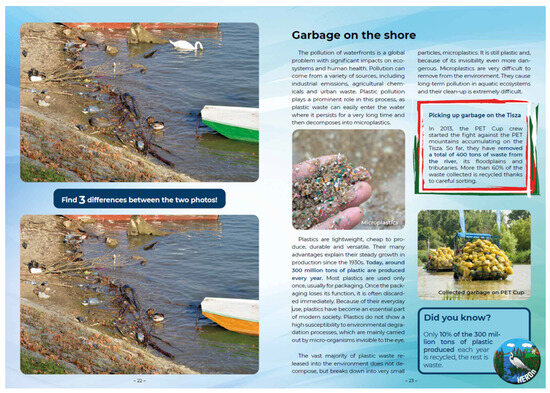
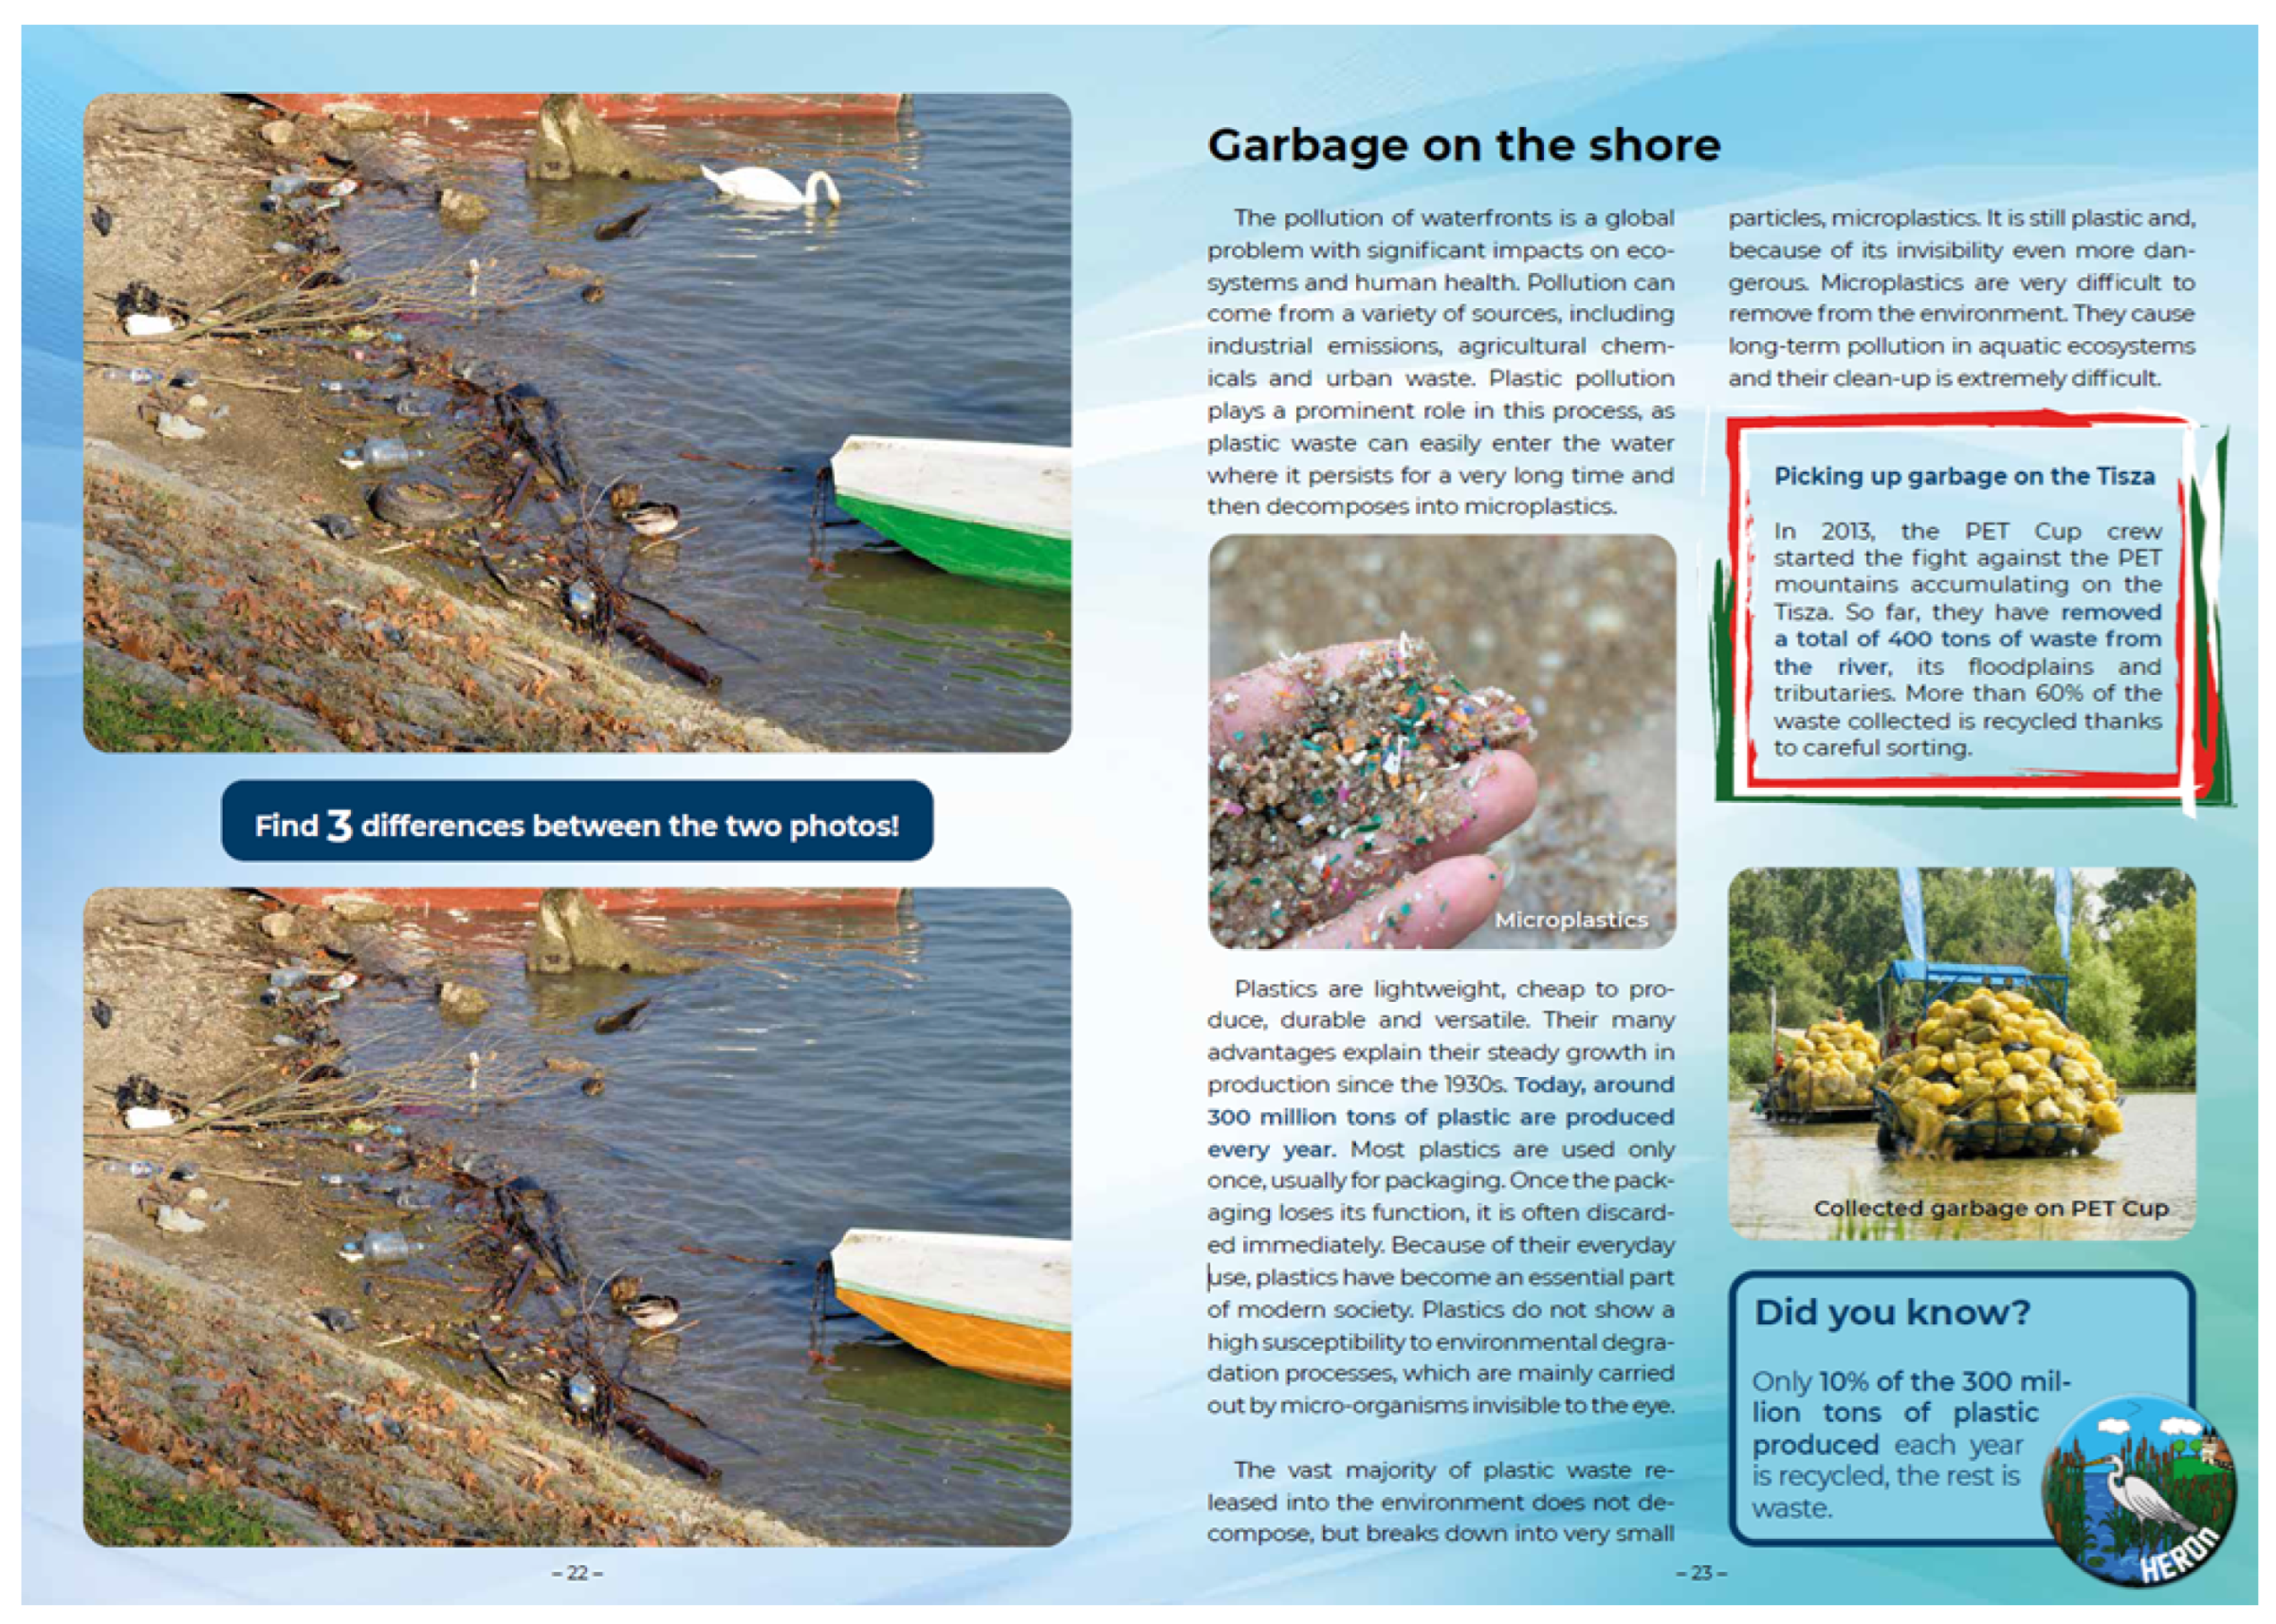
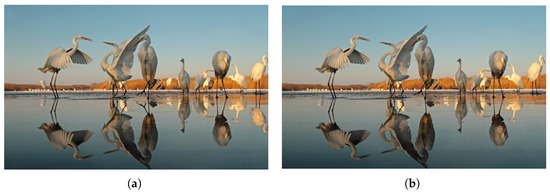
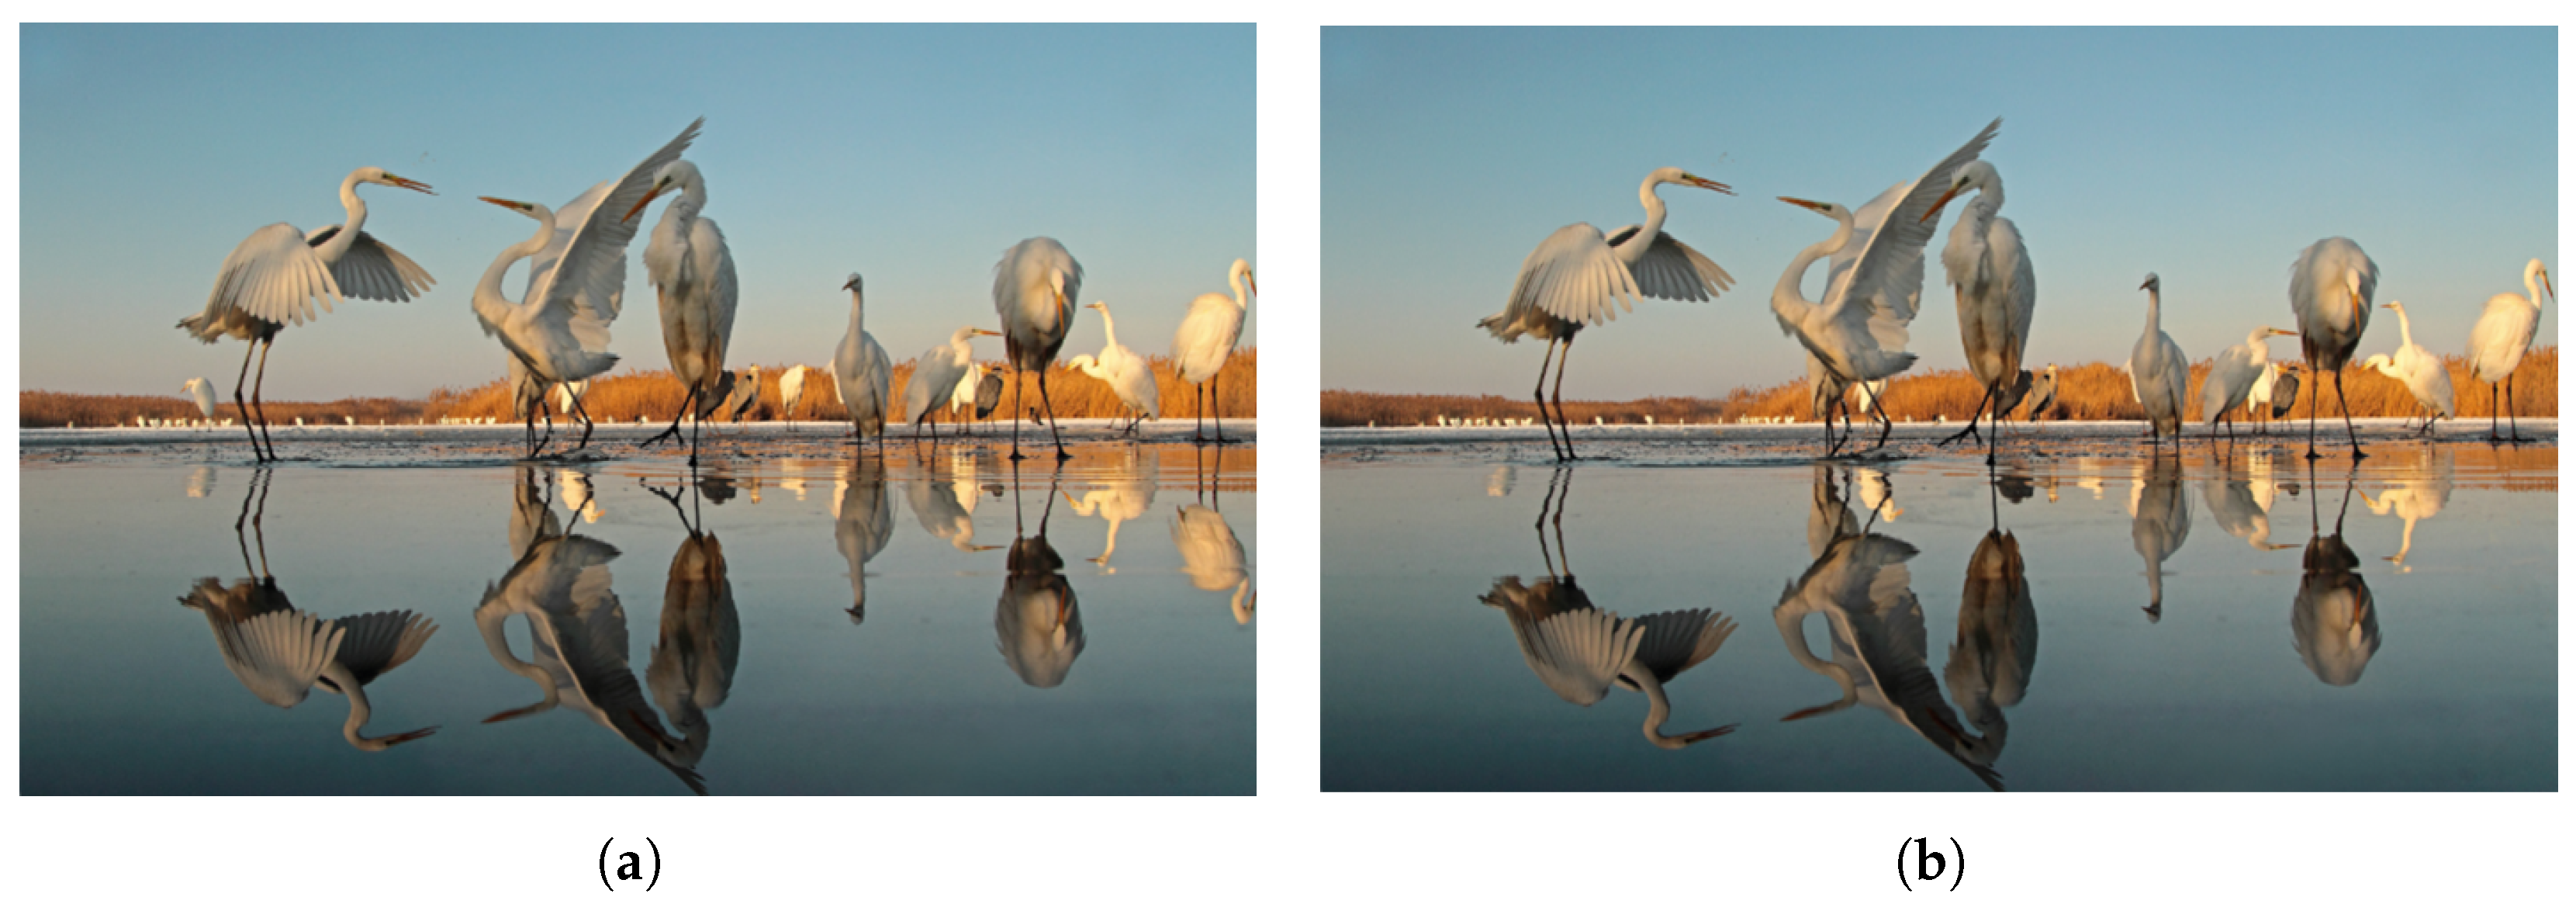
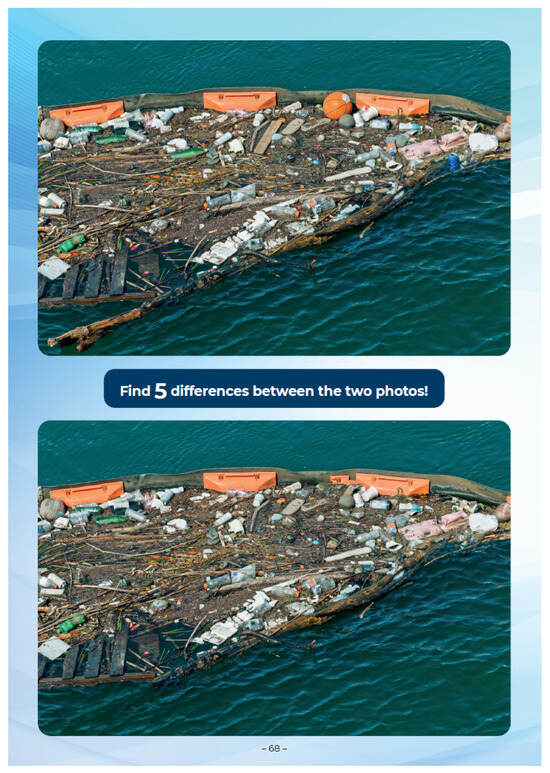
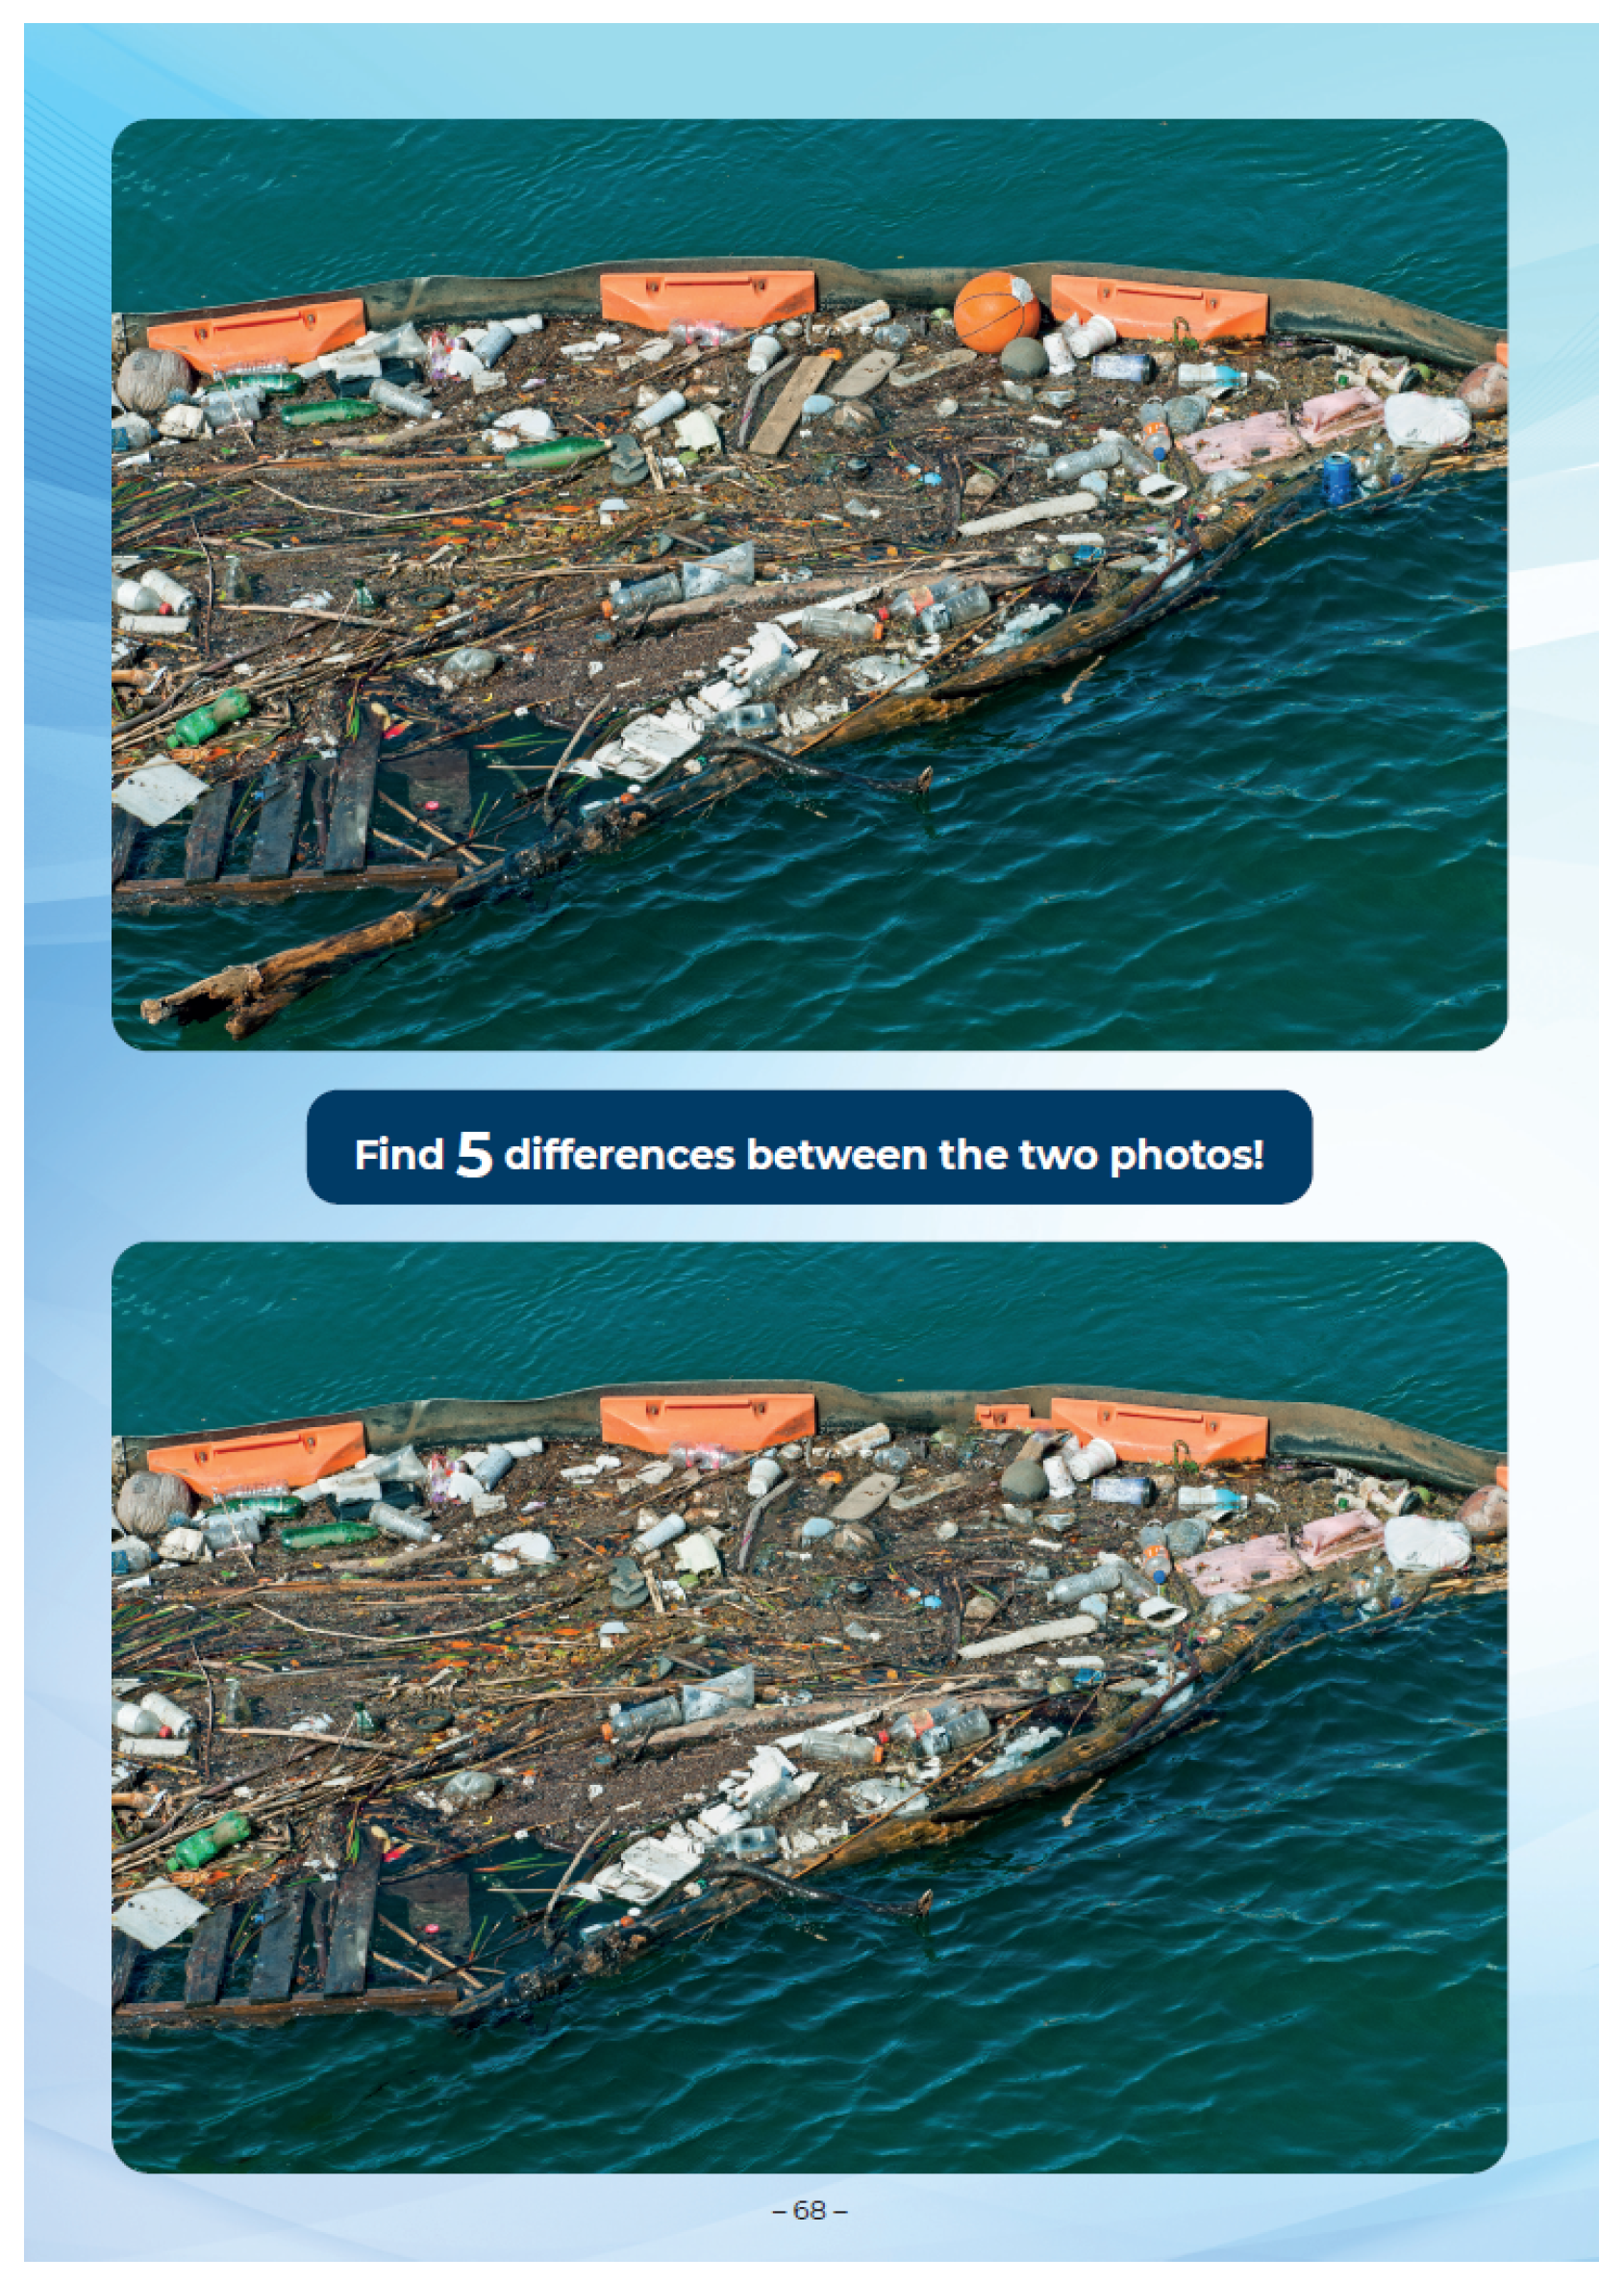
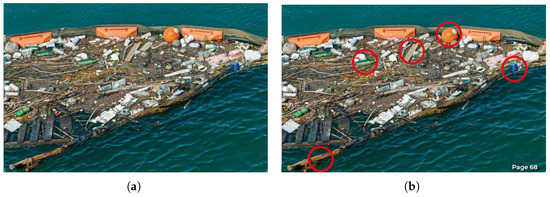
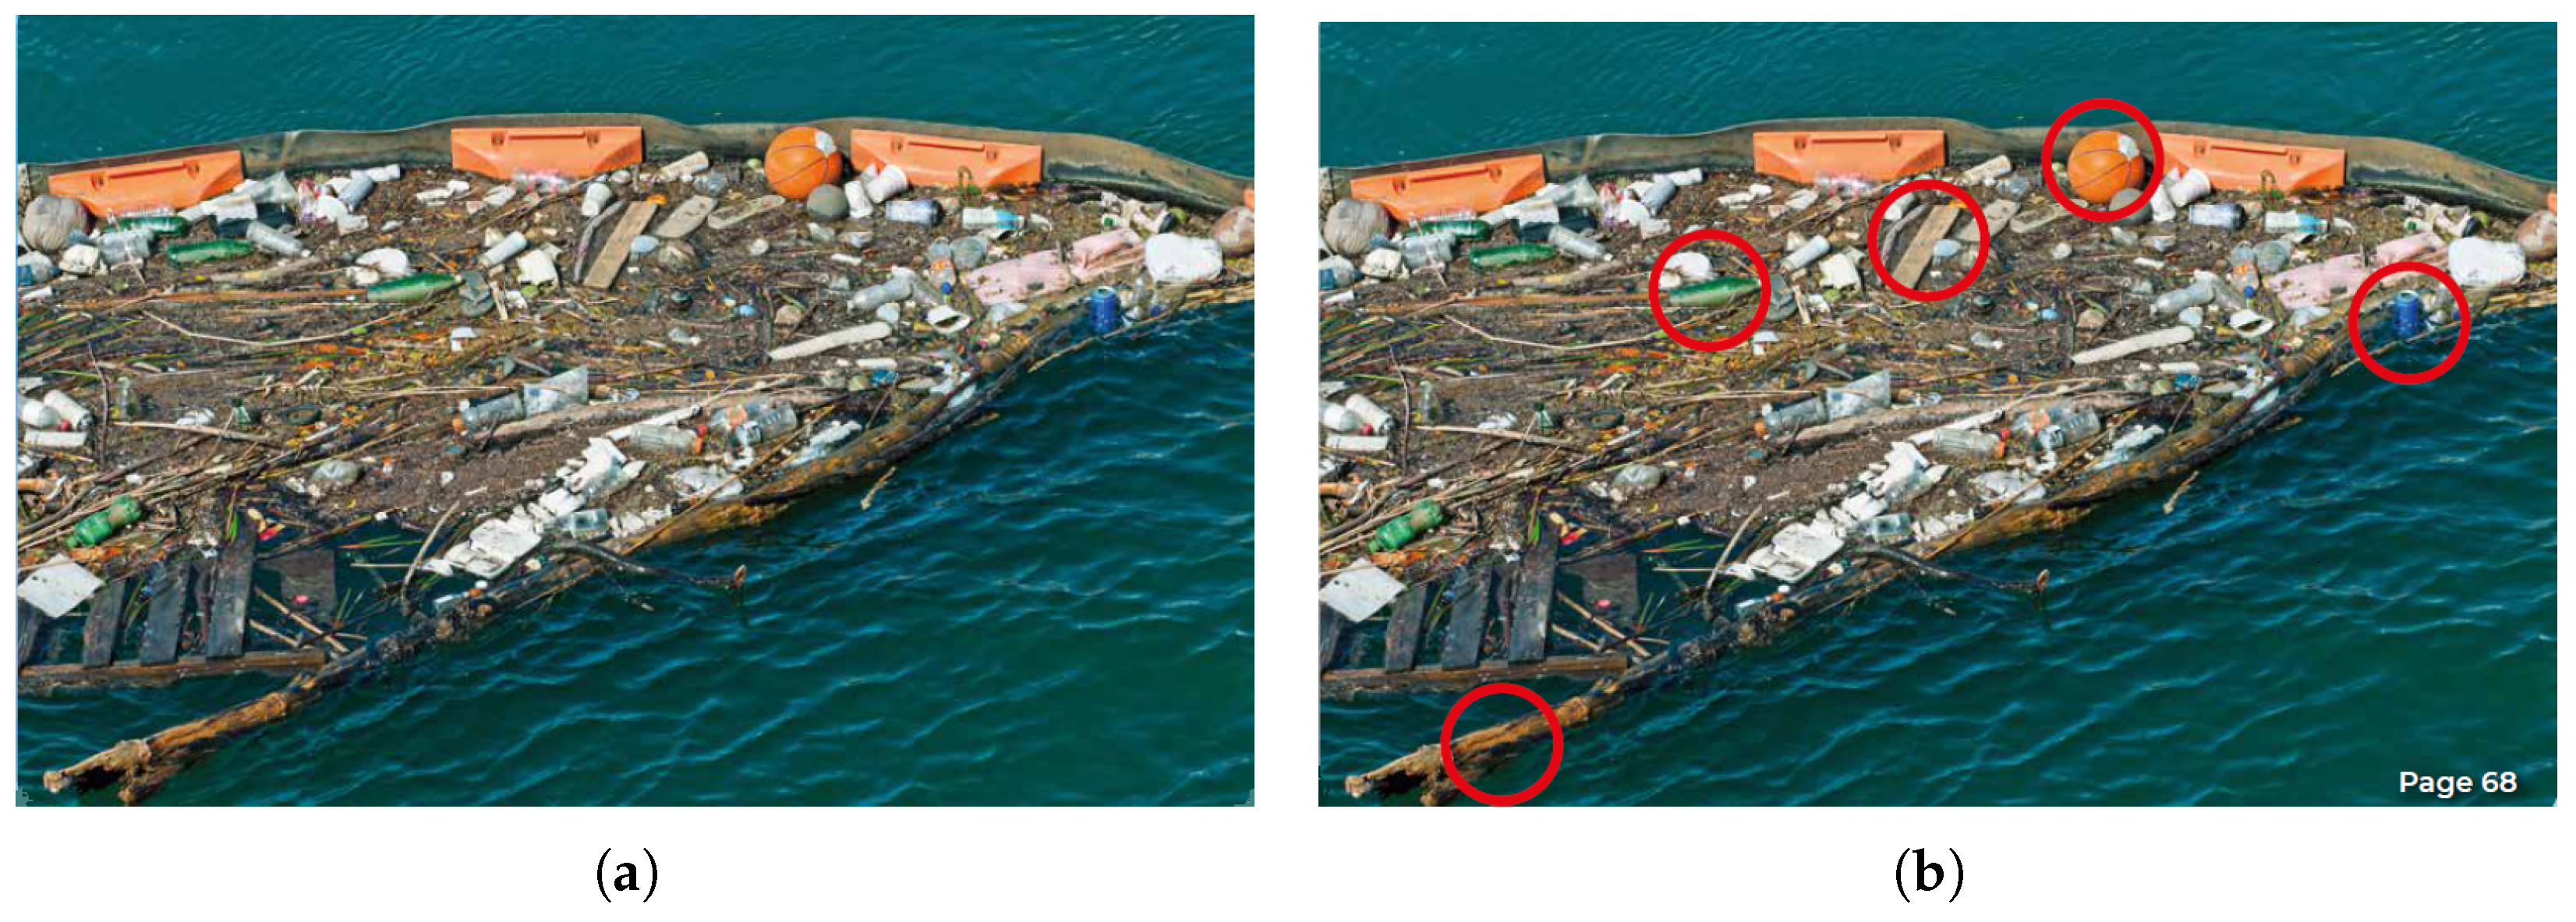
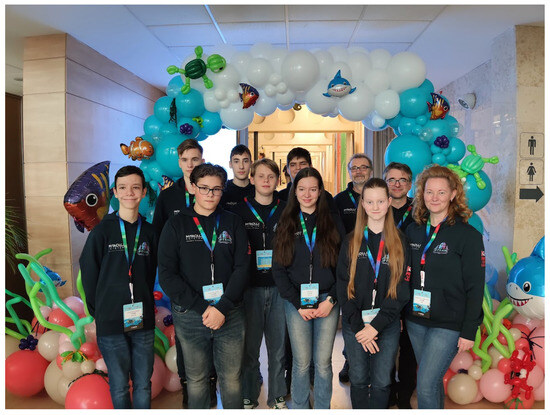
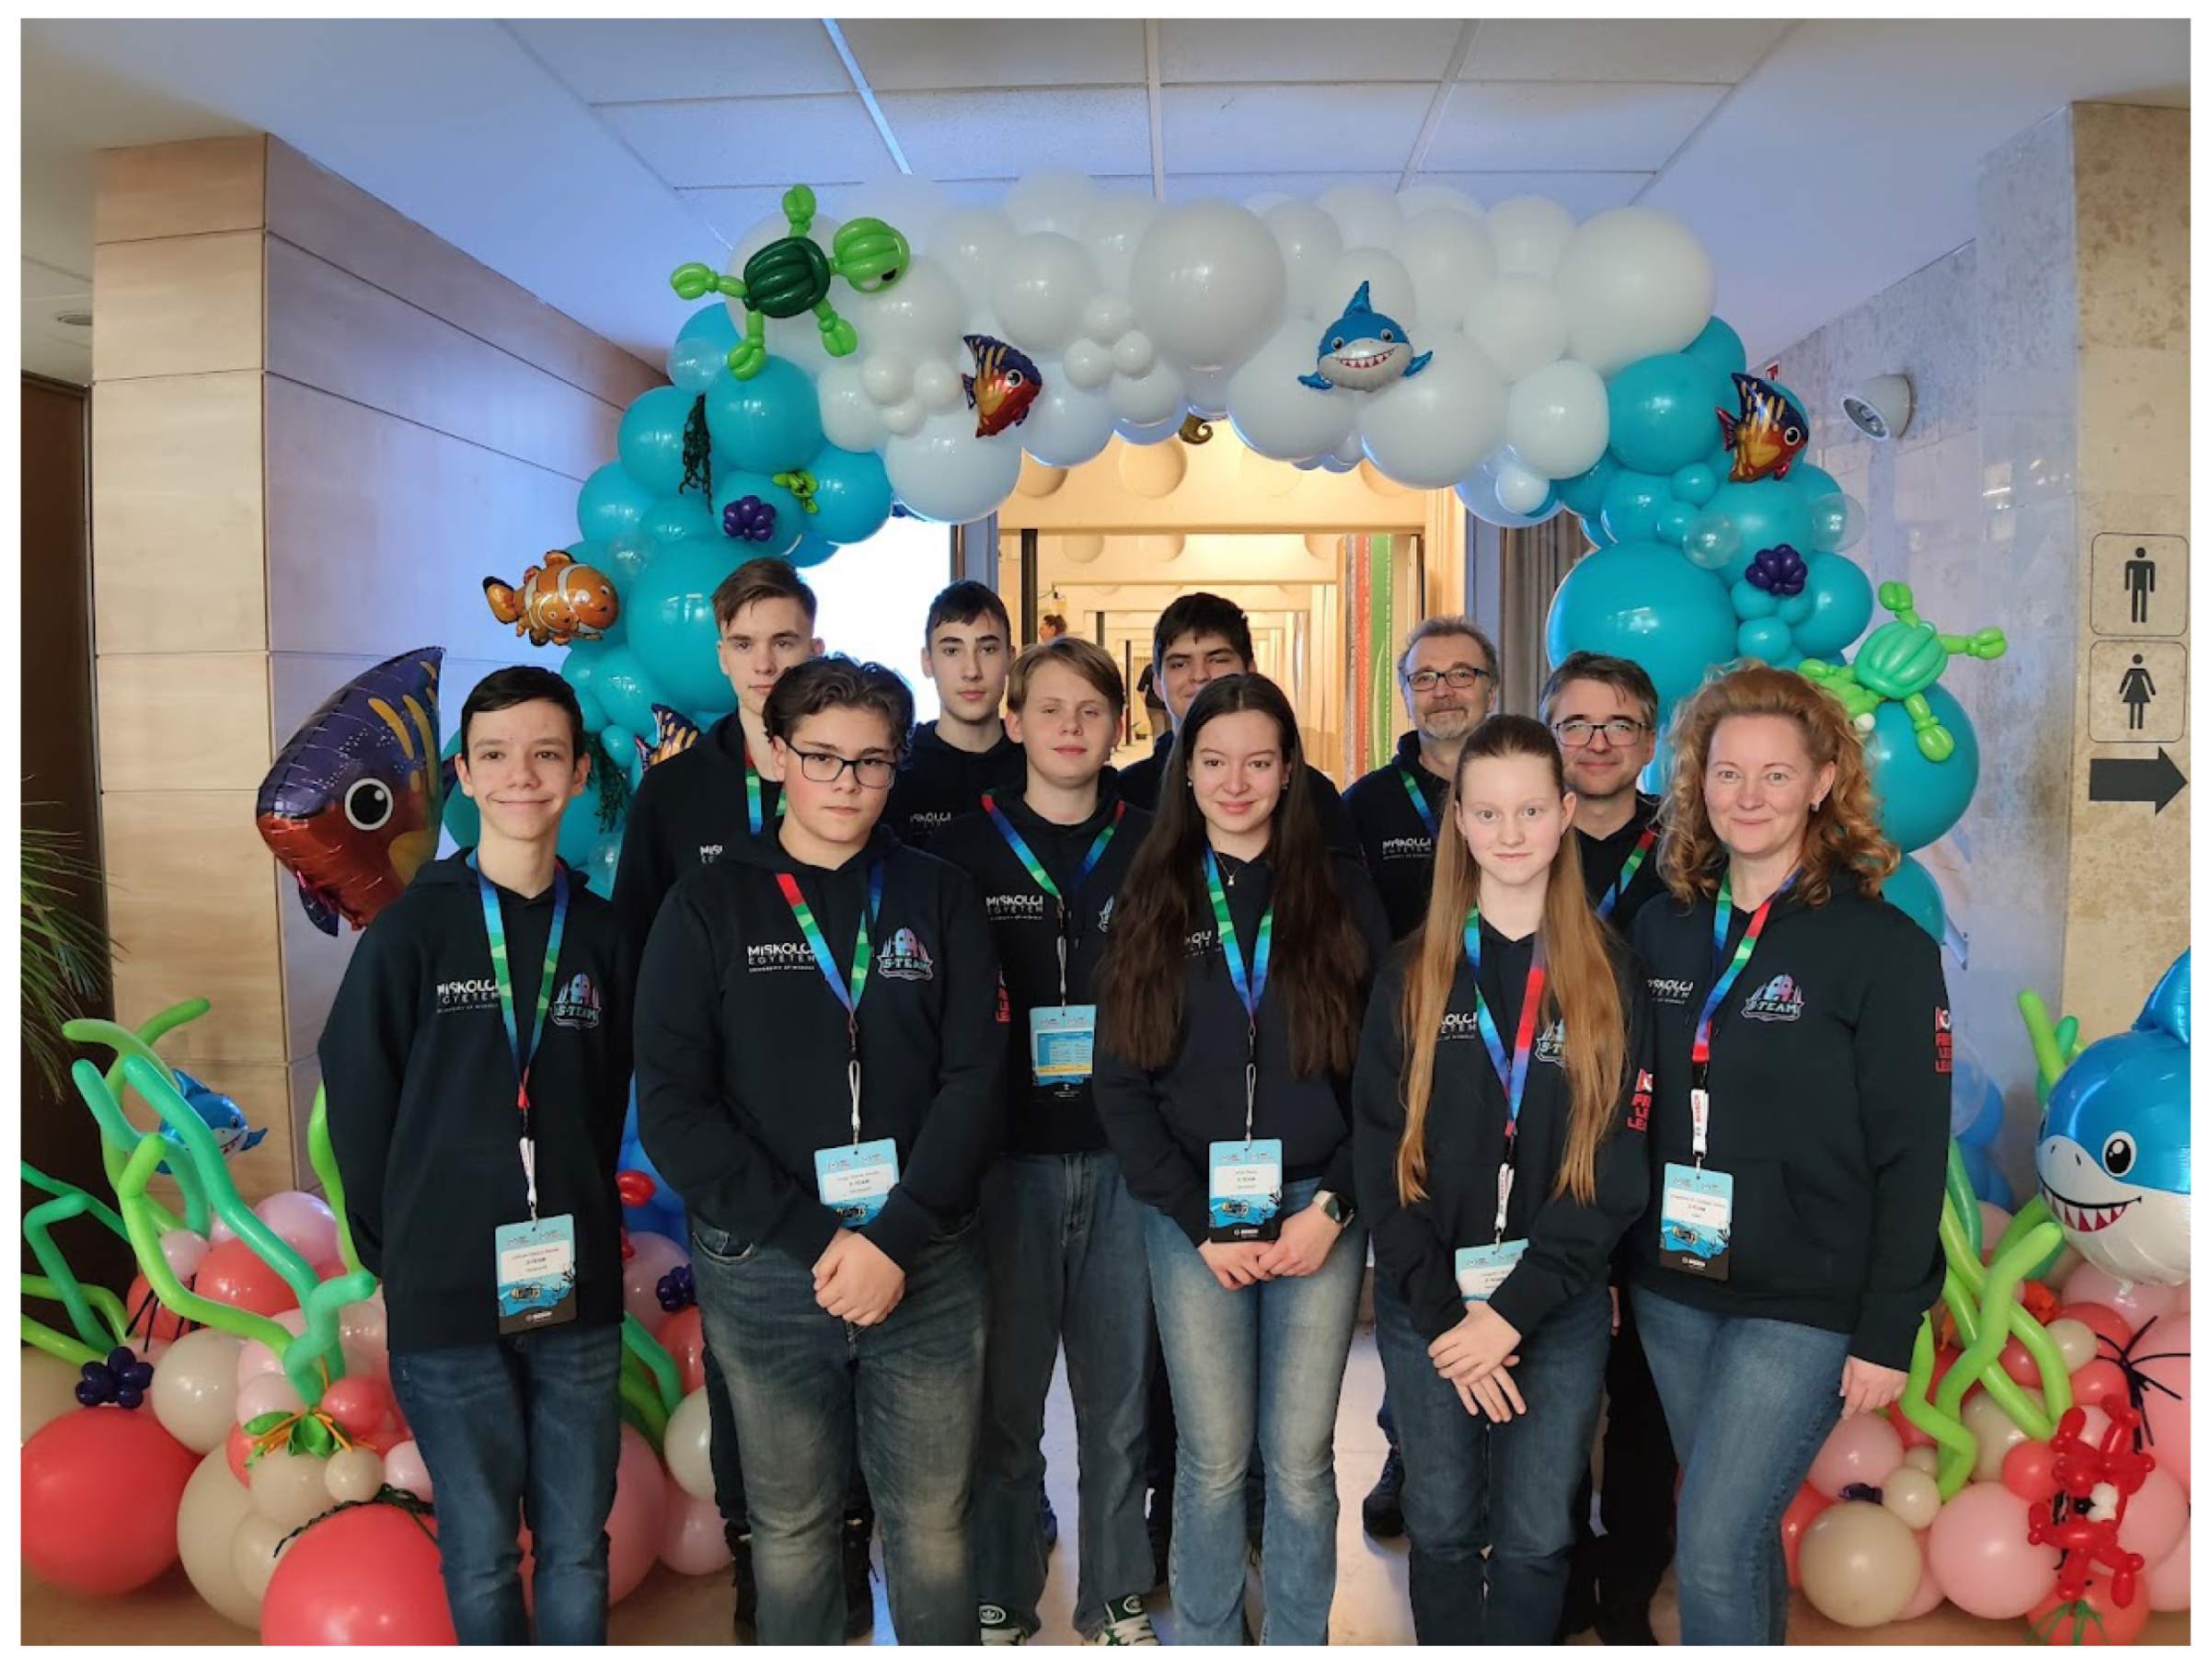
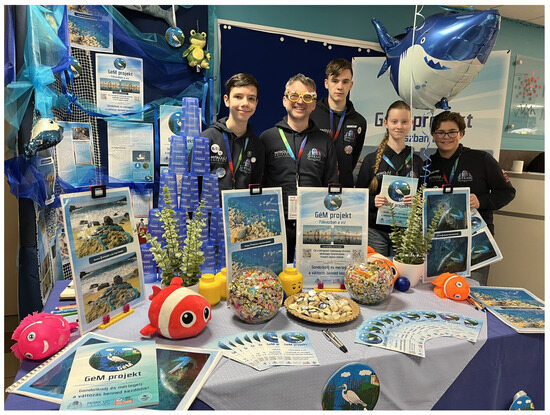
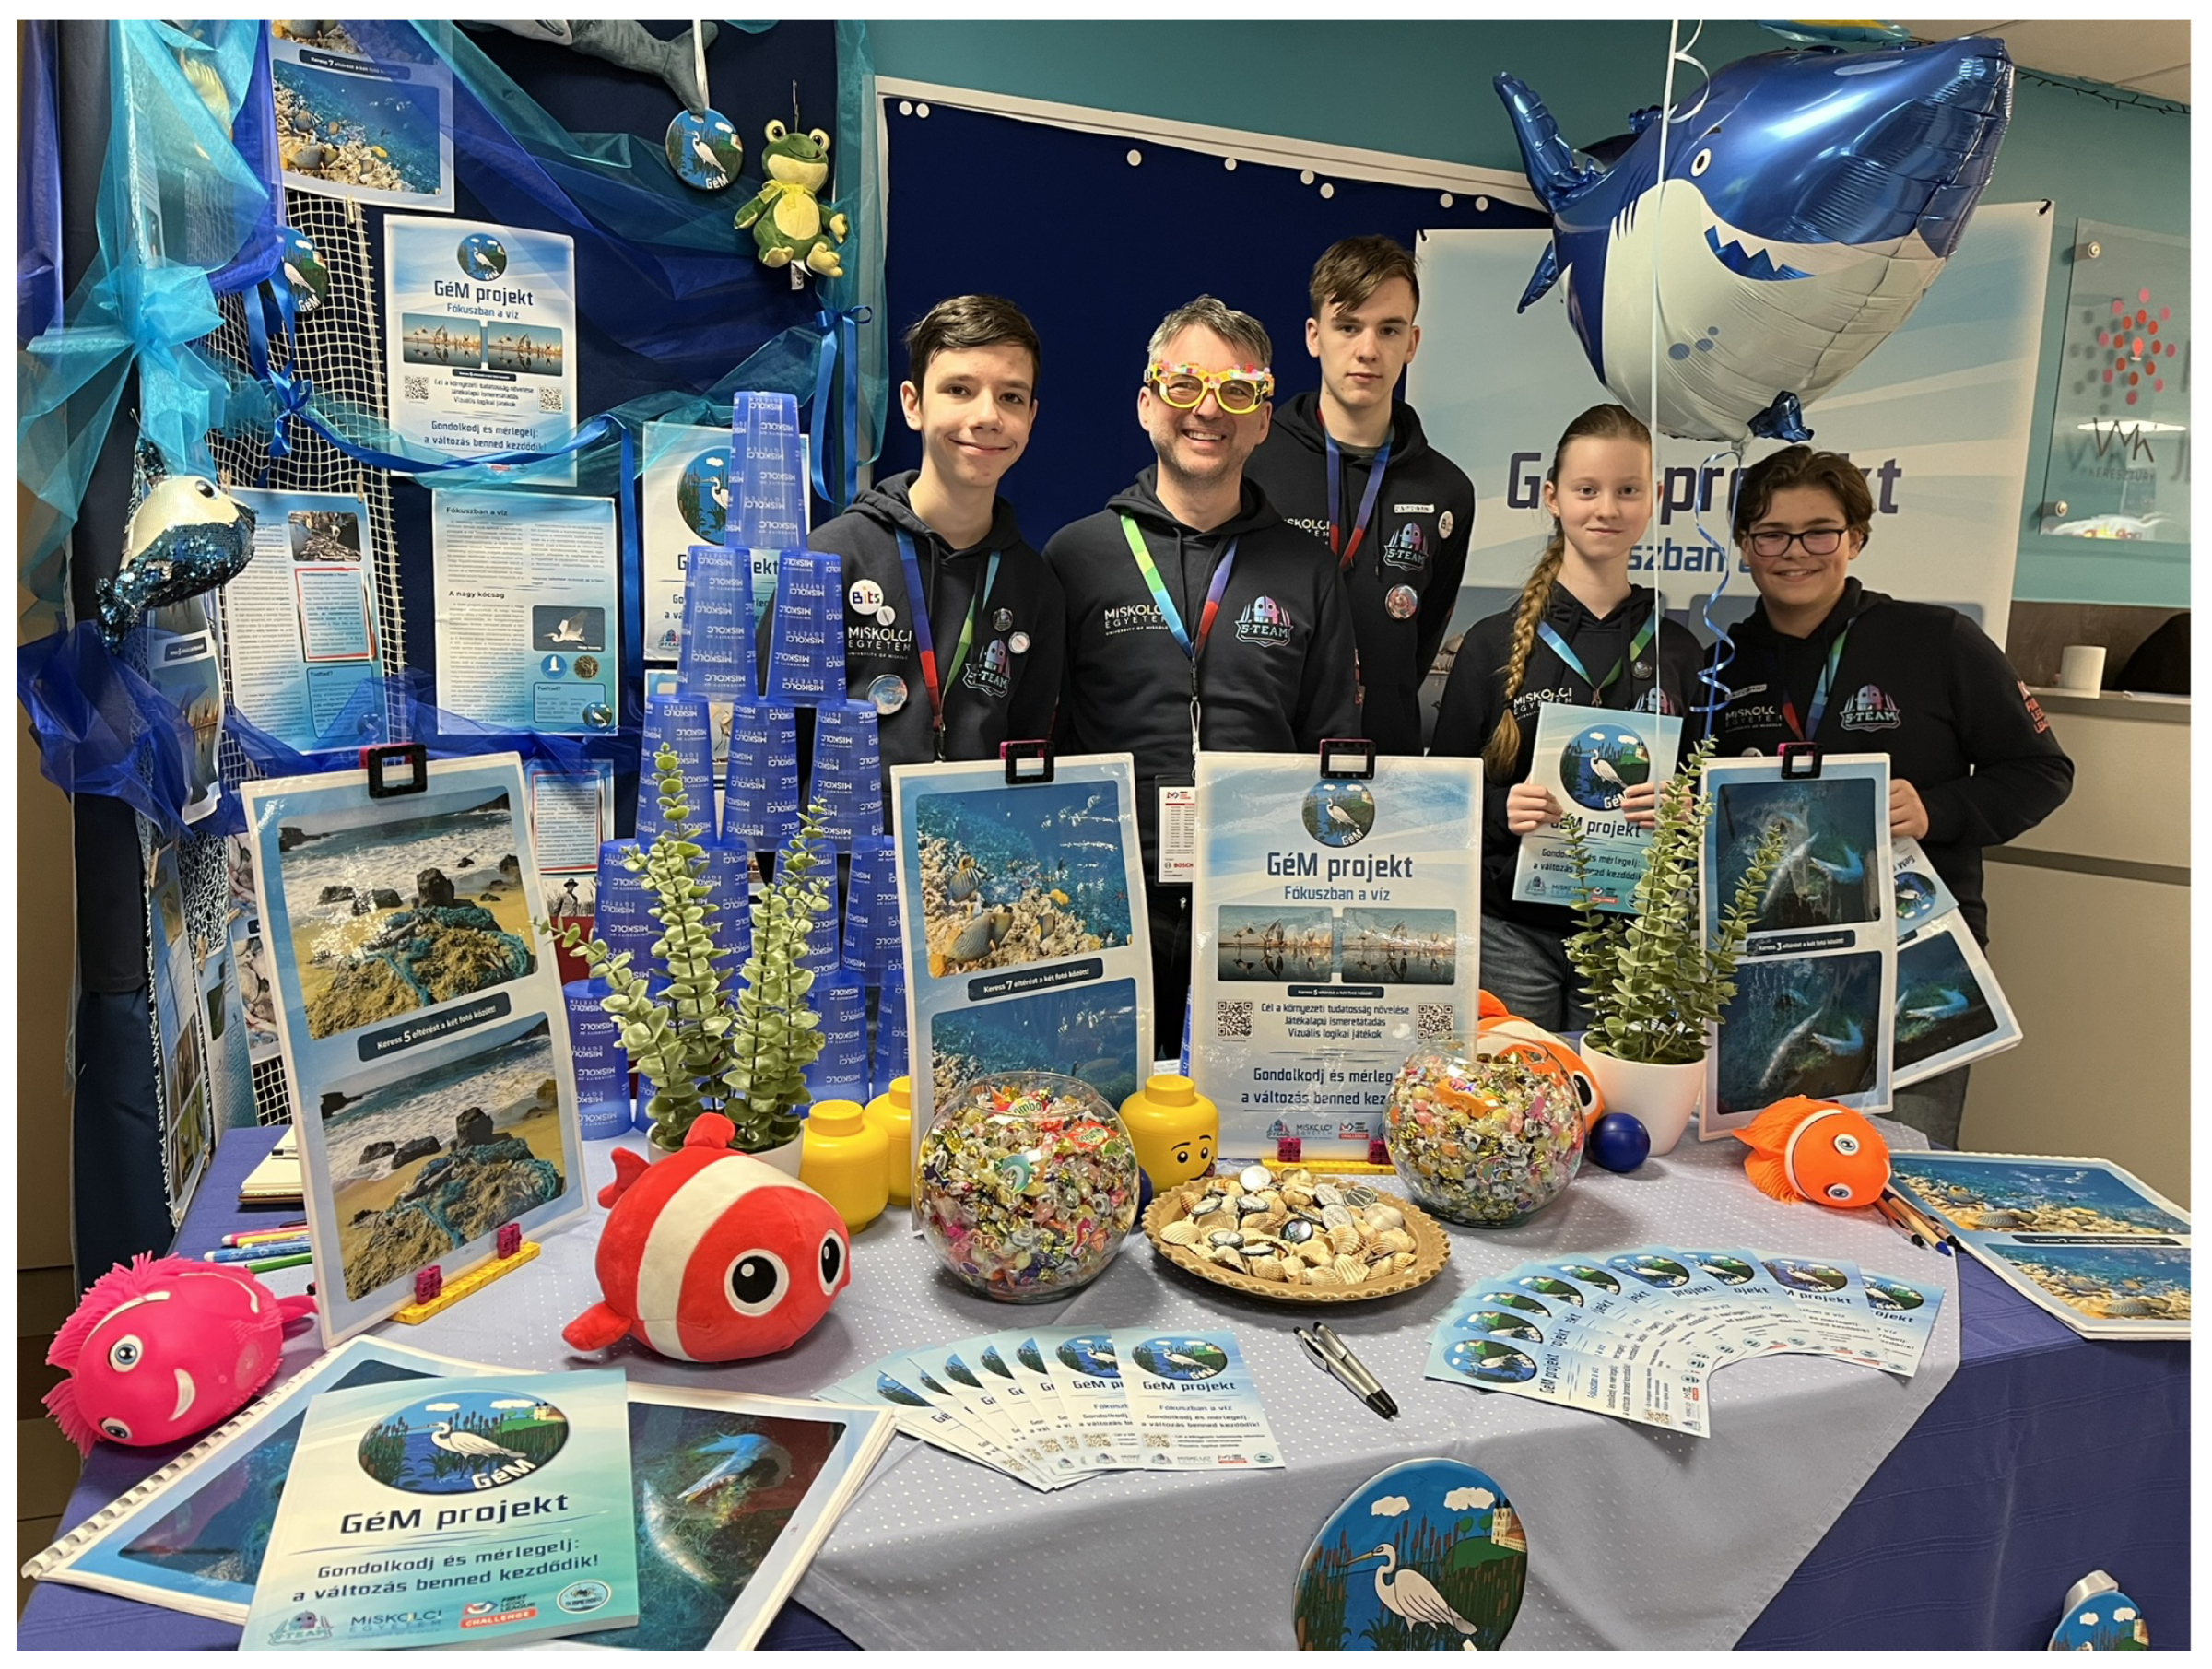
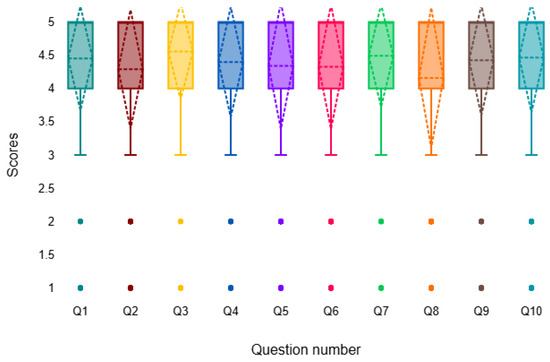
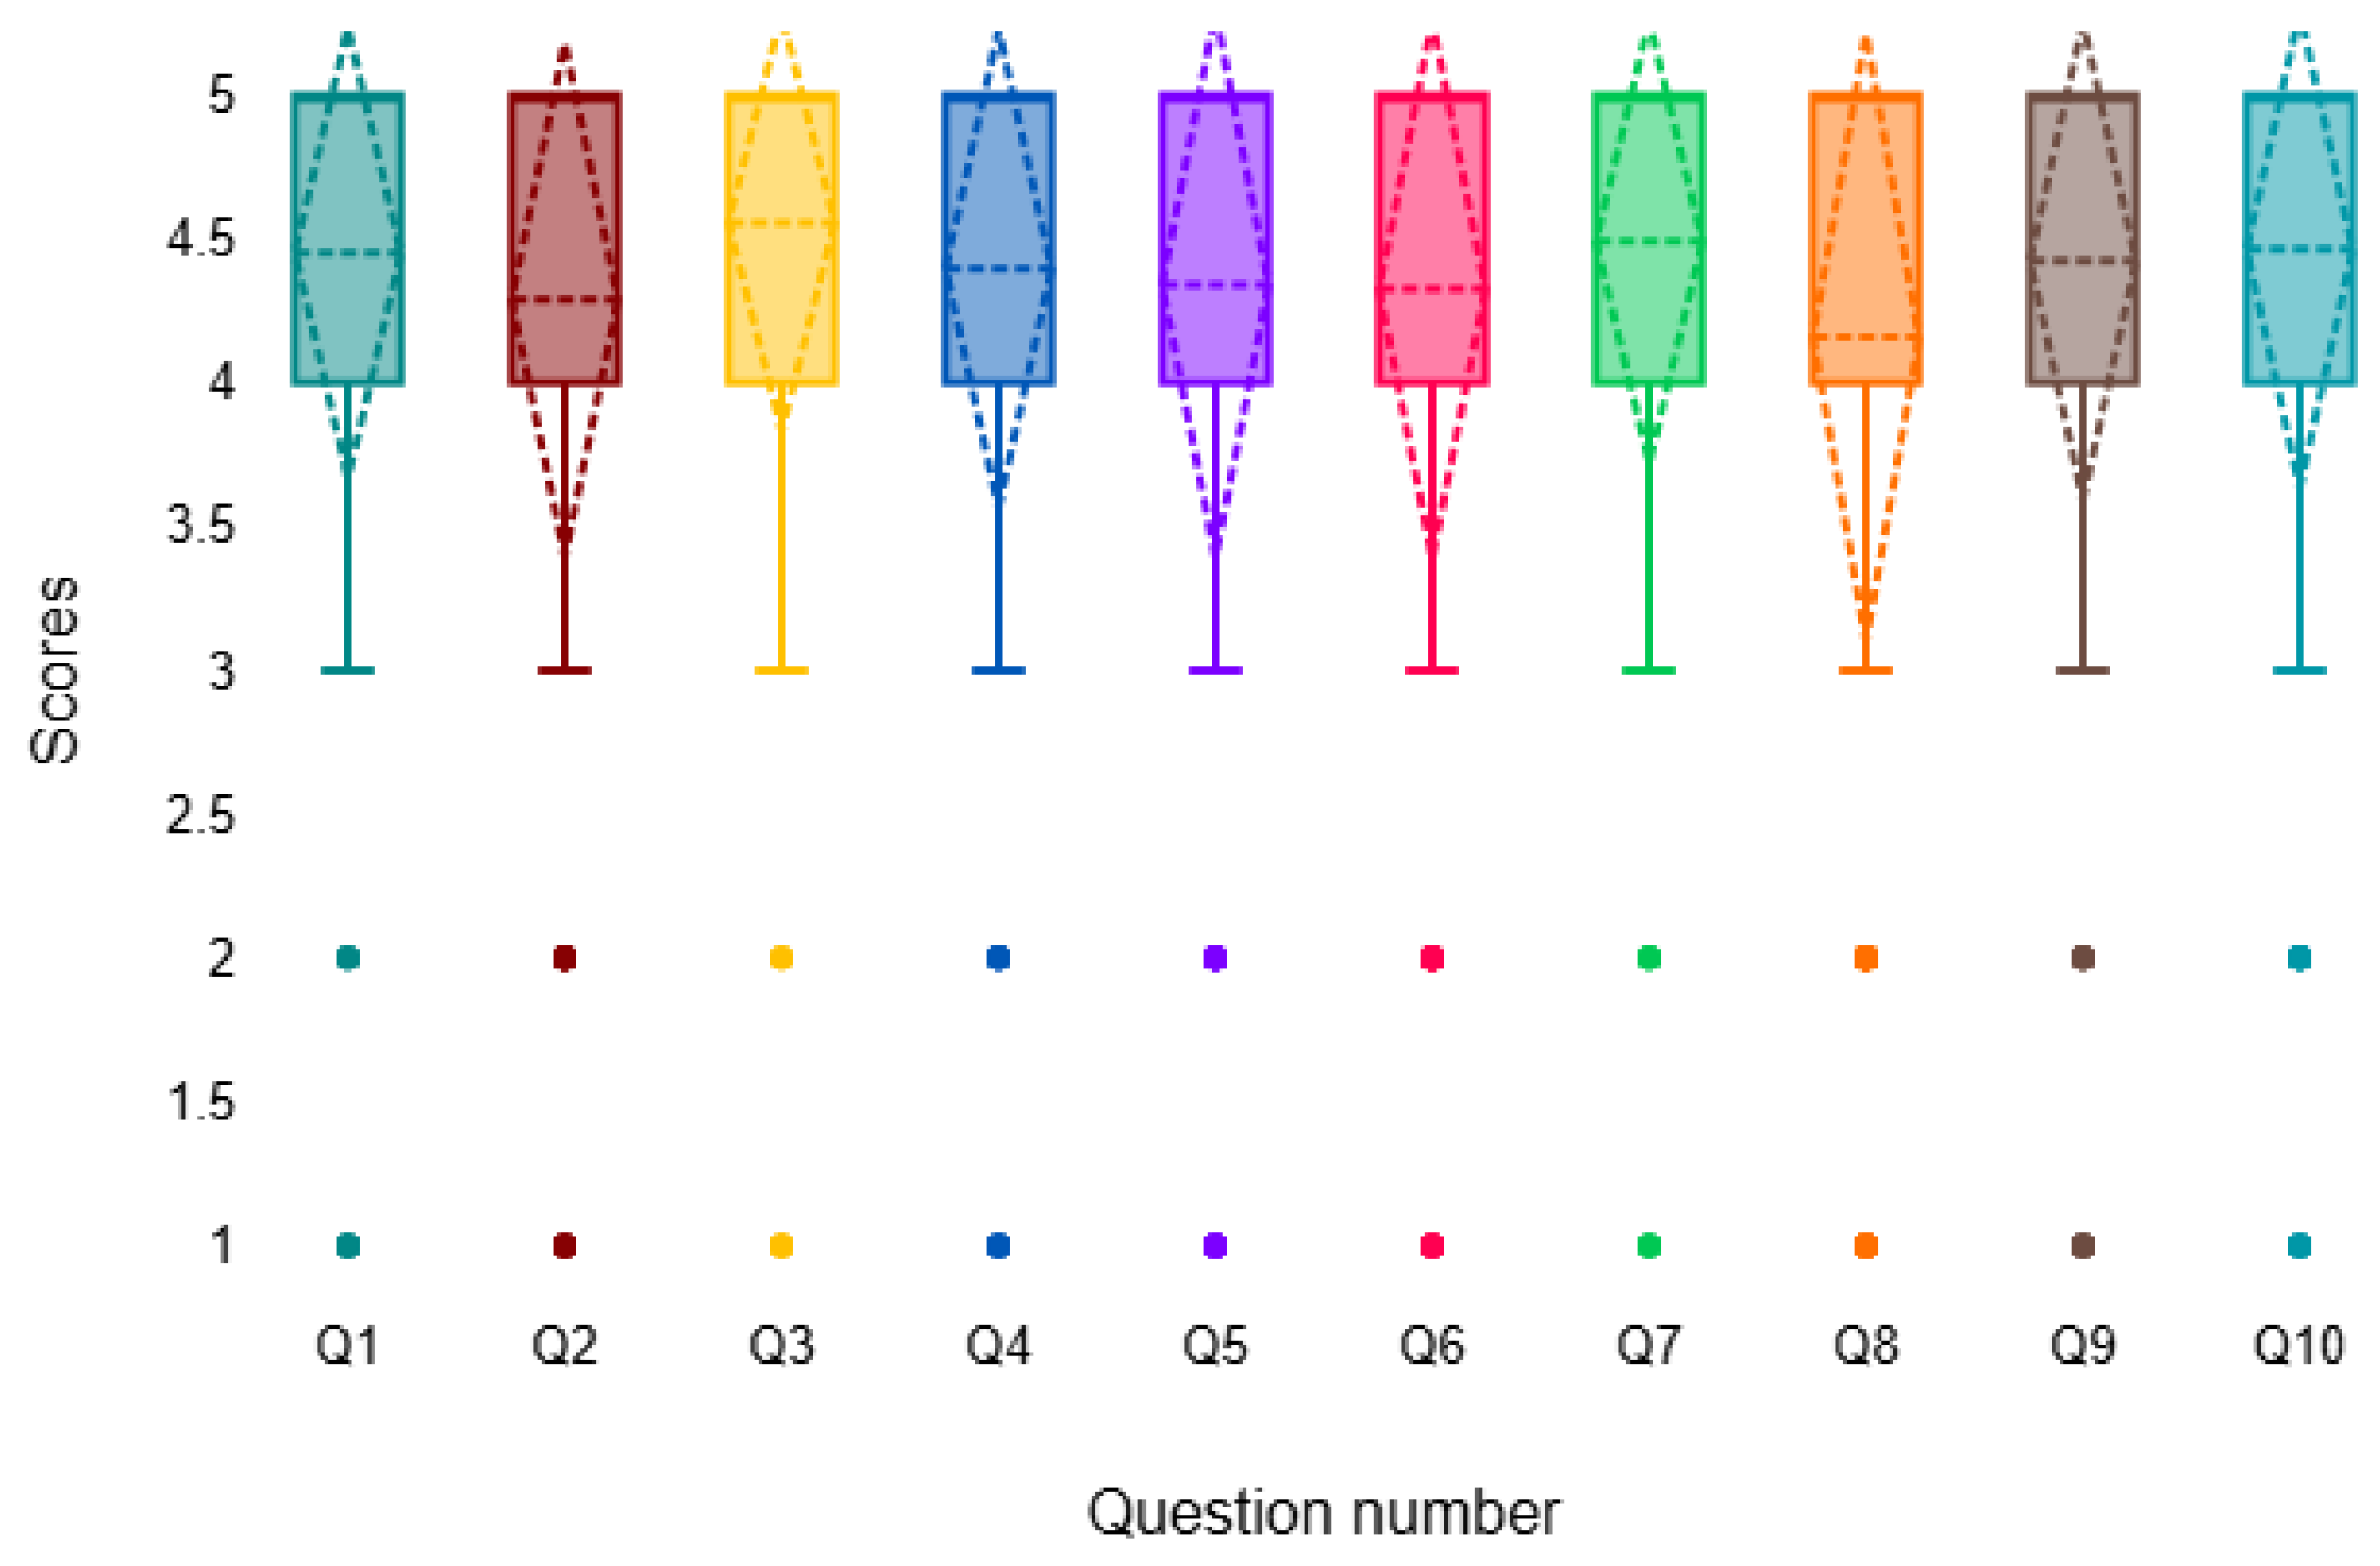
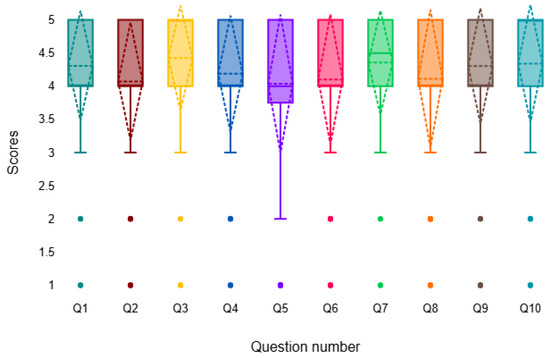
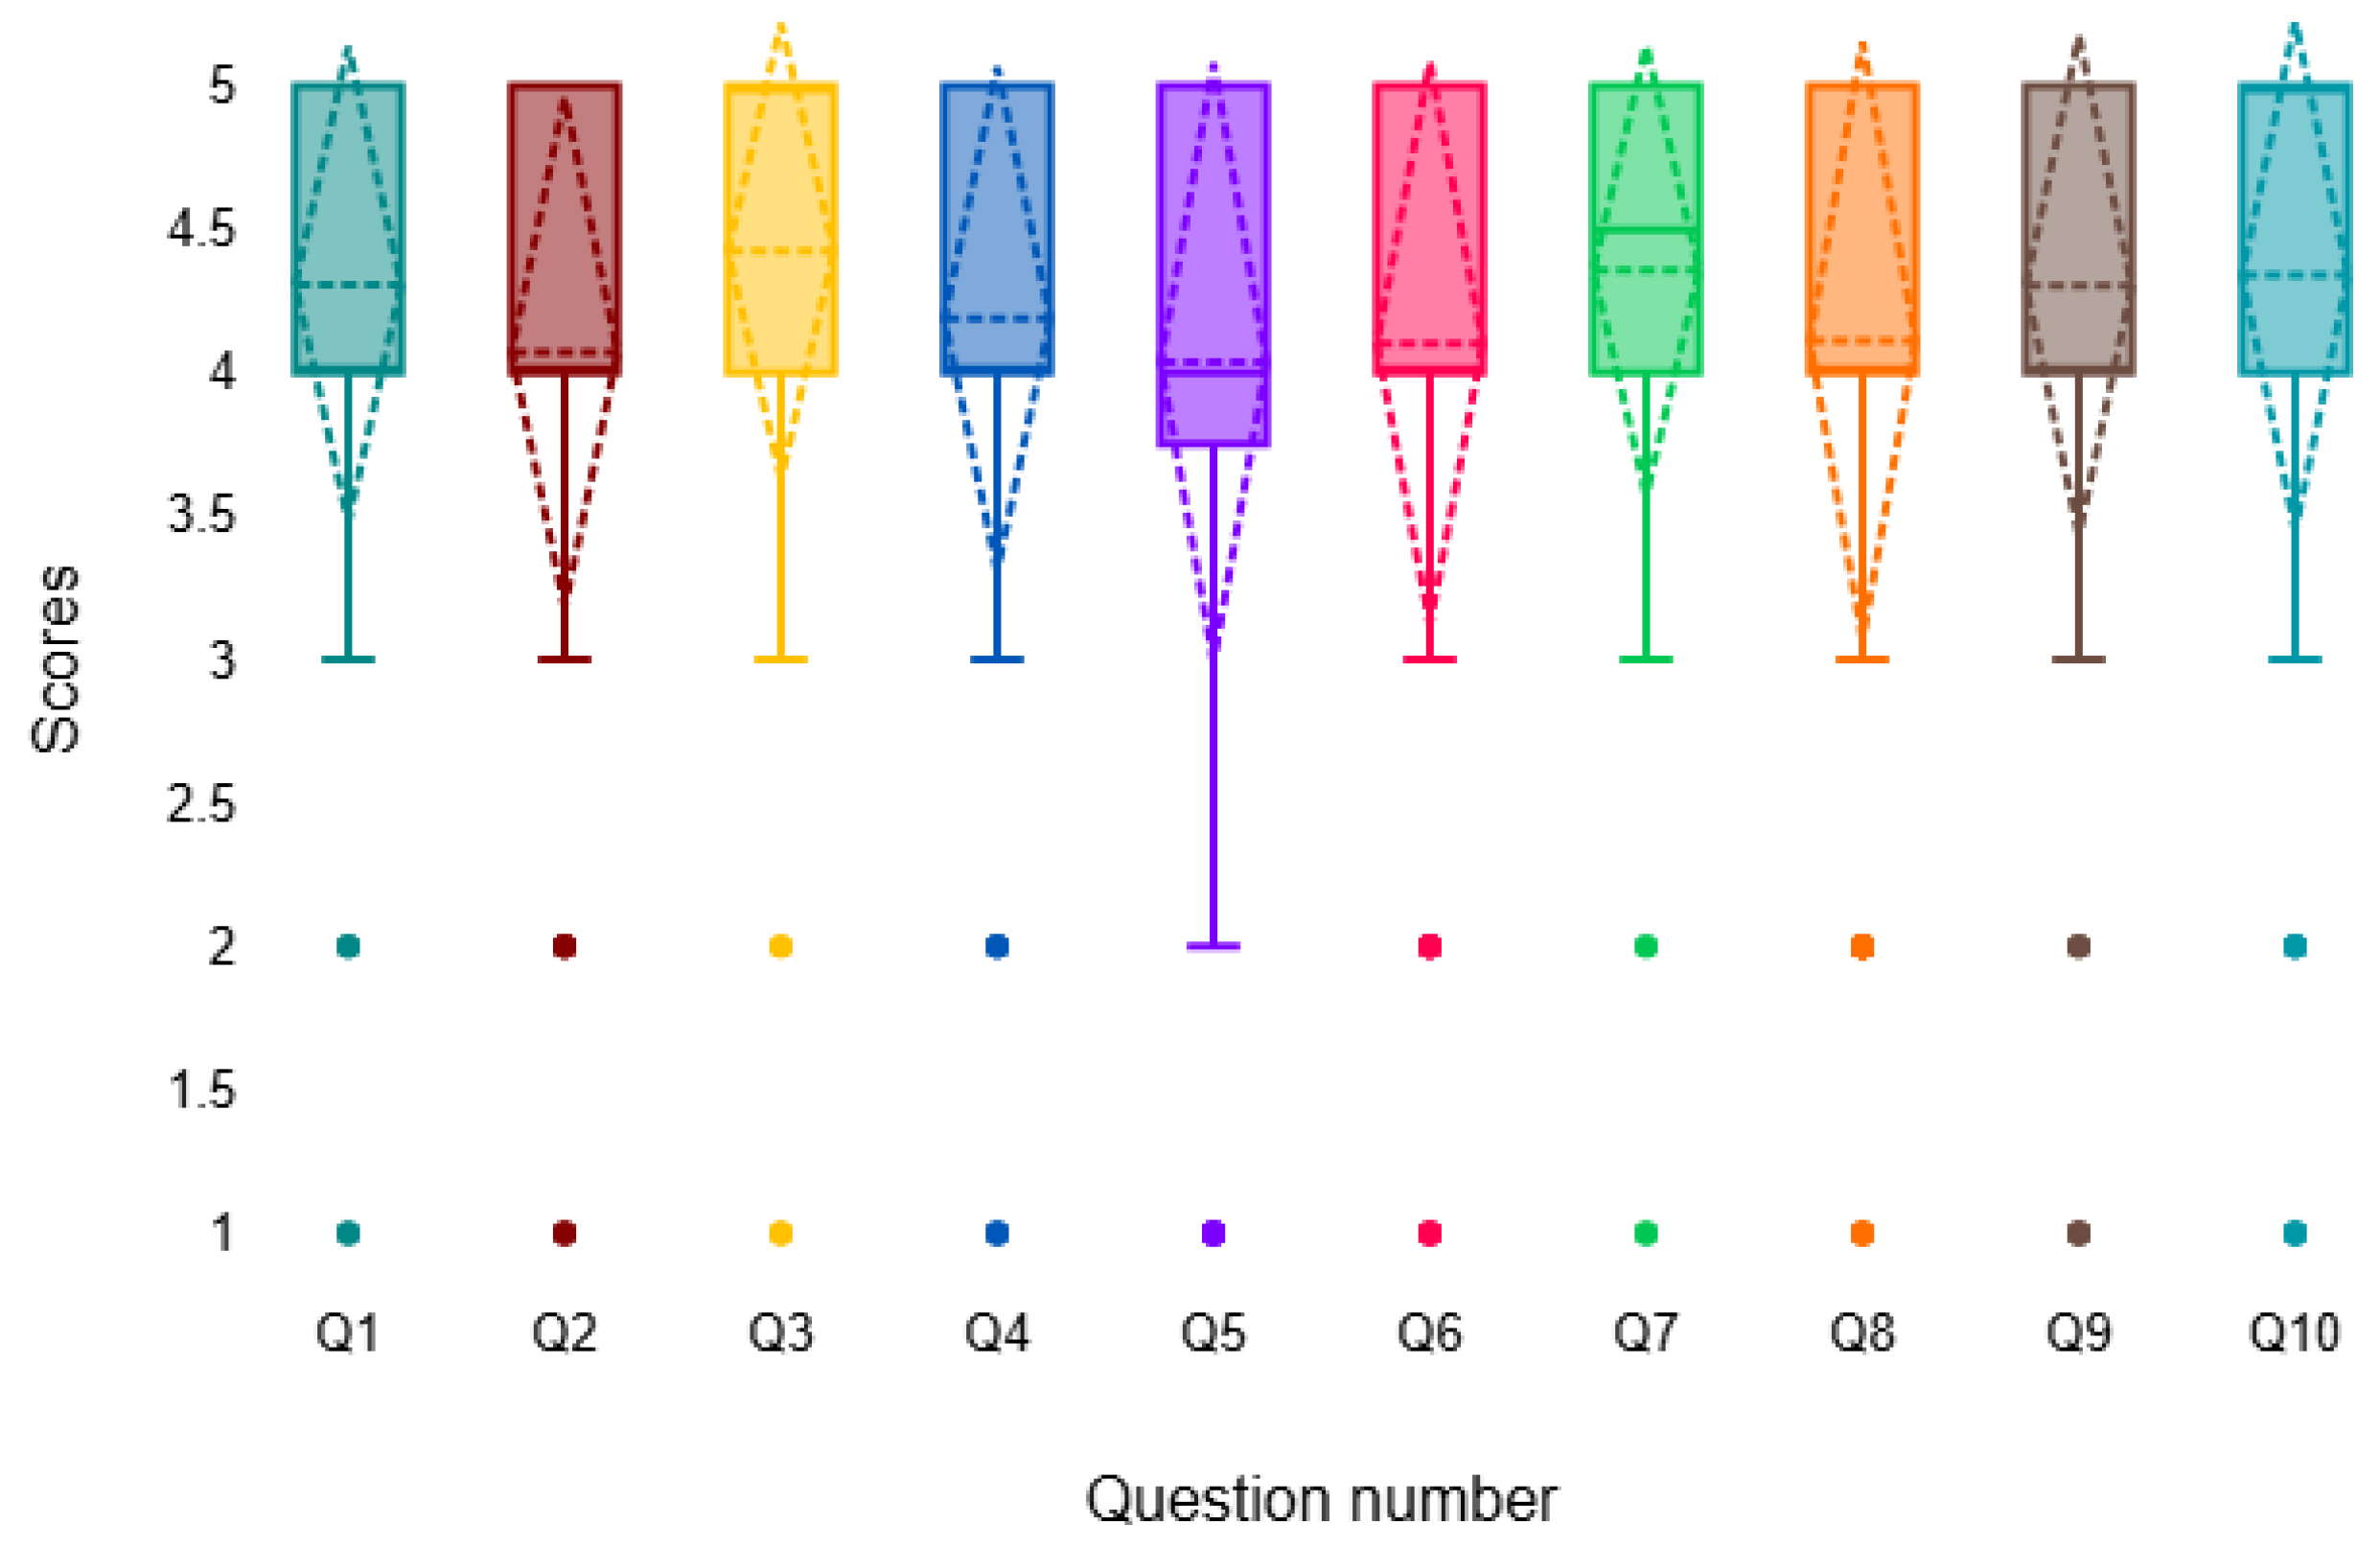
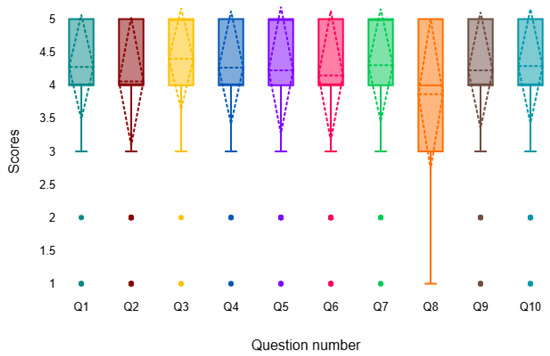
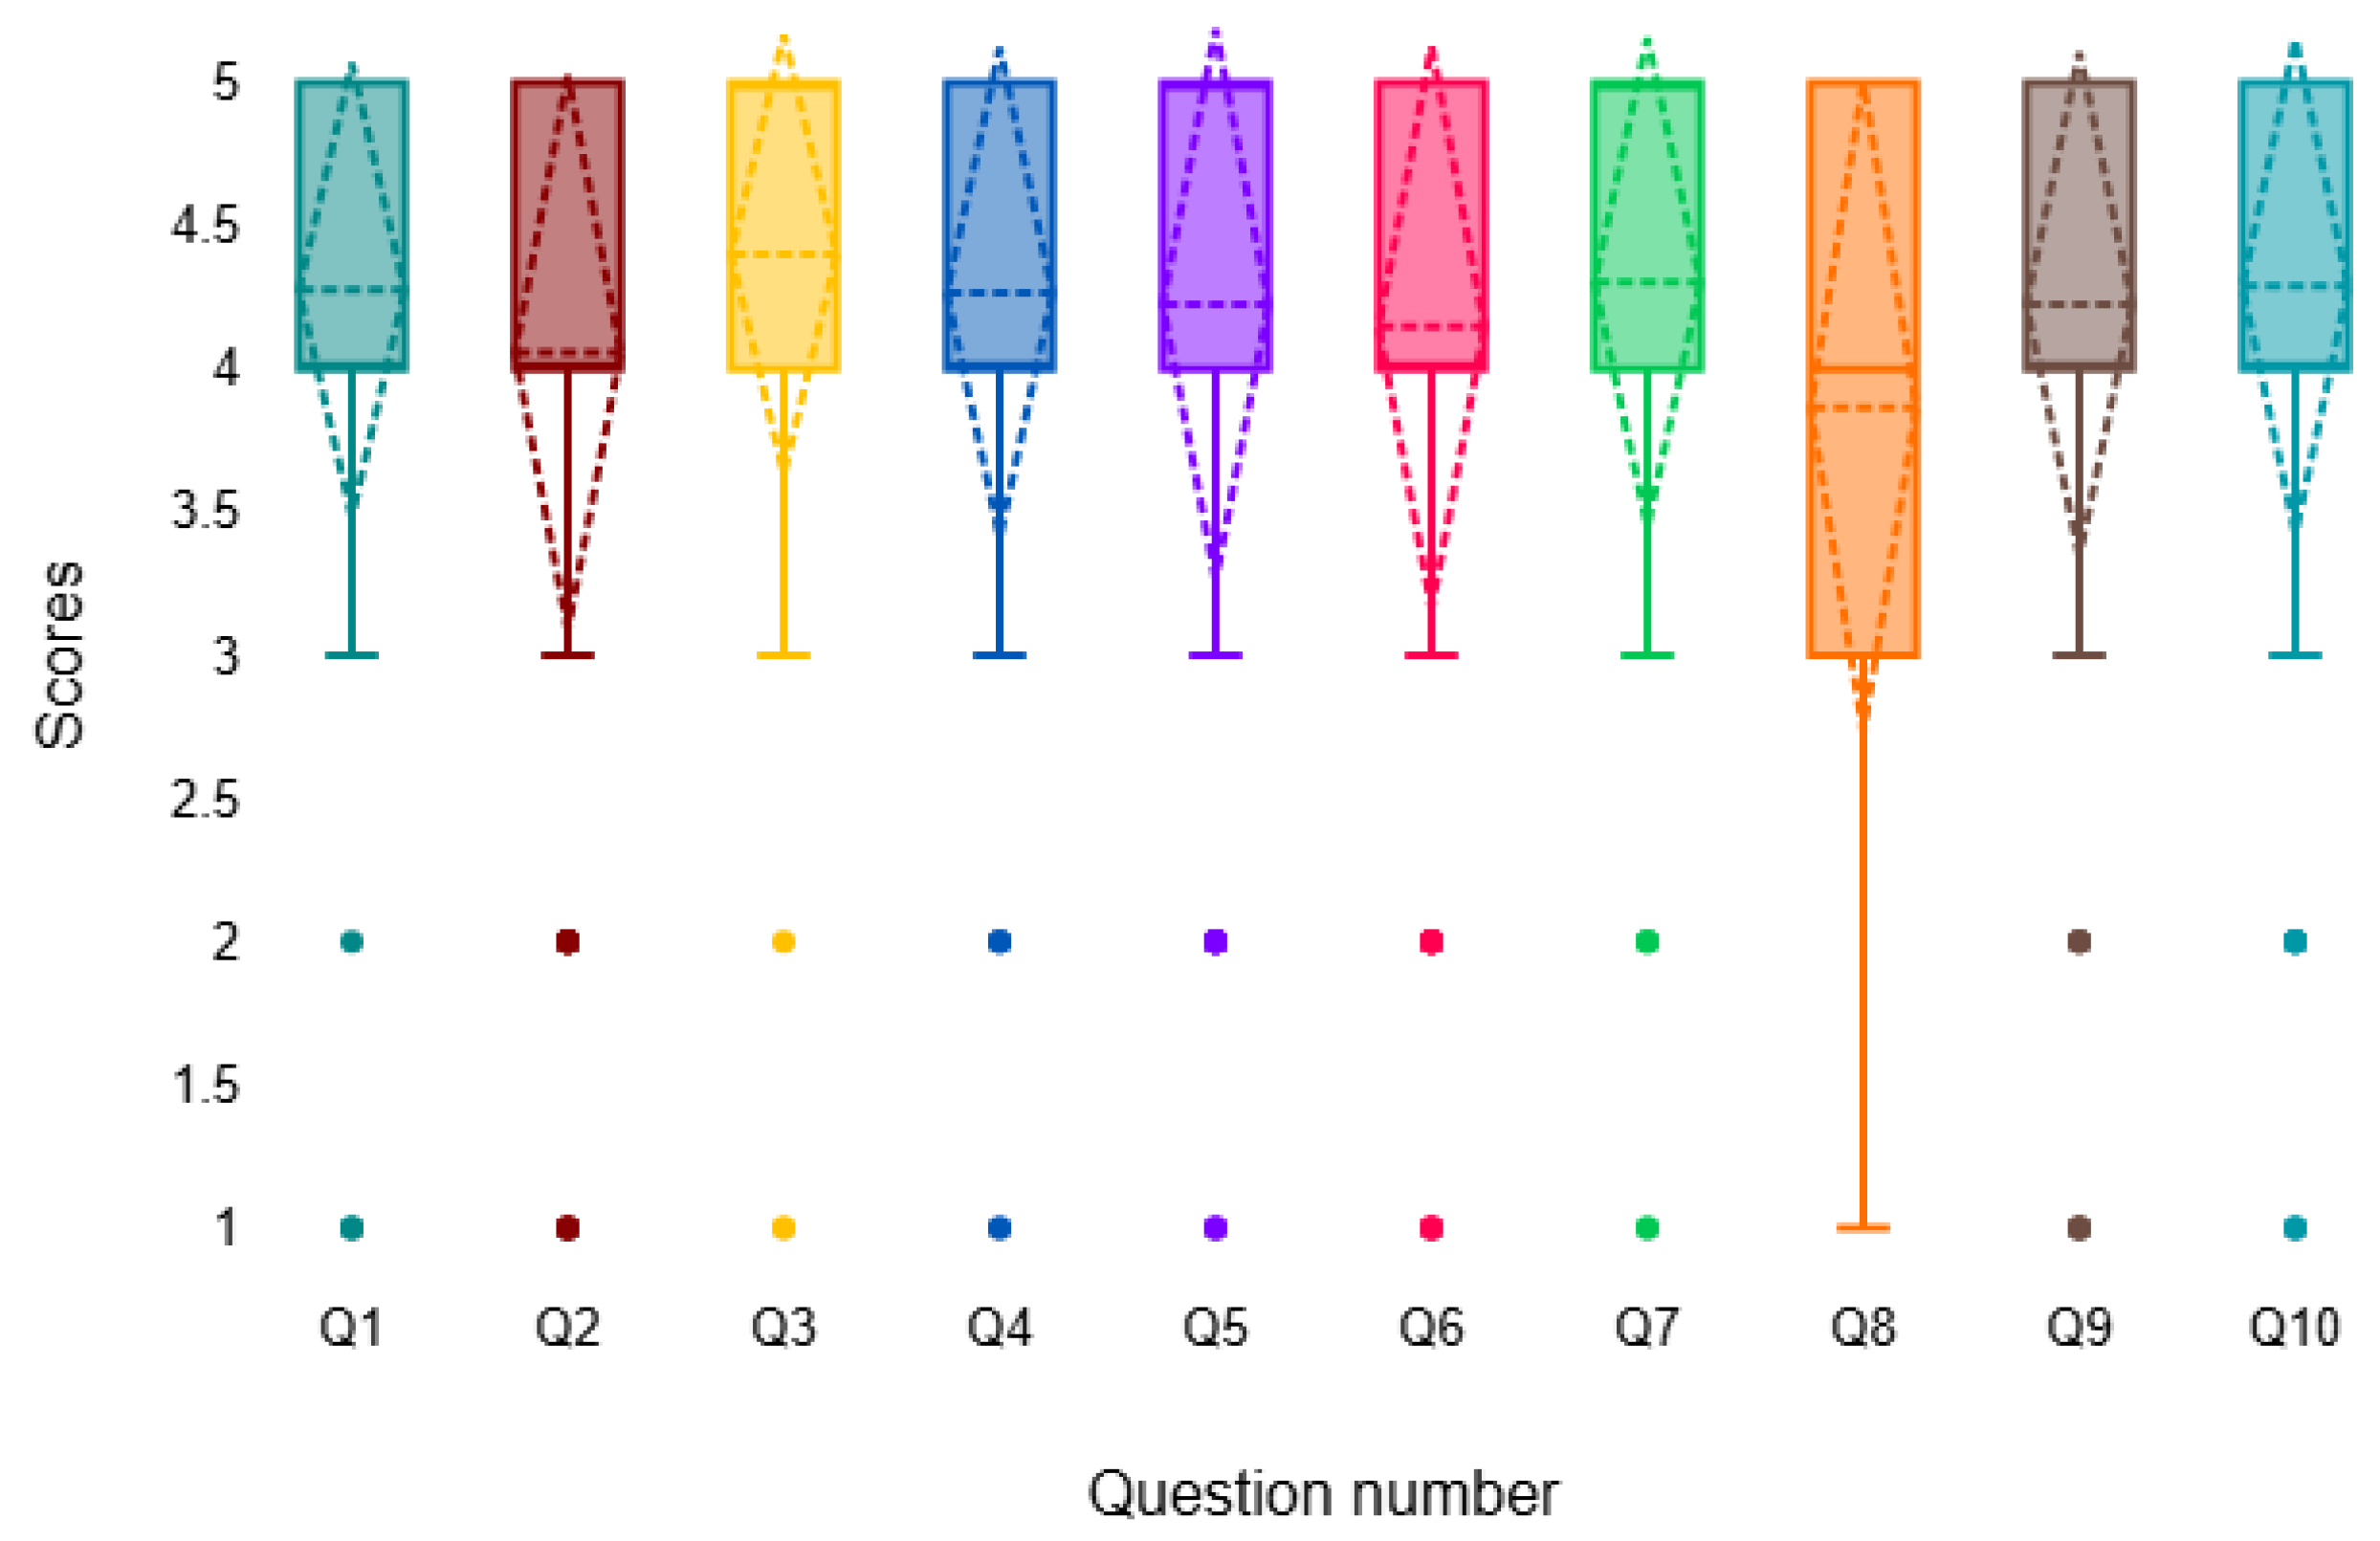
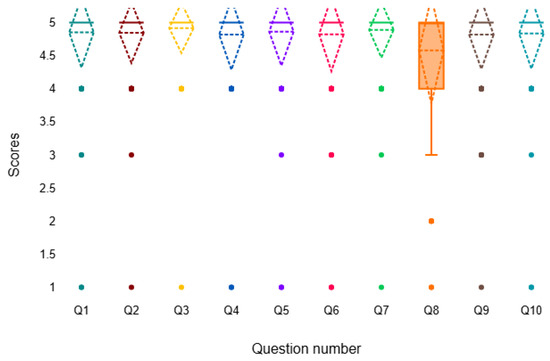
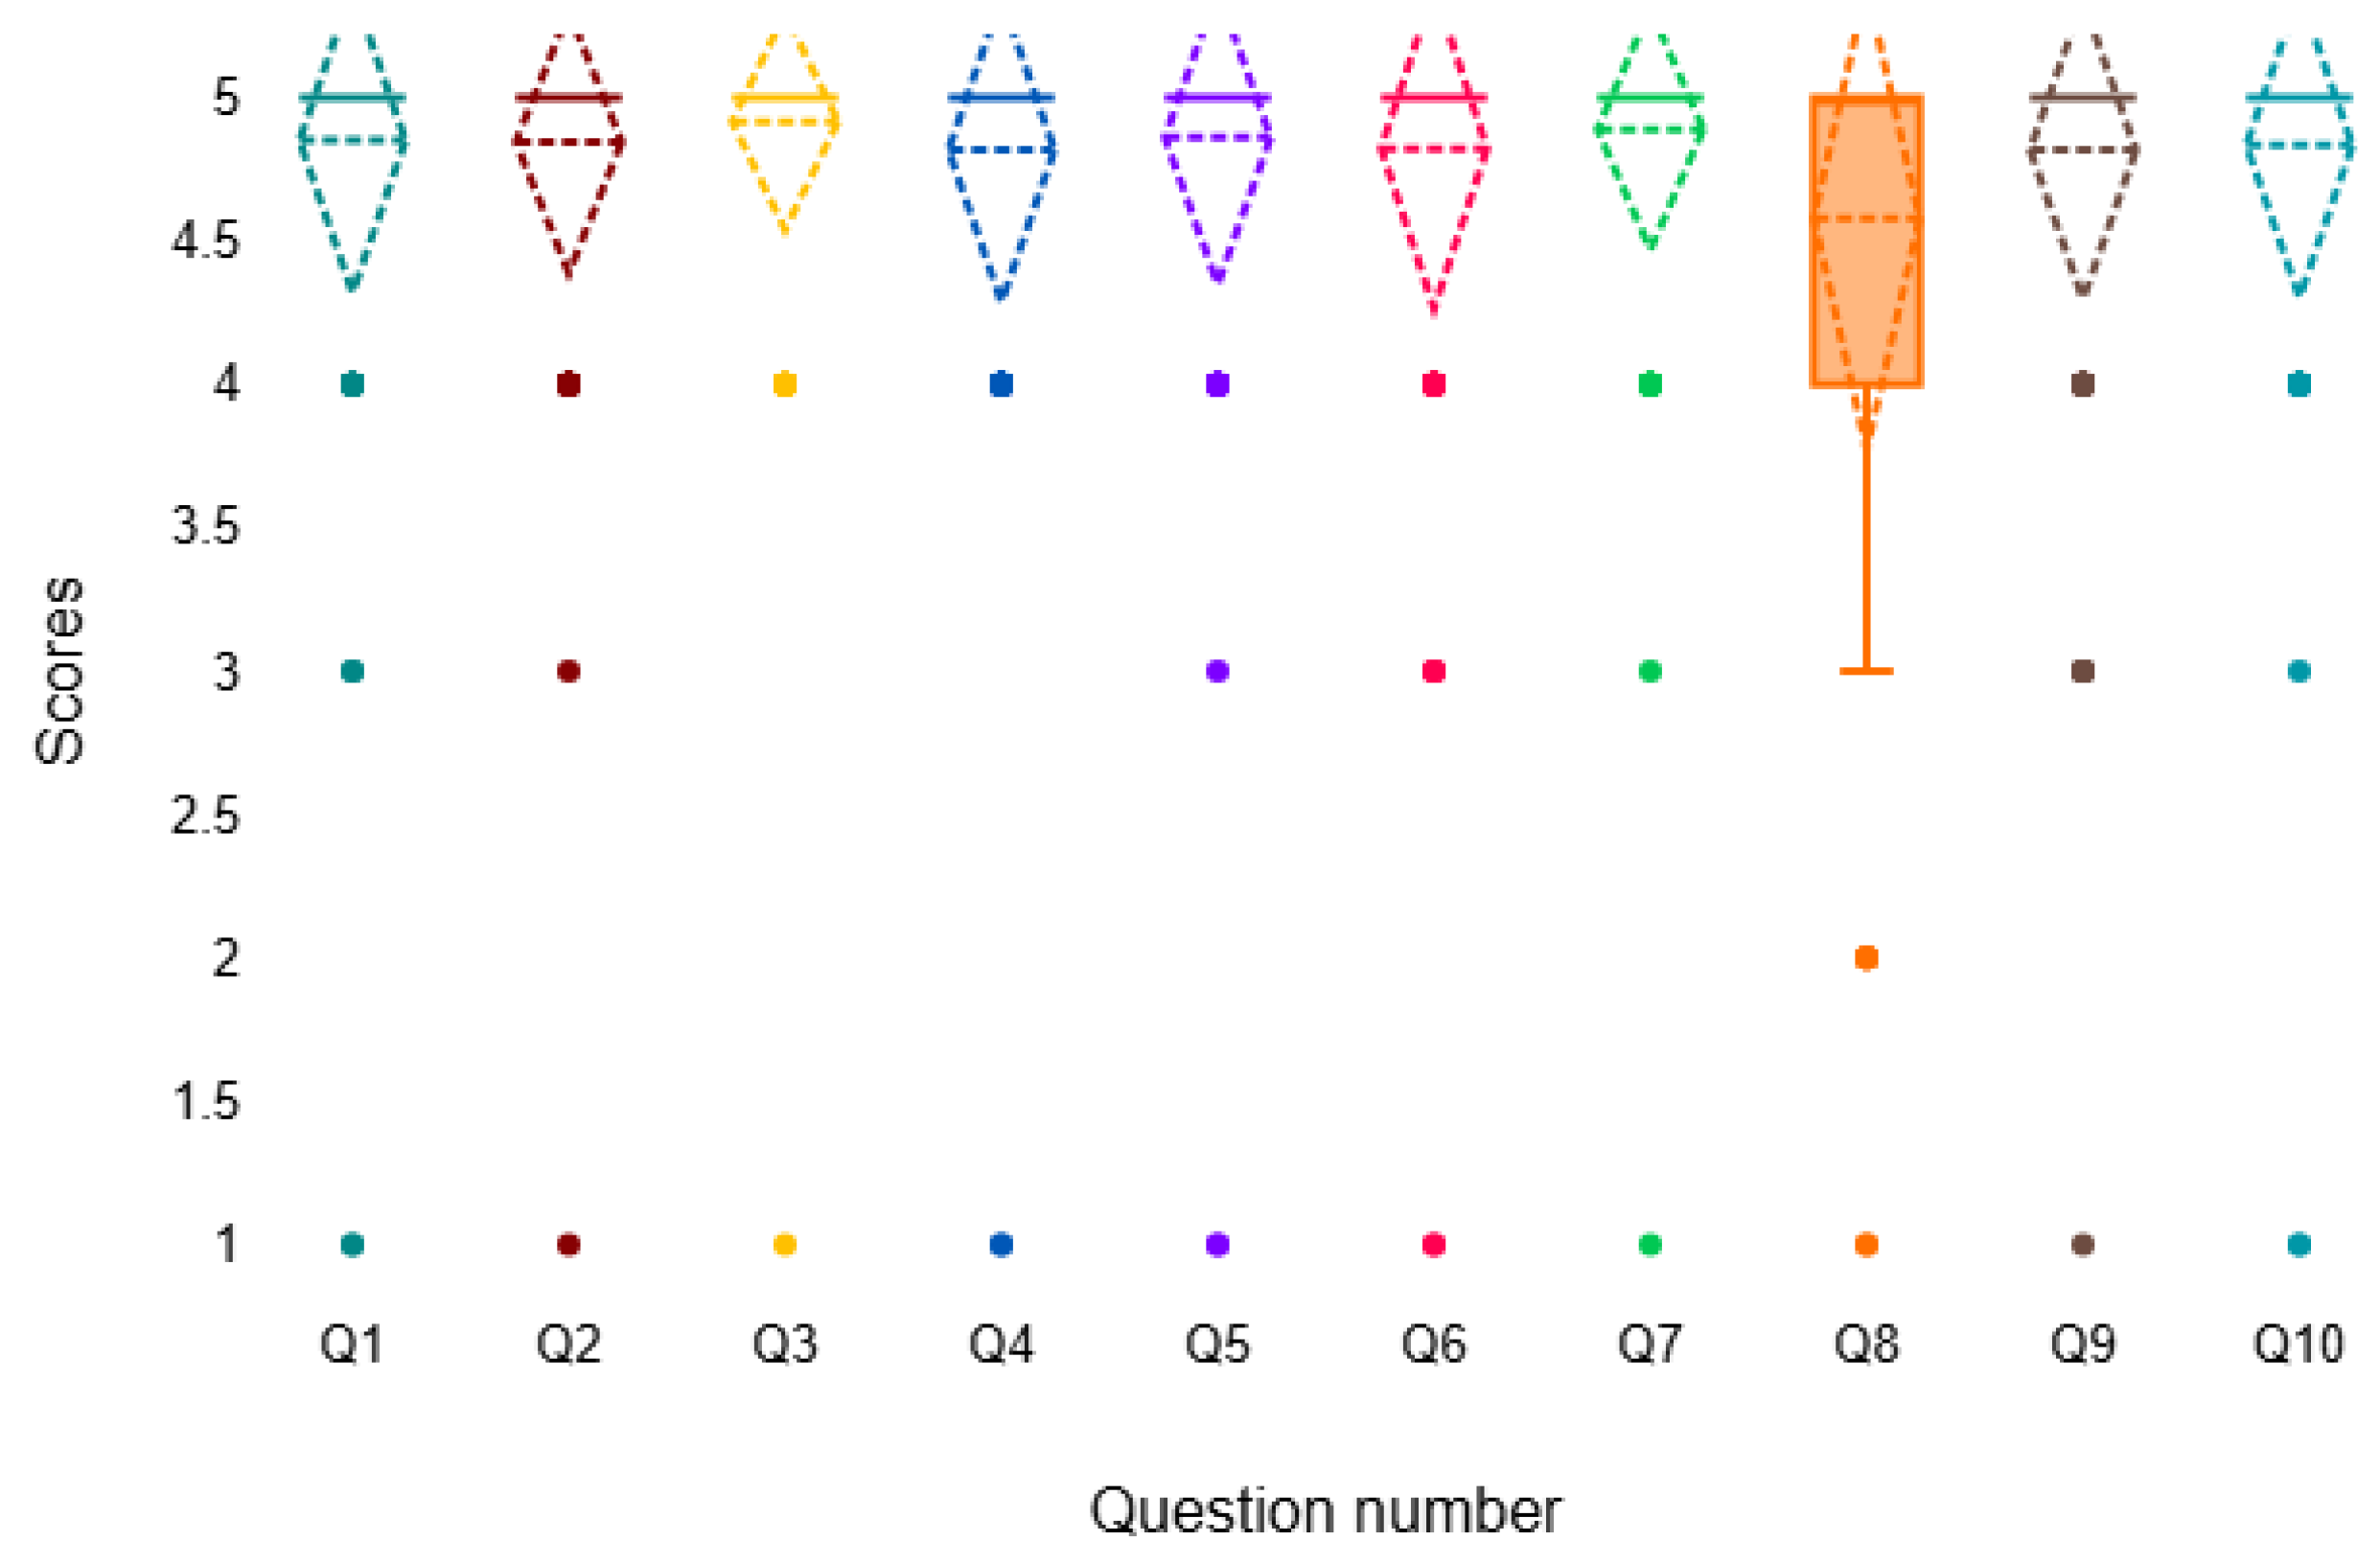
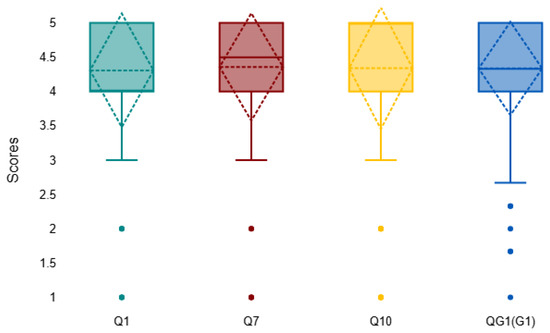
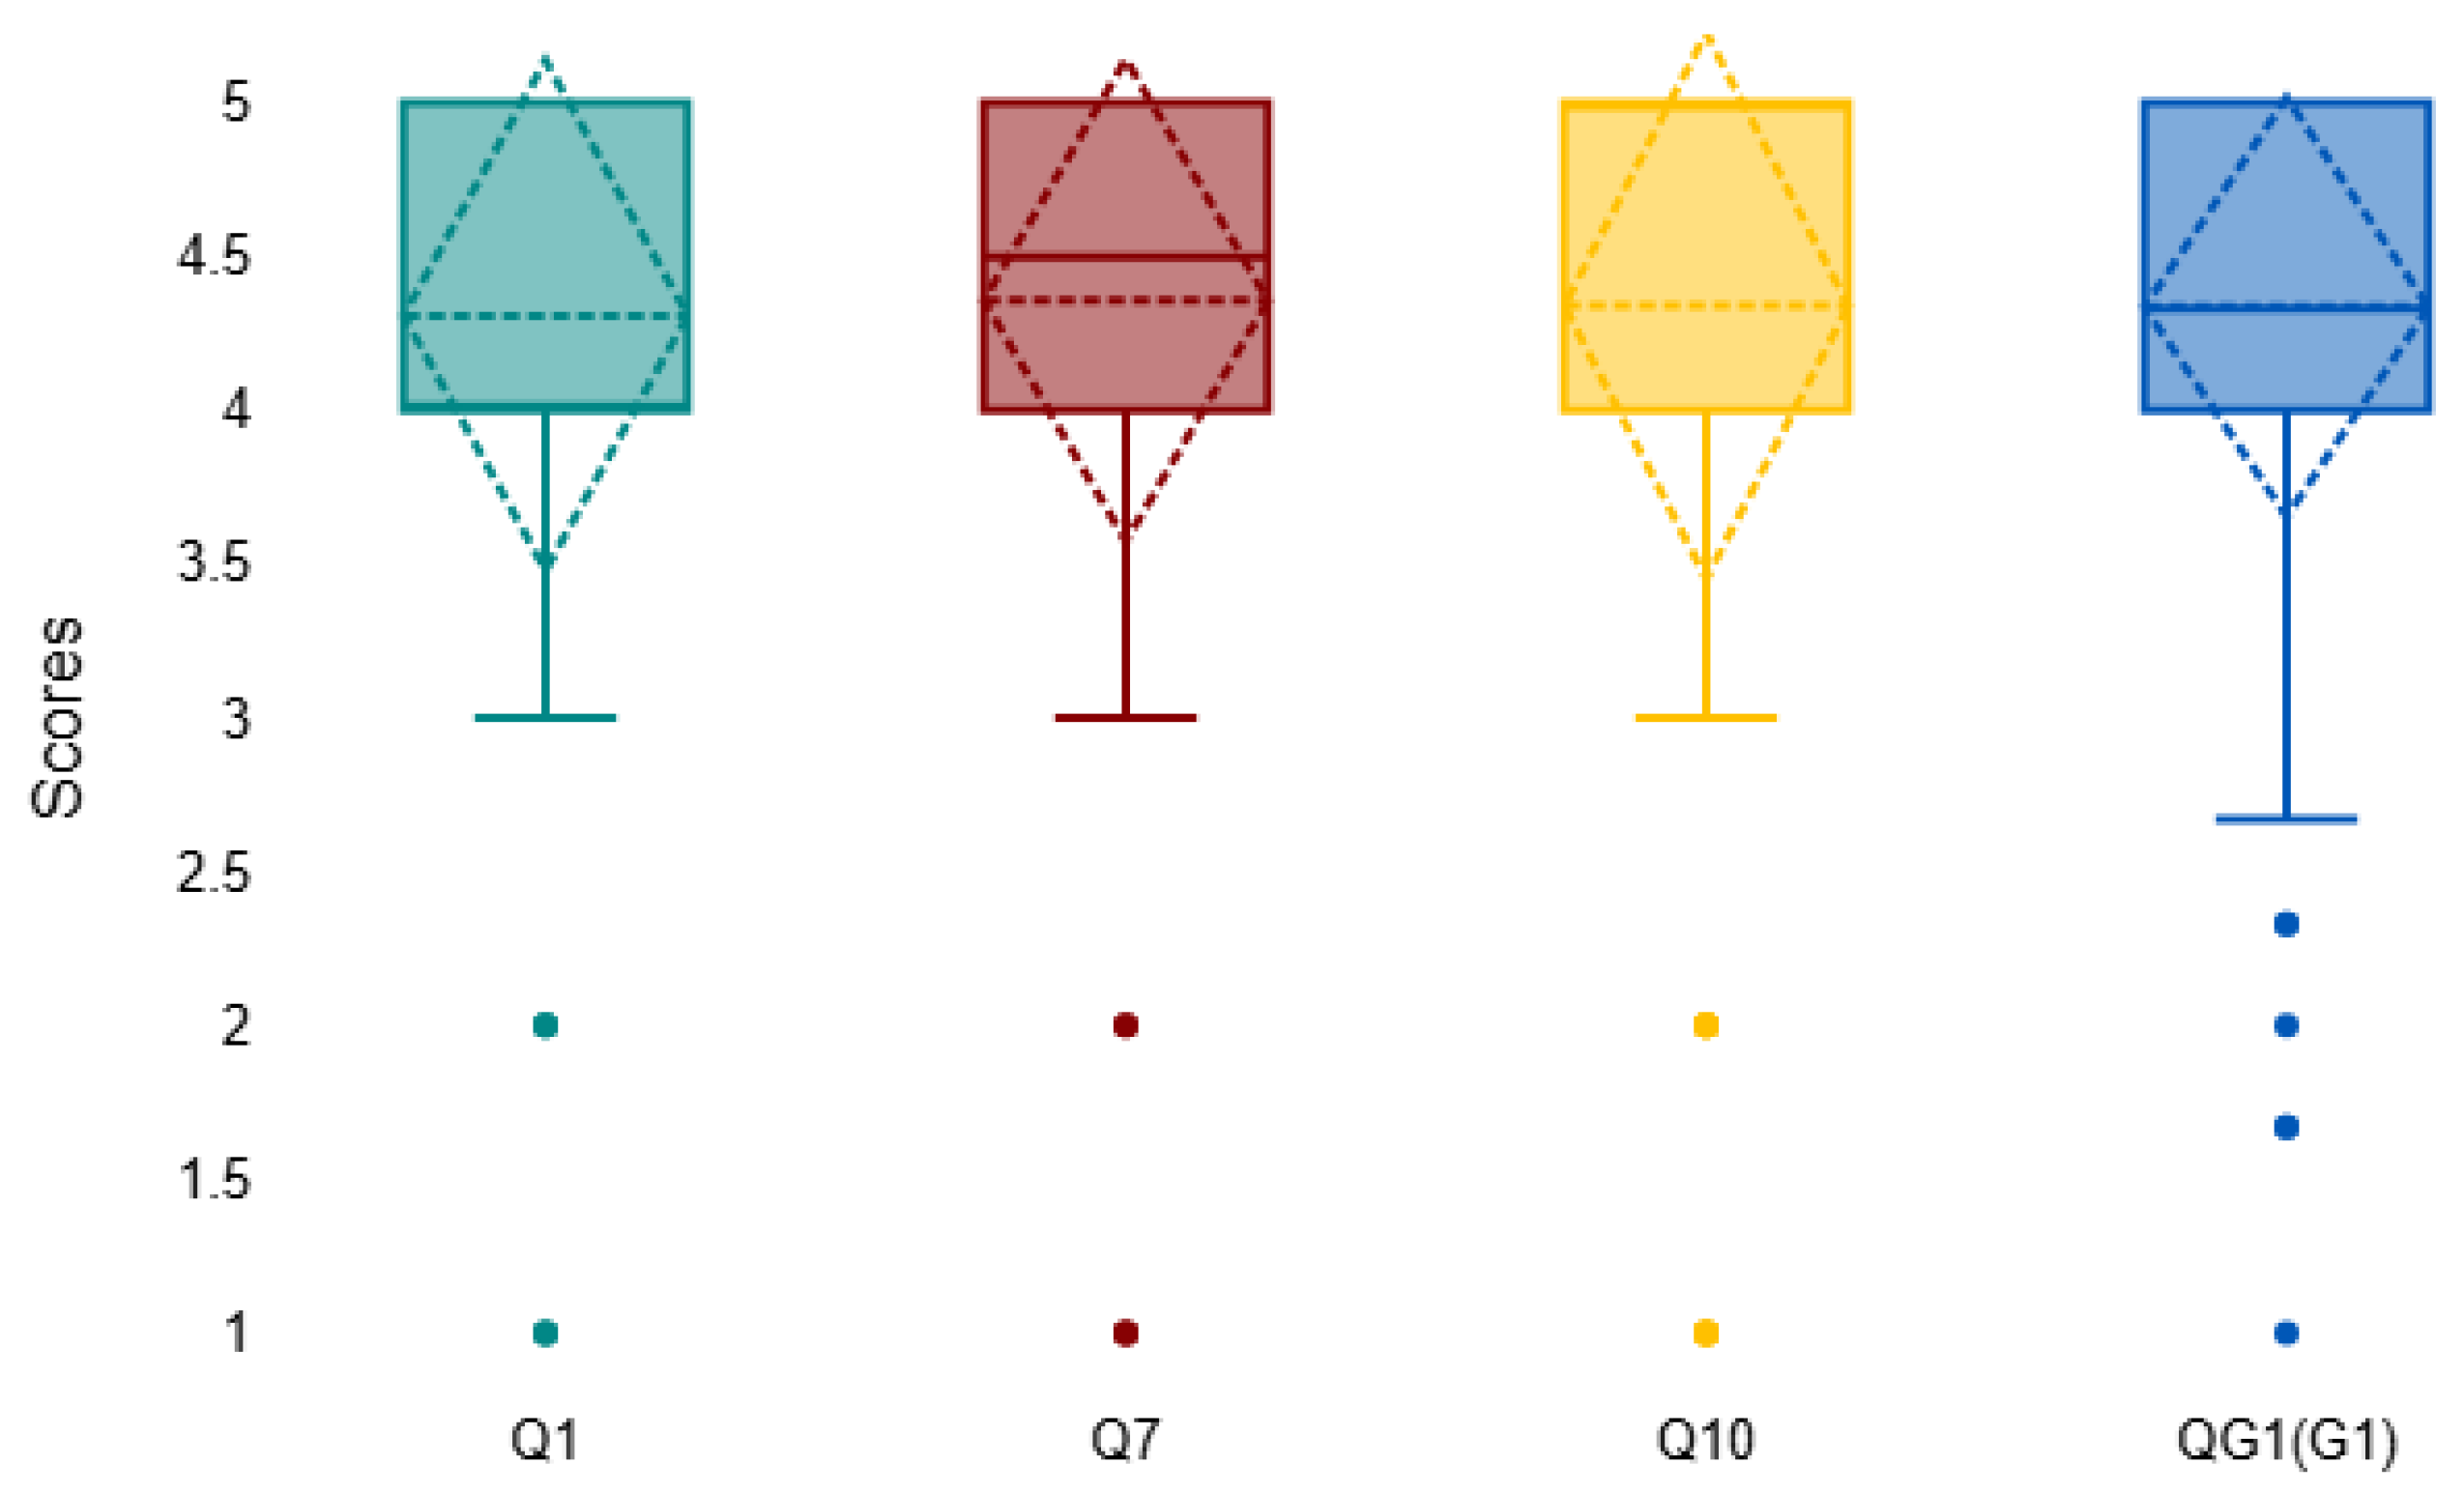

Disclaimer/Publisher’s Note: The statements, opinions and data contained in all publications are solely those of the individual author(s) and contributor(s) and not of MDPI and/or the editor(s). MDPI and/or the editor(s) disclaim responsibility for any injury to people or property resulting from any ideas, methods, instructions or products referred to in the content. |
© 2026 by the authors. Licensee MDPI, Basel, Switzerland. This article is an open access article distributed under the terms and conditions of the Creative Commons Attribution (CC BY) license.