Article

Students’ Perception of the Pedagogical Approach to Geography Teaching and Learning Through Google Earth Pro

by
Marioara Pascu
1,2,* and
Natacha Duroisin
1
1
Education and Learning Sciences Department, University of Mons, 7000 Mons, Belgium
2
Technical College “D.Ghika”, 605200 Comănești, Romania
*
Author to whom correspondence should be addressed.
Educ. Sci. 2026, 16(2), 268; https://doi.org/10.3390/educsci16020268
Submission received: 29 November 2025 / Revised: 29 January 2026 / Accepted: 3 February 2026 / Published: 8 February 2026

Abstract

This study aims to identify students’ perceptions of the teaching strategy employed by teachers during the Geography teaching–learning process, given that the experimental group used Google Earth Pro. The research sample consisted of 229 participants. The research methods were surveys and statistical analysis. The research hypotheses were based on the following premises: the use of Google Earth Pro software could influence students’ perceptions differently in terms of its impact on their personal learning experience and the teaching strategy applied in the classroom as a whole; there could be an association between how students perceived Google Earth Pro software and the benefits of this digital tool as a learning aid and as an integral part of the teaching strategy. The research hypotheses were statistically validated using the statistical test for comparing proportions and means and the chi-square test—Pearson’s correlation coefficient. The research results highlighted statistically significant differences between the experimental group (B) and the control group (A) in most components of the teaching–learning–assessment strategy (method, learning tools and teaching resources used, student organization) but also in terms of students’ interest and motivation for learning Geography, the content taught, the targeted skills, and the time allocated by students to preparing for Geography lessons. GEP brings numerous benefits to the teaching–learning process of Geography, having a positive impact on: understanding the content taught, applying what has been learned and transposing it into a new context, making connections with other disciplines, critical thinking, consolidating prior knowledge, and improving STEM knowledge.

1. Introduction

In this day and age, teaching Geography to the generation of students called generation Z is a major challenge for most education systems, including teachers. While younger learners tend to have greater exposure to digital technologies, existing research underscores that digital competence is influenced predominantly by access (Warschauer & Matuchniak, 2010; Rioseco-Pais et al., 2024), the quality of digital literacy education (H. Ma & Ismail, 2025), socioeconomic background (Symeonaki et al., 2025) and personal experience, rather than age alone (Althubyani, 2024). Therefore, this study views digital skills as multifaceted (Brittain, 2025), shaped by contextual factors rather than generation-based stereotypes. Although young people engage with digital technologies in diverse ways—thereby acquiring skills relevant to the development of their digital competence (DC) (European Commission, 2019)—research highlights that university students often do not reach high levels of digital proficiency and struggle to apply these skills effectively within academic contexts (Janschitz & Penker, 2022; Sánchez-Caballé et al., 2020).
Furthermore, several studies have identified a second-level digital divide concerning digital literacy, which explores disparities in how ICT is utilized (Rustad et al., 2024; Symeonaki et al., 2022, 2024; J. K. H. Ma & Cheng, 2022b; Ayllón et al., 2023). Additionally, a third-level digital divide has been recognised, emphasising differences in learning outcomes and the impact of ICT usage on educational and professional trajectories (J. K. H. Ma & Cheng, 2022a).
The literature uses many names to describe “generation Z”, ranging from “the children of the internet”, “the digital generation”, “digital natives”, “the media generation”, “postmillennial”, “iGen”, “generation Z” to “the .com generation” (Maloni et al., 2019; Berkup, 2014). If we were to describe the profile of “Generation Z”, we have to take into account that its members were born and grew up in the technological age; therefore, they tend to become technology addicts, they spend a lot of time on the internet, they play games, they socialise, and the progress of technology is perhaps the most important socio-cultural feature they have experienced (Magano et al., 2020).
It is believed that because of this, “Generation Z” is impatient, has a short attention span (Berkup, 2014) and is addicted to speed. The members of this generation are interactive, innovative, creative, result-oriented, multitasking, and individualistic (they dislike teamwork) (Magano et al., 2020). Some studies have shown that generation Z students prefer hands-on learning activities to immediately apply what they have learnt in real life (Seemiller & Grace, 2017); they learn faster using computer-based methods and using interactive multimedia content, software, videos, simulations etc. (Obradovic et al., 2017).
Given this profile of “generation Z”, it is important to apply the most appropriate digital teaching strategies in the classroom during the teaching–learning process.
A teaching strategy is defined as a set of resources and methods planned and designed by the teacher in order to enable students to achieve their goals (Cherghit, 1993). Didactic strategy is a way of organising learning and teaching, of combining and optimally organising the methods and means used, and the ways of organising the students during the lessons (Cherghit, 1993). This teaching strategy includes the learning task created by the teacher for the students and the learning context in which the student is engaged. The didactic strategy becomes a digital one in the conditions of using digital methods, means, tools, instruments, procedures, and teaching–learning–assessment techniques in the instructional–educational process.
A conclusive example of a digital tool as part of a modern Geography teaching strategy is Google Earth Pro.
Michael Goodchild commented that Google Earth represents the realisation of former Vice-President Al Gore’s vision of a “Digital Earth”, where Earth was seen as an organising metaphor for digital information (Butler, 2006). Google Earth Pro is a Google product that is capable of displaying an image of the Earth’s surface in two and three dimensions (Suharini et al., 2020). This programme is free and is an enhanced version of the Google Earth software. Google Earth is a 3D geobrowser that has been called “the democratization of GIS” and is part of a family of geobrowsers that allow data with a spatial component to be overlaid on a 3D model of the Earth (Henry, 2009). The GEP program is used by urban planners, geologists, architects, and specialists in public administration, thanks to the satellite images provided by Landsat 8 satellite/Copernicus, characterised by high quality and captured with a greater frequency (Perez, 2020). Koc and Topu (2022) show that students reported that GE created a “sense of reality,” which facilitated their learning. They emphasized that GE made it easier for them to mentally visualize the destinations and helped them retain the information more effectively. Jaeger (2024) conducts a review of the literature from 2012 to 2024 to identify quantitative research studies that have used virtual globes for educational purposes. Jaeger’s (2024) analysis assesses the impact of Google Earth on Earth science learning and highlights important methodological and practical differences between studies. The results of Jaeger’s analysis indicate that numerous studies have compared Google Earth interventions with traditional teaching methods and found benefits in favour of those who used GE. Google Earth had a positive impact on geospatial learning and understanding of geological, geographical or climatic processes. For example, the study by Xiang and Liu (2016) indicated that students in the Google Earth group identified more spatial and temporal changes and were better able to make predictions about how human activity on the island might be affected by a volcanic eruption than students in the traditional textbook lesson group. The results of the study by Hsu et al. (2018) showed that the GE class performed better on the final test, with students developing topographic mapping skills. Monet and Greene (2012) showed that the progress made by students in an introductory geology course was significantly greater in the GE class, with the application’s satellite images supporting the development of geological knowledge, concepts and processes. The results of research by Blank et al. (2016) showed that students who learned with Google Earth gained more knowledge about geological structures, fossil distribution and rocks than students who received traditional instruction. Research by Bodzin and Fu (2014) showed that Google Earth helped students improve their geospatial reasoning and knowledge of energy resources. Most studies report significant improvements between pre-test and post-test, and in many cases, students who used Google Earth achieved higher results than those taught using traditional methods, demonstrating better identification of spatial changes, geospatial reasoning, topographical understanding, and application of knowledge in new contexts. Overall, the literature suggests that Google Earth has the potential to significantly support geospatial learning, but its effects depend largely on how it is implemented and the quality of experimental comparisons.
Aim and research questions. The aim of this research is to identify our students’ perceptions of the teaching strategy in Geography lessons. The objectives: to identify our students’ perceptions of the pedagogical scenario based on the use of the digital tool Google Earth Pro applied during Geography lessons; to identify statistically significant differences in research variables between the experimental and control groups.
The research questions are:
  • What is our students’ perception of the teaching strategy used in Geography lessons during Module 2? Given that the two groups of students studied in relatively different environments (digital and non-digital), we want to find out if there are any differences in perception between the experimental and control groups.
  • Did Google Earth Pro influence students’ perception and satisfaction with the teaching strategy?
  • How is the Google Earth Pro software perceived by students in the experimental group? What are the benefits of Google Earth Pro software in the Geography teaching–learning process?

2. Materials and Methods

As part of this research, a collaborative working group was formed at the national level composed of Geography and ICT teachers who teach in educational institutions that differ in terms of geographical distribution. The six Geography and two ICT teachers carried out collaborative work that covered several months from September 2024 to May 2025. The aim of this collaboration was to teach the Geography content according to the curriculum using different teaching–learning strategies in terms of teaching medium/tool. Thus, an experimental group and a control group were constituted, each consisting of three Geography teachers and two teachers of ICT. The experimental group had a teaching–learning strategy of Geography based on the use of Google Earth Pro, with classes being held in the computer lab, while the control group used other teaching–learning tools available to teachers other than Google Earth Pro, with classes being organised in classrooms. Both groups of students studied the same contents, solved identical work tasks, worked in teams; only the tools used in the teaching–learning process were different. The content taught to ninth-grade students was Physical Geography and that taught in tenth grade was Human Geography. The piloting of Geography teaching using the digital tool was conducted for 5 consecutive hours throughout Module 2, from November to December 2024. During the 5 h of Geography teaching, students of both target groups worked in teams. At the end of the module, they were administered a questionnaire on their perceptions of the Geography teaching–learning strategy approached by the teacher. By strategy we mean methods, procedures, and means of organising the teaching activity, thus contributing to the construction of the learning experience (Mogonea, 2010).
Research methods: (1) survey and (2) statistical analysis.
The questionnaire was used to collect data from the students in order to know their perception of the teaching strategy applied in the classroom. Some questions were aimed at gathering information about the employed means of teaching, the way of organising students, and how they perceived their learning experience. The questionnaire administered to the experimental group included two additional questions which were aimed at finding out students’ perceptions of the benefits and usefulness of Google Earth Pro. The survey for the experimental group had a few extra questions, which focused on how students saw the benefits of Google Earth Pro in teaching and learning Geography and their thoughts on Google Earth Pro (in terms of its software and menu features). They were also asked if they would like to continue using Google Earth Pro in class after the COLABTEACH project ended. The control group had a dedicated question aimed at finding out whether digital resources were combined with traditional ones in their Geography lessons. Some of the questions were open-ended, others were multiple choice. The response options were Likert scaled and the open-ended ones were subsequently coded. Teaching and learning methods were evaluated in close connection with another component of the teaching strategy, namely the organization of learning, and students worked in teams.
Participants. A control group (A) consisting of 107 students and an experimental group (B) consisting of 122 students were selected for the study. The target comprises a total of 229 subjects with different socio-demographic characteristics. The socio-demographic structure of the study group is shown in Table 1.
Statistical analysis was performed using SPSS 28 software. The statistical analysis aimed to validate three research hypotheses. Hypothesis 1. The research hypothesis starts from the premise that the use of Google Earth Pro software in the teaching and learning of Geography could influence students’ perceptions differently in terms of its impact on their personal experience of learning Geography and on teaching strategies as a whole. To validate research hypothesis number 1, a statistical test comparing proportions and means was used. Hypothesis 2. The research hypothesis starts from the premise that the students’ level of study could influence their perception of the impact that Google Earth Pro had on their personal experience of learning Geography and its importance in the teaching–learning–assessment strategy of Geography as a whole. Hypothesis 3. The research hypothesis starts from the premise that there may be an association between how Google Earth Pro software was perceived and its benefits for the teaching strategy applied in classrooms.
The following were used in the statistical analysis of the data: statistical test for comparing proportions and averages, and the chi-square test—Pearson’s correlation coefficient.
  • Statistical test for comparing proportions and mean: (1) at the sampling level to highlight a series of differences between the experimental and control groups and (2) according to the following criterion: the level of study of the students/class. Comparative analysis of proportions is very useful because it measures the proportion of responses for each type of scale, thus highlighting the differences for each one. Although the tests for the comparative analysis of proportions and average values will highlight a number of differences at the sample level as a whole, a statistical analysis based on the criterion of study level/class could highlight a number of differences in students’ perceptions of their learning experience more clearly, as each study level has its own particularities related to the age of the students and their experience in high school.
  • The chi-square test, more precisely the Pearson correlation coefficient, was calculated to identify the level of association between two research variables, namely between the characteristics of the Google Earth Pro application and the other variables related to the teaching strategy. Given that we have an experimental group with two classes at different levels of study, we calculated the Pearson correlation coefficient for each level of study separately. The inferential analysis was supported at a significance level of at least 0.05. We computed a Pearson product-correlation for a bivariate association between constructs of interest for interpretation of the effect size (large effect r ≥ 0.50, medium effect 0.30 ≤ r < 0.50 and small effect; 0.10 ≤ r < 0.30) (Howell, 2012).

3. Results

The statistical test for comparing proportions and average values at sample level and at study level.
The test for comparing proportions shows that differences between the experimental group (B) and the control group (A) were recorded for the following research variables: motivation to learn, the importance of the teacher’s experience and seniority, the teaching–learning methods used by the teacher to convey knowledge, the difficulty of the subject, the organization of students in class, the ability to transfer what has been learned to a new context, the acquisition of digital skills that favour the development of an autonomous learning style, interaction with the teacher, analysis and interpretation of landforms, population distribution factors, the benefits of teamwork, the time students spend at home preparing for Geography, the digital resources used at school in Geography lessons and in other science subjects, and attendance at Geography lessons during Module 2. Statistically significant differences were identified in terms of motivation to learn Geography. Thus, the students in the experimental group (B) have a level of learning motivation based on the desire to “know/understand the environment and the world in which they live” much higher (53.3%) than their peers in the control group (40.2%). A similar situation can be observed in the research variable through which students argue their motivation for learning from the perspective of “personal development as a competent future adult” (40.4% compared to 29%). Another difference was found in the research variable “Geography is an important subject, especially for the Baccalaureate”, with students in group B recording a lower percentage (12.3%) than group A (19.6%).
It was found that students in the experimental group (B) considered the experience and seniority of the teacher (45.9%) to be very important, as it helped them study better, while their peers in group A (25.2%) considered it less important.
Group A rated this variable as “not very important” (12.1%), compared to group B (4.9%), which had a lower value. Group B rated “teaching methods” as “unimportant,” “not very important,” and “relatively important” in a higher proportion (5.7%, 17.2%, 28.7%) than group A (1.9%, 1.9%, 9.3%).
Differences were also recorded in the research variable regarding the “degree of difficulty of the subject,” which was perceived to a greater extent as “very important” by students in group B (32%) compared to their peers in group A (25.2%). The proportion of students who perceived the difficulty of the subject as “not very important” was also higher among students in group A (15%) compared to group B (7.4%).
Statistically significant differences were observed between groups with regard to the variable “digital tools.” Group B felt that digital tools helped them learn Geography “very little” in a proportion of 19.7%, “a lot”—21.3%, and “very much”—18.9%; compared to these, group A recorded 2.8% (very little), 28% (a lot) and 32.7% (very much). The variable “Method of organising students” as part of the teaching strategy also showed differences, with teamwork helping students in group B “relatively” to learn (42.6%) to a greater extent than group A, which recorded a lower percentage (20.6%). In contrast, the response variable “very little” was lower in group B (2.5%) compared to group A (15%).
Another research variable focused on skills development. Differences between the two groups emerged in three variables: “Transfer what you have learned to a new context,” “Acquire digital skills to help you develop an autonomous learning style,” and “Interact more often with teachers.” Group B considered that the teaching strategy helped them “to a large extent” to transfer what they had learned to a new context (38.5%) compared to group A (26.2%). Group B also responded to the same research variable with “moderately” in a smaller proportion (27.0%) than group A (37.4%).
Group B considered that the teaching strategy helped them “to a small extent” to “acquire digital skills that would help them develop an autonomous learning style,” recording a percentage (9.8%) lower than group A (18.7%). On the other hand, the teaching strategy did not help them “at all” to improve their “interaction with the teacher,” with significant differences between group B (6.6%) and group A (1.9%). The proportion of students who considered that the teaching strategy used by the teacher helped them “a little” to learn and understand the content related to volcanism is higher in group A (7.1%) than in group B (1.4%). Differences were identified between groups with regard to the content related to “Analysis and interpretation of landforms”. The percentage of students who answered “A little” was lower in group B (1.4%) than in group A (8.9%). Group B considered that the teaching strategy helped them “very much” in a higher proportion (26.8%) compared to group A (14.3%).
In the 10th grade, the only difference was in the variable “Population distribution factors,” where the percentage values for group B were lower (12.2%) than those for group A (25.5%).
Students were asked what they thought were the advantages of teamwork and were asked to name three advantages. The question was open-ended. Significant statistical differences were observed between the two groups, with group B recording higher percentages than group A for the following variables: cognitive advantages—39.3% compared to 26.2%, pleasant atmosphere in class—23.8% compared to 10.3%, learning through cooperation—14.8% compared to 7.5%, workload—6.6% compared to 0.0%, assessment—3.3% compared to 0.0%.
The allocation of time to preparing for Geography class is becoming a problem. Over the last month, the proportion of students who did not study at all using YouTube was higher in group B (55.7%) than in group A (42.1%). Group B students spent 2 h preparing individually using YouTube, with students in group B (13.9%) allocating less time than those in group A (26.2%). Group B (5.7%) allocated more time than group A (0.9%), while digital encyclopaedias were not used at all by either group (86.1% in group B and 75.7% in group A). The proportion of students who spent less than one hour per month on individual preparation at home using digital encyclopaedias with geographical content was lower in group B than in group A—1.6% compared to 6.5%. The same situation was observed for the Livresq and Adservio applications. One of the questions focused on students’ knowledge of digital resources used at school in Geography and other science classes, as well as their frequency of use. Differences between groups were recorded for Geography, as the percentage of students in group B who used digital encyclopaedias “once a week” was lower than in group A—14.8% compared to 24.3%. Digital encyclopaedia use was higher in group B (24.6%) compared to group A (15.0%). Also, the percentage of those who used digital encyclopaedias “several times a month” was lower in group B (16.4%) compared to group A (29.9%). Some organisations and media websites were used more often in Geography class, “2–3 times a week,” by students in Group A (16.8%), while Group B used them less (8.2%). In contrast, in other sciences, these websites were never used by those in group B (23.8%) in a higher proportion compared to group A (12.1%). Digital atlases and maps were used “2–3 times a week” less by group B (14.8%) and more by those in group A (24.3%). Group B recorded lower percentages (5.7%) than those in group A (12.1%) for the research variable “Kahoot/Wordwall/Setterra games” and the response “2–3 times a week.”
Class attendance is very important, with differences noted between the two groups: the proportion of students who attended Geography classes 50–100% of the time is lower in group B (18.9%) than in group A (32.7%), while 100% attendance was found to be higher in group B (69.7%) compared to group A (54.2%).
The statistical test comparing the average results of the two groups in the sample, the experimental group consisting of 122 students and the control group consisting of 107 students (Table 3), revealed seven statistically significant differences in favour of group B for the following research variables: the teacher’s experience and seniority, the degree of difficulty of the subject matter, the analysis and interpretation of landforms, Eduboom with Geography lessons, Livresque with Geography-related content, Adservio, and class attendance.
There were 15 statistically significant differences in favour of group A in the following research variables: digital encyclopaedias, websites of organisations, mass media, digital atlases and maps, games, online hybrid learning platforms, and YouTube—with use of all of these resources in Geography, but also in other sciences (YouTube, online platforms with video lessons and tests, digital atlases and maps, specialised websites, Adservio, etc.).
  • The statistical test comparing proportions according to educational level/class revealed numerous differences between groups, as shown in Table 4.
The total number of ninth-grade students was 128, divided as follows: 72 were in the experimental group and 56 in the control group. Thus, in the ninth grade, statistically significant differences were observed (Table 4) between the two groups, in favour of group B for the following variables: “I learn to know/understand the environment and the world we live in” (51.4% versus 32.1%); “I learn for my own personal and professional development/career development” (33.3% versus 19.6%); “I learn for my development as a person, as a competent future adult” (41.7% versus 26.8%); “The teacher’s experience and seniority is very important” (44.4% versus 32.1%); “The teacher’s pedagogical approach, their ability to capture the attention and interest of students” is “important” (43.1% versus 30.4%); “The teaching methods used by the teacher to convey the content” are “relatively (11.1% versus 1.8%) and “not very important” (30.6% versus 17.9%); “The degree of difficulty of the subject is important and very important” (36.1% versus 25.0%); “The way students are organised” is “important” (36.1% versus 23.2%); “Teamwork has cognitive benefits” (44.4% versus 21.4%); “In solving work tasks, they used an average of 2 h at home on Eduboom to prepare for Geography” (9.7% versus 3.6%).
There are also statistically significant differences in favour of group A for several research variables, such as: motivation to learn justified by the fact that Geography is “an important subject, including for the Baccalaureate” (30.4% versus 19.4%); “the teacher’s pedagogical skill and ability to capture the attention and interest of students” are “very important” (50.0% versus 34.7%); “the teaching methods used by the teacher to convey the content” are “very important” (42.9% versus 19.4), while they are “not very important” (16.1% versus 5.6%) and “relatively important” (32.1% versus 19.4%) for the variable “Degree of difficulty of the subject matter” and “Classroom organization.”
In the research parameter concerning the benefits of teamwork, group B obtained higher values than the control group in terms of cognitive advantages and task completion. Group A recorded significant differences in its favour only in terms of the benefits of teamwork experience. Not many differences were found regarding the time spent at home on individual preparation. Group B spent 2 h preparing for Geography with Eduboom, while those in group A spent an average of 2 h learning about Geography using YouTube, but did not use digital atlases at all.
The group of 10th grade students consisted of a total of 101 students, of whom 50 were in the experimental group and 51 in the control group. Statistical analysis showed that in the 10th grade, statistically significant differences were found in favour of group B for the variables: “The teacher’s experience and seniority are very important” (48% versus 17.6%); “The teaching methods used by the teacher to convey the content” are “not important at all” (12% versus 2%) and “not very important” (26% versus 2%); “The degree of difficulty of the subject matter” is “relatively important” (36% versus 23.5%); “The implementation of digital tools” is “not important at all” (26% versus 5.9%); “The way students are organised in class” is “relatively important” (48% versus 9.8%). We note that differences exist more for the response variable “not important” and “partially important.”
Group A has higher values than the experimental group, and differences were observed in the following variables: motivation to learn (“Geography is an important subject, including for the Baccalaureate” (7.8% versus 2.0%); “I study for my own personal and professional development/career development” (33.3% versus 20%); “My family puts pressure on me to study well” (19.6% versus 10%)) and the teacher (“Teacher’s experience and seniority”—“not very important” (15.7% vs. 2%); “The teacher’s pedagogical approach, their ability to capture the attention and interest of students” is “important” (41.2% vs. 28%); “The teaching methods used by the teacher to convey the content” are “very important” (51% versus 16%); “Implementation of digital tools” is “important” (29.4% versus 18%) and “very important” (33.3% versus 14%)). For the research variable concerning the benefits of teamwork, group B obtained higher values than the control group for a single variable, namely “pleasant atmosphere.” The control group did not obtain any values higher than the experimental group. Regarding the variables “digital resources” and “time allocated to preparing for Geography lessons at home,” we observe that group B allocated between 50 min and 3 h to YouTube with content related to Geography and 0 h to digital encyclopaedias with content related to Geography, Eduboom, and digital atlases. Group A, on the other hand, obtained higher values than the experimental group on Eduboom, Livresq, and digital atlases, allocating between 1 and 2 h to preparing for Geography lessons.
Since the statistical test comparing proportions and means indicated a series of statistically significant differences between the research variables belonging to the two groups (experimental and control) according to the criterion of educational level, research hypothesis number 2 was validated.
We started from the hypothesis that the way in which Google Earth Pro was perceived by students could influence the research variables that evaluated the teaching strategy during Module 2. Out of the 122 students who formed the experimental group, 72 were in the 9th grade and 50 were in the 10th grade. The Pearson coefficient was calculated for each year of study (9th and 10th grades) within the experimental group. Thus, in the 9th grade, out of a total of 72 students, 18 correlations were identified between the research variables (Table 5).
Most correlations were found between the variable “Google Earth Pro facilitates the learning of fundamental elements of physical and human Geography” and learning motivation (“I learn for grades/to get a scholarship”—r = 390; “Family pressure to learn”—r = −295; “Motivation and interest in Geography”), with the most important elements that helped them learn Geography being “The way students are organised in class”—r = 318; skills development, namely “ improving initial and specialised skills”—r = 255; “better understanding of the content taught”—r = 251; and also with learning outcomes “obtaining better results in assessments”—r = 288 or with the time variable “better time management during a lesson”—r = 272.
At the 10th grade level, many Pearson correlations (Table 6) were found between eight characteristics of Google Earth Pro software and research variables targeting learning motivation, elements of the teaching strategy skills, and content taught. Students perceived some technical features of the GEP software as positive (easy to use, difficult to use, attractive in design and interface, modern and innovative) but also some educational features too (it facilitates the learning of fundamental elements of Geography, compatibility with Geography, practical applicability in teaching Geography, creation of learning situations). In total, 28 statistically significant Pearson correlation coefficient values were recorded. For example, “GEP has a deeply practical and applied nature” is associated with: “I learn for pleasure, Geography lessons make me feel good”—r = 0.331; “develops critical thinking”—r = 0.279; “active involvement in lessons”—r = 0.312; “Faster time management during class”—r = 0.287. Research hypothesis no. 3 was statistically validated.

4. Discussion

  • What is the students’ perception of the teaching strategy in the process of teaching and learning Geography during Module 2?
The statistical analysis of the proportion highlighted a number of differences between the research variables in most aspects of the teaching–learning–assessment strategy (method, learning tools and teaching resources used, organization of students) but also with regard to students’ interest and motivation for learning Geography, the content taught, the targeted skills, and the time allocated by students to prepare for Geography.
The active participation of students in constructing their learning involves important challenges that must be addressed during teaching, with attitude factors such as motivation and interest being among the most important (Sánchez et al., 2024; Maehr & Archer, 1985; Huett, 2006). According to Renninger et al. (2018), students can be motivated toward their education without being interested in it, which means that interest and motivation are fundamentally autonomous attitudes that function separately. In this sense, Lavonen et al. (2021) argue that when students have a specific interest in a subject, it can be intrinsically motivating.
Learning motivation is an essential part of the learning process. Students’ results in Geography and the skills they develop are directly influenced by it. We note that the differences between group B (experimental) and group A were in favour of the former group for two research variables in which learning motivation is associated by students with “their personal development as skilled future adults” who need “to understand the environment and the world in which they live.” Thus, the students are aware of the role of Geography in their development as responsible and competent adults. It is the practical, everyday applicability of the content, skills, and competencies specific to Geography that influenced the students’ decision to choose this response variable. This was influenced by the students’ perception of the practical applicability of the content, skills, and competencies specific to Geography. The higher scores obtained by group B may also have been influenced by their use of Google Earth Pro. The fact that students in group B scored lower than group A on the variable justifying motivation to learn because “Geography is an important subject, including for the Baccalaureate” can be explained by the fact that some students learn Geography without being constrained by the Baccalaureate exam. Out of the 122 students in group B, only 76 of them have the opportunity to take the Geography test in the Baccalaureate exam, but this does not influence their motivation to study Geography. Motivation to learn has two dimensions: an intrinsic one that is specific to the student and an extrinsic one that is related to external factors. Among these external factors, the teaching strategy used in class, as well as the teacher’s experience and pedagogical skills, are not to be overlooked. Thus, students were also questioned about the teaching–learning–assessment process in Geography during Module 2, being asked to rate on a scale of 1 to 5 the most important aspects that helped them learn, understand, and apply the content of Geography. The difference between the two groups is approximately 20.2% in favour of students in group B, who considered that the teacher’s experience and seniority were “very important” and helped them learn better. One reason for this difference could be the use of Google Earth Pro in the teaching–learning process. This application was used as visual support in providing examples, supporting explanations, locating places on the map, and clarifying the physical and human geographical content taught. As a result, some concepts, phenomena, and processes no longer seemed abstract, and students were able to observe and analyse the Earth’s surface as a team. In group B, the teacher introduced a modern application and helped the students use it, taught them the menu, and helped them complete their tasks using Google Earth Pro. The fact that the teacher created a new learning environment was important for the students. We must acknowledge that this process required additional effort on the part of the teacher. The teachers were the ones who taught the students how to use the Google Earth Pro application menu. This application is a teaching method and a learning tool, thus having a dual function. Research also demonstrates a complex relationship between a number of factors, including teaching years (or pedagogical experience), which can influence the quality of teaching and the implementation of instructional strategies (Brandenburg et al., 2016).
Group A believes that the teacher’s experience is not important, perhaps because the teachers did not manage to introduce new elements into their teaching strategy, contrary to what happened in group B. Another element of the teaching strategy assessed by the survey/questionnaire method focused on the teaching methods to convey the content and build skills. Once again, there were differences between the two groups, but in favour of group A. The control group considered the teaching method to be “very important” in a higher proportion (46.7%) than the experimental group (18%). The students in group B obtained better results at the final test than those in group A. For this reason we can conclude that they have an already formed, autonomous learning style, they have formed the key competence “learning to learn” and in their Geography preparation they do not strictly relate only to the classroom teaching method. They are able to explore alternative methods that help them learn. On the other hand, the peers in the control group are heavily dependent on what the teacher is able to do in the classroom using the teaching aids available where appropriate. They can make do with the teaching methods used by the teacher. After the 5 h of experimenting with Google Earth Pro, the expert group focused more on Google Earth Pro as a learning tool and paid less attention to the teaching method used by the teacher. It was the mean that captured their attention and interest.
Differences were observed in the research topic “the difficulty of the subject material” in favour of group B, which considered it as “very important”. Therefore, the teaching strategy should be adapted to this variable in order to improve students’ skills, improve the results in the assessment, make the time students have to spend on Geography preparation more efficient, and to train students’ own learning styles that help them understand the more difficult subjects.
Group B was more aware of the support offered by the teaching strategy based on teaching with Google Earth Pro in overcoming these difficulties.
The tools used in the teaching–learning process are another key element of the teaching strategy. In the absence of suitable tools that capture students’ attention, motivate them and help them to understand the content taught, the level of skills formation will be under the expected level. In this context students had to assess the importance of digital tools.
Group B obtained values below Group A in the assessment of the importance of digital tools in Geography learning for the answer options “very little”, “a lot”, and “very much”, suggesting that the implementation of digital strategies and the use of applications such as Google Earth Pro is challenging for students. It requires time to get used to the application, including using it for a long period of time. Using the Google Earth Pro application for 5 consecutive hours may be an insufficient unit of time, especially for students with learning difficulties. These differences are not incidental; the students in the control group conducted their lessons in classrooms without access to computers, and the only digital tools the students had at their disposal were their phones with internet access. The only classroom facilities were a projector and the teacher’s laptop. Students often used their own internet phones at the teacher’s request for teaching purposes. In this case, the teaching–learning process is less student-centred; teachers in group A used a mix of teaching resources from worksheets, textbooks, wall maps, screen projections, etc., and had to explain the concepts using the available means. Students in the control group are familiar with this teaching strategy. In contrast, students in the experimental group had to put more effort into their Geography classes. They had to learn the Google Earth Pro menu and toolbar, use some functions, develop digital skills and learn Geography with the help of the software. In this case, the teaching–learning process was more student-centred because the student had to handle the digital software.
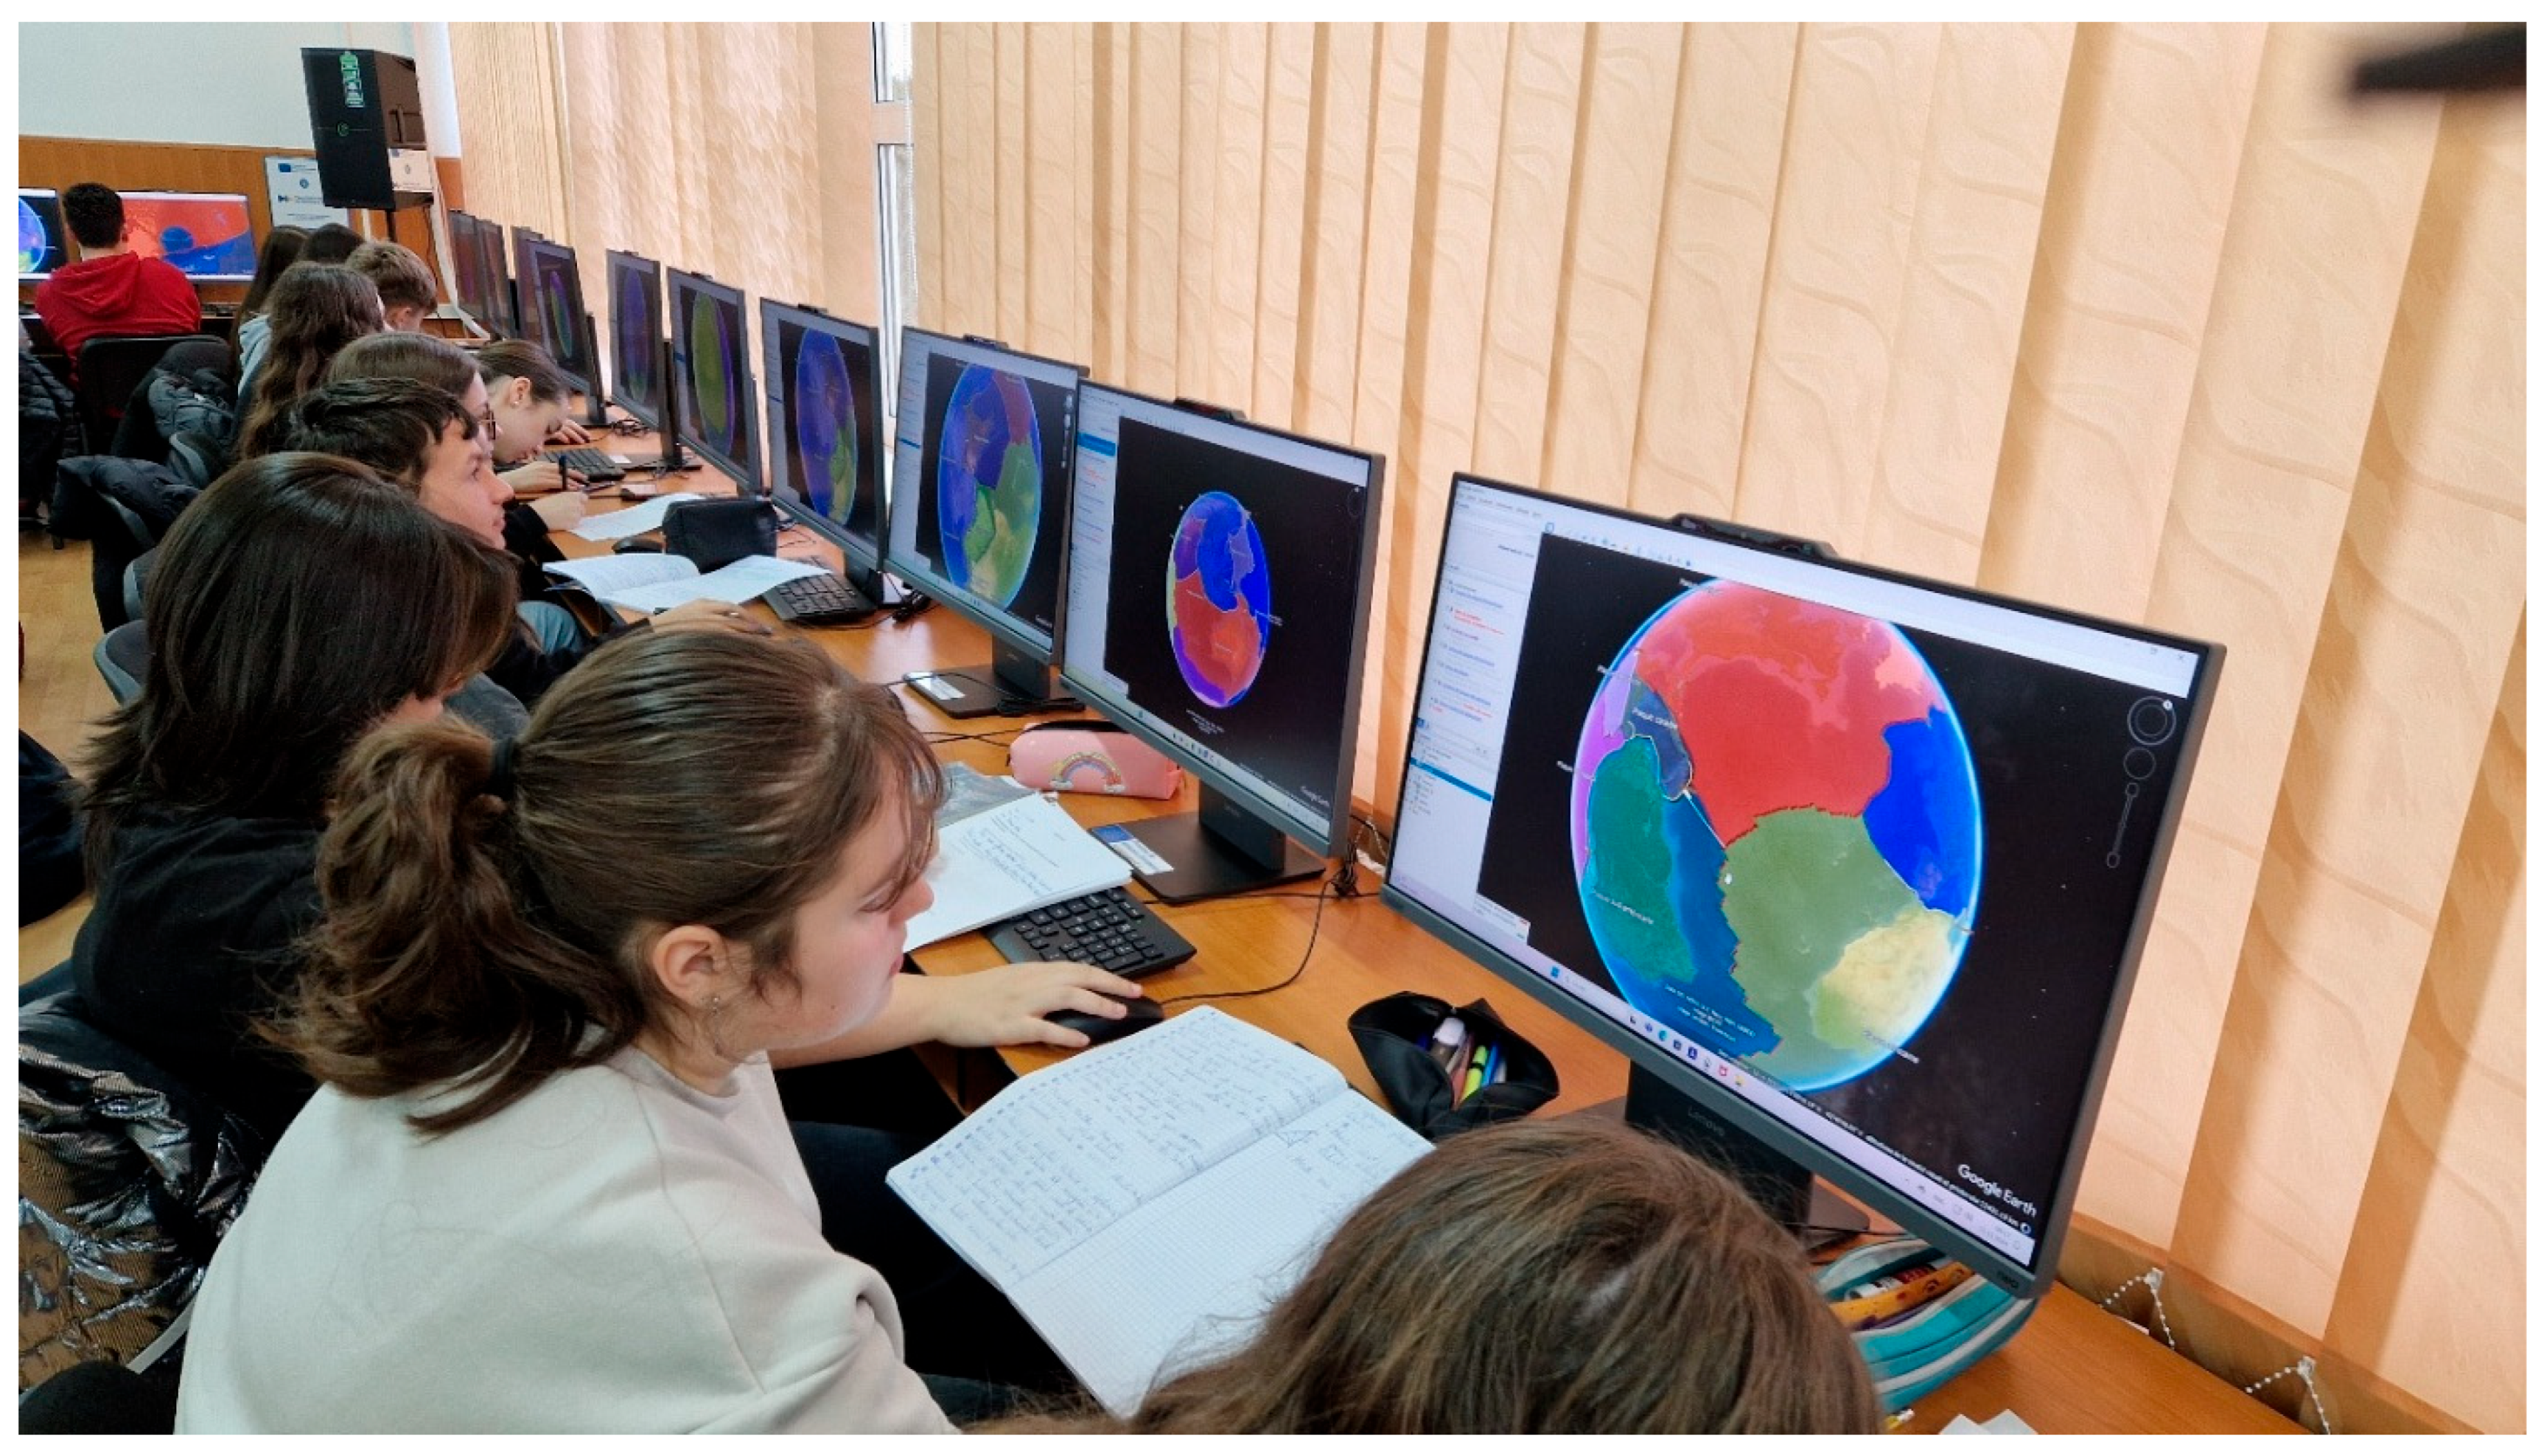
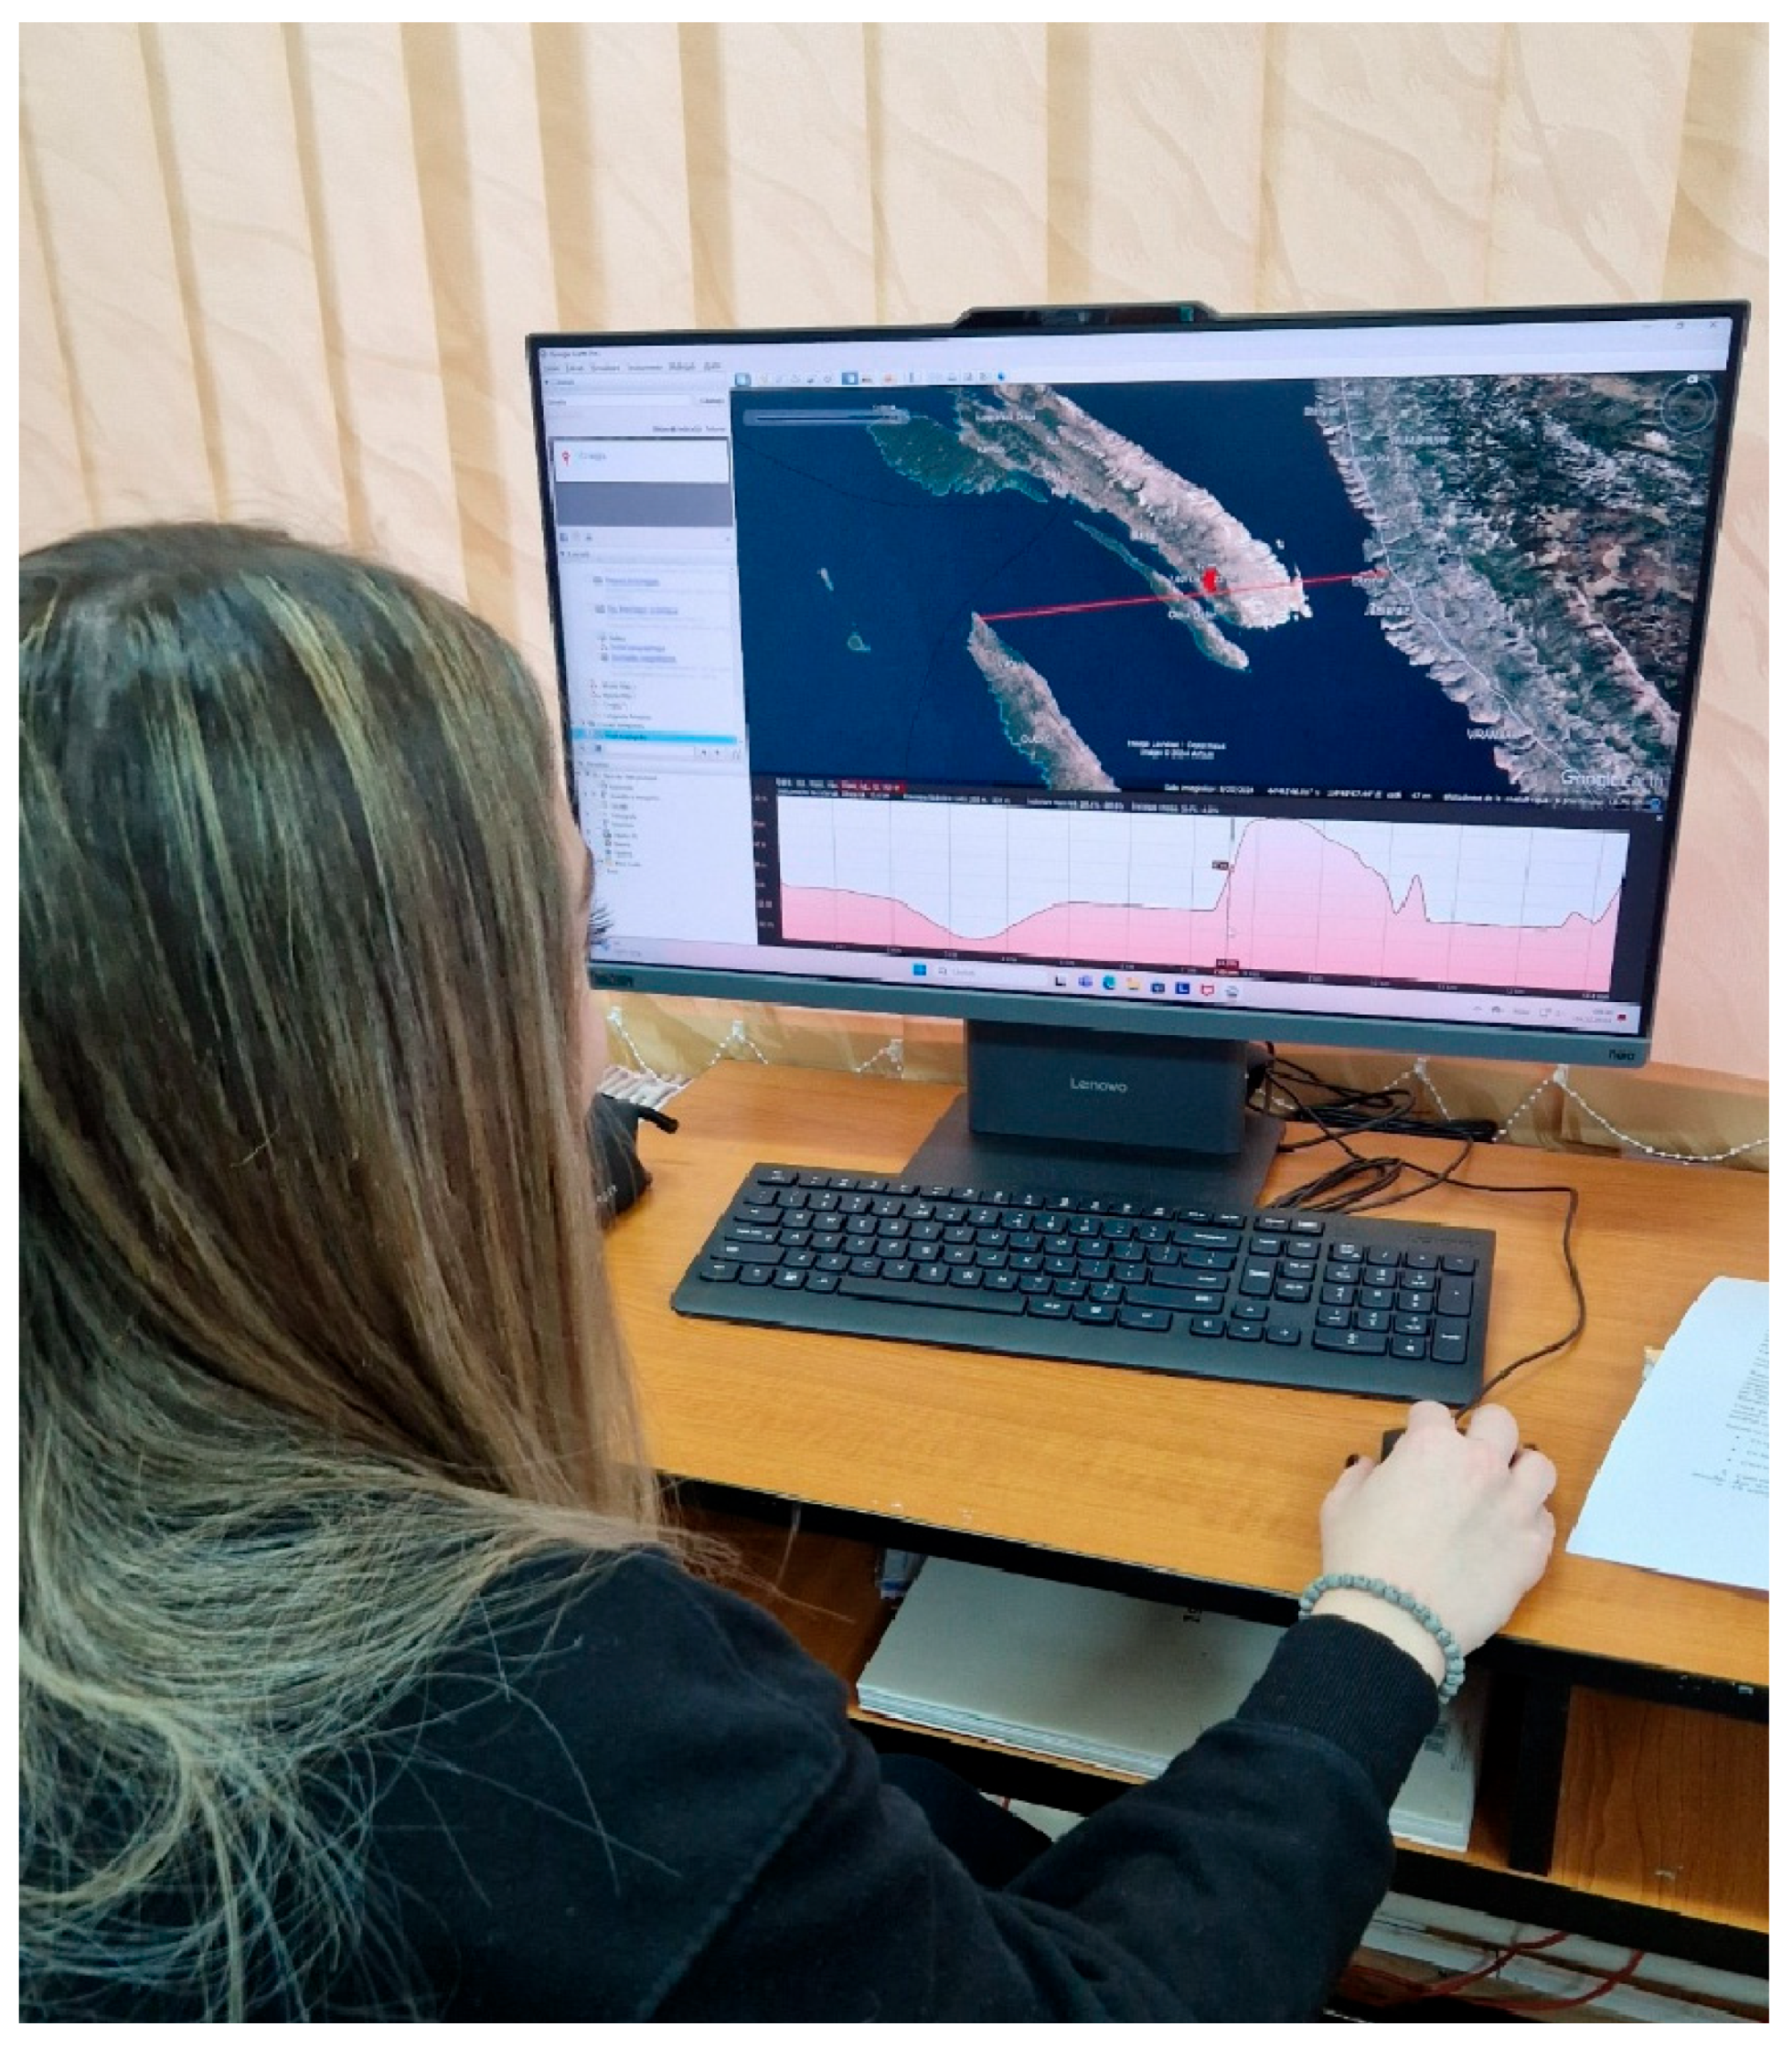
Teaching Geography with Google Earth Pro requires more time to get used to the students who were taken out of their comfort environment. They were required to do more than usual because they had to observe, analyse, and conduct a geographical investigation with a new digital tool (Figure 1). Some students were quite anxious when they were put in front of Google Earth Pro thematic layers and when they had to analyse historical images, interpret topographic profiles, etc. Students in group B were out of their learning style and had to adapt to a new digital tool. Most of the time, students resist change for fear of not achieving the same high marks in the assessment. González-Marcos et al. (2021) and Baeten et al. (2012) emphasize that the effectiveness of teaching strategies is enhanced by combining student-centred teaching strategies and methods, such as case-based learning and cooperative learning, with teacher-centred teaching strategies such as demonstrations, explanations, and worksheet completion. For this reason, GEP was used by both teachers and students throughout the experiment. Teachers in the experimental classes tried a mix of teacher-centred and student-centred teaching. If the content, concepts, correlations, and examples had not been sufficiently explained and demonstrated by the teacher with the help of the GEP software, the students would not have been able to complete the tasks themselves. Students need to learn to think with the help of GEP and use it to improve their skills specific to the content taught.
The implementation of digital strategies in the instructional–educational process requires a longer period of time before visible results are obtained. It also implies constant, systematic use and a division of time between the training of digital skills and the training of specialised skills. However, the success and effectiveness of using a tool such as Google Earth Pro also depends on the level of digital skills that pupils possess at the time. For this reason, the Geography teachers collaborated with the ICT teachers; the students in the experimental group practiced with the Google Earth Pro menu in the ICT lessons. The way the students were organised in teams was a form of encouraging cooperative learning, even though the percentage of those in group B who considered that teamwork helped them to learn, “relatively”, was much higher (42.6%) than in group A (20.6%). Teaching Geography with Google Earth Pro involved grouping students into teams so that they could help each other, learn from each other and not feel discomfort. For some students, Google Earth Pro could have created stress but working in teams gave them courage and confidence.
The use of learning media, whether digital or traditional, aims at building specialised skills in students. That is why we have used the questionnaire to measure the extent to which the didactic strategy has helped students to form a series of competences.
The purpose of the teaching–learning process is the formation of specialised competences and the formation of the profile of a high school graduate. As a result, there were only three differences between the two groups. We note that the time might be insufficient; the formation of competences requires considerably more time, especially as the digital tool is a new one and the target group students are in the 9th and 10th grades. Class IX a in the national education system is the first grade of high school, and the initial tests at the beginning of the year always indicate poor results in Geography because students in their last year of secondary school focused on the high school entrance exam. They did not pay much attention to Geography preparation. This could be one of the reasons why not much difference was found with regard to the impact of the teaching strategy in improving skills. Moreover, some students do not focus on the competences, they relate more to the assessment grade, not realising that it can measure the level of skill formation.
Although the variable of content taught was introduced in the research, no great differences were found. For example, in 9th grade, the statistical results were in favour of group B. The students considered that the GEP-based strategy helped them to analyse and interpret the landform. With the help of Google Earth Pro the students solved all the tasks. Tectonic plate thematic layers with tectonic plate-related phenomena such as earthquakes, volcanism, ridges, etc. were saved on the desktop of each computer. We notice that among these contents the students selected “Analysis and interpretation of landforms” because they worked collaboratively on a lot of applications and performed practical operations with GEP such as measuring some mountain ranges with the menu ruler by tracing a segment with the ruler and saving the topographic profile. Subsequently, they interpreted the elevation profile and measured the length and width of some volcanic craters, mountain lakes, and glaciers. Then, they used historical images to see how they evolved and changed over time; they did a ground-referenced flyover of a fjord, rias and deltaic/estuarine shorelines, and other different landforms. Also, they switched to Google Street and climbed Vesuvius or Fuji. Some river processes such as alluviation, transportation and deposition were explained and demonstrated to the students through the Volga Delta case study. They identified an island and traced its boundaries in the year 2023. With historical images, they observed and analysed the segment affected by the accumulation of alluvium. With the help of Google Earth Pro the students practically learned to observe the landforms and analyse them according to the requirements on the worksheets. Students in group A had to solve the same worksheets, but since some of the tasks were solved with the help of atlases, internet sources, YouTube, Wikipedia, and photos, they could not perform the operations of measuring the topographic profile. In practice, they could not have control over the research tools GEP offers through its menu. GEP lent itself very well to learning this content by discovery by allowing a global approach. The students were able to move quickly from one continent to another and had a macro-planetary scale perspective.
In 10th grade, the only difference between the two groups was in favour of group A (25.5%) and concerned content related to the answer variable “Factors of population distribution”, “Very much”. The students used Google Earth Pro and the only difference between the two groups was in favour of group A (25.5%) and concerned the content related to “Factors of population distribution” which observed the way the population is spread over the globe according to latitude and longitude, observed and analysed the natural conditions in different regions of the globe, studied the physical features of some settlements with the help of Google Earth Street and correlated it with the natural conditions, and explained the restrictive or favourable role of the natural environment for the settlements observed. Google Earth Pro has the advantage that the student can start a geographical investigation much faster than with any other tool because they can move quickly from one continent to another, from Canada to Australia, automatically read the geographical coordinates by zooming in, focus on a neighbourhood/city, mountain top, etc., and visualise what the region looks like by switching to Google Street. The information they want to analyse is in one place. Students in group A used online lesson platforms, images printed on paper, and maps, but some information was delivered to them already-processed and explained, as they are designed by the creators of the lesson teaching platforms (Eduboom). Some worksheets were solved by the students with the help of bibliographic sources on the net, but the teacher could not follow and check how they were working because the students were using their phones and some could have directly queried the CHP to solve their requirement.
During the 5 h of Geography the students worked in teams and were encouraged to learn in tandem, to learn cooperatively. The statistical analysis revealed only differences in favour of group B, who appreciated a number of advantages of teamwork in Geography classes which were coded into the following categories: cognitive advantages, pleasant atmosphere, cooperative learning, workload, and assessment. The fact that the students in group B obtained significantly higher percentage values than group A may be related to the use of Google Earth Pro because the students were put in front of a new digital tool and perceived it as a challenge; some students had digital skills whilst others did not, and some were more anxious at the beginning but gained courage thanks to their teammates.
Google Earth Pro practically united them during the 5 h and they thus declared advantages in the cognitive, socio-emotional, cooperation, workload and evaluation areas.
A few of the answers given by the students in group B on the advantages of teamwork are: “The work was easier, The answers were broader, The experience was much more beautiful”; “the 3 advantages are: 1. we combine information, 2. each one came with an idea to apply, 3. if someone didn’t know, the other did”; “We came with more ideas, reaching a better conclusion. I have interacted with colleagues with whom I don’t normally have the chance to do so. Peer solidarity. The fact that I was helped to understand what I didn’t understand”; “I learned to use Google Earth Pro, discovered geographical aspects and visualised beautiful countries”; “We find the solution faster, we orient ourselves easier, we have better chances of not making mistakes”; “brain-storming, cooperation, tolerance, exchange of ideas, etc.”.
Here are some of the answers given by the students in group A on the advantages of teamwork: “better relationship with colleagues, communication development, I am no longer shy in front of the class, thank you!”; “Cooperation, developing social skills, more effective learning”; “I made new friends, I understood the subject better by hearing other opinions, arguments and perspectives, the class becomes more interesting and fun”; “we pooled our knowledge to form a better answer, the activity was less stressful, we solved the requirements faster”; “I learned to socialise more, to share the tasks we had and to work as a team” “We learn to cooperate, We learn to understand each other better, We can learn new things from each other”. Dividing students into teams and working in teams is a form of cooperative learning between students. Bender encouraged teachers to replace lectures with differentiated lessons, to trust students to learn from each other whenever possible. Finally, Lucas et al. (2012) advocated for the use of experiential learning. We wanted to find out if the instructional process continues after the classes taught at school if students prepare for their lessons at home.
In order to achieve good Geography performance and results, the learning process should continue at home. We found that the students did not allocate enough time to prepare at home. Group B scored lower than A on a number of digital resources such as YouTube, Edooboom, and Adservio, but this is absolutely understandable for them. Group B students experiencing Google Earth Pro were no longer interested in combining digital resources. This tool was sufficient for them because it required extra time to get used to it and these resources such as YouTube or Edooboom were no longer a challenge but a novelty, and they neglected them. Similarly, learning a new program such as Google Earth Pro required more of them as they were used to using 2D not 3D representations, looking for ready written answers on the internet, and retrieving already-processed information or the thematic layers imported into Google Earth Pro. The toolbar of the application is the exact opposite of what they were used to.
The survey revealed a general tendency for students to stop preparing for Geography at home, with evidence that the high percentage of those who did not use any of the digital resources on the list provided and the percentage of those who did not use any of the others is increasing. Therefore, the differences between the two groups concerning resources such as YouTube and digital encyclopaedias with Geography content in their individual preparation carried out at home being allocated less than one hour per month was lower in group B compared to group A—1.6% compared to 6.5%. The same situation was observed for the Livresq and Adservio apps.
Although digital atlases should be compulsory for students to use when preparing for Geography, it was found that the proportion of students who allocated 0 h for one month was higher in group B compared to group A—86.1% compared to 75.7%. It is not group B but group A that attracts our attention in a negative sense. In group B, this is justified because they used Google Earth Pro and it has the structure and configuration of a digital atlas, the thematic layers are 3D versions of 2D thematic maps, the primary database is a real atlas, and the layers in kmz, shape, and json format are compatible with the G.I.S. atlas version. That is why it is critical that students in group A do not learn and use the atlas. Whether printed or digital, it is a minus point for them.
One of the questions asked was about the digital resources used at school in Geography and other science classes and how often they were used. Differences between groups were recorded in “Geography,” with the proportion of students in group B who used digital encyclopaedias “once a week” being lower (14.8%) than in group A (24.3%). However, this difference is not to the detriment of group B, as by teaching Geography with Google Earth Pro we wanted to detach students from digital encyclopaedias that provide instant information and do not challenge them to observe, compare, and analyse geographical processes and phenomena spatially and visually (as Google Earth Pro does). The same trend was observed for the variable “Digital atlases and maps” used 2–3 times a week, in favour of group B (14.8%) compared to group A (24.3%). We insist that this difference is not a negative aspect for group B, because Google Earth Pro offers the possibility to import a large number of thematic maps that are, in fact, 2D digital maps converted into 3D GIS, and in the future it will be possible to align Google Earth Pro tools with QGis and perhaps ArcGis Pro, so that layers with specific properties can be opened by all of these applications.
The use of digital resources in schools remains a challenge, as the Ministry of Education does not pay for school subscriptions to certain platforms/applications, and teachers adapt their teaching strategies to free ones, which often do not have varied content adapted to school curricula. There are also so many platforms and applications that teachers sometimes do not know which one to choose. When they do choose a digital resource, they do so without knowing its technical and educational advantages or disadvantages, which they discover along the way.
The fact that group B recorded lower values (5.7%) than group A (12.1%) for the research variable “Kahoot/Wordwall/Setterra games” and the response variable “2–3 times a week” was to be expected, as the time allocated to Geography in the school curriculum is not very long. Students studying Mathematics and Computer Science, Natural Sciences, Public Nutrition, and Tourism have one hour of Geography per week, while those studying Philology and Social and Human Sciences have two hours. In this context, teachers must choose digital resources so that they can teach the content and solve as many applications as possible with their students, using a teaching tool. Teachers who taught in group B did not have enough time to combine digital resources, as they focused strictly on Google Earth Pro.
The research variable “attendance at Geography classes” is also very important, as the school curriculum is quite heavy, and with only one hour per week, we do not have time to consolidate certain concepts that have not been sufficiently understood, and if students miss many classes, they will find it difficult or impossible to catch up. Attendance becomes even more important when students have to learn a new digital tool such as Google Earth Pro, because the instructions and applications carried out in class are essential, while students in group A, who used the textbook, paper maps, YouTube, and digital encyclopaedias as teaching tools, can more easily catch up on the material taught at home, at their own pace. Group B had 100% attendance, compared to group A, which had 54.2% attendance. Students often miss classes, citing reasons such as boredom, lack of new material presented by teachers, etc. The difference between the groups in favour of group B could be interpreted as follows: the introduction of Google Earth Pro in Geography teaching improved attendance by 15.5% compared to Group A; students prone to truancy found the lessons more attractive; the teacher teaches them practical things, such as how to conduct geographical research and learn skills that can be useful in everyday life. In middle school, students in grades 9 and 10 are more willing to collaborate with the teacher, are more engaged if lessons are interactive, and digital methods bring an element of novelty and creativity to the educational process. The comparative analysis test of mean values showed that although there were more significant differences (14) in favour of group A, these relate to the research variable concerning teaching methods, the implementation of digital tools, four skills and the resources used in Geography and other sciences. It was normal for group A to record higher averages because, in the absence of equipment, teachers try to use more teaching resources and as much variety as possible to motivate students to learn. Group A was made up of students from different counties, so it was to be expected that there would be differences, especially since we noticed that each geographical region had become accustomed to certain resources during the pandemic. These resources are generally promoted in the professional communities of teachers in the respective county and used more often. Even though the students in group A had to learn Geography using a mix of resources, even if these were more classical/traditional, they achieved higher averages than group B in variables related to “ improvement of initial and specialised skills,” “understanding of the content taught,” “application of what was learned,” and “making connections with other sciences.”
The statistical test comparing proportions according to the criterion of level of study/class revealed numerous differences between groups. In the ninth grade, group B consisted of 72 students and group A of 56 students. Statistically significant differences showed that, unlike group A, group B was much more motivated to learn Geography, with students’ motivation falling into the categories of personal and career development, as well as cognitive motivation.
Also, unlike group A, group B rated positively as “important” and “very important” teacher characteristics such as “experience, ability to capture students’ attention and interest,” “level of difficulty of the subject matter,” and “how students are organised.”
  • Did the use of Google Earth Pro influence students’ perception and satisfaction with the teaching strategy?
Although several GIS and geospatial visualisation platforms exist (ArcGIS Online or QGIS), Google Earth Pro (GEP) was selected due to its user-friendly interface, free availability and extensive database of thematic layers importable from diverse sources, all of which align with the pedagogical objectives of this study. Within lower secondary education, simpler GIS tools can be introduced and GEP stands out as an optimal choice.
The selection of GEP also accounted for the fact that many students were already familiar with Google tools (such as Google Street View and Google Maps). Thus, integrating it into Geography teaching and learning allowed for the exploration of new functions that facilitate geographic investigation. Unlike other tools, such as the ArcGIS Online platform, students did not require user accounts. The software was installed locally on each computer. The archive of thematic layers used in the teaching–learning process corresponded scientifically and pedagogically with the contents, learning activities and educational competencies mandated by the national curriculum.
We chose Google Earth Pro software because several studies have shown that it creates a learning environment through discovery, facilitates experiential learning, and ensures that learning is not a passive process; students become active agents, capable of building their own knowledge (Alé & Arancibia, 2025). It is also considered a software that can improve Geography teaching and learning processes to provide learners with the appropriate skills relevant to the needs and demands of the twenty-first century (Abdulmajid et al., 2017; Saavedra & Opfer, 2012).
Several features offered by Google Earth Pro were used at the 9th grade level, both from the Layers section and by importing and opening thematic files in kmz and shape file formats in locations to help students understand the composition of the Earth’s crust from tectonic plates (macro and micro plates) and the phenomena associated with plate tectonics, such as subduction, volcanism, earthquakes, ocean ridge formation, fold mountains, and coastal relief (Figure 2).
Students received printed worksheets with exercises that required opening and importing these thematic layers, which formed the digital support for geographical analysis and investigation. Students searched for answers to the questions in the worksheets using the thematic layers, with their help exploring the topic of plate tectonics and related phenomena. Once familiar with the 3D form of the Earth’s surface and maintaining the North–South orientation, the following lessons gradually moved on to exploring the toolbar. Topics related to landforms were analysed using the functions in the toolbar. The Add Path function allowed students to draw transverse lines along mountain ranges, enabling them to visualise and analyse the profile of the elevation. Using the Ruler and Polygon functions, they measured mountain ranges, volcanic craters, river mouths, etc. Another particularly useful tool for analysing the Earth’s surface was “Show historical images”. This feature allows for the temporal analysis of physical and geographical elements of the Earth’s crust. We applied this temporal analysis to observe the evolution of the natural environment over time. The students were divided into teams and measured the surface areas of glaciers in the Himalayas, Pyrenees, and Alps over the last year and compared them with those from the 1980s. This temporal comparison was also very useful for content related to coastal relief. We basically combined several features offered by Google Earth Pro to help students analyse and better understand the concepts taught. This made Geography classes practical and applicable, as each student had access to a computer. Furthermore, students were encouraged to continue their geographical investigation at home using Google Earth Pro. The teacher sent all students an archive with the thematic files they had used in class. Google Earth Pro thus had the great advantage of importing thematic layers in the form of kmz and shape file files for tectonic plates, phenomena such as volcanism and earthquakes, thus introducing students to GIS functions.
Some maps and layers downloaded from QGIS or ArcGIS can now be imported into Google Earth Pro. In this context, the teaching of physical Geography by Geography teachers becomes much more innovative thanks to these compatibilities with GIS.
At the 10th grade level, Google Earth Pro was used for teaching Human Geography lessons such as geographical distribution of population and population concentration. We took advantage of this opportunity to import thematic files such as: climate types, water networks, population density, all at a global level. Importing these thematic files into locations complemented the classic layer functionalities. When teaching the factors that influence population distribution, Google Earth Pro requires thematic layers to support explanations, arguments, and correlations between natural factors and population. The primary database of Google Earth Pro only includes a topographic map of the Earth, with administrative elements (borders and names), topographic elements (terrain, landforms), human settlements (localities, buildings), communication routes (roads), and photos, weather, etc. This primary database is not sufficient for teaching the above-mentioned content, which is why this inconvenience has been remedied by importing thematic layers. These thematic layers were taken from the eduterre website. On the other hand, the role of natural factors (relief, climate, hydrographic network, vegetation) in the geographical distribution of the population can be taught using Google Earth Pro, as can population density. Like the 9th grade students, the 10th grade students used the toolbar in the menu (ruler, path, topographic profile, overview, historical images). They also received worksheets which they completed by searching for answers using Google Earth Pro.
At the 9th grade level, statistical results demonstrate the existence of Pearson correlation associations between GEP characteristics and teaching strategy. For example, the association with “Classroom organization” is not random; students were grouped into teams precisely to help each other learn the GEP toolbar more quickly, so that those with advanced digital skills could help their classmates. Students were more relaxed working together and completed their tasks more rapidly. The purpose of using GEP in Geography teaching was to develop students’ specialised skills and improve their understanding of the content covered, as evidenced by the Pearson correlation coefficient values.
The Pearson correlation coefficient values were statistically significant, showing an association with all the content taught in the 9th grade. For the accessibility of the menu, the feature “GEP is easy to use” recorded Pearson coefficient values with learning motivation/”grade/scholarship” (r = 0.254), “degree of difficulty of the subject” (r = 0.309) and “better results in assessment” (r = 0.292). The students’ focus on results, grades, and scholarships is encouraging, as these are criteria for university admission. Some of the more difficult content can be better understood with the help of GEP thanks to its viewing and zoom functions and historical images, which help students find the answers they need more easily. Perhaps the greatest advantage of GEP is that students do not passively attend lessons; they are required to search for answers using this application and thus learn more effectively. The characteristic “GEP has a deeply practical and applied nature” was associated with the content “Major relief features” (r = 0.297). For this content, students solved exercises involving location and identification of major landforms, and the search function made the students’ work easier, enabling them all to complete the task. Unlike paper maps, digital maps, and atlases, where students cannot interact directly with the map and some details are missing, location using GEP is easier; students look for clues, details are more visible, they can investigate independently, and they have the opportunity to correct themselves immediately and restart the search from the beginning. GEP is particularly useful for students who do not have sufficient prior knowledge or are below the minimum level. The “Search” function helps them catch up quickly and even gain confidence that they can solve the tasks themselves.
The characteristic “GEP is a modern and innovative tool” is associated with “Geography is an important subject, including in the Baccalaureate” (r = 0.267). The explanation could be that students relate to the Baccalaureate exam because it is a preliminary stage to university studies, a culmination of compulsory secondary education that facilitates their transition to the labour market, and these modern, innovative digital tools could help them further. Although the students are in the 9th grade and still have three and a half years before the Baccalaureate, they are already thinking seriously about this final exam. There was an association between “GEP creates a stimulating learning environment” and “improving initial and specialised skills.” The more students believe that digital tools help them, the more motivated they will be to use them in the learning process. Pascu et al. (2023) revealed that there is an association between ease of remembering with the internet and digital instruments, which explains the students’ need for personal development in accordance with the current digital transition concerns.
At the 10th grade level, the Pearson correlation coefficient values were within the significance threshold, indicating a negative, inversely proportional association between the variable “GEP facilitates the learning of fundamental elements of physical and human geography” and “Teacher experience and seniority”—r = −0.303; there was also a negative association between “GEP is an attractive digital tool in terms of its design and interface” and “Implementation of digital tools”—r = −0.307. Some students felt that “GEP is a difficult application to use,” and this variable is associated with learning motivation (“Geography is an important subject, including in the Baccalaureate”—r = 0.305), with variables related to skills development (“Improving STEM skills”—r = 0.333; “Consolidating previously taught knowledge and content”—r = 0.294; “Developing critical thinking”—r = 0.312), and also with aspects related to student participation in class (“Active involvement in class”—r = 0.290). The variable “GEP is an easy-to-use application” is associated with “I learn for my own personal and professional development/career development”—r = 0.361; “I learn for my development as a person, as a competent future adult”—r = 0.392, with the category of variables related to skills development (“You make connections with other subjects”—r = −0.331; “You argue/explain various phenomena and processes specific to physical and human geography”—r = −0.312), and with the time variable (“You manage your time better during a lesson”—r = −0.314). The application “GEP is compatible with the study of geography” has several correlations with skill-type variables (“You understand the content taught better”—r = 0.294; “You apply what you have learned” -r = 0.384; “You carry out geographical investigations”—r = 0.349) and with the taught content (“Population concentration—population density on Earth”—r = 0.450; “Consequences of population density”—r = 0.417). The research variable “GEP has a deeply practical and applied nature” also has a series of correlations with learning motivation (“I learn for pleasure, geography lessons make me feel good”—r = 0.331), with skills (“You develop critical thinking”—r = 0.279), with time management (“Manage your time more quickly during a lesson”—r = 0.287), with teamwork (“Work in a team with your classmates”—r = 0.336), and with teacher–student interaction (“Be actively involved in lessons”—r = 0.312). The variable “GEP is a modern and innovative digital tool” is associated with “I learn for my development as a person and as a competent future adult”—r = 0.303. The research variable “GEP creates learning situations that challenge the student” is associated with variables in the learning motivation category (“I learn for pleasure, Geography classes make me feel good”—r = 0.376; “I learn for my own personal and professional development/career development”—r = 0.385; “I learn for my development as a person, as a competent future adult”—r = 0.336) and the skills developed (“You carry out geographical investigations”—r = 0.368).
Unlike their 9th grade classmates, GEP did not influence 10th grade students to learn “for grades/scholarships” or because of “family pressure.” On the contrary, GEP helped them learn for pleasure and for reasons related to personal and career development.
Furthermore, GEP as a digital tool within the teaching strategy seems to have influenced students differently: ninth graders report correlations with “the degree of difficulty of the subject” and “the way students are organised in class,” while their tenth-grade peers associate it with “ teacher seniority and experience” and “implementation of digital tools.” In terms of skills, 10th grade students consider the impact of GEP to be much greater on the development of skills: eight associations compared to three recorded by their 9th grade classmates. The difference between the two classes is that 10th graders are more aware of the impact of GEP on skills development, perhaps due to their age.
Students’ perceptions change depending on the year they are in, because the further they advance in their studies, the better their perspective on learning and their abilities (Santhanam & Hicks, 2002), and also due to the theoretical and practical knowledge they have acquired and the relationships they have established with their teachers (Kamran et al., 2022). We note that the GEP characteristic “is a difficult application to use” has a greater impact on 10th grade students because this variable establishes six associations, compared to only two in the 9th grade. This difference could indicate that GIS-type digital tools should be implemented at younger ages because, as the study shows, ninth-grade students, unlike tenth-grade students, perceived GEP as difficult to a much lesser extent. It is possible that the more we implement digital tools at higher levels of secondary education, the more students perceive them as difficult, even though, paradoxically, they have a better level of digital skills. Tenth-grade students considered that “GEP creates learning situations that challenge the student,” with four associations. In fact, this is the purpose of using GEP: to challenge students to observe, analyse, measure, locate, interpret, etc.
Knowing the differences in the experimental sample based on the level of study could help teachers adapt their strategy. It is believed that a variety of strategies should be applied to facilitate flexible learning environments that allow learners to master complex tasks independently (Noguera et al., 2024). Each student reacts in their own way to the teaching strategies applied by the teacher in class. Payne (2019) has shown that some strategies can influence individuals in different ways, such as group work, which can be beneficial for some students and less so for others.
  • What are the benefits of Google Earth Pro software in teaching and learning Geography?
According to Morote et al. (2021), it is essential to move away from traditional pedagogical approaches and adopt innovative methods that respond to contemporary challenges. In this regard, Geography emerges as a key discipline for equipping students with the knowledge and tools needed to adopt sustainable, resilient, and healthy lifestyles (Widener et al., 2016; Yli-Panula et al., 2020). Geography is an interdisciplinary subject due to its subject matter, which is practical in nature and requires the use of teaching strategies that provide students with practical experience (Kagoda, 2016). Google Earth is an incredibly flexible tool that facilitates interdisciplinarity. It can be used in almost any subject, from Geography and Biology to History, Art and even Math (Widodo et al., 2025). The ‘Pro’ version, in particular, offers new ways to teach Geography to high schoolers. It introduces them to professional GIS (Geographic Information Systems) tools, but in a way that is not too overwhelming for their age group.
For the last thirty years, GIS technology has grown far beyond just ‘map-making’. It is now used in all sorts of classrooms (Jant et al., 2020). We already know how useful Google Earth is for advanced scientists studying things like urban planning or the environment; this study shows that we can also bring that same power into high school classrooms in a step-by-step way. This approach fits perfectly with today’s Geography lessons. Instead of just memorising names on a map, the curriculum now focuses on the bigger picture—how humans and nature interact, how our environment is changing and how to analyse the world around us.
For three-quarters of the 122 students in the experimental group, GEP represents an opportunity to “discover places on the Earth’s surface that you would otherwise never see.” This is the most common response from students. The top three also include “orienting yourself in space” and “visualizing the exterior of the Earth’s surface in real time.” These two options were selected by 73.8% and 68.9% of students. More technical options, such as “GEP facilitates the association of graphics/maps/images with theoretical concepts” or “I have control over the information I analyse (the menu helps me zoom in to observe the profile of the elevation over time)” (Figure 3) are selected by a smaller proportion of students, less than half. The least selected option is “facilitating the digital transition.” This appears in approximately one-fifth of students. When asked, “What were the benefits of using Google Earth Pro?”, differences were found within the experimental group over the two years of study (Table 7).
The statistical test shows that statistically significant differences are in favour of the experimental group in the 10th grade for the following variables: spatial orientation, analysis of geospatial data for educational purposes, usefulness in everyday life not only for school purposes, and facilitating digital transition. One of the reasons for these differences could be age and level of study. Students in the 10th grade are in their second year of high school, they have had time to get to know their classmates, their teacher and their requirements, they are more mature, and the teacher has formed their student groups, while 9th graders were only two months into high school when the Google Earth Pro-based teaching strategy was piloted. The first months are generally the hardest because students are trying to integrate and get used to their classmates, the teaching methods, the demands of high school teachers, commuting, etc. Basically, these research results can be used by Geography teachers in the future training of 9th grade students. There is only one difference in favour of 9th grade students in the variable regarding “control over the information I analyse (the menu helps me zoom in, get an overview, see the profile of the quota, and its evolution over time.”
To the question “What do you think about the Google Earth Pro environment/software?” there were two significant differences in favour of the 10th grade in the research variables: “GEP has a deeply practical and applied character” and “GEP creates learning situations that challenge the student.” There was only one difference in favour of 9th grade students in the variable “GEP is an easy-to-use application.” Due to the fact that 9th grade students have a lower level of digital skills because of their age and year of study, they are more likely to make value judgments about GEP software in terms of the difficulty of the menu. In contrast, their more experienced classmates in 10th grade have more-developed analytical thinking.
We can conclude that the level of study influences students’ perceptions of the benefits of GEP. Google Earth Pro offers new pedagogical possibilities for teaching and learning Geography at the pre-university level with the free provision of the software by Google. Until recently, GIS software was only used in academic courses, but with the free provision of GEP, it can now be introduced as a support tool in the teaching of Geography to high school students. For Generation Z students, this is no longer such a big challenge. On the one hand, students have ICT lessons included in the compulsory school curriculum, two hours per week starting in the 5th grade (ages 10–11), so students’ digital skills are progressively developed throughout middle and high school in the national education system. The free availability and capabilities of Google Earth Pro software to import thematic files from GIS increase its compatibility for use in teaching Geography in high school and connecting students with the GIS industry (Healy & Walshe, 2020) from an early age. GEP allows students to overlay and make visible any type of map or image on the Google Earth layer (Monet & Greene, 2012), facilitating the association of geographically specific content. In practice, some of the obstacles of the past, such as access to GIS software and data, have been resolved or significantly reduced (McKenzie et al., 2022). While these difficulties included the lack of reusable learning objects (RLOs) that are ready for use in lessons (Jo et al., 2016), this difficulty has now disappeared. In our research, we reused thematic layers found within the ESRI/ArcGIS online communities, the eduterre website, or the specialized websites of European agencies.
Among the difficulties that teachers may encounter in adopting GEP in the teaching process are those of a technical nature, access to the internet, and access to computer labs. West (2006) also warned that the time gap between training and teaching with GIS can lead to a loss of enthusiasm and skills. Short lesson times (50 min), which limit sustained engagement, can be another obstacle (Höhnle et al., 2016). For this reason, the COLABTEACH research project is interdisciplinary, and Geography teachers collaborated with ICT teachers or the school’s computer scientist to help students navigate the GEP menu so that they would not lose their enthusiasm and improve their skills. For the same reason, students worked in teams during Geography lessons.

Study Limitations

There are a few limitations to this research that should be noted. First, the participants were not chosen at random. This was a pilot study where teachers signed up on a voluntary basis, resulting in a convenience sample. Additionally, it is important to mention that we could not fully control for confounding factors. This means that certain external influences may have played a role in the results (even if we were not able to measure them exactly).

5. Conclusions

We found significant differences in favour of group B in research variables related to: the need for “personal development as competent future adults” and “understanding the environment and the world we live in.” as sources of motivation for learning Geography; the importance of “teacher experience and seniority” perceived by students as playing a “very important” role in learning the content taught; the numerous advantages of teamwork in Geography lessons, such as those of a cognitive, environmental, cooperative learning, workload, and assessment; and higher attendance in Geography classes. They could be determined by the fact that this group of students experienced learning Geography with Google Earth Pro, the software being included in the teaching strategy for five consecutive lessons. The study highlighted that the students’ year of study can be an important criterion in assessing variations in perception. GEP as a digital tool that was part of the teaching strategy seems to have influenced the students in the experimental group differently, with the 9th grade showing correlations with “Degree of difficulty of the subject matter” and “Classroom organization,” while in the 10th grade, associations were made with “Teacher seniority and experience,” “Implementation of digital tools,” and “Skills training.” The greatest impact was seen in the skills variable, with 10th grade students considering that GEP helped them develop a greater number of skills, as evidenced by eight associations (understanding the content taught, applying what was learned and transposing it into a new context, making connections with other subjects, critical thinking, consolidating previous knowledge, improving STEM knowledge, etc.) compared to only three in the 9th grade. The perception of students in the experimental group regarding the usefulness of GEP in the teaching–learning process of Geography is positive across the entire sample. They appreciated that this software has numerous benefits for them: “discovering places on the Earth’s surface that you normally cannot see” (75.8%); “spatial orientation” (74.25%); “real-time visualization of the Earth’s surface” (71.7%). Perceptions vary depending on the year of study, with 9th graders appreciating more “control over the information they analyze” while their 10th grade classmates appreciate more “spatial orientation,” “analysis of geospatial data for educational purposes,” and “help in everyday life, not only for school.” How is Google Earth Pro perceived as software? Across the entire sample, it is perceived as “an attractive digital tool in terms of its design and interface” (73.8%), one that “facilitates the learning of fundamental elements of physical and human geography” (65.6%) and is “an easy-to-use application” (63.15%).
Although Google Earth Pro was a challenge for the students in the experimental group, its use had a positive impact on how students perceived the entire teaching strategy based on this software. However, it is necessary to use the software for a longer period of time so that students have the opportunity to explore all the features it offers. The study showed that teaching Geography with Google Earth Pro should be integrated into the overall teaching–learning–assessment strategy for Geography, and that the teacher, the content taught, and the way students were organized into teams were important variables that contributed to the success of teaching Geography with this software.
We can conclude that Google Earth Pro can be introduced as a digital support tool in the teaching of Geography to high school students, and that its implementation should start at an earlier age, because, as the study results show, 9th grade students found it much easier to use than their 10th grade peers.
Even though the potential impact of geospatial technologies on learning is significant (Baker & White, 2003), their implementation in schools remains slow (Baker & White, 2003; DeMers, 2016; Kerski, 2003; Kim & Lee, 2012).
Geospatial technologies, including GEP, support evidence-based research and training (Baker & White, 2003; Kulo & Bodzin, 2013; Stahley, 2006). If teaching Geography with GEP becomes a constant over time, students can acquire the skills necessary not only to learn with GIS tools but to learn GIS. GEP as part of the teaching strategy applied to the experimental group meets the needs of Geography as a science.

Author Contributions

Conceptualization, M.P. and N.D.; Methodology, M.P.; Software, M.P.; Validation, M.P.; Formal analysis, M.P.; Investigation, M.P.; Resources, M.P.; Data curation, M.P.; Writing—review and editing, M.P.; Visualization, M.P. and N.D.; Supervision, N.D.; Project administration, M.P.; Funding acquisition, M.P. All authors have read and agreed to the published version of the manuscript.

Funding

This paper is an output of the science project COLABTEACH, supported by an Marie Skłodowska Curie Action-H2020–MSCA COFUND, grant number 101034383.

Data Availability Statement

The original contributions presented in this study are included in the article. Further inquiries can be directed to the corresponding author.

Acknowledgments

Grateful thanks are given to the reviewers and editors who have helped shape this document to be readable for its audience, to all collaborating teachers who contributed to this research.

Conflicts of Interest

The authors declare no conflicts of interest.

References

  1. Abdulmajid, F., Zamin, A., & Kamarudin, M. (2017). Toolkits for 21st century teaching: Practical implications for the 4th industry skills development. UiTM Press. [Google Scholar]
  2. Alé, J., & Arancibia, M. L. (2025). Emerging technology-based motivational strategies: A systematic review with meta-analysis. Education Sciences, 15(2), 197. [Google Scholar] [CrossRef] [Scilit]
  3. Althubyani, A. R. (2024). Digital competence of teachers and the factors affecting their competence level: A nationwide mixed-methods study. Sustainability, 16(7), 2796. [Google Scholar] [CrossRef] [Scilit]
  4. Ayllón, S., Holmarsdottir, H., & Lado, S. (2023). Digitally deprived children in Europe. Child Indicators Research, 16, 1315–1339. [Google Scholar] [CrossRef] [Scilit] [PubMed]
  5. Baeten, M., Dochy, F., & Struyven, K. (2012). Using students’ motivation and learning profiles in investigating their perceptions and achievement in case-based and lecture-based learning environments. Educational Studies, 38(5), 491–506. [Google Scholar] [CrossRef] [Scilit]
  6. Baker, T. R., & White, S. H. (2003). The effects of G.I.S. on students’ attitudes, self-efficacy, and achievement in middle school science classrooms. Journal of Geography, 102(6), 243–254. [Google Scholar] [CrossRef] [Scilit]
  7. Berkup, S. B. (2014). Working with generations X and Y in generation Z period: Management of different generations in business life. Mediterranean Journal of Social Sciences, 5(19), 218. [Google Scholar] [CrossRef] [Scilit]
  8. Blank, L. M., Almquist, H., Estrada, J., & Crews, J. (2016). Factors affecting student success with a Google Earth-based earth science curriculum. Journal of Science Education and Technology, 25(1), 77–90. [Google Scholar] [CrossRef] [Scilit]
  9. Bodzin, A. M., & Fu, Q. (2014). The effectiveness of the geospatial curriculum approach on urban middle-level students’ climate change understandings. Journal of Science Education and Technology, 23(4), 575–590. [Google Scholar] [CrossRef] [Scilit]
  10. Brandenburg, R. T., McDonough, S., Burke, J., & White, S. J. (2016). Teacher education research and the policy reform Agenda. Springer. [Google Scholar]
  11. Brittain, A. (2025, June 19). Young people aren’t inherently digital natives. The Times. Available online: https://www.thetimes.com/business/ceo-summit/article/alison-brittain-young-people-arent-inherently-digital-natives-svlncqrhp?utm (accessed on 4 November 2025).
  12. Butler, D. (2006). Virtual globes: The web-wide world. Nature, 439, 776–778. [Google Scholar] [CrossRef] [Scilit]
  13. Cherghit, I. (1993). Teaching methods. Polirom Publishing House. [Google Scholar]
  14. DeMers, M. N. (2016). Geospatial technology in geography education. The Geography Teacher, 13(1), 23–25. [Google Scholar] [CrossRef] [Scilit]
  15. European Commission. (2019). Educación digital en las escuelas Europeas. Eurydice Report. European Commission. [Google Scholar]
  16. González-Marcos, A., Navaridas-Nalda, F., Jiménez-Trens, M. A., Alba-Elías, F., & Ordieres-Meré, J. (2021). Academic effects of a mixed teaching methodology versus a teacher-centered methodology and approaches to learning. Revista de Educación, 392, 115. [Google Scholar] [CrossRef] [Scilit]
  17. Healy, G., & Walshe, N. (2020). Real-world geographers and geography students using GIS: Relevance, everyday applications and the development of geographical knowledge. International Research in Geographical and Environmental Education, 29(2), 178–196. [Google Scholar] [CrossRef] [Scilit]
  18. Henry, A. (2009). Using Google Earth for internet GIS, GeoSciences MSc thesis collection. Institute of Geography School of GeoSciences University of Edinburgh. Available online: https://era.ed.ac.uk/handle/1842/3087?show=full (accessed on 4 November 2025).
  19. Howell, D. C. (2012). Statistical methods for psychology (8th ed.). Wadsworth Cengage Learning. ISBN 9781111835484. [Google Scholar]
  20. Höhnle, S., Fögele, J., Mehren, R., & Schubert, J. C. (2016). GIS teacher training: Empirically-based indicators of effectiveness. Journal of Geography, 115(1), 12–23. [Google Scholar] [CrossRef] [Scilit]
  21. Hsu, H. P., Tsai, B. W., & Chen, C. M. (2018). Teaching topographic map skills and geomorphology concepts with Google Earth in a one-computer classroom. Journal of Geography, 117(1), 29–39. [Google Scholar] [CrossRef] [Scilit]
  22. Huett, J. B. (2006). The effects of ARCS-based confidence strategies on learner confidence and performance in distance education [Doctoral thesis, University of North Texas]. Available online: https://digital.library.unt.edu/ark:/67531/metadc5268/ (accessed on 21 November 2024).
  23. Jaeger, A. J. (2024). Google Earth as a Tool for supporting geospatial thinking. Land, 13(12), 2218. [Google Scholar] [CrossRef] [Scilit]
  24. Janschitz, G., & Penker, M. (2022). How digital are ‘digital natives’ actually? Developing an instrument to measure the degree of digitalisation of university students—The DDS-Index. Bulletin of Sociological Methodology/Bulletin de Méthodologie Sociologique, 153(1), 127–159. [Google Scholar] [CrossRef] [Scilit]
  25. Jant, E. A., Uttal, D. H., Kolvoord, R., James, K., & Msall, C. (2020). Defining and measuring the influences of GIS-based instruction on students’ STEM-relevant reasoning. Journal of Geography, 119(1), 22–31. [Google Scholar] [CrossRef] [Scilit]
  26. Jo, I., Hong, J. E., & Verma, K. (2016). Facilitating spatial thinking in world geography using Web-based GIS. Journal of Geography in Higher Education, 40(3), 442–459. [Google Scholar] [CrossRef] [Scilit]
  27. Kagoda, A. M. (2016). Teaching of geography in Uganda secondary schools: Reflections of geography teacher trainees at the school of education, Makerere university, Uganda. Advances in Social Sciences Research Journal, 3(5), 2796–2802. [Google Scholar] [CrossRef] [Scilit]
  28. Kamran, F., Afzal, A., & Rafiq, S. (2022). Students’ perception regarding teachers’ teaching practices at university level. Journal of Social Sciences Development, 1(1), 13–26. [Google Scholar] [CrossRef] [Scilit]
  29. Kerski, J. J. (2003). The implementation and effectiveness of geographic information systems technology and methods in secondary education. Journal of Geography, 102(3), 128–137. [Google Scholar] [CrossRef] [Scilit]
  30. Kim, M., & Lee, S. I. (2012). South Korea: GIS implementation profiles among secondary geography teachers. In International perspectives on teaching and learning with GIS in secondary schools (Vol. 9789400721203, pp. 233–241). Springer. [Google Scholar] [CrossRef] [Scilit]
  31. Koc, T., & Topu, F. B. (2022). Using three-dimensional geospatial technology in primary school: Students’ achievements, spatial thinking skills, cognitive load levels, experiences and teachers’ opinions. Education and Information Technologies, 27, 4925–4954. [Google Scholar] [CrossRef] [Scilit]
  32. Kulo, V., & Bodzin, A. (2013). The impact of a geospatial technology supported energy curriculum on middle school students’ science achievement. Journal of Science Education and Technology, 22(1), 25–36. [Google Scholar] [CrossRef] [Scilit]
  33. Lavonen, J., Ávalos, B., Upadyaya, K., Araneda, S., Juuti, K., Cumsille, P., Inkinen, J., & Salmela-Aro, K. (2021). Upper secondary students’ situational interest in physics learning in Finland and Chile. International Journal of Science Education, 43(16), 2577–2596. [Google Scholar] [CrossRef] [Scilit]
  34. Lucas, B., Spencer, E., & Claxton, G. (2012). How to teach vocational education: A theory of vocational pedagogy. City & Guilds. Available online: https://www.improvingtechnicaleducation.org.uk/assets/__/resource-library/resource/pdf/report-how-to-teach-vocational-education.pdf (accessed on 10 April 2024).
  35. Ma, H., & Ismail, L. (2025). Bibliometric analysis and systematic review of digital competence in education. Humanities and Social Sciences Communications, 12, 185. [Google Scholar] [CrossRef] [Scilit]
  36. Ma, J. K. H., & Cheng, S. (2022a). Adolescent well-being and ICT use. In Human well-being research and policy making. Springer. [Google Scholar]
  37. Ma, J. K. H., & Cheng, S. (2022b). First- and second-level digital divides from 2009 to 2018. In Adolescent well-being and ICT use: Social and policy implications. Springer. [Google Scholar] [CrossRef] [Scilit]
  38. Maehr, M. L., & Archer, J. (1985). Motivation and school achievement. ERIC Publications. Available online: https://files.eric.ed.gov/fulltext/ED265938.pdf (accessed on 21 November 2024).
  39. Magano, J., Silva, C., Figueiredo, C., Vitória, A., Nogueira, T., & Pimenta Dinis, M. A. (2020). Generation Z: Fitting project management soft skills competencies—A mixed-method approach. Education Sciences, 10(7), 187. [Google Scholar] [CrossRef] [Scilit]
  40. Maloni, M. J., Hiatt, M. S., & Campbell, S. M. (2019). Understanding the work values of Gen Z business students. The International Journal of Management Education, 17(3), 100320. [Google Scholar] [CrossRef] [Scilit]
  41. McKenzie, P., Cook, S., & Roulston, S. (2022). Learners as teachers—Teachers as learners: A collaborative approach to develop skills in GIS education. The Geography Teacher, 19(1), 4–11. [Google Scholar] [CrossRef] [Scilit]
  42. Mogonea, F. (2010). Developing self-assessment skills in high school students. Universitaria Publishing House. [Google Scholar]
  43. Monet, J., & Greene, T. (2012). Using Google Earth and satellite imagery to foster place-based teaching in an introductory physical geology course. Journal of Geoscience Education, 60(1), 10–20. [Google Scholar] [CrossRef] [Scilit]
  44. Morote, Á.-F., Hernández, M., & Olcina, J. (2021). Are future school teachers qualified to teach flood risk? An approach from the geography discipline in the context of climate change. Sustainability, 13(15), 8560. [Google Scholar] [CrossRef] [Scilit]
  45. Noguera, I., Barrientos, D., Torres-Sánchez, M., & Pineda-Herrero, P. (2024). Exploring pedagogical and digital practices in vocational education and training: Comparing teacher and student perspectives. Education Sciences, 14(7), 734. [Google Scholar] [CrossRef] [Scilit]
  46. Obradovic, V., Mitrovic, Z., & Pavicevic, M. (2017). Millennials vs. Baby Boomers in project management: Education and training gap. In Proceedings of the 12th international scientific and technical conference on computer sciences and information technologies (CSIT), Lviv, Ukraine, 5–8 September 2017 (Vol. 2, pp. 22–29). IEEE. [Google Scholar]
  47. Pascu, M., Petculescu, D. C., & Stupariu, I. P. (2023). Investigating students’ perception of online assessment as a result of the interaction among the extrinsic assessment factors on students psychological characteristics. Education Sciences, 13(2), 193. [Google Scholar] [CrossRef] [Scilit]
  48. Payne, L. (2019). Student engagement: Three models for its investigation. Journal of Further and Higher Education, 43(5), 641–657. [Google Scholar] [CrossRef] [Scilit]
  49. Perez, S. (2020). Google Earth and maps get sharper satellite imagery with new update. Available online: https://devicology.com/tech/big-updates-to-google-earth-maps-time-travel-and-more-street-view-with-sharper-imagery/2021/#:~:text=Google%E2%80%99s%20new%20AI-powered%20updates%20enhance%20Earth%20and%20Maps,users%20with%20a%20more%20immersive%20and%20informative%20experience (accessed on 14 February 2020).
  50. Renninger, K. A., Ren, Y., & Kern, H. M. (2018). Motivation, engagement, and interest: “In the end, it came down to you and how you think of the problem”. In F. Fischer, C. E. Hmelo-Silver, S. R. Goldman, & P. Reimann (Eds.), International handbook of the learning sciences (pp. 116–126). Routledge. [Google Scholar]
  51. Rioseco-Pais, M., Silva-Quiroz, J., & Vargas-Vitoria, R. (2024). Digital competences and years of access to technologies among Chilean university students: An analysis based on the DIGCOMP framework. Sustainability, 16(22), 9876. [Google Scholar] [CrossRef] [Scilit]
  52. Rustad, M. B., Parsanoglou, D., Symeonaki, M., Mifsud, L., Hyggen, C., & Ghetau, C. (2024). ‘Of gaming and other demons’: Defining children and young people’s meaningful leisure activities in the digital era. In H. Holmarsdottir, I. Seland, C. Hyggen, & M. Roth (Eds.), Understanding the everyday digital lives of children and young people. Palgrave Macmillan. [Google Scholar] [CrossRef] [Scilit]
  53. Saavedra, A., & Opfer, V. (2012). Teaching and learning 21st century skills: Lessons from the learning sciences. A Global Cities Education Network Report. Asia Society. Available online: http://asiasociety.org/files/rand-0512report.pdf (accessed on 4 November 2025).
  54. Santhanam, E., & Hicks, O. (2002). Disciplinary, gender and course year influences on student perceptions of teaching: Explorations and implications. Teaching in Higher Education, 7(1), 17–31. [Google Scholar] [CrossRef] [Scilit]
  55. Sánchez, J., Reyes-Rojas, J., & Alé-Silva, J. (2024). What is known about assistive technologies in distance and digital education for learners with disabilities? Education Sciences, 14(6), 595. [Google Scholar] [CrossRef] [Scilit]
  56. Sánchez-Caballé, A., Gisbert-Cervera, M., & Esteve-Mon, F. (2020). The digital competence of university students: A systematic literature review. Aloma, 38, 63–74. [Google Scholar] [CrossRef] [Scilit]
  57. Seemiller, C., & Grace, M. (2017). Generation Z: Educating and engaging the next generation of students. About Campus: Enriching the Student Learning Experience, 22(3), 21–26. [Google Scholar] [CrossRef] [Scilit]
  58. Stahley, T. (2006). Earth from above. The Science Teacher (National Science Teachers Association), 73(7), 44. [Google Scholar]
  59. Suharini, E., Ariyadi, M. H., & Kurniawan, E. (2020). Google Earth Pro as a learning media for mitigation and adaptation of landslide disaster. International Journal of Information and Education Technology, 10(11), 820–825. [Google Scholar] [CrossRef] [Scilit]
  60. Symeonaki, M., Ayllón, S., & Lado, S. (2022, July 28–30). Do European adolescents lack interest and confidence in ICT? Evidence from the PISA survey. 4th International Conference on Statistics: Theory and Applications (ICSTA’22), Prague, Czech Republic. [Google Scholar]
  61. Symeonaki, M., Hyggen, C., Parsanoglou, D., Mifsud, L., & Stamou, G. (2024). Investigating patterns of digital socialisation duringleisure through multimodal social research. In H. Holmarsdottir, I. Seland, C. Hyggen, & M. Roth (Eds.), Under standing the everyday digital lives of children and young people. Palgrave Macmillan. [Google Scholar] [CrossRef] [Scilit]
  62. Symeonaki, M., Stamatopoulou, G., & Parsanoglou, D. (2025). Factors explaining adolescents’ digital skills in Europe. Humanities and Social Sciences Communications, 12, 937. [Google Scholar] [CrossRef] [Scilit]
  63. Warschauer, M., & Matuchniak, T. (2010). New technology and digital worlds: Analyzing evidence of equity in access, use, and outcomes. Review of Research in Education, 34(1), 179–225. [Google Scholar] [CrossRef] [Scilit]
  64. West, B. A. (2006). Forum: Issues affecting the adoption of GIS within Australian and New Zealand schools. International Research in Geographical and Environmental Education, 15(3), 255–258. [Google Scholar] [CrossRef] [Scilit]
  65. Widener, J. M., Gliedt, T., & Tziganuk, A. (2016). Assessing sustainability teaching and learning in geography education. International Journal of Sustainability in Higher Education, 17(5), 698–718. [Google Scholar] [CrossRef] [Scilit]
  66. Widodo, J. P., Sitompul, N. C., Subekti, I., Bustan, L., & Arbi, A. P. (2025). Google earth integration in learning: A narrative review. Magister Scientiae, 53, 15–23. [Google Scholar] [CrossRef] [Scilit]
  67. Xiang, S., & Liu, Y. (2016). Understanding ‘change’ through spatial thinking using Google Earth in secondary geography. Journal of Computer Assisted Learning, 33, 65–78. [Google Scholar] [CrossRef] [Scilit]
  68. Yli-Panula, E., Jeronen, E., Koskinen, S., & Vesterkvist, S. (2020). Biologian jamaantieteen opetuksessa käytettävät ilmastonmuutoksen opetusmenetelmät. Ainedidaktiikka, 4(3), 102–124. [Google Scholar] [CrossRef] [Scilit]
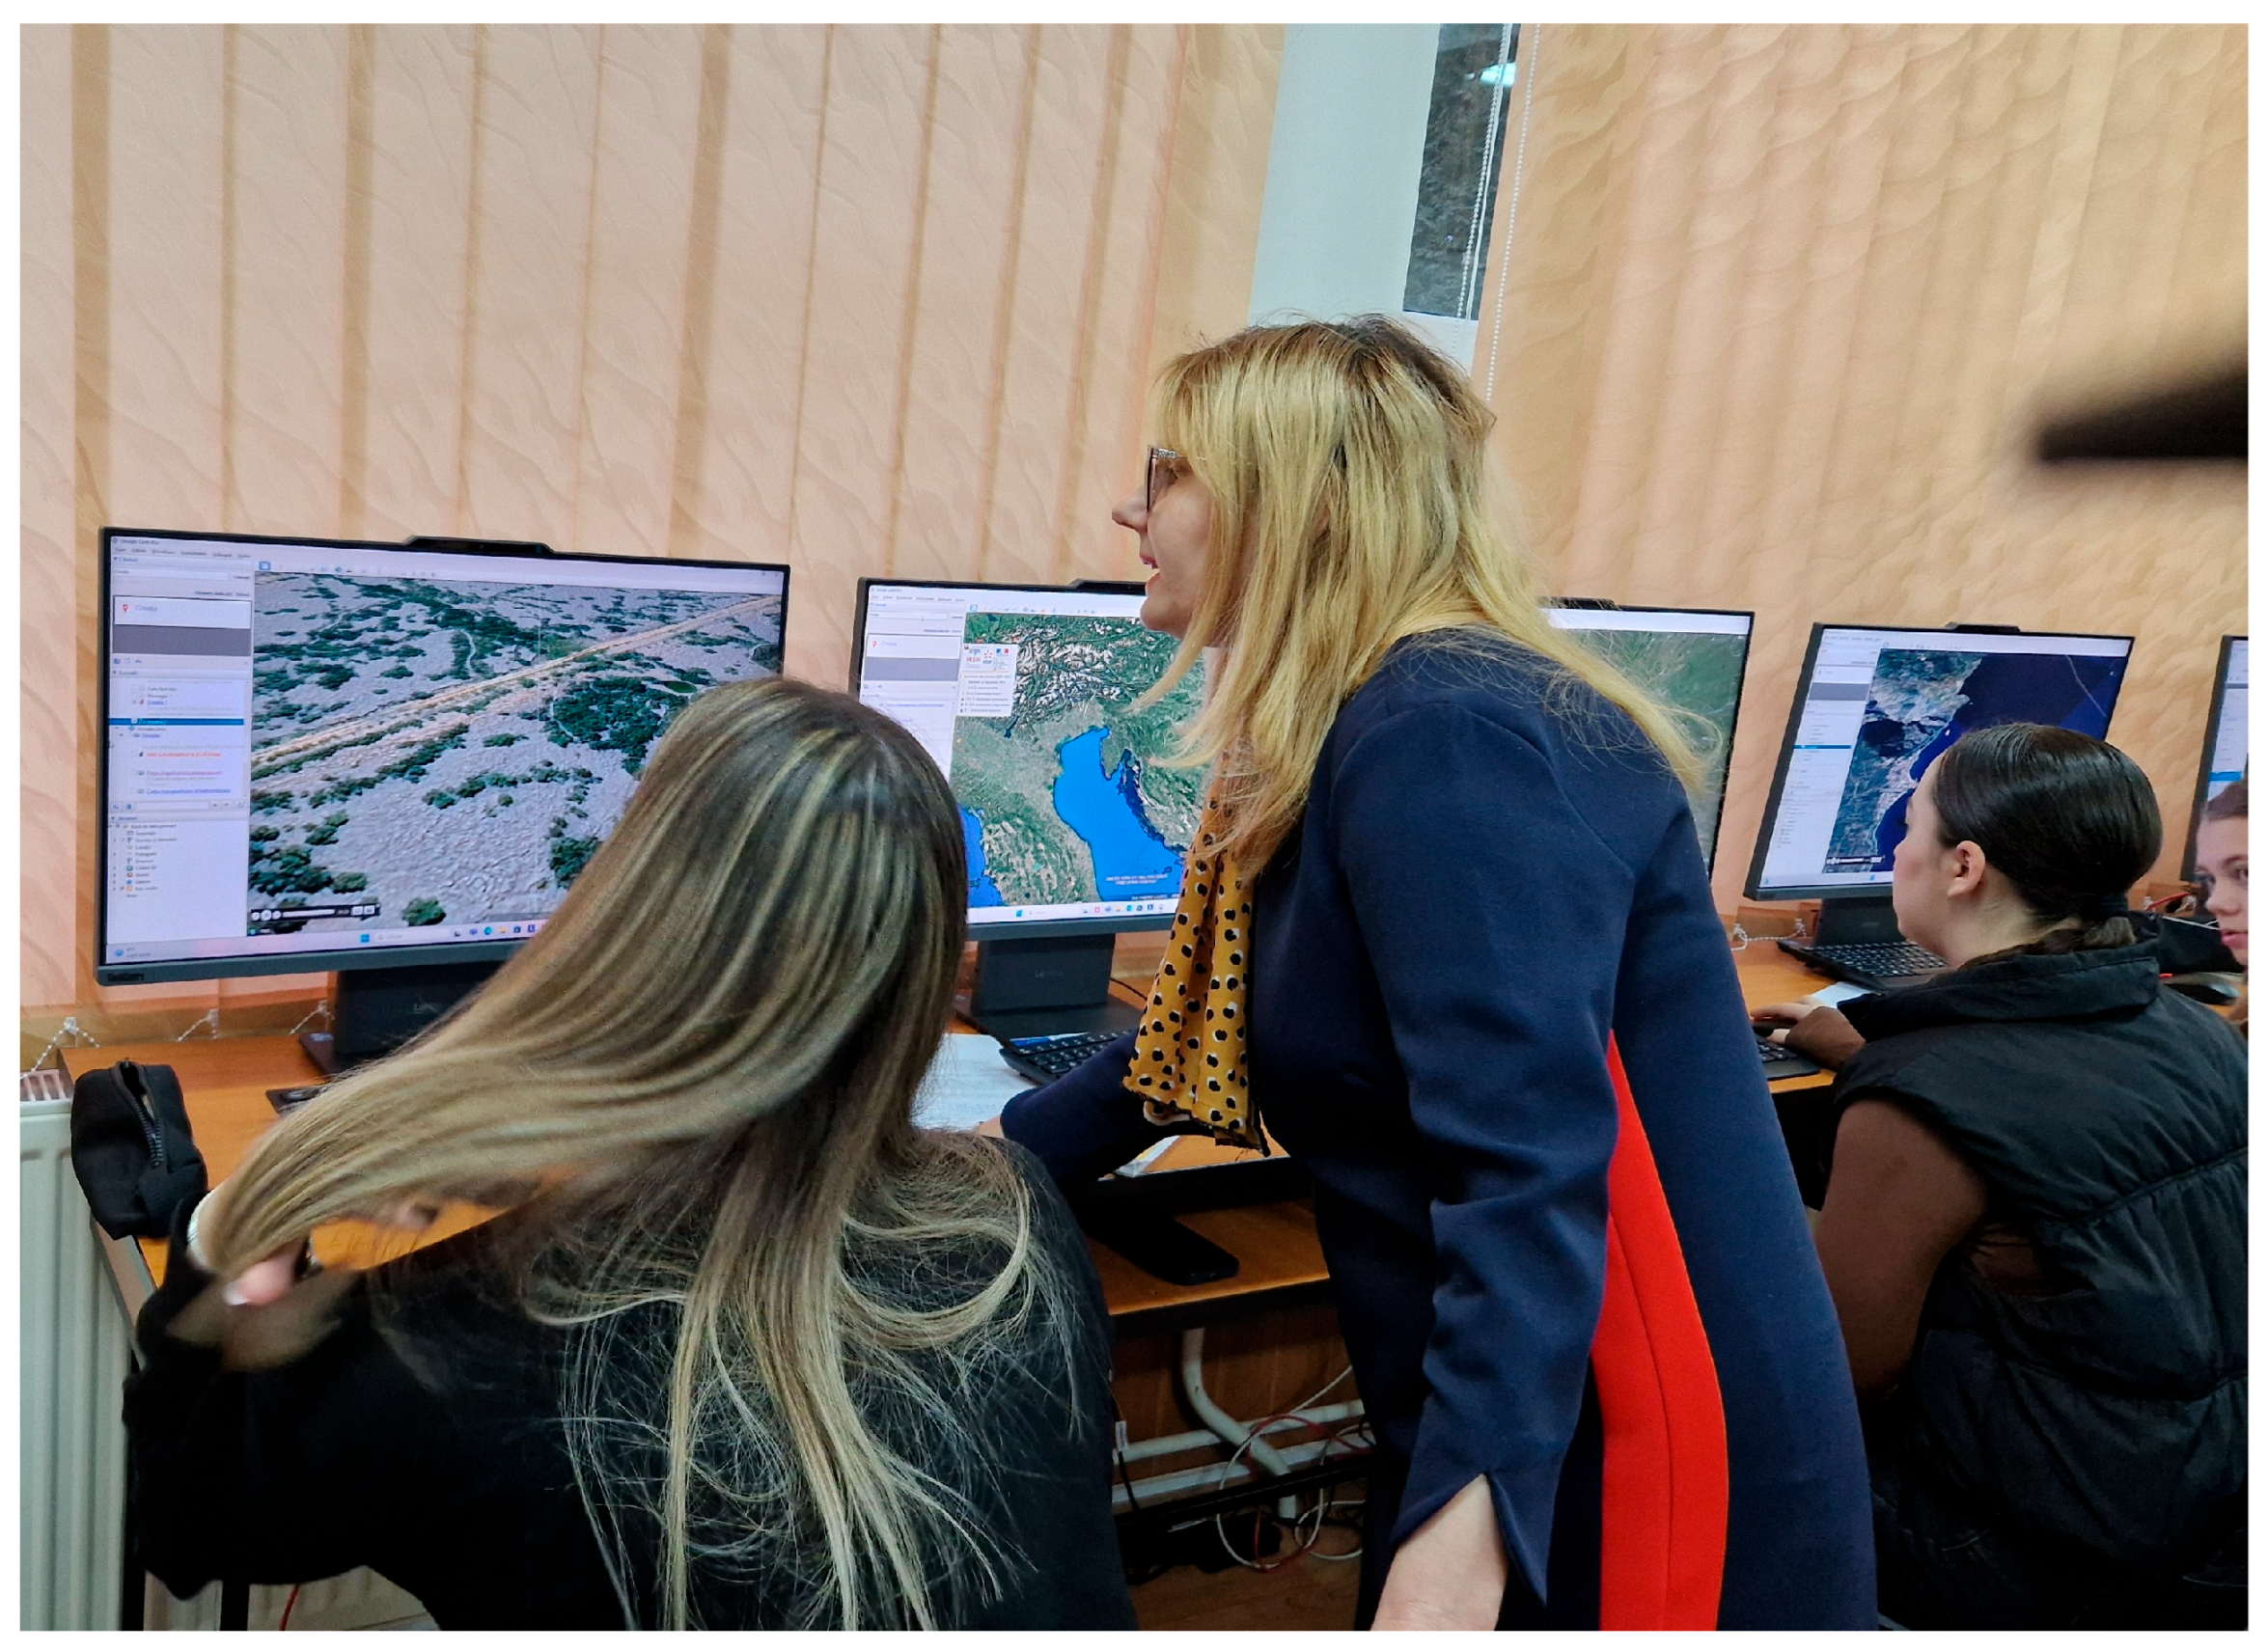
Figure 1. Ninth graders experience learning Geography with Google Earth Pro.
Education 16 00268 g001
Figure 2. Contents related to Earth tectonics are taught using Google Earth Pro.
Education 16 00268 g002
Figure 3. Analysis of relief type and hypsometric profile.
Education 16 00268 g003
Table 1. Socio-demographic structure of the sample.
Student Group
Control GroupExperimental Group
ClassTotalUnweighted Base107122
IXCol%52.359
Test5672
XCol%47.741
Test5150
ProfileNatural sciencesCol%22.419.7
Test2424
PhilologyCol%35.521.3
Test3826
Maths—InformaticsCol%25.241
Test2750
Technical—Food and TourismCol%018
Test022
Social StudiesCol%16.80
Test180
SexFemaleCol%55.150.8
Test5962
MaleCol%44.949.2
Test4860
CountyACol%47.741
Test5150
BCol%15.90
Test170
CCol%16.80
Test180
DCol%041
Test050
ECol%19.60
Test210
FCol%018
Test022
Table 2. Significant sample differences resulting from the comparative analysis of proportions.
QuestionResearch VariableThe AnswerUnweighted BaseControl GroupExperimental Group
Total students 107122
Q1b. I learn to know/understand the environment and the world we live in Col%40.253.3
Test4365
c. Geography is an important subject in school and for the Baccalaureate exam Col%19.612.3
Test2115
f. I learn for my formation as a human being, as a future competent adult Col%29.040.2
Test3149
Q2Teacher experience and seniority2 = Of little importanceCol%12.14.9
Test136
5 = Very importantCol%25.245.9
Test2756
Teaching methods used by the teacher to deliver the content1 = unimportantCol%1.95.7
Test27
2 = Of little importanceCol%1.917.2
Test221
3Col%9.328.7
Test1035
5 = Very importantCol%46.718.0
Test5022
Difficulty level of the subject2 = Of little importanceCol%15.07.4
Test169
5 = Very importantCol%25.232.0
Test2739
Implementing digital tools1 = unimportantCol%2.819.7
Test324
4Col%28.021.3
Test3026
5 = Very importantCol%32.718.9
Test3523
How pupils are organised in the classroom1 = unimportantCol%15.02.5
Test163
3Col%20.642.6
Test2252
Q3Transfer what you’ve learnt into a new context3Col%37.427.0
Test4033
4 = MostlyCol%26.238.5
Test2847
You learn digital skills to help you develop an autonomous learning style2 = To a small extentCol%18.79.8
Test2012
Interact more with your teacher1 = Not at allCol%1.96.6
Test28
Q4_cls.IXRelief analysis and interpretation2 = A little/
To a small extent
Col%8.91.4
Test51
5 = Very muchCol%14.326.8
Test819
Tectonic plate phenomena: volcanism2 = A little/
To a small extent
Col%7.11.4
Test41
Analysing and interpreting landforms (topographic profile, measuring distances)2 = A little/
To a small extent
Col%8.91.4
Test51
5 = Very muchCol%14.326.8
Test819
Q4_cls.XPopulation distribution factors5 = Very muchCol%25.512.2
Test136
Q8cognition Col%26.239.3
Test2848
pleasant atmosphere Col%10.323.8
Test1129
co-operative learning Col%7.514.8
Test818
Q9YouTube with geography-related content0.00Col%42.155.7
Test4568
2.00Col%26.213.9
Test2817
3.00Col%0.95.7
Test17
Digital encyclopaedias with Geography-related contentless than an hourCol%6.51.6
Test72
Livresq with Geography-related content1.0Col%5.62.5
Test63
Adservio0.0Col%82.293.4
Test88114
1.0Col%9.32.5
Test103
Digital Atlas0.0Col%75.786.1
Test81105
Q10Digital encyclopaedias (Wikipedia)—Geographyonce a weekCol%24.314.8
Test2618
Digital encyclopaedias (Wikipedia)—other sciencesnone/neverCol%15.024.6
Test1630
several times a monthCol%29.916.4
Test3220
Websites of organisations, media etc—Geography2–3 times a week or more oftenCol%16.88.2
Test1810
Websites of organisations, media etc—other sciencesnone/neverCol%12.123.8
Test1329
Atlases and digital maps—Geography2–3 times a week or more oftenCol%24.314.8
Test2618
Kahoot/Wordwall/Settera Games—Geography2–3 times a week or more oftenCol%12.15.7
Test137
Virtual hybrid learning platforms—Geographynone/neverCol%28.043.4
Test3053
2–3 times a week or more oftenCol%15.05.7
Test167
Virtual platforms for hybrid learning—other sciencesnone/neverCol%20.642.6
Test2252
once a monthCol%12.120.5
Test1325
once a weekCol%21.58.2
Test2310
2–3 times a week or more oftenCol%17.813.1
Test1916
Online platforms with online lessons and quizzes—Geographynone/neverCol%15.041.0
Test1650
2–3 times a week or more oftenCol%29.06.6
Test318
Online platforms with online lessons and quizzes—other sciencesnone/neverCol%18.732.0
Test2039
2–3 times a week or more oftenCol%23.413.1
Test2516
YouTube—Geographynone/neverCol%13.141.8
Test1451
once a weekCol%30.812.3
Test3315
2–3 times a week or more oftenCol%23.412.3
Test2515
YouTube—other sciencesnone/neverCol%3.719.7
Test424
2–3 times a week or more oftenCol%32.716.4
Test3520
Power Point/Prices—Geography2–3 times a week or more oftenCol%17.87.4
Test199
Adservio—other sciencesnone/neverCol%59.869.7
Test6485
once a weekCol%9.34.9
Test106
2–3 times a week or more oftenCol%8.46.6
Test98
Livresq- Geographynone/neverCol%46.759.0
Test5072
Q13During the M2 module you attended ?50–100%Col%32.718.9
Test3523
100%Col%54.269.7
Test5885
Table 3. Differences resulting from the comparative analysis of means.
Research Variable Student Group
Control GroupExperimental
Group
(A)(B)
Teacher’s experience and seniorityUnweighted Base107122
Mean3.64.1
Test A
Teaching methods used by the teacher to convey the contentMean4.33.4
TestB
Difficulty level of the subjectMean3.63.8
Test A
Implementation of digital technology/toolsMean3.83.1
TestB
Improve your initial and specialised skillsMean3.63.5
TestB
A better understanding of the taught contentMean3.93.7
TestB
Apply what you’ve learntMean3.63.4
TestB
Being able to make correlations with other disciplinesMean3.33.1
TestB
Analysing and interpreting relief (topographic profile, measuring distances, historical images)Mean3.63.8
Test A
Eduboom, with Geography lessons/homeworkUnweighted Base1917
Mean1.41.8
Test A
Livresq with Geography-related contentUnweighted Base87
Mean0.82.1
Test A
AdservioUnweighted Base198
Mean1.31.9
Test A
Digital encyclopaedias (Wikipedia)—GEOGRAPHYMean2.92.6
TestB
Websites of organisations, media etc—GEOGRAPHYMean3.02.6
TestB
Websites of organisations, media etc—Other SciencesMean3.12.9
TestB
Atlases and digital maps—GEOGRAPHYMean3.33.0
TestB
Atlases and digital maps—Other SciencesMean2.82.5
TestB
Games Kahoot/Wordwall/Settera/Kidibot etc.—GEOGRAPHYMean2.32.0
TestB
Virtual platforms for hybrid learning, blending-learning (Google Classroom, Teams, etc.)—GEOGRAPHYMean2.8
TestB2.2
Virtual platforms for hybrid, blending-learning (Google Classroom, Teams, etc.)—Other SciencesMean3.0
TestB2.3
Online platforms with video lessons and online tests (e.g., Eduboom, Mykoolio, Mozaweb)—GEOGRAPHYMean3.3
TestB2.3
Online platforms with video lessons and online quizzes (e.g., Eduboom, Mykoolio, Mozaweb)—Other SciencesMean3.1
TestB2.6
YouTube—GEOGRAPHYMean3.42.4
TestB
YouTube—Other SciencesMean3.8
TestB3.1
Adservio—GEOGRAPHYMean2.1
TestB1.4
Adservio—Other SciencesMean2.01.7
TestB
Livresq—GEOGRAPHYMean2.31.9
TestB
During Module 2 of the school year, you attended Geography classes…Mean3.33.5
Test A
Highlights (compared to A column only): bigger than A smaller than A
Table 4. Statistically significant differences between 9th and 10th grades.
Class
9th Grade Experimental Group10th Grade Experimental Group9th Grade Control Group10th Grade Control Group
(A)(B)(C)(D)
Which of the statements below apply to you?TotalUnweighted Base72505651
b. I learn to know/understand the environment and the world we live inCol%51.456.032.149.0
Test37281825
CC C
c. Geography is an important subject in school and for the Baccalaureate examCol%19.42.030.47.8
Test141174
B D A B DB
d. I like learning Geography, classes make me feel goodCol%13.924.017.927.5
Test10121014
A A
e. I learn for my own personal and professional/career developmentCol%33.320.019.633.3
Test24101117
B C B C
f. I learn for my own development as a human being, as a future competent adultCol%41.738.026.831.4
Test30191516
C
g. My family puts pressure on me to learn wellCol%15.310.08.919.6
Test115510
B C
Teacher experience and seniorityTotalUnweighted Base72505651
1 = unimportantCol%1.46.05.47.8
Test1334
A A
2 = Of little importanceCol%6.92.08.915.7
Test5158
BA B
5 = Very importantCol%44.448.032.117.6
Test3224189
C DC DD
The pedagogical tact of the teacher, their ability to capture the attention and interest of pupils4Col%43.128.030.441.2
Test31141721
B C B
5 = Very importantCol%34.752.050.041.2
Test25262821
AA
Teaching methods used by the teacher to convey the content1 = unimportantCol%1.412.01.82.0
Test1611
A C D
2 = Of little importanceCol%11.126.01.82.0
Test81311
C DA C D
3Col%30.626.017.90.0
Test2213100
C
4Col%37.520.035.745.1
Test27102023
5 = Very importantCol%19.416.042.951.0
Test1482426
A BA B
Difficulty level of the subject2 = Of little importanceCol%5.610.016.113.7
Test4597
AA
3Col%19.436.032.123.5
Test14181812
A DA
4Col%36.122.025.031.4
Test26111416
B C
5 = Very importantCol%36.126.025.025.5
Test26131413
C
Implementation of digital technology/tools1 = unimportantCol%15.326.00.05.9
Test111303
DA D
2 = Of little importanceCol%15.310.012.55.9
Test11573
D
4Col%23.618.026.829.4
Test1791515
B
5 = Very importantCol%22.214.032.133.3
Test1671817
BA B
Organisation of pupils in the classroom1 = unimportantCol%1.44.012.517.6
Test1279
A BA B
2 = Of little importanceCol%5.612.08.917.6
Test4659
A C
3Col%38.948.030.49.8
Test2824175
DC DD
4Col%36.122.023.233.3
Test26111317
B C
5 = Very importantCol%18.114.025.021.6
Test1371411
B
Q9.TotalUnweighted Base72505651
perceived degree of difficultyCol%11.12.08.92.0
Test8151
B D B D
cognitionCol%44.432.021.431.4
Test32161216
B C D
solving work tasksCol%38.942.026.847.1
Test28211524
CC C
team work experienceCol%6.98.014.311.8
Test5486
A
pleasant atmosphereCol%25.022.016.13.9
Test181192
DDD
co-operative learningCol%13.916.07.17.8
Test10844
C
organisation at team levelCol%5.616.01.811.8
Test4816
A C C
interaction, interactivityCol%8.310.03.611.8
Test6526
workloadCol%8.34.00.00.0
Test6200
C C
YouTube with Geography content0.50 minCol%1.40.00.02.0
Test1001
DDD
1.00 hCol%22.214.019.631.4
Test1671116
B C
2.00 hCol%11.118.021.431.4
Test891216
AA B
3.00 hCol%4.28.00.02.0
Test3401
D
Digital encyclopaedias with Geography-related content0.0 hCol%81.982.080.470.6
Test59414536
DD
Eduboom, with Geography lessons/homework0.0 hCol%84.788.089.374.5
Test61445038
DDD
1.0 hCol%4.26.07.111.8
Test3346
A B
2.0 hCol%9.74.03.63.9
Test7222
C
Livresq with Geography-related content0.0 hCol%95.892.096.488.2
Test69465445
D D
1.0 hCol%2.82.03.67.8
Test2124
A B
Adservio0.0 hCol%97.288.087.576.5
Test70444939
1.0 hCol%2.82.08.99.8
Test2155
Digital Atlas0.0 hCol%84.788.094.654.9
Test61445328
DDA D
1.0 hCol%5.66.03.617.6
Test4329
A B C
2.0 hCol%5.64.01.819.6
Test42110
A B C
Table 5. Table of correlations between Google Earth Pro and research variables, 9th grade.
Crosstab/VariablesPearson CorrelationSig. (2-Tailed)
Study for the grade/to get the scholarship * Facilitates learning the fundamentals of physical and human Geography0.390 **0.001
Study for the grade/to get the scholarship * Is an easy to use application0.254 *0.031
Geography is an important subject in school and for the Baccalaureate exam * Is a modern and innovative digital tool0.267 *0.023
I enjoy learning, Geography, classes make me feel good * Is a difficult application to use0.241 *0.041
My family puts pressure on me to learn well * Facilitates learning the fundamentals of physical and human Geography−0.295 *0.012
Difficulty level of the subject * Is an easy to use application0.309 **0.008
Organisation of pupils in the classroom * facilitates learning the fundamentals of physical and human Geography0.318 **0.007
Improve your initial and specialised skills * facilitates learning the fundamentals of physical and human Geography0.255 *0.031
Improve your initial and specialised skills * creates a stimulating learning environment0.279 *0.017
A better understanding of the taught content * facilitates learning the fundamentals of physical and human Geography0.251 *0.033
Get better results in assessments * facilitates learning the fundamentals of physical and human Geography0.288 *0.014
Get better results in assessments * is an easy to use application0.292 *0.013
Manage your time more quickly within an hour * facilitates learning the fundamentals of physical and human Geography0.272 *0.021
Being more motivated and interested in learning Geography * facilitates learning the fundamentals of physical and human Geography0.334 **0.004
Tectonic plate motions: submarine ridges * facilitates learning the fundamentals of physical and human Geography0.370 **0.001
Phenomena associated with tectonic plate movement: volcanism * facilitates learning the fundamentals of physical and human Geography0.251 *0.034
Earthquakes—phenomena associated with tectonic plate movement * facilitates learning the fundamentals of physical and human Geography0.296 *0.012
Continental landforms (mountains, hills, bridges, plains) * facilitates learning the fundamentals of physical and human Geography0.368 **0.001
Continental landforms (mountains, hills, bridges, plains) * has a deeply practical and applied character0.297 *0.011
Analysing and interpreting relief (topographic profile, measuring distances, historical images) * facilitates learning the fundamentals of physical and human Geography0.316 **0.007
Genetic landforms: coastal relief * facilitates learning the fundamentals of physical and human Geography0.244 *0.039
*. Correlation is significant at the 0.05 level (2-tailed). **. Correlation is significant at the 0.01 level (2-tailed).
Table 6. Table of correlations between Google Earth Pro and the research variables, 10th grade.
Crosstab/VariablesPearson CorrelationSig. (2-Tailed)
Geography is an important subject in school and for the Baccalaureate exam * is a difficult application to use0.305 *0.031
I enjoy learning, Geography classes make me feel good * has a deeply practical and applied character0.331 *0.019
I enjoy learning, Geography classes make me feel good * creates learning situations that challenge the learner0.376 **0.007
I learn for my own personal and professional/career development * is an easy to use application0.361 **0.010
I learn for my own personal and professional/career development * creates learning situations that challenge the learner0.385 **0.006
I learn for my formation as a human being, as a future competent adult * is an easy to use application0.392 **0.005
I learn for my formation as a human being, as a future competent adult * is a modern and innovative digital tool0.303 *0.033
I learn for my formation as a human being, as a future competent adult* creates learning situations that challenge the learner0.336 *0.017
Teacher experience and seniority * facilitates learning the fundamentals of physical and human Geography−0.303 *0.033
Implementing digital tools * is an attractive digital tool with design and interface−0.307 *0.030
A better understanding of the taught content * is compatible with the study of geography0.294 *0.038
Apply what you’ve learnt * is compatible with the study of geography0.384 **0.006
Make correlations with other discipline * is an easy to use application−0.331 *0.019
Improve your STEM skills * is a difficult application to use0.333 *0.018
Consolidate the knowledge and content previously taught * is a difficult application to use294 *0.038
Develop critical thinking * is a difficult application to use0.312 *0.027
Conduct geographical investigations * is compatible with the study of geography0.349 *0.013
Conduct geographical investigations * creates learning situations that challenge the learner0.368 **0.009
Argue/explain various phenomena, processes specific to physical and human Geography * is an easy to use application−0.312 *0.027
Being actively involved in class * is a difficult application to use0.290 *0.041
Being actively involved in class * is an easy to use application−0.300 *0.034
Being actively involved in class * has a deeply practical and applied character0.312 *0.028
Manage your time more quickly within an hour * is an easy to use application−0.314 *0.026
Manage your time more quickly within an hour * has a deeply practical and applied character0.287 *0.043
Working in a team with colleagues * has a deeply practical and applied character0.336 *0.017
Population concentration—population density on the globe * is compatible with the study of geography0.450 **0.001
The consequences of population density ** is compatible with the study of geography0.417 **0.003
*. Correlation is significant at the 0.05 level (2-tailed). **. Correlation is significant at the 0.01 level (2-tailed).
Table 7. Statistically significant differences between the two experimental groups.
Variables9th Grade10th Grade
TotalUnweighted Base7149
What were the main benefits of using the Google Earth Pro software (due to the set of tools) in the teaching–learning process of Geography during Module 2?orientate yourself in spaceCol%66.285.7
Test4742
analysing geospatial data for educational purposesCol%33.849.0
Test2424
it also helps me in my daily life, not only for school purposesCol%32.446.9
Test2323
I have control over the information that I am analysing (the menu helps me to zoom in, to observe by hovering, the quote profile, the evolution over time)Col%53.540.8
Test3820
facilitate the digital switchoverCol%21.134.7
Test1517
What do you think about Google Earth Pro?is an easy to use applicationCol%69.454.0
Test5027
has a deeply practical and applied characterCol%38.954.0
Test2827
creates learning situations that challenge the studentCol%18.142.0
Test1321
Disclaimer/Publisher’s Note: The statements, opinions and data contained in all publications are solely those of the individual author(s) and contributor(s) and not of MDPI and/or the editor(s). MDPI and/or the editor(s) disclaim responsibility for any injury to people or property resulting from any ideas, methods, instructions or products referred to in the content.