


Abstract
The development of new principles for controlling the technical systems requires the use of reliable actuators. A sliding steel/steel contact under a high-density electric current could serve as one of their elements. The search for the factors reducing the wear of the contacts is a subject of scientific and commercial interest. One such factor is the melting that occurs within a sliding steel/steel electrical contact space. The overall goal of this study is to describe the characteristics of an M2 steel/steel sliding electrical contact during the formation of a melt-like state in the contact zone. Dry sliding of M2 steel (sample) against C45 steel (counterbody) under an alternating electric current at a density higher than 100 A/cm2 is performed as a model experiment using the well-known “pin-on-ring” tribo-loading configuration. The formation of tribolayers on the sample and the counterbody is demonstrated using a scanning electron microscope and a MICRO MEASURE 3D-station non-contact device. According to the EDX analysis, the contact layers predominantly contain oxygen and iron. Two sectors with different morphological features are observed on the M2 steel sliding surface. A melt-like state is visible in one of the sectors. This state is assumed to form within a certain sublayer. A method for calculating this sublayer thickness is proposed. This thickness does not exceed 10 μm. The calculation model has revealed that the thickness of this sublayer depends mainly on the external impact power rather than on the atomic and phase composition of the tribolayer. An increase in the contact current density is consistent with an increase in the calculated thickness of this sublayer, an increase in the electrical conductivity of the contact, and a decrease in the coefficient of friction (COF). The proposed analysis of the obtained results could serve as a basis for broader generalizations.
1. Introduction
Improving the tribological characteristics of friction pairs is a primary goal of tribological research. Low wear is observed when predominantly elastic deformation is achieved within the contact layers [1]. This condition can be realized by creating artificial high-modulus coatings on the contact surfaces, applying strong thermal pulses or using other methods [2,3,4,5,6,7,8,9]. However, all types of surface hardening decrease the thermal conductivity of the contact layers and their ductility. These factors can accelerate frictional fatigue with an increase in the external impact, particularly as the contact temperature increases. Therefore, it is of great scientific and practical interest to use materials that would dissipate the external energy through a good heat outflow, the changes in the structure of the contact layers, or the formation of tribolayers with improved characteristics.
In general, the formation of tribolayers serves as a mechanism for frictional energy dissipation. The formation of oxides within a tribolayer retards the wear quite effectively [10,11,12,13,14,15,16,17]. Oxides separate the contact surfaces, i.e., they act as lubricants. However, there are always certain critical values for the external impact parameters (e.g., contact pressure, sliding velocity, contact current density, etc.), beyond which the wear is catastrophic. Therefore, the critical values of the impact parameter have to be determined.
The above-mentioned processes in the friction zone are often observed in sliding electrical contacts. The current density (rather than the current) in a sliding electrical contact is one of the external impact factors capable of causing severe wear during dry sliding against metal. It should be noted that industrial (commercial) current-collecting materials are commonly used at the current densities lower than 60 A/cm2. In general, many friction pairs cannot maintain low wear at higher current densities due to their limited capacity for satisfactory energy dissipation and relaxation of the mechanical stresses within the contact layers. A sliding (metal/steel) electrical contact often generates relief on the contact surfaces, morphologically resembling a melt [18,19,20,21,22,23,24,25]. This melt is caused by electric arcing according to the conclusions of the previous studies [19,20,21,22,23,24,25]. However, sliding under the arcing conditions represents an emergency friction mode and is of limited scientific interest. On the other hand, the melt formation during sliding under high-density current under mild conditions with low wear is of greater interest. A steel/steel friction pair can serve as a model for the initial stages of research in this area. The main feature of steel/steel friction pairs is the formation of tribolayers on the contact surfaces [26,27,28,29]. The tribolayers primarily contain oxygen, iron, and carbon, as well as FeO and α-Fe phases. Furthermore, the contact zone shows the signs of a melt-like state in the form of a sublayer. The formal calculated thickness of this sublayer in a C235/C45 contact does not exceed 10 μm, when we use the model reported earlier [27]. It is of scientific interest to theoretically estimate the thickness of the melt-like state sublayer using this model [27] for friction pairs with different initial structures under different friction conditions, specifically by varying the pressure, speed, and other input parameters of a tribosystem with the current collection. Then, a comparative analysis of their contact zone parameters can be conducted and the general patterns can be identified. Very little information is currently available on this topic.
High-speed steels can serve as models for experiment in tribology and subsequent calculations of the melt-like sublayer thickness. These steels often exhibit low wear at elevated temperatures and have a large number of applications, in particular, in model friction units [2,3,4,5,6,30,31]. M2 steel has high hardness stability at the temperatures up to 650 °C [2,4,6], so its wear under the influence of heat would be low. However, it exhibits high wear in sliding under electric current [11]. Finding the reason for this and increasing the amount of information obtained in the model experiments can be useful in formulating the recommendations for a targeted search for friction pairs exhibiting low wear under high current density in dry sliding. The thickness of the melt-like sublayer in the M2 steel contact layer has not been so far calculated and the chemical composition of the tribolayer is currently unknown. Therefore, it is of scientific interest to determine these tribolayer parameters.
Wear intensity, contact electrical conductivity and contact current density at the onset of catastrophic wear can serve as indicators of the ultimate strength of the contact layers of a given friction pair. Current density is the main deteriorative factor of external impact. Therefore, the contact characteristics should be represented in terms of the current density. These dependences, some regular features, the contact layer structures of other materials and the melt have been presented in numerous studies (e.g., [11,18,29]). However, neither the thickness of the melt nor the melt atomic compositions have been addressed. An analysis of these parameters, corresponding to the onset of catastrophic wear for different friction pairs, will allow us to propose the ways to improve the respective tribological characteristics.
The purpose of this study is to obtain the initial information on the structure of the M2 steel contact layer, the ultimate current density in an M2 steel/C45 steel dry sliding electrical contact, on the melt-like state in the contact zone and to establish their relationship.
2. Materials and Methods
2.1. Materials and Their Characterization
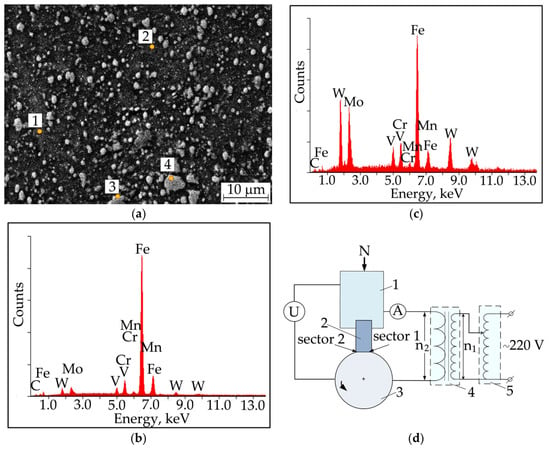
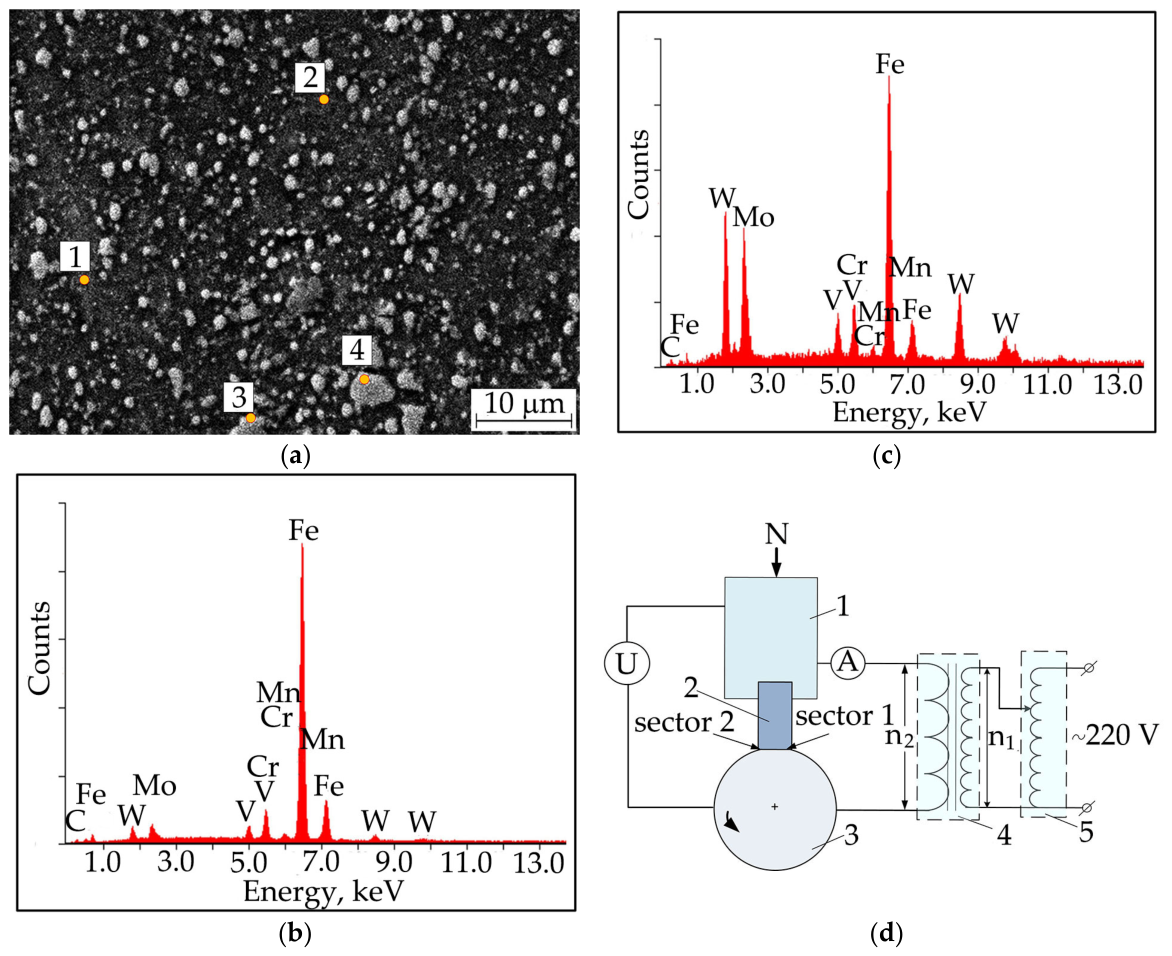
A current collection sample (pin) measuring 2.5 mm × 4 mm in the nominal contact area and a length of 10 mm was produced using commercial high-speed M2 steel (the steel composition is shown in Table 1), with the composite structure (Figure 1a–c).
Table 1.
Chemical composition of the original M2 steel and of its components in points 1–4 (Figure 1a).
Figure 1.
(a) Initial composite microstructure of M2 steel with quasi-spherical grains containing mainly WC, MoC and W3Mo3C; (b) EDX spectra for entire image (row 1 in Table 1) and (c) quasi-spherical carbide grain (point 3). Points 1–4 indicate locations of element concentration determination; (d) pin-on-ring configuration with sliding electrical contact (d): 1—sample holder, 2—M2 steel sample, 3—C45 steel counterbody, 4—supply transformer, and 5—autotransformer. Arrow indicates rotation direction.
This steel was quenched to the microhardness of Hμ1 = 8.6 ± 0.2 GPa (66 HRC). The commercial C45 steel (0.42 ÷ 0.50%) with the microhardness value of Hμ2 =5.8 ± 0.2 GPa (53 HRC) served as a counterbody (ring). The micrographs and EDX spectra of the M2 steel and C45 steel contact layers were obtained using a Quanta 200 3D scanning electron microscope (SEM; FEI Company, Hillsboro, OR, USA). A three-dimensional image of the counterbody transfer layer was obtained using the MICRO MEASURE 3D station apparatus (STIL, Melun, France). The Vickers microhardnesses (Hμ) of the experimental steels were determined by a TVM-5215-A hardness tester (ZIP, Ivanovo, Russia) under the loads of about 1 N. The X-ray diffraction (XRD) patterns of the worn surfaces were recorded with a DRON-7 X-ray diffractometer (Burevestnik, Saint-Peterburg, Russia) in CoKα radiation.
2.2. Tribological Measurements
The samples were tested in dry sliding under the alternating current collection (50 Hz) at a contact pressure of p = 0.13 MPa, a sliding velocity of v = 5 m/s applying a well-known pin-on-ring wear loading configuration (Figure 1d) at a turn ratio of k = n1/n2 = 62 of the supply transformer. The sliding distance for every friction regime was of D = 9 km. Prior to wear loading, the pin and ring were lapped against each other to set a good profile conformity between contact surfaces of the sample and counterbody. The linear wear intensity was determined as Ih = hd/D, where hd was the sample height variation per sliding distance D. The contact current density j was found as j = i/Aa, where i was the contact current (in the secondary winding circuit of the transformer) and Aa was the nominal area of the tribocontact. The surface specific contact electric conductivity was obtained as σA = j/U (U is the contact voltage drop). The friction coefficient (μ) values were found using a stress sensor (gauge) and simultaneously recorded and saved as data files. Each test was repeated 3 times for obtaining reproducible results.
3. Results
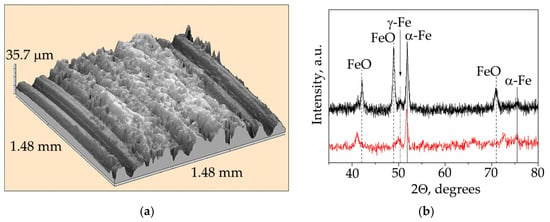
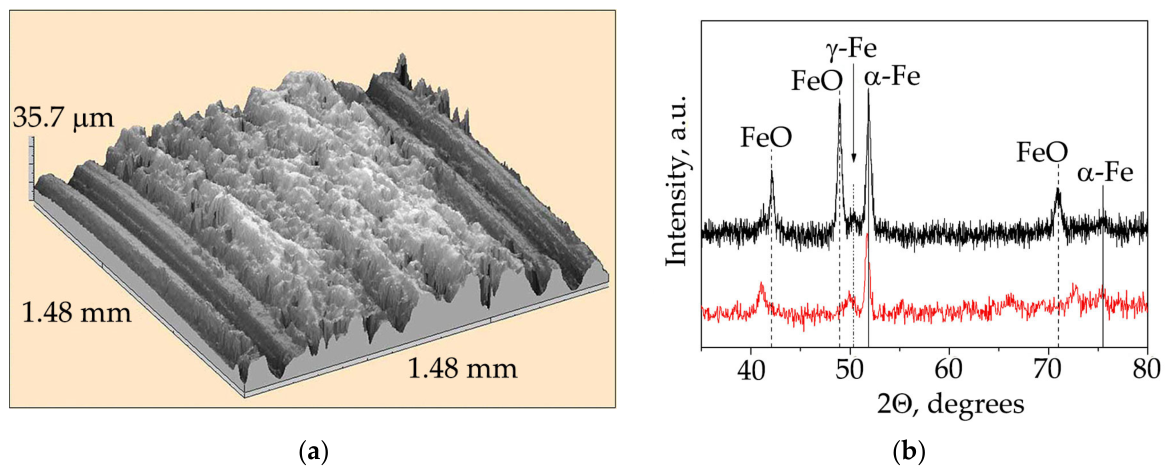
Studying the influence of the initial roughness of the contact surface on its failure may be of scientific interest. It is evident (Figure 2a) that the contact surface of the counterbody is coated with a transfer layer, despite a very high initial counterbody roughness (Rz > 100 μm, Figure 2a). The transfer process is capable of concealing the initial roughness of the counterbody surface and creating a functional coating with Rz < 35 μm (Figure 2a) in sliding under external current. This observation suggests that the initial preparation of the contact surface (roughness reduction, rinsing with acetone or alcohol, breaking in the contact surfaces, etc.) is not a mandatory procedure for tribological testing in the cases where plastic deformation of the contact layers occurs, i.e., where wear is observed. Plastic deformation of the contact layers is one of the ways of self-organization of the tribosystem, and the optimal roughness and hardness of the sliding surface are set by this tribosystem according to the given conditions of quasi-equilibrium friction. The XRD pattern (black curve) of a worn counterbody surface and of a worn sample surface (red curve) contain mainly the peaks of FeO and α-Fe phases (Figure 2b). FeO particles have different atomic compositions (Fe0.83O ÷ FeO) here. This leads to the FeO peak deviation from their tabulated positions in the XRD pattern (red curve). The concentration of γ-Fe is low and is not of interest for our discussion. The lattice parameters of the α-Fe and FeO phases (aFeO = 0.4301 nm and aα-Fe = 0.2888 nm) in the tribolayer differ slightly from those in the ASTM Standard database.
Figure 2.
(a) 3D image of the transfer layer on C45 steel contact surface after sliding at j = 300 A/cm2 per sliding distance of D = 7 km; (b) X-ray diffraction patterns of the worn surfaces of the C45 steel (black curve) and of the M2 steel (red curve).
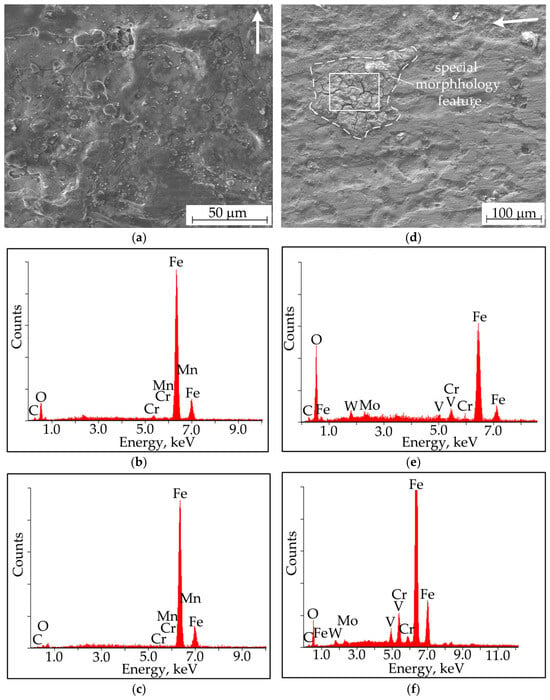
The counterbody sliding surface shows the signs of melt or weak interatomic interaction during contact (Figure 3a). This type of contact surface can be produced by a very viscous solidified liquid. The absence of adhesion and plowing traces is the main morphological feature of the steel counterbody sliding surface in sliding under current. The sliding surface contains mainly oxygen and iron (Figure 3b,c). The atomic concentrations of oxygen, iron, and carbon exceed the concentrations of other atoms (Figure 3b,c and Table 2). The main attention should be directed to the oxygen concentration, which is an indicator of FeO formation. Increasing the accelerating voltage in an electron microscope allows us to increase the penetration depth of electrons into the contact layer and obtain the element concentrations at a greater distance from the sliding surface. In the present case, the lower oxygen concentration (i.e., the FeO concentration) corresponds to a higher accelerating voltage and to a greater distance from the sliding surface. However, an observable decrease in the oxygen concentration does not imply the formation of a FeO concentration gradient in the contact layer.
Figure 3.
(a) SEM image of the counterbody worn surface and its EDX spectra, obtained at accelerating voltages of (b) 15 kV and (c) 30 kV; (d) SEM image of the special morphology feature on the counterbody worn surface and feature EDX spectra (in white rectangular contour) obtained at accelerating voltages of (e) 15 kV and (f) of 30 kV in sliding at j = 300 A/cm2. The arrow shows the sliding direction of the M2 steel.
Table 2.
Main chemical elements on worn counterbody surface, determined at accelerating voltages of 15 kV and 30 kV in sliding at j = 300 A/cm2.
It should be noted that the accelerating voltage of the electron microscope allows the electrons to penetrate to a depth (range) of RK-O (Table 2), which is determined by the Kanaya–Okayama equation [32]. The measurement depth, referred to here as the MD parameter, is the layer thickness, where the chemical compositions are determined and presented in the Tables of this article (MD < RK-O). The approximated MD values were determined using the Casino computer program and are provided for general information only. It is clear that X-ray spectral microanalysis allows the determination of element concentrations at the depths lower than 1 μm below the surface of iron-based materials.
It is known [2,4,6] that the contact layer structure may differ to a large extent in its different microvolumes. In the present case, the special morphological features can be seen on the worn counterbody surface (Figure 3d). These microregions have higher oxygen concentrations (Figure 3e,f and Table 2) compared to the ambient average concentration, which is shown in Figure 3b,c and Table 2. This means that they have accumulated a large amount of FeO particles. The cracks in different directions (Figure 3d) indicate a probable rapid cooling of the brittle material under the conditions of very high temperature gradients.
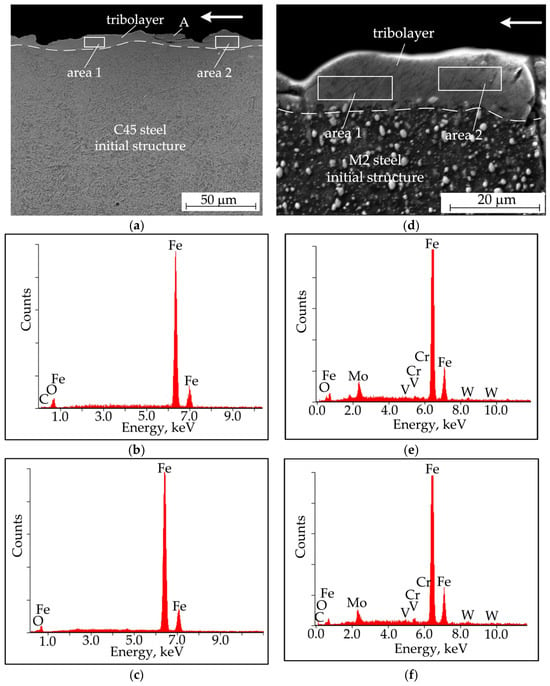
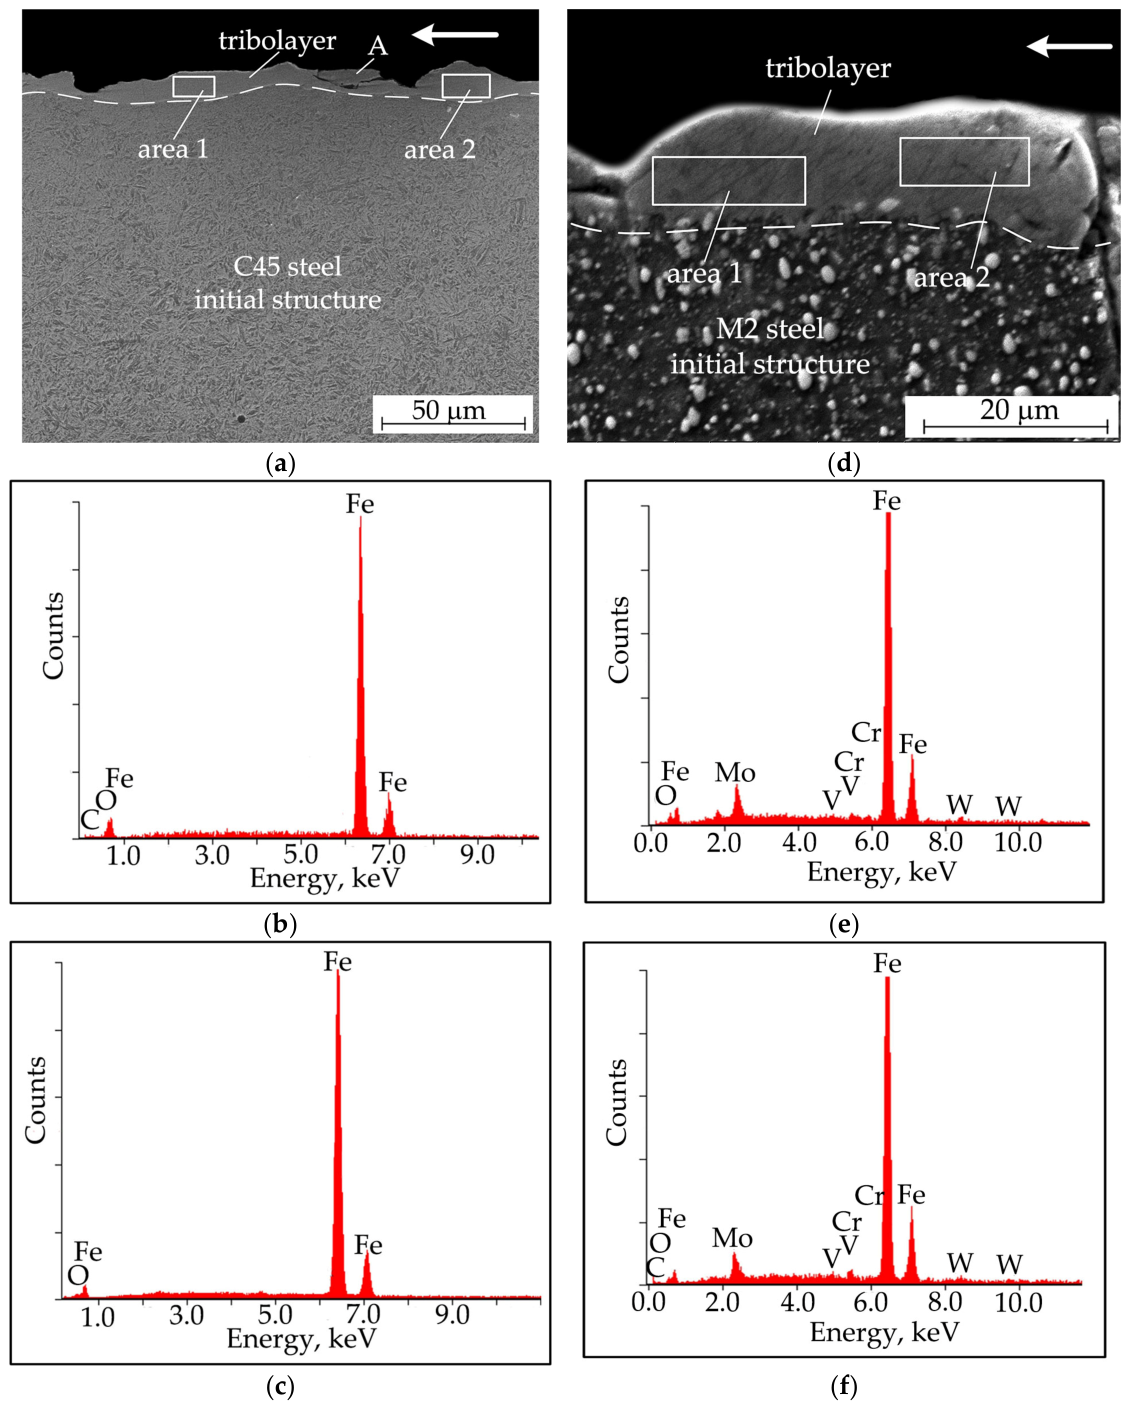
It is seen in Figure 4a that the cracks do not propagate deep into the tribolayer. It is also evident that the counterbody tribolayer adheres well to the C45 steel and its thickness varies within about 3–20 μm across the contact surface. This indicates its ability to fail in large microvolumes, causing high wear. Occasionally, cracks are observed to form parallel to the sliding direction.
Figure 4.
(a) SEM image of the cross-section of counterbody tribolayer and its EDX spectra for (b) area 1 and (c) for area 2 obtained at accelerating voltages of 30 kV in sliding at j = 300 A/cm2. The letter A (Figure 4a) shows the fragment delaminated from tribolayer. Arrow indicates the sliding direction of M2 steel. (d) SEM image of the cross-section of sample tribolayer and its EDX spectra for (e) area 1 and (f) area 2 obtained at accelerating voltages of 30 kV in sliding at j = 300 A/cm2. Arrow indicates the sliding direction of counterbody.
The tribolayer fragment marked with letter A (Figure 4a) has separated from the tribolayer during the metallographic sample preparation. This indicates that the layer is highly brittle, and the production of foil for TEM studies may be impossible. The low concentration of alloying elements in the tribolayer (Figure 4b,c) indicates their small-mass transfer from M2 steel to the counterbody sliding surface and seems to predominate in the transfer process. Also note the presence of carbon. Its concentration in the tribolayer (Table 3) is higher than that in the initial structure (Table 1). The content of oxygen in the counterbody tribolayer sharply varies across different microvolumes, and the concentrations of tungsten, molybdenum and other alloying metals within its depth are low (Table 3).
Table 3.
Main chemical elements on the counterbody tribolayer (Figure 4a), determined at accelerating voltages of 30 kV in sliding at j = 300 A/cm2.
Sliding of the M2 steel sample is also accompanied by the formation of a tribolayer, which adheres well to the initial M2 steel structure and contains no visible cracks (Figure 4d). No significant difference in oxygen content is observed in the bulk of the sample tribolayer (Figure 4e,f and Table 4). The concentrations of tungsten and molybdenum are also higher (Figure 4e,f) compared to those in the counterbody tribolayer. No significant difference in the oxygen concentration is observed across different sections of the sample tribolayer. This indicates that FeO is distributed quite uniformly throughout the tribolayer.
Table 4.
Main chemical elements in the sample tribolayer (Figure 4d), determined at accelerating voltages of 30 kV in sliding at j = 300 A/cm2.
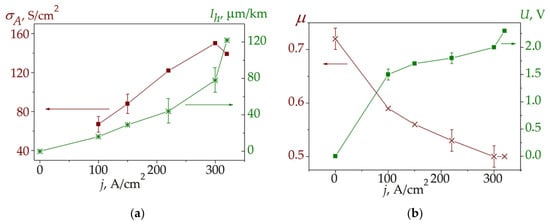
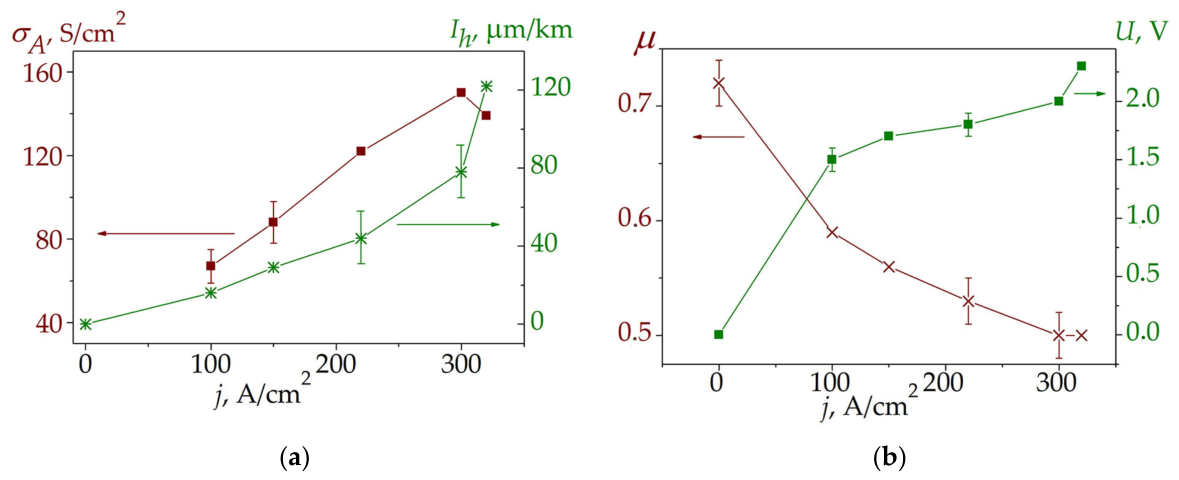
We believe that current density is the main factor causing fatigue and thermal failure of contact layers. An increased contact current density j causes an increase in wear intensity Ih and an increase in σA (Figure 5a).
Figure 5.
(a) Electrical conductivity (wine color curve) and linear wear intensity (green color curve) vs. current density and (b) friction coefficient (wine color curve) and contact voltage drop (green color curve) vs. current density. Arrows indicate correspondence of the curves and their ordinates.
The σA(j) curve has a positive slope at j < 300 A/cm2 while at j > 300 A/cm2 it has a negative slope, i.e., σA decreases (Figure 5a). At the same time, there is a sharp increase in Ih and an increase in U (Figure 5b), indicating the onset of catastrophic wear. This means that the wear occurring at j < 300 A/cm2 is mild. It is also clear that COF decreases with the increasing j and does not change its behavior at the onset of catastrophic wear (Figure 5b).
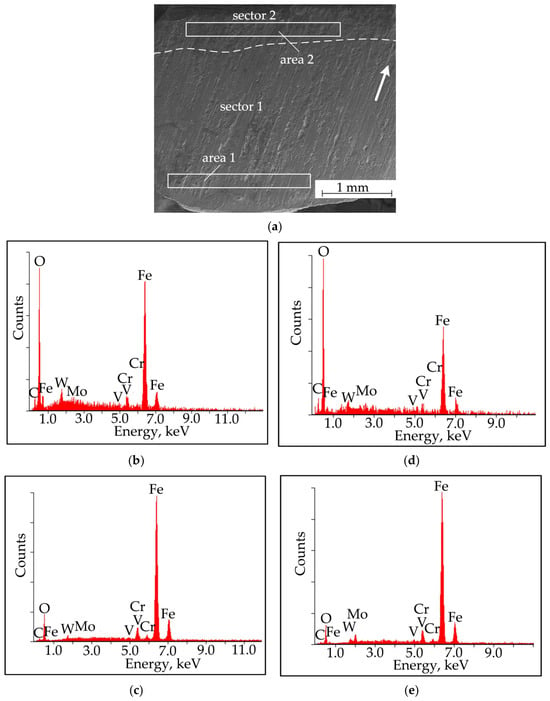
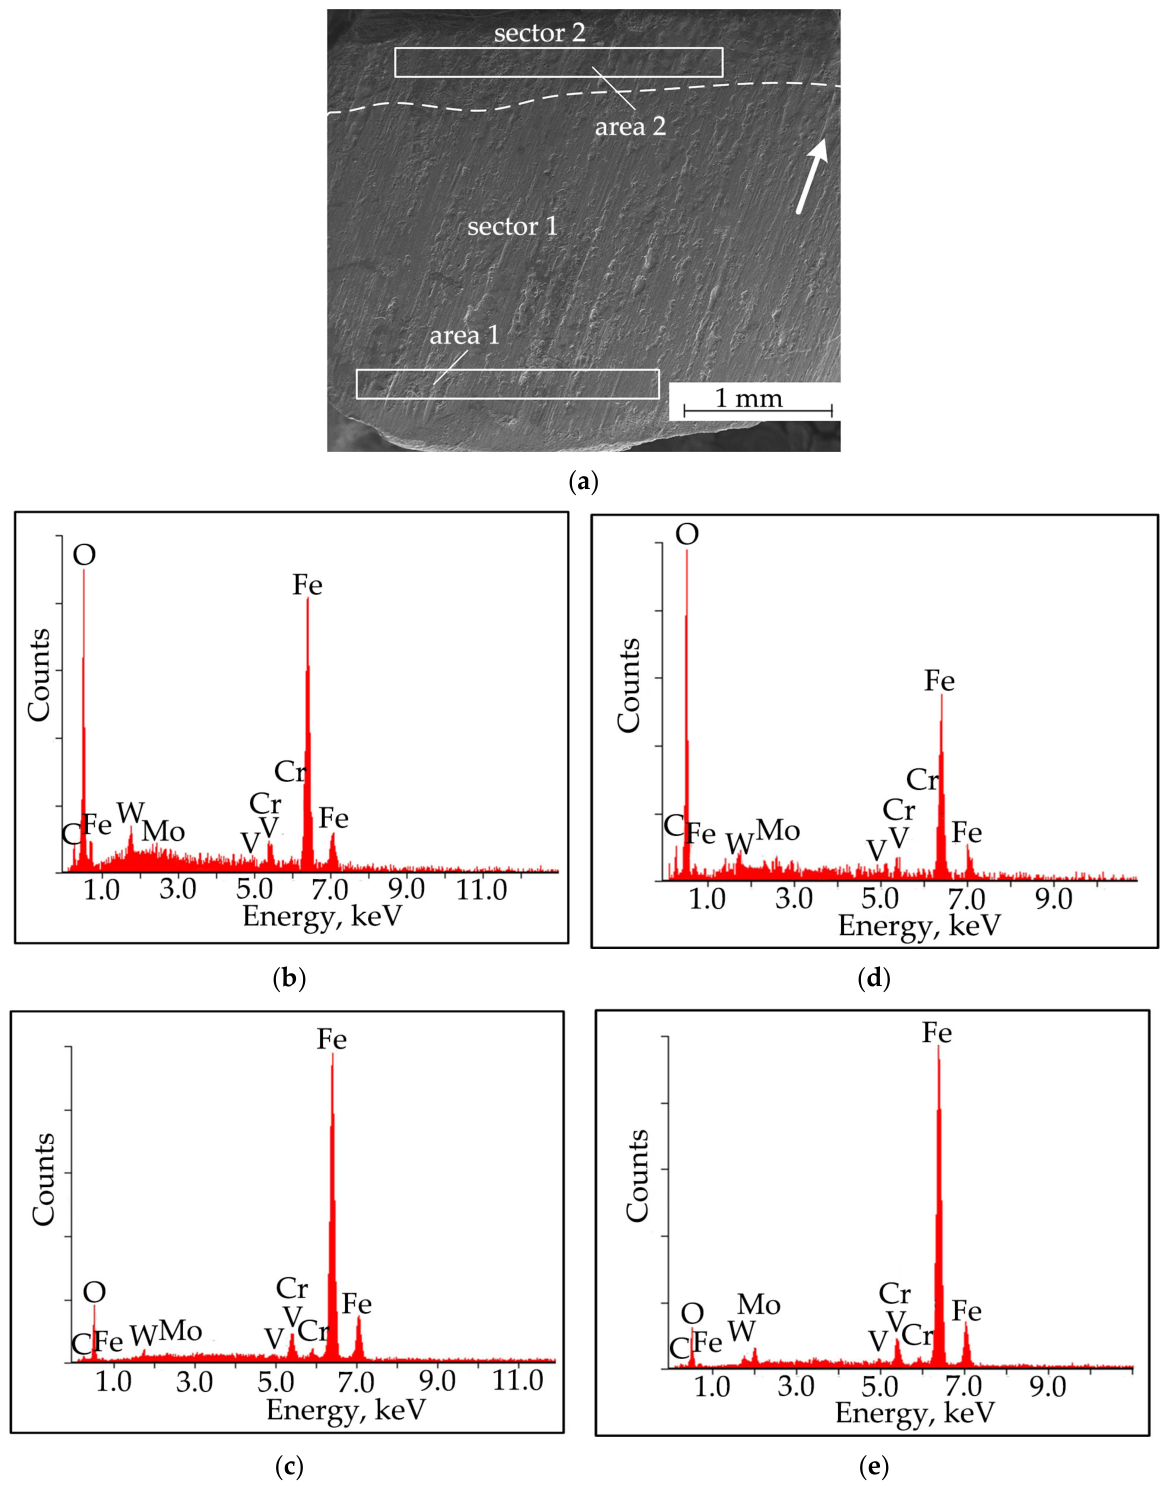
The sample wear has certain features, such as the division of its sliding surface into two morphologically different sectors (Figure 6a). The main morphological peculiarities (special features) in sector 1 (Figure 6a) consist of the contact surface plowing, adhesion and delamination, which is directed towards the movement of the counterbody contact surface (Figure 1d, leading part of the pin).
Figure 6.
(a) SEM image of worn sample surface in sliding at j = 300 A/cm2 (a). Arrow indicates sliding direction of counterbody. Dashed line approximately separates sector 1 from sector 2. EDX spectra of worn area 1 (sector 1) obtained at accelerating voltages: (b) 15 and (c) 30 kV. EDX spectra of worn area 2 (sector 2) obtained at (d) 15 and (e) 30 kV.
The other side of the sample contact surface (sector 2, Figure 1d, rear part of the pin surface) shows the signs of melt formation. These external signs of the sample worn surface are discussed in a number of works [11,18,28,29]. The contact surface of the sample continuously interacts with the counterbody. This primarily leads to continuous heating of the sample, to its stronger oxidation and more severe wear, compared with those of the counterbody. Table 5 gives the initial information on the chemical elemental content in these sectors based on the data from Figure 6b–e. It is evident that the oxygen concentration decreases with the increasing distance from the sliding surface, i.e., at higher microscope accelerating voltage. Furthermore, the oxygen concentration in sector 2 is higher than that in sector 1, implying that the amount of FeO in sector 2 exceeds that in sector 1.
Table 5.
Main chemical elements on worn sample surface, determined at accelerating voltages of 15 kV and 30 kV in sliding at j = 300 A/cm2.
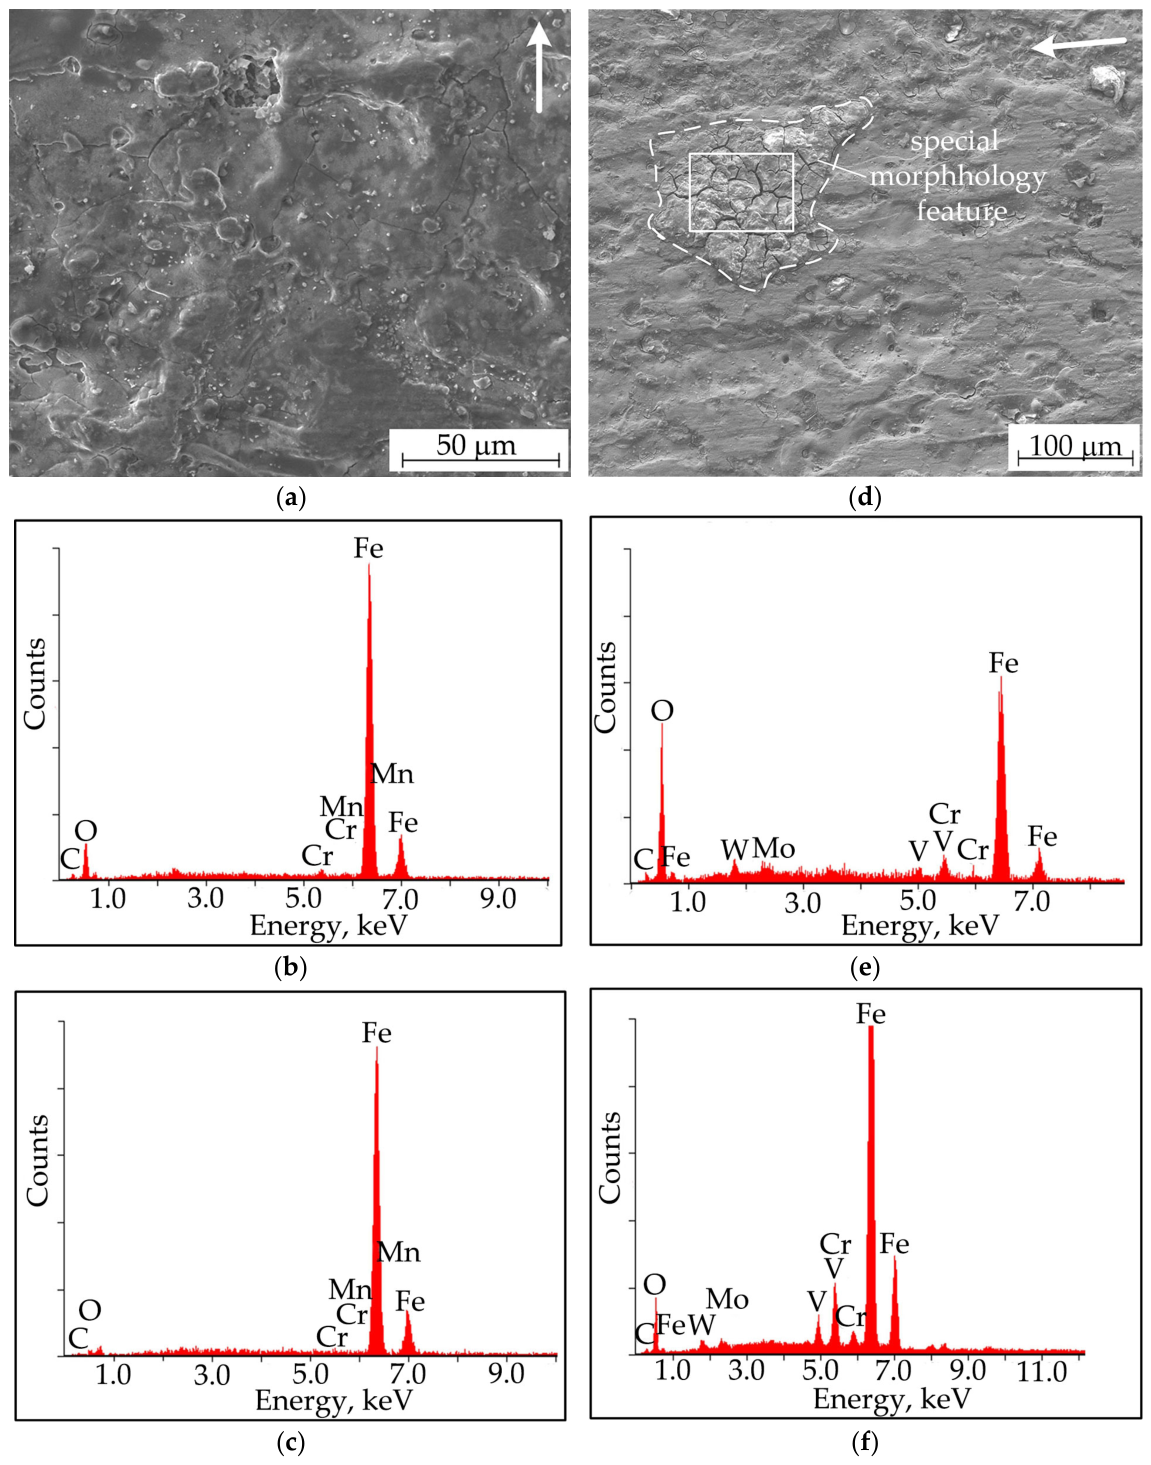
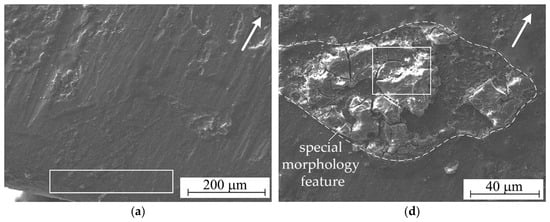
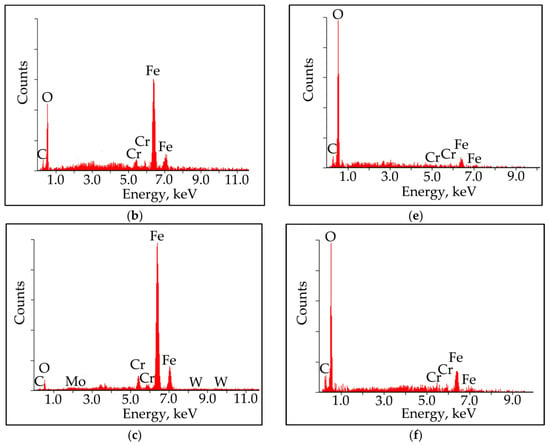
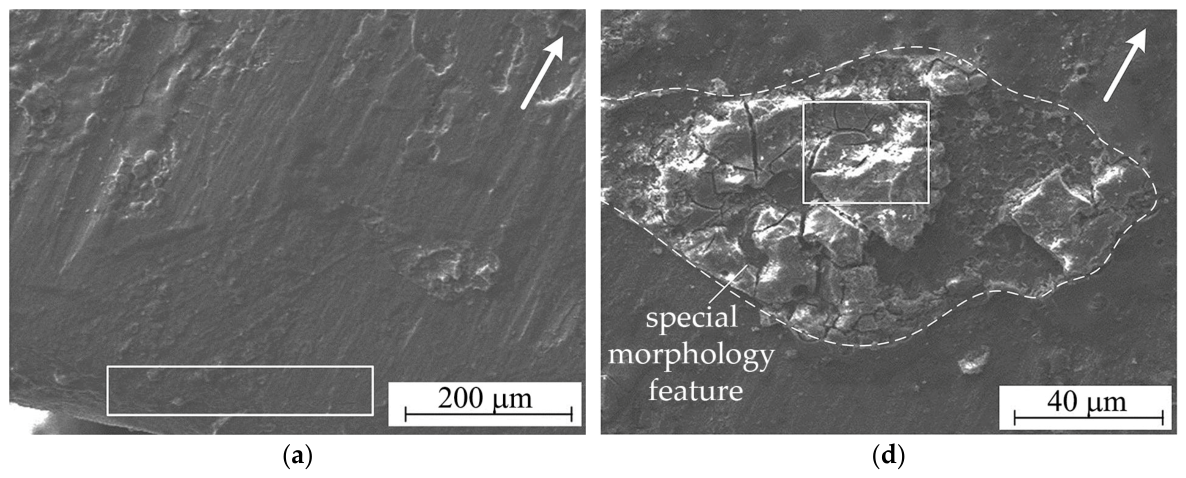
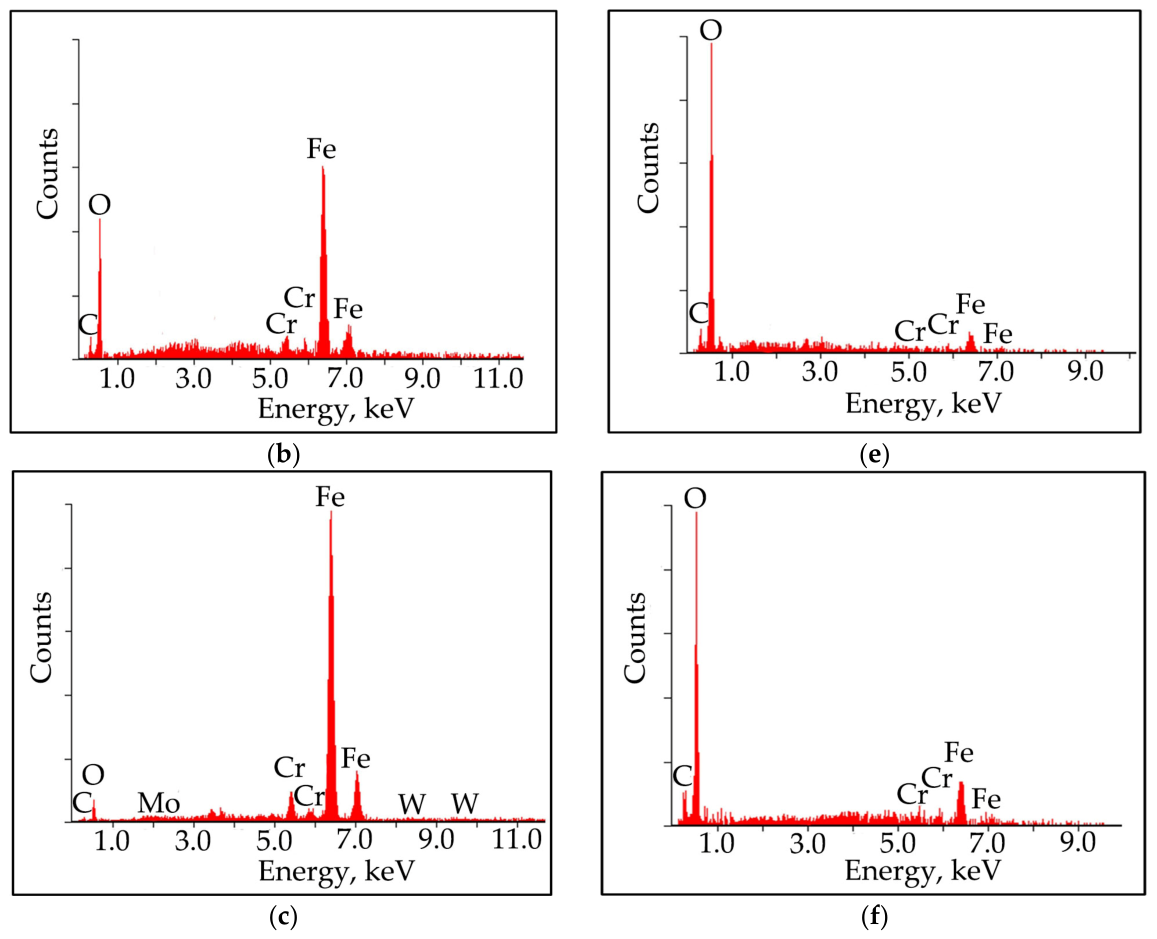
The chemical composition of the sliding surface with quite high roughness in sector 1 (Figure 7a) and the formation of morphological features on it (Figure 7d) should be studied in more detail. It is seen (Table 6) that any region of the worn surface in sector 1 contains mainly oxygen, iron, and carbon. The special morphological features (Figure 7d) have relatively high oxygen concentrations (Table 6) at the accelerating voltages of 10–30 kV. This indicates the formation of FeO particle clusters. Cracks in them can form under the influence of high temperature gradients and high local deformation rates of the contact layer.
Figure 7.
(a) SEM image of the sample worn surface in the sector 1 and its EDX spectra, obtained at accelerating voltages of (b) 10 kV and (c) 30 kV (in white rectangle). (d) SEM image of the special morphology feature on worn sample surface in the sector 1 and the EDX feature spectra obtained at accelerating voltages of (e) 10 kV and (f) of 30 kV in sliding at j = 300 A/cm2 (in white rectangle). Arrow shows the sliding direction of the counterbody.
Table 6.
Main chemical elements on worn sample surface (sector 1), determined at accelerating voltages of 10 kV and 30 kV in sliding at j = 300 A/cm2.
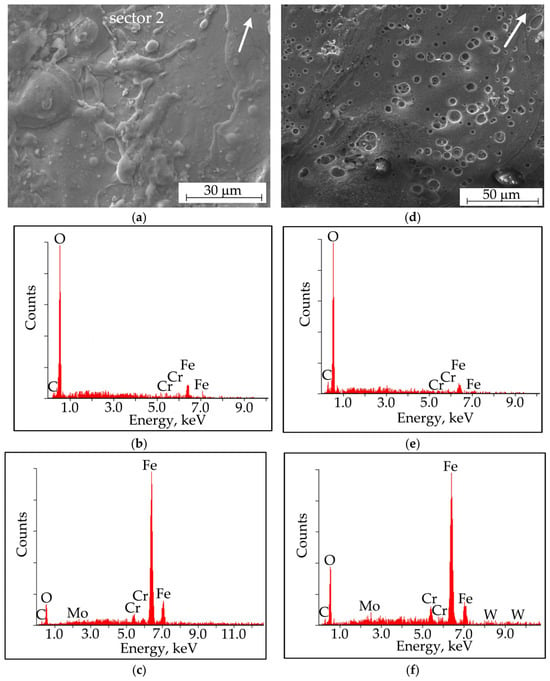
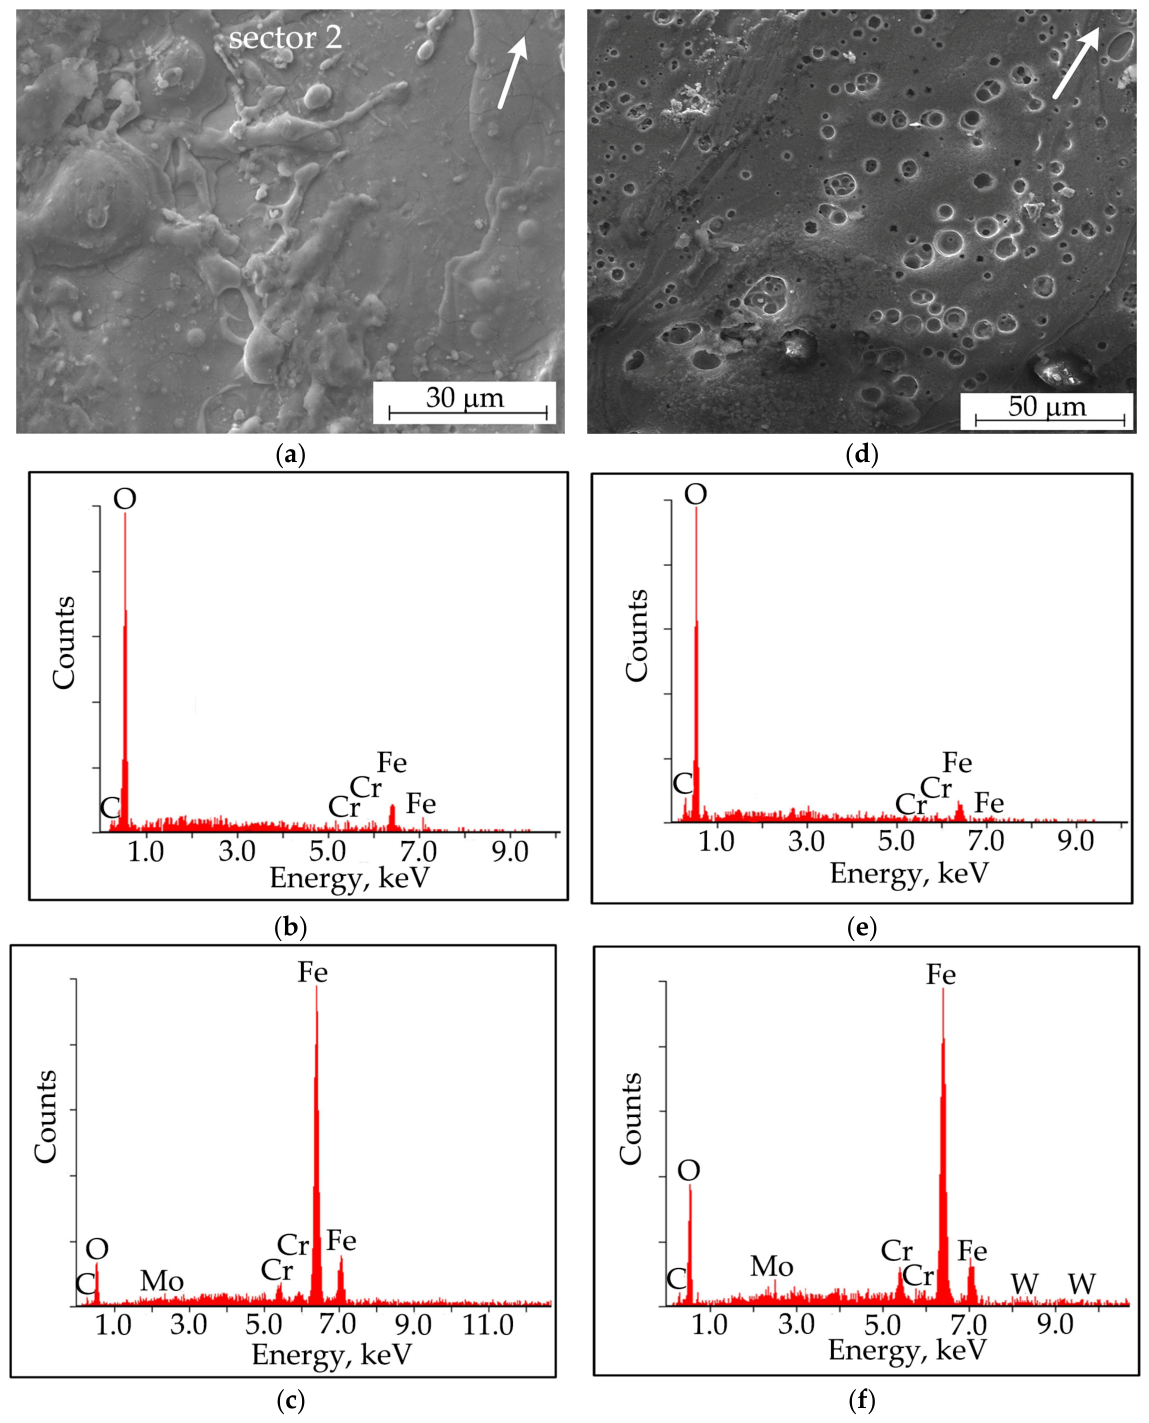
The worn surface in sector 2 has signs of melting in the regions between the middle of the nominal area and the rear part of the pin surface (Figure 8a). It has traces of electrical discharges. The worn surface contains a relatively large oxygen concentration (Figure 8b,c and Table 7). The surface of sector 2 near the rear edge of the nominal area has a melt-like appearance and clear traces of electrical discharges (Figure 8d). These features of the sliding steel/steel electrical contact and other changes in the structure of the contact layer cause the formation of a tribolayer on the contact surface of the sample (Figure 4d). Note that the oxygen concentration is quite high in sector 2.
Figure 8.
(a) SEM image of worn sample surface in the sector 2 and its EDX spectra, obtained at accelerating voltages of (b) 15 kV and (c) 30 kV; (d) SEM image of the special morphology feature on worn sample surface in the sector 2 and the feature EDX spectra obtained at accelerating voltages of (e) 15 kV and (f) of 30 kV in sliding at j = 300 A/cm2. Arrow shows the sliding direction of counterbody.
Table 7.
Main chemical elements on worn sample surface (sector 2), determined at accelerating voltages of 15 kV and 30 kV in sliding at j = 300 A/cm2.
Increasing the accelerating voltage in a microscope allows us to observe a decrease in the oxygen concentration, when we move from the sliding surface inwards the transfer layer (Table 7). The observed changes in element concentrations are not regular.
4. Discussion
One can see that the EDX spectra (Figure 1, Figure 2, Figure 3, Figure 4, Figure 5, Figure 6, Figure 7 and Figure 8) are similar to each other and can serve only as background illustrations containing little information. The main information (atomic concentrations) is in the tables corresponding to the EDX spectra. Different oxygen concentrations, i.e., different FeO concentrations in different sectors of the sliding surface indicate that there is no need to obtain XRD patterns from the entire worn surface for calculating the FeO volume concentration, as was done earlier [11]. These XRD patterns allow one to reveal only the phases as such in the contact layer after friction. These phases sometimes melt during the contact. The mechanism for the melt formation was proposed elsewhere [11]. It was assumed that FeO particles melt firstly due to a large displacement of Fe2+ and O2− ions from their equilibrium positions (electrostriction of the FeO crystal lattice), an ion release from the crystal lattice nodes and a formation of free Fe2+ and O2− ions, which form the melt. A sharp ion displacement in the FeO lattice (i.e., deformation and polarization) could be induced by strong pulses of the electric induction vector, which would arise due to self-induction pulses during sliding in the stick-slip mode. In other words, the self-induction pulses have to generate a high rate of change in the electric induction vector, which would drive ions from the lattice nodes into the melt. Theoretically, this could have been realized, should the medium being polarized contain only bound charges. However, the data in Table 2, Table 3, Table 4, Table 5, Table 6, Table 7 and Table 8 suggest no polarization of the medium, despite the high FeO content. Furthermore, the electrostriction typically manifests itself as elastic deformation, and a high rate of change in the electric induction vector cannot cause any deterioration or melting of the crystalline dielectric.
Table 8.
Physical properties of crystalline FeO and α-Fe phases.
In this work, we focus the attention on the stick stage of contact spots. Its duration represents the contact spot lifetime. The real contact area can be presented as Ar ≈ N/Hμ under the condition of plastic deformation of a softer material in the contact layer. The contact between two rough surfaces can be stable in the case where the number of contact spots is n ≥ 3. Assume that Ar consists of n contact spots shaped as squares with sides of bn. Then Ar = n × bn2. Hence, bn = (Ar/n)0.5 = 8.6 μm for n = 3. Such linear sizes of contact spots are common in many friction units [1]. The average time of the counterbody asperity movement along such a contact spot is tn = bn/v ≈ 1.7 × 10⁻⁶ s for n = 3 (time of elementary contact, stick stage). It was previously supposed [11] that such a short duration of the electrical pulse could cause a self-induction pulse capable of triggering the melt formation mechanism in the contact spot. However, the electrical circuit (Figure 1d), containing inductive and electrical resistances (LR circuit), has a self-induction time constant: ts = L/R ≈ 10−3 s. This means that we can write the inequality tn << ts, indicating no self-induction due to the stick-slip sliding mode. Therefore, one has to address some other ways of melt-like formation, for example, melting due to the Joule heat influence. It should be noted that the melt formation in Figure 8 is only perceived as such and cannot serve as sufficient evidence to guarantee the melt formation. Therefore, it seems reasonable here to discuss the formation of a melt-like sublayer. An estimation of the height of this sublayer is presented below, where the calculation is based on melt formation in the contact spots. Therefore, the term melt will be used throughout the text.
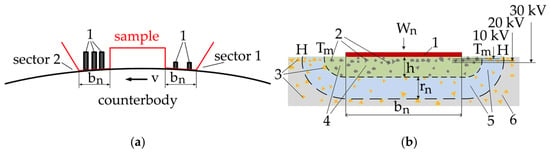
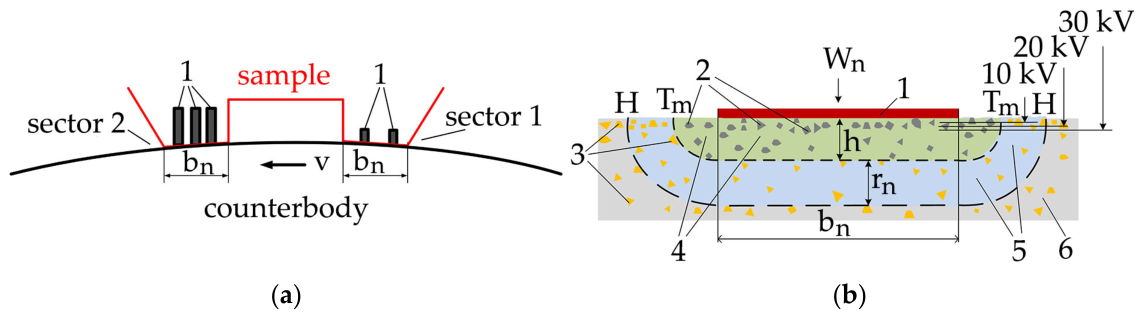
It is necessary to assume that the external energy Q0 = (iU + μNv)t (i.e., Joule heat and friction energy, where i = jAa) is absorbed by the real contact area Ar during time t in the stick stage. The energy Q0 is spent on heating and melting the contact layers of the sample and the counterbody during the stick stage. In this case, we have a steel/steel contact, so the contact layers of the sample and the counterbody exhibit approximately the same thermal conductivity and receive approximately the same energy, namely, 0.5 Q0. In general, Ar is the mechanical contact area. Typically, current can flow only through a certain portion of Ar. Therefore, the conductive area is usually smaller than Ar. The melt microvolumes on the conductive area in the contact spot zone are designated by digit 1 in Figure 9a. Here, the contact spot volume contains the melt and the partitions between melt microvolumes. These partitions consist of the FeO + M2 steel. Normal mechanical loads in the leading part of the pin (in sector 1) always have higher values compared to those in sector 2. This causes high wear of the contact material in sector 1. In addition, sector 1 interacts with the counterbody surface containing crystalline FeO. Therefore, sector 1 has some traces of abrasive and adhesive wear (plowing, etc.). Under these conditions, the current through sector 1 is expected to be small and the melt would fail to form in large volumes. Furthermore, it is clear that the abrasive (FeO) of the counterbody intensively shears the contact material of the sample in sector 1. Therefore, the contact spot has to contain a small number of smaller-size melt microvolumes in sector 1 (Figure 9a). It can be assumed that sector 2 has a higher temperature at a higher current density compared with those in sector 1. Therefore, sector 2 would contain a melt volume exceeding that in sector 1. This may be seen in Figure 9a showing relatively large melt microvolumes 1 and a larger number of conductive microspots in sector 2. Any contact spot volume with a linear dimension of bn can be deteriorated due to crumpling of the partitions between the melt microvolumes and the resulting melt + FeO + M2 steel mixture shown in Figure 8. The proposed description of the simultaneous formation of two sectors with different mechanisms of deterioration of the sample contact surface is based on the principle presented elsewhere [27].
Figure 9.
(a) Melt in contact spots located in different sectors (bn is the linear size of contact spot). Arrow shows the rotation direction, red line shows the sample contour; (b) schematic image of tribolayers structure near contact spot: melt in contact spot vicinity (green, h—melt thickness) and zone of heat outflow (blue) from internal boundary (Tm-Tm) of melt to tribolayer (1—contact spot, 2—molten FeO particles, 3—solid FeO particles, 4—M2 steel melt, 5 and 6—solid M2 steel. H-H—boundary of thermal front propagated via distance rn in time tn).
It also seems necessary to discuss a possible mechanism of the melt formation on the contact surface. Here, we primarily assume that the current flows through the entire Ar (Figure 9b). This approximation is convenient for estimating the melt height. The energy of 0.5 Q0 is distributed between n contact spots. The energy is Qn = Wn·tn for one contact spot, where Wn is the external impact power on a single contact spot. It is given by
where Wout is the heat outflow power from the melt to the contact layer. Each point of the contact spot creates a hemispherical thermal front directed to the tribolayer. As a result, the microvolume Vm0 containing the melt should have the shape limited by a Tm-Tm contour in the vicinity of contact spot (Figure 9b).
Wn = 0.5(iU + μNv)n−1 − Wout,
The power Wout can be found using Fourier’s law q = −λ·grad T = Wout/Sn. Here, q is the heat flux density (i.e., heat outflow) with a frontal surface (designated as H-H, Figure 9b), λ is the tribolayer thermal conductivity, and grad T is the temperature gradient existing between the melt surface (designated as Tm-Tm, Figure 9b) and the surface of the H-H heat removal front. The distance rn between these surfaces can be most easily estimated as rn = (3a·tn)0.5, where a is the thermal diffusivity of the tribolayer. This derivation of rn is convenient since the temperature on the surface of the H-H heat outflow front may be presented as TH-H ≈ 0.95 Tm. Then grad T = (Tm − TH-H)/rn =0.05 Tm/(3a·tn)0.5 and q = Wout/Sn, where Sn is the surface area of the H-H heat outflow front and Tm is the melt temperature. We can obtain from this
Wout = 0.05λSnTm/(3a × tn)0.5,
An increased number of contact spots would decrease the contact spot size, i.e., parameters Sn and tn and also cause a decrease in Wout. This means that the maximum heat outflow from the contact spot will be at n = 3, and it is of interest to find Wout. Here a = λ/C·d, where C and d are the average heat capacity and density of the tribolayer, respectively. The heat outflows into the tribolayer having a FeO + M2 steel composition and the parameter values (λ, C and d) of such a composite can be calculated as the average λ ≈ cv1·λ1 + cv2·λ2, C ≈ cv1·C1 + cv2·C2 and d ≈ cv1·d1 + cv2·d2, where cv1 and cv2 are the volume concentrations of FeO and M2 steel. In melt volume Vm0, the latter volume concentrations of FeO and M2 steel in the volume can be obtained using the EDX data (Table 6). We should write the usual equality cv-i = Ni·VA-i/∑ Ni·VA-i and bring it to the form
where Ni is the number of atoms of the i-th element, ca-i is the atomic concentration of the i-th element, and VA-i is the atomic volume of the i-th element in the crystal lattice with parameter ai. In particular, the iron (Fe1) and oxygen atoms have the average volumes in FeO (8 atoms in the crystal lattice cell) according to VA-Fe1 = aFeO3/8 = 10 × 10−30 m3 = VA-O and the atomic volume of iron (Fe2) in the steel VA-Fe2 = aα-Fe3/2 = 11.8 × 10⁻³⁰ m3 (α-Fe, 2 atoms in the crystal cell). It should be taken into account that all alloying atoms would be present in the steel melt (Fe2), which has a chemical composition close to that of M2 steel after sliding. Therefore, for calculation one should use the following equality:
cv-i = ca-i × VA-i/∑ca-i × VA-i,
ca-Fe2 = ca-Fe + ca-W + ca-Mo + ca-Cr + ca-V + ca-C − ca-O.
It is necessary to take into account that the parameters h and rn may have dimensions significantly exceeding RK-O (Table 3 and Table 4). Therefore, the atomic concentrations ca-Fe obtained within RK-O values on the sliding surface are inapplicable here. The atomic concentrations ca-Fe for the cross-section (Table 3 and Table 4) must be inserted into formula (4). From this, cv-Fe2 and cv-FeO = 2cv-O can be found. Some reference data are presented in Table 8.
The area Sn of the heat outflow front can be represented as Sn = bn2 + 2π(hs + rn)bn (Figure 9b). If we assume h = 10 µm (this should exceed the real melt layer thickness) and present Sn in a simpler form (Sn = (Ar/n) + 2π(Ar/n)0.5(rn + hs)), then we can obtain Wout ≈ 0.3 W. However, the external impact power can have values larger than 10 W, i.e., Wout is a comparably low value and does not always significantly affect the thermal state of the contact spot. The external impact energy can be written as Qn = Wntn in the contact spot or, more accurately, as
Qn = [0.5(iU + μNv)n−1 − Wout]Ar0.5/vn0.5.
This energy Qn is directed to creating a melt in the contact spot. Therefore, we can write
where Tm1 and Tm2 are the melting temperatures of FeO and M2 steel, respectively; T is the average temperature of the tribolayer under a given friction regime (T ≤ 350 °C [29]); Λ1 and Λ2 are the specific heats of melting of FeO and M2 steel, respectively; d1 and d2 are the densities of FeO and M2 steel, respectively; V1 and V2 are the volumes of FeO and M2 steel melts in the vicinity of the contact spot, respectively. We can write the phase volumes as V1 = cv1Vm0 (FeO) and as V2 = cv2Vm0 (M2 steel), where Vm0 is the volume of the melt in the vicinity of the contact spot (Figure 9b). Then we can obtain from Equations (5) and (6) for one contact spot
where A0 = [C1·(Tm1 − T) + λ1]d1cv1 + [C2·(Tm2 − T) + Λ2]·d2cv2. The melt microvolume can be presented in accordance with Figure 9b, i.e., Vm0 ≈ bn2 h + πh2bn, where h is the melt layer thickness. Equations (5)–(7) allow us to write the general form of the equation for calculating the melt thickness h
Qn = [C1(Tm1 − T) + Λ1]d1V1 + [C2(Tm2 − T) + Λ2]d2V2,
Wntn = A0Vm0,
πA0Ar0.5h2 + A0Arn−0.5h − [0.5(iU + μNv)n−1 − Wout]Ar0.5v−1 = 0.
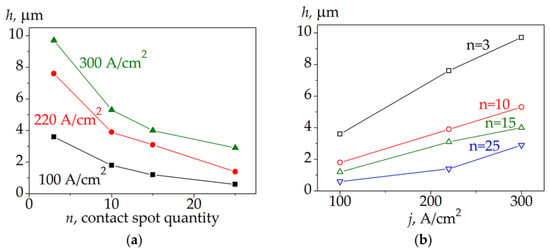
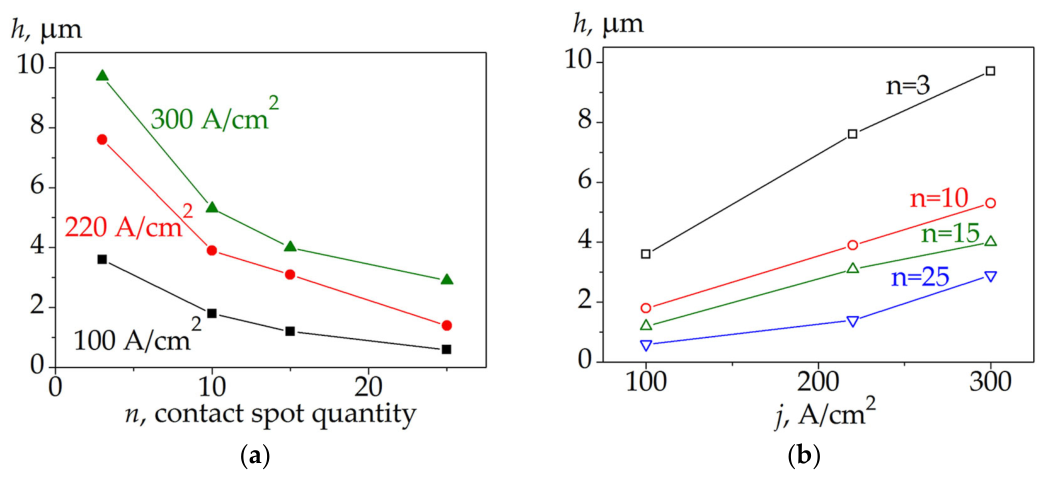
The energy of the external impact on the contact spot (the last term in Equation (8)) can be written using the data from Figure 2. Equation (8) is the ordinary quadratic equation and its solution looks like h ~ n−0.5, i.e., h decreases with the increasing n (Figure 10a). It is also seen (Figure 10b) that h increases with increasing current density. It should be noted that h has only a formal value, since the proposed calculation allows us to find the melt volume at a certain value of Ar only. In reality, the melt would be distributed between the contact surface asperities. Then Ar would increase and h would decrease. Therefore, this thickness is a conventional (conditional) parameter.
Figure 10.
Melt layer thickness dependence: (a) on the contact spots quantity and (b) on the contact current density.
The thermal friction problems are solved under the assumption that the temperatures of the sample and counterbody in contact are equal. This cannot be verified experimentally. Therefore, it can be assumed that the thermal conditions in the contact spot between the counterbody and the sample are different, and the temperature on the sliding surface of the larger counterbody may be lower compared to that of the sample. In this case, the contact material of the counterbody can only be in a highly plastic state, but not in the form of a melt in the contact zone (Figure 3). In general, one can assume different viscosities of the sample and counterbody layers at the moment of contact.
Obviously, a decrease in the heat outflow Wout would lead to an increase in the thickness h of the melt-like layer. The heat removal from the contact spot (Wout ~ λSn (Equation (2)) can be reduced by decreasing the factor Sn = (Ar/n) + 2π(Ar/n)0.5(rn + hs), containing the would-be height hs of a probable melt-like layer. Therefore, a decrease in hs leads to a decrease in Wout and to a corresponding increase in h. It is evident (Table 9) that decreasing hs within reasonable limits causes an insignificant increase in h at a contact current density of j ≤ 300 A/cm2 and at any n. This indicates an insignificant effect of Wout on the value of h due to a change in hs. The heat removal can also be reduced by decreasing the thermal conductivity λ (Formula (2)). It is evident (Table 9) that setting Wout = 0 W (at λ = 0 W/m K) leads to an insignificant increase in h. An increase in Wout due to an increase in λ would lead to a decrease in h. High λ is realized in the case of using the materials with a low content of alloying elements. The use of unalloyed low-carbon steel (λ = 55 W/m K) can serve as a theoretical example. It is evident (Table 9) that a fairly high λ does not cause any significant decrease in h. This means that the chemical and phase compositions of the contact layer weakly affect the values of h. It can then be concluded that any error in determining the concentration of any element will not cause a significant error in the calculated h. It should be noted that this conclusion is made only on the basis of the proposed formalism. But it may well be observed in reality. This indicates the need for further research. The external impact power affects h much more significantly. Obviously, setting a certain low current power will result in a very small melt-like layer thickness, with virtually no melt. This case (0.5(iU + μNv)n−1 < Wout) is presented in Table 9 for j = 100 A/cm2 and n = 25, which is similar to sliding without current. This means that there must be some minimum energy in the contact spot that would cause melt-like state formation. Obviously, other conditions exist for the melt-like state formation, but discussing them here is not reasonable.
Table 9.
The influence of heat outflow parameters (hs, λ) and current density on the calculated height (h) of the melt in the contact spot.
Generally speaking, a change in the structure of a system is the way to dissipate the external energy. The melt in the contact zone of a tribosystem with current collection is a type of dissipative structure that exists only under nonequilibrium conditions during an external impact and disappears when this impact ceases. A no-zero sliding velocity is a mandatory requirement. Some of the melt is likely to flow in between the contact asperities at the moment of contact, i.e., it does not leave the nominal contact area in the form of wear particles and does not increase the wear. It should be noted that the current power in a sliding contact can significantly exceed the friction power μNv. The absence of a melt during sliding without a current indicates a low energy density in the contact spot or the impossibility of concentrating the thermal energy in the contact spot due to variations in the friction parameters μ, N, v. Therefore, the contact surface in sliding without current is primarily deteriorated by the abrasive or adhesive mechanisms. It is obvious that the melt formation depends on many factors, primarily on the initial structure of the contact materials. It is expected that the materials with a complex initial structure (a large number of phases or chemical elements, high-entropy materials, intermetallic compounds, etc.) are not capable of exhibiting low wear in dry sliding under high-density current due to low thermal conductivity, low ductility and high electrical resistance. These parameters play the main roles in the formation of arc discharges. It should be noted that an arc can only exist as a stable gas discharge in a stable gap between the anode and the cathode. These two conditions are not met in a sliding contact. Therefore, only discharges can occur in the sliding zone. The materials with a complex initial structure are not always capable of forming the oxides in the contact zone. The surfaces without oxide strengthening deteriorate quite rapidly. However, this has to be determined experimentally. It should be noted that FeO in the contact layers of M2 steel is in a liquid-like state and is not capable of strengthening the surface mechanically, which was reported in numerous studies [8,11,13,33].
Probably, the melt-like layer acts as a lubricant. However, this supposition requires a special study. It is also clear that the initial high hardness and high heat stability of M2 steel tend to zero due to the melt-like state formation and do not contribute to the wear reduction. This study merely demonstrates that the melt formation is possible and that the melt is a dissipative structure likely to relax stresses and reduce wear. This self-organization of the contact layer may be described without arc discharges. No significant electrical erosion is observed here; only small discharge craters are seen to form on the resulting melt (Figure 8b).
The proposed method for estimating the melt layer thickness h is based on the Joule heat localization on the real contact area and is applicable to sliding with low electrical erosion against a steel counterbody. Clearly, there is a need to generalize these results and discuss sliding against counterbodies with different initial structures (e.g., copper, stainless steel, etc.). These cases are of great interest and significance; they have been poorly studied for dry sliding under high (over 100 A/cm2) current densities but should be the subjects of future studies.
5. Conclusions
Dry sliding of an M2 steel sample against a C45 steel counterbody has been performed under the impact of a high-density electric current. The following results have been obtained:
- The M2 steel is transferred to the contact surface of the counterbody. This causes the formation of tribolayers on the M2 steel and the counterbody. The tribolayers consist mainly of the α-Fe matrix and the FeO particles.
- Two sectors with different signs of failure are revealed on the sliding surface of M2 steel. One sector is worn abrasively, while the other sector shows the signs of melt formation. The counterbody sliding surface shows the signs of melting only.
- The sliding surfaces of the M2 steel sample and the counterbody contain the agglomerates of FeO particles. The agglomerates are of different sizes (smaller than 100 μm).
- The oxygen concentration decreases with moving out from the sliding surface into the tribolayers of the M2 steel sample and the counterbody. This is caused by a decrease in the concentration of FeO particles, rather than the formation of a gradient structure.
- The melt-like state formation may be described using the Joule heat only. This state is in the layer whose calculated thickness is smaller than 10 μm, which was estimated using the elementary physics and EDX analysis.
Author Contributions
M.I.A.: Methodology, writing—original draft, conceptualization; V.V.F.: Writing—review and editing, investigation and supervision. All authors have read and agreed to the published version of the manuscript.
Funding
The study was carried out within a state task of the ISPMS SB RAS, project No FWRW-2026-0001.
Data Availability Statement
The original contributions presented in this study are included in the article. Further inquiries can be directed to the corresponding author.
Conflicts of Interest
The authors declare no conflicts of interest.
References
- Kragelsky, I.V.; Dobychin, M.N.; Kombalov, V.S. Friction and Wear Calculation Methods; Pergamon Press: Elmsford, NY, USA, 1982; pp. 6–7. [Google Scholar]
- Wei, Y.; Zhang, Y.; Chu, X.; Yang, S.; Wang, J.; Jia, W.; Zhu, J.; Liu, S. Enhanced red hardness through fine carbides in M2 high-speed steel fabricated via electron beam powder bed fusion. J. Mater. Res. Technol. 2025, 36, 205608. [Google Scholar] [CrossRef] [Scilit]
- Murua, J.; Ibañez, I.; Dianova, A.; Domínguez-Meister, S.; Larrañaga, O.; Larrañaga, A.; Braceras, I. Tribological and electric contact resistance properties of pulsed plasma duplex treatments on a low alloy steel. Surf. Coat. Technol. 2023, 454, 129155. [Google Scholar] [CrossRef] [Scilit]
- Wei, Y.; Qi, S.; Wang, Y.; Chu, X.; Chu, C.; Sun, Z.; Wang, J.; Zhang, L.; Jia, W.; Yang, X.; et al. Microstructural evolution and tribological properties of M2 high-speed steel fabricated under various selective electron beam melting processing parameters. Tribol. Int. 2023, 187, 108749. [Google Scholar] [CrossRef] [Scilit]
- Zhu, X.; Peng, T.; Hua, J.; Ren, R.; Huang, Z.; Zhang, G. Wear damage and microstructure evolution of high-speed wheel steel under low slip ratios. Wear 2025, 564–565, 205742. [Google Scholar] [CrossRef] [Scilit]
- Zhang, N.; Xu, Y.; Wang, M.; Hou, X.; Du, B.; Ge, X.; Shi, H.; Xie, X. M2 coating prepared by ultra-high speed laser cladding: Microstructure and interfacial residual stress. Mater. Today Commun. 2023, 35, 10563. [Google Scholar] [CrossRef] [Scilit]
- Zhang, Q.Y.; Zhou, Y.; Wang, L.; Cui, X.H.; Wang, S.Q. Investigation on tribo-layers and their function of a titanium alloy during dry sliding. Tribol. Int. 2016, 94, 541–554. [Google Scholar] [CrossRef] [Scilit]
- Rengifo, S.; Zhang, C.; Harimkar, S.; Boesl, B.; Agarwal, A. Tribological Behavior of Spark Plasma Sintered Aluminum-Graphene Composites at Room and Elevated Temperatures. Technologies 2017, 5, 4. [Google Scholar] [CrossRef] [Scilit]
- Ji, X.; Alavi, S.H.; Harimkar, S.P. Dry Sliding Wear Behavior of Spark Plasma Sintered Fe-Based Bulk Metallic Glass/Graphite Composites. Technologies 2016, 4, 27. [Google Scholar] [CrossRef] [Scilit]
- Yin, C.H.; Liang, Y.; Yu, L.; Li, W.; Yang, M. Formation of a self-lubricating layer by oxidation and solid-state amorphization of nano-lamellar microstructures during dry sliding wear tests. Acta Mater. 2019, 166, 208–220. [Google Scholar] [CrossRef] [Scilit]
- Aleutdinova, M.I.; Fadin, V.V. Effect of the initial structure of steels on the deterioration of their contact layers in dry sliding against quenched steel under alternating electric current of a density higher than 100 A/cm2. Wear 2025, 572–573, 205985. [Google Scholar] [CrossRef] [Scilit]
- Kato, H.; Sasase, M.; Suiy, N. Friction-induced ultra-fine and nanocrystalline structures on metal surfaces in dry sliding. Tribol. Int. 2010, 43, 925–928. [Google Scholar] [CrossRef] [Scilit]
- Fox-Rabinovich, G.; Kovalev, A.; Aguirre, M.H.; Yamamoto, K.; Veldhuis, S.; Gershman, I.; Rashkovskiy, A.; Endrino, J.L.; Beake, B.; Dosbaeva, G.; et al. Evolution of self-organization in nano-structured PVD coatings under extreme tribological conditions. Appl. Surf. Sci. 2014, 297, 22–32. [Google Scholar] [CrossRef] [Scilit]
- Qi, B.; Wang, M.; Sun, K. Temperature-driven evolution of oxide films on MAX300 steel and corresponding wear behavior under high-speed friction. Tribol. Int. 2025, 211, 110898. [Google Scholar] [CrossRef] [Scilit]
- Wang, S.Q.; Wang, L.; Zhao, Y.T.; Sun, Y.; Yang, Z.R. Mild-to-severe wear transition and transition region of oxidative wear in steels. Wear 2013, 306, 311–320. [Google Scholar] [CrossRef] [Scilit]
- Saravanana, P.; Selyanchyn, R.; Tanaka, H.; Fujikawa, S.; Lyth, S.M.; Sugimura, J. The effect of oxygen on the tribology of (PEI/GO)15 multilayer solid lubricant coatings on steel substrates. Wear 2019, 432–433, 102920. [Google Scholar] [CrossRef] [Scilit]
- Bouchoucha, A.; Kadiri, E.K.; Robert, F.; Zaidi, H.; Paulmier, D. Metals transfer and oxidation of copper-steel surfaces in electrical sliding contact. Surf. Coat. Technol. 1995, 76–77, 521–527. [Google Scholar] [CrossRef] [Scilit]
- Aleutdinova, M.I.; Pochivalov, Y.I.; Fadin, V.V. Viscous Plastic Flow in Contact Layers as A Method of Stress Relaxation in Dry Sliding of Steel Against Steel Under Electric Current. Mater. Lett. 2022, 328, 133050. [Google Scholar] [CrossRef] [Scilit]
- Zheng, R.G.; Zhan, Z.J.; Wang, W.K. Wear behavior of Cu–La2O3 composite with or without electrical current. Wear 2010, 268, 72–76. [Google Scholar] [CrossRef] [Scilit]
- Lin, Y.; Wang, X.; Zhou, H.; Xu, Y.; Kang, L.; Yuan, Z.; Deng, M.; Han, Y.; Yao, P. Surface damage mechanism and evolution of Al-Zn-Mg-Cu alloy as a sliding electrical contact material under extreme environments. Wear 2025, 572–573, 205995. [Google Scholar] [CrossRef] [Scilit]
- Yanar, H.; Coskun, A. Influence of multi directional forging-induced grain refinement and subsequent aging on tribological performance of Cu-Ni-Si-Cr alloys in electrical contact sliding conditions. Wear 2025, 574–575, 206100. [Google Scholar] [CrossRef] [Scilit]
- Dong, L.; Chen, G.X.; Zhu, M.H.; Zhou, Z.R. Wear mechanism of aluminum–stainless steel composite conductor rail sliding against collector shoe with electric current. Wear 2007, 263, 598–603. [Google Scholar] [CrossRef] [Scilit]
- Meng, Y.; Ren, W.; Han, Y.; Zhang, C. Effects of current load on wear and melt erosion of electrical contacts under fretting condition. Tribol. Int. 2024, 194, 109511. [Google Scholar] [CrossRef] [Scilit]
- Jia, S.G.; Liu, P.; Ren, F.Z.; Tian, B.H. Sliding wear behavior of copper alloy contact wire against copper-based strip for high-speed electrified railways. Wear 2007, 262, 772–777. [Google Scholar] [CrossRef] [Scilit]
- Behtash Amir, M.K.; Alpas, A.T. Effect of electrical current on sliding friction and wear mechanisms in a-C and ta-C amorphous Carbon coatings. Wear 2025, 560–561, 205608. [Google Scholar] [CrossRef] [Scilit]
- Aleutdinova, M.I.; Kolubaev, A.V.; Fadin, V.V. Structure of Contact Layer of Steel (0.2% C) and Electrical Conductivity of Contact in Sliding on Steel Under Alternative Electric Current with Different Turn Ratios of Current Source. Russ. Phys. J. 2022, 65, 1041–1047. [Google Scholar] [CrossRef] [Scilit]
- Aleutdinova, M.I.; Fadin, V.V. On the possibility of melting the contact layer of steel in dry sliding against steel under electric current. Russ. Phys. J. 2026, 69, 149–157. [Google Scholar] [CrossRef] [Scilit]
- Aleutdinova, M.I.; Fadin, V.V. On gradients of FeO concentration in the contact layer of Hadfield steel in dry sliding against C45 steel under electric current. Wear 2025, 582–583, 206361. [Google Scholar] [CrossRef] [Scilit]
- Fadin, V.V.; Aleutdinova, M.I.; Kolubaev, A.V. Effect of High-Density Electric Current on Wear and Average Temperature of Steel/Steel Triboelectric Contact. J. Frict. Wear 2018, 39, 294–298. [Google Scholar] [CrossRef] [Scilit]
- Yuan, H.; Ji, S. An Improved Calculation Model for the Prediction of the wear of Coated Electrical Contacts. Technologies 2019, 7, 77. [Google Scholar] [CrossRef] [Scilit]
- Gutierrez-Noda, L.; Cuao-Moreu, C.A.; Perez-Acosta, O.; Lorenzo-Bonet, E.; Zambrano-Robledo, P.; Hernandez-Rodrigues, M.A.L. The effect of a boride diffusion layer on the tribological properties of AISI M2 steel. Wear 2019, 426–427, 1667–1671. [Google Scholar] [CrossRef] [Scilit]
- Goldstein, J.I.; Newbury, D.E.; Michael, J.R.; Ritchi, N.W.M. Scanning Electron Microscopy and X-Ray Microanalysis; Springer: New York, NY, USA, 2018; pp. 66–70. [Google Scholar]
- Wang, P.; Wu, K.; Wu, W.; Pan, A.; Guo, Z.; Chen, S. Current-carrying wear behavior of CoCrFeNiW0.2 and CoCrFeNiW0.2+3at%C high entropy alloys. Tribol. Int. 2024, 197, 109749. [Google Scholar] [CrossRef] [Scilit]

Disclaimer/Publisher’s Note: The statements, opinions and data contained in all publications are solely those of the individual author(s) and contributor(s) and not of MDPI and/or the editor(s). MDPI and/or the editor(s) disclaim responsibility for any injury to people or property resulting from any ideas, methods, instructions or products referred to in the content. |
© 2026 by the authors. Licensee MDPI, Basel, Switzerland. This article is an open access article distributed under the terms and conditions of the Creative Commons Attribution (CC BY) license.