


Abstract
Accelerometers embedded in consumer-grade smartwatches hold significant potential for health-related research applications, but their measurement reliability is often compromised. This limitation necessitates proper metrological characterization to ensure precision and consistency, particularly in health-related research contexts where reliable movement data are required. This study proposes a methodology for the simultaneous metrological characterization of multiple smartwatch accelerometers, enabling efficient and consistent bench-based measurement evaluation. The proposed methodology employs a seismic table to generate controlled vibrations within a frequency range of 1–8 Hz and acceleration amplitudes between 1 and 4 m/s2. Five commercial smartwatch units were tested, collecting acceleration data at sampling rate of 50 Hz. A reference accelerometer was used to assess the accuracy of smartwatch measurements, with errors and uncertainties quantified following ISO standards. Results demonstrate that simultaneous bench-based evaluation allows consistent comparison of measurement performance across devices while reducing the time required for the process. The analysis highlights variations in frequency response and amplitude accuracy across different smartwatch units, emphasizing the need for systematic metrological characterization when considering the future use of smartwatches in health-related research studies involving wearable movement monitoring.
1. Introduction
Wearable technology, often referred to simply as wearables, encompasses a wide range of compact, electronic, and wireless devices that are seamlessly incorporated into ordinary accessories, clothing, or even directly onto the body. This category extends beyond everyday gadgets to include more advanced and invasive technologies, such as implanted microchips and smart tattoos, as well as widely recognized consumer electronics such as smartwatches, smart glasses, and connected clothing [1].
Recent advances in telecommunications and technology have allowed wearable devices to introduce significant innovations in healthcare, offering novel opportunities to address and mitigate the inherent limitations of traditional clinical practices, like subjective clinical evaluations or discontinuous monitoring. Using advances in digital health and mobile health (m-health) systems, these devices contribute to the delivery of more effective, personalized, and patient-centered care [2]. One of the primary strengths of wearables lies in their capacity for continuous and non-intrusive health monitoring, which extends beyond the boundaries of conventional medical facilities and supports users in discreet and comfortable environments [3].
Wearable devices are particularly adept at collecting large amounts of health-related data while maintaining their original functions, such as fitness tracking or communication enhancement. Through the integration of artificial intelligence, these devices can analyze data using established protocols, identifying patterns and potential health risks with predictive precision [4]. Additionally, wearable technology can recognize user activities and provide context for those activities, offering deeper insights into daily behaviors and their impact on health [5].
These devices can incorporate a diverse array of sensors, each serving unique functions that enhance their capabilities. Moreover, advancements in sensor technology have led to the development of multifunctional sensors capable of capturing a wider range of data simultaneously. These sensors range from those focused on physical health, such as electrocardiogram sensors to monitor heart activity, pulse sensors to monitor heart rates, and electromyogram sensors to measure muscle activity [6]. In addition, sensors that monitor human movement, including accelerometers, gyroscopes, and magnetometers, play a crucial role in capturing dynamic physical activity and orientation [7]. Environmental sensors that measure temperature, humidity, and luminosity further expand the functionality of wearables, allowing for comprehensive monitoring of both personal health and external conditions [8].
Smartwatches have emerged as some of the most widely adopted tools in healthcare applications, gaining significant traction for their multifunctionality, user-friendly design, ease of use, and integration of advanced sensors. Smartwatches provide continuous monitoring of various physiological parameters, such as heart rate, physical activity, and sleep patterns, while maintaining an unobtrusive presence on the wrist [9].
Within the scope of neurological disorder management and monitoring, smartwatches hold particular promise for supporting individuals with movement disorders like Parkinson’s disease, dystonia, multiple sclerosis, or Huntington’s disease [10]. In this context, smartwatches can provide continuous monitoring of these movement symptoms, helping to track changes in real-time and offering valuable data for personalized treatment adjustments [9]. In [11], a movement data collection tool was designed to monitor motor symptoms in Parkinson’s disease by utilizing the sensors in consumer-grade smartwatches and smartphones. Abbadessa et al. [12] evaluates the correlation of motor parameters detected by a smartwatch with multiple sclerosis disability measures and patient-reported outcomes. Kinsella et al. [13] demonstrates that smartwatch-based assessments can effectively monitor motor symptoms in Huntington’s disease, showing high feasibility, strong clinical correlations, and accurate differentiation between disease stages.
Among the sensors commonly integrated into smartwatches, accelerometers are one of the most widely used in the movement disorders monitoring [14,15,16]. Their popularity stems from the accelerometers’ ability to capture subtle movements and measure activity intensity in a way that aligns well with the needs of clinical diagnostics and patient monitoring. Accelerometers are a category of inertial sensors designed to measure acceleration by sensing changes in velocity along specific directions. They operate on the behavior of an internal test mass, which is held in place by a suspension system within the accelerometer frame. When the accelerometer undergoes movement, this test mass shifts slightly from its resting position due to inertia, causing a detectable displacement, which is translated into an electrical signal [17].
Recent research has increasingly focused on the use of wrist-worn devices with accelerometers to detect and monitor movement symptoms, providing valuable information on disease progression and treatment efficacy. Sigcha et al. [18] proposed a system for detecting resting tremors using the built-in accelerometer of consumer-grade smartwatches along with machine learning. Keren et al. [19] used a wrist-worn accelerometer to quantify daily-living gait quantity and quality in Huntington’s disease. In [20], a wearable photonic smart wristband was proposed for cardiorespiratory function assessment and biometric identification through continuous monitoring of pulse wave signals. In [21], wrist-worn accelerometers measure bilateral upper limb activity and asymmetry in individuals with multiple sclerosis during daily living.
Despite the potential of these devices, to guarantee the reliability of measurements within the healthcare domain, it is crucial that accelerometers operate with high accuracy [22]. In the case of accelerometers embedded in smartwatches, their operational capacity is often intentionally limited by the device’s operating system to conserve battery life and extend overall energy autonomy, so measurement accuracy may be reduced to prioritize energy efficiency [10]. For this reason, metrological characterization processes are necessary to validate precision and consistency, ensuring that the accelerometer readings reflect actual movements or vibrations with minimal error [23]. This verification is vital to establish confidence in the data used in health applications, where precise measurements can significantly impact patient monitoring and clinical decision-making [24].
Several studies have explored different methods for calibrating accelerometers [25]. For instance, Xu et al. [26] proposes a calibration method for triaxial accelerometers that utilizes measurements from six different positions to improve accuracy through a 12-parameter model and iterative parameter corrections. Karnawat et al. [27] presents a calibration method that employs particle swarm optimization to accurately estimate measurement errors such as biases and scale factors. Won et al. [28] introduces a calibration method for triaxial accelerometers using a mathematical model that leverages stationary measurements in multiple orientations to estimate and correct biases and gain errors.
To our knowledge, only two studies have been identified that analyze in detail the performance of accelerometers in consumer-grade smartwatches. Varghese et al. [29] compared two smartwatch models by evaluating their acceleration measurements against those recorded by a seismometer, using a high-precision shaker for excitation. Sighca et al. [30] performed a calibration of each accelerometer measurement axis across three different smartwatch models by comparing the values recorded with those of a reference accelerometer. These methods are highly accurate, providing a detailed characterization of each accelerometer axis embedded in a smartwatch. However, for an accurate implementation of monitoring strategies at a large scale, it is essential to develop a method that enables the concurrent metrological characterization of several devices.
Simultaneous metrological characterization of accelerometers across multiple smartwatches offers several advantages, particularly in research applications. First, calibrating multiple devices concurrently ensures that they produce consistent and comparable data, which is essential in scenarios where data from different devices need to be aggregated or compared, such as in health monitoring or fitness tracking. This approach may significantly reduce the time required for characterization, which is particularly beneficial in environments where numerous devices are in use, such as large-scale research studies. Furthermore, simultaneous metrological characterization facilitates the maintenance and update process for fleets of devices, enabling bulk reassessment and updates, thereby reducing downtime and ensuring that all devices remain functional and accurate.
To address this concurrent metrological characterization, this paper introduces a comprehensive methodology for characterizing the frequency response and amplitude variability of acceleration measurements, aimed at assessing the precision and measurement uncertainty of data obtained from accelerometers in a selection of commercial smartwatches at the same time.
The remainder of the paper is organized as follows: Section 2 outlines the proposed system and the methodology followed, Section 3 presents the experimental results of the process, Section 4 discusses the results and their implications, and, finally, Section 5 concludes the paper, summarizing the key findings and implications of the proposed system.
2. Metrological Characterization System
In this research, characterization was performed to evaluate the measurement discrepancies associated with the accelerometer integrated into a commercially available smartwatch. Although these devices are equipped with manufacturer-calibrated triaxial accelerometers, it is crucial to conduct independent metrological characterization and adjustment procedures, especially if the devices are used in healthcare, in order to grant traceability, consistency, and comparability. Such steps are necessary to ensure measurement accuracy before proceeding with tests that involve frequency and amplitude analysis.
The analysis evaluated different amplitude and frequency responses of the built-in accelerometers. The methodology for the analysis was chosen based on ISO 8041-1:2017 [31], the standard for measuring instruments used in human vibration response analysis. The ISO 16063 standards [32] provide comprehensive guidelines for the calibration of vibration transducers, covering both primary and secondary calibration methods and their application in various settings. Primary methods include laser interferometry (ISO 16063-11 [33]) and the reciprocity method (ISO 16063-12 [34]), ensuring precise calibration without reliance on external standards. Secondary calibration through comparison (ISO 16063-21 [35]) allows alignment with reference standards, while the centrifuge method (ISO 16063-31 [36]) enables accurate assessment of acceleration responses.
Among the secondary calibration methods, comparison with a reference accelerometer was selected because of its simplicity and reliability. Unlike the conventional approach of placing the test accelerometer on a standard reference device, this study placed all devices on the same surface to implement the test plan at specified frequencies and amplitudes.
The proposed methodology is intended to verify the amplitude and frequency response of each smartwatch accelerometer by comparison with a calibrated reference sensor under controlled vibration conditions. It should be noted that no correction equations based on the results of this verification have been derived or applied to the raw sensor output.
This section has been divided into 4 subsections. Section 2.1 outlines the test bench used in this methodology for measurement evaluations. Section 2.2 provides a description of the experimental protocol, including the specified frequency and measurement ranges, along with additional considerations used for the analysis. Section 2.3 presents the detailed specifications of the smartwatches and their built-in accelerometers as an example of the proposed methodology. Finally, Section 2.4 presents the data processing methodology employed to calculate the measurement error and determine the uncertainty value of the error.
2.1. Test Bench
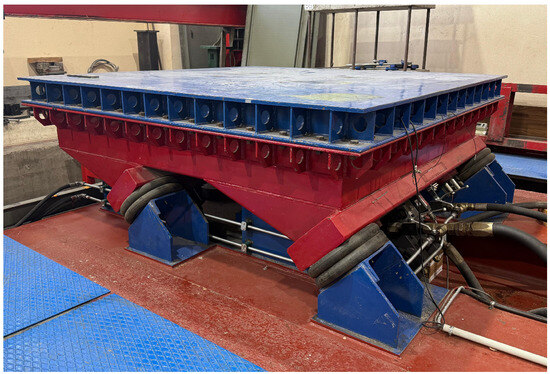
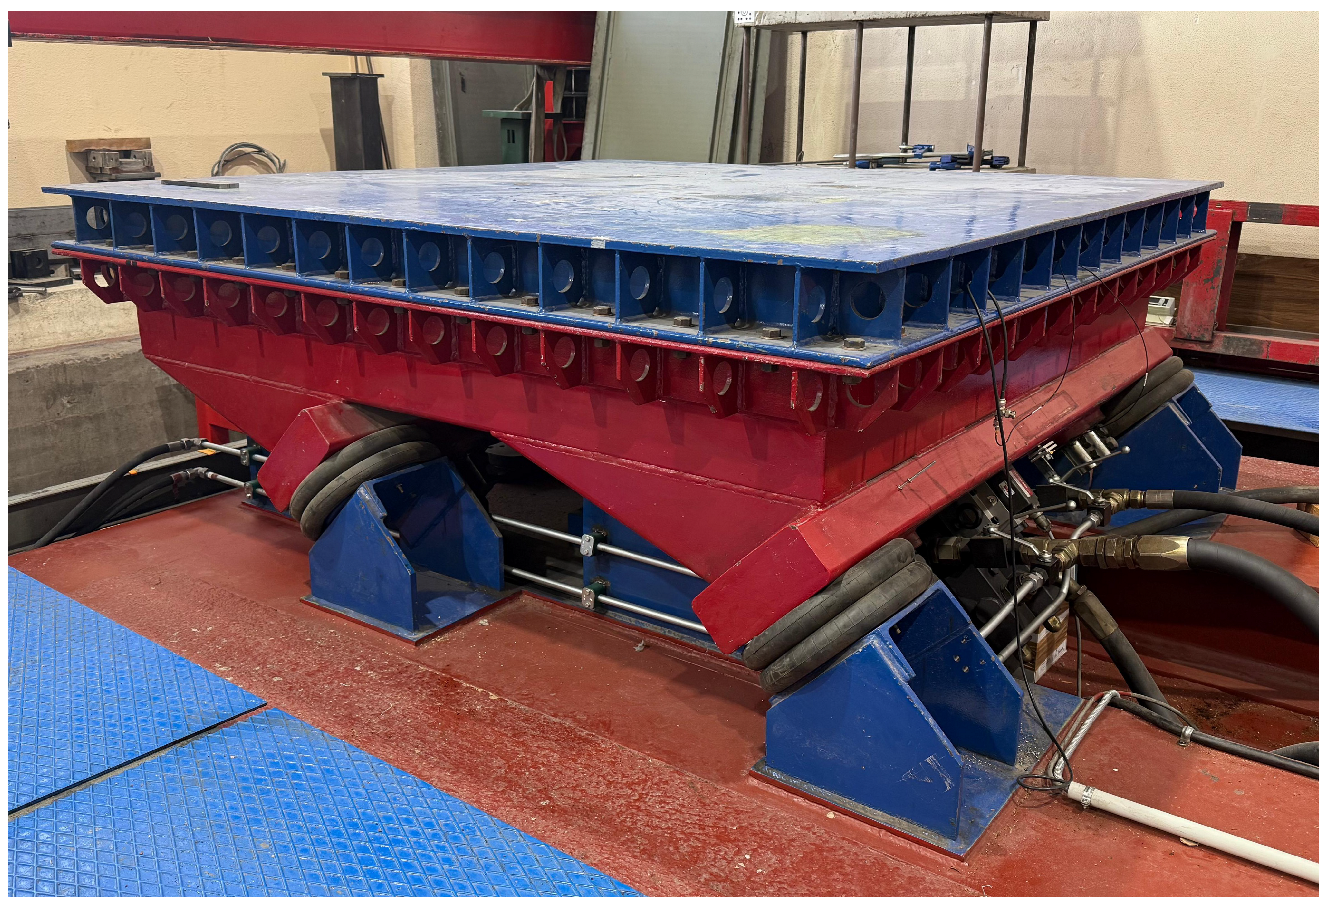
The main objective of this study is to propose a methodology for the simultaneous metrological characterization of multiple smartwatches. To achieve this, a seismic table was utilized as the vibration generation system. In this case, the model used is a vibrative dynamic testing platform ED-200/200 of the Urbar company (Urbar, Madrid, Spain). This table operates hydraulically, has dimensions of 2 × 2 m, allowing the placement of the smartwatch array without constraints. In this case, the seismic table employed features an actuator positioned at a 45° angle to the horizontal plane, as illustrated in Figure 1.
Figure 1.
Seismic table used.
The seismic table is a mechanical device designed to simulate ground movements during an earthquake, typically occurring at very low frequencies (ranging from 0.01 to 8 Hz). However, according to the specifications of the table used, verified by previous analyses, the frequency response curve remains flat between 1 Hz and 10 Hz, while outside this range, below 1 Hz and above 10 Hz, the behavior becomes non-linear. Regarding the amplitude response, it is stated that within the linear frequency range, the seismic table is capable of reaching slightly above 5 m/s2.
2.2. Experimental Protocol
To establish the experimental protocol, it is essential to identify the amplitude and frequency ranges required for the analysis. In terms of frequency, although it can be performed at any value, ISO 16063-21:2003 [35] recommends using the standardized one third octave frequencies specified in ISO 266:1997 [37]. Given that the test bench operates reliably within the frequency range of 1 Hz to 8 Hz, the analysis was conducted using standardized one-third-octave bands within this range. Specifically, the study frequencies were defined for the one-third octave bands with center frequencies of 1 Hz, 2 Hz, 4 Hz, 6.3 Hz, and 8 Hz.
Regarding amplitude, as the seismic table is capable of generating excitations up to 5 m/s2, the study was conducted at three different acceleration levels: 1, 2.5, and 4 m/s2. This selection allows for the assessment of the methodology’s validity across a diverse range of amplitudes and frequencies, ensuring a comprehensive evaluation of the smartwatch accelerometer’s performance under varying dynamic conditions. This selection resulted in a total of 15 amplitude and frequency combinations being established.
The frequency range of 1–8 Hz and acceleration amplitudes of 1–4 m/s2, defined by the operational limits of the seismic table, constitute a pragmatic bench-test range that partially overlaps with motion characteristics reported for some movement disorders. For reference, normal and abnormal gait patterns typically lie in the frequency range of 0.8–1.5 Hz [38], tremors are observed in the range of 3.5–7.5 Hz [39], and bradykinesia data generally occur between 1–6 Hz [40]. Regarding amplitude, the movement of the arm during walking generates a signal with a maximum acceleration of approximately 4 m/s2 [41]. However, this range should not be interpreted as a comprehensive coverage of all clinically relevant movement patterns. Other motor phenomena, such as dyskinesia, freezing of gait, postural transitions, or non-sinusoidal free-living movements, may involve frequency and amplitude characteristics that fall outside or only partially within the tested range. Furthermore, the use of sinusoidal excitation in a controlled laboratory setting does not replicate the complexity and variability of real-world movement signals. The tested conditions should therefore be understood as a pragmatic starting point for a general-purpose simultaneous calibration protocol, and researchers targeting a specific clinical application should carefully verify that the excitation parameters adequately cover the characteristic frequency and amplitude ranges of the disorder of interest.
It is important to note that, due to mechanical limitations of the seismic table at low frequencies combined with high amplitudes, three of the fifteen planned conditions could not be completed: 1 Hz at 2.5 m/s2, 1 Hz at 4 m/s2, and 2 Hz at 4 m/s2. At these conditions, the table produced inconsistent or non-linear excitation. The experimental validation was therefore carried out over 12 amplitude–frequency combinations, as detailed in Table 1.
Table 1.
Planned and completed amplitude–frequency combinations. ✔ indicates completed; blank indicates not completed due to seismic table limitations.
Because the seismic table has an actuator at a 45° angle, if the smartwatch array were placed directly on the horizontal plane, the resulting vibration would not be confined to a single axis; instead, two axes of the smartwatches would be stimulated. Considering the amplitude and frequency requirements and the fact that the seismic table can generate accelerations slightly exceeding 5 m/s2, it is essential to ensure that excitation occurs along only one axis. Therefore, a support structure is required to provide the appropriate inclination for uniaxial evaluation of the devices. This ensures that the full excitation amplitude from the seismic table aligns with the acceleration recorded on one of the excitation axes of the smartwatch under analysis. For this reason, in this study, all the smartwatches used and the reference accelerometer were positioned on the same surface to implement the test plan at specified frequencies and amplitudes.
To ensure consistent input conditions across devices during simultaneous testing, all smartwatches were mounted on a common vibration platform under identical experimental conditions. A dedicated structure was carefully designed for this study, considering factors such as material stiffness, mass distribution, and geometric dimensions, as these parameters govern the dynamic behavior and natural frequencies of the system. The objective was to ensure that the structure’s resonant modes remained outside the frequency range of interest. A modal analysis of the supporting structure was conducted to evaluate potential spatial non-uniformities, local vibration effects, and structural resonances that could influence the recorded signals. Although, based on the geometry, density, rigidity, and material properties of the support, the fundamental resonance frequency was expected to lie above the frequency range of interest, the analysis confirmed that the first resonance frequency of the structure was 56 Hz. This value lies well above the 1–8 Hz excitation range used in this study, indicating that structural resonances are not expected to influence the recorded measurements within the operational bandwidth. Furthermore, given that the excitation is confined to the 1–8 Hz range and the band-pass filtering applied during data processing retains only the frequency content within each corresponding one-third octave band, any potential contribution from higher-frequency structural vibration to the analyzed signals is effectively excluded. These results support the assumption of sufficiently uniform input conditions across devices during simultaneous testing.
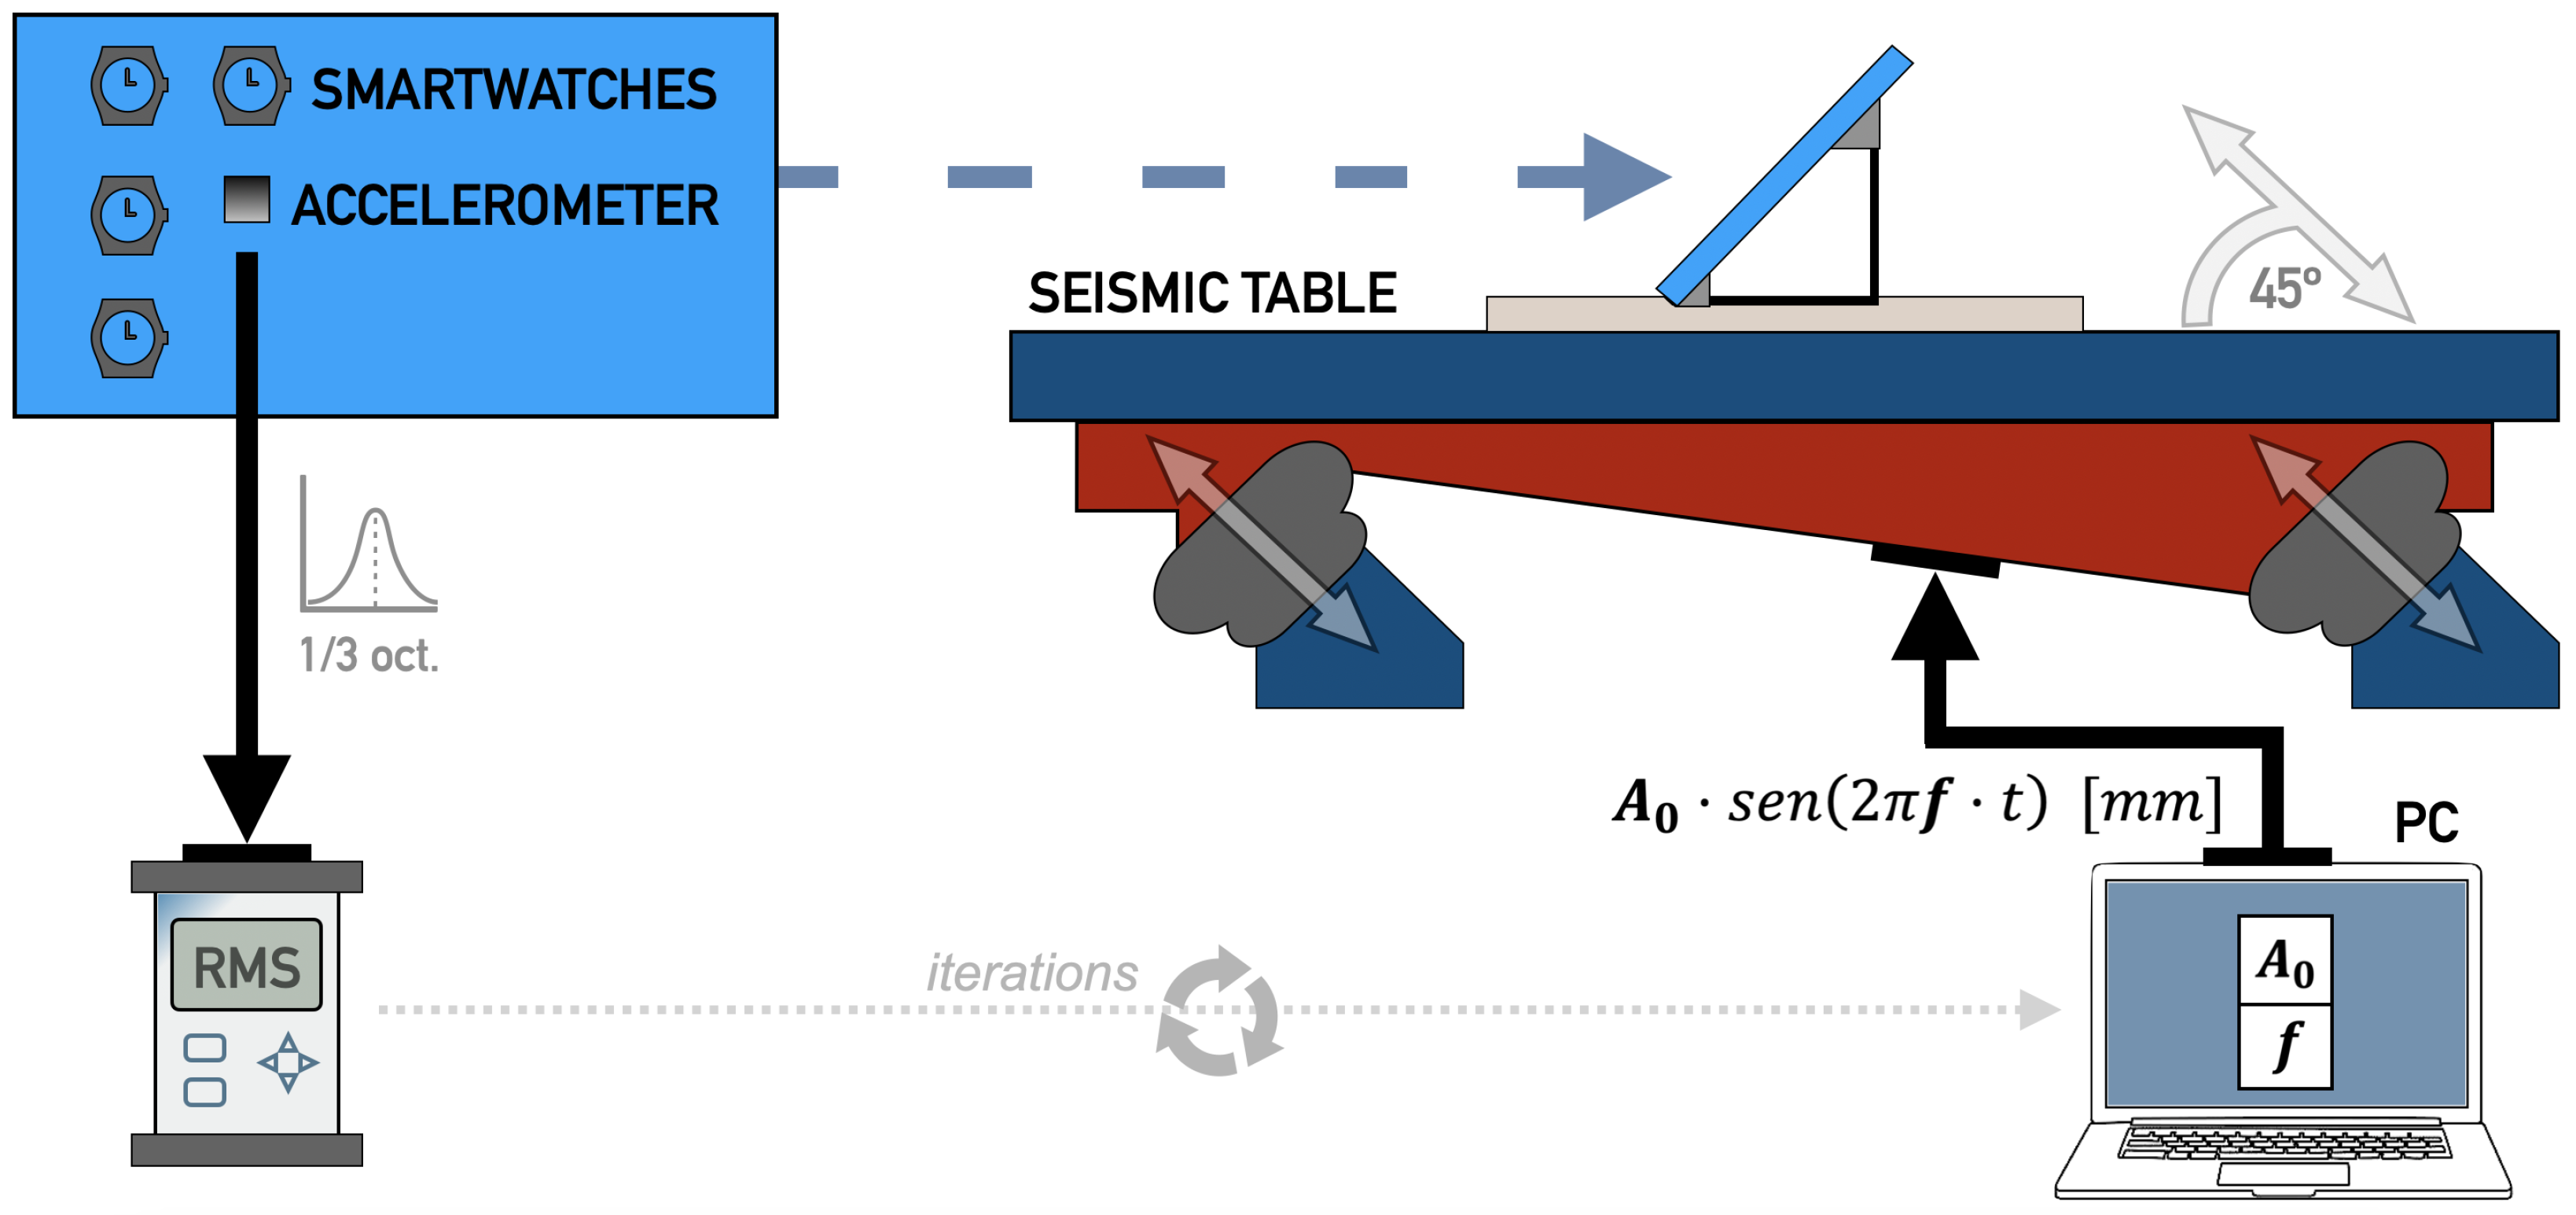
Figure 2 presents a schematic of the seismic bench test setup. A computer housed in an external cabinet generates a sinusoidal control signal, specifying the amplitude in millimeters and the frequency, and transmits it to the seismic table. This, in turn, induces vibration of the platform-and the structure that holds the smartwatches-at an angle of 45 degrees. In addition to smartwatches, a reference accelerometer, Dytran 3023M3 accelerometer (Dytran Instruments, Los Angeles, CA, USA), is mounted on the custom support structure. This accelerometer is linked to a vibration analyzer, SV106 vibrometer (Svantek, Warsaw, Poland), that outputs the acceleration experienced by the reference.
Figure 2.
Experimental protocol outline.
The reference accelerometer and analyzer were calibrated by an accredited calibration laboratory prior to the experimental campaign (March 2025). The corresponding calibration certificate provides the calibration date, traceability to national metrological standards, the associated measurement uncertainty, and the results of calibration tests carried out at different excitation frequencies and acceleration levels. Specifically, calibration was performed at selected frequency points within the sensor’s operating range (25, 160, and 2500 Hz), with controlled reference acceleration amplitudes applied at each frequency to characterize the accelerometer’s response. For each calibration point, the certificate records the instrument’s indication values, the mean value, the indication error relative to the reference, and the expanded uncertainty. These calibration data were incorporated into the uncertainty balance of the proposed methodology and taken into account throughout the uncertainty analysis of the overall measurement process.
An iterative process was conducted to establish each of the 12 amplitude and frequency points. This involved setting the frequency and specifying the displacement via the computer. The vibration analyzer was used to verify the accelerometer value obtained, and the displacement was adjusted until the desired acceleration amplitude was reached at the target frequency. Due to the background noise that the seismic table can generate, the measurements from the reference accelerometer are filtered using the third-octave band corresponding to the frequency of each specific case.
According to ISO 8041-1:2017 standard [31], three repetitions per each amplitude and frequency combination are recommended. Each measurement included a stabilization period of 5 s and had a total duration of 30 s, following the ISO standard recommendation. Since there are 12 unique amplitude and frequency combinations, and each combination was tested three times, a total of 36 tests have to be conducted for each axis of the accelerometer of a smartwatch.
The present analysis focuses on the z-axis, which received the primary excitation from the seismic table. Since most consumer-grade smartwatches incorporate triaxial accelerometers, the proposed methodology could be straightforwardly extended to the remaining axes, which would further amplify the time-efficiency advantages of simultaneous characterization, whereas traditional individual evaluation would require 108 tests per device per full triaxial characterization, the proposed approach would maintain a fixed total test count regardless of the number of devices evaluated. In the proposed simulated characterization methodology, this procedure would only need to be performed once with all the smartwatches that have to be calibrated.
2.3. Test Devices
The validation of this methodological proposal was conducted using five consumer-grade smartwatch units that operate under the Wear OS system. Device selection was guided by predefined criteria, including: (i) commercial availability in 2024, (ii) integration of a triaxial accelerometer accessible through the standard Android Sensor API (SensorManager), (iii) broad market adoption, and (iv) stable support for continuous data acquisition during prolonged recording sessions. Devices were excluded if they lacked documented sensor APIs, exhibited unstable firmware behavior, or did not allow access to raw accelerometer data streams.
All devices were running Wear OS version 4.x or higher, with firmware versions corresponding to the latest stable releases available at the time of data collection. Although all the selected smartwatches share similar technical specifications, Table 2 provides detailed technical specifications of the smartwatches and their integrated accelerometers.
Table 2.
Technical specifications of the smartwatches evaluated.
A custom Wear OS application was deployed on each device to collect triaxial accelerometer signals via the Android SensorManager API. Data were recorded at a nominal sampling rate of 50 Hz, which provides sufficient temporal resolution for the frequency range of interest, in accordance with the Nyquist theorem. The maximum available sampling frequency of the devices is several orders of magnitude higher than the selected sampling rate, ensuring that the acquisition process operates well within hardware capabilities and is not constrained by sensor-level sampling limits. The actual mean sampling rate was 50 Hz, corresponding to one sample every 20 ms, with a sampling interval variability of ±3.8 ms. The signal acquisition application had been previously characterized during recordings exceeding one day, by comparing expected and observed sample counts, and showed a data loss of approximately 2% of recorded samples, with a maximum inter-sample gap of 40 ms. These sampling characteristics were consistent across devices and test conditions. The captured signal was stored locally on each device for subsequent extraction and analysis.
2.4. Data Processing
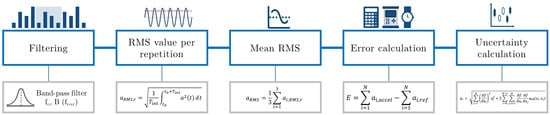
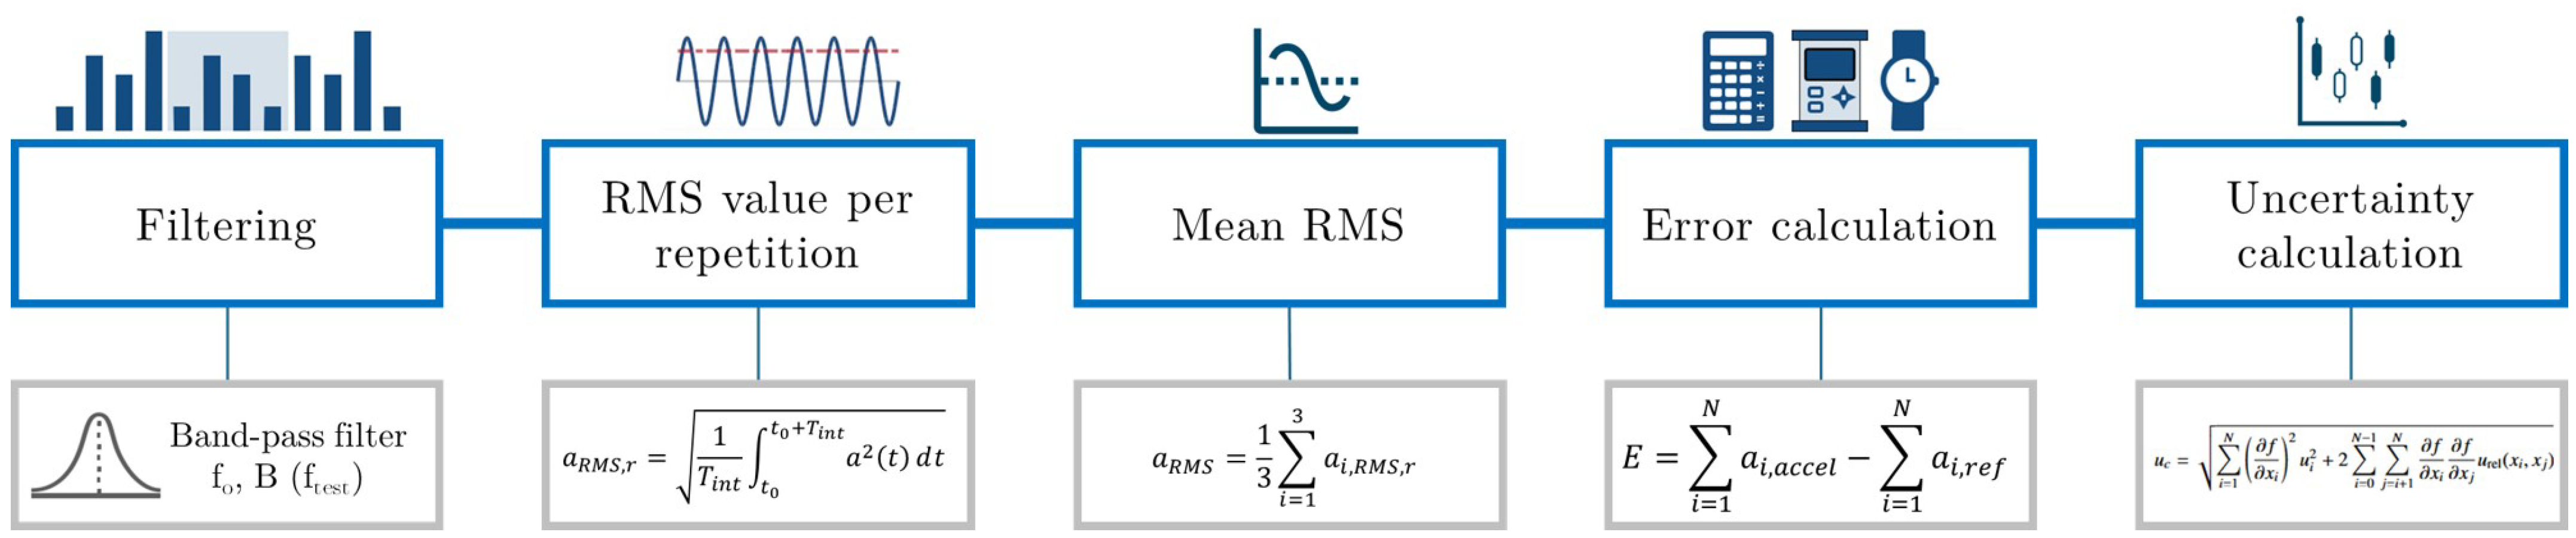
The accelerometer measures the combined effect of all forces acting on the sensor and cannot differentiate between accelerations from various sources. To isolate the contribution from the excitation produced by the seismic table or the effect of gravity, each measurement record must undergo processing. The procedure followed is illustrated in Figure 3.
Figure 3.
Data processing diagram.
The process begins by applying a second-order Butterworth bandpass filter to the signal, with the central frequency set to the excitation frequency of each test and the upper and lower frequencies corresponding to the one-third octave band. This filtering step ensures that only information related to the target frequency is retained.
Following the filtering stage, the RMS (Root Mean Square) value is calculated, which represents the effective value of each test. The RMS value provides a measure of the total energy in the signal and is not instantaneous but rather an average that evolves over time. The calculation is performed using Equation (1), in which the total integration time for each test corresponds to the 30 s of signal recording.
Once the RMS values for each of the tests have been calculated, the average of the three tests conducted at each point, corresponding to the same amplitude and frequency, is determined using Equation (2)
The accuracy of the measurement must be verified by evaluating the error relative to the reference. So, the RMS value of each measurement record has to be compared with the corresponding value of the reference accelerometer (1, 2.5 or 4 m/s2). According to ISO 8041-1:2017 [31], the comparison between the two RMS values is carried out using the indication error, expressed as an absolute difference or as a percentage.
However, it is crucial to understand and estimate uncertainties to ensure the accuracy of any measurement, as these uncertainties may arise from the condition of the testing equipment, experimental variability, or environmental influences. Assessing these uncertainties offers insight into the spread of measurement values, thus ensuring that the results are reliable and correctly interpreted. Thus, a comprehensive uncertainty analysis is vital for achieving precise outcomes. The calculation and reporting of uncertainties were carried out according to the guide for the expression of uncertainty in measurement (ISO-GUM) [42] and ISO 16063-21:2003 [35].
Only contributions for which the information required to perform the corresponding calculations is available have been considered. Specifically, the contributions and uncertainties evaluated are related to the acceleration, temperature, finite resolution of the equipment, the device calibration uncertainty, and the cross-sensitivity (degree of sensor misalignment) of the equipment, as shown in Table 3. The characterization and measurement uncertainties must be determined by adapting the procedure outlined in ISO 16063-21:2003 [35]. This adjustment is necessary because the accelerometer’s output voltage, which is required for calculating uncertainty directly based on sensitivity, is not readily accessible.
Table 3.
Identification of the contribution source for characterization.
The indication error is calculated by accounting for all significant influences on the measurement results, including systematic and random errors. Considering these contributions, the indication error can be expressed in absolute terms using Equation (3) or as a percentage using Equation (4).
For the calculation of uncertainties, the combined uncertainty is determined using the law of propagation of variances. As shown in Table 4, the uncertainties related to temperature, finite resolution, and cross-sensitivity have been treated as rectangular distributions since their values are confined within a known range. In contrast, the calibration accuracy of the devices is represented by a normal distribution, as is the RMS uncertainty, which is associated with the three repetitions performed at each amplitude and frequency combinations.
Table 4.
Summary of metrological characterization results for each smartwatch unit. MAE: mean absolute error; Max AE: maximum absolute error; RMSE: root mean square error; Mean U (%): mean expanded uncertainty relative to the reference value.
In this case, the sensitivity coefficients are set to one in all cases, since it is assumed that none of the variables under consideration are correlated, so the combined uncertainty () can be calculated as expressed in the Equation (5), where y is the measurand determinate for N input quantities (x1, x2, …, xn); is the estimated uncertainty contribution associated with each contribution, f is the functional relationship between measurand, input variable and are estimated input values, and is the estimated covariance.
ISO 16063-21:2003 [35] indicates that measurement results must be reported together with the expanded uncertainty (U), calculated according to the Equation (6), which defines the interval of values around the measurement result within which a significant fraction (at the selected confidence level) of the distribution of values attributable to the measure is expected to fall. According to the guidelines, calculations must be performed assuming a normal distribution and a confidence level of 95.45% (k = 2).
3. Results
The following section presents the experimental results for the frequency–amplitude response of the tested smartwatches, along with the associated uncertainty analysis. The experimental evaluation focuses on the z-axis, which received the direct excitation from the seismic table. A reference vibrometer was utilized to calibrate the mechanical test signal, ensuring precise amplitude adjustments across various test frequencies and amplitudes. Given the limitations of the test bench, the analysis was restricted to the third octave frequency bands and the acceleration ranges defined in Section 2.2.
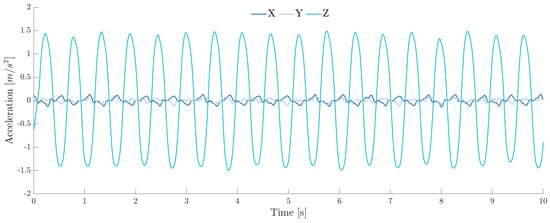
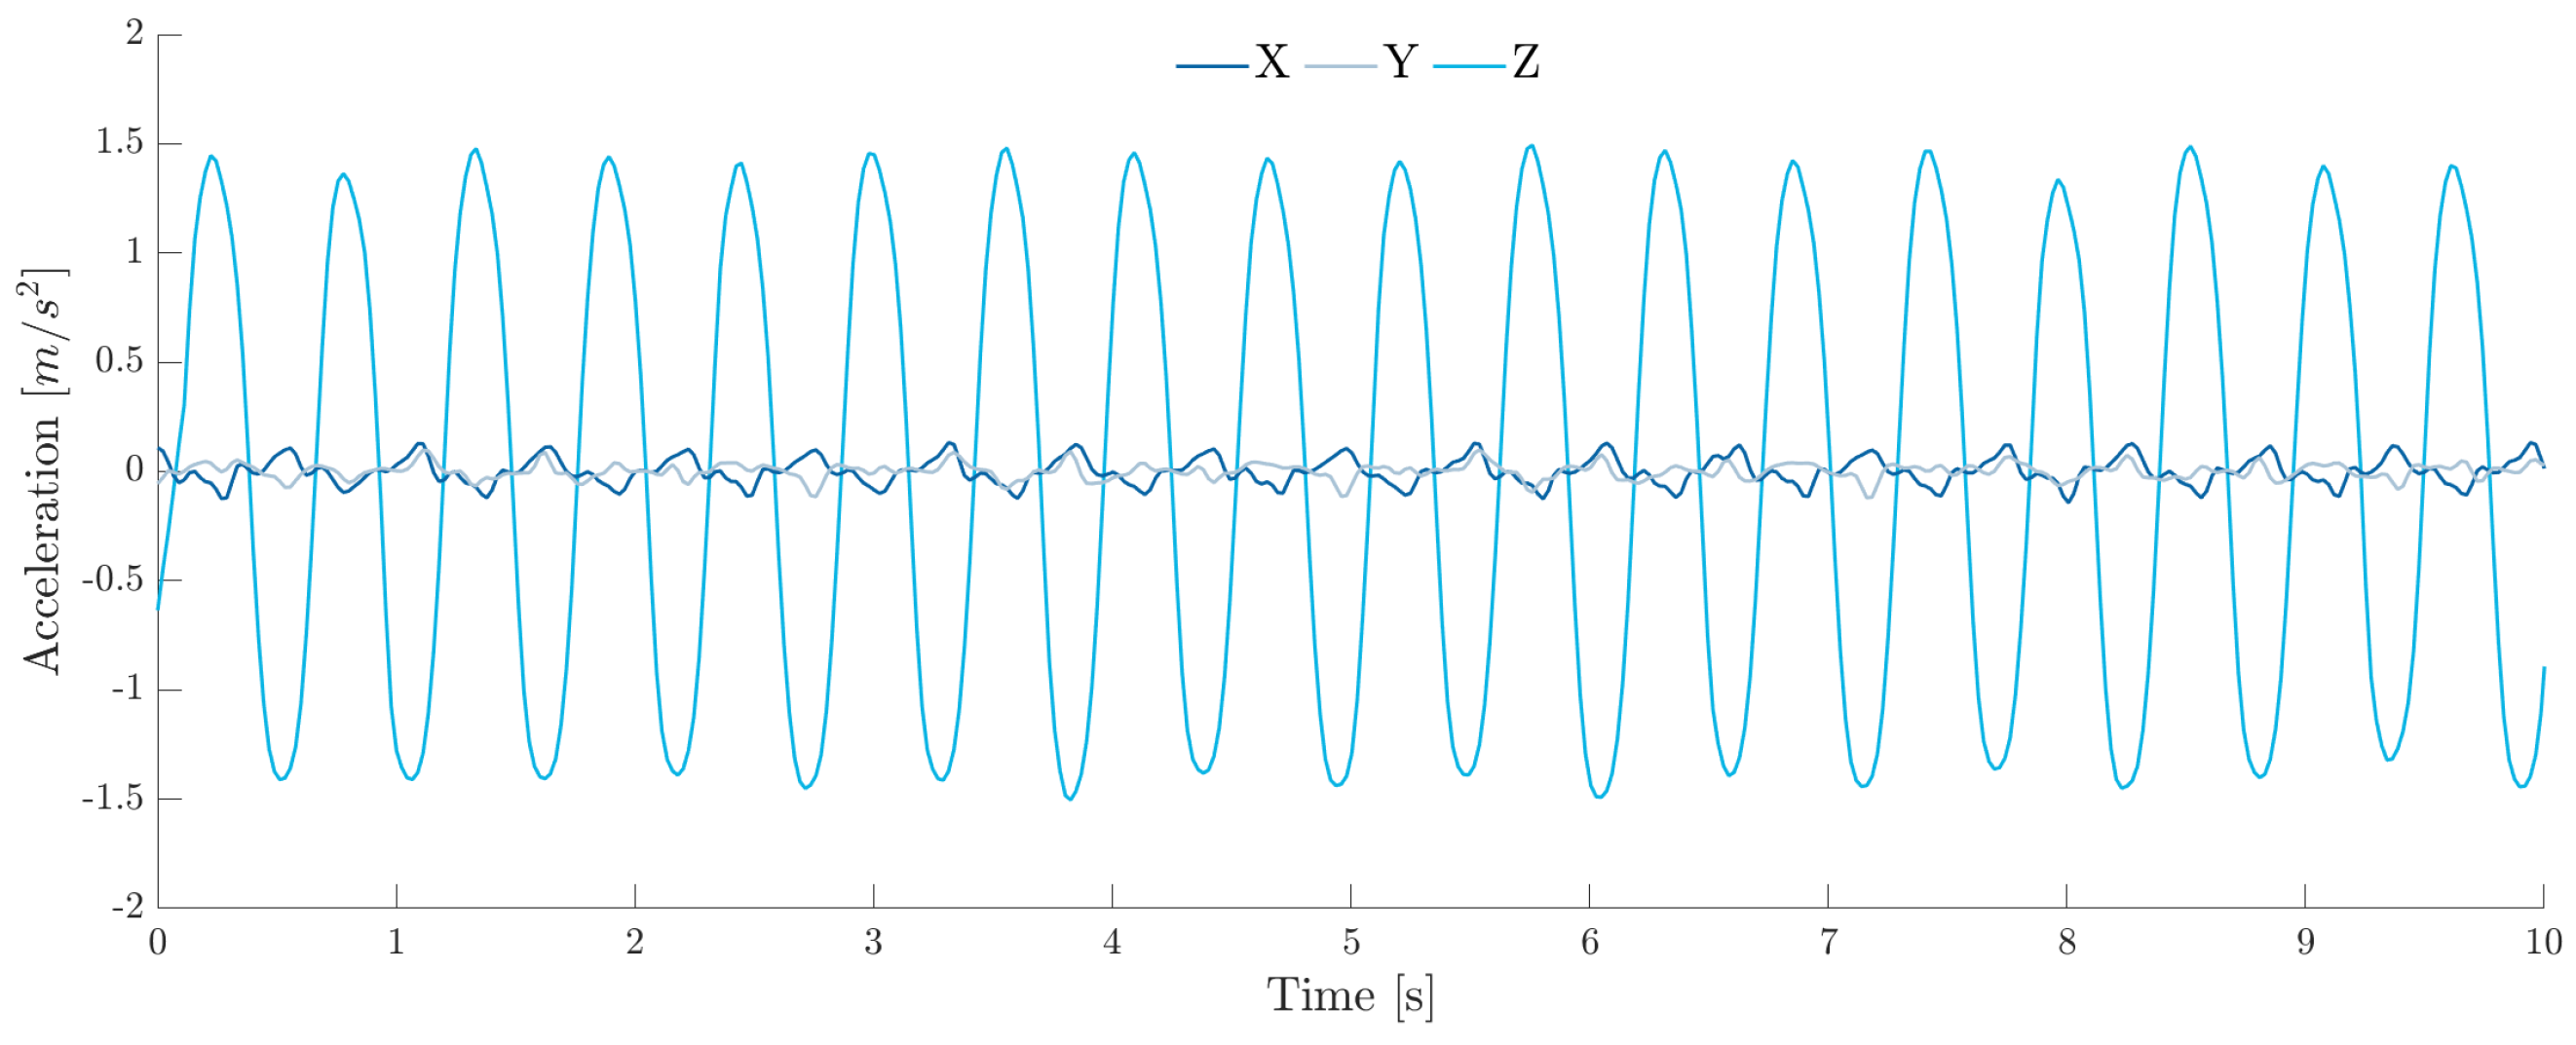
Figure 4 illustrates the measurement of all three axes of the smartwatch accelerometer during one of the tests. The results show that the contributions in terms of acceleration from the X and Y axes are negligible compared to the Z-axis contribution. This confirms that the excitation from the seismic table is effectively recorded along the intended study axis.
Figure 4.
Example of a measurement test.
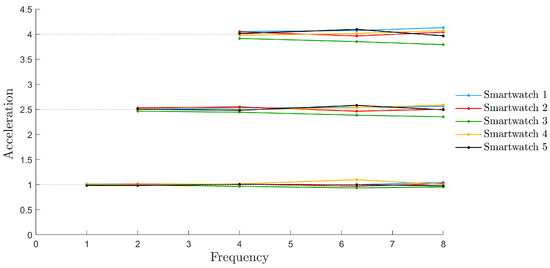
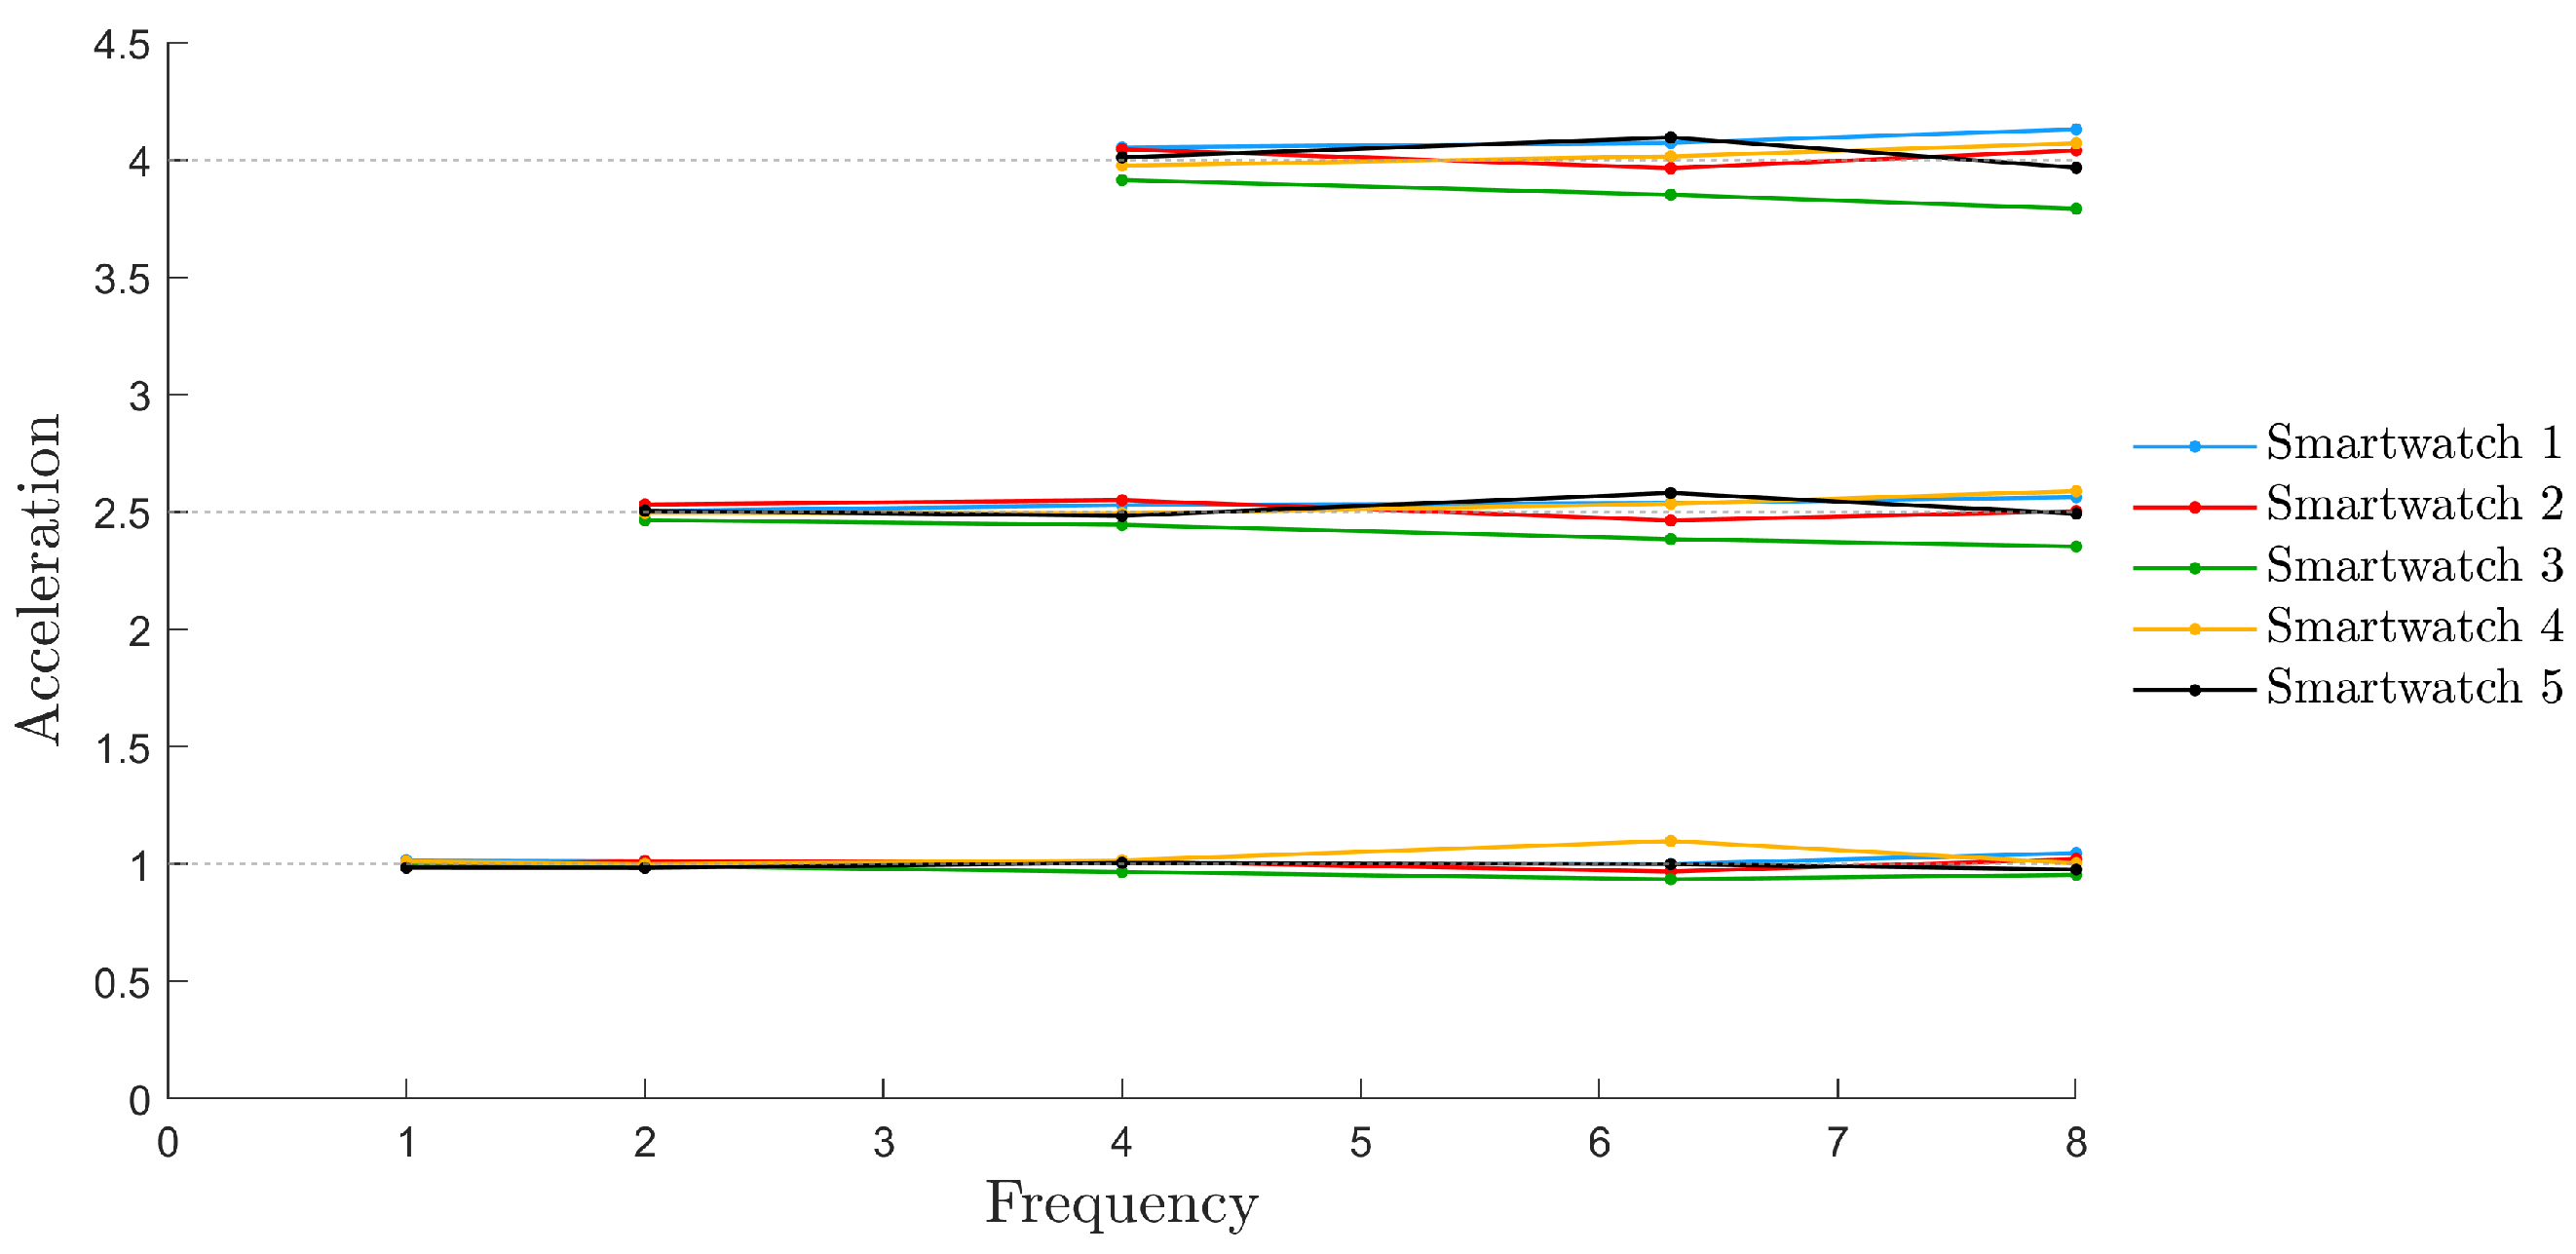
Each of the 12 amplitude and frequency combinations for the metrological characterization of one axis was analyzed using the defined processing pipeline to extract the acceleration values recorded by each smartwatch at the corresponding excitation frequencies. Figure 5 presents the frequency response curves for the five evaluated smartwatches. As shown, 12 of the 15 planned amplitude–frequency combinations are presented, as the three conditions that could not be completed due to seismic table limitations were described in Section 2.2.
Figure 5.
Tested smartwatches’ frequency responses.
The frequency response curve demonstrates predominantly linear behavior in most smartwatches for each frequency at the three studied amplitudes. In general, the results show that the acceleration values recorded by the five smartwatches are similar to those recorded by the reference accelerometer. At low frequency and amplitude values, the response of the smartwatches is nearly identical to the reference accelerometer. However, for constant amplitude values, the acceleration recorded by the smartwatches exhibits a higher dispersion relative to the reference. Similarly, when the frequency remains constant, an increase in amplitude leads to a more significant dispersion of the recorded values. Consequently, this suggests that as both frequency and, particularly, amplitude increase, the smartwatches’ responses become progressively more dispersed in relation to the reference.
To perform a more detailed analysis of the frequency response, a study of the measured error, calculated as Equation (3), with respect to the reference accelerometer and the corresponding observed standard deviation, obtained as Equation (6), is performed at each study point. Figure 6, Figure 7, Figure 8, Figure 9 and Figure 10 present these results for each of the study amplitudes. Each figure presents the error relative to the reference for the three study amplitudes. Additionally, the confidence intervals for these errors are included, calculated based on the expanded uncertainty. To provide a reference framework for evaluating measurement error, the 6% tolerance threshold defined in ISO 8041-1:2017 [31] for general-purpose vibration meters was adopted. Although this standard is not directly applicable to healthcare contexts, it was used here solely as a reference benchmark in the absence of a specific normative framework for wearable accelerometers in clinical applications.
Figure 6.
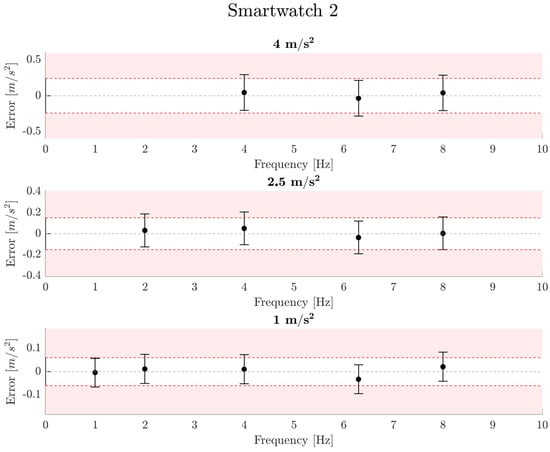
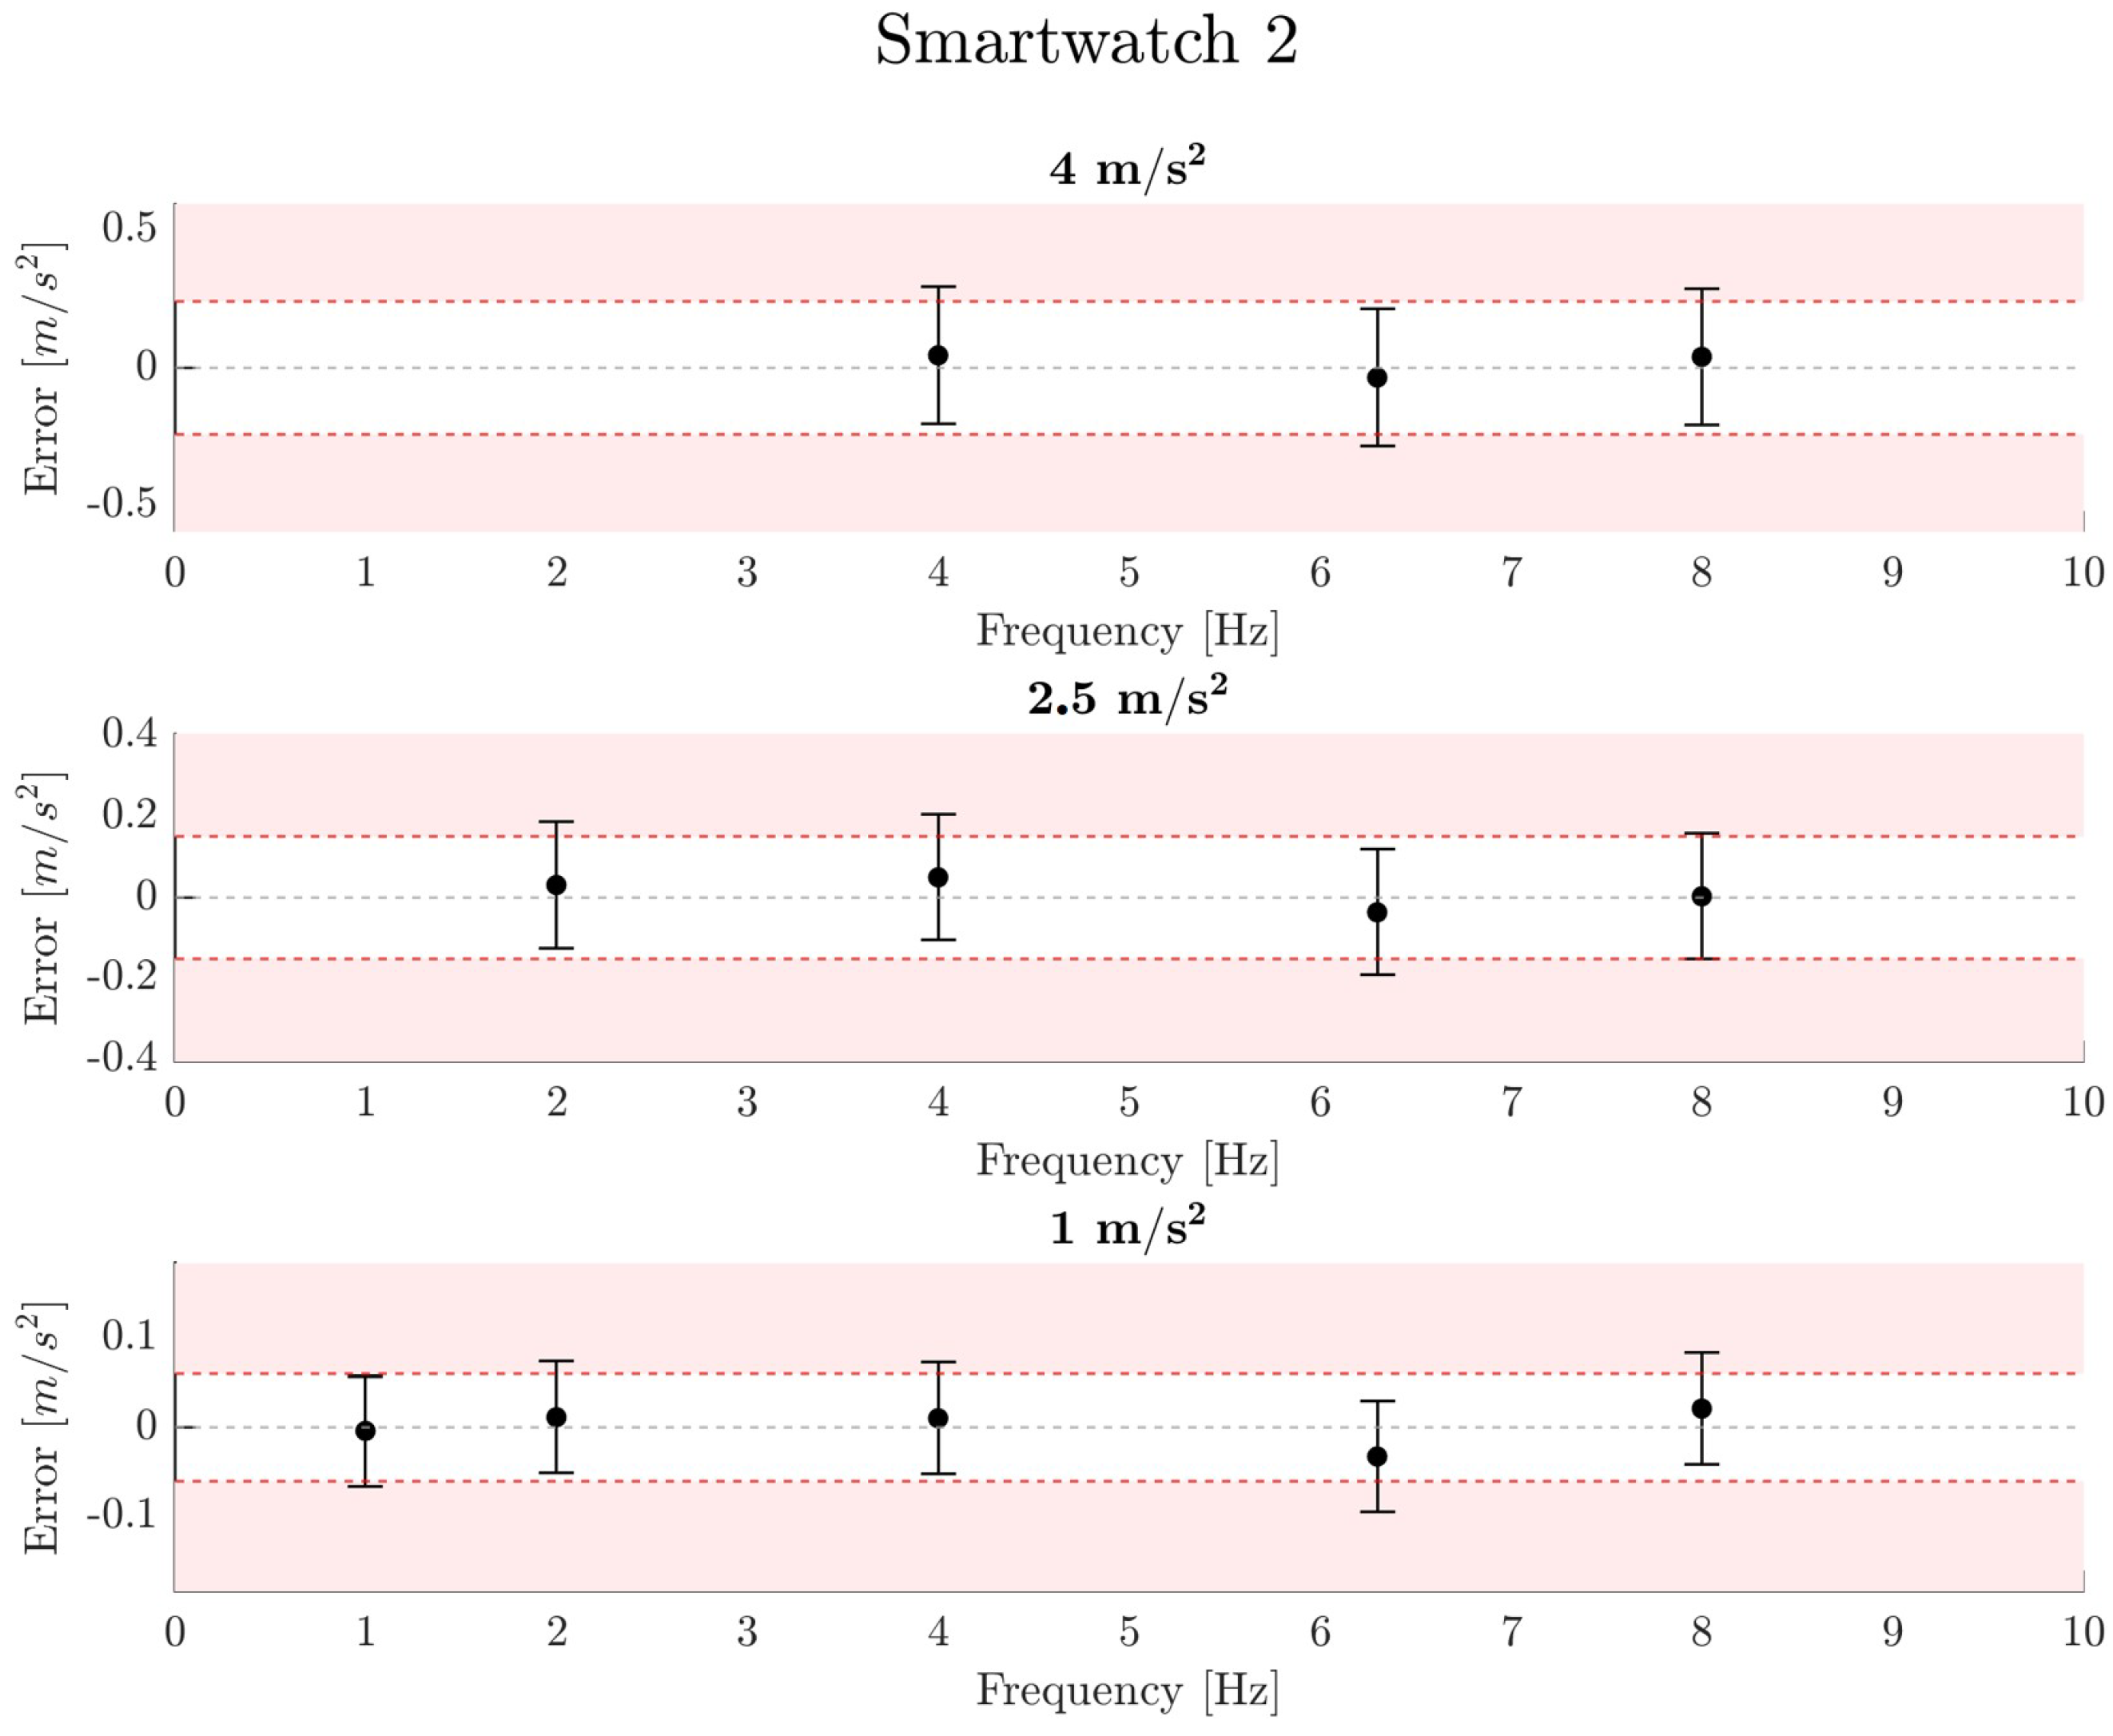
Indication error and expanded uncertainty range of smartwatch unit 2 at three excitation amplitudes (1, 2.5, and 4 m/s2). The x-axis represents the excitation frequency (Hz) and the y-axis represents the indication error (m/s2). Error bars represent the expanded uncertainty while the dashed lines indicate the ±6% threshold.
Figure 7.
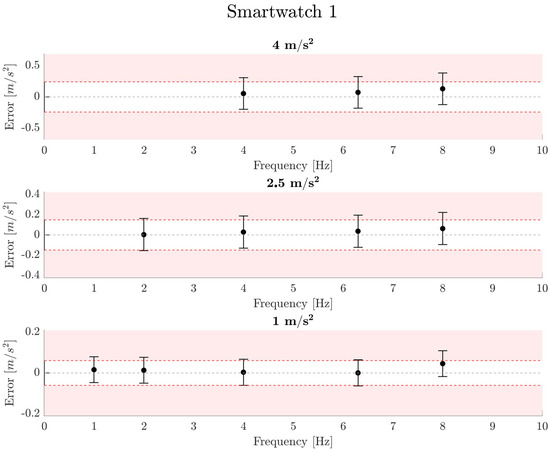
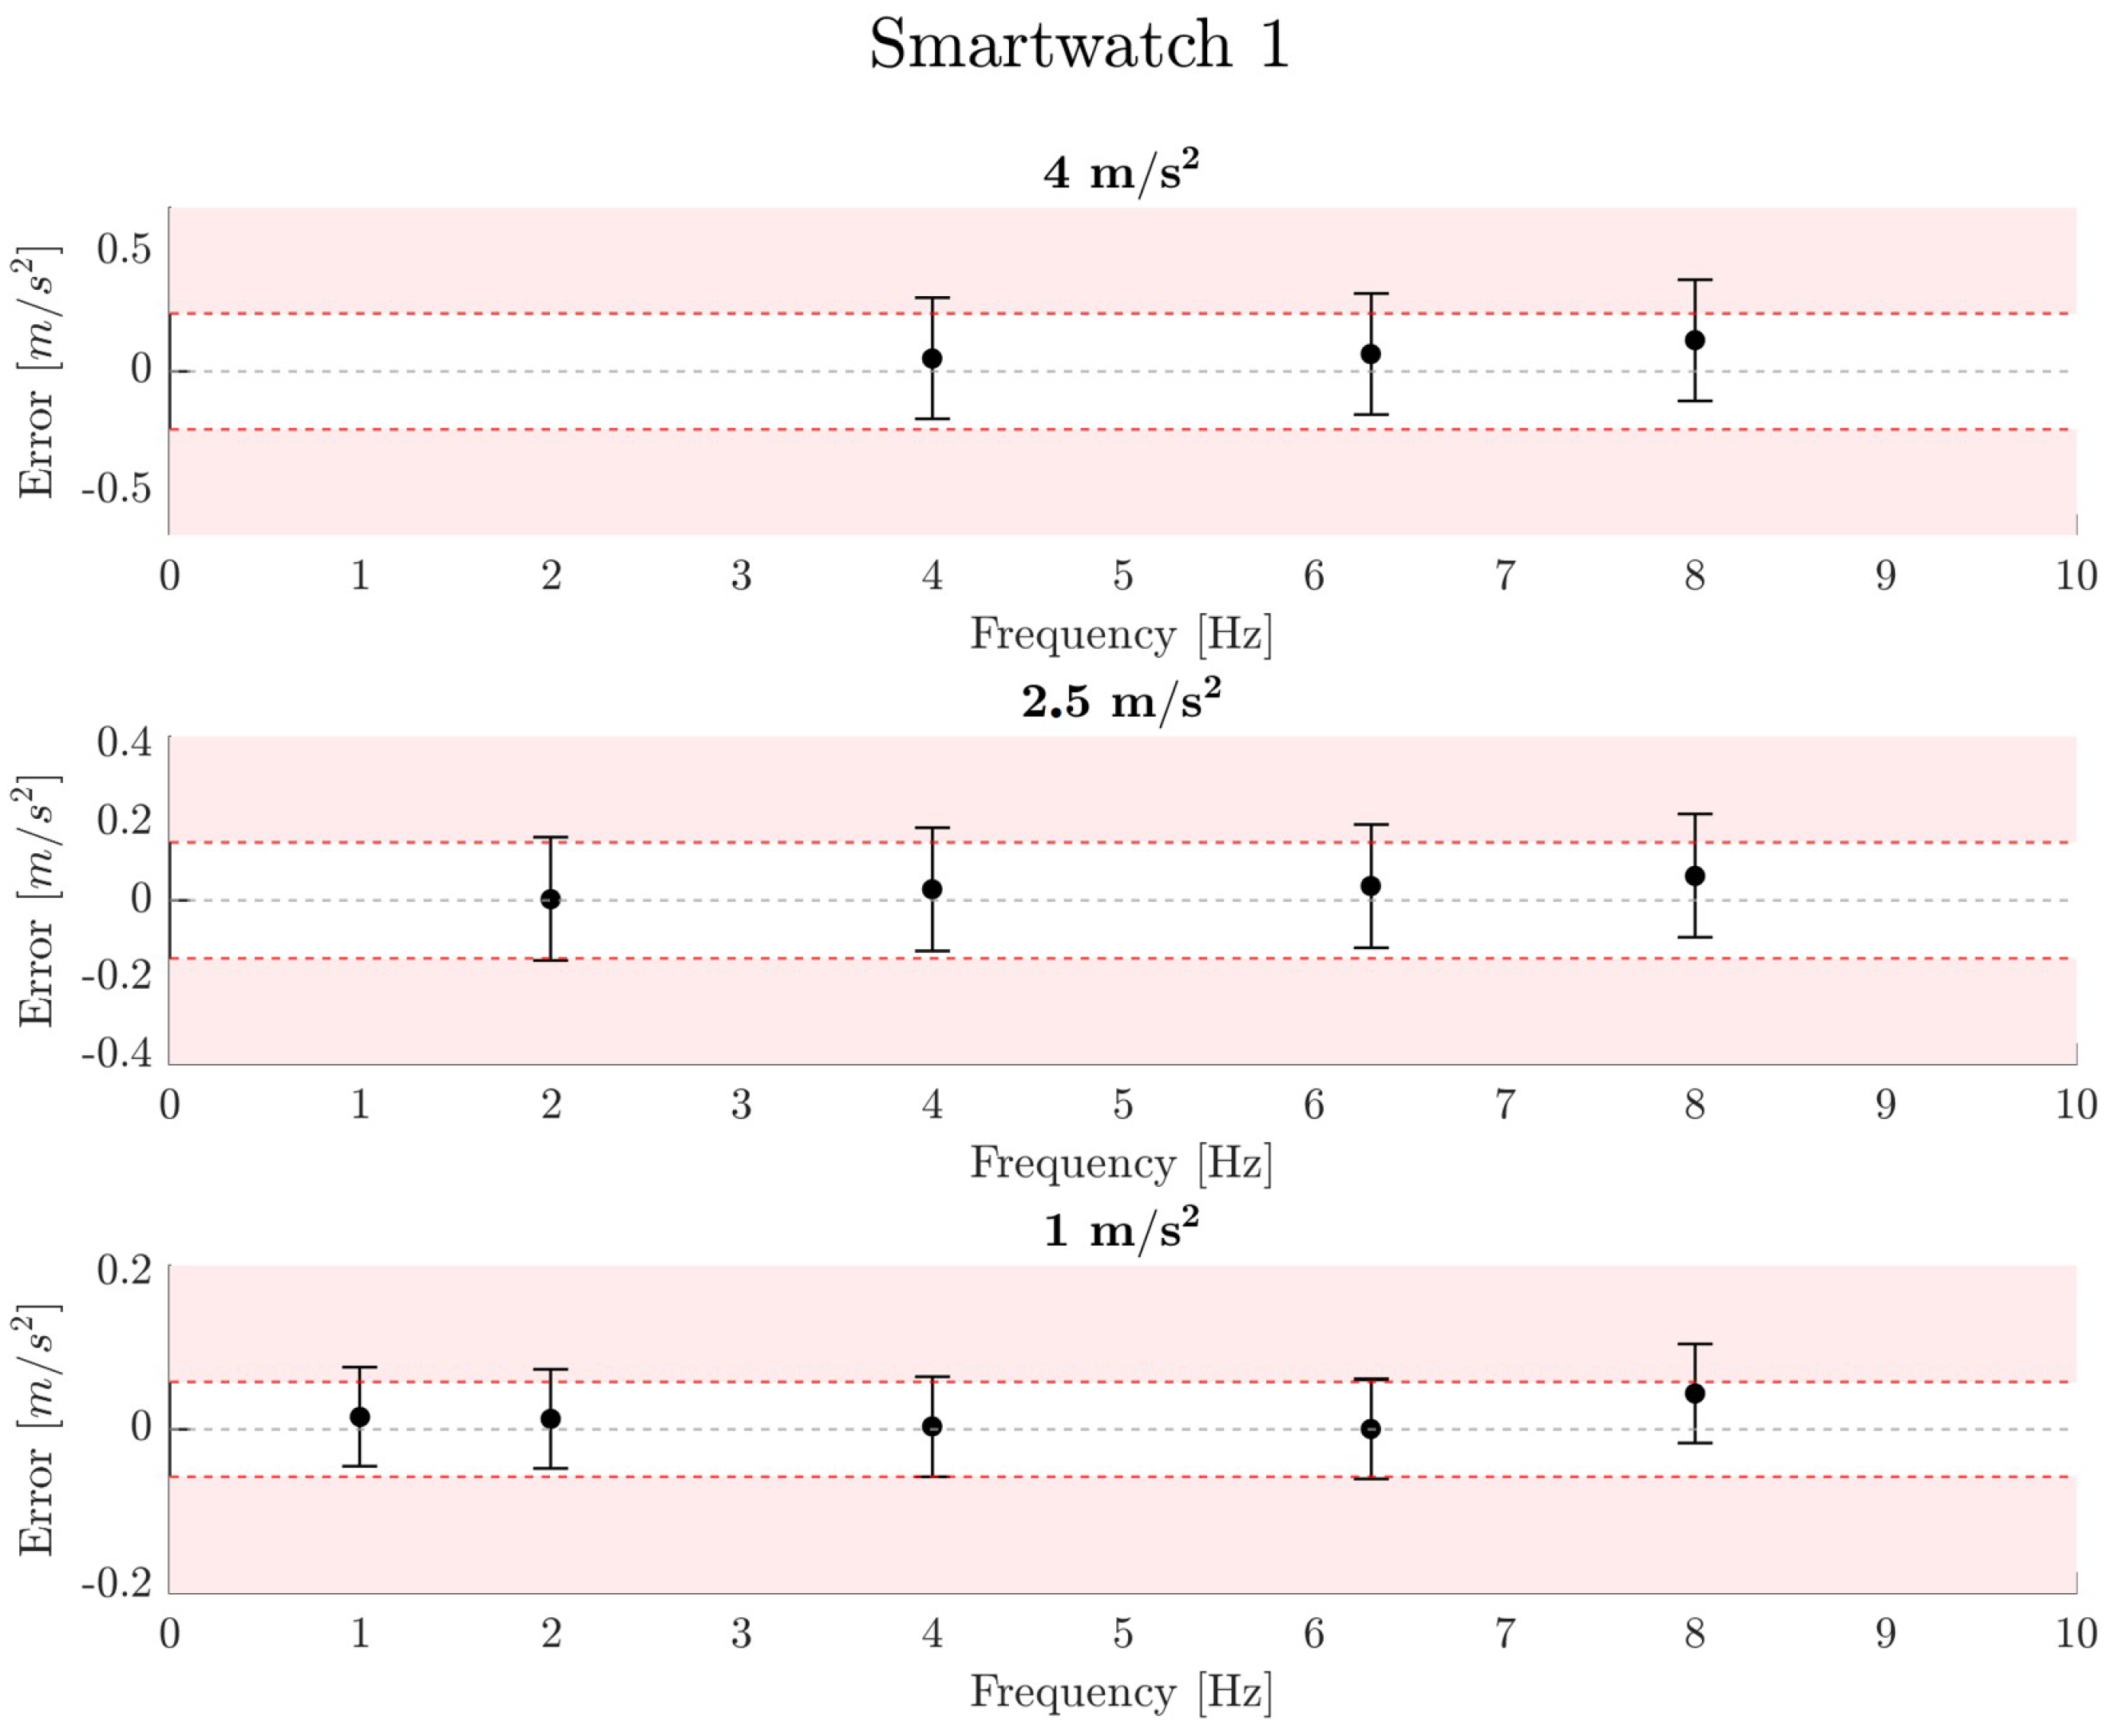
Indication error and expanded uncertainty range of smartwatch unit 1 at three excitation amplitudes (1, 2.5, and 4 m/s2). The x-axis represents the excitation frequency (Hz) and the y-axis represents the indication error (m/s2). Error bars represent the expanded uncertainty while the dashed lines indicate the ±6% threshold.
Figure 8.
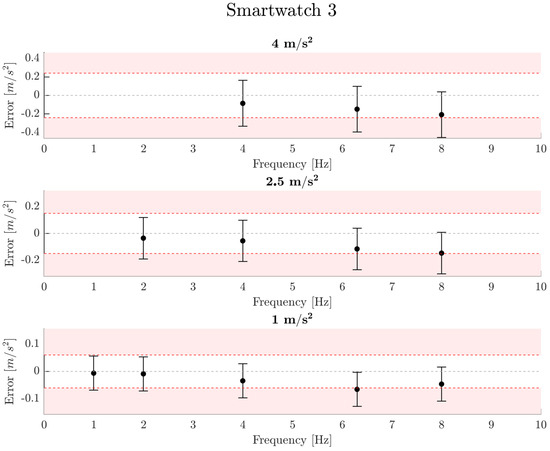
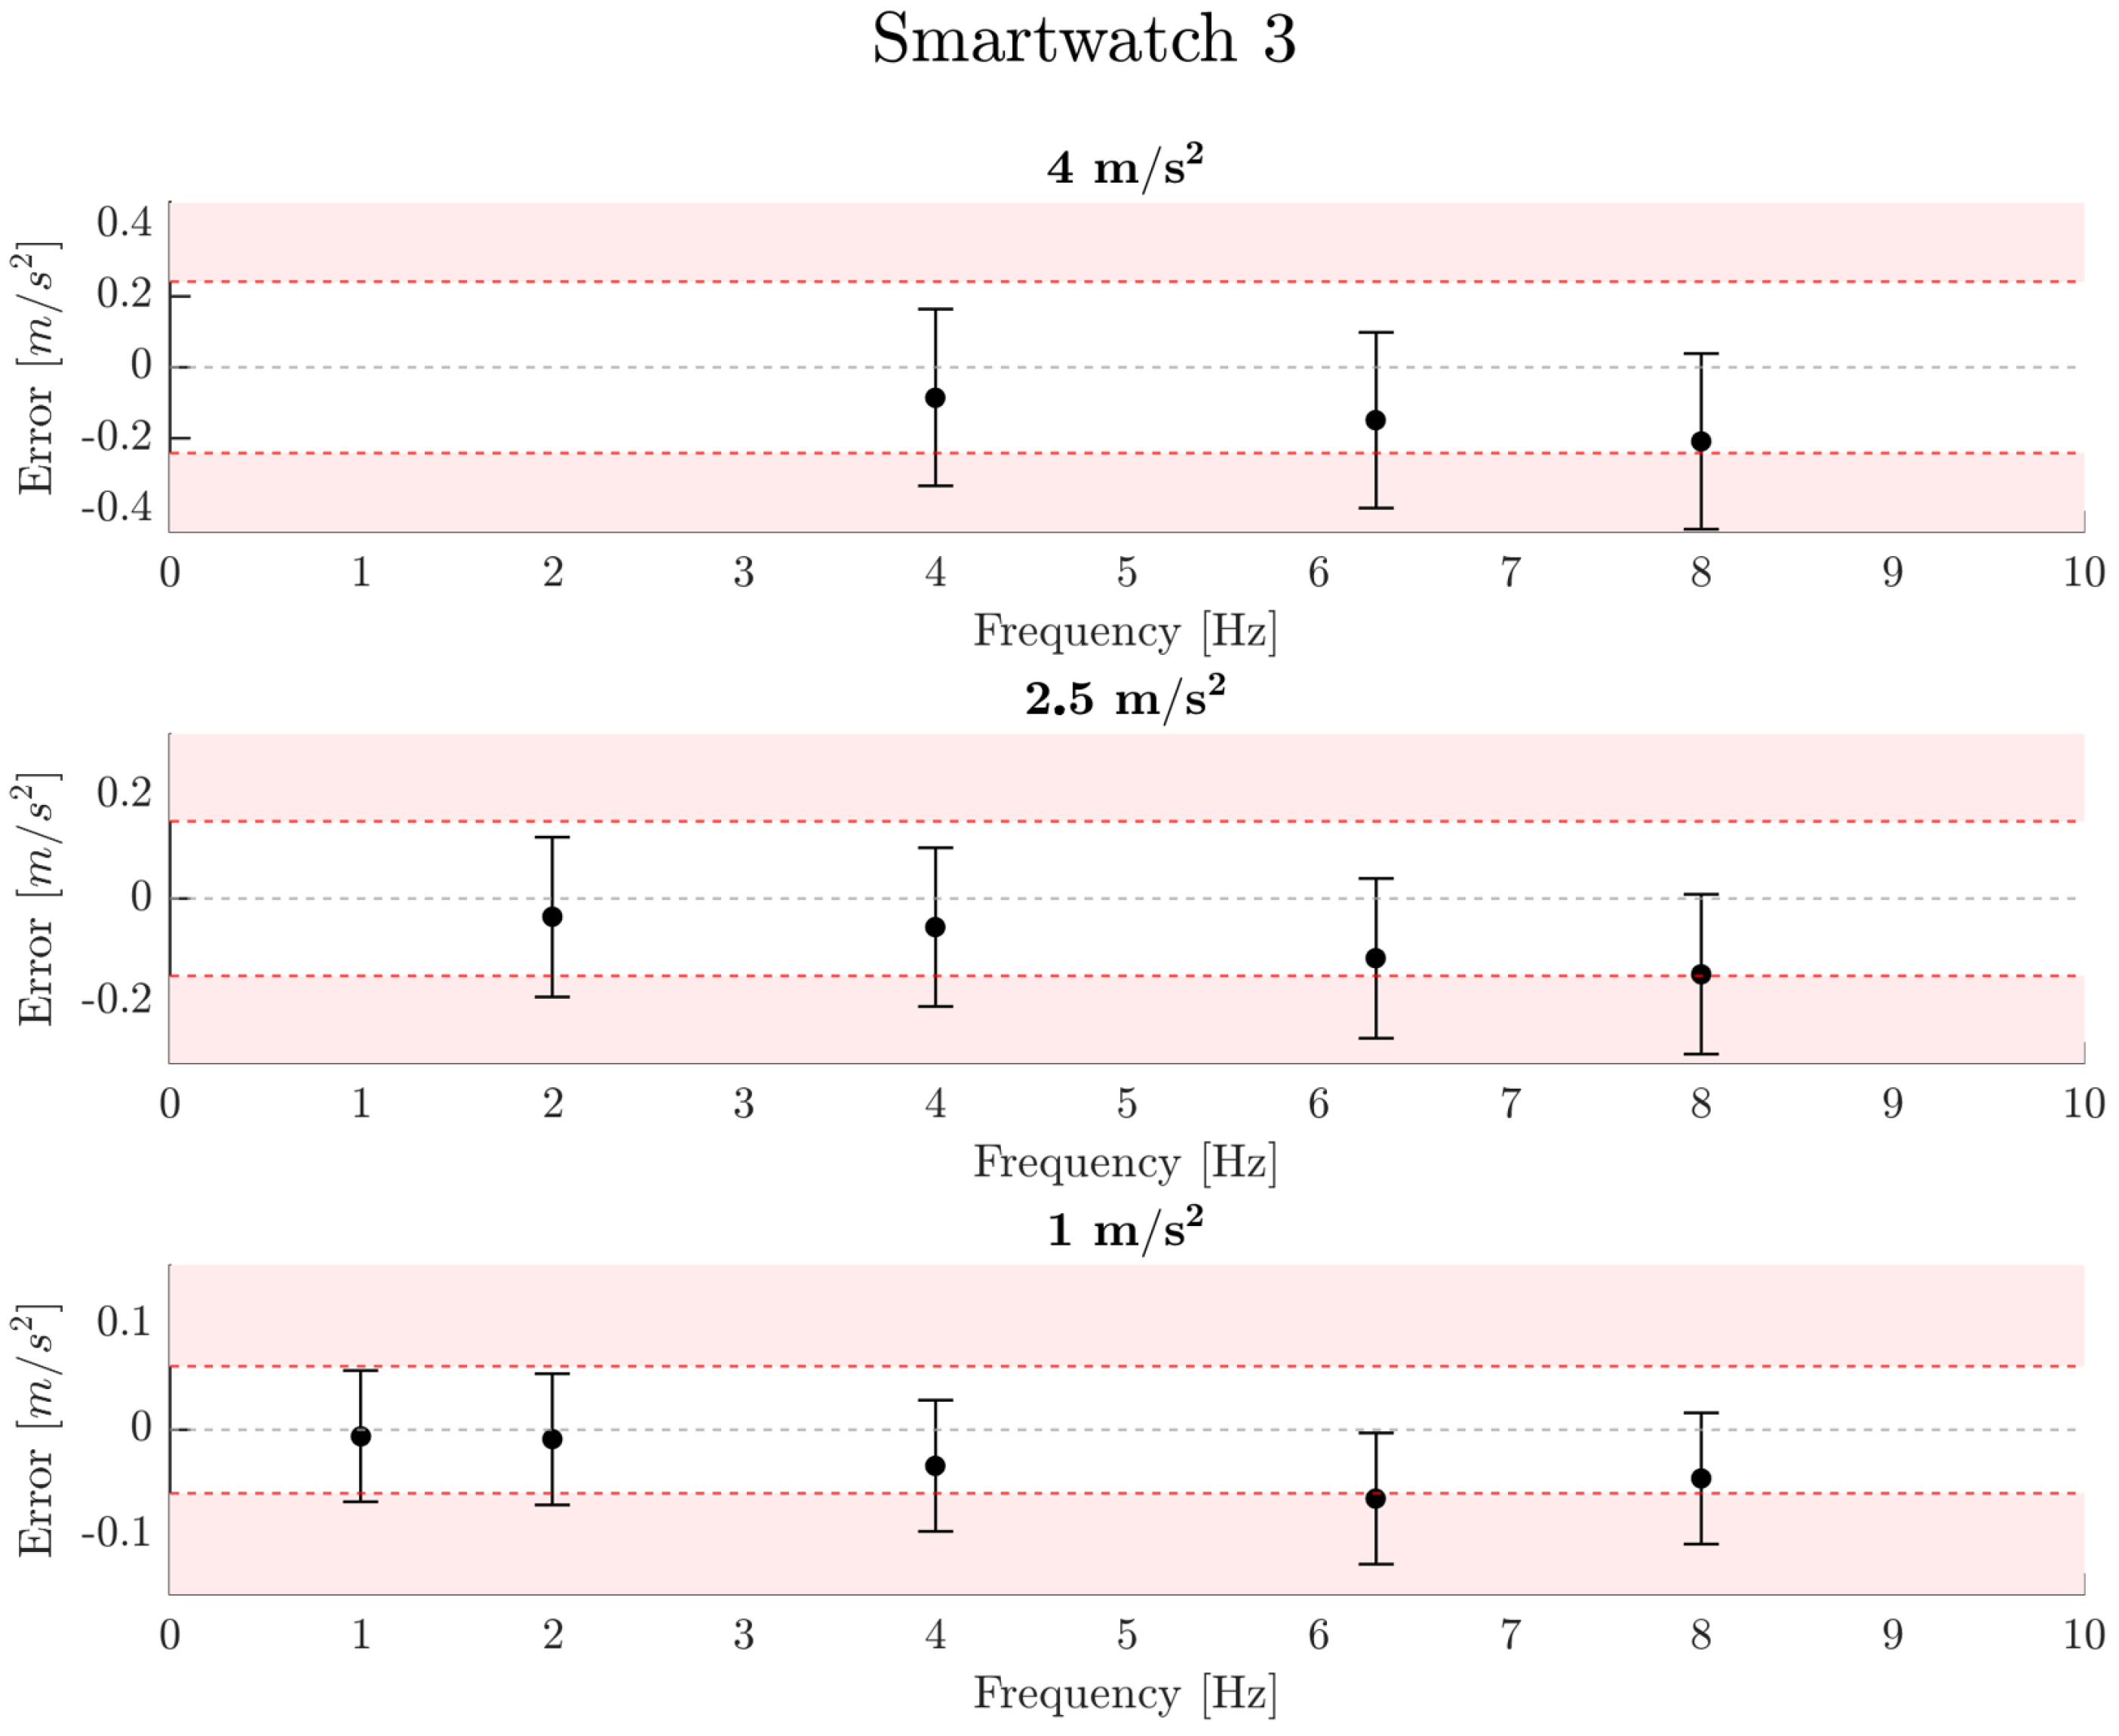
Indication error and expanded uncertainty range of smartwatch unit 3 at three excitation amplitudes (1, 2.5, and 4 m/s2). The x-axis represents the excitation frequency (Hz) and the y-axis represents the indication error (m/s2). Error bars represent the expanded uncertainty while the dashed lines indicate the ±6% threshold.
Figure 9.
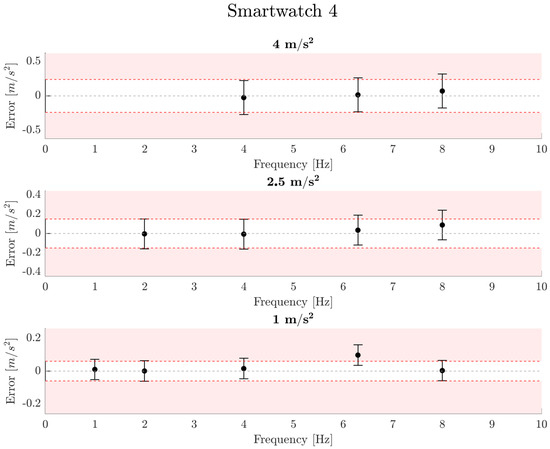
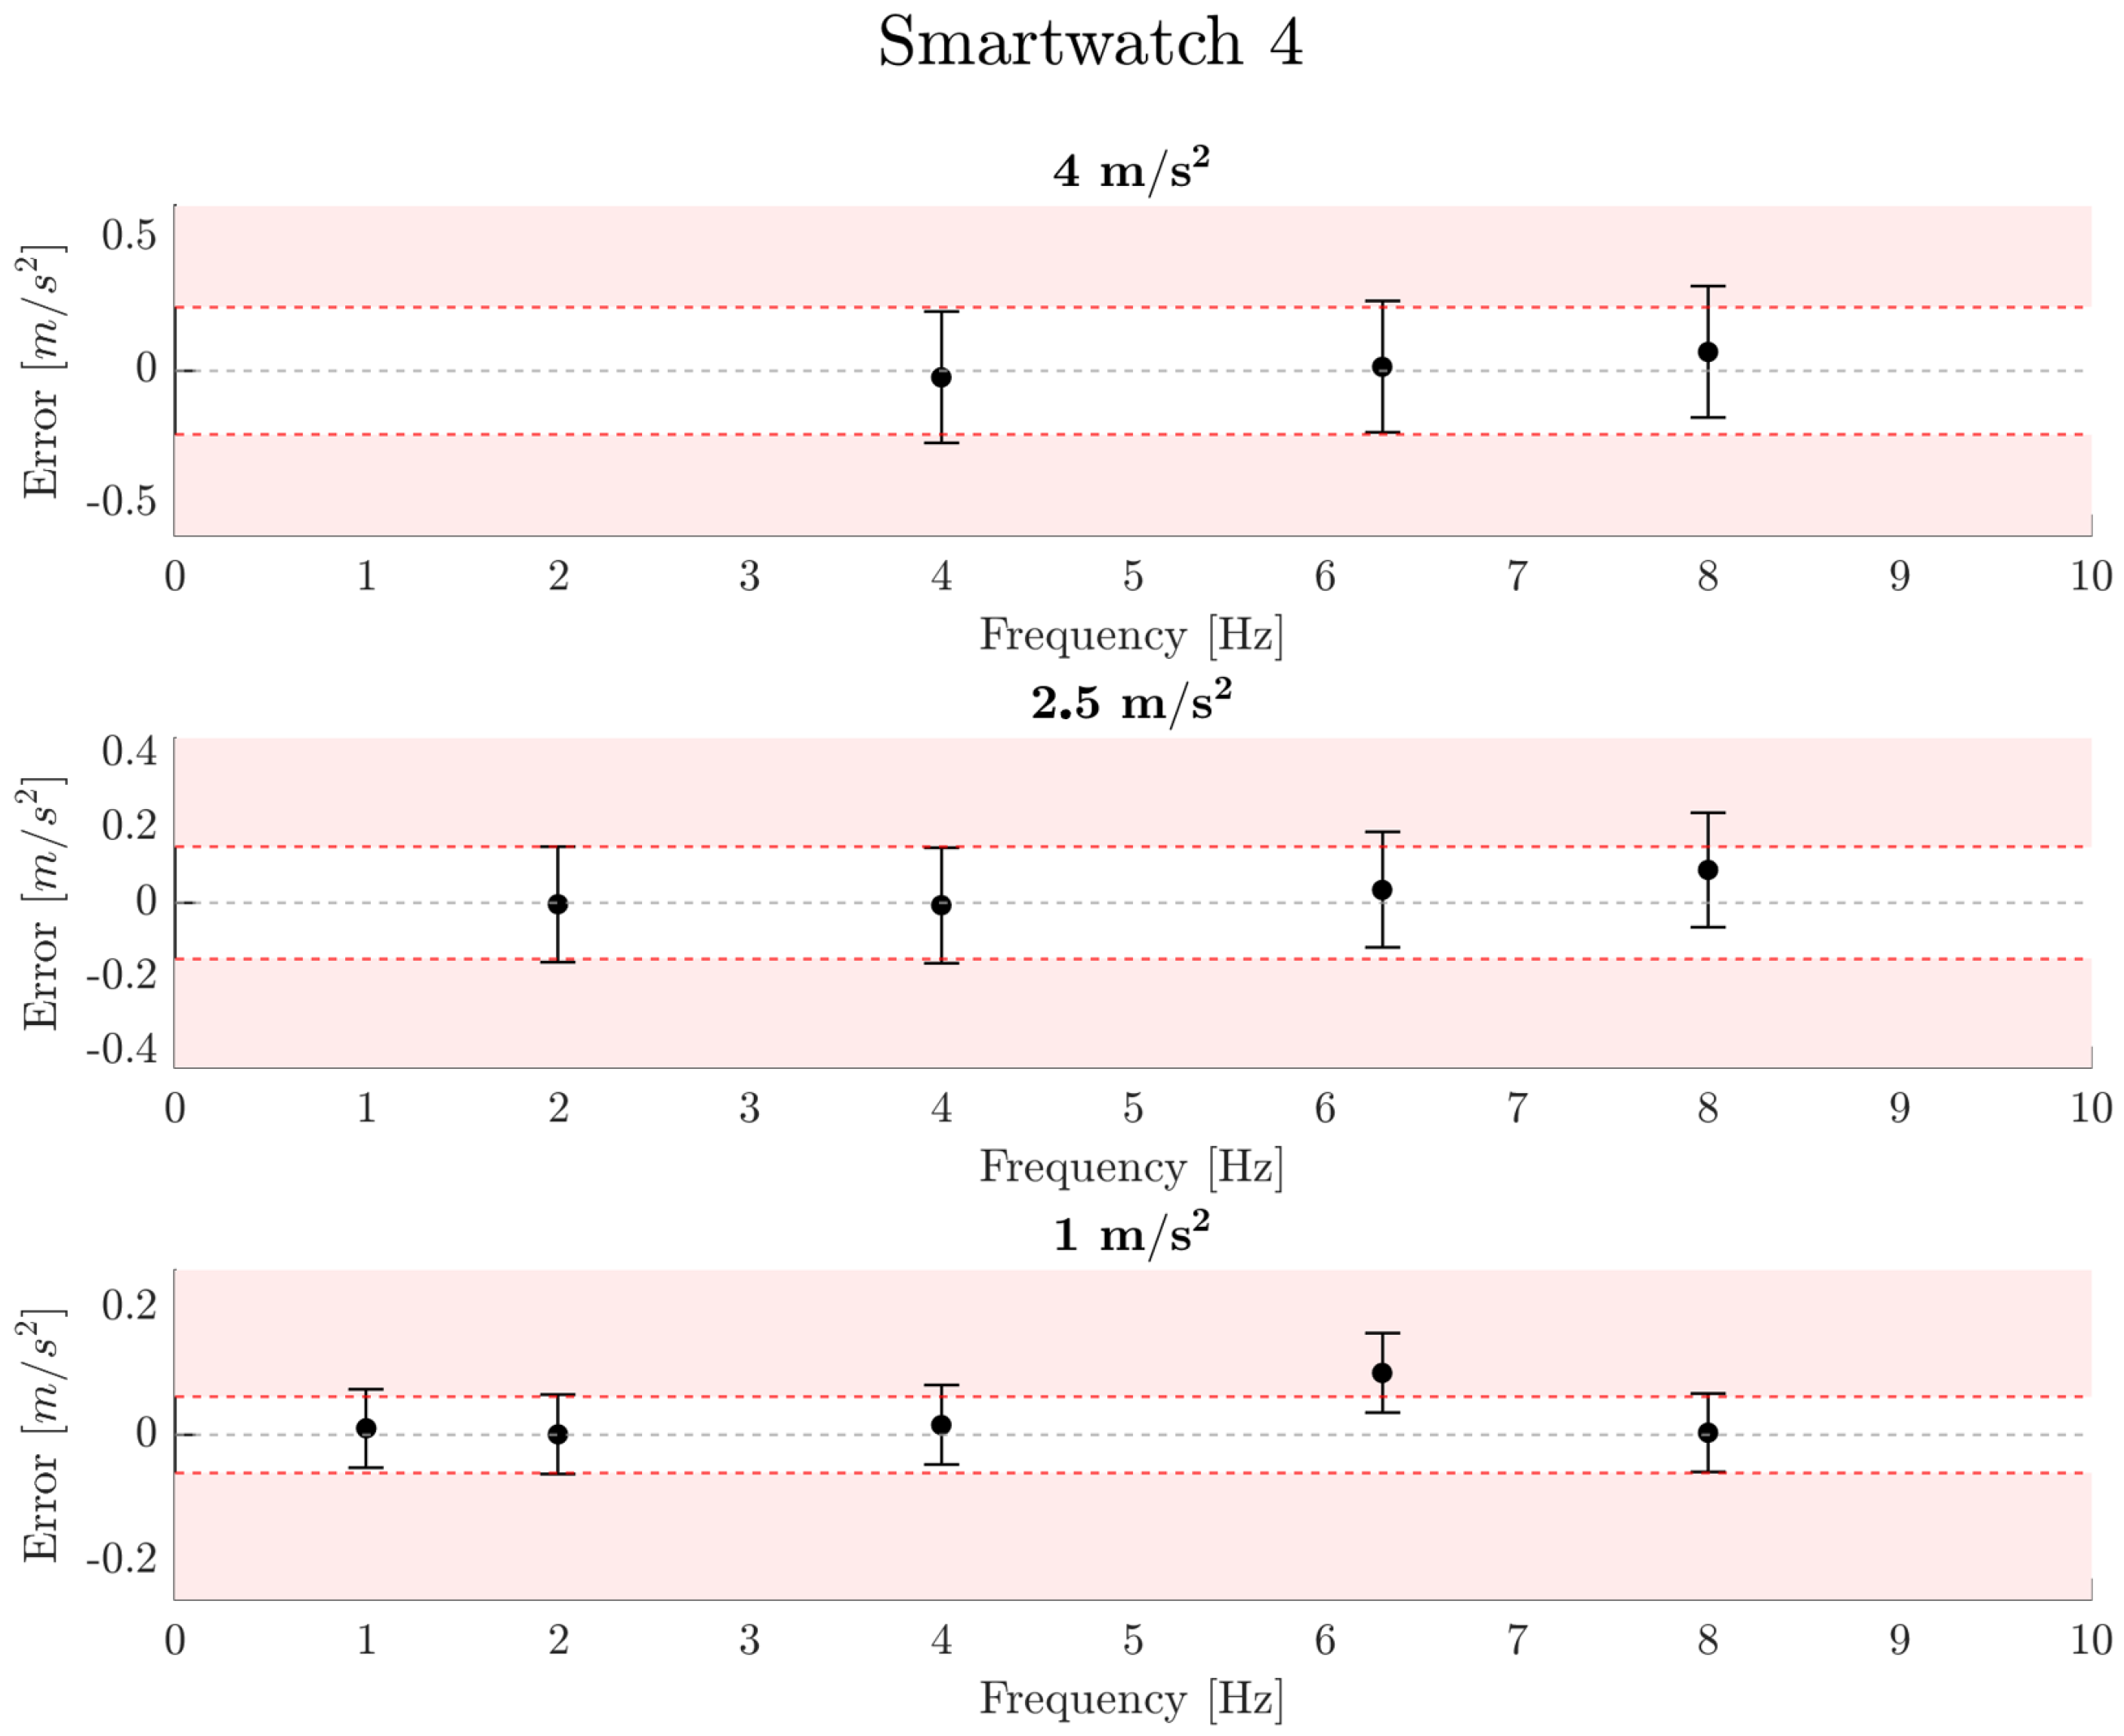
Indication error and expanded uncertainty range of smartwatch unit 4 at three excitation amplitudes (1, 2.5, and 4 m/s2). The x-axis represents the excitation frequency (Hz) and the y-axis represents the indication error (m/s2). Error bars represent the expanded uncertainty while the dashed lines indicate the ±6% threshold.
Figure 10.
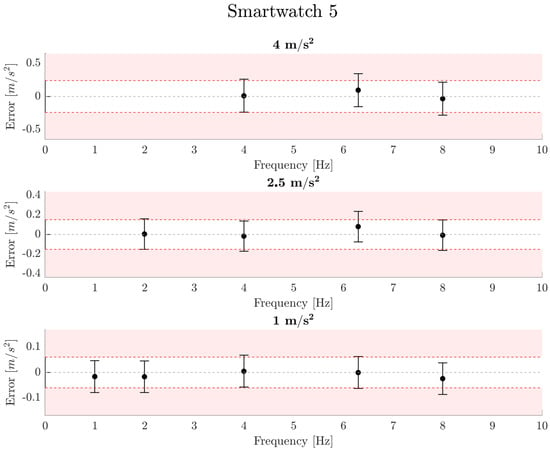
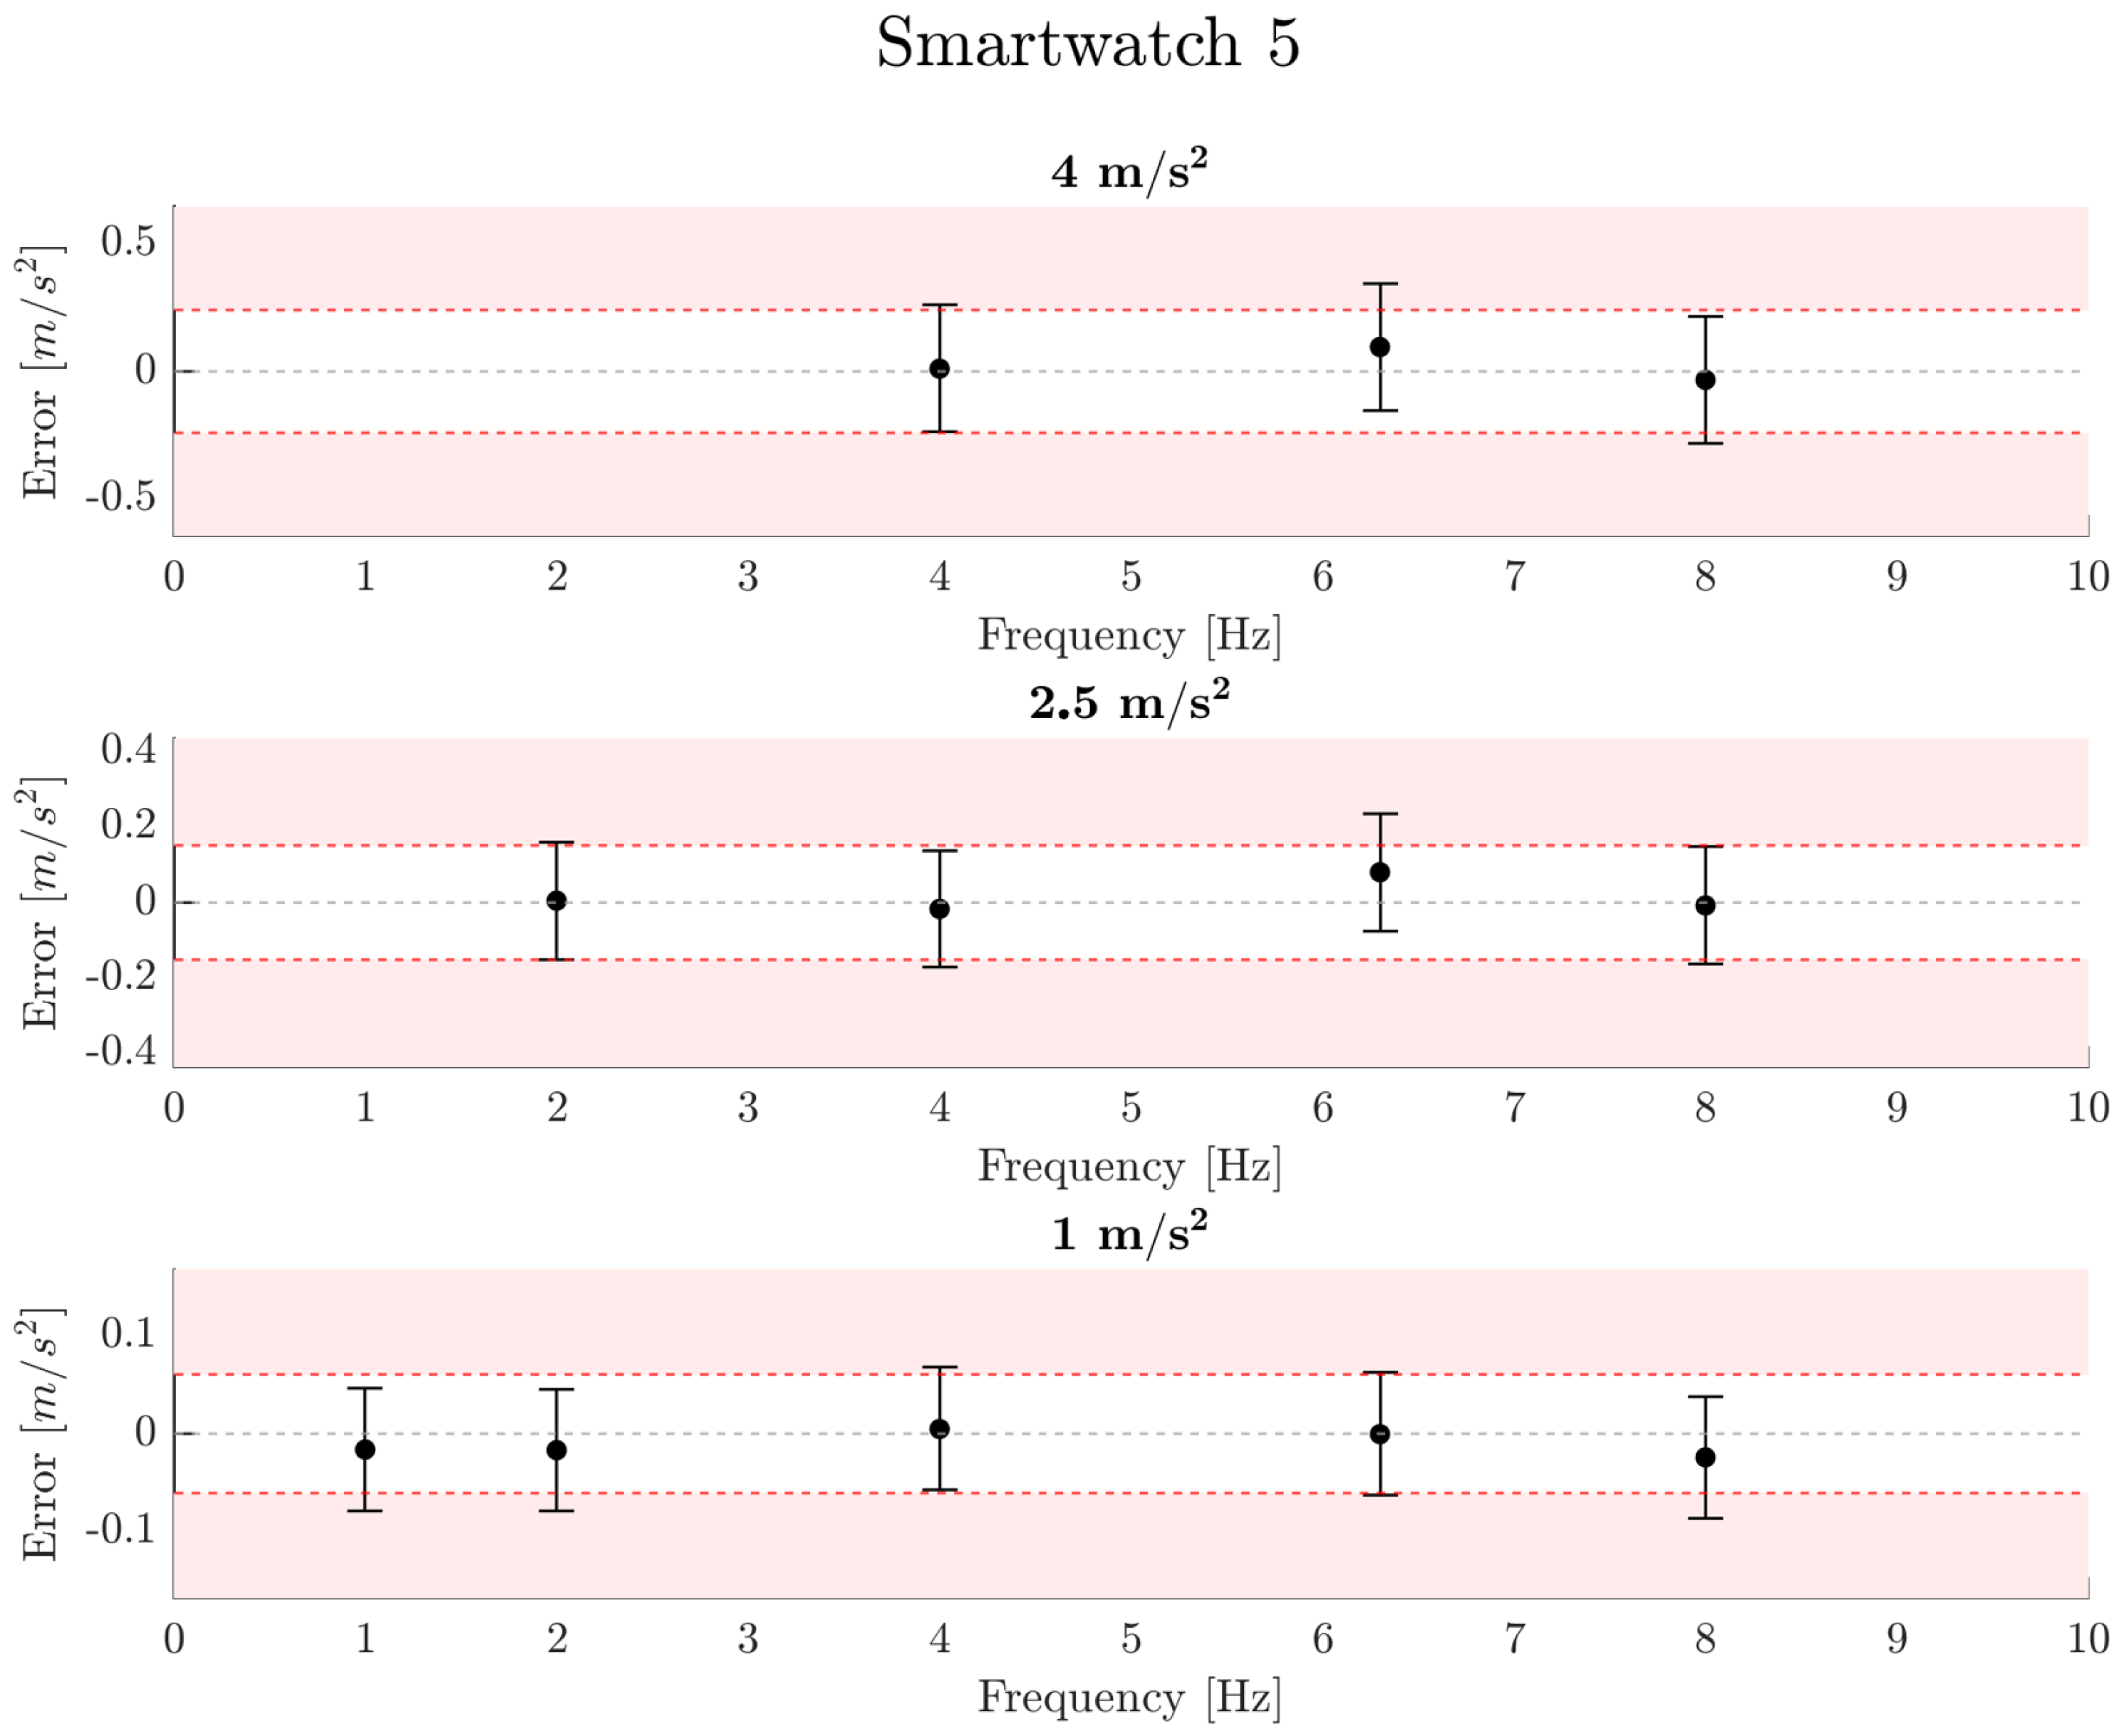
Indication error and expanded uncertainty range of smartwatch unit 5 at three excitation amplitudes (1, 2.5, and 4 m/s2). The x-axis represents the excitation frequency (Hz) and the y-axis represents the indication error (m/s2). Error bars represent the expanded uncertainty while the dashed lines indicate the ±6% threshold.
Figure 6 illustrates the error observed in smartwatch 1. In all study points, the acceleration measurements obtained for each frequency are generally higher than the reference values. However, all characterization points remain within the ±6% criterion. For the 1 m/s2 amplitude, which exhibits the largest deviations, the narrower acceptance interval makes these deviations more significant, as only values within the range of 1 ± 0.06 m/s2 are considered acceptable. Conversely, for amplitudes of 2.5 and 4 m/s2, the larger acceptance intervals provide wider acceptance intervals for measurement deviations. Overall, percentage errors range from 0.0 to 4.6%.
For smartwatch 2, shown in Figure 7, a trend similar to that observed in the previous case is observed, with recorded values generally higher than the expected ones. However, the deviations remain relatively small across the study range. At higher or lower frequencies and greater amplitudes, the recorded values remain within the acceptance criterion. In terms of percentage error, calculated according to Equation (3), the values range between −3.2% and 2.1%, corresponding to the combinations of 6.3 Hz—1 m/s2 and 8 Hz—1 m/s2, respectively.
In the case of smartwatch 3, most study points are within the uncertainty interval, as shown in Figure 8, although some cases exceed the ±6% criterion. Specifically, the combinations of 6.3 Hz—1 m/s2 and 8 Hz—2 m/s2 fall outside the acceptance criterion. At all excitation levels, a reduction in measured amplitude is observed at high frequencies, while the response remains more constant at low frequencies. This effect becomes progressively more pronounced as the excitation amplitude increases, with a more significant decrease at higher frequencies for higher excitation levels. Percentage error values range from −7.1% to −0.6%.
For the frequency response of smartwatch 4, in Figure 9, it can be observed that all recorded values for amplitudes of 2.5 and 4 m/s2 fall within the uncertainty interval. However, for the 1 m/s2 amplitude cases, larger deviations are observed at intermediate frequencies. Particularly notable is the case of 6.3 Hz, where the recorded value exhibits the largest deviation from the reference value. For reference, the percentage errors of most tests remain below 6%, with only isolated cases exceeding this criterion. Overall, percentage errors range from −0.6% to 9.8%.
Finally, for smartwatch 5, as shown in Figure 10, no clear systematic trend is observed for 2.5 m/s2, with values distributed around the uncertainty interval. However, for 4 m/s2, all values fall within the uncertainty interval, while for 1 m/s2, greater variability is observed across frequencies. Nevertheless, all characterization points satisfy the ±6% criterion. The percentage error ranges from −2.4% to 3.2%.
Table 4 summarizes the metrological characterization results for all five smartwatch units, providing a concise comparison across devices in terms of mean absolute error, maximum absolute error, RMSE, percentage error range, mean expanded uncertainty, and the proportion of test conditions satisfying the ±6% criterion. This overview complements the device-specific figures presented above by enabling a direct cross-device comparison of measurement performance.
4. Discussion
The results obtained from the experimental evaluation demonstrate that the proposed simultaneous metrological characterization methodology is a viable and efficient approach for characterizing the acceleration measurements of consumer-grade smartwatches. The capability to calibrate multiple devices concurrently offers considerable advantages for large-scale studies, particularly in healthcare research, where numerous participants utilize smartwatches for movement monitoring. Conventional characterization methods are based on individual device evaluation, rendering large-scale implementation time-intensive. By contrast, the proposed methodology allows for the simultaneous evaluation of all smartwatch accelerometers, meaning that the total time required to calibrate is equivalent to the time needed to calibrate just one unit in traditional methods. This approach provides a significant advantage, particularly as the number of devices to be evaluated increases, thereby reducing overall characterization time and improving efficiency.
Despite its advantages, the methodology is subject to certain limitations arising from the mechanical constraints of the seismic table, which restrict the range of frequencies and amplitudes that can be examined. The three excluded amplitude–frequency combinations (1 Hz at 2.5 m/s2, 1 Hz at 4 m/s2, and 2 Hz at 4 m/s2) correspond to low-frequency, high-amplitude conditions that may be clinically relevant in certain movement disorder contexts. While the proposed methodology is intended as a general simultaneous metrological characterization framework, its practical implementation for specific motor disorders requires careful consideration of the characteristic frequency and amplitude ranges associated with each condition. When deploying this approach for a particular clinical application, it is therefore recommended to select an excitation device capable of reliably covering the full amplitude and frequency range characteristic of the target disorder, avoiding the mechanical limitations observed in the device used in this study at low-frequency, high-amplitude combinations. Future work should explore alternative vibration platforms with extended linear operating ranges, as well as more complex excitation profiles, to ensure more complete validation coverage across clinically meaningful conditions.
It is also worth noting that the higher dispersion observed across smartwatch measurements at 1 m/s2 excitation levels is likely influenced by the signal-to-noise ratio (SNR) characteristics of consumer-grade accelerometers. At this amplitude, the excitation signal is closest to the noise floor of the embedded sensors, meaning that background noise contributes more significantly to the recorded values relative to the actual excitation. This effect is consistent with the results presented in Figure 6, Figure 7, Figure 8, Figure 9 and Figure 10, where the 1 m/s2 condition systematically exhibits greater variability and a higher number of out-of-range points compared to the 2.5 and 4 m/s2 conditions across all five smartwatch units. A formal characterization of the noise floor for each smartwatch unit would provide a more rigorous basis for interpreting low-amplitude measurements and should be considered in future implementations of this metrological characterization protocol.
It should be noted that this study evaluates sensor performance exclusively in terms of RMS acceleration error. Movement disorder monitoring typically relies on downstream digital biomarkers, such as peak frequency, frequency-band power, gait periodicity, or tremor scores, whose validity cannot be directly inferred from a low RMS error. The proposed metrological characterization framework should therefore be understood as a necessary metrological foundation, rather than a validation of specific clinical metrics. For studies targeting a particular biomarker, the uncertainty characterization provided here could serve as a basis for formal uncertainty propagation from the sensor level to the biomarker level, following the ISO-GUM framework [42], allowing a principled estimation of how sensor measurement uncertainty contributes to the total uncertainty of the derived clinical metric.
The present study evaluates short-term repeatability through three repetitions for each amplitude–frequency condition following ISO 8041-1:2017 [31] recommendations. However, additional reproducibility aspects were not assessed, including within-day and between-day reproducibility, remounting variability, firmware-related effects, battery level influence, and other operational conditions that may affect accelerometer performance during prolonged real-world use. These factors may introduce additional variability in wearable sensing applications and should therefore be systematically evaluated in future work. Furthermore, although the signal acquisition application employed in this study had been previously characterized and showed data loss limited to approximately 2% of the recorded samples, intermittent signal discontinuities and sensor anomalies remain important considerations for long-term clinical monitoring applications.
In this work, the analysis was restricted to the z-axis, which received the direct excitation from the seismic table. Although most consumer-grade smartwatches incorporate triaxial accelerometers, the extension of the proposed methodology to the remaining axes is plausible but remains to be empirically verified. Factors such as device mounting orientation, gravitational component distribution, and cross-axis sensitivity may differ across axes and could influence the calibration results in ways that cannot be directly inferred from the present z-axis evaluation. If this proposal is successfully extended, the efficiency gains of simultaneous calibration would be even more pronounced, as the total number of tests remains constant regardless of the number of devices, making the approach particularly attractive for large-scale triaxial characterization. Future work should therefore empirically evaluate the applicability of the proposed methodology to the remaining accelerometer axes.
It should be noted that only one unit per smartwatch unit was tested in this study. However, this does not constitute a limitation of the proposed methodology, since metrological characterization is inherently an individual-device procedure. Two units of the same model cannot be assumed to be metrologically equivalent, as manufacturing tolerances, firmware versions, and sensor-level variability may introduce differences in measurement performance between units. The proposed framework is precisely intended to address this issue by providing a tool to characterize each individual device before deployment in a research or clinical study, regardless of its model. Nevertheless, it should be acknowledged that testing only one unit per model constitutes a limitation of the present study in terms of generalizability. The findings reported in this document apply exclusively to the specific devices tested and cannot be extrapolated to the performance of each commercial model as a whole. In particular, within-model variability cannot be estimated from the present dataset, and future studies should include multiple units of the same model to assess the extent of inter-unit differences in accelerometer performance.
An additional limitation concerns the assumption of spatial uniformity of the vibration input across all device positions on the platform. Although the modal analysis confirmed that the first resonance frequency of the supporting structure was 56 Hz, well above the operational bandwidth of this study, this does not constitute direct evidence that all smartwatch positions received identical acceleration inputs. Local amplitude differences, phase differences, rotational components, and position-dependent effects were not directly verified through multi-position reference measurements. Spatial uniformity was therefore inferred from the structural design and modal analysis results rather than empirically demonstrated. Future implementations of this simultaneous calibration methodology should include direct verification of input uniformity, such as reference accelerometer measurements at multiple positions across the platform, to provide stronger experimental support for this assumption and further consolidate the validity of the concurrent evaluation approach.
A broader limitation of the current evaluation concerns the absence of a dedicated normative framework for the metrological validation of wearable accelerometers in healthcare applications. The 6% tolerance threshold adopted in this study is borrowed from ISO 8041-1:2017 [31], a standard designed for general-purpose vibration meters used in human vibration response assessment, which is not directly applicable to clinical or research wearable contexts. This threshold was therefore used solely as an indicative engineering reference to provide a basis for evaluating measurement error. The fact that expanded uncertainty intervals exceed this boundary at higher excitation amplitudes does not necessarily imply device failure, but rather reflects the inherent variability of consumer-grade sensors and the limitations of applying an engineering standard outside its intended scope. The authors wish to emphasize the need to develop specific metrological standards for portable accelerometers in clinical and research settings, as this remains a significant unmet need in this field. Such standards would need to define not only tolerance thresholds appropriate for specific clinical applications, but also reproducibility requirements, wearing condition specifications, and uncertainty reporting guidelines tailored to healthcare contexts.
Although the proposed methodology demonstrates the feasibility of simultaneous smartwatch accelerometer metrological characterization under controlled laboratory vibration conditions, the present study does not evaluate device performance in patients or free-living environments. Real-world movement disorder monitoring involves additional sources of variability, including sensor placement, motion artifacts, daily activity patterns, patient-specific movement characteristics, and potential signal discontinuities, which are not reproduced in the current bench-based setup. In this context, beyond measurement accuracy, signal continuity is also a critical factor in clinical movement monitoring, as intermittent data loss may compromise the reliability of long-term assessments. Therefore, further validation studies involving clinical populations and ecological monitoring conditions are required before the proposed methodology can support clinical assessment or healthcare decision-making applications.
In clinical movement-monitoring applications, accelerometers may be exposed to intermittent anomalies such as transient motion artefacts, short-duration disturbances, or temporary signal instabilities. Under these conditions, accurate metrological characterization and rigorous uncertainty characterization are particularly important to ensure reliable sensor response, especially when detecting low-amplitude or rapidly varying motion events. The proposed methodology contributes to improving the metrological reliability of wearable accelerometer systems intended for use in such environments, by providing a systematic framework for quantifying and controlling measurement uncertainty prior to deployment.
The clinical implications of device-related measurement error deserve further consideration, particularly in the context of large-scale movement disorder research. Over recent years, there has been a growing trend in the scientific community toward quantifying motor symptoms through instrumental methods using wearable devices, with the aim of providing more objective and continuous assessments than traditional clinical evaluations. In this context, RMS acceleration is one of the most commonly used metrics for characterizing tremor amplitude and consistency. Established clinical scales such as the Unified Parkinson’s Disease Rating Scale (UPDRS) have been correlated with RMS-based acceleration features derived from wearable sensors [18], meaning that measurement uncertainty at the sensor level may propagate into the assignment of clinical scores. For instance, uncertainty in the RMS estimate obtained from a given device could affect the estimation of derived digital biomarkers and, in studies where such biomarkers are related to clinical scales such as the UPDRS, may influence the interpretation of category-level changes, longitudinal progression, or intervention-related effects. Furthermore, in longitudinal studies where the objective is to detect change over time between an initial assessment and a follow-up measurement, the dispersion of the recorded signal has one component associated with the actual biological variability of the patient, and other associated with the instrumentation itself. If the measurement uncertainty is not properly characterized and accounted for, it may mask true clinical change or, conversely, be misinterpreted as meaningful progression. Similar considerations apply to between-group comparisons, where systematic differences in device performance across units could introduce bias, and to device replacement in longitudinal studies, where metrological continuity between units must be ensured. The proposed calibration framework directly addresses this need by providing a systematic tool to quantify and document the measurement uncertainty of each individual device prior to deployment, thereby allowing researchers to estimate the contribution of instrumental uncertainty to the total variability of derived clinical metrics.
Additionally, it should be pointed out that motor symptoms in movement disorders are not only characterized by the energy contained in each frequency but also by highly variable peak-to-peak amplitudes, transient events, and rapidly evolving signal morphologies, such as those observed in dyskinesia episodes or in signals with fast-onset characteristics. These features cannot be adequately captured by sinusoidal steady-state excitation at fixed amplitude and frequency combinations. Addressing this limitation would require the development of dedicated simultaneous evaluation protocols capable of reproducing more complex, non-stationary excitation profiles under controlled conditions. Future work should therefore explore excitation waveforms beyond pure sinusoidal signals, including transient, swept-frequency, or clinically representative recorded signals, as well as the applicability of complementary ISO standards that address dynamic measurement beyond steady-state sinusoidal conditions, such as those covering shock calibration or broadband vibration characterization, such as those covering shock calibration (ISO 16063-13 [43]), transient motion (ISO 16063-15) [44], which may provide a more complete metrological framework for the evaluation of wearable accelerometers in complex motor symptom monitoring scenarios.
5. Conclusions
This study presents a methodology for calibrating smartwatch accelerometers using a seismic table as the excitation source under controlled laboratory conditions. The proposed metrological characterization approach, based on a comparison with a reference accelerometer, enables the simultaneous evaluation of multiple smartwatch accelerometers under identical mechanical vibration conditions. The results demonstrate that the specific smartwatch units tested recorded acceleration values closely aligned with those of the reference accelerometer under bench-based testing, in terms of point estimates. However, the expanded uncertainty intervals exceed the 6% reference threshold adopted in this study, particularly at higher excitation amplitudes. These findings should therefore be interpreted with caution, and the proposed methodology should be understood as a metrological characterization tool rather than a definitive validation of device accuracy for clinical applications.
In the context of movement disorder monitoring, precise accelerometer characterization is essential for ensuring data reliability. Movement disorders, such as Parkinson’s disease or Huntington’s disease, are characterized by alterations in motion patterns that necessitate accurate sensor measurements for proper assessment and tracking. The proposed approach enhances standardization across study devices, mitigating inconsistencies in accelerometer data collection. By pre-validating smartwatch sensors within a controlled amplitude and frequency range, this methodology aims to enhance reproducibility across studies and over time, thereby strengthening the reliability of movement disorder assessments. Furthermore, it may serve as an initial metrological screening tool to document the measurement performance of individual smartwatch units before their use in research studies. However, the present study evaluates only selected individual devices under bench-based conditions, and these findings cannot be directly extrapolated to clinical accuracy, suitability for patient monitoring, or validity of movement disorder digital biomarkers.
Beyond the technical domain, the systematic metrological characterization of smartwatch accelerometers prior to their deployment in research studies may contribute to more reliable data collection, which is a necessary precondition for meaningful clinical insights. The efficiency of the simultaneous evaluation approach also reduces time, energy consumption, and associated costs, making large-scale deployment more feasible. Finally, as wearable technology continues to expand its role in remote and continuous health monitoring, having a validated and scalable characterization framework becomes increasingly critical to bridge the gap between consumer-grade devices and clinical-grade standards. Any application of this methodology toward clinical movement disorder monitoring or the validation of digital biomarkers will require further validation under human wearing conditions, free-living environments, and relevant patient populations.
Author Contributions
Conceptualization: C.P.-F., M.C.-C. and I.P.; Data curation: C.P.-F. and M.C.-C.; Formal analysis: C.P.-F. and M.C.-C.; Funding acquisition: G.d.A. and I.P.; Investigation: C.P.-F., M.C.-C. and I.P.; Methodology: C.P.-F., M.C.-C. and I.P.; Project administration: I.P.; Resources: G.d.A. and I.P.; Supervision: I.P.; Validation: C.P.-F., L.S. and I.P.; Visualization: C.P.-F., M.C.-C., L.S., C.A. and I.P.; Writing—original draft: C.P.-F., M.C.-C., L.S. and I.P.; Writing—review & editing: C.P.-F., M.C.-C., L.S., G.d.A., C.A. and I.P. All authors have read and agreed to the published version of the manuscript.
Funding
This research has been possible thanks to the financing of the project BIOCLITE PID2021-123708OB-I00, funded by MCIN/AEI/10.13039/501100011033/FEDER, EU.
Data Availability Statement
Data is contained within the article.
Acknowledgments
During the preparation of this work, the authors used DeepAI to assist with stylistic editing. Following the use of this tool, the authors have reviewed and edited the output and take full responsibility for the content of this publication.
Conflicts of Interest
The authors declare that they have no known competing financial interests or personal relationships that could have appeared to influence the work reported in this paper.
References
- Bonato, P. Wearable Sensors and Systems. IEEE Eng. Med. Biol. Mag. 2010, 29, 25–36. [Google Scholar] [CrossRef] [Scilit]
- Iqbal, S.M.A.; Mahgoub, I.; Du, E.; Leavitt, M.A.; Asghar, W. Advances in healthcare wearable devices. NPJ Flex. Electron. 2021, 5, 9. [Google Scholar] [CrossRef] [Scilit]
- Dunn, J.; Runge, R.; Snyder, M. Wearables and the Medical Revolution. Pers. Med. 2018, 15, 429–448. [Google Scholar] [CrossRef] [Scilit]
- Shajari, S.; Kuruvinashetti, K.; Komeili, A.; Sundararaj, U. The Emergence of AI-Based Wearable Sensors for Digital Health Technology: A Review. Sensors 2023, 23, 9498. [Google Scholar] [CrossRef] [Scilit] [PubMed]
- Borzì, L.; Sigcha, L.; Olmo, G. Context Recognition Algorithms for Energy-Efficient Freezing-of-Gait Detection in Parkinson’s Disease. Sensors 2023, 23, 4426. [Google Scholar] [CrossRef] [Scilit] [PubMed]
- Kristoffersson, A.; Lindén, M. A Systematic Review of Wearable Sensors for Monitoring Physical Activity. Sensors 2022, 22, 573. [Google Scholar] [CrossRef] [Scilit]
- Bayat, A.; Pomplun, M.; Tran, D.A. A Study on Human Activity Recognition Using Accelerometer Data from Smartphones. Procedia Comput. Sci. 2014, 34, 450–457. [Google Scholar] [CrossRef] [Scilit]
- Li, Y.; Yang, G.; Su, Z.; Li, S.; Wang, Y. Human activity recognition based on multienvironment sensor data. Inf. Fusion 2023, 91, 47–63. [Google Scholar] [CrossRef] [Scilit]
- Caroppo, A.; Manni, A.; Rescio, G.; Carluccio, A.M.; Siciliano, P.A.; Leone, A. Movement Disorders and Smart Wrist Devices: A Comprehensive Study. Sensors 2025, 25, 266. [Google Scholar] [CrossRef] [Scilit]
- Masoumian Hosseini, M.; Masoumian Hosseini, S.T.; Qayumi, K.; Hosseinzadeh, S.; Sajadi Tabar, S.S. Smartwatches in healthcare medicine: Assistance and monitoring; a scoping review. BMC Med. Inform. Decis. Mak. 2023, 23, 248. [Google Scholar] [CrossRef] [Scilit]
- Sigcha, L.; Polvorinos-Fernández, C.; Costa, N.; Costa, S.; Arezes, P.; Gago, M.; Lee, C.; López, J.M.; de Arcas, G.; Pavón, I. Monipar: Movement data collection tool to monitor motor symptoms in Parkinson’s disease using smartwatches and smartphones. Front. Neurol. 2023, 14, 1326640. [Google Scholar] [CrossRef] [Scilit]
- Abbadessa, G.; Lavorgna, L.; Miele, G.; Mignone, A.; Signoriello, E.; Lus, G.; Clerico, M.; Sparaco, M.; Bonavita, S. Assessment of Multiple Sclerosis Disability Progression Using a Wearable Biosensor: A Pilot Study. J. Clin. Med. 2021, 10, 1160. [Google Scholar] [CrossRef] [Scilit]
- Kinsella, F.C.; Bamdadian, A.; Gavidia, F.; Giboin, L.S.; Simillion, C.; Volkova-Volkmar, E.; Rennig, J.; Lindemann, M.; Lipsmeier, F.; McColgan, P.; et al. F029 Digital-HD: Smartphone and smartwatch-based testing to assess the motor, cognitive, and behavioural symptoms of Huntington’s disease. J. Neurol. Neurosurg. Psychiatry 2024, 95, A75–A76. [Google Scholar] [CrossRef] [Scilit]
- Qi, J.; Yang, P.; Waraich, A.; Deng, Z.; Zhao, Y.; Yang, Y. Examining sensor-based physical activity recognition and monitoring for healthcare using Internet of Things: A systematic review. J. Biomed. Inform. 2018, 87, 138–153. [Google Scholar] [CrossRef] [Scilit]
- Polvorinos-Fernández, C.; Sigcha, L.; Borzì, L.; Olmo, G.; Asensio, C.; López, J.M.; de Arcas, G.; Pavón, I. Evaluating Motor Symptoms in Parkinson’s Disease Through Wearable Sensors: A Systematic Review of Digital Biomarkers. Appl. Sci. 2024, 14, 10189. [Google Scholar] [CrossRef] [Scilit]
- Vanmechelen, I.; Haberfehlner, H.; De Vleeschhauwer, J.; Van Wonterghem, E.; Feys, H.; Desloovere, K.; Aerts, J.M.; Monbaliu, E. Assessment of movement disorders using wearable sensors during upper limb tasks: A scoping review. Front. Robot. AI 2023, 9, 1068413. [Google Scholar] [CrossRef] [Scilit] [PubMed]
- Polizzi, J.P.; Fain, B.; Maspero, F. Accelerometer. In Handbook of Silicon Based MEMS Materials and Technologies; Elsevier: Amsterdam, The Netherlands, 2020; pp. 879–898. [Google Scholar] [CrossRef] [Scilit]
- Sigcha, L.; Pavón, I.; Costa, N.; Costa, S.; Gago, M.; Arezes, P.; López, J.M.; De Arcas, G. Automatic Resting Tremor Assessment in Parkinson’s Disease Using Smartwatches and Multitask Convolutional Neural Networks. Sensors 2021, 21, 291. [Google Scholar] [CrossRef] [Scilit]
- Keren, K.; Busse, M.; Fritz, N.E.; Muratori, L.M.; Gazit, E.; Hillel, I.; Scheinowitz, M.; Gurevich, T.; Inbar, N.; Omer, N.; et al. Quantification of Daily-Living Gait Quantity and Quality Using a Wrist-Worn Accelerometer in Huntington’s Disease. Front. Neurol. 2021, 12. [Google Scholar] [CrossRef] [Scilit] [PubMed]
- Li, W.; Long, Y.; Yan, Y.; Xiao, K.; Wang, Z.; Zheng, D.; Leal-Junior, A.; Kumar, S.; Ortega, B.; Marques, C.; et al. Wearable Photonic Smart Wristband for Cardiorespiratory Function Assessment and Biometric Identification. Opto-Electron. Adv. 2025, 8, 240254. [Google Scholar] [CrossRef] [Scilit]
- Pau, M.; Leban, B.; Deidda, M.; Porta, M.; Coghe, G.; Cattaneo, D.; Cocco, E. Use of wrist-worn accelerometers to quantify bilateral upper limb activity and asymmetry under free-living conditions in people with multiple sclerosis. Mult. Scler. Relat. Disord. 2021, 53, 103081. [Google Scholar] [CrossRef] [Scilit]
- Nez, A.; Fradet, L.; Laguillaumie, P.; Monnet, T.; Lacouture, P. Comparison of calibration methods for accelerometers used in human motion analysis. Med. Eng. Phys. 2016, 38, 1289–1299. [Google Scholar] [CrossRef] [Scilit]
- Kumar, R. Calibration of Medical Devices: Method and Impact on Operation Quality. Int. Pharm. Sci. 2023, 16, 1–14. [Google Scholar] [CrossRef] [Scilit]
- Huang, Y.; Li, W.; Macheret, F.; Gabriel, R.A.; Ohno-Machado, L. A tutorial on calibration measurements and calibration models for clinical prediction models. J. Am. Med. Inform. Assoc. 2020, 27, 621–633. [Google Scholar] [CrossRef] [Scilit] [PubMed]
- Ru, X.; Gu, N.; Shang, H.; Zhang, H. MEMS Inertial Sensor Calibration Technology: Current Status and Future Trends. Micromachines 2022, 13, 879. [Google Scholar] [CrossRef] [Scilit] [PubMed]
- Xu, T.; Xu, X.; Xu, D.; Zhao, H. A Novel Calibration Method Using Six Positions for MEMS Triaxial Accelerometer. IEEE Trans. Instrum. Meas. 2021, 70, 1002211. [Google Scholar] [CrossRef] [Scilit]
- Karnawat, S.; Rufus, E.; Karar, V.; Poddar, S. Accelerometer to accelerometer calibration using particle swarm optimization. In Proceedings of the 2017 2nd IEEE International Conference on Recent Trends in Electronics, Information & Communication Technology (RTEICT); IEEE: New York, NY, USA, 2017; pp. 1502–1506. [Google Scholar] [CrossRef] [Scilit]
- Won, S.P.; Golnaraghi, F. A Triaxial Accelerometer Calibration Method Using a Mathematical Model. IEEE Trans. Instrum. Meas. 2010, 59, 2144–2153. [Google Scholar] [CrossRef] [Scilit]
- Varghese, J.; Alen, C.M.v.; Fujarski, M.; Schlake, G.S.; Sucker, J.; Warnecke, T.; Thomas, C. Sensor Validation and Diagnostic Potential of Smartwatches in Movement Disorders. Sensors 2021, 21, 3139. [Google Scholar] [CrossRef] [Scilit] [PubMed]
- Sigcha, L.; Pavón, I.; Arezes, P.; Costa, N.; De Arcas, G.; López, J.M. Occupational Risk Prevention through Smartwatches: Precision and Uncertainty Effects of the Built-In Accelerometer. Sensors 2018, 18, 3805. [Google Scholar] [CrossRef] [Scilit]
- ISO8041-1:2017; Human Response to Vibration—Measuring Instrumentation-Part 1: General Purpose Vibration Meters. ISO: Geneva, Switzerland, 2017.
- ISO 16063; Methods for the Calibration of Vibration and Shock Transducers. ISO: Geneva, Switzerland, 1998.
- ISO 16063-11:1999; Methods for the Calibration of Vibration and Shock Transducers-Part 11: Primary Vibration Calibration by Laser Interferometry. ISO: Geneva, Switzerland, 1999.
- ISO 16063-12:2002; Methods for the Calibration of Vibration and Shock Transducers-Part 12: Primary Vibration Calibration by the Reciprocity Method. ISO: Geneva, Switzerland, 2002.
- ISO 16063-21:2003; Methods for the Calibration of Vibration and Shock Transducers-Part 21: Vibration Calibration by Comparison to a Reference Transducer. ISO: Geneva, Switzerland, 2003.
- ISO 16063-31:2009; Methods for the Calibration of Vibration and Shock Transducers-Part 31: Testing of Transverse Vibration Sensitivity. ISO: Geneva, Switzerland, 2009.
- ISO266:1999; Acoustics-Preferred Frequencies. ISO: Geneva, Switzerland, 1999.
- Winter, D.A. Biomechanics and Motor Control of Human Movement; Wiley: Hoboken, NY, USA, 2009. [Google Scholar] [CrossRef] [Scilit]
- Crawford, P.; Zimmerman, E.E. Differentiation and Diagnosis of Tremor. Am. Fam. Physician 2011, 83, 697–702. [Google Scholar]
- Kim, J.-W.; Lee, J.-H.; Kwon, Y.; Kim, C.-S.; Eom, G.-M.; Koh, S.-B.; Kwon, D.-Y.; Park, K.-W. Quantification of Bradykinesia During Clinical Finger Taps Using a Gyrosensor in Patients with Parkinson’s Disease. Med. Biol. Eng. Comput. 2010, 49, 365–371. [Google Scholar] [CrossRef] [Scilit]
- Hamner, S.R.; Delp, S.L. Muscle Contributions to Fore-Aft and Vertical Body Mass Center Accelerations over a Range of Running Speeds. J. Biomech. 2013, 46, 780–787. [Google Scholar] [CrossRef] [Scilit] [PubMed]
- ISO/IEC Guide 98-3:2008; Uncertainty of Measurement—Part 3: Guide to the Expression of Uncertainty in Measurement (GUM:1995). ISO: Geneva, Switzerland, 2008.
- ISO 16063-11:2001; Methods for the Calibration of Vibration and Shock Transducers-Part 13: Primary Shock Calibration Using Laser Interferometry. ISO: Geneva, Switzerland, 2001.
- ISO 16063-15:2006; Methods for the Calibration of Vibration and Shock Transducers-Part 15: Primary Angular Vibration Calibration by Laser Interferometry. ISO: Geneva, Switzerland, 2006.

Disclaimer/Publisher’s Note: The statements, opinions and data contained in all publications are solely those of the individual author(s) and contributor(s) and not of MDPI and/or the editor(s). MDPI and/or the editor(s) disclaim responsibility for any injury to people or property resulting from any ideas, methods, instructions or products referred to in the content. |
© 2026 by the authors. Licensee MDPI, Basel, Switzerland. This article is an open access article distributed under the terms and conditions of the Creative Commons Attribution (CC BY) license.