


Abstract
Extreme weather conditions impose significant challenges on distribution network inspection because UAV flight safety, energy consumption, vehicle mobility, and task coverage are strongly coupled under wind disturbances. To improve inspection efficiency and operational robustness, this paper proposes a weather-aware asynchronous vehicle–UAV cooperative scheduling method based on bi-level MODDPG–NSGA-II optimization. First, a dynamic wind field model and a wind-sensitive UAV energy model are established to describe the effects of background wind, vertical wind shear, and local gust disturbances on UAV motion and state-of-charge evolution. Then, an asynchronous vehicle–UAV collaboration mechanism is developed, allowing the vehicle to move toward downstream parking sites after UAV deployment while UAVs perform inspection and cross-site recovery under rendezvous and energy safety constraints. On this basis, a bi-level optimization framework is constructed, in which NSGA-II searches global coordination parameters and MODDPG learns adaptive multi-UAV scheduling policies in continuous decision spaces. Controlled wind-factor experiments show that, with the task scale fixed at 52 inspection tasks, the proposed method maintains 100% task coverage under 0–10 m/s wind conditions. As the reference wind speed increases from 0 m/s to 10 m/s, the mission completion time increases from 40.97 min to 70.24 min, while the minimum residual SOC decreases from 50.32% to 13.82%, which remains above the predefined safety threshold. Repeated stochastic trials and statistical significance analysis further indicate that the proposed method achieves shorter mission time and more stable task coverage than representative baselines under the same experimental conditions. The scope of this study is simulation-level validation; real-world flight tests and hardware-in-the-loop verification will be further investigated in future work.
1. Introduction
Distribution networks are increasingly exposed to extreme weather events such as strong winds, typhoons, heavy rainfall, and compound meteorological hazards. These events may damage overhead lines, towers, switches, transformers, and auxiliary communication facilities, thereby reducing the situational awareness and restoration capability of power distribution systems. In recent years, resilience-oriented planning and assessment have become important research topics for distribution systems, especially under weather-driven uncertainty and high-impact low-probability events [1,2,3,4]. However, post-event inspection remains a difficult operational problem. When line corridors cover large spatial areas and road access is limited after disasters, rapid acquisition of equipment status becomes essential for fault localization, emergency repair scheduling, and resilience recovery. Therefore, an efficient inspection strategy that can maintain coverage, timeliness, and safety under extreme weather conditions is of practical significance for modern distribution network operation and maintenance.
Unmanned aerial vehicles (UAVs) have been widely used in power line inspection because of their flexible deployment, low operational risk, and ability to acquire visual, infrared, and LiDAR-based information from multiple perspectives [5,6,7,8]. Recent studies have reported autonomous power line detection, UAV-LiDAR-assisted power facility inspection, intelligent monitoring systems, and vision-assisted inspection and landing methods [9,10]. These studies have significantly improved the perception, localization, and autonomous inspection capability of UAV platforms. Nevertheless, most existing UAV-based power inspection methods still focus on single-UAV sensing, local target tracking, or autonomous flight execution. For large-scale distribution network inspection, task points are usually discretely distributed along line corridors, rural roads, and regional boundaries. A single UAV is often constrained by limited endurance, payload capacity, wind resistance, and communication range. As a result, UAV inspection cannot be treated only as a local path-planning problem; it should be formulated as a cooperative scheduling problem involving vehicle deployment, UAV task allocation, energy evolution, and safe recovery.
Recent studies on intelligent low-altitude economy further indicate that UAV-based low-altitude systems are evolving from isolated aerial platforms toward integrated sensing, communication, computation, and decision-making infrastructures [11]. Lyu et al. discussed the deployment of large AI models in low-altitude economy scenarios and emphasized the importance of adaptive service execution, edge intelligence, and real-world implementation for intelligent aerial services. This provides a broader technical background for developing intelligent vehicle–UAV cooperative inspection systems under complex environmental and operational constraints.
UAV path planning and obstacle avoidance have also been extensively investigated. Safety-distance-constrained inspection planning, remote-sensing-oriented UAV path-planning reviews, improved Informed-RRT* combined with dynamic window approaches, and adaptive dynamic window methods have provided useful tools for improving flight safety and local obstacle avoidance [12,13,14,15,16]. In parallel, reinforcement-learning-based UAV navigation methods have shown promise in unknown or dynamic environments, especially for continuous control and local decision-making [17,18]. These methods can enhance the autonomy and adaptability of UAV flight. However, most of them optimize the UAV trajectory or local action policy independently, while the operational constraints introduced by a ground support vehicle are rarely considered in a unified manner. In distribution network inspection, the vehicle is not only a transport platform but also a mobile charging, deployment, and recovery station. Therefore, the UAV flight process is strongly coupled with vehicle parking positions, vehicle movement timing, UAV recovery radius, state-of-charge constraints, and task-stage transitions.
Vehicle–UAV cooperative routing provides a possible solution for large-scale inspection tasks. Studies on cooperated trucks and drones, truck–drone hybrid routing, rural logistics delivery, reliable truck–drone routing, and systematic reviews of truck–drone routing problems have shown that the spatiotemporal relationship between ground vehicles and UAVs can greatly affect overall system efficiency [19,20,21,22,23]. More recent work has also investigated dynamic collaborative truck–drone delivery with en-route synchronization and random requests, indicating the potential of learning-based dynamic routing strategies [24]. However, most of these studies are designed for logistics delivery or general service-routing applications, where the major objectives are transportation cost, delivery time, and customer service efficiency. In contrast, power grid inspection has stronger engineering constraints, including fixed or limited parking sites, strict UAV recoverability, energy safety margins, communication reliability, and complete inspection coverage. In addition, extreme wind conditions may cause trajectory deviation and increased energy consumption, making direct migration of logistics-oriented truck–drone models insufficient for power inspection scenarios.
For multi-UAV inspection and cooperative decision-making, heuristic optimization and deep reinforcement learning have attracted increasing attention. Adaptive heuristic algorithms with collaborative search mechanisms can improve multi-UAV inspection planning performance [25], while multi-agent TD3-based methods can enhance cooperative path planning under complex environments [26]. These studies demonstrate the effectiveness of intelligent optimization in multi-agent UAV systems. Nevertheless, under extreme weather conditions, the inspection scheduling problem has two coupled characteristics. On one hand, high-frequency UAV motion and heading compensation require adaptive policy learning in continuous decision spaces. On the other hand, low-frequency system-level parameters, such as parking-stage configuration, task detection radius, recovery radius, energy threshold, and cooperative budget, require a global multi-objective search. A single reinforcement learning method with fixed reward weights may be insufficient to provide diverse trade-off solutions, while a single evolutionary optimization algorithm may have difficulty handling continuous feedback control during task execution.
To address these limitations, this paper proposes a weather-aware asynchronous vehicle–UAV cooperative scheduling method for distribution network inspection based on bi-level MODDPG–NSGA-II optimization. The proposed method differs from conventional synchronous cooperation, where the vehicle must remain at the current parking site until all UAVs return. Instead, an asynchronous collaboration mechanism is constructed, allowing the vehicle to move toward subsequent parking sites after UAV deployment, while UAVs perform inspection, return, or recovery according to dynamic energy and rendezvous constraints. This mechanism reduces vehicle waiting time and improves spatiotemporal flexibility. Meanwhile, wind field disturbance, energy evolution, task coverage, completion time, minimum residual SOC, and load balance are jointly considered to improve operational robustness under extreme weather conditions.
The main contributions of this paper are summarized as follows:
- A weather-aware asynchronous vehicle–UAV cooperative scheduling model is developed for distribution network inspection under extreme weather conditions. The model jointly considers task-point distribution, vehicle parking-site support, UAV deployment and recovery, dynamic wind disturbances, energy consumption, task coverage, and load balance. Compared with conventional same-site synchronous cooperation, the proposed asynchronous mechanism enables spatiotemporal decoupling between vehicle movement and UAV inspection execution.
- A wind-sensitive UAV energy and feasibility model is established to support energy-safe scheduling. The model incorporates background wind, vertical wind shear, and local gust disturbances into UAV motion and SOC evolution. By linking wind-induced speed variation with energy consumption and recovery constraints, the proposed formulation provides a physical basis for evaluating inspection feasibility under strong wind conditions.
- A bi-level MODDPG–NSGA-II optimization framework is proposed for multi-objective cooperative scheduling. The outer-layer NSGA-II searches global coordination parameters, while the inner-layer MODDPG learns adaptive multi-UAV scheduling policies in continuous action spaces. The framework enables coordinated optimization of task coverage, mission completion time, minimum residual SOC, and load balance.
- A simulation-based validation is conducted under representative distribution network inspection scenarios and gradient wind conditions. The results show that the proposed method can maintain complete task coverage under a 10 m/s wind condition while preserving a controllable SOC safety margin, demonstrating its potential for resilient inspection scheduling during adverse weather.
2. Problem Formulation and Definitions
2.1. Description of Power Grid Inspection Issues
Under extreme weather conditions, power distribution network inspection tasks are not only affected by factors such as wide geographical coverage and a large number of inspection points but are also significantly impacted by complex meteorological disturbances such as strong winds, gusts, and vertical wind shear. Meanwhile, as the platform for carrying, recharging, and recovering UAVs, the parking locations and movement patterns of ground vehicles directly determine the UAVs’ takeoff and landing conditions, operational range, and collaborative efficiency. Therefore, the problem of vehicle–UAV collaborative power grid inspection under extreme weather conditions is essentially a multivariate dynamic optimization problem that integrates task allocation, vehicle parking, UAV trajectories, wind field disturbances, energy evolution, and recovery constraints.
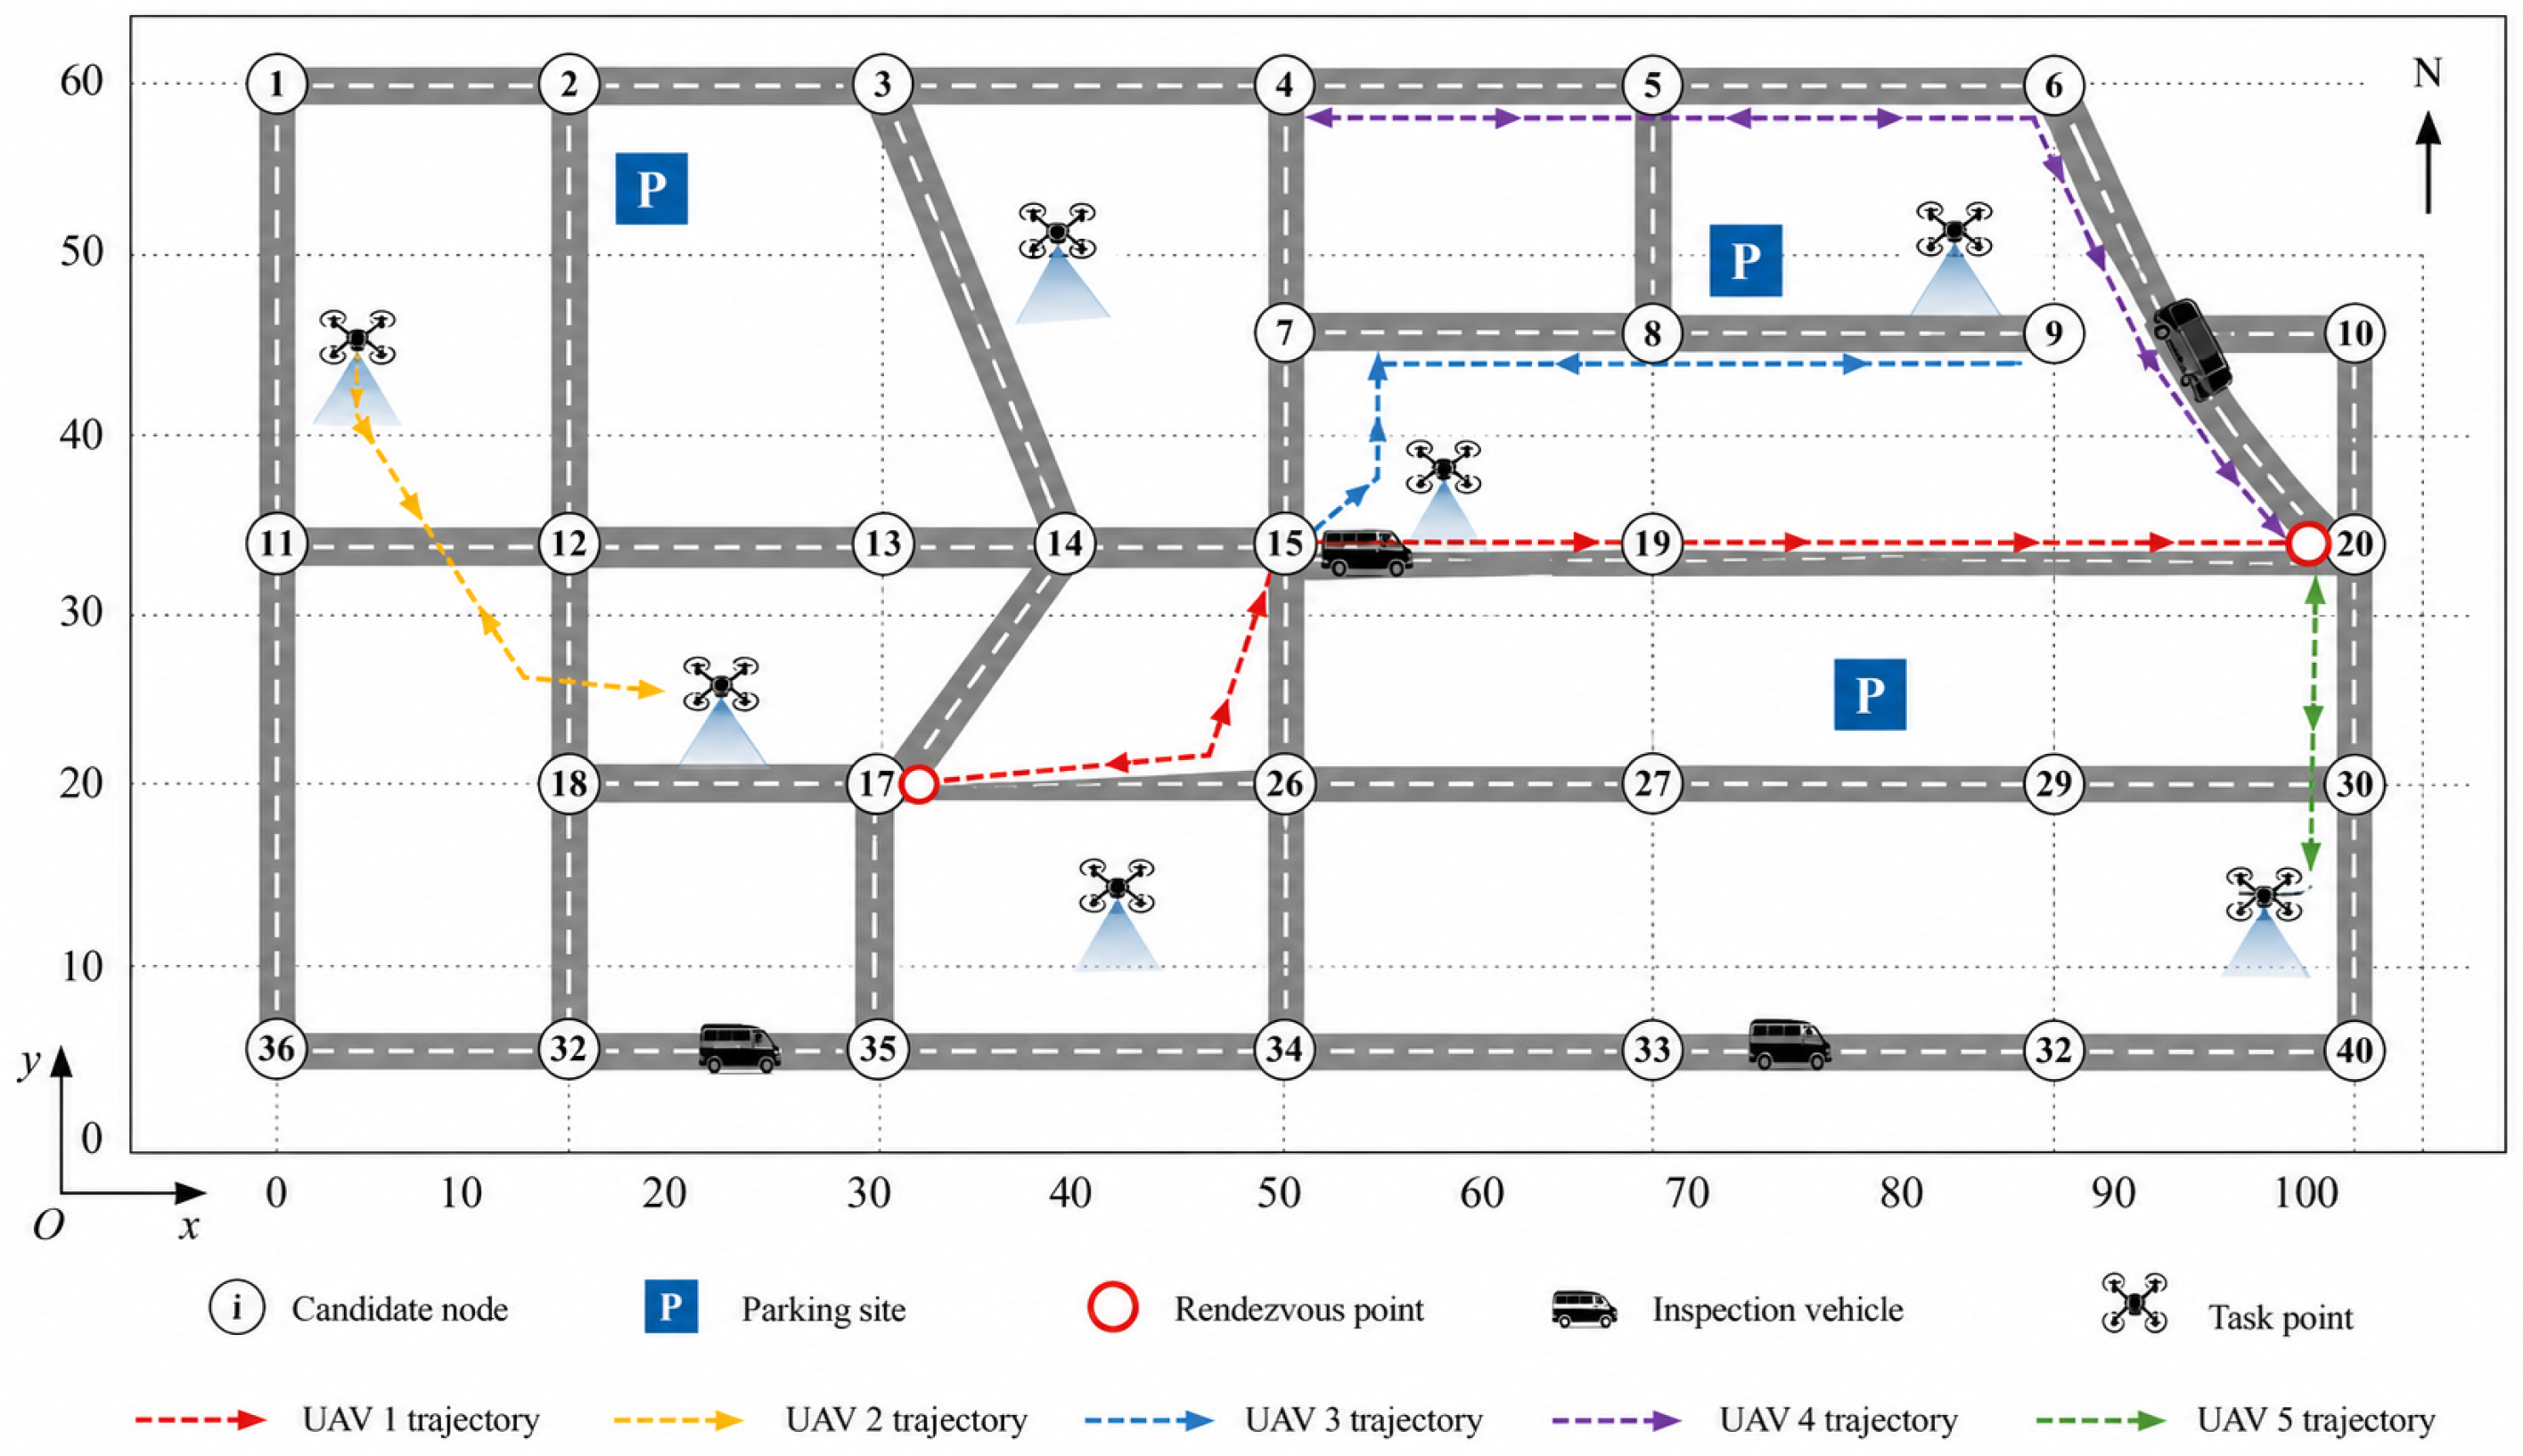
To address this, this paper first establishes a scheduling model for vehicle–UAV collaborative power grid inspection under extreme weather conditions. It provides a unified description of the task set, wind field disturbances, vehicle–UAV collaboration relationships, and energy safety constraints, thereby laying the mathematical foundation for the subsequent hierarchical optimization method based on MODDPG–NSGA-II. A schematic diagram is shown in Figure 1.
Figure 1.
Schematic of vehicle–UAV collaborative power grid inspection under extreme weather conditions.
2.2. Basic Definitions
Let the set of inspection task points be:
where the spatial coordinates of the i-th task point are denoted as:
Let the set of stopping points for vehicle c be:
where the position of the m-th stop is:
Let the set of vehicle-mounted UAVs be:
This paper investigates a collaborative inspection model in which a single vehicle carries multiple UAVs; therefore, the vehicle set can be abbreviated as:
At discrete time , the vehicle’s position is denoted as:
The position of the u-th UAV is recorded as:
The state vector of the UAV u is defined as:
where represents the velocity vector, represents the charge state, represents the collaborative budget, and represents the current execution phase identifier.
The vehicle state vector is defined as:
where represents the vehicle speed, represents the current stop index, and represents the remaining stop time.
To describe the results of task execution, we introduce a task completion status variable:
where, if task i has been completed, then ; otherwise, .
Therefore, the number of completed tasks at time t is:
The corresponding task coverage is:
At the final time step T, the total coverage can be expressed as:
To represent the assignment relationship between waypoints and the UAV, a binary variable is introduced:
The uniqueness constraint on the task can be expressed as:
When complete task assignment is required for a deployable full-coverage schedule, the assignment condition can be expressed as:
The coverage objective and the complete-assignment condition have different roles in the optimization framework. Task coverage is retained as an objective because full coverage may not always be feasible under severe wind disturbance, limited residual energy, or degraded operating conditions. The complete-assignment condition is used as a preferred feasibility criterion when a full-coverage and SOC-safe solution exists. If no such solution is available, the scheduling problem is evaluated in a degraded mode where maximizing task coverage, maintaining SOC safety, and reducing mission time are prioritized in sequence.
3. Wind Field Disturbance and UAV Modeling
3.1. Wind Field Models for Extreme Weather Conditions
Under extreme weather conditions, wind fields within power distribution network inspection areas exhibit significant spatiotemporal heterogeneity and random disturbances. Wind speed and direction not only vary with geographical location and altitude but are also influenced by gusts, turbulence, and local meteorological conditions, resulting in high uncertainty. This complex wind field environment directly affects the flight of UAVs, altering their actual motion state and mission execution capabilities.
To address the issues in traditional inspection models—which either ignore wind field disturbances or rely solely on static wind speed approximations—this paper constructs a three-dimensional dynamic wind field model. This model provides a unified representation of background wind, gusts, and random disturbances, thereby establishing a foundational environmental input for subsequent UAV kinematic modeling and energy analysis.
The primary impact of extreme weather on UAVs can be abstracted as time-varying wind field disturbances in three-dimensional space. Let the wind field vector field be:
Then, the wind field acting on the UAV u at position is:
To account for background wind, vertical wind shear, and localized gust effects under extreme weather conditions, the wind field can be further decomposed into:
where represents the background wind term, represents the wind shear term that varies with height, and represents the local gust disturbance term.
The background wind term can be written as:
The high-wind-shear term can be approximated linearly as:
The local gust term can be written as:
where represents the center of the -th gust, represents the intensity of the disturbance, represents the radius of influence, and represents the direction vector.
To ensure flight feasibility under extreme weather conditions, the wind speed must satisfy the following constraint:
where represents the maximum wind speed threshold at which flight is permitted.
The reference wind speed is used to define the background wind level of the inspection region. In the controlled wind-factor experiments, 0 m/s, 4 m/s, 8 m/s, and 10 m/s are selected to represent calm, mild-wind, strong-wind, and near-critical wind conditions, respectively. The gust disturbance is superimposed on the background wind field to represent local short-term wind fluctuations. The gust intensity is set as a proportion of the reference wind speed, and the disturbance radius is determined according to the spatial scale of the inspection area and the local density of task points. In the controlled experiments, the wind direction and gust centers are fixed so that the independent influence of wind speed can be isolated. In the stochastic robustness experiments, local wind disturbance is randomly perturbed within the predefined range to approximate practical wind uncertainty.
3.2. UAV Kinematic Model
Under the influence of wind field disturbances, the actual flight trajectory of a UAV is determined jointly by its own control inputs and external wind speed, exhibiting distinct coupled dynamic characteristics. The wind field not only causes deviations in the direction and magnitude of the UAV’s ground speed but also affects its path-tracking accuracy, thereby complicating trajectory planning and control during mission execution.
Therefore, to accurately describe the flight behavior of UAVs under extreme weather conditions, this paper establishes a UAV kinematic model based on a wind field model that accounts for the coupled effects of wind speed. By incorporating the relationship between airspeed and ground speed, the paper characterizes the mechanism through which wind fields affect the UAV’s motion state, thereby providing a theoretical basis for subsequent mission feasibility analysis and scheduling decisions.
Let the airspeed of the UAV u be:
According to the principle of velocity superposition, the ground speed satisfies:
Thus, the discrete update equation for the UAV’s position is:
Equation (26) shows that under tailwind conditions, the wind field term increases the actual ground speed; under headwind conditions, the wind field term reduces the effective propulsion capability in the direction of the target. To further analyze this effect, let the current target point be . Then, the unit vector in the direction of the target for the UAV is:
The effective forward speed of the UAV in the direction of the target is:
Substituting Equation (26) into Equation (29) yields:
when
This indicates that, under current wind conditions, the UAV is unable to generate sufficient thrust to reach the mission target; therefore, this mission point is currently considered temporarily unreachable for the UAV.
The maximum airspeed constraint for the UAV is expressed as:
The maximum climb or descent rate constraint is written as:
The track smoothing constraint can be expressed as:
where represents the maximum allowable angle of rotation.
3.3. Energy Consumption and State-of-Charge Model
During inspection missions, a UAV’s energy consumption is not only related to factors such as flight speed and path length but is also significantly affected by wind disturbances. In strong wind conditions, UAVs require additional power output to maintain flight stability, which leads to increased energy consumption and reduced endurance, thereby impacting mission coverage and scheduling strategies.
Based on this, this paper constructs an energy consumption model that accounts for wind field effects based on the UAV’s kinematic model and further establishes a state-of-charge (SOC) evolution model to describe the patterns of energy changes during mission execution, providing critical support for the subsequent formulation of vehicle–UAV coordination constraints and optimization objectives.
To characterize the impact of extreme weather wind fields on energy consumption, the instantaneous power of the UAV is defined as:
where represents the basic hovering power, while , , and represent the coefficients related to airspeed, vertical motion, and wind field disturbances, respectively.
The cumulative energy consumption of the UAV in the interval [0, T] is:
Let be the maximum battery capacity of the UAV and be the remaining charge; then its SOC is defined as:
Energy conservation is satisfied:
Dividing both sides of Equation (38) by yields the SOC update equation:
When the UAV is recharging on the vehicle platform, the SOC is updated to:
where represents the energy replenishment rate per unit time.
Therefore, the range of SOC values satisfies:
Define the system’s minimum SOC metric as:
The higher this value, the greater the safety margin in terms of energy throughout the entire inspection process.
4. Vehicle–UAV Cooperative Modeling and Optimization Objectives
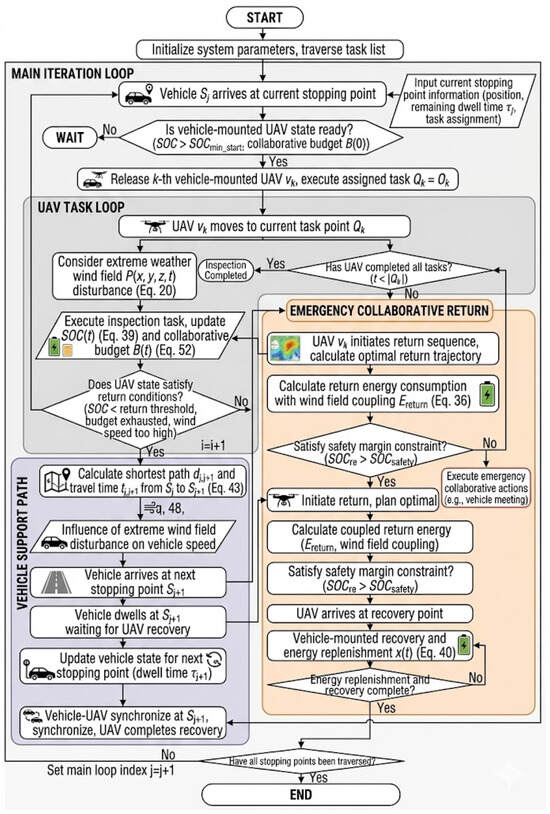
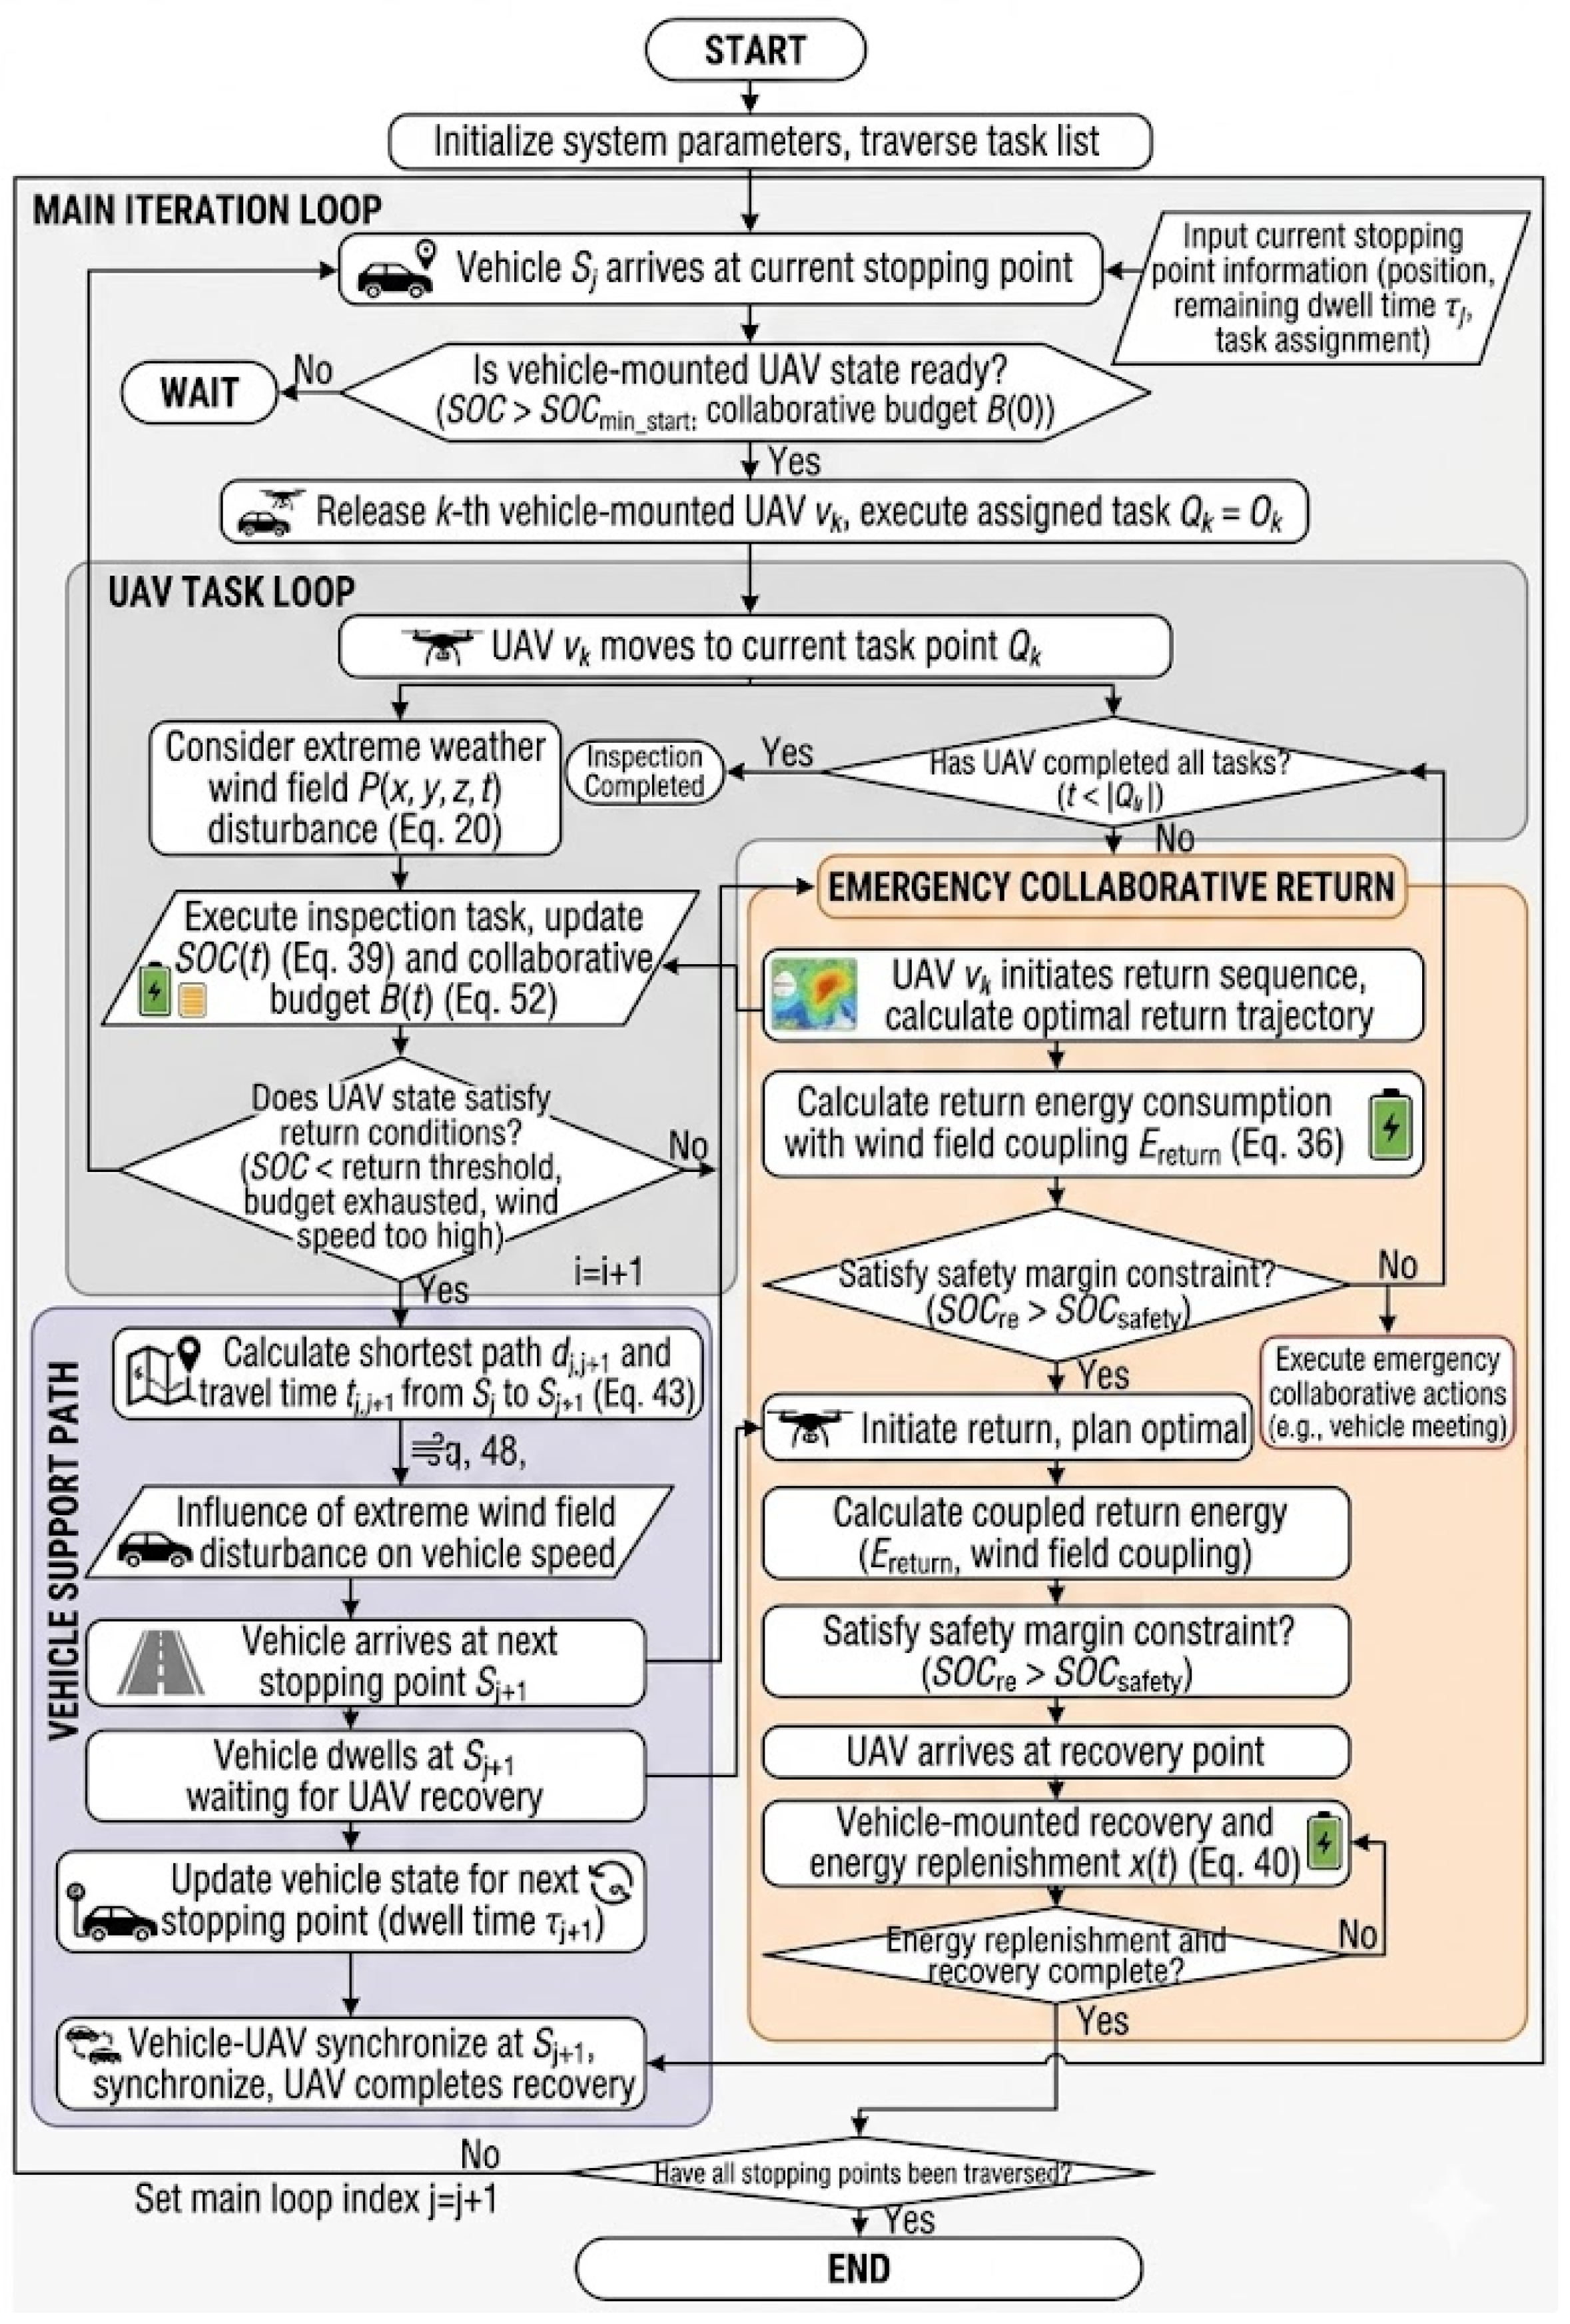
Building on the wind field, UAV kinematic, and energy-evolution models established above, this section introduces the ground vehicle as a mobile base station and recharging platform to address the endurance limitation of UAVs, thereby establishing a dynamic inspection mode characterized by asynchronous vehicle–UAV collaboration. Unlike the conventional synchronous mechanism of takeoff and recovery at the same site, the proposed cross-site rendezvous strategy achieves spatiotemporal decoupling; after UAV deployment, the vehicle can proceed to downstream parking sites, while the UAV can be recovered at a feasible site after task execution or when safety constraints require recovery. Based on this mechanism, the vehicle motion, UAV energy evolution, spatiotemporal matching boundary, mission coverage, total completion time, energy safety, and load balance are jointly modeled. The flowchart of vehicle–UAV collaboration under extreme weather conditions is shown in Figure 2.
Figure 2.
Flowchart of the vehicle–UAV collaborative framework under extreme weather conditions.
The flowchart adopts a hierarchical nested loop structure, with the main loop managing vehicle movement between parking points and the inner nested loop managing UAV mission execution. It makes real-time decisions regarding routine or emergency return based on energy safety conditions to generate the optimal inspection plan.
4.1. Vehicle Motion and Parking Model
In the vehicle–UAV collaborative inspection mode, ground vehicles serve as carriers and support platforms for UAVs, performing critical functions such as maneuvering within the mission area, coordinating stop-and-go operations, and providing recharging support. The driving routes and stopping locations of these vehicles directly determine the takeoff and landing positions of the UAVs as well as their service coverage, making them key factors affecting the overall efficiency of the system.
Therefore, this paper first models the vehicle’s motion process and parking behavior. By describing the vehicle’s driving path within the inspection area and its stopping strategies at discrete parking points, it provides a spatial and temporal foundation for UAV mission scheduling.
The vehicle moves along a road network. Let be the shortest path length from parking point m to parking point n; then, the corresponding travel time is:
where represents the vehicle’s average speed.
Let the dwell time of a vehicle at a stop be . Its discrete representation is:
For subsequent parameter optimization, the dwell-time vector is written as:
The vehicle position update can be written as:
where is the unit vector representing the direction of the road.
4.2. Vehicle–UAV Coordination Constraints
In vehicle–UAV collaboration systems, the execution of a UAV’s mission is subject to the combined effects of various constraints, including takeoff conditions, recovery conditions, mission feasibility, and energy safety constraints. These constraints depend not only on the UAV’s own state but are also closely related to the vehicle’s position and operational status, exhibiting typical spatiotemporal coupling characteristics.
Therefore, building upon the aforementioned modeling framework, this paper systematically constructs a vehicle–UAV coordination constraint system. It provides a unified description of the UAV’s takeoff conditions, recovery radius, mission completion criteria, and energy constraints, thereby clarifying the system’s feasible solution space and laying the foundation for the subsequent development of optimization models.
4.2.1. Takeoff Constraints
Let be the minimum takeoff SOC threshold for the UAV; then, before it can undertake a new mission, it must satisfy the following condition:
In the final mission phase, to prevent UAVs with low battery levels from being assigned new missions, a safety margin is introduced, resulting in:
4.2.2. Recovery Constraints
Let the UAV’s return radius be . If
the UAV is considered to be within the vehicle platform’s recovery range.
4.2.3. Task Point Arrival Constraints
Let the task point determination radius be . If
the waypoint i is considered to have been successfully visited by the UAV u.
Therefore, the task completion status can be written as:
where the indicator function is used to determine whether the task point is successfully visited.
4.2.4. Coordinated Budget Constraints
Let the collaborative budget for UAV u be , the maximum budget be , the mission consumption be , and the recovery amount be . Then
and satisfy
If the UAV is within budget recovery zone , the recovery amount is recorded as:
4.3. Task Completion Time and Load Balancing Metrics
In multi-UAV collaborative inspection operations, using the number of completed tasks alone as an evaluation criterion fails to fully reflect system performance. Task completion time directly impacts inspection efficiency, while uneven task distribution among UAVs may lead to some UAVs being overloaded and other resources remaining idle, thereby reducing overall system performance.
Therefore, this paper introduces task completion time and load balancing metrics to conduct a comprehensive evaluation of the inspection process. Specifically, the total task completion time is used to characterize system efficiency, while the load balancing metric measures the uniformity of task distribution among UAVs, thereby providing a quantitative basis for multi-objective optimization.
Let denote the completion time of task i. Then, the total task completion time can be expressed as:
If expressed in terms of the final stop time, it can also be written as:
Let the number of missions ultimately completed by the UAV u be:
The average mission load for each UAV is:
Define the task load balancing metrics as follows:
The smaller the value of A, the more balanced the distribution of tasks among the UAVs.
4.4. Optimization Objectives for Vehicle–UAV Cooperative Task Scheduling
Under extreme weather conditions, vehicle–UAV collaborative inspection tasks require balancing multiple performance metrics, including task coverage, execution time, energy safety, and load balancing. These objectives are often in conflict with one another; for example, increasing coverage may lead to higher energy consumption, while shortening execution time may reduce safety margins.
Therefore, this paper constructs a multi-objective optimization model that sets maximizing task coverage, minimizing task completion time, maximizing the minimum SOC, and optimizing load balancing as the primary optimization objectives. These are integrated into a unified framework to provide the objective function foundation for subsequent hierarchical optimization methods based on MODDPG and NSGA-II.
Taking into account task coverage, total completion time, minimum SOC, and load balancing, the following multi-objective function is formulated:
To facilitate subsequent unified processing in NSGA-II, the maximization objective is converted to a minimization form, yielding the objective vector:
where is the vector of parameters to be optimized.
Therefore, the problem of scheduling coordinated inspections by aircraft and the power grid during extreme weather conditions can be formulated as follows:
5. Vehicle–UAV Cooperative Multi-Objective Optimization Based on MODDPG–NSGA-II
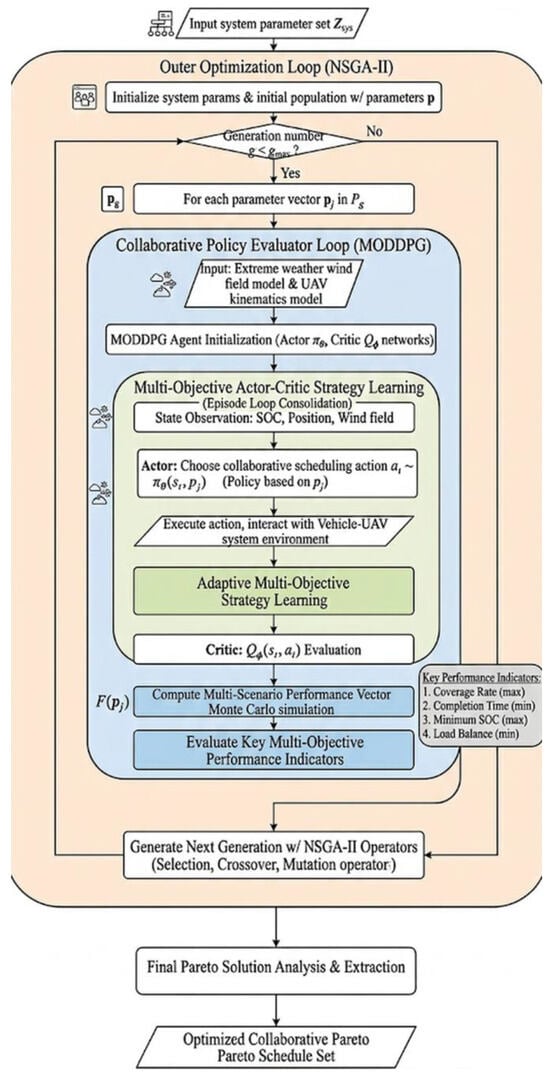
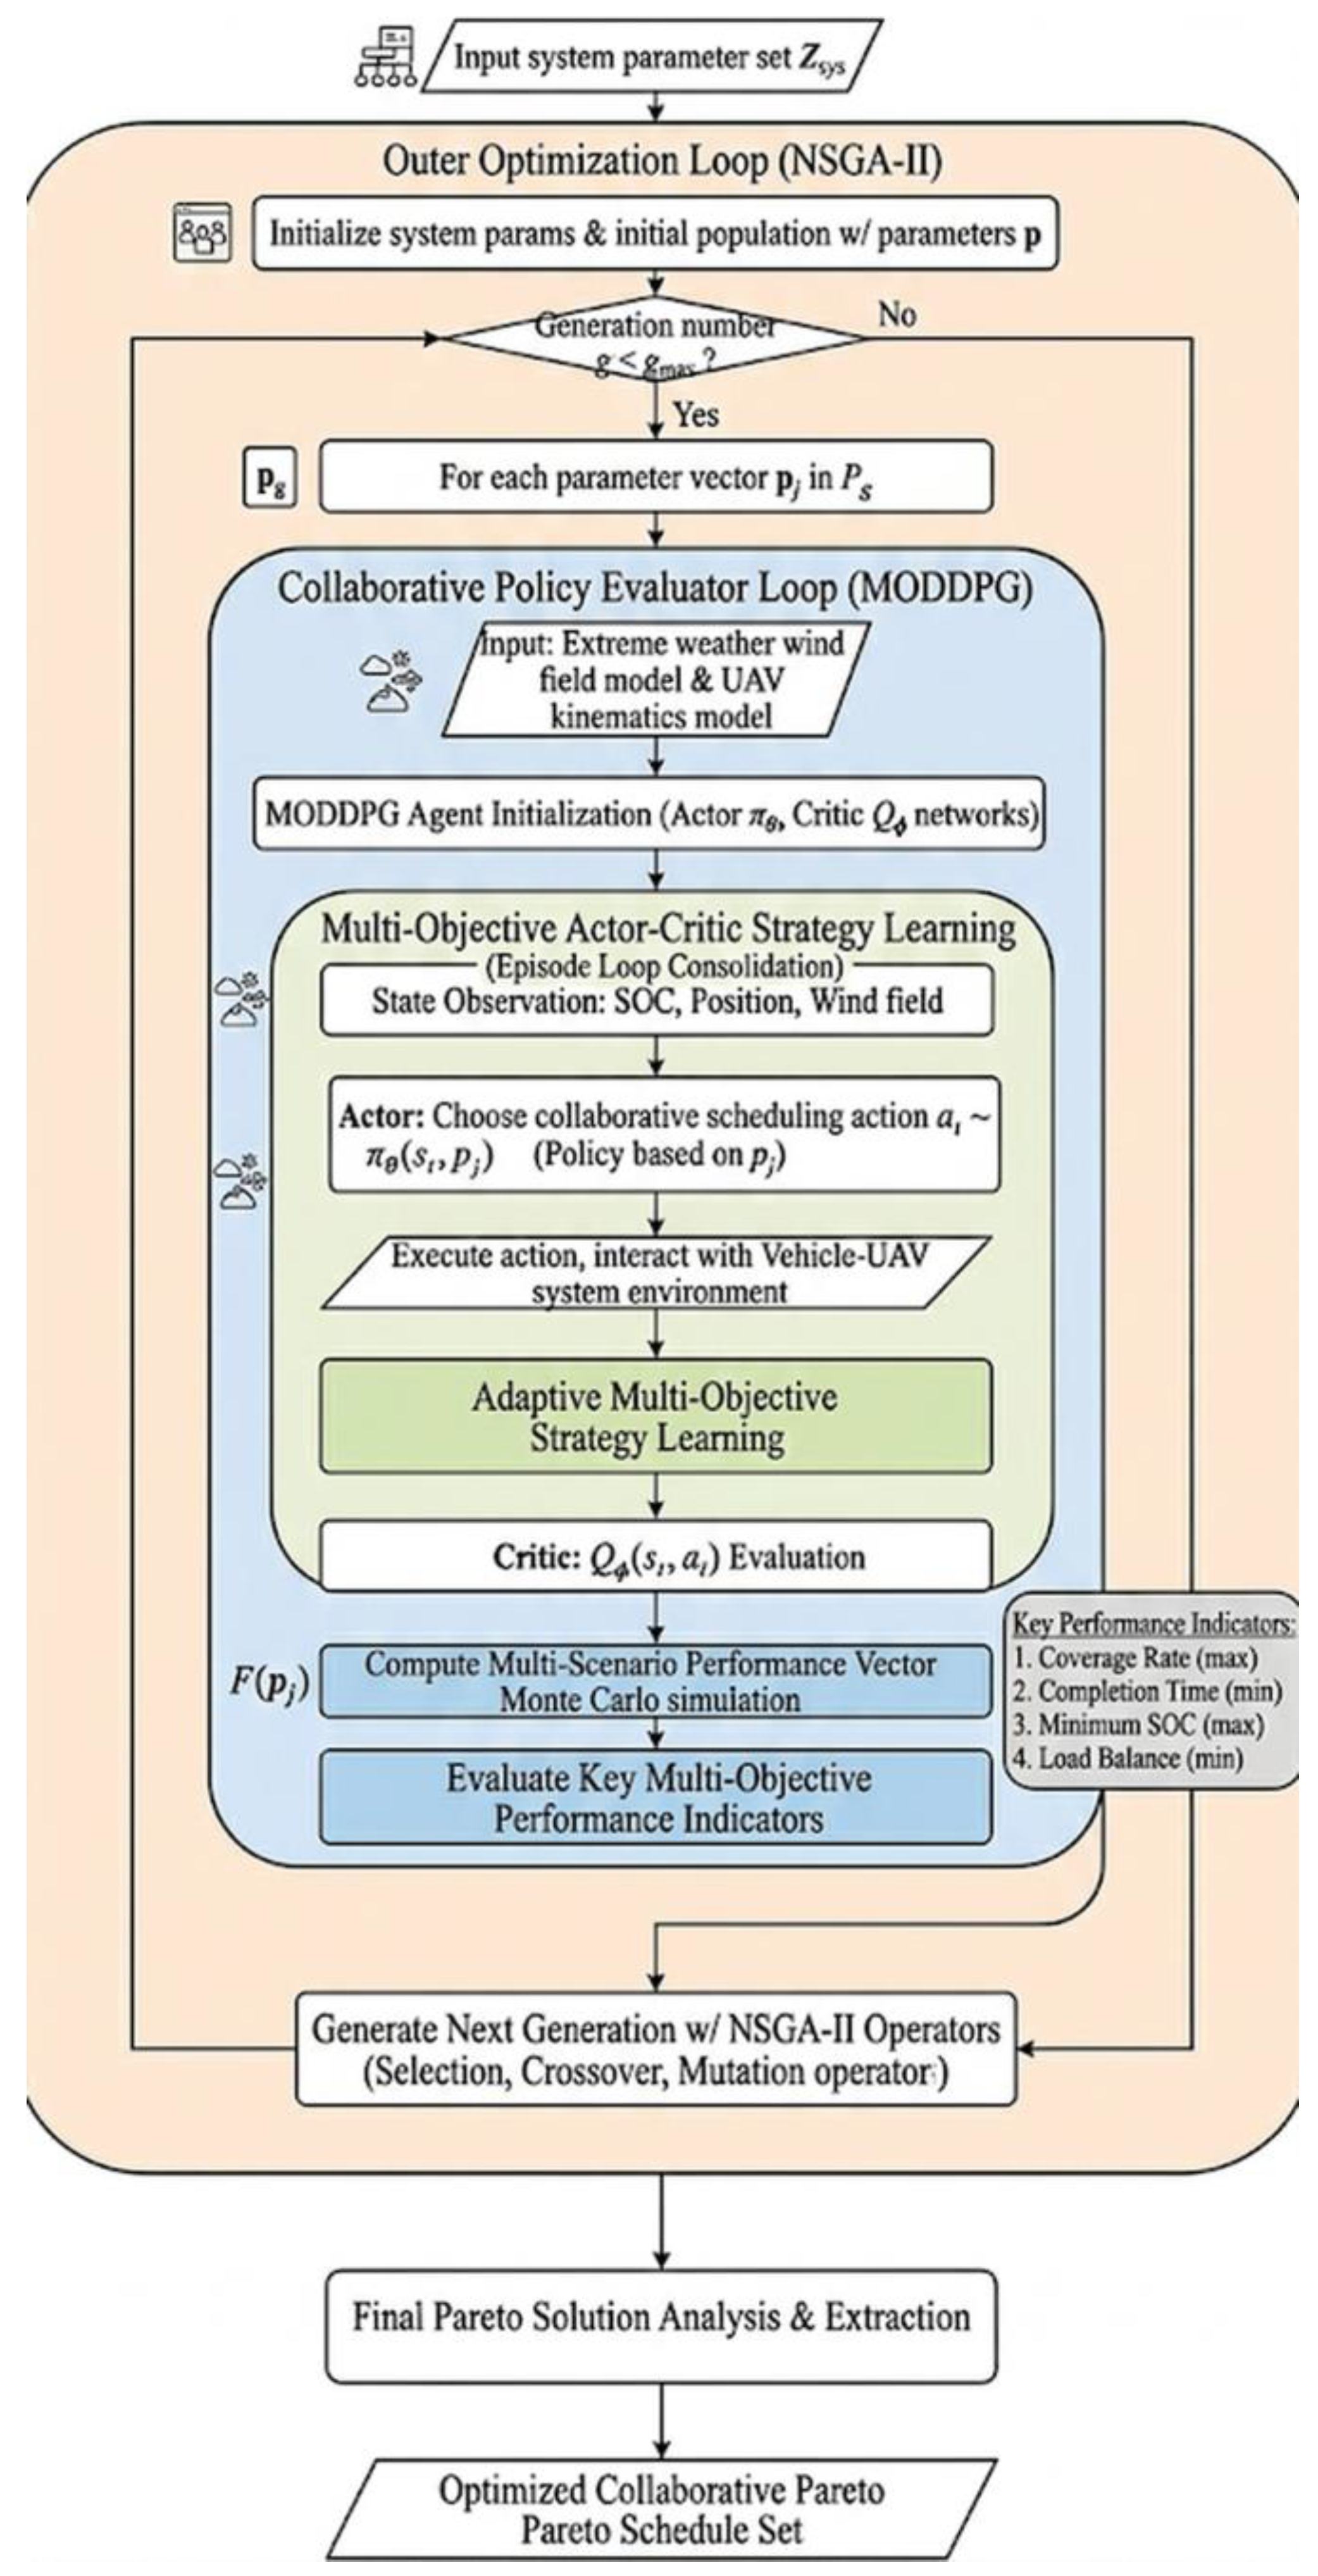
Based on the extreme-weather vehicle–UAV inspection scheduling model established in the preceding sections, this section proposes a hierarchical optimization method based on MODDPG–NSGA-II. Wind field disturbances under extreme weather conditions exhibit high-frequency dynamic characteristics, whereas vehicle parking, UAV deployment and recovery, and energy safety boundaries are low-frequency coordination constraints. If a single-layer algorithm is used to simultaneously handle high-frequency motion control and low-frequency parameter optimization, it is prone to dimensional expansion and may have difficulty maintaining multi-objective convergence. Therefore, the complex scheduling problem is decomposed into inner-layer policy learning and outer-layer parameter optimization, enabling comprehensive optimization of coverage, completion time, energy safety, and load balance. The overall framework flowchart is shown in Figure 3.
Figure 3.
Flowchart of the MODDPG–NSGA-II-based hierarchical optimization method.
5.1. Outer-Layer Coordination Parameter Definition
In a hierarchical architecture, the outer-layer NSGA-II algorithm performs a heuristic search on the key hyperparameters that affect the system’s overall performance. These hyperparameters define the system’s physical and logical boundaries. The vector of parameters to be optimized in the outer layer is defined as:
where represents the number of vehicle stops, represents the task arrival detection radius, represents the maximum UAV coordination budget, represents the budget recovery rate, represents the budget recovery radius, represents the minimum takeoff SOC threshold, represents the safe recovery radius, represents the speed scaling factor, represents the early bias factor, and represents the terminal safety margin. These parameters strictly define the UAV’s operational range and the system’s fault tolerance threshold.
In the inner-layer architecture, for any given parameter combination transmitted from the outer layer, the MODDPG algorithm interacts with the simulation environment at high frequency within the boundary conditions set by these parameters to learn and output a specific multi-agent coordination strategy . The trajectory of the system state evolution following strategy execution is used to evaluate the objective function. The hierarchical mapping and evaluation process between the inner and outer layers can be uniformly represented as:
This mapping relationship indicates that the outer framework does not directly plan the drone’s specific flight path; rather, by adjusting the coordination parameter , it indirectly alters the exploration space of the inner reinforcement learning algorithm and the system’s dynamic evolution process, thereby achieving multi-objective coordinated optimization.
5.2. Inner-Layer Coordination: A MODDPG Decision-Making Model Based on Heuristic Fusion
Inner-layer collaborative decision-making is essentially a multi-agent Markov decision process (MDP) in a continuous space. To comprehensively perceive the environment, the system’s global state is designed as a composite vector comprising the vehicle’s motion state, the UAV’s local perception state, the global distribution of uncompleted tasks, and the wind field disturbance state. Based on this, the UAV’s action space encompasses continuous actions such as speed adjustment, heading control, altitude changes, and target guidance.
Given that pure reinforcement learning incurs excessive exploration costs and converges slowly to feasible solutions under extremely adverse weather conditions, this chapter introduces a heuristic–residual fusion mechanism into the actor–critic network architecture. Specifically, a heuristic action —determined by the relative azimuth of the target point and the return path to the mother vehicle—is introduced and linearly fused with the residual action output by the policy network. The final executed action is defined as:
where A represents the residual fusion coefficient. When the UAV’s power level drops to a critical threshold, the return-to-base weight in the heuristic algorithm is dynamically increased to limit unnecessary exploration by the network and ensure the platform’s safety.
To guide the network toward a balance between task efficiency and collaborative equilibrium, the single-step reward function combines the task completion increment , time penalty, power consumption, safety penalty, and load imbalance . The total reward function is constructed as follows.
The heuristic–residual fusion mechanism is designed to reduce invalid exploration under strong wind and low SOC conditions. The heuristic component provides a feasible guidance direction toward the selected task or recovery site, while the residual action learned by MODDPG adjusts speed, heading, and recovery tendency according to the current state. The fusion coefficient is dynamically adjusted according to the SOC margin and recovery distance: when the UAV has a sufficient SOC, the residual policy has a larger influence to improve exploration and efficiency; when the SOC approaches the safety threshold or the recovery distance increases, the heuristic return component is strengthened to improve recoverability and prevent unsafe exploration.
The state, action, and reward designs are selected according to the physical roles of the cooperative inspection process. The state vector contains vehicle position, parking-stage index, UAV position, UAV SOC, remaining task distribution, local wind vector, and task-completion status, because these variables jointly determine task reachability, energy feasibility, and recovery safety. The action vector contains target-guidance direction, speed scaling, heading compensation, altitude adjustment, and return tendency, which correspond to the controllable decisions required for continuous UAV scheduling under wind disturbance. The reward function is not intended to replace hard constraints such as task completion, recovery feasibility, and SOC safety. Instead, it provides a shaped learning signal for feasible-policy search by combining task-completion gain, time cost, energy consumption, SOC risk, and load imbalance.
Under this reward scheme, the update of the inner critic network depends on a Bellman objective based on the joint action-value:
Through its soft-updating mechanism, MODDPG is able to smoothly converge to the optimal multi-machine scheduling policy under the current environmental and parameter constraints.
5.3. Outer-Layer Optimization: Parameter Search and Evaluation Based on NSGA-II
The optimization of outer-layer coordination parameters is driven by the NSGA-II algorithm. This algorithm divides the parameter population into different Pareto levels through rapid non-dominance sorting and maintains the diversity of the solution set via a crowding distance mechanism. In engineering inspection scenarios, maintaining solution diversity provides decision-makers with scheduling plans that feature distinct priorities.
To quantify diversity, the crowding distance of individual i on the same Pareto front is defined as the sum of the normalized differences across all objective functions:
Individuals located in regions with greater crowding distances are less densely populated and are assigned a higher retention priority in subsequent crossover and mutation operations. The algorithm then performs simulated binary crossover and polynomial mutation in the real-number encoding space, strictly constrained by the upper and lower bounds of the physical parameters in Equation (66).
5.4. Hierarchical Collaboration Mechanism and Final Solution Selection Strategy
The output of NSGA-II is typically a set of Pareto-optimal solutions containing multiple non-dominated solutions. However, in actual power grid inspection projects, the dispatch center must issue a single, unambiguous execution plan. If selection is made directly from the Pareto front based on global distribution, it is prone to introducing boundary solutions with extreme imbalances in performance distribution, making it difficult to meet the project’s requirements for safety thresholds and task efficiency. To address this, this paper designs a “constraint-first, optimization-second” downgrading screening mechanism.
First, based on the system’s absolute safety constraints, construct a feasible solution set that satisfies the full-coverage constraint and has a minimum power consumption exceeding the safety threshold :
If the safety set is non-empty, the solution with the shortest total task completion time is selected as the final solution. If extreme operating conditions result in the aforementioned subset of safe feasible solutions being empty, the algorithm will initiate a hierarchical backtracking process, which involves selecting the optimal solution in lexicographical order by sequentially maximizing coverage, maximizing the minimum SOC, and minimizing total time, in order of priority:
This mechanism ensures that, even under extreme environmental disturbances, the system prioritizes inspection coverage and the physical safety of the equipment.
The final decision procedure does not abandon Pareto optimality. The Pareto front is first generated by the outer-layer multi-objective search. A feasible Pareto subset is then obtained by applying hard engineering constraints, including task coverage, recovery feasibility, and SOC safety threshold. Within this feasible Pareto subset, a safety-first preference rule is used to select the deployable solution. In other words, Pareto optimization is used for candidate generation, and engineering preference is used only for final deployment-oriented decision-making. This avoids selecting extreme boundary solutions that may appear mathematically non-dominated but are unsuitable for safety-critical inspection.
5.5. Unified Multi-Objective Coordinated Scheduling Optimization Model
In summary, the optimization model for scheduling collaborative power grid inspection tasks by unmanned aerial vehicles (UAVs) under extreme weather conditions proposed in this paper can be expressed in the following compact mathematical form, which unifies the objective function set and the core-boundary constraints:
Equation (74) integrates constraints related to wind field extremes, UAV dynamic limits, energy dissipation ranges, and takeoff/landing space coupling. Through a mechanism of “inner-layer strategy learning—outer-layer parameter optimization,” the method presented in this paper successfully integrates high-frequency disturbance robustness with low-frequency multi-agent coordination within this framework.
5.6. Methodological Necessity and Ablation Design
To verify that the proposed framework is not a simple combination of existing algorithms, an ablation-oriented evaluation is designed. The outer NSGA-II module is responsible for a global parameter preference search and Pareto-set generation, while the inner MODDPG module is responsible for continuous-action scheduling under dynamic wind and energy feedback. Removing either component changes the nature of the solution process. Therefore, NSGA-II-only, MODDPG-only, without heuristic–residual fusion, without asynchronous recovery, and without wind-aware energy terms are used as ablation baselines. The complete framework is expected to improve task coverage, mission time, and solution diversity by jointly exploiting the global multi-objective search and adaptive continuous policy learning.
5.7. Modeling Scope Under Extreme-Weather Uncertainty
The current model focuses on wind-related extreme weather because wind disturbance directly affects UAV ground speed, energy consumption, trajectory feasibility, and recovery safety. Other weather-related factors can be incorporated into the same scheduling framework by modifying the corresponding feasibility, energy, and task-completion modules. Heavy rainfall may be modeled by reducing sensing reliability and increasing task-completion uncertainty. Low visibility can be represented by lowering image-recognition confidence or increasing the required observation time at each task point. Thunderstorm conditions can be incorporated as temporary no-fly time windows or forbidden spatial zones. Icing and low-temperature effects can be reflected by reducing effective battery capacity and increasing the SOC decay rate. Road waterlogging or post-disaster road blockage can be introduced by modifying vehicle travel time and road-network accessibility. Other uncertainty factors, including stochastic gust variations, communication delay, positioning error, and UAV temporary fault, can be introduced as delayed state observation, task-arrival uncertainty, recovery-radius uncertainty, or forced-recovery events. These extensions do not change the overall vehicle–UAV scheduling architecture, but they require additional meteorological data and field-test calibration before engineering deployment.
6. Case Studies: Simulation and Analysis
6.1. Simulation Scenarios, Controlled Variables, and Model Parameter Settings
The simulation area is constructed as a distribution network inspection region with a road network, four candidate vehicle parking sites, and multiple inspection task points distributed along line corridors and road boundaries. The vehicle acts as a mobile platform for UAV deployment, recovery, and charging. The UAVs inspect task points according to the asynchronous scheduling policy and may be recovered at subsequent parking sites when the rendezvous and energy safety constraints are satisfied.
To improve the interpretability of the experimental results, the experiments are organized into controlled variable experiments and comprehensive multi-scenario validation. The controlled variable experiments follow the one-factor-at-a-time principle. In each controlled experiment, only one target factor is varied, while the remaining environmental parameters, task inputs, vehicle–UAV configuration, SOC safety threshold, task-completion criteria, and algorithmic parameters are kept unchanged. The comprehensive multi-scenario validation is used to examine the overall applicability of the proposed method when task density and wind condition vary jointly.
For the wind-factor controlled experiment, the number of inspection tasks is fixed at 52, the number of UAVs is fixed at four, the number of vehicle parking sites is fixed at four, and the road network, task spatial distribution, SOC safety threshold, task-completion criteria, and algorithmic parameters are kept unchanged. Only the reference wind speed is varied among 0 m/s, 4 m/s, 8 m/s, and 10 m/s. This setting is used to analyze the independent influence of wind disturbance on mission time and energy safety.
For the task-scale controlled experiment, the reference wind speed, UAV configuration, parking-site setting, SOC threshold, wind field parameters, and main algorithmic parameters are fixed, while only the number of inspection tasks is varied. This setting is used to analyze the independent influence of task scale on scheduling performance and computational scalability.
Comprehensive scenarios are further designed to evaluate the overall behavior of the proposed method under combined changes in task density and wind condition. Table 1 summarizes the controlled experimental design used in this study, and Table 2 lists the comprehensive multi-scenario settings.
Table 1.
Controlled experimental design used in this study.
Table 2.
Comprehensive multi-scenario settings.
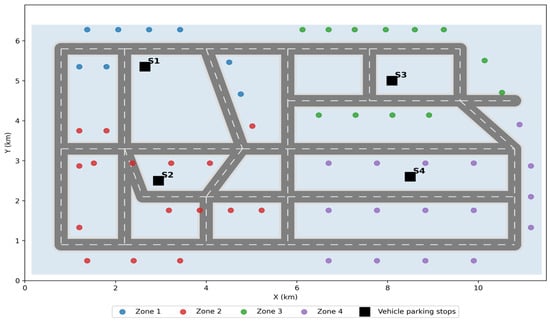
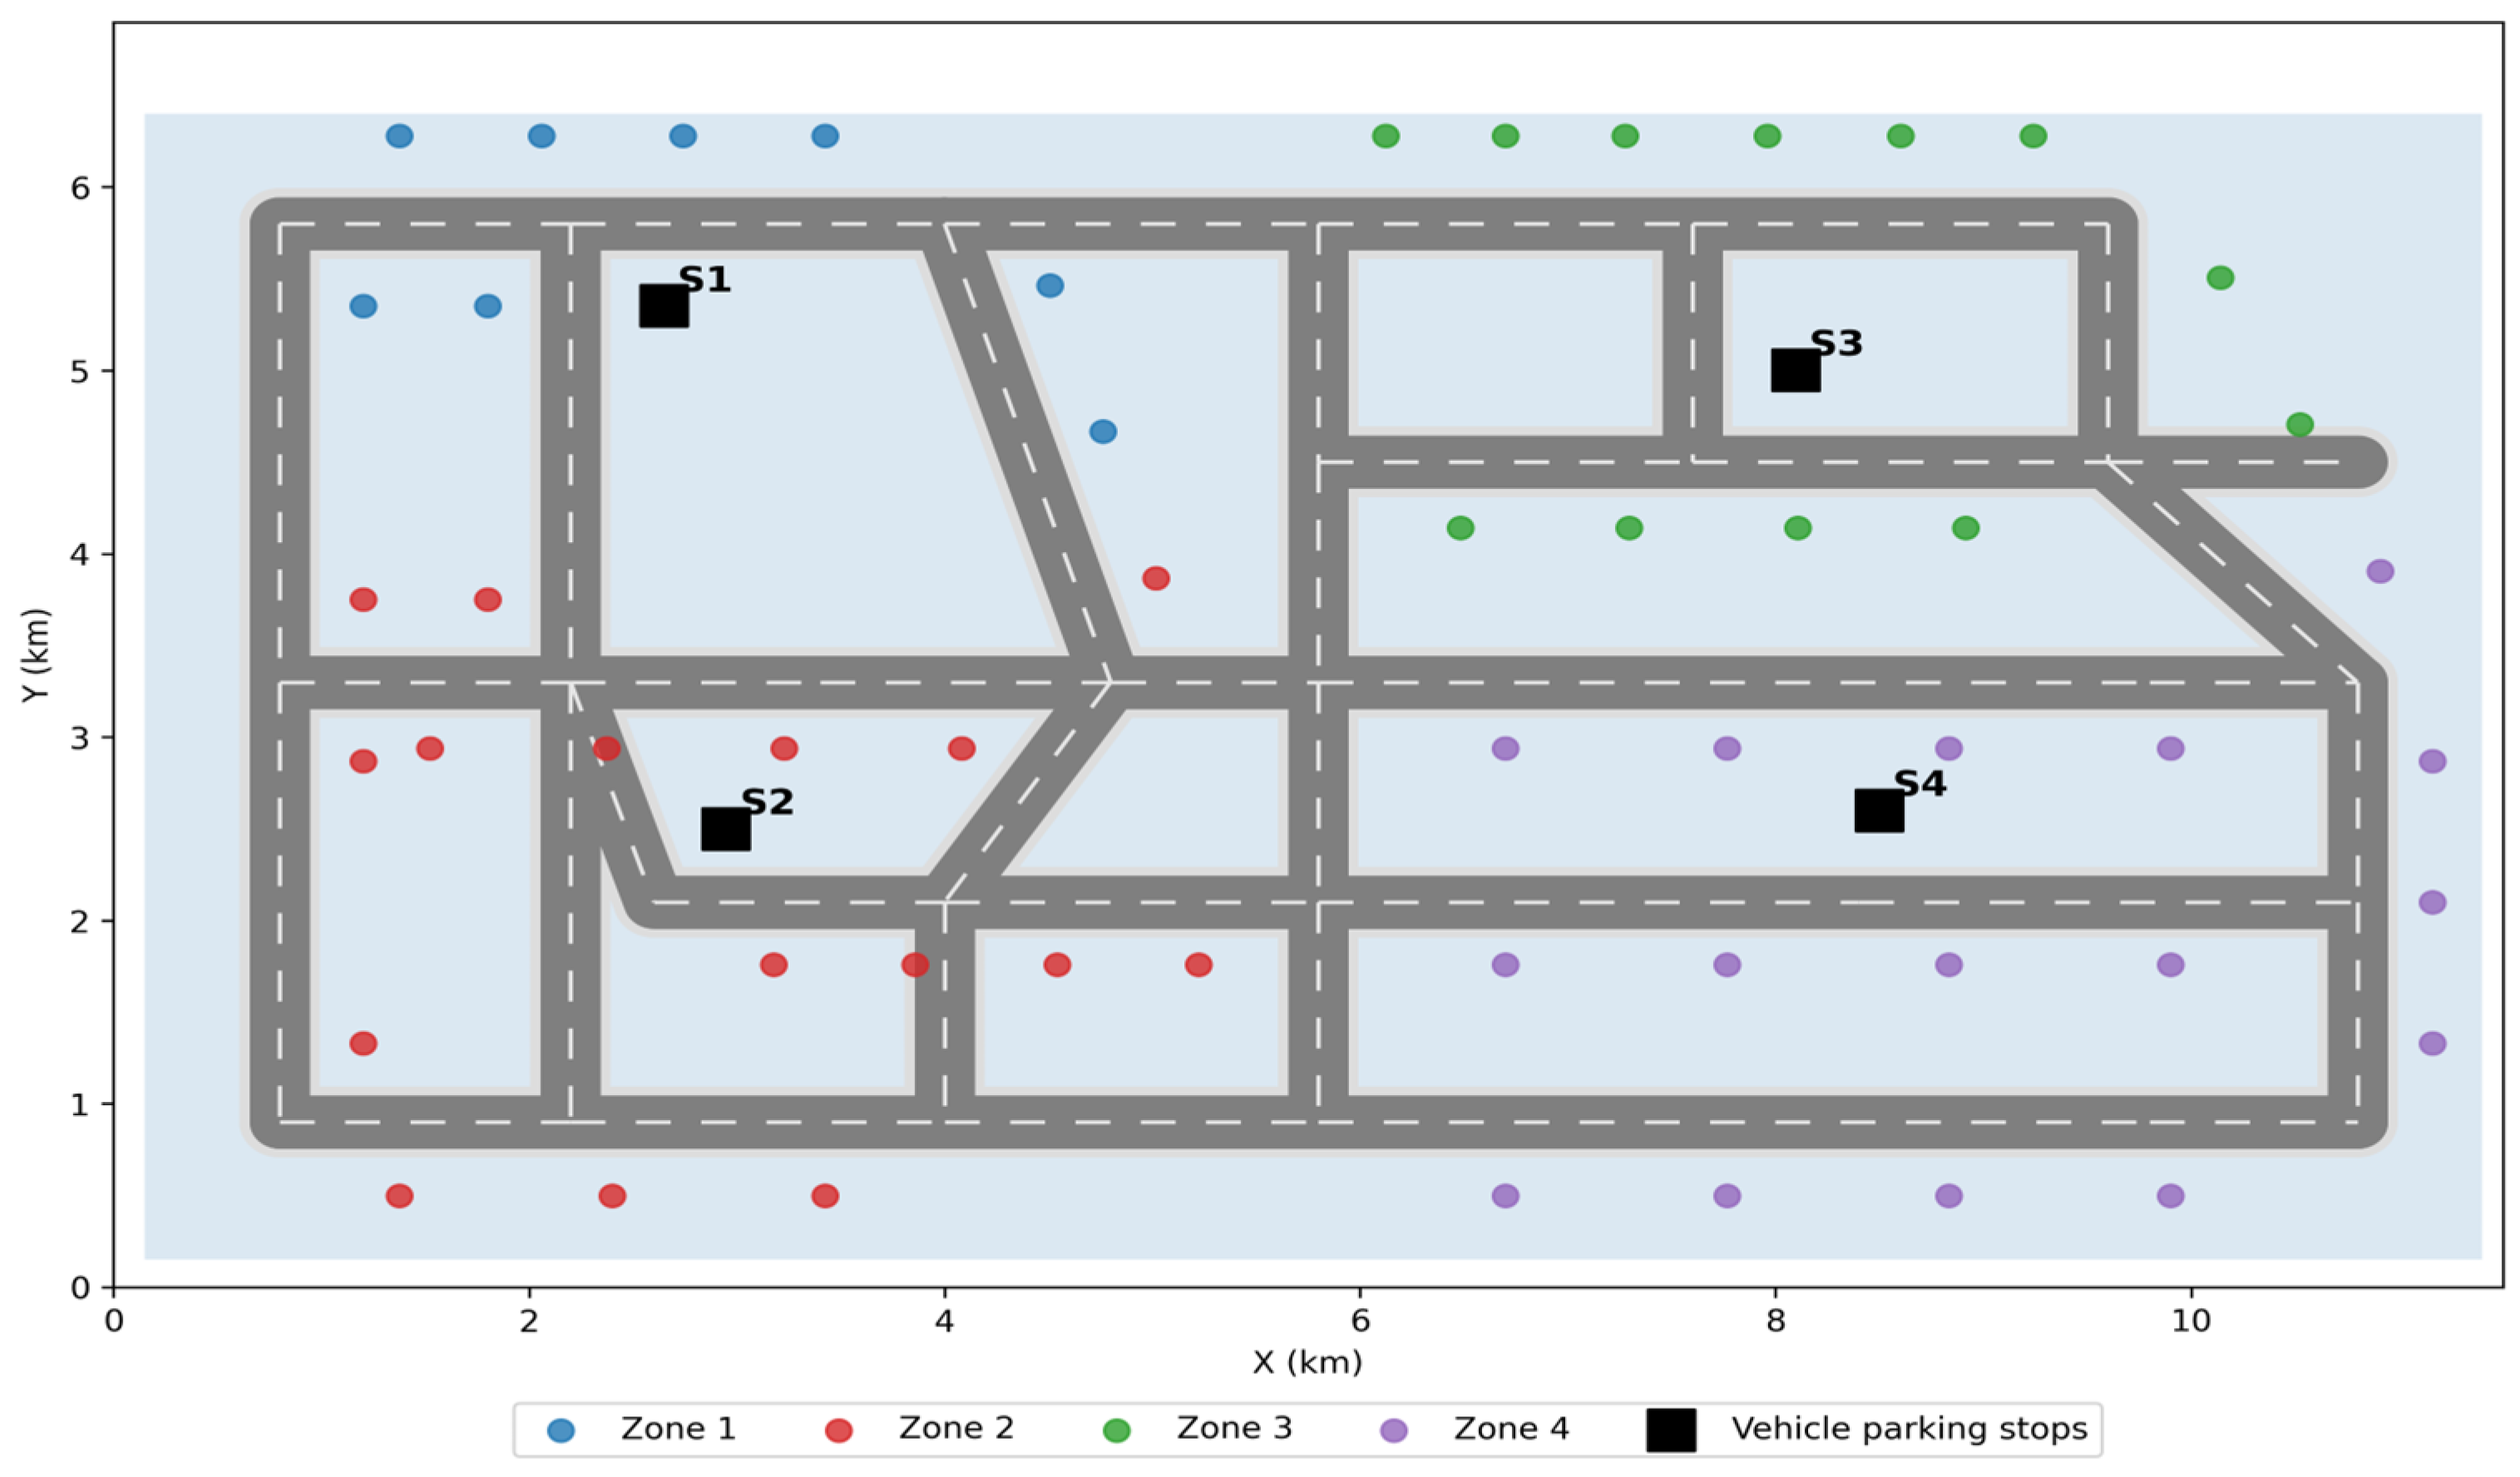
Figure 4 shows the spatial task-region partitioning results. The four parking sites generate relatively independent service regions, which reduces unnecessary cross-regional flight and provides an organized basis for asynchronous vehicle–UAV coordination. In the wind-factor controlled experiment, the task distribution and parking-site configuration remain unchanged, while only the reference wind speed is varied. In the comprehensive multi-scenario validation, task density and wind condition are allowed to vary jointly to examine the overall applicability of the proposed method under different operating conditions.
Figure 4.
Multi-scenario task distribution and parking-site-based task-region partitioning.
6.2. Execution Process in the Reference Strong-Wind Scenario
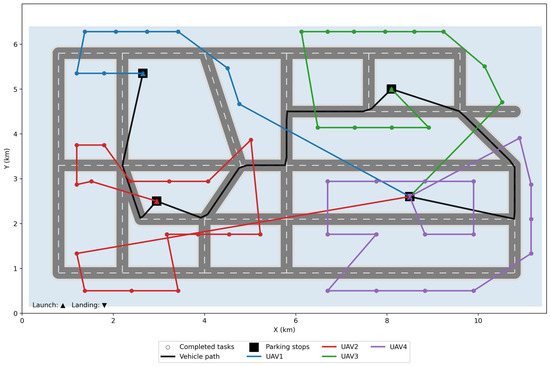
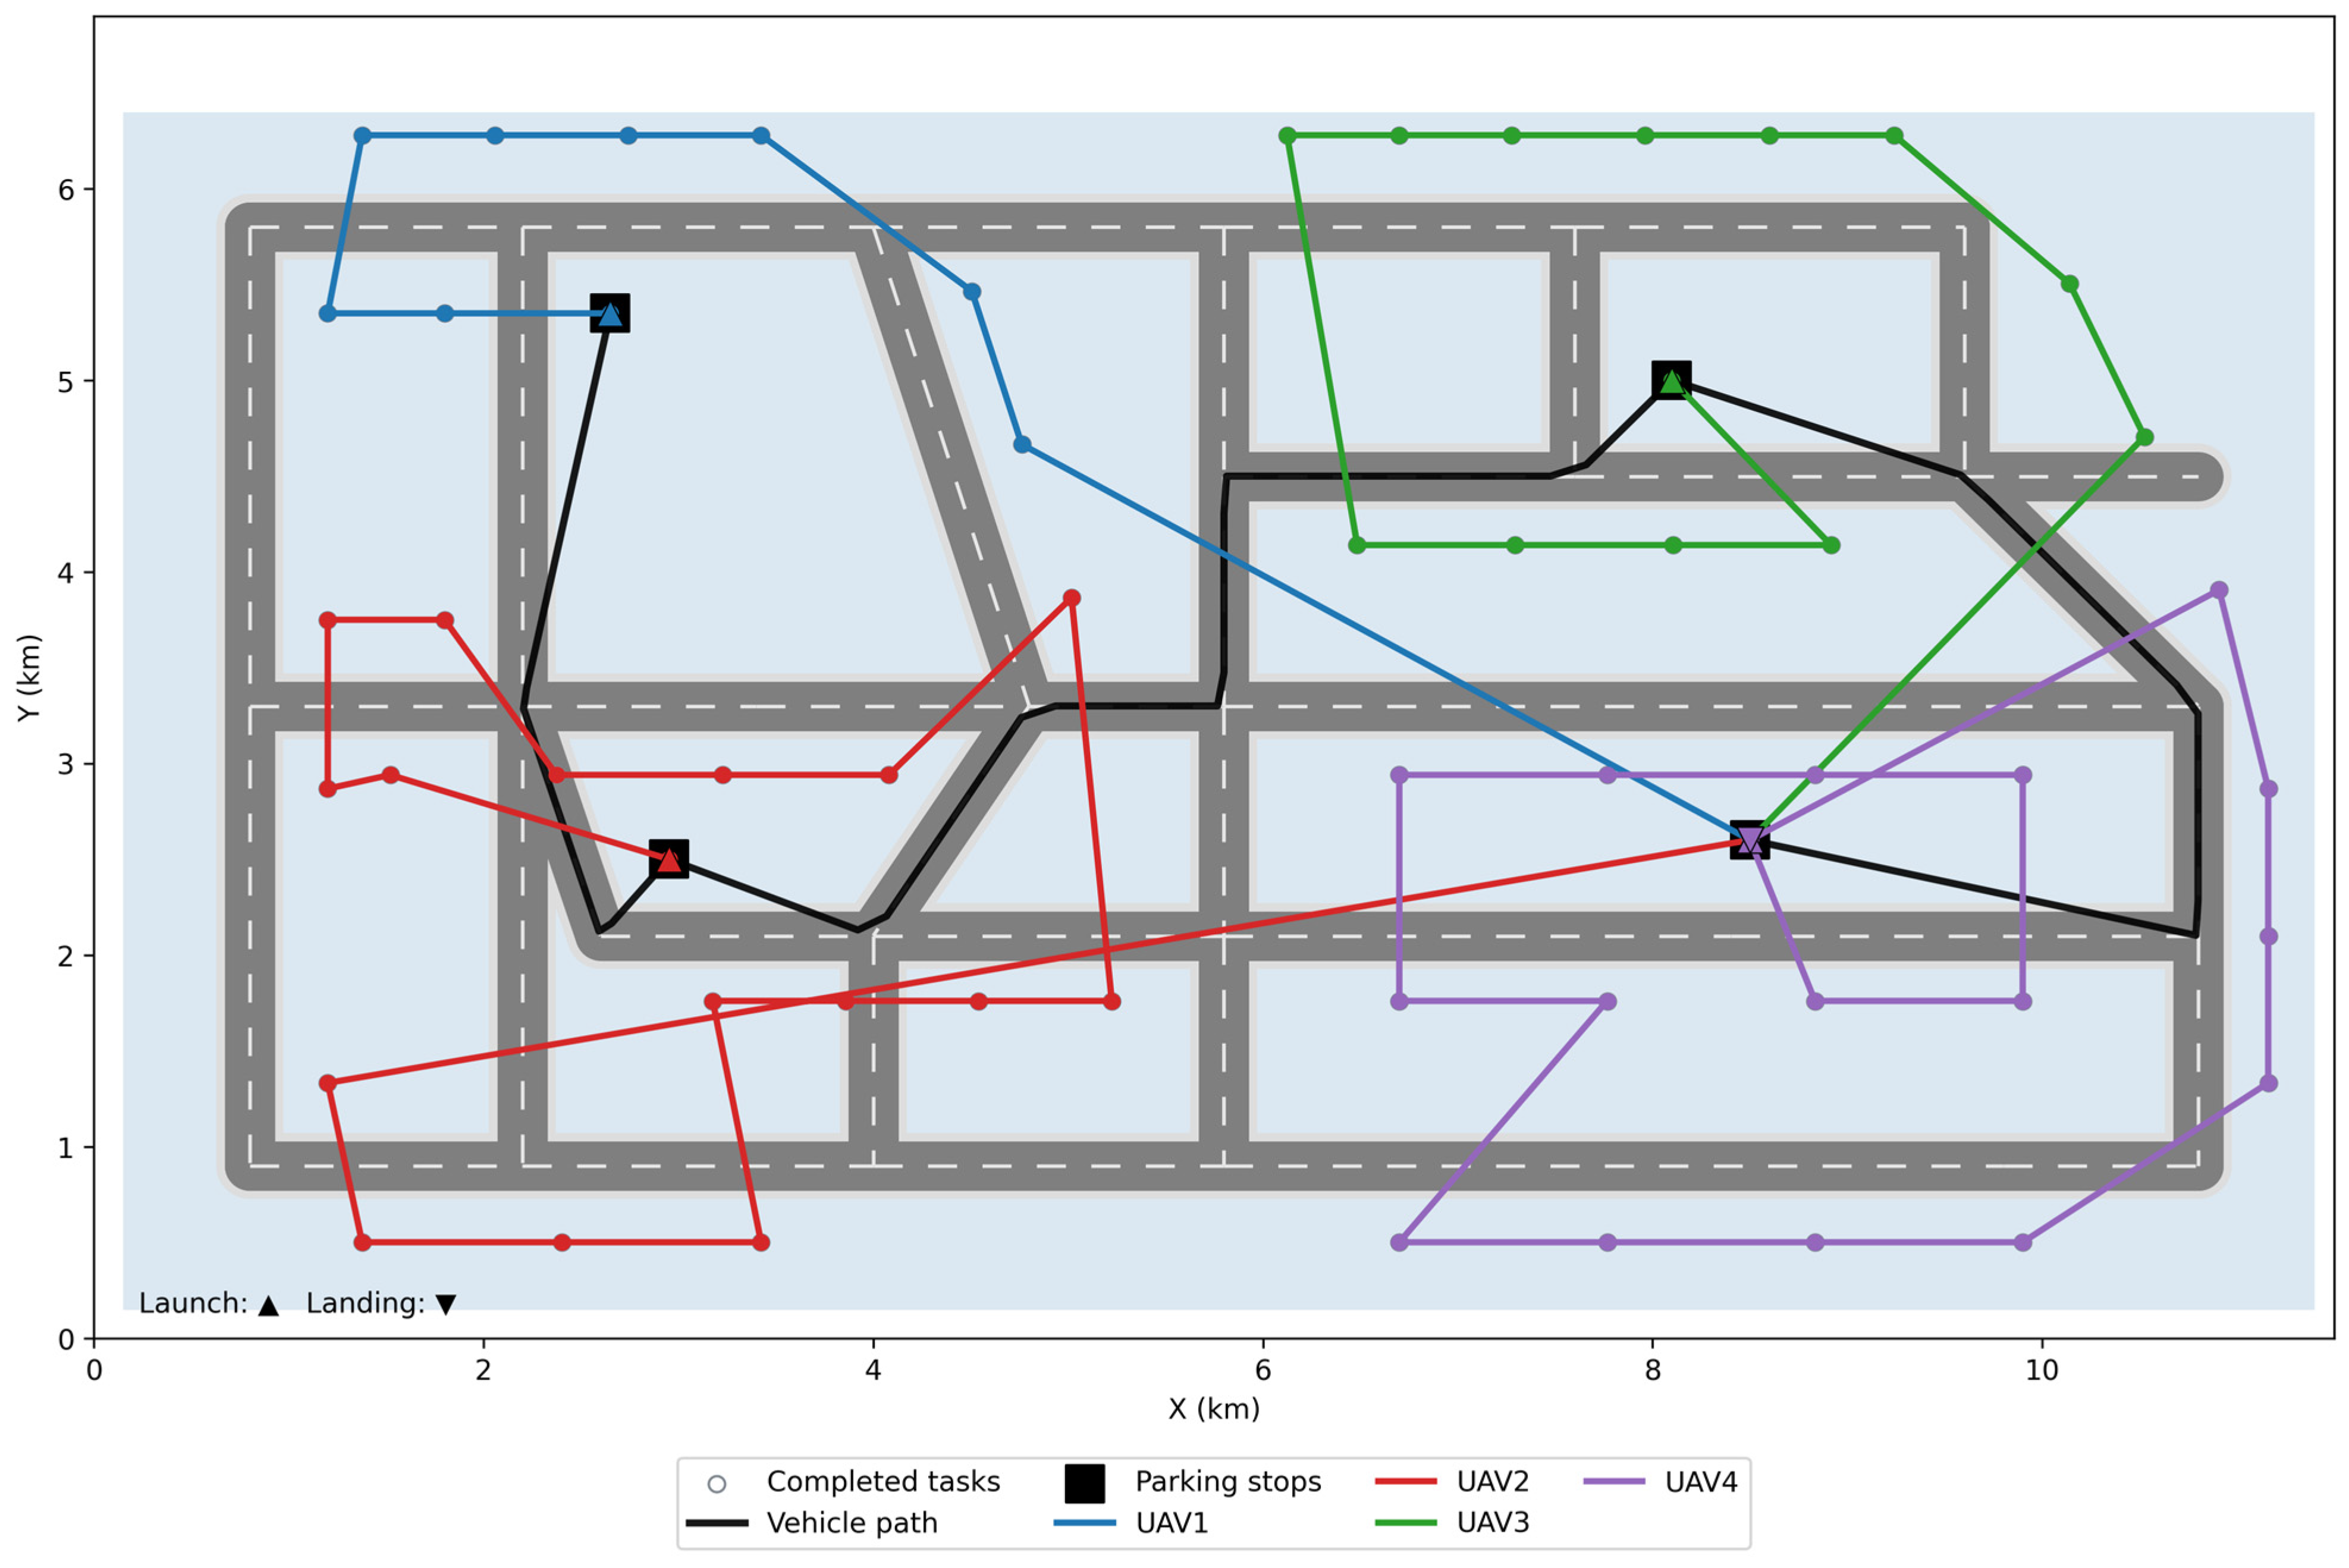
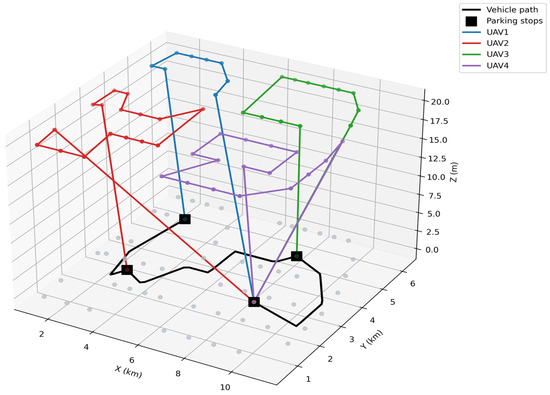
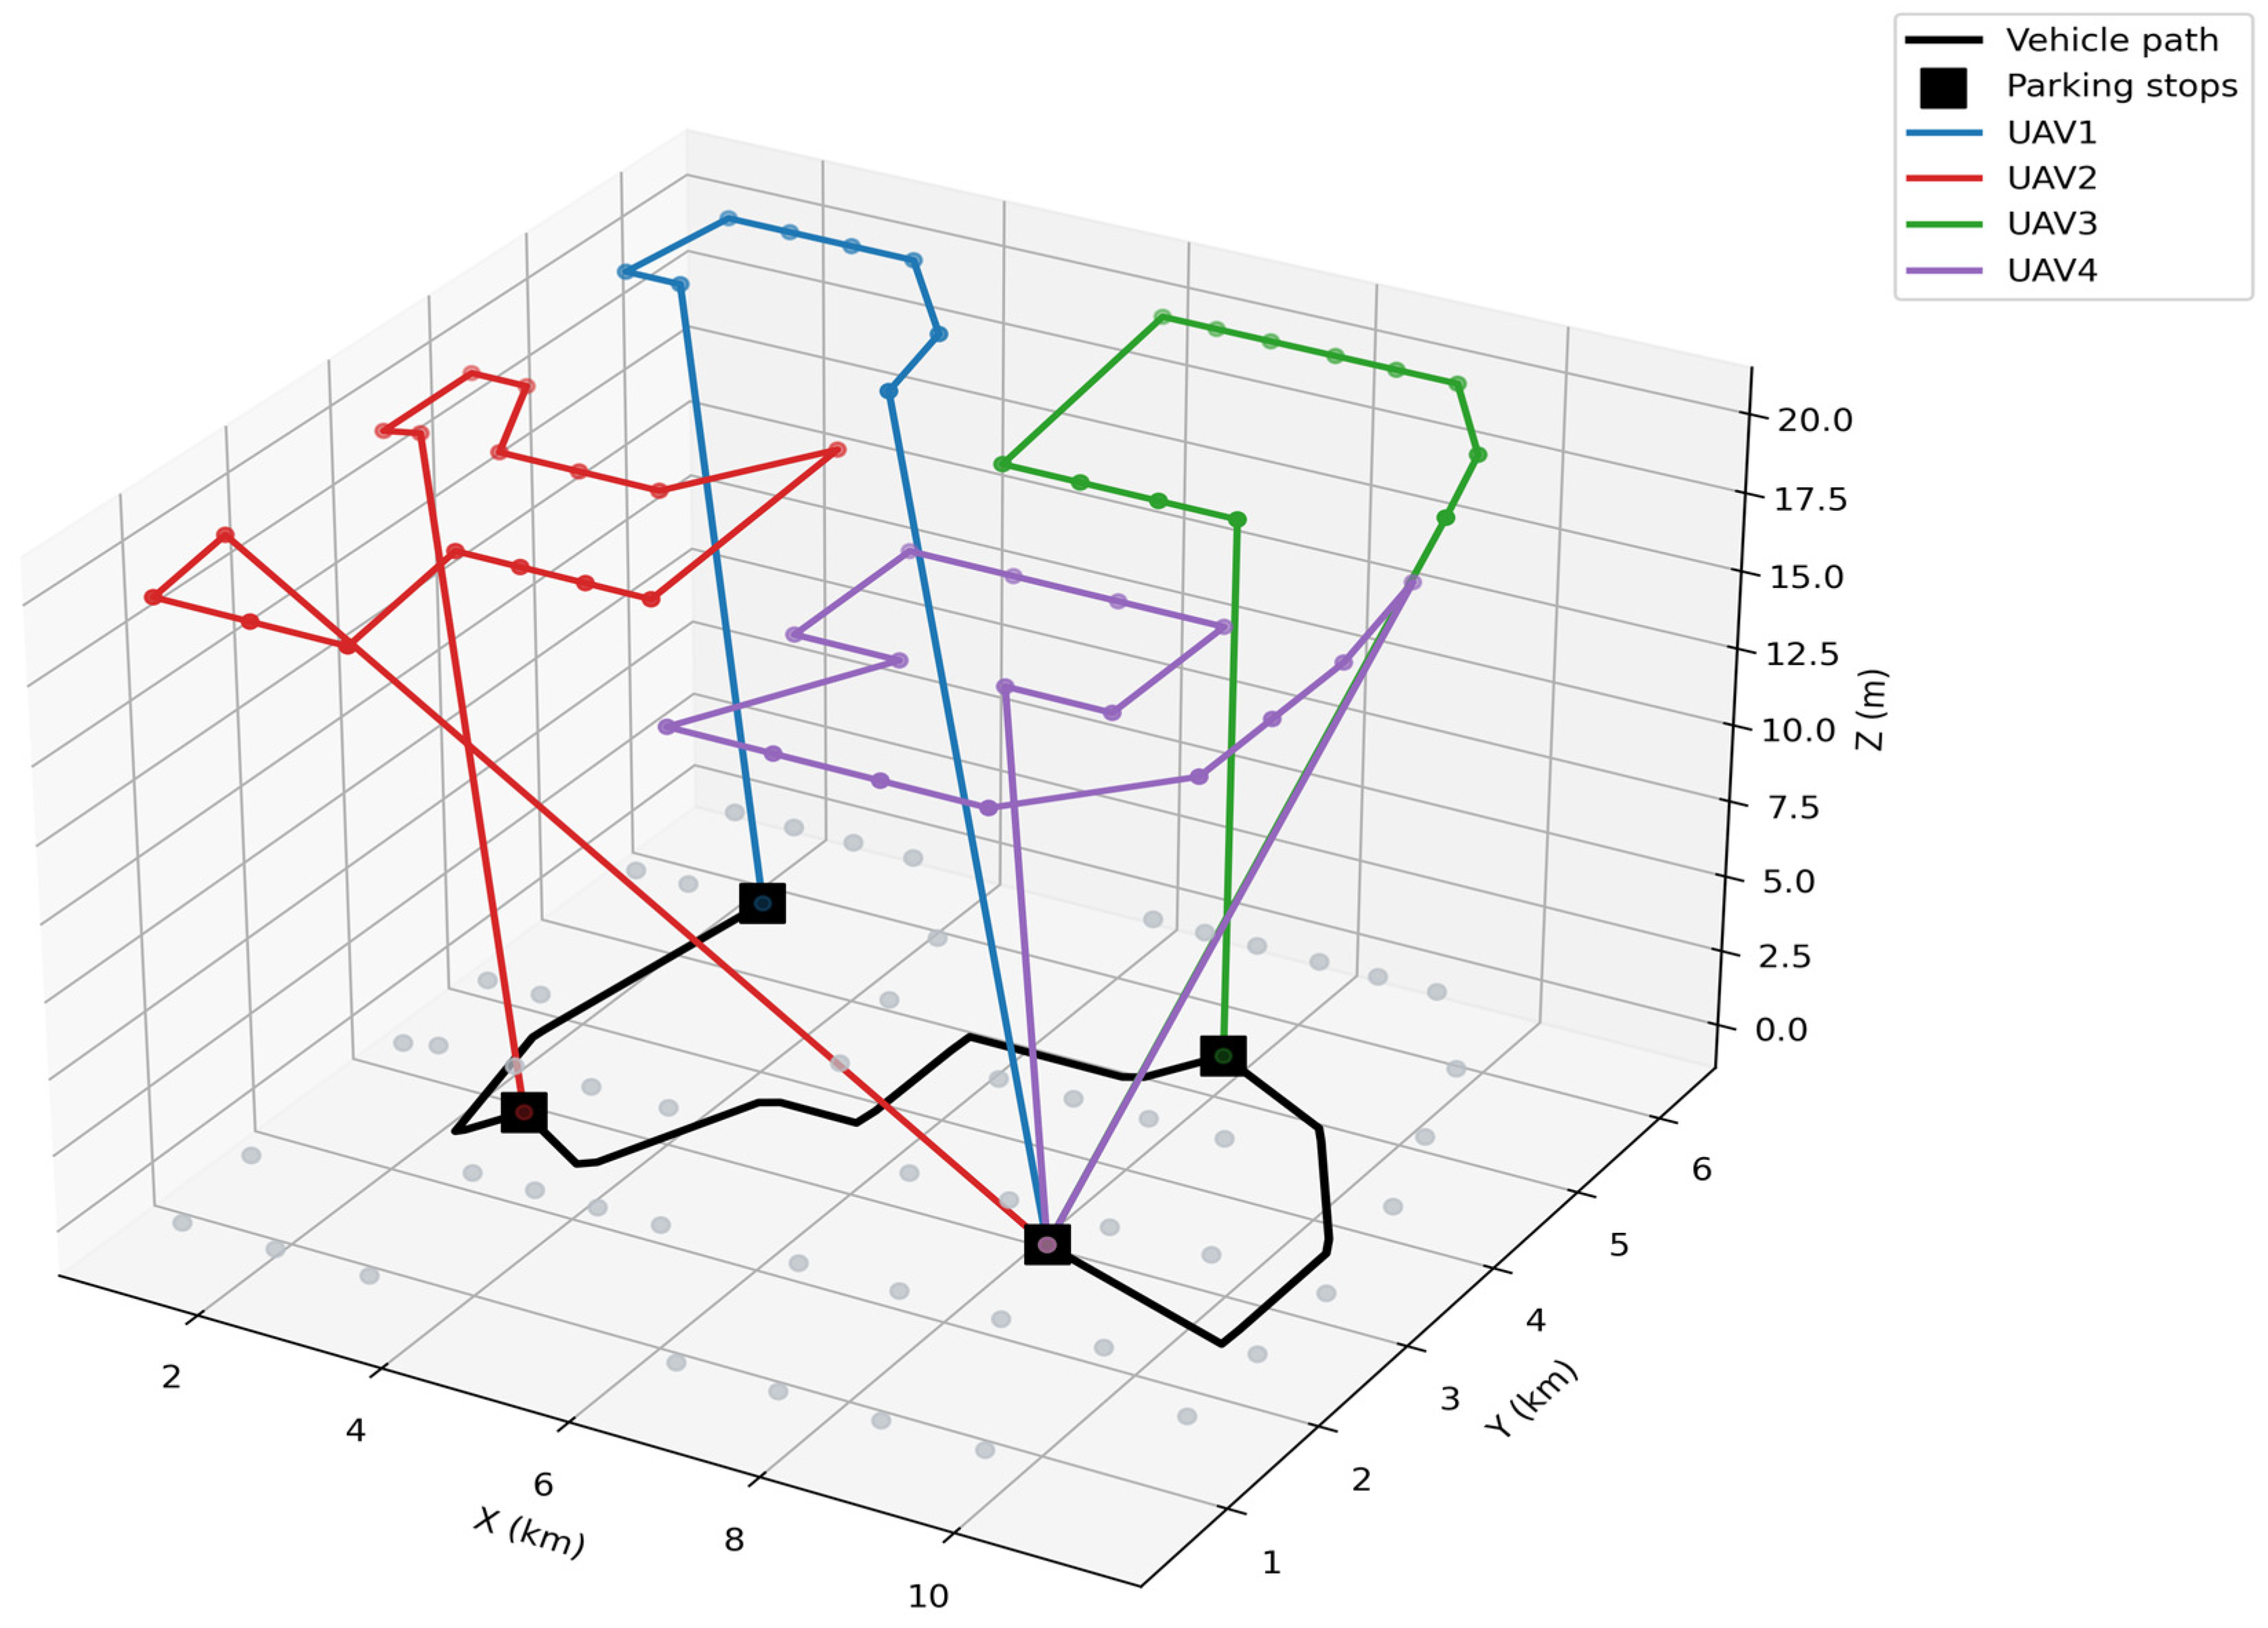
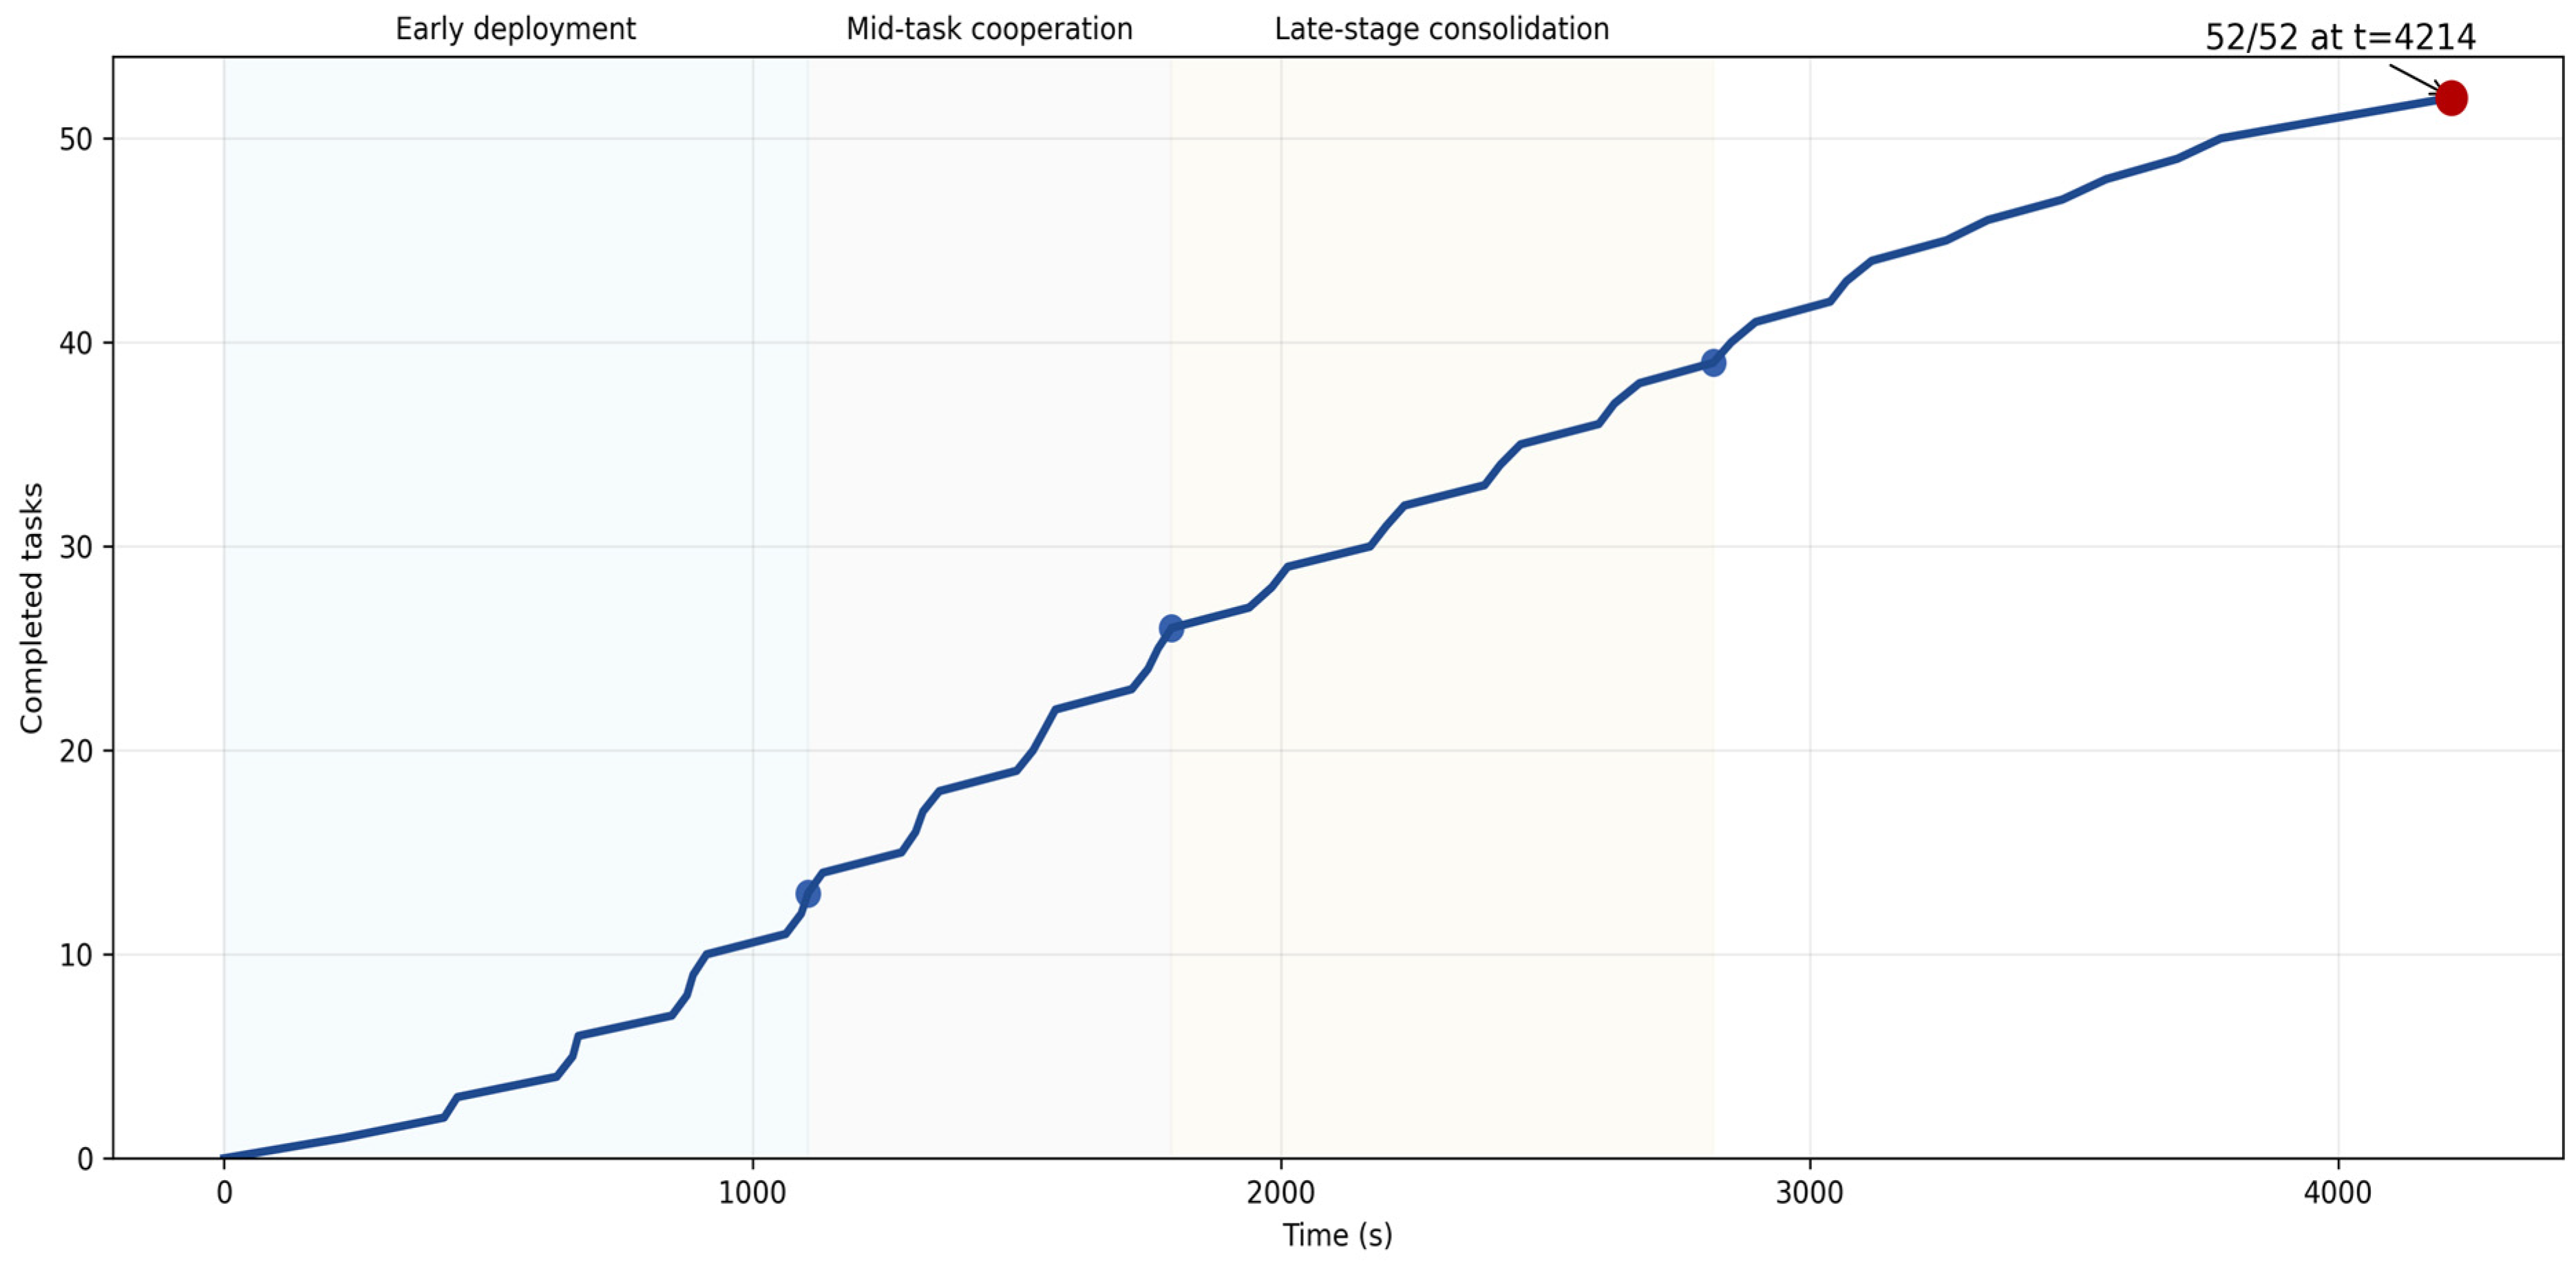
Scenario B is selected as the reference strong-wind case because it contains the complete 52-task distribution and the 10 m/s wind condition. Under this condition, the proposed method completes 52 out of 52 tasks, with a task coverage of 100.00%. The mission completion time is 4214.19 s (70.24 min), and the minimum residual SOC is 13.82%, which remains above the 10% safety threshold. The planar and three-dimensional trajectories of asynchronous vehicle–UAV cooperative inspection in Scenario B are shown in Figure 5 and Figure 6, respectively.
Figure 5.
Planar trajectories of asynchronous vehicle–UAV cooperative inspection in Scenario B under a 10 m/s wind condition.
Figure 6.
Three-dimensional trajectories of asynchronous vehicle–UAV cooperative inspection in Scenario B.
6.3. Task Progress, SOC Evolution, and State-Switching Analysis
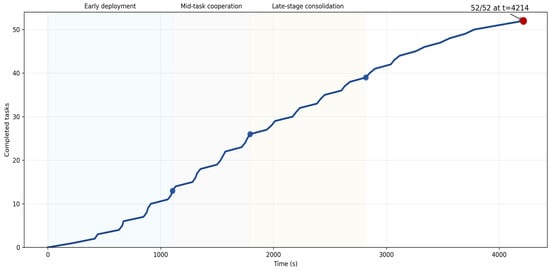
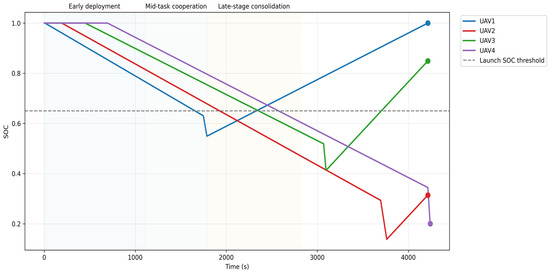
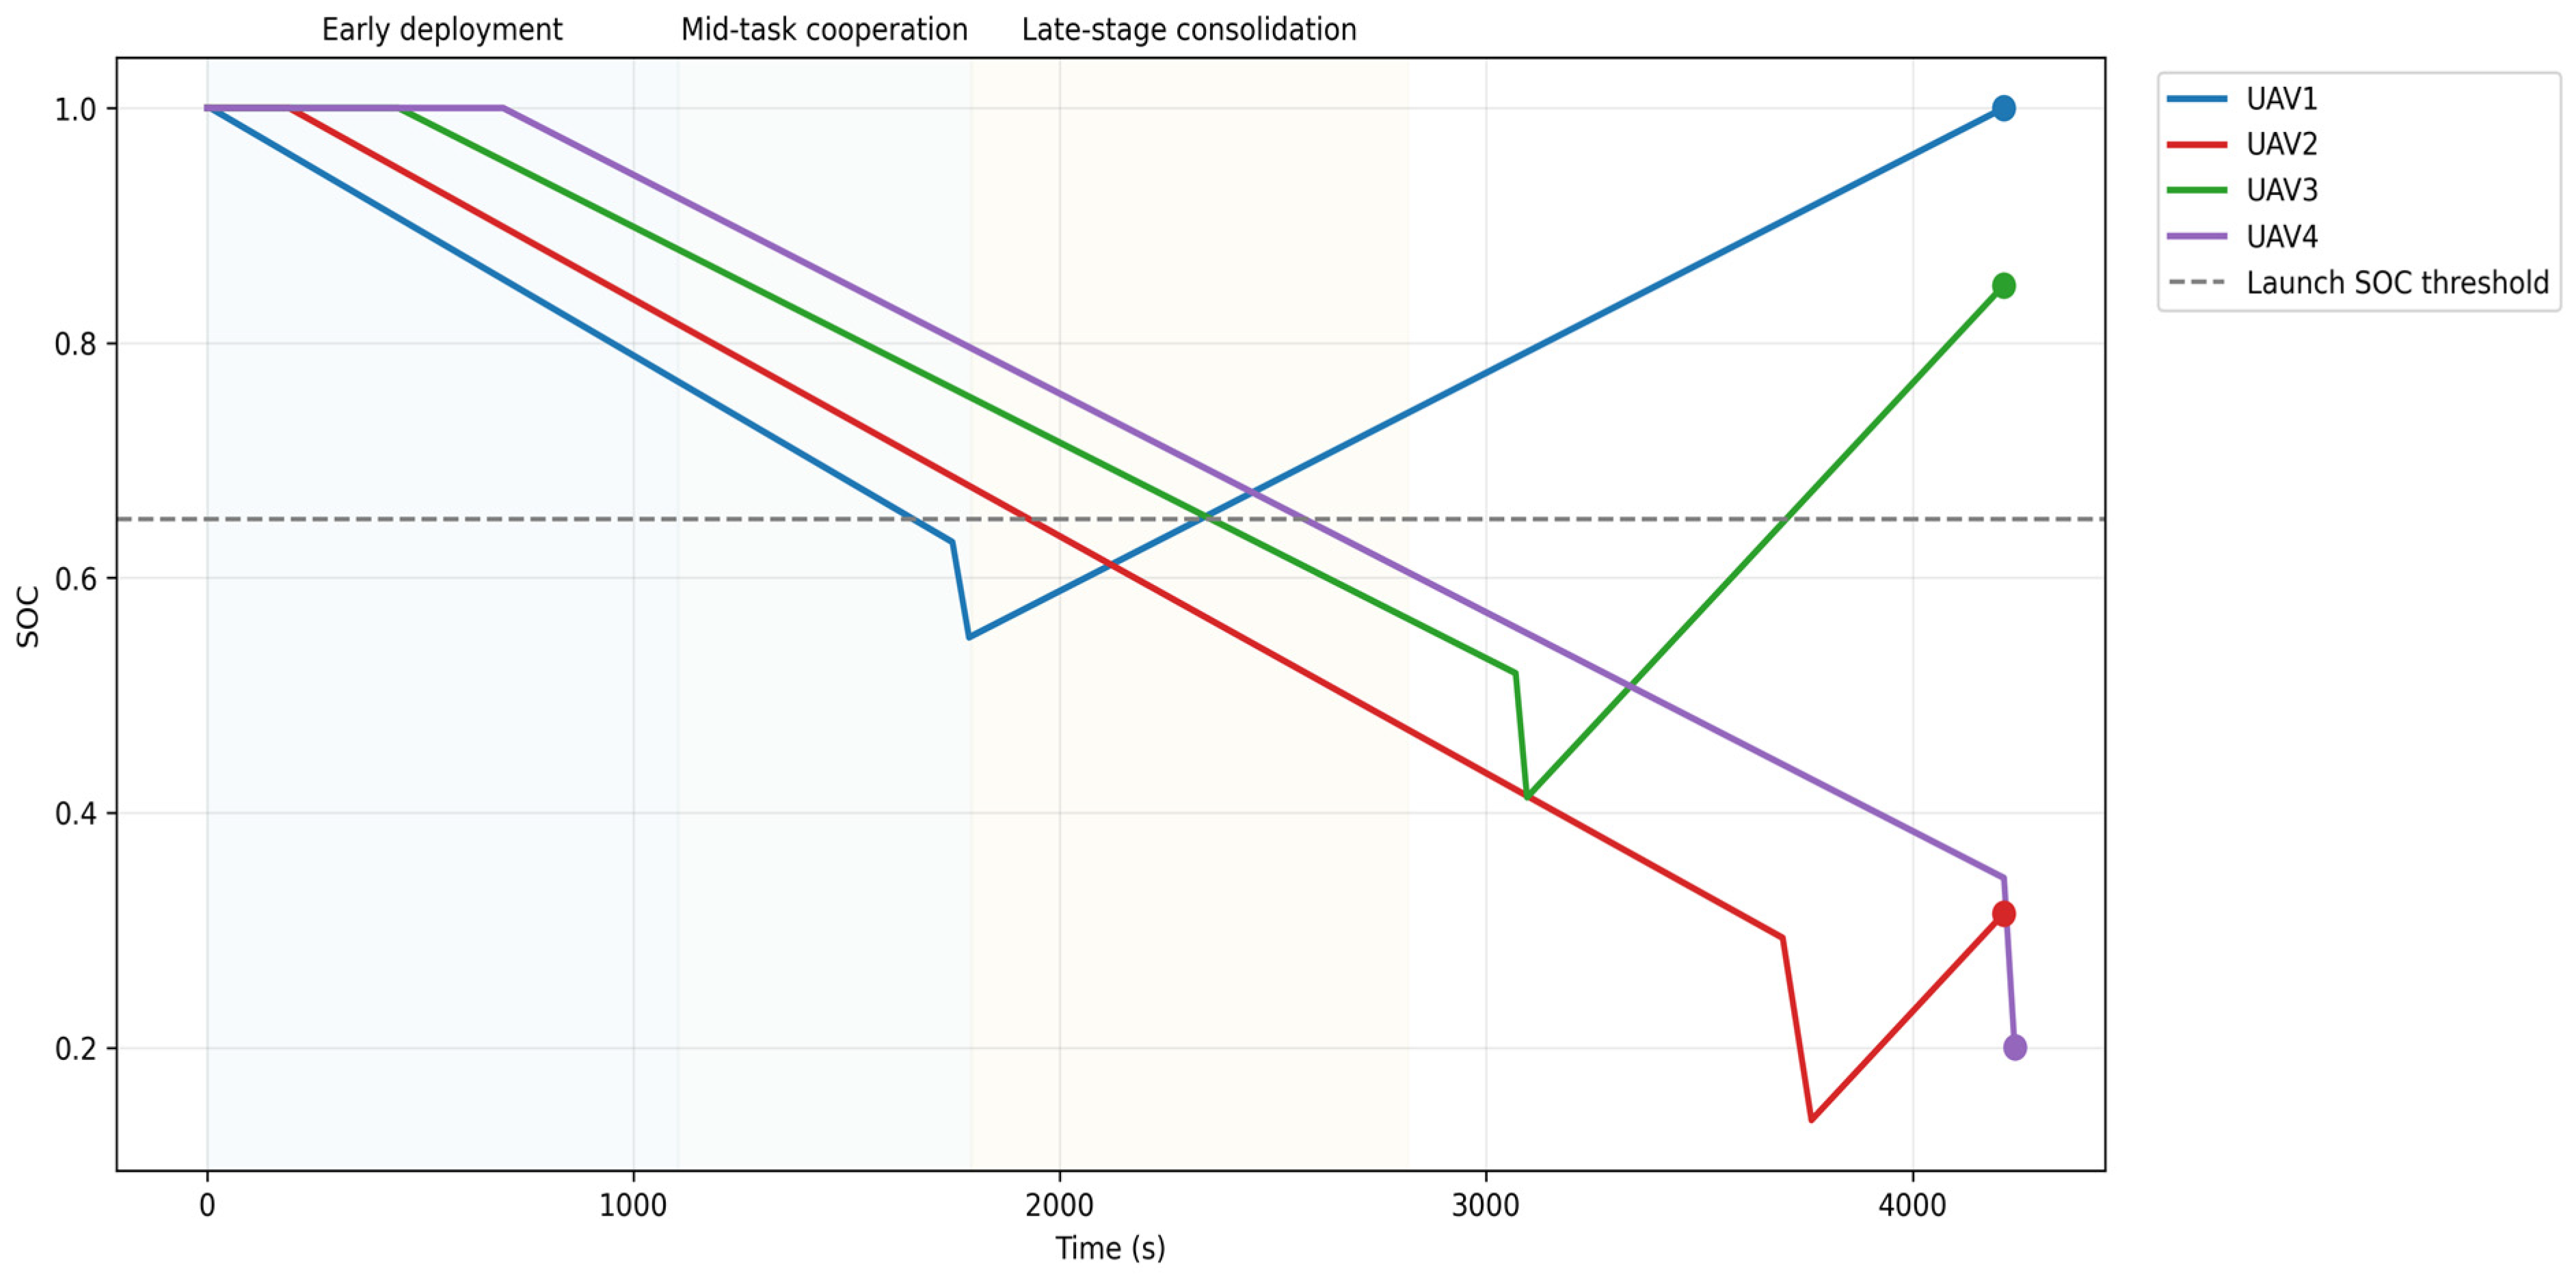
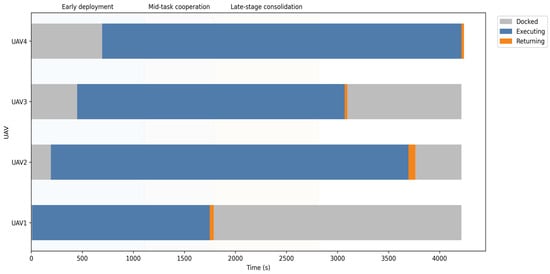
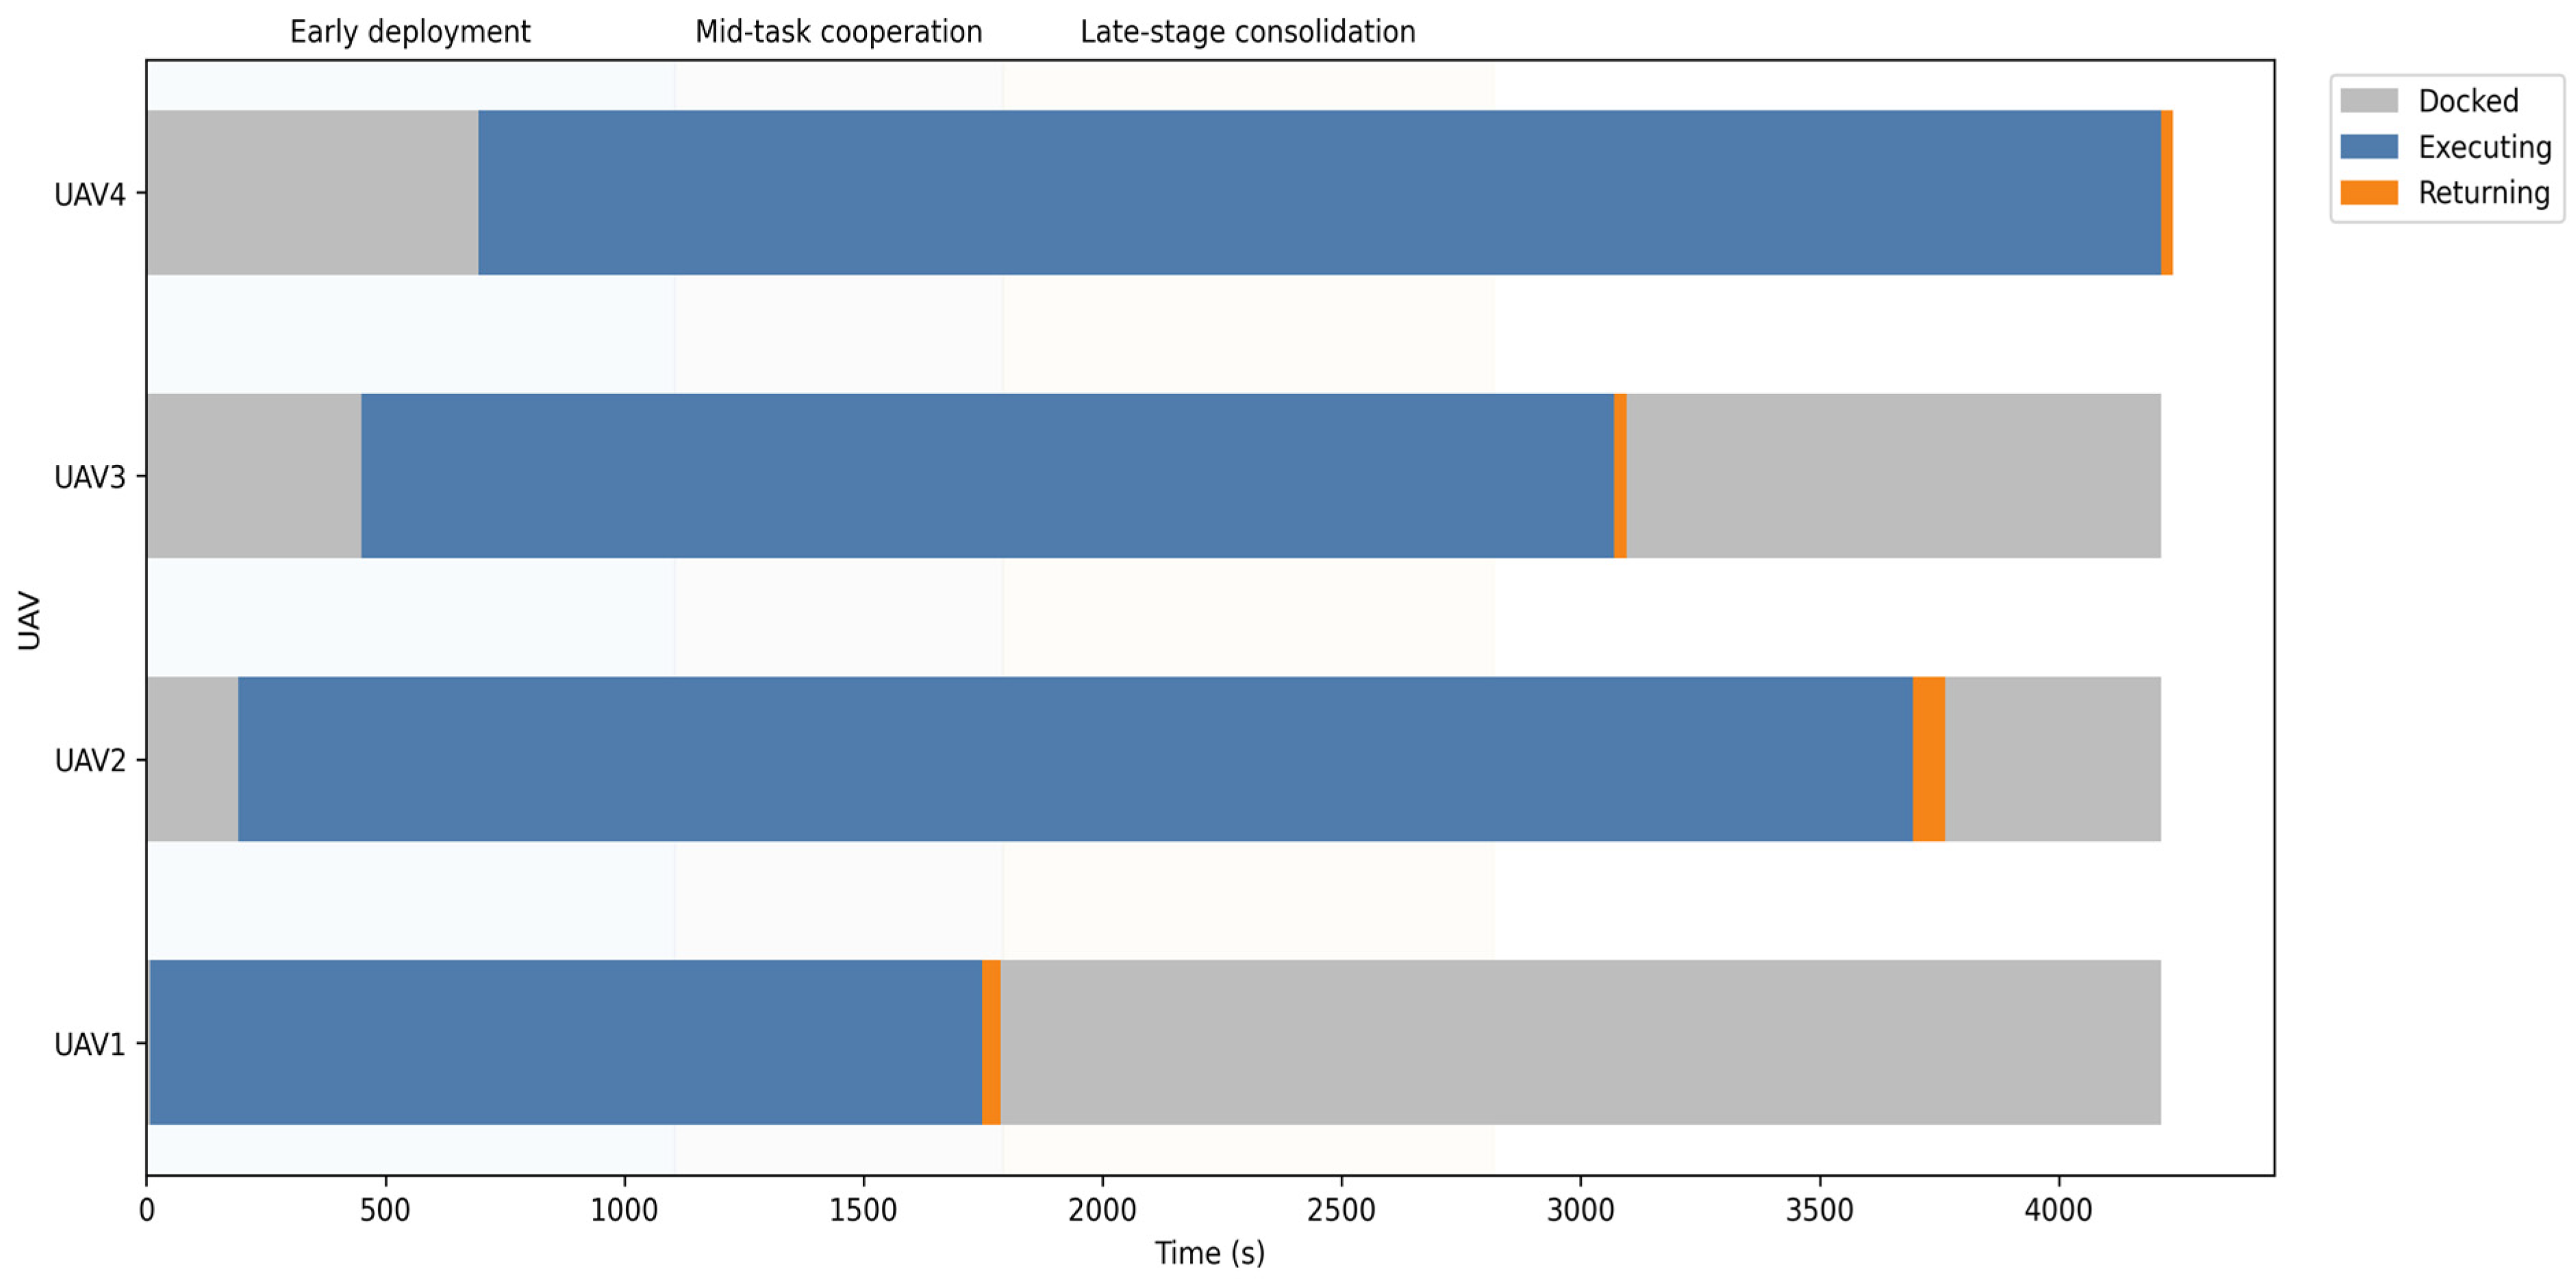
The task completion progress, SOC evolution, and UAV state-switching timeline in Scenario B are shown in Figure 7, Figure 8 and Figure 9, respectively. The task-completion curve increases monotonically and reaches full coverage at the end of the mission, indicating that no repeated deadlock or unresolved terminal task occurs. The SOC curves show that UAV energy consumption differs among vehicles because their assigned task lengths and recovery distances are different. The state-switching timeline further confirms that vehicle movement, UAV inspection, UAV return, and charging operations are partially decoupled.
Figure 7.
Task completion progress in Scenario B under a 10 m/s wind condition.
Figure 8.
SOC evolution of UAVs in Scenario B under a 10 m/s wind condition.
Figure 9.
UAV state timeline in Scenario B under a 10 m/s wind condition.
6.4. Controlled Variable Experiments
To further clarify the causal influence of wind disturbance and task scale, controlled variable experiments are conducted. Different from the comprehensive scenarios in which task scale and wind speed may change simultaneously, the controlled experiments follow the one-factor-at-a-time principle. In each experimental group, all variables except the target factor are kept unchanged.
Wind-Factor Controlled Experiment
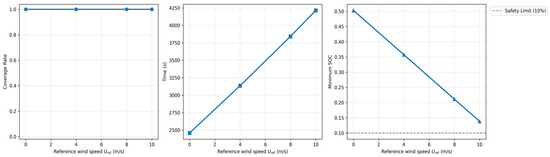
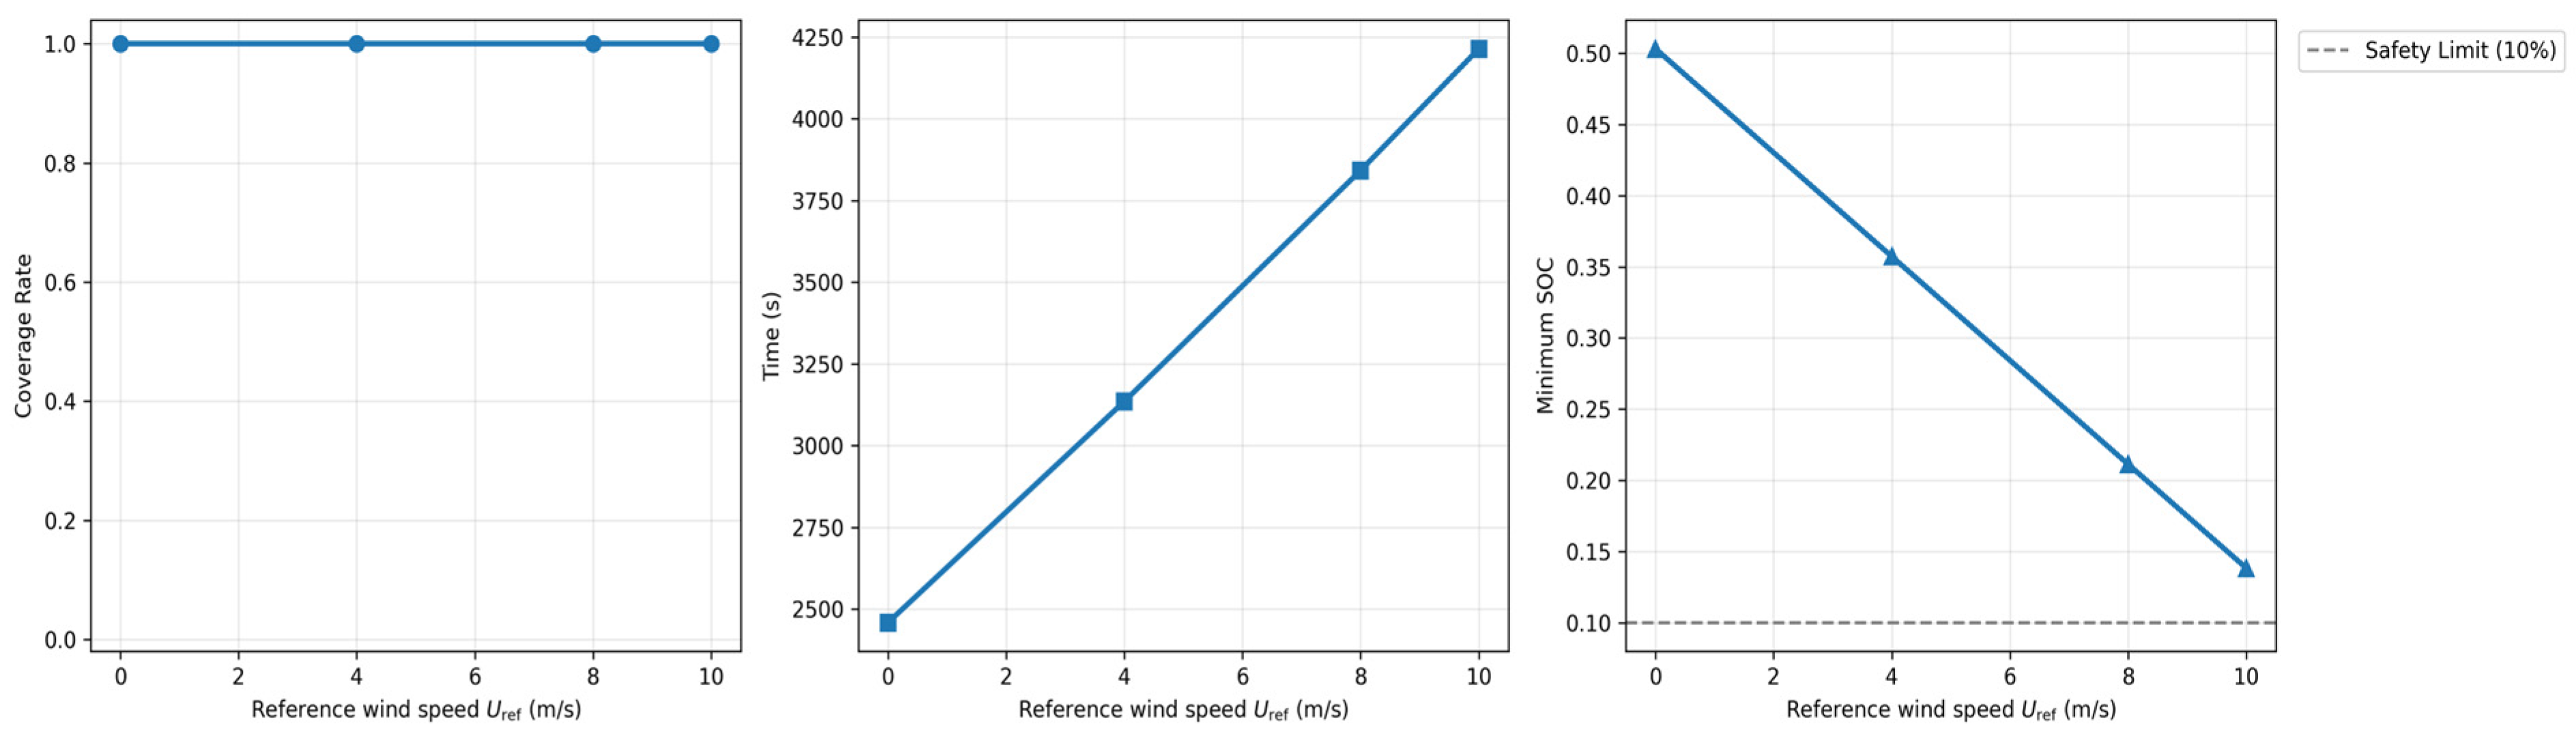
In the wind-factor controlled experiment, the task set, vehicle parking sites, road network, UAV fleet, SOC safety threshold, task-completion criteria, and algorithmic parameters are fixed. The number of inspection tasks is fixed at 52, and the number of UAVs is fixed at four. Only the reference wind speed is varied among 0 m/s, 4 m/s, 8 m/s, and 10 m/s. The results are shown in Table 3 and Figure 10.
Table 3.
Numerical results of the wind-factor controlled experiment under fixed task scale.
Figure 10.
Variation trends of coverage, mission time, and minimum SOC under different reference wind speeds.
As shown in Table 3, when the task scale is fixed, the proposed method maintains full task coverage under all tested wind conditions. However, the mission completion time increases from 2458.33 s to 4214.19 s as the reference wind speed increases from 0 m/s to 10 m/s. Meanwhile, the minimum residual SOC decreases from 50.32% to 13.82%. This trend indicates that wind disturbance independently increases the energy burden and execution time of UAV inspection. Nevertheless, under the 10 m/s wind condition, the minimum residual SOC remains above the 10% safety threshold, indicating that the proposed asynchronous scheduling mechanism can still maintain task completeness and energy safety under the tested strong-wind condition.
6.5. Comprehensive Multi-Scenario Validation
After the controlled variable experiments, four comprehensive scenarios are further evaluated to examine the overall behavior of the proposed method under combined changes in task density and wind condition. It should be noted that these scenarios are not used to isolate the causal effect of a single factor. Instead, they are used to verify whether the proposed method can maintain task completeness and energy safety under different combined operating conditions.
Table 4 shows the comprehensive multi-scenario results. Since task scale and wind condition vary jointly in these scenarios, they are not used for single-factor causal inference. Instead, they provide an overall validation of the proposed method under combined operating conditions. The proposed method maintains 100.00% task coverage in all four scenarios. As the task density and wind intensity increase, the mission completion time generally increases and the minimum residual SOC decreases. This result is consistent with the wind-sensitive energy model and the increased task workload. However, because multiple factors change simultaneously in this group, the isolated influence of wind speed and task scale should be interpreted based on the controlled experiments in Section 6.4.
Table 4.
Overall performance of the proposed method across comprehensive scenarios.
6.6. Comparative Analysis, Ablation, and Sensitivity
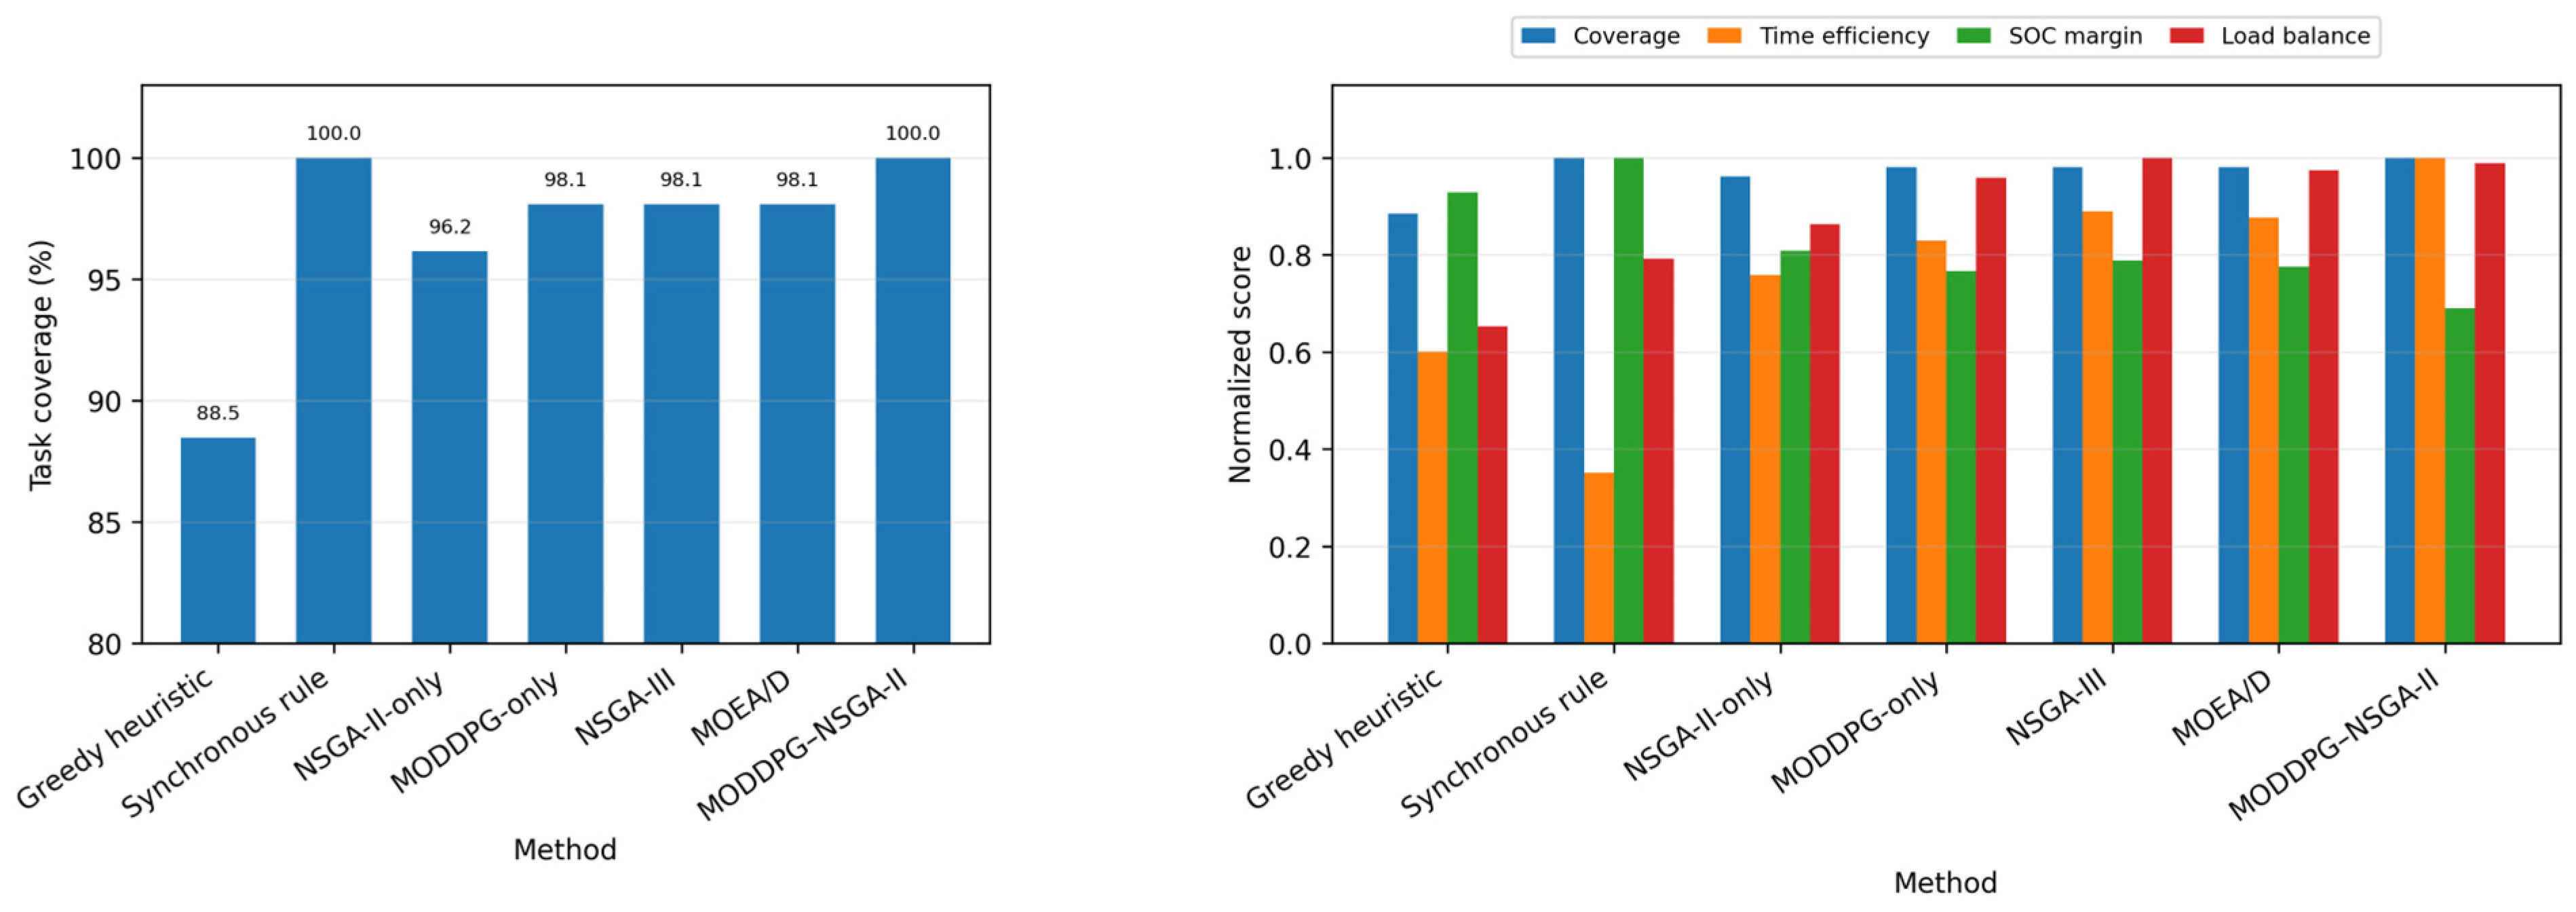
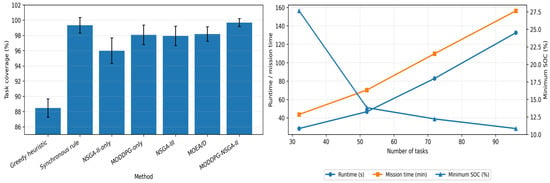
To evaluate the effectiveness of the proposed bi-level MODDPG–NSGA-II framework, six representative baselines are considered: greedy heuristic, synchronous rule, NSGA-II-only, MODDPG-only, NSGA-III, and MOEA/D. All methods are evaluated under the same reference scenario, road network, task set, parking sites, UAV fleet, SOC threshold, and task-completion criteria. The inclusion of NSGA-III and MOEA/D provides representative state-of-the-art multi-objective baselines, while NSGA-II-only and MODDPG-only serve as ablation baselines for verifying the necessity of the bi-level framework. Table 5 compares the performance of different scheduling methods, and Figure 11 provides the corresponding visual comparison.
Table 5.
Comparison of different scheduling methods in the reference scenario.
Figure 11.
Comparison of different scheduling methods under the reference scenario.
Table 6 presents the ablation analysis results of the proposed framework.
Table 6.
Ablation analysis of the proposed framework.
The ablation results indicate that the performance gain comes from the joint contribution of the bi-level architecture, heuristic–residual fusion, wind-aware energy evaluation, and asynchronous recovery. The full framework achieves the shortest mission time while maintaining full task coverage and SOC safety. Removing the outer NSGA-II weakens the global preference search; removing the inner MODDPG weakens continuous feedback learning; and removing the wind-aware energy term leads to unsafe SOC margins. These results verify the necessity of the proposed framework rather than treating it as an ad hoc integration of existing modules.
Table 7 reports the reward-weight sensitivity analysis results.
Table 7.
Reward-weight sensitivity analysis.
The sensitivity results show that reward-weight changes affect the detailed trade-off among time efficiency, energy margin, and load balance. However, within the tested range, the proposed method maintains high task coverage and SOC safety. This indicates that the main conclusion does not depend on a single manually selected reward-weight setting.
The main implementation settings of the proposed framework are summarized in Table 8. The inner-layer MODDPG uses actor–critic networks with experience replay and soft target updates to learn continuous scheduling actions, while the outer-layer NSGA-II uses real-valued encoding and standard multi-objective evolutionary operators to search coordination parameters. These settings provide reproducible implementation details for the reinforcement learning training process and the outer-layer multi-objective optimization.
Table 8.
Main implementation settings of the proposed MODDPG–NSGA-II framework.
Table 9 summarizes the Pareto-set quality comparison of different multi-objective methods.
Table 9.
Pareto-set quality comparison of different multi-objective methods.
6.7. Pareto-Set Quality Evaluation
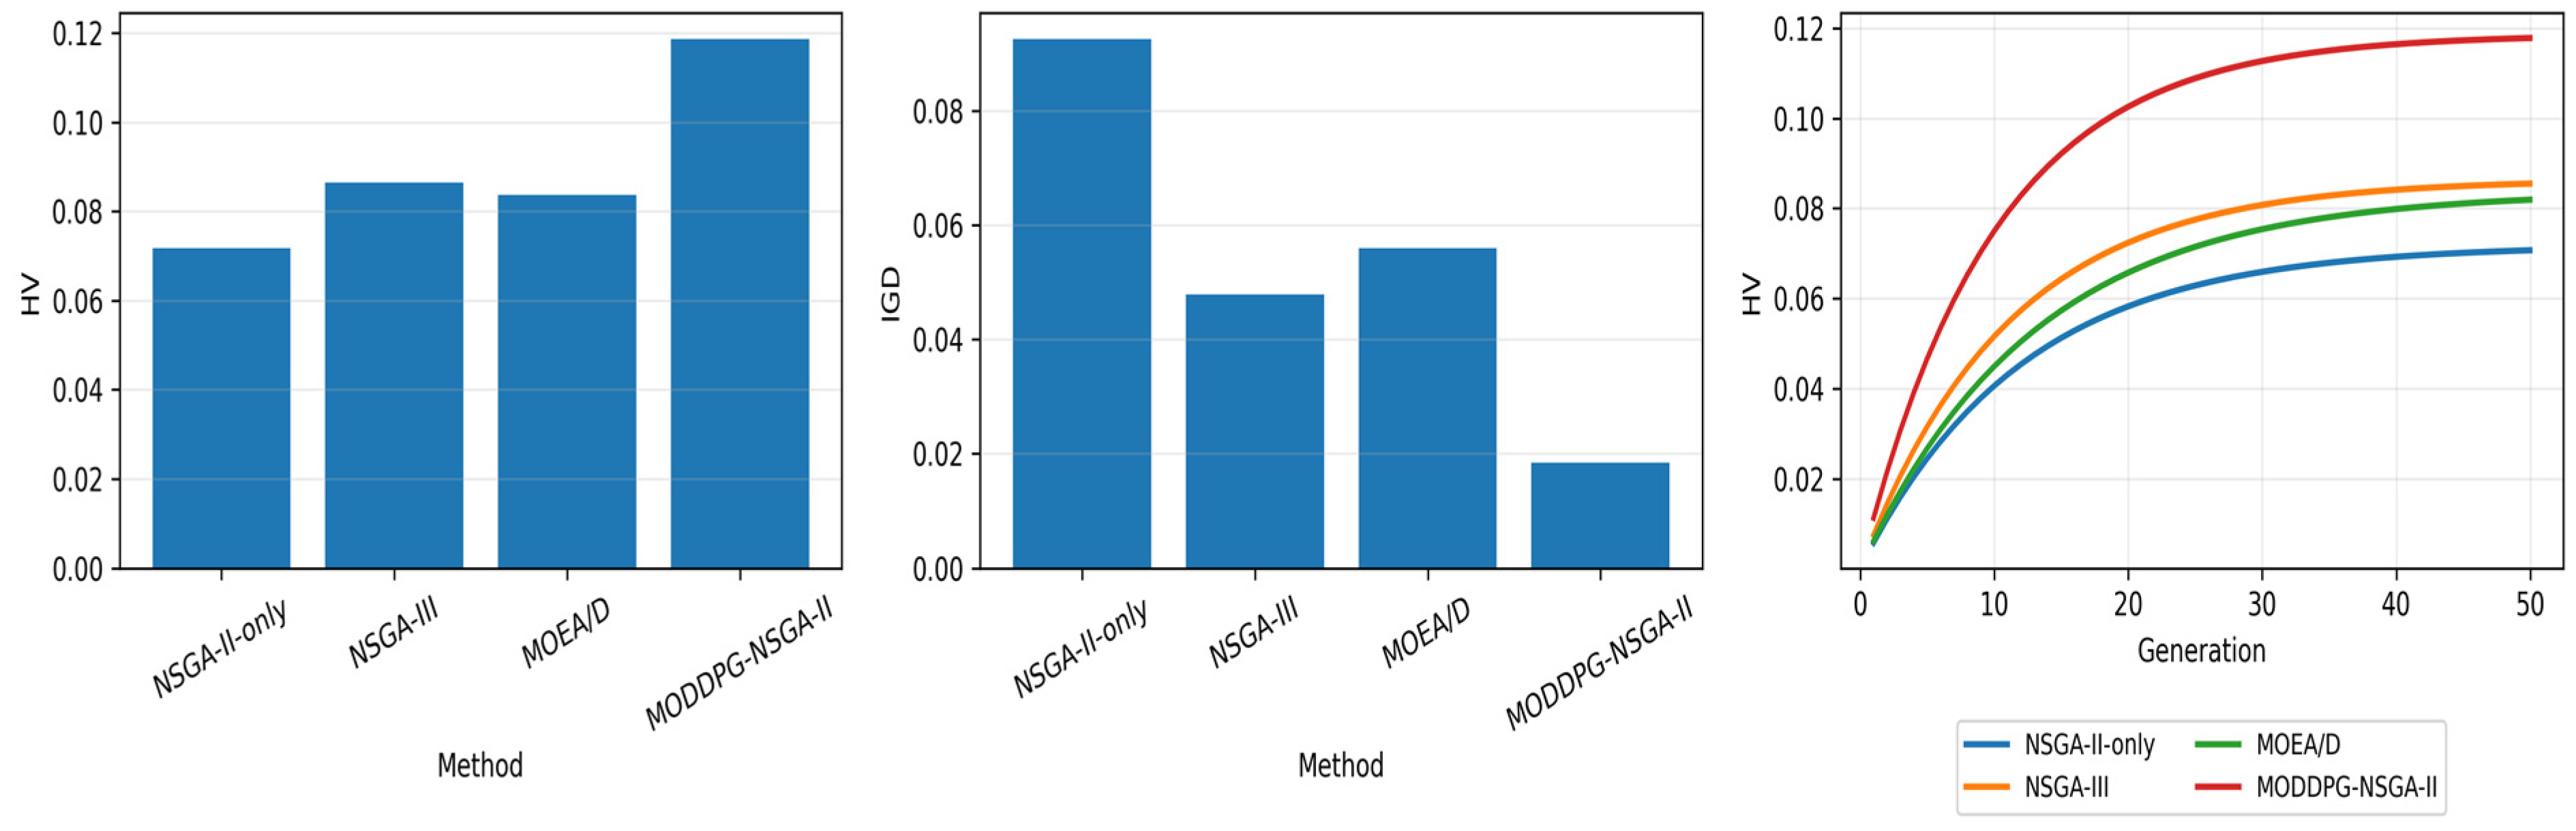
The Pareto-set quality indicators are summarized in Table 9, and the corresponding Pareto-set quality and HV convergence comparison is shown in Figure 12. The Pareto-set quality results show that the proposed method obtains the highest HV value and the lowest IGD and spacing values. This indicates that the proposed bi-level framework improves both convergence toward high-quality solutions and distribution uniformity. The final solution is selected from the feasible Pareto subset according to safety-first engineering preference rather than by abandoning Pareto optimality.
Figure 12.
Pareto-set quality and HV convergence comparison.
6.8. Robustness Under Stochastic Perturbations
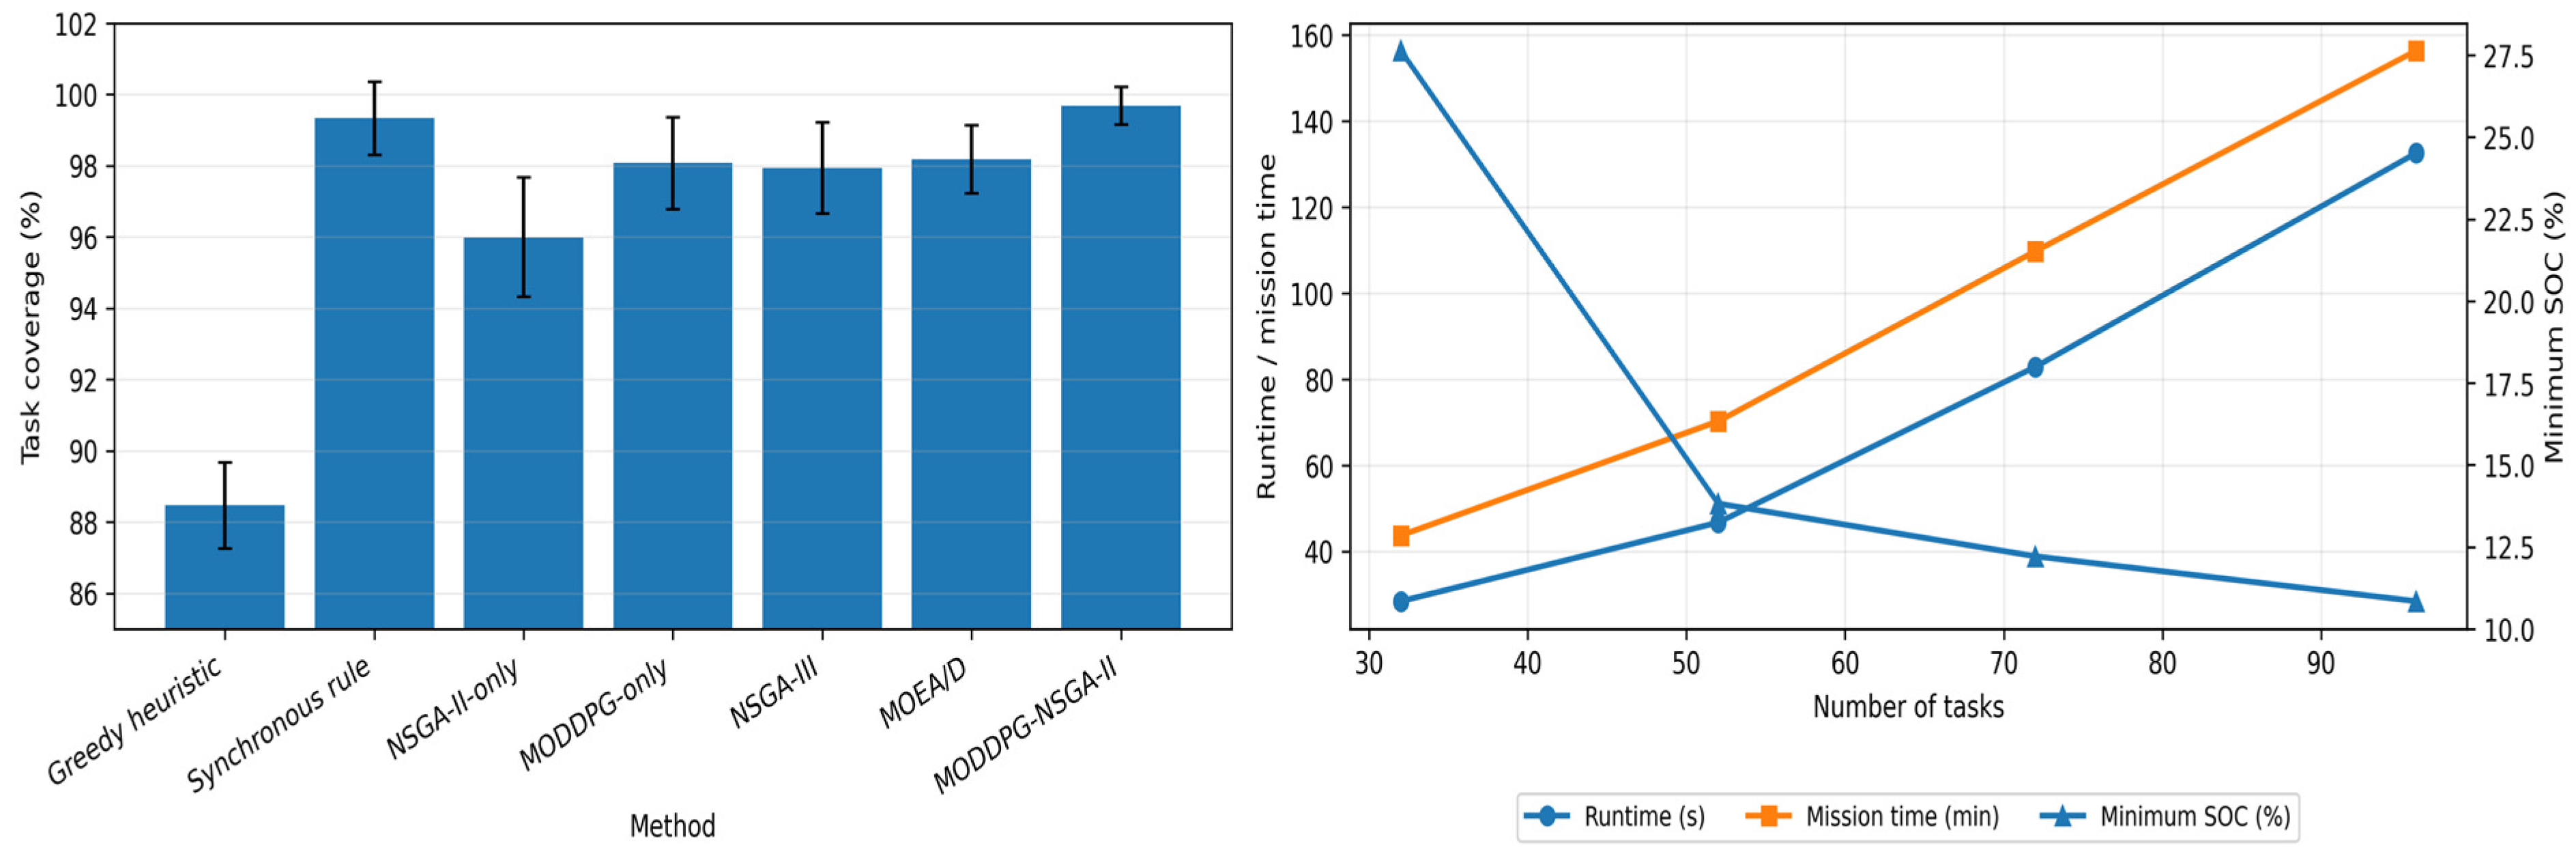
To approximate practical operational uncertainty and provide repeated-measure validation, stochastic perturbations are introduced into vehicle travel time, UAV energy consumption, local wind disturbance, communication delay, positioning error, and task-completion judgment. Each method is tested for 30 independent trials using different random seeds under the same task set, road network, parking-site configuration, UAV fleet, SOC threshold, and task-completion criteria. The results are reported in the form of mean ± standard deviation. The full-mission success rate is defined as the proportion of trials satisfying both task-coverage and SOC-safety requirements. Table 10 summarizes the robustness comparison results under stochastic perturbations, and Figure 13 further illustrates the robustness and scalability trends.
Table 10.
Robustness comparison under stochastic perturbations.
Figure 13.
Robustness and scalability results.
6.9. Statistical Significance Analysis
To further examine whether the performance differences among different methods are statistically significant, one-way ANOVA and pairwise Welch’s t-tests are conducted based on the 30 independent trials. The mission completion time is selected as the primary efficiency metric, while task coverage, minimum residual SOC, and load balance are used as auxiliary indicators. The significance level is set to 0.05. The one-way ANOVA results are summarized in Table 11, and the pairwise Welch’s t-test results for mission completion time are summarized in Table 12.
Table 11.
One-way ANOVA results based on 30 repeated trials.
Table 12.
Pairwise Welch’s t-test results for mission completion time.
6.10. Computational Efficiency, Scalability, and Validation Boundary
As the number of task points and the environment size increase, runtime and mission completion time both increase. The proposed method still maintains high task coverage in medium- and large-scale cases, but the SOC margin gradually decreases. Therefore, the robustness claim is interpreted within the tested simulation conditions rather than as unlimited scalability. Larger-scale field deployment should further incorporate distributed training, hierarchical task decomposition, adaptive parking-site selection, real meteorological data, and hardware-in-the-loop or physical flight validation. Table 13 summarizes the computational efficiency and scalability results under different task scales.
Table 13.
Computational efficiency and scalability results under different task scales.
7. Conclusions
This paper investigates the problem of weather-aware asynchronous vehicle–UAV cooperative scheduling for distribution network inspection under extreme weather conditions. By jointly considering wind field disturbance, UAV energy evolution, vehicle movement, cross-site recovery, task coverage, mission completion time, minimum residual SOC, and load balance, an asynchronous cooperative scheduling model and a bi-level MODDPG–NSGA-II optimization framework are developed. The main conclusions are as follows.
A weather-aware asynchronous vehicle–UAV cooperative scheduling model is established for distribution network inspection. Unlike conventional synchronous cooperation, in which the vehicle must wait for UAV same-site return before moving to the next parking site, the proposed model allows UAVs to be recovered at downstream parking sites when rendezvous and energy constraints are satisfied. The novelty of this study is not the general concept of asynchronous truck–drone cooperation but its integration with wind-aware energy feasibility, cross-site recovery, safety-constrained Pareto decision-making, and bi-level multi-objective policy learning for extreme-weather power inspection.
Controlled variable experiments improve the interpretability of the experimental results. Under the fixed 52-task condition, the proposed method maintains 100.00% task coverage as the reference wind speed increases from 0 m/s to 10 m/s. Meanwhile, the mission completion time increases from 40.97 min to 70.24 min, and the minimum residual SOC decreases from 50.32% to 13.82%. This result indicates that wind disturbance independently increases mission time and energy pressure, while the proposed method can still maintain task completeness and SOC safety within the tested wind range.
Ablation, sensitivity, and comparative experiments support the necessity of the proposed bi-level framework. Compared with greedy heuristic, synchronous rule, NSGA-II-only, MODDPG-only, NSGA-III, and MOEA/D, the proposed method achieves the best overall performance in the reference scenario, with 100.00% task coverage and the shortest mission time of 70.24 min. The reward-weight sensitivity results indicate that the main conclusion is stable within the tested preference range.
Repeated stochastic trials and statistical tests further support the effectiveness of the proposed method. Based on 30 independent trials, one-way ANOVA and pairwise Welch’s t-tests show that the proposed method achieves statistically significant reductions in mission completion time compared with representative baselines. These results provide more rigorous experimental evidence than single-run simulation results and improve the reliability of the performance interpretation.
It should be noted that the present study is still based on a simulation-level scheduling model. Real-world inspection may involve more complex factors, such as time-varying gusts, communication interruption, positioning errors, heterogeneous UAV payloads, battery aging, road accessibility changes, and emergency recovery requirements. Future work will further incorporate real meteorological data, hardware-in-the-loop validation, field-test verification, uncertainty-aware constrained reinforcement learning, and distributed multi-agent training to improve engineering applicability.
Author Contributions
Conceptualization, X.L., Y.Y. and J.Z.; methodology, X.L. and Y.Y.; software, X.L. and Y.Y.; validation, X.L., Y.Y. and Y.Z.; formal analysis, X.L. and K.W.; investigation, X.L., Y.Y. and Y.Z.; resources, J.Z. and F.M.; data curation, Y.Y. and K.W.; writing—original draft preparation, X.L.; writing—review and editing, Y.Y., J.Z. and F.M.; visualization, X.L. and Y.Z.; supervision, J.Z. and F.M.; project administration, J.Z.; funding acquisition, J.Z. All authors have read and agreed to the published version of the manuscript.
Funding
This research was funded by Science and Technology Project of Jiangsu Electric Power Company, grant number J2025048.
Institutional Review Board Statement
Not applicable.
Informed Consent Statement
Not applicable.
Data Availability Statement
The datasets used during the current study are available from the corresponding author upon reasonable request.
Conflicts of Interest
The authors declare that this study received funding from Science and Technology Project of Jiangsu Electric Power Company. The funder was not involved in the study design, collection, analysis, interpretation of data, the writing of this article or the decision to submit it for publication.
References
- Paul, S.; Poudyal, A.; Poudel, S.; Dubey, A.; Wang, Z. Resilience Assessment and Planning in Power Distribution Systems: Past and Future Considerations. Renew. Sustain. Energy Rev. 2024, 189, 113991. [Google Scholar] [CrossRef] [Scilit]
- Poudyal, A.; Poudel, S.; Dubey, A. Risk-Based Active Distribution System Planning for Resilience Against Extreme Weather Events. IEEE Trans. Sustain. Energy 2023, 14, 1178–1192. [Google Scholar] [CrossRef] [Scilit]
- Ghosh, P.; De, M. Resilience-Oriented Planning for Active Distribution Systems: A Probabilistic Approach Considering Regional Weather Profiles. Int. J. Electr. Power Energy Syst. 2024, 158, 109976. [Google Scholar] [CrossRef] [Scilit]
- Hou, H.; Tang, J.; Zhang, Z.; Wang, Z.; Wei, R.; Wang, L.; He, H.; Wu, X. Resilience Enhancement of Distribution Network under Typhoon Disaster Based on Two-Stage Stochastic Programming. Appl. Energy 2023, 338, 120892. [Google Scholar] [CrossRef] [Scilit]
- Mendu, B.; Mbuli, N. State-of-the-Art Review on the Application of Unmanned Aerial Vehicles (UAVs) in Power Line Inspections: Current Innovations, Trends, and Future Prospects. Drones 2025, 9, 265. [Google Scholar] [CrossRef] [Scilit]
- Guan, H.; Sun, X.; Su, Y.; Hu, T.; Wang, H.; Wang, H.; Peng, C.; Guo, Q. UAV-Lidar Aids Automatic Intelligent Powerline Inspection. Int. J. Electr. Power Energy Syst. 2021, 130, 106987. [Google Scholar] [CrossRef] [Scilit]
- Li, Z.; Zhang, Y.; Wu, H.; Suzuki, S.; Namiki, A.; Wang, W. Design and Application of a UAV Autonomous Inspection System for High-Voltage Power Transmission Lines. Remote Sens. 2023, 15, 865. [Google Scholar] [CrossRef] [Scilit]
- Tsellou, A.; Livanos, G.; Ramnalis, D.; Polychronos, V.; Plokamakis, G.; Zervakis, M.; Moirogiorgou, K. A UAV Intelligent System for Greek Power Lines Monitoring. Sensors 2023, 23, 8441. [Google Scholar] [CrossRef] [Scilit] [PubMed]
- Schofield, O.B.; Iversen, N.; Ebeid, E. Autonomous Power Line Detection and Tracking System Using UAVs. Microprocess. Microsyst. 2022, 94, 104609. [Google Scholar] [CrossRef] [Scilit]
- Diniz, L.F.; Pinto, M.F.; Melo, A.G.; Honório, L.M. Visual-Based Assistive Method for UAV Power Line Inspection and Landing. J. Intell. Robot. Syst. 2022, 106, 41. [Google Scholar] [CrossRef] [Scilit]
- Lyu, Z.; Gao, Y.; Chen, J.; Du, H.; Xu, J.; Huang, K.; Kim, D.I. Empowering Intelligent Low-Altitude Economy with Large AI Model Deployment. IEEE Wirel. Commun. 2026, 33, 64–72. [Google Scholar] [CrossRef] [Scilit]
- Li, D.; Wang, H.; Zhang, Y.; Wu, H.; Chen, Y.; Li, W. A Method for UAV Inspection Path Planning Based on Safety Distance in Substation. Sci. Rep. 2025, 15, 43688. [Google Scholar] [CrossRef] [Scilit]
- Debnath, D.; Vanegas, F.; Sandino, J.; Hawary, A.F.; Gonzalez, F. A Review of UAV Path-Planning Algorithms and Obstacle Avoidance Methods for Remote Sensing Applications. Remote Sens. 2024, 16, 4019. [Google Scholar] [CrossRef] [Scilit]
- Wu, T.; Zhang, Z.; Jing, F.; Gao, M. A Dynamic Path Planning Method for UAVs Based on Improved Informed-RRT* Fused Dynamic Windows. Drones 2024, 8, 539. [Google Scholar] [CrossRef] [Scilit]
- Dobrevski, M.; Skočaj, D. Dynamic Adaptive Dynamic Window Approach. IEEE Trans. Robot. 2024, 40, 3068–3081. [Google Scholar] [CrossRef] [Scilit]
- Yao, M.; Deng, H.; Feng, X.; Li, P.; Li, Y.; Liu, H. Improved Dynamic Windows Approach Based on Energy Consumption Management and Fuzzy Logic Control for Local Path Planning of Mobile Robots. Comput. Ind. Eng. 2024, 187, 109767. [Google Scholar] [CrossRef] [Scilit]
- Wang, E.; Meng, X.; Yu, J.; Wang, J.; Yin, L. An Unmanned Intelligent Inspection Technology Based on Improved Reinforcement Learning Algorithm for Power Large-Area Multi-Scene Inspection. Sci. Rep. 2025, 15, 24933. [Google Scholar] [CrossRef] [Scilit] [PubMed]
- Feiyu, Z.; Dayan, L.; Zhengxu, W.; Jianlin, M.; Niya, W. Autonomous Localized Path Planning Algorithm for UAVs Based on TD3 Strategy. Sci. Rep. 2024, 14, 763. [Google Scholar] [CrossRef] [Scilit]
- Dang, S.; Liu, Y.; Luo, Z.; Liu, Z.; Shi, J. A Survey of the Routing Problem for Cooperated Trucks and Drones. Drones 2024, 8, 550. [Google Scholar] [CrossRef] [Scilit]
- Wang, Y.; Wang, Z.; Hu, X.; Xue, G.; Guan, X. Truck–Drone Hybrid Routing Problem with Time-Dependent Road Travel Time. Transp. Res. Part C Emerg. Technol. 2022, 144, 103901. [Google Scholar] [CrossRef] [Scilit]
- Wang, Y.; Yang, S.; Wang, X.V.; Wang, L. Research on Truck-Drone Collaborative Route Planning for Rural Logistics Delivery Services. Sci. Rep. 2024, 14, 31815. [Google Scholar] [CrossRef] [Scilit]
- Xing, J.; Guo, T.; Tong, L.C. Reliable Truck-Drone Routing with Dynamic Synchronization: A High-Dimensional Network Programming Approach. Transp. Res. Part C Emerg. Technol. 2024, 165, 104698. [Google Scholar] [CrossRef] [Scilit]
- Duan, J.; Luo, H.; Wang, G. Approaches to the Truck-Drone Routing Problem: A Systematic Review. Swarm Evol. Comput. 2025, 92, 101825. [Google Scholar] [CrossRef] [Scilit]
- Cui, H.; Li, K.; Jia, S.; Meng, Q. Dynamic Collaborative Truck-Drone Delivery with En-Route Synchronization and Random Requests. Transp. Res. Part E Logist. Transp. Rev. 2024, 192, 103802. [Google Scholar] [CrossRef] [Scilit]
- He, C.; Ouyang, H.; Huang, W.; Li, S.; Zhang, C.; Ding, W.; Zhan, Z.-H. An Adaptive Heuristic Algorithm with a Collaborative Search Framework for Multi-UAV Inspection Planning. Appl. Soft Comput. 2025, 174, 112969. [Google Scholar] [CrossRef] [Scilit]
- Zhou, Y.; Kong, X.; Lin, K.-P.; Liu, L. Novel Task Decomposed Multi-Agent Twin Delayed Deep Deterministic Policy Gradient Algorithm for Multi-UAV Autonomous Path Planning. Knowl. Based Syst. 2024, 287, 111462. [Google Scholar] [CrossRef] [Scilit]

Disclaimer/Publisher’s Note: The statements, opinions and data contained in all publications are solely those of the individual author(s) and contributor(s) and not of MDPI and/or the editor(s). MDPI and/or the editor(s) disclaim responsibility for any injury to people or property resulting from any ideas, methods, instructions or products referred to in the content. |
© 2026 by the authors. Licensee MDPI, Basel, Switzerland. This article is an open access article distributed under the terms and conditions of the Creative Commons Attribution (CC BY) license.