


Abstract
Globalisation, accompanied by the rapid advancement of digital technologies, has become the bedrock of contemporary economies. However, the global digital divide has hindered many economies from enjoying the benefits of enhanced digitalisation. This study addresses the question: to what extent is there evidence of digital convergence or divergence among global economies, and what specific patterns of club clustering exist within the African continent? Employing a quantitative research design with secondary panel data from 123 countries (38 African), the study applies the Phillips and Sul convergence and club clustering algorithm to analyse digitalisation trends. The findings reveal that African countries exhibit significantly stronger within-club convergence dynamics than broader developing country groups, with Africa’s adjustment speed (σ = 2.5624) exceeding the Global South average (σ = 0.8394) by more than threefold. This indicates that African nations are following a similar ICT development trajectory and catching up with other global regions at an accelerated rate. However, the study identifies substantial digital inequality within Africa itself, as countries fail to converge to a single steady state, instead forming distinct convergence clubs. These results underscore that digitalisation follows a systematic and continuous process determined by both technological advancement and countries’ absorptive capacity to adopt these technologies.
1. Introduction
The impact of digitalisation, specifically information and communication technologies (ICTs), on shaping the process of globalisation is widely recognised. As a result, these technologies can no longer be viewed solely in terms of economic growth and poverty reduction, especially when ICT networks have been considered the key factor in the operations of most organisations [1,2,3]. There is an ongoing digital revolution globally; however, the pace of this revolution varies in many ways across global economies, with developing countries often falling behind [3,4,5,6]. According to Wellenius [7], the conditions under which telecommunication services are established and expanded in developing countries differ significantly from those experienced by developed countries. These conditions include among others technological, industrial, institutional, and educational factors.
The research of Nishijima et al. [4] adds cultural, demographic, and geographical factors to the list. Other empirical evidence cites infrastructural deficiencies, fiscal capacity, and economic performance as additional conditions that distinguish the telecommunication sector of developing countries from industrial ones [8,9,10]. Despite this, developing countries around the world continue to invest in the telecommunication sector to leapfrog the traditional stages of development. In Africa, as well as in many developing countries around the world, the telecommunication sector is undergoing significant transformation and development. This progress is largely attributed to de-monopolisation, deregulation, increased investment in the industry, and heightened competition in the sector [11,12,13].
However, many developing countries have yet to fully harness the potential of the ICT sector to promote social and economic development. This is largely due to disparities in affordability, accessibility, and the usage of ICT tools and services within countries and between countries and regions [11,14,15]. The issue of digital inequality as a barrier to the development of underdeveloped economies has been recognised in earlier studies [16,17,18]. In 2023, global digital proliferation demonstrated the widespread nature of this digital divide; The International Telecommunications Union (ITU) reported that, while over 5.4 billion people are now connected online, 2.6 billion individuals remain without internet access [19], accounting for roughly 33 per cent of the global population. Notably, internet access stands at 87% in the Americas and 91% in Europe, significantly higher than the global average of approximately 67%. In contrast, only 37% of individuals in Africa and 27% in low-income countries were reported to be using the internet [19], demonstrating significant global digital disparities.
This inherent digital inequality raises critical questions about convergence, the process by which developing economies might catch up with developed ones in terms of digitalisation [3]. While there is no firm line between developed and emerging economies, fundamental demographic, social, and economic factors differentiate regions like Africa, Asia, and Latin America from Europe, North America, and Oceania [7]. These profound differences lead to vastly diverse development goals, policies, and strategies globally. Despite this diversity, a common aspiration exists: to reduce poverty, improve living standards, mitigate inequality, and promote sustainable growth, peace, safety, and security. Global and regional policies, such as the UN 2030 Sustainable Development Agenda and Africa’s Agenda 2063, explicitly acknowledge the importance of ICTs in achieving these goals [20]. Developing countries are thus investing in ICT development and spread, driven by the convergence hypothesis, which posits that they can converge and reach the level of developed countries [11,21]. However, the specific patterns of this convergence, particularly for African economies, remain underexplored. This study, therefore, aims:
- To examine the convergence patterns of African economies.
- To compare the digital convergence patterns of Africa with the rest of the globe and identify whether the African region is catching up with other regions across the world.
- To conceptually outline the systematic process of digitalisation in Africa, comparing it with global patterns by examining technological adoption and investment strategies.
2. Review of the Related Literature
2.1. Early Empirical Evidence of Economic Convergence
The concept of convergence draws its theoretical underpinnings from the traditional Neoclassical growth model developed by Robert Solow, which is commonly used to model economic growth [22]. This theory focuses on a transitional growth path to a steady state. The concept of convergence has been utilised in the early literature to explain the convergence of per capita output and analyse the performance of long-term growth within and between countries. It is also used to determine whether there is a tendency for poorer economies or regions to grow faster than developed countries and regions and eventually reduce income disparities across countries [23,24,25,26,27]. The convergence literature has evolved to encompass diverse understandings and applications of the convergence concept [11]. Scholars have investigated different types of convergence, such as convergence within economies and across economies, club convergence, absolute convergence, and others using a wide range of methodologies including a formal and informal cross-sectional method, time series, panel data approach as well as distribution approach. The succeeding discussion will review the existing literature on the topic, starting with early studies up to more recent contemporary studies.
The foundational empirical work on convergence theory has demonstrated the practical application of Neoclassical growth principles in real-world contexts. The research conducted by Barro and Sala I-Martin [27] investigated the per capita income convergence between states in the United States, providing evidence that income convergence patterns could be observed within national boundaries. Their work was based on the traditional Neoclassical growth theory. The study argued that poorer economies tend to have high rates of return (in terms of diminishing returns to capital) leading to faster growth compared to rich economies. Utilising data from 1840 for personal income and from 1963 for gross product per state for empirical analysis, the findings of the study revealed evidence of convergence among the states, with poor economies experiencing faster growth in per capita terms than richer ones. The authors developed empirical models based on the principles of Neoclassical and endogenous models and were used to explain the gradual diffusion of technology across economies.
The convergence framework was subsequently extended to incorporate human capital and technological progress as critical drivers of economic development. Romer [25] developed a one-sector augmented Neoclassical model that considers knowledge, human capital, and technological progress to explain the disparities in per capita income between rich and poor countries. The model’s key insight was that human capital is a critical factor in technological change and the development of an economy. The empirical findings showed that countries that have high human capital levels tend to grow faster than those that do not, highlighting the importance of education and skill development in convergence processes.
2.2. Evolution in Technology Club Convergence
Building on the understanding of human capital and technological progress, the convergence literature has evolved to examine technology club formation; [28] investigated the existence of what they termed “technology clubs” in the global economy. Technology clubs are defined as a group of economies that share similar technological capabilities and innovation patterns [28]. This concept represents a significant advancement from simple bilateral convergence to club convergence theory, in which countries may not converge to a single global steady state but rather form distinct clusters based on their technological characteristics.
The authors analysed the potential implications of technology clubs for international trade and economic development using a non-parametric technique, the diffused convergence method. They examined technological progress at two points in time, the beginning and the end of the 1990s, across 131 countries. The study reported evidence of technological clubs in the global economy, with countries clustering into groups based on their technological capabilities. The findings revealed that intra-club technology spillovers occur more readily than inter-club transfers, as countries within the same technology club tend to engage in similar trading patterns and innovations. These results conformed with the early literature presented by [29,30,31,32].
The convergence framework was subsequently applied to analyse digital divide patterns across countries, representing a natural extension of technology club concepts to ICT infrastructure and adoption. The most renowned work on this topic is that of [18], which investigates the digital divide across 108 countries, examines contributing factors, and assesses whether there is convergence in digital divide levels among sampled countries. Unlike earlier studies that relied on simple convergence tests, Park et al. [18] utilised Phillips and Sul’s club convergence model to analyse the digital divide across countries. This methodological advancement allowed the identification of convergence clubs without requiring a priori knowledge of group membership. The empirical model includes variables such as GDP per capita, human capital, infrastructure and regulation.
The empirical findings indicated evidence of club convergence among countries, suggesting that countries with similar levels of development tend to have similar levels of digital divide. The study also identified human capital (proxied by education) and regulation (government policies) as significant determinants of digital divide patterns across the sampled countries. However, the study’s scope was limited, as it neglected other economic, social, and political factors that may influence the level of digital divide and could have included more variables related to ICT access and usage to provide a more comprehensive analysis.
2.3. Comprehensive ICT Convergence Analysis
The convergence analysis framework was further refined to examine multidimensional ICT development patterns. Research conducted by Rath [14] builds on the work of Park et al. [18] by investigating the convergence of ICT across 47 countries, including developed and developing countries. The study employed panel data using annual data spanning 2000 to 2012. The study constructed a composite ICT index using principal component analysis. The index incorporated four ICT indicators: telephone landlines, mobile cellular phones, fixed broadband internet subscribers, and internet subscribers. The empirical findings of the study revealed divergence in ICT development, with the divergence attributed to geographical factors (rural vs. urban) and demographic factors (population). Importantly, the study reported that ICT divergence is higher in developing countries than in developed countries, suggesting that the development level influences convergence speed and that geographic characteristics play crucial roles in determining digital technology adoption patterns.
In the contemporary literature, the understanding of global ICT convergence patterns has been significantly advanced through sophisticated club clustering methodologies. The paper by Saba and David [11] builds on earlier research and addresses limitations in previous studies by focusing on convergence patterns in global information and communication technologies (ICTs) and utilising the club clustering algorithm developed by Phillips and Sul [33,34]. The study identifies convergence patterns in global ICT development and determines which countries form clusters based on levels of ICT adoption and penetration. The study reports that distinct convergence clubs exist in global ICT development, with countries clustering by ICT adoption levels. Interestingly, the study finds that income-based classifications (developed vs. developing) do not accurately capture convergence patterns in ICT development, suggesting that digital convergence follows different dynamics than traditional economic convergence and that other factors beyond income levels drive ICT adoption clustering.
2.4. Research Gap and Study Justification
While the existing literature has established comprehensive frameworks for understanding digital convergence, it predominantly relies on aggregate ICT indices or broad digital divide indicators, neglecting technology-specific convergence patterns. This study addresses this limitation by disaggregating convergence trajectories across fixed telephone lines, internet access, and mobile cellular phones, thereby identifying which specific technologies drive overall convergence. This is important because understanding these technology-specific dynamics is crucial for designing targeted policy interventions, as strategies for expanding broadband infrastructure differ fundamentally from those supporting mobile penetration or maintaining fixed-line networks in underserved areas.
Furthermore, the literature offers limited insights into the temporal dynamics of digital convergence, especially the speed at which countries close digital gaps relative to their economic capabilities and investment capacities. Existing convergence analyses identify whether countries are catching up but do not unpack the country-specific drivers behind these trajectories. To fill this gap, this study employs a methodological pairing of Phillips–Sul club convergence analysis with Random Forest Machine Learning. This integrated approach not only characterises convergence patterns but also uncovers the heterogeneous, country-specific factors influencing digital progress. By doing so, the study provides a comprehensive empirical framework for understanding not just whether Africa is catching up digitally, but how and through what mechanisms, thereby offering actionable insights for policymakers seeking to foster inclusive digital growth.
3. Materials and Methods
3.1. Data and Research Design
To capture the transition and convergence patterns of global economies, this study utilises secondary panel data from 123 countries observed between 1990 and 2023. The selection criteria for this study were solely based on data availability. However, this study carefully included a balanced set of countries to represent all regions, ensuring that the findings are reliable and unbiased. This study adopted a secondary quantitative research approach to examine convergence patterns across global economies, with a focus on African economies. The rationale for considering global economies, whilst the focus is on Africa, was so that the results could provide meaningful insights through inter-comparisons. All data used in this study were extracted from the World Bank’s World Development Indicators (WDI) database, which serves as the primary data source for this research. The analysis of the study is conducted in R using multiple libraries.
3.2. Methodology
This research paper builds on the empirical evidence presented in earlier studies [11,14,18,21,22]. This study employs models developed by Phillips and Sul [33,34] to analyse the transition patterns and curves within the panel series, across subgroups, and among various clubs. This study contributes to the literature by employing the Random Forest and XGBoost models to forecast when the convergence gap will close, based on the current trajectory.
3.3. Measuring Digitalisation
This study employs principal component analysis (PCA) to construct a composite index from indicators representing ICT use, access, and skills. The index is a latent variable that will capture all dimensions of digitalisation. PCA is a technique for transforming a set of high-dimensional indicators into a single benchmark that captures and presents information in a different dimension [35]. This technique is considered a better approach than modelling each indicator separately [36]. It has been used in earlier studies [9,11,12,36,37,38,39]. The digitalisation index is constructed by using the first eigenvectors from the principal components as the required weights; thus, the following linear combination exists:
In the equation, DigiX is a composite index that measures digitalisation; ∅1, ∅2 and ∅3, represent the eigenvectors derived from the principal components, and X1, X2 and X3 denote the indicators selected to form the composite index. Substituting the indicators into Equation (1), Equation (2) is presented as:
In Equation (2), fixedteline represents fixed telephone line subscription per 100 people, mobilephone denotes mobile cellular phone subscription per 100 people, and internetaccess indicates the percentage of households with access to the internet.
3.4. Constructing the Digitalisation Index
As previously mentioned, principal component analysis (PCA) is performed to determine the weights for the composite index. The results are shown in Table 1 and reveal that the digitalisation index is computed using fixed telephone lines, mobile phones, and internet access. The first principal component (PC1) explains approximately 66.85% of the variance, as indicated by the eigenvalue of 2.005479. The second component (PC2) accounts for 26.64%, shown by the eigenvalue of 0.799262, and cumulatively captures 93.49% of the variance. The final component (PC3) accounts for 6.51%, falling below the eigenvalue threshold. Only PC1 was retained for the digitalisation index based on Kaiser’s criterion (eigenvalue > 1) and interpretability considerations. Kaiser’s criterion is a widely accepted standard in PCA applications, ensuring that retained components explain more variance than any single original variable. Moreover, PC1’s loadings reveal that PC1 reflects a broad telecommunications dimension, with balanced contributions from all the variables (fixed: 0.41, mobile: 0.64, internet: 0.65), making it an interpretable composite measure of overall digital infrastructure development. In contrast, PC2 captures orthogonal variation reflecting legacy-to-modern infrastructure substitution rather than digitalisation level per se, making it unsuitable for a composite development index. Thus, retaining only PC1 provides a parsimonious, interpretable measure that captures countries’ overall digital infrastructure capacity without confounding development levels with technological transition patterns. The correlation matrix supports these findings, with a strong correlation observed between mobile phones and internet access (0.803) and weaker links involving fixed telephone lines, confirming that PC1 primarily reflects modern digital infrastructure co-development while PC2 isolates the legacy infrastructure dimension.
Table 1.
Principal component results for the digitalisation index.
3.5. Modelling Digital Convergence
The club convergence hypothesis states that convergence can only be realised across groups of countries that share some common characteristics. To test for convergence as a whole following the construction of the digitalisation index, to separate standard idiosyncratic components, the panel data is decomposed in the following fashion:
In Equation (3) denotes the digitalisation index, represents a time-varying idiosyncratic element and denotes a single common component that captures the stochastic trend; using Phillips and Sul’s [33] technique to test for statistical convergence, the model assumes the general form for the idiosyncratic element as:
In Equation (4) ~iid (0.1) across each cross-section unit, denotes the slow varying function, and represents the speed of convergence. Following Phillips and Sul’s [33] principle, a relative transition parameter is introduced because this model cannot be estimated directly. Therefore, the following model is presented as:
The loading coefficient is measured relative to the panel average at time t. This transition parameter draws a transition path of each individual cross-sectional unit in relation to the panel average. The transition path helps to obtain the cross-sectional variance of stated as:
The Phillips–Sul log t-test is grounded on the notion that if → δ as t → ∞, then → 1, and at the same time → 0, which ensures convergence.
On the backdrop of this theoretical foundation, the study formulates the null hypothesis of convergence: .
The null hypothesis is stated against the alternative hypothesis that: .
The hypothesis will be tested using the following regression:
For t = [rT], [rT] + 1,….T with r > 0.
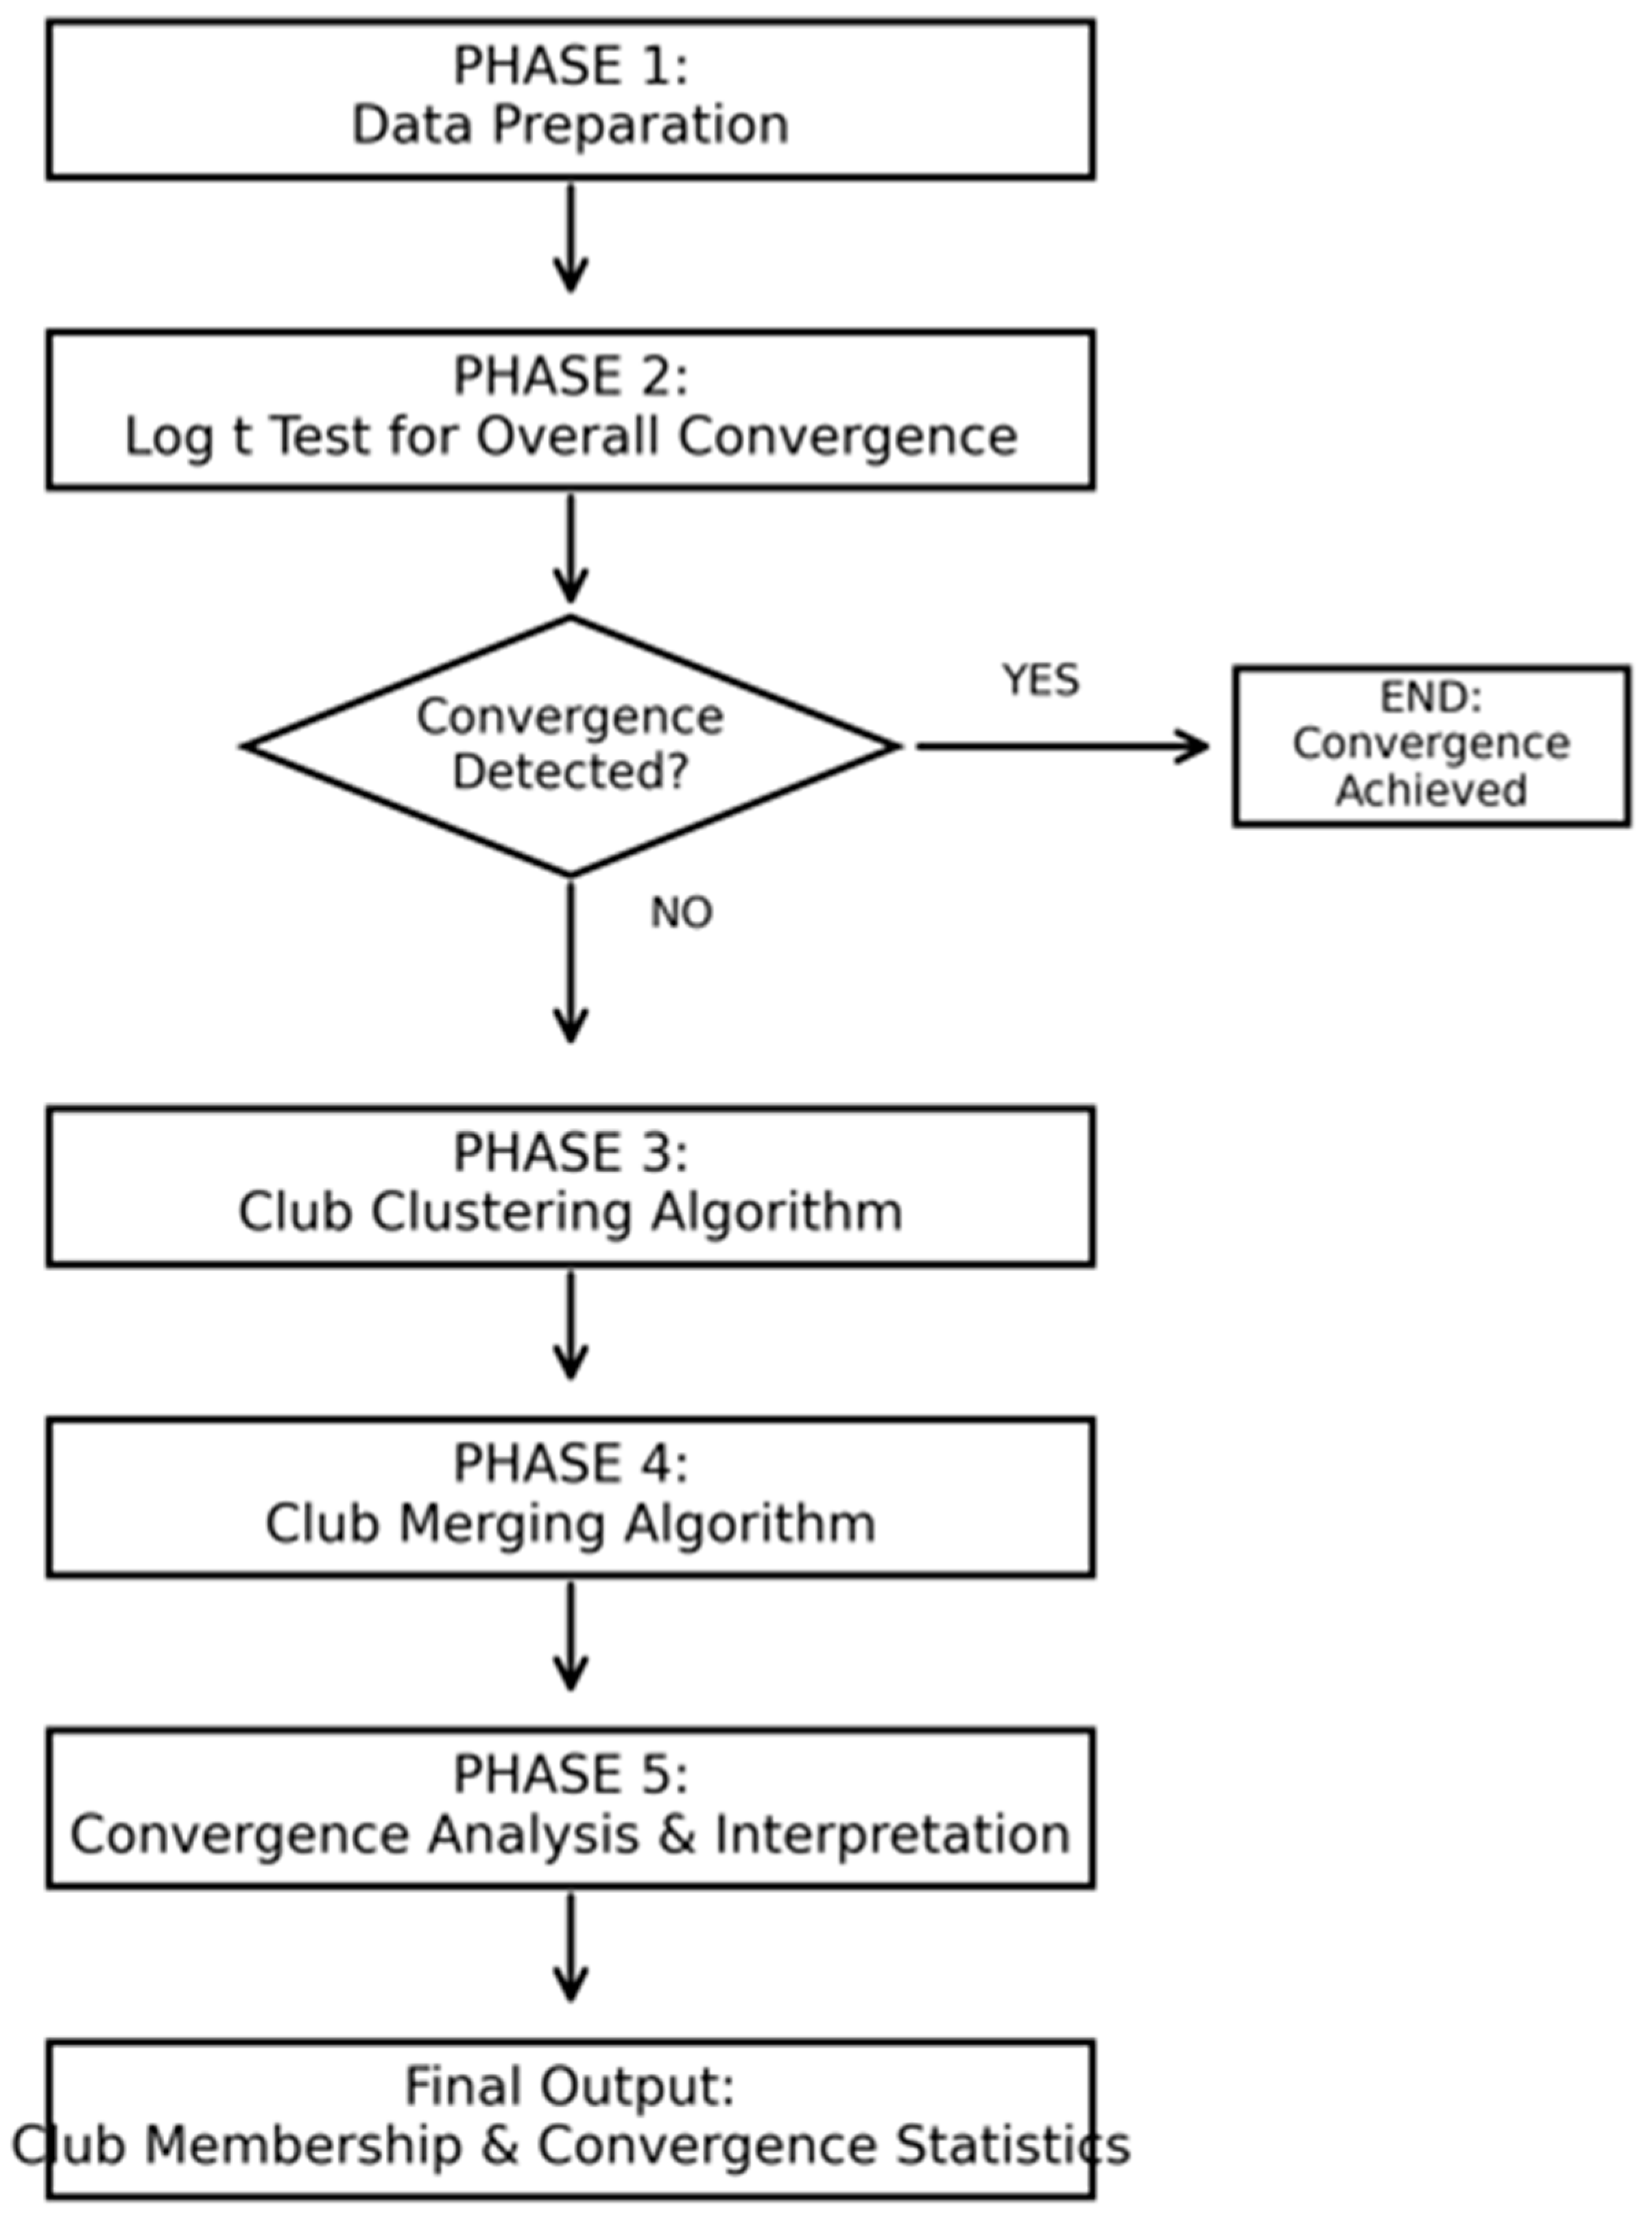
According to the Phillips–Sul rule, b = 2a, and r denotes the fraction of the sample that must be discarded for the regression analysis. The result of this regression is sensitive to the sample fraction r. The Monte Carlo experiments indicate that r ϵ [0.2, 0.3] achieves a satisfactory performance. Specifically, it is suggested to set r to 0.3 for the small or moderate T (≥50) sample and to 0.2 for the large T (≥100) sample. Under convergence, the right-hand side of the above equation goes to ∞; this allows this study to transform the testing of the null hypothesis of convergence and testing the equation as : b ≥ 0 against : b < 0. If the study rejects the overall convergence of the panels in testing Equation (3), it will conduct subgroup convergence tests. According to Phillips and Sul [33], the procedure for clubbing starts by ordering the members by the last observation and identifying the core group of members that maximise the t-statistic of the log-t regression. Once the core group is identified, non-core members are added one at a time to the core group until the study rejects the null hypothesis based on the t-statistic. After detecting the first subgroup members, the procedure is repeated for another subgroup.
The convergence hypothesis is tested at two levels: within-club convergence (whether countries in the same club move toward a common steady state among club members), and the global convergence (whether all countries, regardless of club membership, move toward a single worldwide steady state). Rejection of global convergence alongside acceptance of within-club convergence indicates that, while countries follow similar transition paths within their groups, structural differences prevent them from reaching the same global equilibrium.
3.6. Determining the Key Driver of Africa’s Digital Diffusion with Machine Learning Models
Machine Learning approaches emerged and gained prominence in economic applications because of their ability to handle complex data structures and present superior predictive performance [40]. For instance, Random Forest models are ensemble methods that combine multiple decision trees using a technique known as bootstrap aggregating (bagging), which offers several advantages in economic modelling [40]. Critically, Random Forest improves upon traditional econometric forecasting by relaxing restrictive parametric assumptions [40]. While linear regression models require researchers to pre-specify functional forms and lag structures, Random Forest “learns” these relationships directly from the data through recursive partitioning. This is valuable in contexts where relationships may be non-monotonic or exhibit complex relationships that would require extensive specification testing in traditional frameworks [41]. Kyriazos and Poga [41] and Du et al. [42] demonstrate that Machine Learning approaches can capture nonlinear relationships and interactions without explicit specification, unlike traditional econometric models. Moreover, Random Forest’s variable importance metrics identify predictive drivers based on actual contribution to model accuracy rather than statistical significance [42], which can be misleading in small samples. In addition, these models can effectively handle missing values and provide measures of variable importance that can guide economic interpretation. Concerns of overfitting overshadow the superior predictive performance of these models [43]. However, techniques such as the bagging mechanism help to reduce overfitting while maintaining flexibility, thus making models such as Random Forest suitable for economic datasets with complex underlying relationships.
To identify which technology has been driving Africa’s digital diffusion process, the study employs the Random Forest model. This is because the Random Forest model allows for multiple trees and produces multiple outcomes to improve the accuracy of the predicted outcomes [44]. It is important to note that one of the most important requirements for a successful Random Forest is that the trees should not be correlated, so that no single strong predictor weighs heavily on the outcome [44]. The key hyperparameters include the number of trees (optimised through out-of-bag error minimisation), the number of variables randomly sampled at each split (often for regression), and the minimum node size [44]. The Random Feature selection process is systematically evaluated by comparing the model performance across different feature subset sizes and selection strategies. In this study, variable importance is assessed using the Mean Decrease in Impurity, which provides insights into which growth determinants contribute to predictive accuracy. To conduct the Random Forest model, this study adopts the formula by [45], which models Random Forest in the following fashion:
where denotes the expected value and indicates the observed values, and m represents the number of trees.
To identify the key drivers of Africa’s digitalisation across the three digital infrastructure dimensions—fixed telephone lines, mobile cellular phone networks, and internet access—the model was trained with 500 trees using an 80/20 train–test split (seed = 123 for reproducibility) and importance = TRUE to calculate variable importance metrics. Model validity was confirmed through out-of-bag (OOB) error, providing internal cross-validation across 500 bootstrap samples, alongside test set R2 and root mean squared error (RMSE), which collectively confirm that the model captures meaningful relationships rather than noise. The variable importance rankings are determined using two complementary metrics: (1) permutation importance (%IncMSE), which measures the increase in mean squared error when a variable is randomly permuted, indicating how much prediction accuracy deteriorates when that variable is excluded, and (2) Gini importance (IncNodePurity), which measures the total decrease in node impurity (residual sum of squares) from splits on that variable, averaged across all trees. Variables with both high %IncMSE and high IncNodePurity are considered primary drivers of digitalisation, as they demonstrate strong predictive contribution and substantial explanatory power in partitioning countries into distinct digital development outcomes.
3.7. Analysis Procedure
The technology indicators selected represent legacy and contemporary technologies, allowing for a comprehensive analysis of global and regional technology and digital advancement. The variables and their brief definitions are presented in Table 2.
Table 2.
Variable definition.
The study employed R software (version 2025.09.02 Build 418) to conduct digital convergence analysis. Various libraries, including the tidyverse, missMDA, and FactorMineR, were utilised. Libraries such as ggplot2 and reshape were used for data visualisation, and the Random Forest package was used to conduct the Random Forest model variable importance feature to identify which technology is driving Africa’s digital diffusion process. To handle missing data, the study employed a conservative approach to preserve time series integrity while maximising sample coverage. Countries with more than five missing data points were excluded to avoid excessive reliance on imputations. For countries with 2–5, linear interpolation was implemented using Excel’s TREND function, a technique that fits a least-squares regression line through available temporal observations and estimates missing values based on a linear trend. The formula TREND (known_ys, known_xs, new_xs) was applied, where known_y represents observed ICT values in adjacent years, known_x represents corresponding time points, and new_x represents years requiring imputation. This approach is appropriate for ICT indicators because digital infrastructure often exhibits smooth, monotonic growth patterns within short time windows. For missing observations at temporal endpoints (first or last years), backward interpolation was employed, extending the nearest available trend to fill edge cases. This combination of forward (TRENDS-based) and backward interpolation ensures temporal consistency without introducing artificial volatility. The applied approach to handling missing data yields a sample of 123 countries, of which 38 are in Africa; see the Appendix A for the complete list of sampled countries.
In terms of standardisation, all variables were standardised to ensure comparability across different measurement scales. Standardisation was performed using z-score normalisation: z = (x − μ)/σ, where x represents the raw value, μ is the variable mean, and σ is the standard deviation. This transformation ensures that variables measured in different scales contribute equally to the composite index and the convergence test. Standardising variables was important for PCA because the method is scale-sensitive; variables with larger variance would otherwise dominate the principal components regardless of their substantive importance. All standardisation was conducted using R’s scale function within the tidyverse framework to maintain consistency across analytical stages.
4. Results
The primary aim of this research is to investigate digitalisation trends and patterns in global economies, with a specific focus on the African perspective. The study aims to identify which digitalisation indicators are driving digitalisation in the region and to determine the convergence and divergence patterns not only within African economies but also across regional blocs worldwide. This approach provides a deeper insight into whether African economies are catching up with the rest of the world, as suggested by macroeconomic theories and empirical evidence [9,11,23,46].
4.1. Digitalisation Trends Sorted According to Convergence Clubs
Table 3 presents the results of the Phillips and Sul [33] club clustering techniques for all sampled countries and their respective regions. The results from the club clustering technique revealed that countries belong in Club 1 across all regions, including the full panel sample. Thus, the club merging algorithm was not conducted. For the full panel sample, the study failed to reject the null hypothesis of convergence () as the computed t-statistic (1.9549) exceeds the critical value of −1.65. This indicates that countries in Club 1 are converging toward a common steady state in the digitalisation process. Furthermore, the positive speed of adjustment ( = 3.2403/2 = 1.6202) confirms strong convergence dynamics among the 123 countries in the sample. For the African region, the study similarly failed to reject the null hypothesis of convergence, as the estimated t-statistic (25.8685) substantially exceeds −1.65 at the 5 per cent significance level. The highly positive convergence coefficient ( = 5.1248) and resulting speed of adjustment ( = 2.5624) indicate robust convergence patterns among African countries in Club 1, suggesting rapid catching-up dynamics in digitalisation diffusion across the continent. The positive β coefficient is confirmation that convergence is occurring. The coefficient = 2.5624 suggests that the dispersion in digitalisation levels among African countries decreases by 2.56 units for every unit increase in log(time). Economically, this means that countries that started with lower digitalisation levels are catching up to the regional average at a rate three times faster than the Global South region (0.8394). This rapid adjustment reflects the structural coupling within the African club, where countries face similar digitalisation trajectories and benefit from regional spillovers. However, it is important to note that this convergence is toward a club-specific steady state rather than the global frontier, meaning African countries are catching up with each other faster than the broader Global South converges, but remain structurally distinct from advanced economies. For other regions, the convergence test results show mixed patterns. The Arab region (t-stat = 1.1522 > −1.65) and Latin America (t-stat = 1.4741 > −1.65) both exhibit convergence with positive adjustment speeds. The Asia and Pacific region (t-stat = 0.8120 > −1.65) and the Global South economies (t-stat = 0.7336 > −1.65) demonstrate convergence, albeit with slower adjustment speeds, as indicated by smaller positive coefficients. The European region shows robust convergence (t-stat = 4.9811 > −1.65) with a high adjustment speed ( = 2.7302), suggesting rapid alignment in digitalisation levels among European countries.
Table 3.
Global digitalisation convergence clubs.
4.2. Internet Access Convergence
The results of Phillips and Sul’s club convergence, as presented in Table 4, revealed that countries in the sample belong to a single club, irrespective of their regional bloc or categorisation. Thus, the study did not implement the club-merging algorithm. The study failed to reject the null hypothesis of convergence for countries in the full sample, as the calculated t-statistic (18.8056) exceeds the critical value of −1.65 at the 5 per cent level of significance. Similarly, the null hypothesis was not rejected for all other regions and categories: Africa (15.1612 > −1.65), the Arab region (41.5793 > −1.65), Asia and Pacific (107.9962 > −1.65), Latin America (18.8056 > −1.65), Global South economies (58.4722 > −1.65), and Europe (20.9948 > −1.65). The failure to reject the null hypothesis implies that countries are converging toward the same steady state with respect to internet access. Moreover, the study confirms strong convergence across all regions, including the full panel sample, as evidenced by positive adjustment speeds () in all categories, ranging from 0.8489 (Latin America) to 1.7071 (Europe).
Table 4.
Internet access convergence.
4.3. Mobile Cellular Phone Convergence
The results show that only countries in the Latin America region fail to demonstrate convergence in mobile cellular phone subscriptions per 100 people. The study rejected the null hypothesis for Latin America, as the t-statistic (−0.5414) is greater than −1.65, indicating divergence. However, the negative but small convergence coefficient ( = −0.0424) suggests a very weak divergence pattern, indicating near-stability rather than strong divergence dynamics. Conversely, the study failed to reject the null hypothesis of convergence across all other regions and categories, as the estimated t-statistics exceed −1.65: Africa (39.8207 > −1.65), the Arab region (5.7962 > −1.65), Asia and Pacific (27.9182 > −1.65), Europe (9.7273 > −1.65), Global South economies (33.0077 > −1.65), and the global sample (29.9126 > −1.65). The positive convergence coefficients (σ) across these regions indicate strong convergence speeds, with Africa showing particularly robust convergence dynamics (= 0.6159). These findings, presented in Table 5, suggest that mobile cellular adoption is converging across most global regions, with countries increasingly exhibiting similar penetration rates.
Table 5.
Mobile cellular phone convergence.
4.4. Fixed Telephone Lines Convergence
For the global sample, the study rejected the null hypothesis of convergence, as the estimated t-statistic (−13.0066) is less than −1.65. This rejection implies that countries do not converge to the same steady state in the adoption of fixed telephone lines. The negative convergence coefficient (= −0.5752) and resulting adjustment speed ( = −0.2876) indicate divergence, with countries moving away from a common steady state in fixed-line telephony. For the African region, despite forming a single club, the results indicate rejection of the null hypothesis (t-stat = −31.5571 < −1.65), indicating that countries in the region do not converge to the same steady state. The African region exhibits a strong divergence pattern with a negative adjustment speed ( = −0.6031), suggesting countries are moving apart in their fixed-line adoption patterns. For other regions, the null hypothesis was rejected across Asia and Pacific (t-stat = −21.3553 < −1.65), Latin America (t-stat = −9.8106 < −1.65), Global South economies (t-stat = −20.6396 < −1.65), and Europe (t-stat = −10.9946 < −1.65), all indicating divergence with negative adjustment speeds. The widespread divergence in fixed telephone line adoption is not counterintuitive, as countries across the globe increasingly consider fixed telephone lines a legacy technology, with policy and investment focus shifting toward mobile and internet-based digital infrastructure. Table 6 below shows the fixed telephone line convergence. The significance of this divergence will become clearer in Section 4.8, where the Random Forest analysis reveals that fixed telephone infrastructure is simultaneously the primary driver of Africa’s digital diffusion. The proposed systematic digitalisation framework presented in Section 5 attempts to resolve this tension.
Table 6.
Fixed telephone line convergence.
4.5. Robustness Check
This study conducted a robustness check of Africa’s digitalisation convergence. For this analysis, the digitalisation index (DIGIX2) is computed using three telecommunication indicators: fixed broadband, mobile cellular phone, and internet access. As with the first DIGIX computation, the PCA technique is used to compute the second digitalisation index. The results of the PCA are presented in Table 7.
Table 7.
DIGIX2 PCA results.
The newly computed digitalisation index is tested for convergence using the Phillips–Sul club clustering algorithm. The results are presented in Table 8 and show that countries belong to a single club; the study failed to reject the null hypothesis because the computed t-statistic (4.1644) is significantly greater than the critical value (1.65) at 5 per cent. These findings confirm the results presented in Table 3. These results collectively indicate that Africa is experiencing digital convergence and is following the global digital trajectory. However, it is critical to note that the region still experiences some form of digital inequality, with countries not on the same pace in terms of technological advancement and or development.
Table 8.
Africa digital convergence (DIGIX2).
4.6. Global Digital Convergence
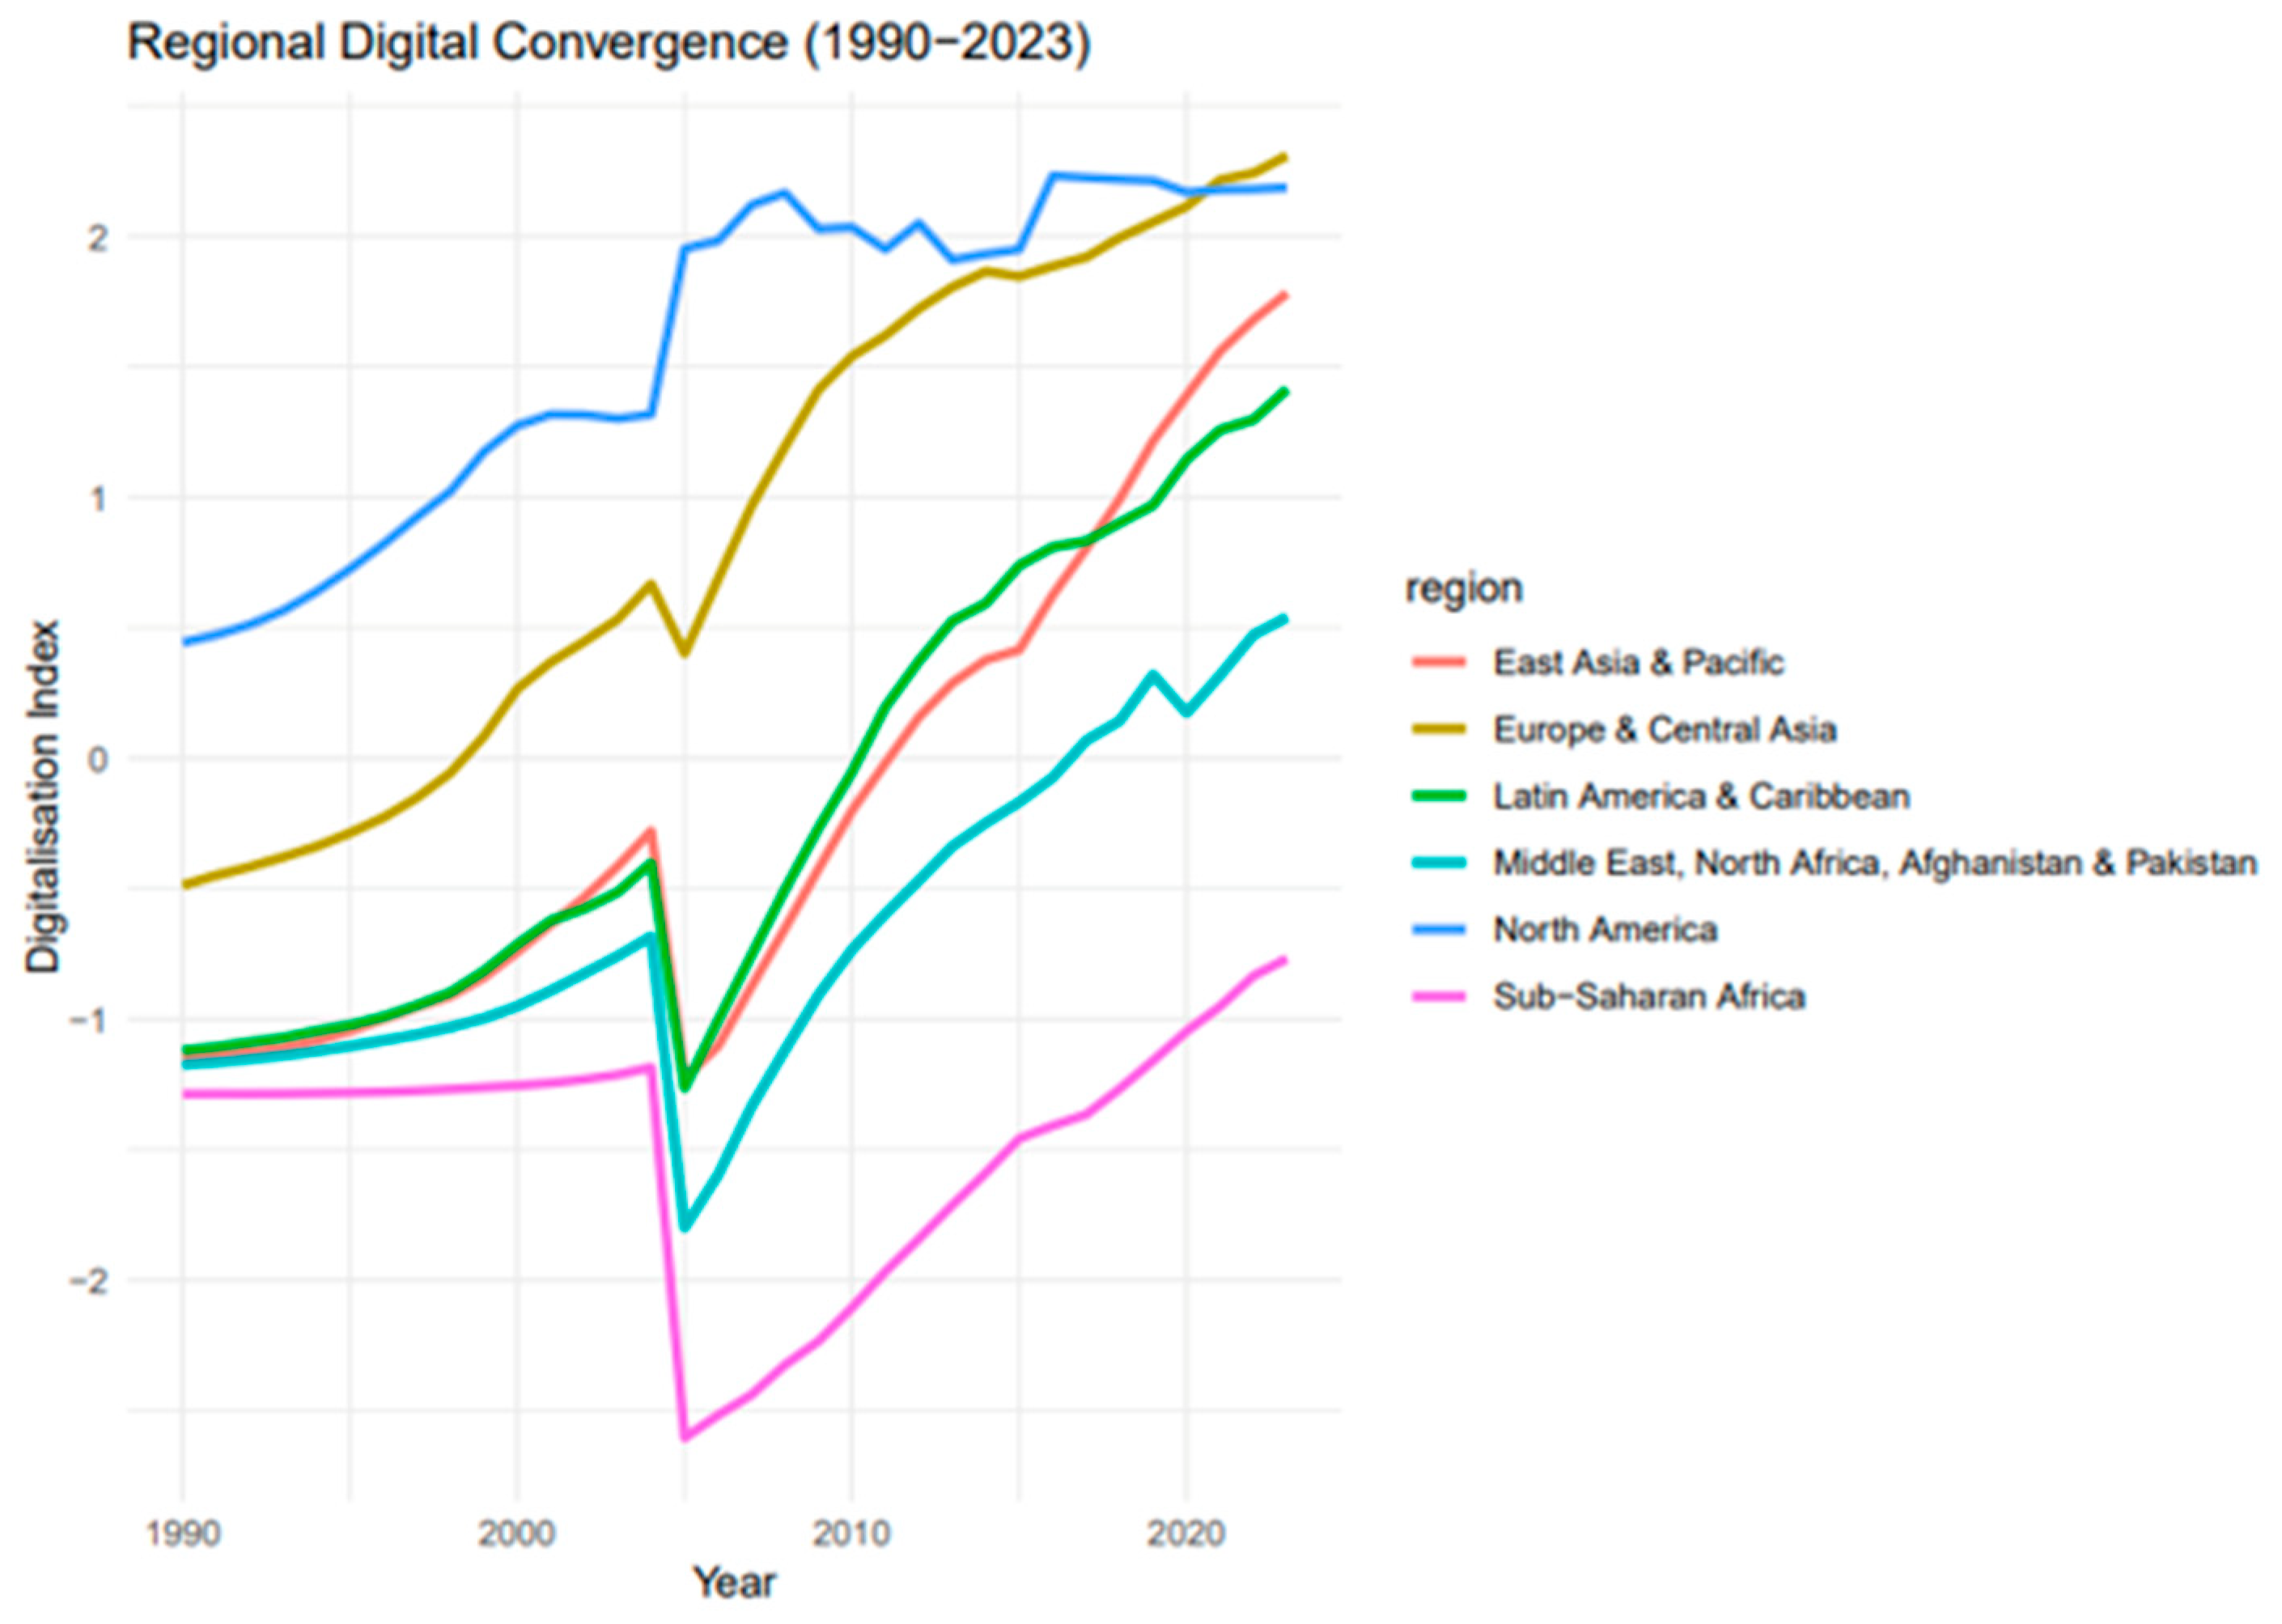
The visual presented in Figure 1 shows that the African region, particularly Sub-Saharan Africa, is narrowing the digitalisation diffusion gap relative to other global regions. This implies that, while there may be digital inequality in the overall digital diffusion process across the continent and among African countries, the region is reducing the digital adoption gap.
Figure 1.
Digital convergence: Africa vs. global regions. Source: Authors’ computation.
4.7. Quantifying Africa vs. Global Region Digital Diffusion Gap
This section presents the digital diffusion gap of Africa relative to the global region. The idea is to demonstrate that the continent is catching up with the rest of the world. For this analysis, the mean and standard deviation are used. The findings are presented in Table 9.
Table 9.
Africa vs. global region digitalisation gap.
The findings reveal a complex picture of Africa’s digital convergence with global regions. Sub-Saharan Africa recorded a mean DIGIX of −0.98 (SD: 0.87), indicating that it initially started from a significantly lower baseline than other regions. However, this positioning should be interpreted within a broader convergence narrative. While Europe and Central Asia lead with a mean DIGIX of 0.81 (SD: 1.84) and North America at 0.53 (SD: 1.63), Sub-Saharan Africa’s lower standard deviation suggests more consistent and steady progress across the region, rather than the volatile growth patterns observed in more developed markets. Notably, Sub-Saharan Africa’s trajectory mirrors that of other developing regions such as Latin America and the Caribbean (mean: −0.11, SD: 1.42) and the Middle East and North Africa (mean: −0.11, SD: 1.58), which started from similar positions but have significantly narrowed the gap. Overall, the data strongly supports a convergence narrative: Africa is progressively closing its digitalisation gap with global regions, moving from a position of substantial disadvantage towards greater parity with emerging markets, even as advanced economies maintain their leadership.
4.8. Which Technology Is Leading Africa’s Digital Process?
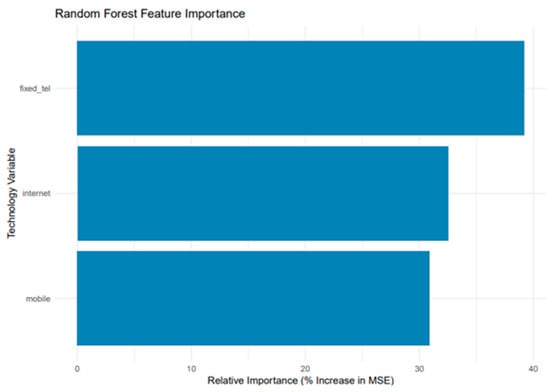
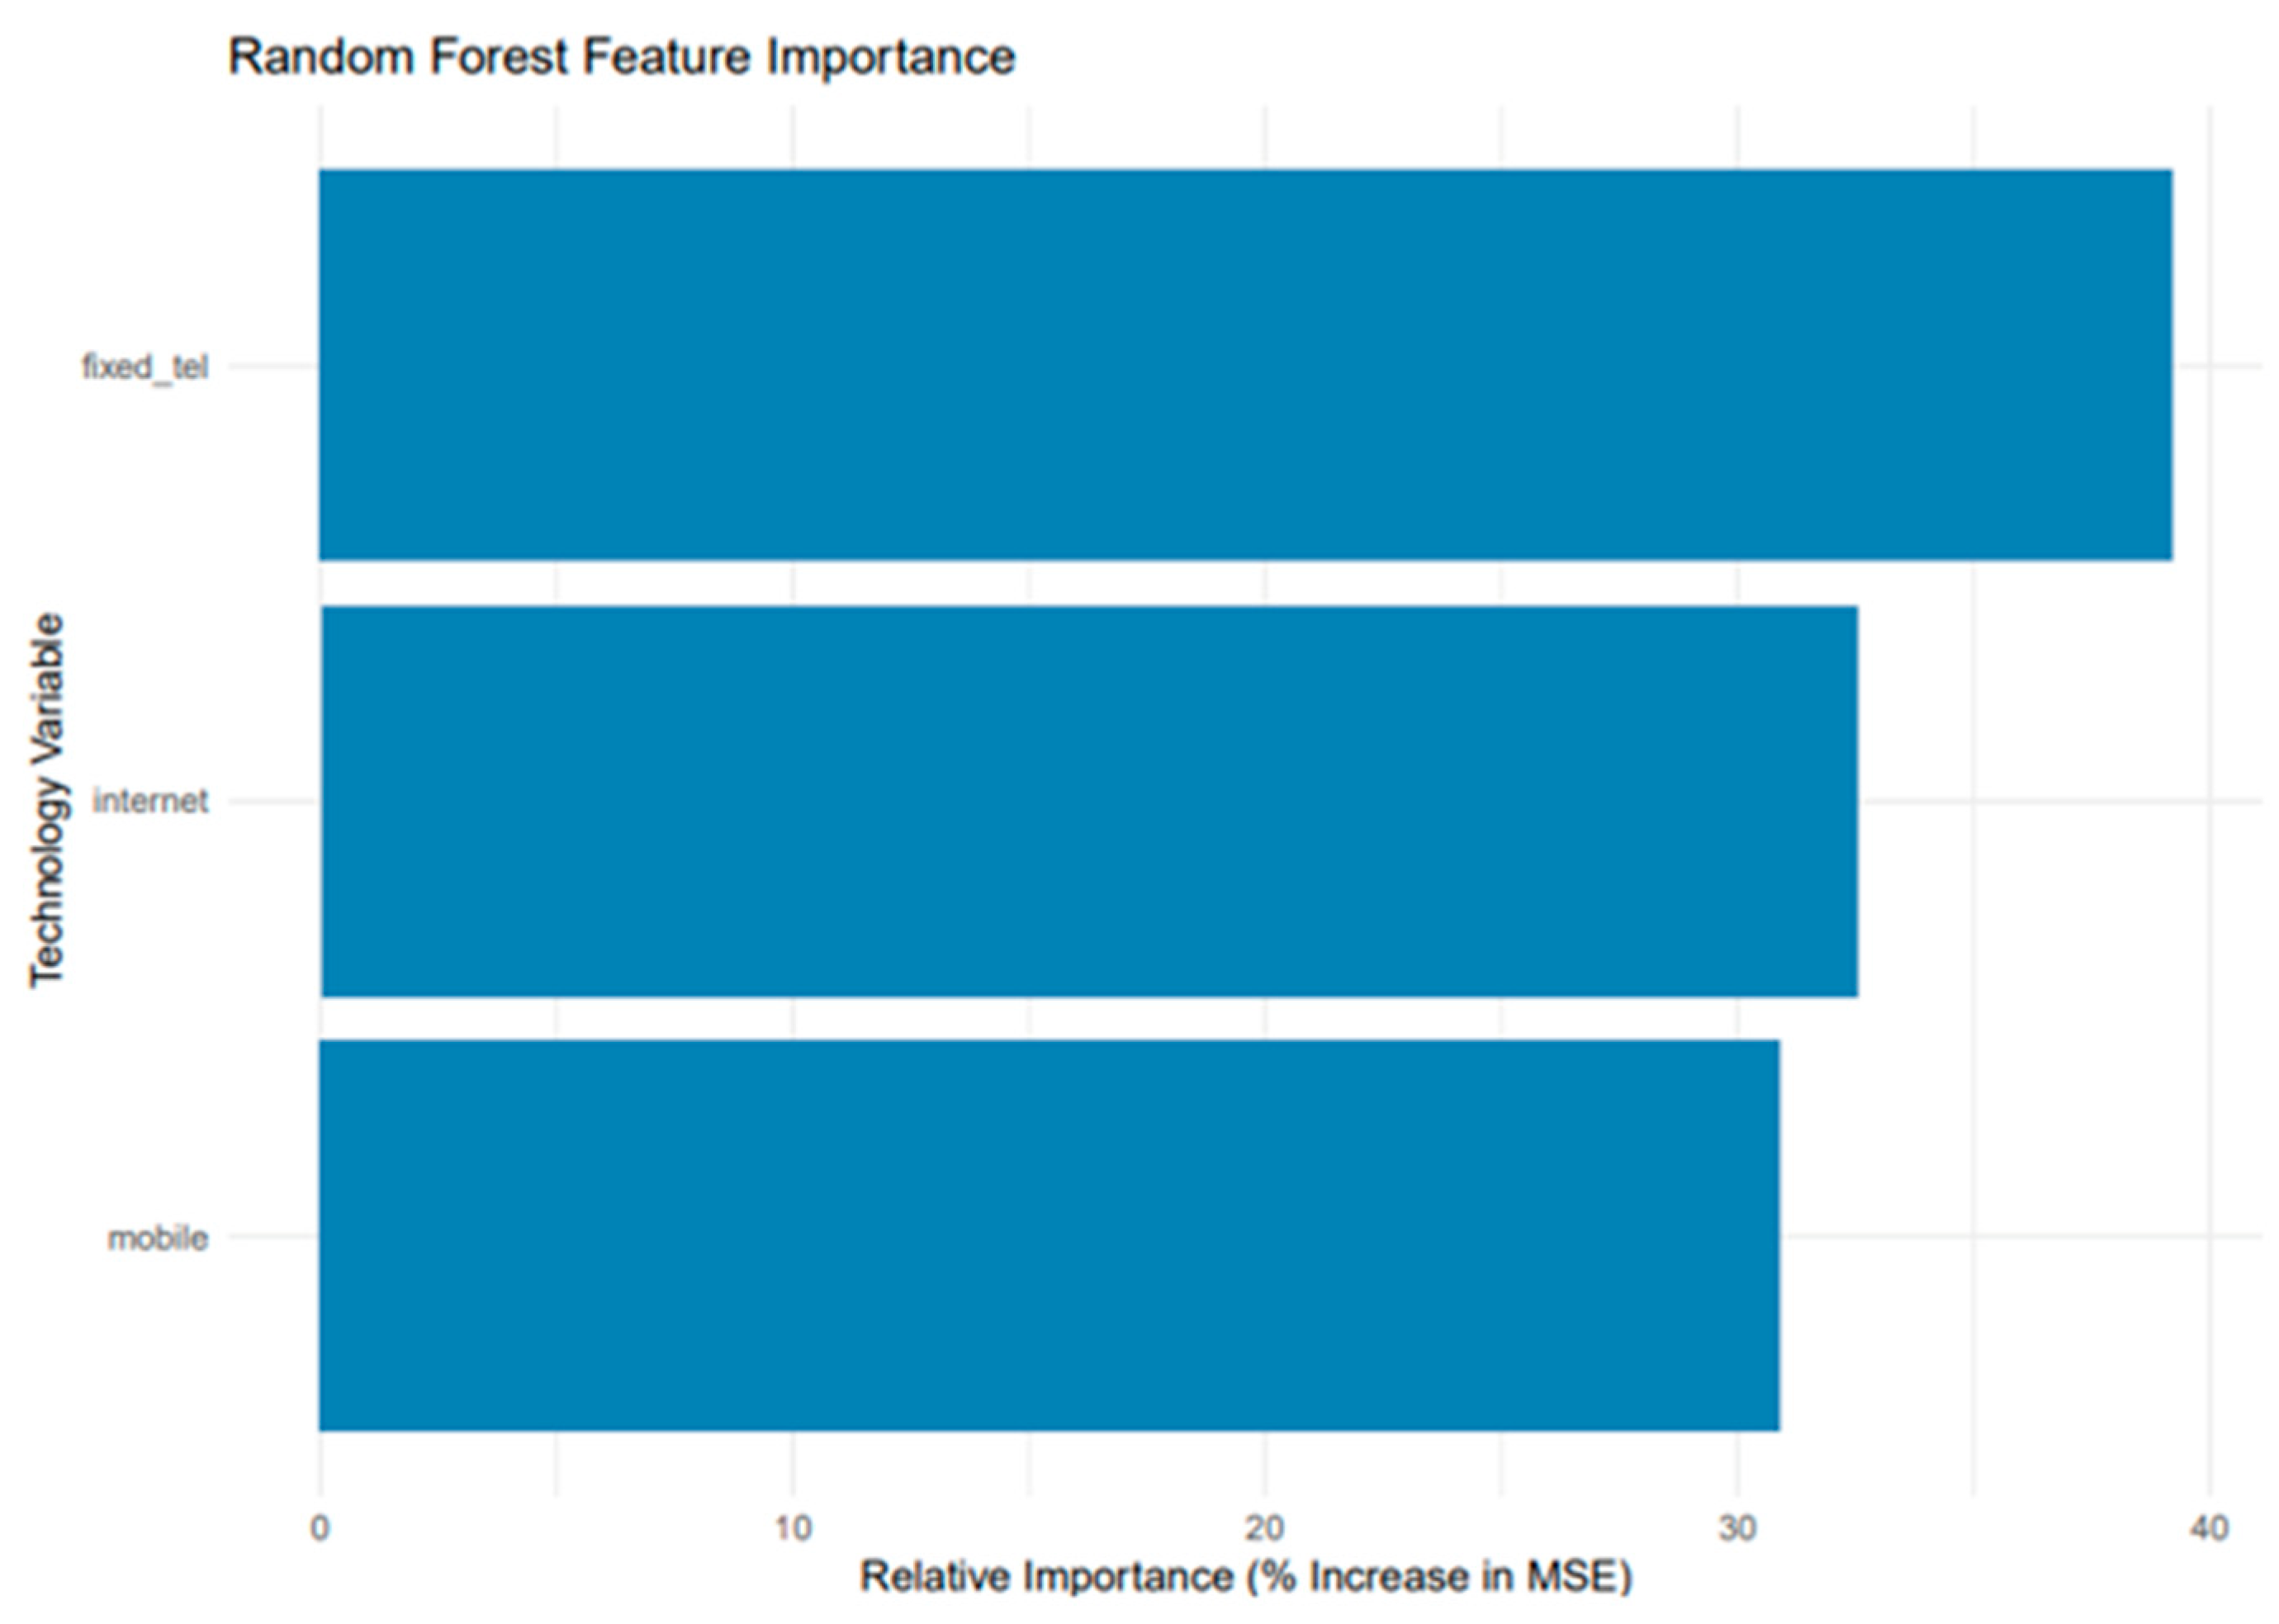
The Random Forest feature process was used to uncover which technology is driving Africa’s diffusion process. The results are presented in Figure 2. The findings show that the fixed telephone infrastructure is the key driver of digital adoption in Africa. This finding aligned with the a priori expectations because telephone infrastructure has been the backbone of basic digital technology adoption in Africa; this legacy technology has been the gateway of advanced technology adoption, including mobile cellular phone and internet access. This finding, taken alongside the divergence results reported in Table 6, presents what may be construed as a paradox, particularly when considering the notion that the technology that is most responsible for driving Africa’s digital diffusion is the same one that is exhibiting the most divergence in terms of adoption. This does not imply a contradiction but a reflection of the structural reality that fixed-line infrastructure retains foundational importance for countries in earlier adoption phases, even as their counterparts (advanced economies) are transitioning away from it, thus exhibiting divergence in investment trajectories across the continent.
Figure 2.
Technology driving Africa’s digital diffusion process. Source: Authors’ computation.
5. Discussion
The findings offer several practical implications for policymakers and governments regarding the development of the digital economy and the reduction in the digital divide. The consistent failure to reject the convergence hypothesis for the digitalisation index and internet access across Africa indicates strong internal convergence, despite African economies as a whole not yet catching up with global digitalisation levels. However, they follow similar digital development trajectories. Specifically, the highly positive convergence (β = 5.1248; t = 25.8685) coefficient for the African club confirms that these shared trajectories are statistically robust. These findings align with a priori expectations given the inherent digital inequality within and between African countries [47]. While some African countries converge towards global digitalisation standards, others diverge due to inadequate ICT infrastructure [8], varying levels of economic development [9], differential human capital endowments [48], and inconsistent investment patterns alongside governance and regulatory frameworks [49].
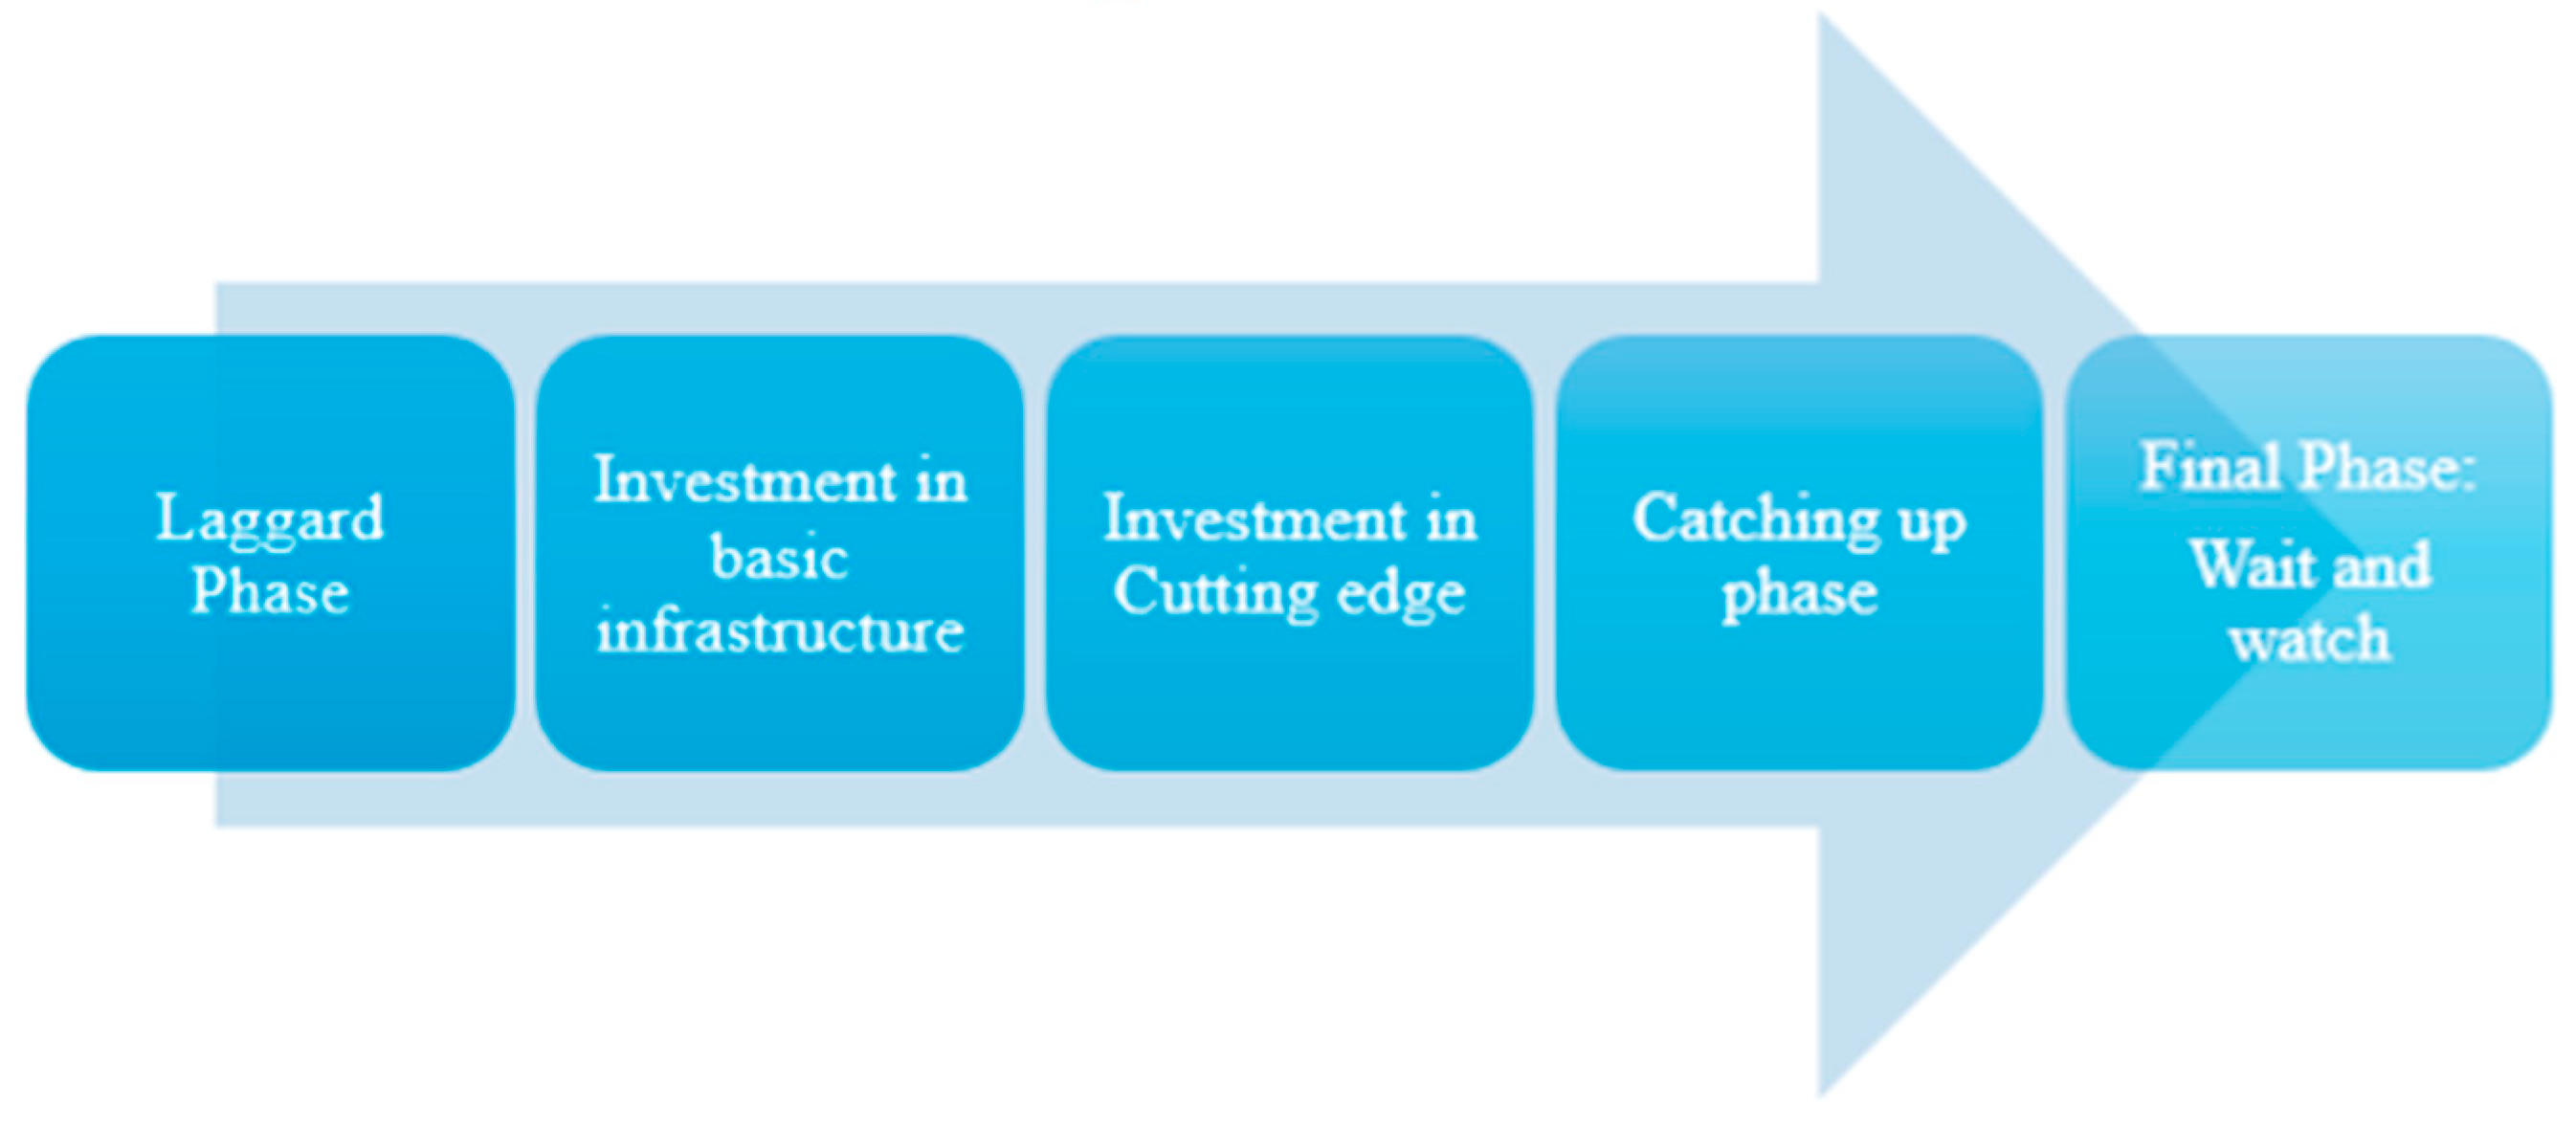
The observed convergence patterns can be understood through a systematic digitalisation framework grounded in Rogers’ [50] diffusion of innovation theory and technology adoption models. Rogers’ framework posits that innovations diffuse through social systems following an S-shaped adoption curve driven by specific attributes (such as relative advantage, compatibility, complexity, trialability, and observability) and adopter characteristics (innovators, early adopters, early majority, late majority, and laggards) [50]. Extending this framework into the study’s context, African nations’ digital infrastructure follows a sequential, cyclical path through distinct phases.
The first phase begins with low penetration and basic ICT infrastructure investment (fixed telephone lines), corresponding to the innovator and early adopter stages where high costs and technical complexity limit diffusion to advanced economies. The case of Mauritius is a classical example, where the country leveraged its legacy fixed-line network to provide the foundational backbone for its National Broadband Policy [51]. The second phase involves investing in cutting-edge technologies. In this phase, digital resource inequality manifests, with developed countries adopting the latest technologies (mobile and internet) while resource-constrained countries maintain legacy systems due to capability constraints. This divergence reflects Bass’ [52] idea that adoption rates depend on imitation coefficients and network externalities. This transition is illustrated by the recent telecommunications liberalisation observed in Ethiopia, where the country invited private competition to upgrade a state-monopoly legacy system in an attempt to bridge the gap between basic access and modern mobile broadband utility [53].
The third phase is catch-up, in which countries build capacity to accelerate technology adoption while discontinuing investment in legacy infrastructure, often leapfrogging intermediate technologies, which is a pattern observed in the adoption of mobile telephony. Kenya’s “Silicon Savannah” is a prime example, where the regulatory flexibility surrounding M-Pesa allowed the country to leapfrog traditional banking infrastructure, directly entering a sophisticated digital financial services stage. The final phase is consolidation, in which countries allow digitalisation to penetrate economic spheres and reach late majority before pursuing next-generation technologies. Currently, developed nations are adopting 4IR technologies (5G, AI), while many African nations still work toward widespread 3G coverage, exemplifying the perpetual nature of the adoption cycle (See Figure 3).
Figure 3.
The systematic process of digitalisation in Africa. Source: Authors’ computation.
The disparity in the ICT diffusion process is attributed to various factors, such as inadequate infrastructure to support ICT development [8] and economic status [9], and human capital [48]. Inadequate investment in digital technologies or the digital sector, as well as governance structures and regulatory frameworks, further contribute to this digital divide [49]. The empirical relevance of club-specific convergence is validated by the One Network Area initiative in the East African Community, where member states harmonised cross-border tariffs and spectrum regulations, thus creating a regional club of converged digital markets that outperforms isolated neighbours [54]. This aligns with this study’s finding that the continent experiences intra-African convergence even when the continent lags globally.
Importantly, the systematic digitalisation framework presented in Figure 3 is not merely conceptual; it is directly derived from the empirical findings, providing a data-driven map of Africa’s current technological state. The framework’s emphasis on the primary importance of “Phase 1” (legacy infrastructure) is verified by the Random Forest analysis, where fixed telephone lines emerged as the predominant driver of Africa’s overall diffusion (Figure 2). However, our results also reveal a critical structural vulnerability: Table 6 shows that Africa’s fixed-line adoption is diverging at one of the fastest rates recorded across all regions (σ = −0.6031; t = 31.5571). The fact that the continent’s primary digitalisation engine is precisely the technology experiencing the most severe and uneven disinvestment underscores the capability constraints highlighted in the model.
Furthermore, the “catch-up” and “consolidation” phases of the framework are empirically evidenced by the Phillips–Sul results, which identified distinct club clustering where countries move toward steady states based on their specific technological capacities. By mapping these statistical indices, specifically the divergence in fixed lines (Table 6) against their high importance as a driver (Figure 2) into this cyclical framework, the study proves that Africa’s digital progress is tethered to legacy foundations. This empirical alignment justifies this study’s call for balanced reinvestment strategies to ensure that the foundations for next-generation technology adoption are not eroded by premature disinvestment in the very technologies currently driving the diffusion process.
6. Conclusions
6.1. Conclusion
Globalisation, accompanied by the rapid advancement of digital technologies, has become the bedrock of contemporary economies. Economies that have successfully adapted to and harnessed these technologies are marked by social and economic prosperity and a heightened competitive edge in international trade. However, the empirical evidence on digitalisation in emerging economies remains limited, particularly in the African context. This study addresses this gap by investigating digital convergence trends across 123 countries, including 38 from Africa, using Phillips and Sul’s [33,34] convergence and club clustering algorithm. The findings reveal that Africa is experiencing a digitalisation process that reconciles convergence with heterogeneity. All sampled African countries belong to a single convergence club with a strong intra-regional convergence speed (σ = 2.5624) that exceeds the Global South average (σ = 0.8394), indicating that countries follow similar digitalisation development trajectories and are gradually catching up with other global regions. However, the Random Forest analysis reveals significant heterogeneity in how digitalisation drivers operate across individual African countries, with country-specific factors explaining substantial variation in outcomes.
These findings are complementary rather than contradictory to each other, because while African countries are converging towards the same steady state it is important to consider that their trajectories have different starting points, with country-specific pathways being shaped by their unique structural conditions such as infrastructure, institutional capacity, and levels of economic development as well as policy environments. This dual reality reflects Africa’s position in earlier phases of systematic digitalisation, where structural heterogeneity remains high even as countries follow parallel transition trajectories.
For specific technologies, internet access showed strong internal convergence without global steady state convergence. Mobile cellular phones exhibited strong convergence speeds across most regions (except Latin America), yet global convergence was not achieved. Fixed telephone lines showed pronounced divergence with slow convergence speeds, reflecting their status as legacy technology. These patterns confirm that digitalisation is a systematic and continuous process driven by a technology-specific process where adoption capacity varies significantly across African nations despite their shared convergence.
6.2. Policy Implication
The finding that the African continent experiences digital convergence characterised by significant heterogeneity has direct policy implications. Given that fixed telephone lines emerged as the primary driver of digital diffusion despite perceptions of obsolescence, governments should prioritise hybrid infrastructure mandates. This entails integrating legacy fixed-line nodes with modern fibre-optic backbones to stabilise connectivity in underserved regions where mobile signals remain inconsistent. This approach preserves existing infrastructure while providing a cost-effective foundation for broader broadband expansion. A successful example of this technology-specific focus is Mauritius, where the National Broadband Policy utilised fixed-line infrastructure as a central pillar to reduce costs and achieve the highest fixed penetration in the region, effectively providing the backbone necessary for global digital alignment.
Furthermore, because the study identifies club-specific convergence rather than a unified move toward the global frontier, policy interventions should be localised at the regional cluster level. Instead of solely pursuing continent-wide targets, nations within high-performing clubs should harmonise spectrum licencing and cross-border data tariffs to create unified regional digital markets. This allows laggard countries to adopt the regulatory reforms of their club leaders more efficiently. The East African Community (EAC) provides a model for this “club-based” harmonisation; through the One Network Area, member states like Kenya and Rwanda harmonised regional roaming and cyberlaws, functioning as a unified digital club that significantly accelerated regional diffusion.
Finally, to bridge the gap between African clubs and global regions, there must be a strategic shift from hardware distribution to enhancing “absorptive capacity.” This requires policies that incentivize the private sector to leapfrog intermediate technologies in rural areas, such as through tax credits for direct-to-5G or satellite deployments. For instance, Kenya’s regulatory flexibility allowed it to bypass traditional banking infrastructure through mobile money, demonstrating that leapfrogging succeeds when the focus shifts to service utility and high-speed quality indicators. Ultimately, prioritising technical Science, Technology, Engineering, and Mathematics (STEM) training over simple subscription rates will ensure that African nations develop the human capital necessary to move from internal convergence toward the global technological frontier.
6.3. Research Limitations and Direction for Future Research
One of the study’s limitations lies in its reliance on secondary panel data which, while covering 123 countries, is subject to the reporting consistency and quality of World Bank datasets. The exclusion of countries with significant missing data may introduce a degree of selection bias, potentially overlooking digital dynamics in the most isolated nations.
Furthermore, while the Random Forest model provided a robust diagnostic for identifying technology-specific drivers, this study did not perform a comparative cross-algorithmic validation (e.g., against Gradient Boosting or Support Vector Machines). Future research could employ a multi-model ensemble approach to further test the stability of these variable importance rankings. Additionally, as this study primarily measures access and subscription rates, subsequent research should incorporate indicators of digital quality such as internet speeds, data affordability, and the adoption of emerging technologies like Artificial Intelligence (AI) and 5G to provide a more nuanced perspective on the evolving global digital divide.
Author Contributions
T.C., O.O.D. and A.O.N. have all contributed equally to the development and production of this manuscript. All authors have read and agreed to the published version of the manuscript.
Funding
This research received no external funding.
Institutional Review Board Statement
Not applicable.
Informed Consent Statement
Not applicable.
Data Availability Statement
Data will be made available upon reasonable request.
Conflicts of Interest
The authors declare no conflicts of interest.
Appendix A
Table A1.
List of sampled countries.
Figure A1.
The Phillips and Sul convergence framework. Source: Authors’ adoption of Phillips and Sul [33].
References
- Maina, T.M. A review of convergence in information and communication technology. Int. J. Sci. Footpr. 2014, 2, 80–98. [Google Scholar]
- Ahmad, M.; Imitaz, M.; Khan, M. Digital convergence and its economic sentiments. In Proceedings of the Asia Pacific Conference on Information Communication Technology (APCICT-2018), Daegu, Republic of Korea, 6–7 July 2018. [Google Scholar]
- Matthess, M.; Kunkel, S. Structural change and digitalisation in developing countries: Conceptually, linking the two transformations. Technol. Soc. 2020, 63, 101428. [Google Scholar] [CrossRef] [Scilit]
- Nishijima, M.; Ivanauskas, T.M.; Sarti, F.M. Evolution and determinants of digital divide in Brazil (2005–2013). Telecommun. Policy 2017, 41, 12–24. [Google Scholar] [CrossRef] [Scilit]
- Murthy, K.V.B.; Anjala, K.; Shankar, R. Digital economy in a global perspective: Is there a digital divide? Transnatl. Corp. Rev. 2021, 13, 1–15. [Google Scholar] [CrossRef] [Scilit]
- Bahr, G. How Information Technology Impacts Economic Growth and Human Development at the Country Level. Doctoral Dissertation, Oklahoma State University, Stillwater, OK, USA, 2022. [Google Scholar]
- Wellenius, B. Telecommunications in developing countries. Telecommun. Policy 1977, 1, 289–297. [Google Scholar] [CrossRef] [Scilit]
- Adeola, O.; Evans, O. ICT, infrastructure, and tourism development in Africa. Tour. Econ. 2019, 26, 97–114. [Google Scholar] [CrossRef] [Scilit]
- David, O.O. Nexus between telecommunication infrastructures, economic growth, and development in Africa: Panel vector autoregression (P-VAR) analysis. Telecommun. Policy 2019, 43, 101816. [Google Scholar] [CrossRef] [Scilit]
- Adeleye, N.; Eboagu, C. Evaluation of ICT development and economic growth in Africa. Netnomics 2019, 20, 31–53. [Google Scholar] [CrossRef] [Scilit]
- Saba, C.S.; David, O.O. Convergence patterns in global ICT: Fresh insights from a club clustering algorithm. Telecommun. Policy 2020, 44, 102010. [Google Scholar] [CrossRef] [Scilit]
- David, O.O.; Grobler, W. Information and communication technology penetration level as an impetus for economic growth and development in Africa. Econ. Res.-Ekon. Istraživanja 2020, 33, 1394–1418. [Google Scholar] [CrossRef] [Scilit]
- Corrigan, T. Africa’s ICT Infrastructure: Its Present and Prospects (Policy Briefing). South African Institute of International Affairs (SAIIA). 2020. Available online: https://africaportal.org/wp-content/uploads/2023/05/Policy-Briefing-197-corrigan-1.pdf (accessed on 10 July 2025).
- Rath, B.N. Does the digital divide across countries lead to convergence? New international evidence. Econ. Model. 2016, 58, 75–82. [Google Scholar] [CrossRef] [Scilit]
- Bankole, F.; Mimbi, L. The impact of ICT on governance systems performance. In Proceedings of the 2017 International Conference Resource Management (Confr-IRM), Santiago, Chile, 17–19 May 2017. [Google Scholar]
- Kiiski, S.; Pohjola, M. Cross-country diffusion to the internet. Inf. Econ. Policy 2002, 14, 297–310. [Google Scholar] [CrossRef] [Scilit]
- Quibria, M.G. The Digital Divide: Determinants and Policies with Special Reference to Asia. 2003. Available online: https://www.adb.org/sites/default/files/publication/28183/wp040.pdf (accessed on 12 July 2025).
- Park, S.R.; Choi, D.Y.; Hong, P. Club convergence & social change. Technol. Forecast. Change 2015, 126, 195–204. [Google Scholar] [CrossRef] [Scilit]
- International Telecommunications Union (ITU). Measuring Digital Development: Facts and Figures. 2023. Available online: https://www.itu.int/hub/publication/d-ind-ict_mdd-2023-1/ (accessed on 12 July 2025).
- International Telecommunications Union (ITU). The ITU Role in the Millennium Development Goals. 2022. Available online: https://www.itu.int/itunews/manager/display.asp?lang=en&year=2005&issue=04&ipage=millennium&ext=html#:~:text=%E2%80%9CICTs%20alone%20may%20not%20feed,more%20accessible%2C%20and%20much%20more (accessed on 12 July 2025).
- Rath, B.N.; Panda, B.; Akram, V. Convergence and determinants of ICT development in case of emerging market economies. Telecommun. Policy 2023, 41, 102464. [Google Scholar] [CrossRef] [Scilit]
- Ramadhanti, H.; Astuti, E. Digital divide and a spatial investigation of convergence in ICT development across Indonesian provinces. J. Apl. Stat. Komputasi Stat. 2020, 12, 69–84. [Google Scholar] [CrossRef] [Scilit]
- Solow, R.M. A contribution to the theory of economic growth. Q. J. Econ. 1956, 70, 65–94. [Google Scholar] [CrossRef] [Scilit]
- Lucas, R. On the Mechanics of Economic Development. J. Monet. Econ. 1988, 22, 3–42. [Google Scholar] [CrossRef] [Scilit]
- Romer, P.M. Endogenous technological change. J. Political Econ. 1990, 98, 71–102. [Google Scholar] [CrossRef] [Scilit]
- Barro, R.J.; Sala-I-Martin, X.; Blanchard, O.J.; Hall, R.E. Convergence across states and regions. Brook. Pap. Econ. Act. 1991, 1991, 107–182. [Google Scholar] [CrossRef] [Scilit]
- Barro, R.J.; Sala-I-Martin, X. Convergence. J. Political Econ. 1992, 100, 223–251. [Google Scholar] [CrossRef] [Scilit]
- Castellaci, F.; Archibugi, D. The technology clubs: The distribution of knowledge across nations. Res. Policy 2008, 37, 1659–1673. [Google Scholar] [CrossRef] [Scilit]
- Baumol, W.J. Productivity growth, convergence and welfare: What the long-run data show. Am. Econ. Rev. 1986, 76, 1072–1085. [Google Scholar]
- Baumol, W.J. Multivariate growth patterns: Contagion and common forces as possible sources of convergence. In Convergence of Productivity: Cross-National Studies and Historical Evidence; Baumol, W.J., Nelson, R.R., Wolff, E.N., Eds.; Oxford University Press: Oxford, UK, 1994; pp. 62–85. [Google Scholar]
- Durlauf, S.N.; Johnson, P.A. Multiple regimes and cross-country growth behaviour. J. Appl. Econom. 1995, 10, 365–384. [Google Scholar] [CrossRef] [Scilit]
- Nakajima, T. Catch-up in turn in a multi-country international trade model with learning-by-doing and invention. J. Dev. Econ. 2003, 72, 117–138. [Google Scholar] [CrossRef] [Scilit]
- Phillips, P.C.B.; Sul, D. Transition modelling and econometric convergence tests. J. Econom. Soc. 2007, 75, 1771–1855. [Google Scholar] [CrossRef] [Scilit]
- Phillips, P.C.B.; Sul, D. Economic transition and growth. J. Appl. Econom. 2009, 24, 1153–1185. [Google Scholar] [CrossRef] [Scilit]
- Akanbi, O.A. Structural and institutional determinants of poverty in Sub-Saharan African countries. J. Hum. Dev. Capab. 2015, 16, 122–141. [Google Scholar] [CrossRef] [Scilit]
- Pradhan, R.P.; Arvin, M.B.; Norman, N.R.; Bele, S.K. Economic growth and the development of telecommunications infrastructure in the G-20 countries: A panel-VAR approach. Telecommun. Policy 2014, 38, 634–649. [Google Scholar] [CrossRef] [Scilit]
- Hanafizadeh, M.R.; Saghaei, A.; Hanafizadeh, P. An index for cross-country analysis of ICT infrastructure and access. Telecommun. Policy 2009, 33, 385–405. [Google Scholar] [CrossRef] [Scilit]
- Apergis, N.; Christou, C.; Miller, S. Convergence patterns in financial development: Evidence from club convergence. Empir. Econ. 2012, 43, 1011–1040. [Google Scholar] [CrossRef] [Scilit]
- Androniceanu, A.; Georgescu, I. E-government in European countries, a comparative approach using the principal component analysis. NISPAcee J. Public Adm. Policy 2021, 14, 65–86. [Google Scholar] [CrossRef] [Scilit]
- Shobana, G.; Umamheswari, K. Forecasting by machine learning techniques and econometrics: A review. In 2021 6th International Conference on Inventive Computation Technologies (ICICT); IEEE: Piscataway, NJ, USA, 2021. [Google Scholar] [CrossRef] [Scilit]
- Kyriazos, T.A.; Poga, M. Application of machine learning models in social sciences: Managing nonlinear relationships. Encyclopedia 2024, 4, 1790–1805. [Google Scholar] [CrossRef] [Scilit]
- Du, K.L.; Zhang, R.; Jiang, B.; Zeng, J.; Lu, J. Understanding machine learning principles: Learning, inference, generalisation, and computational learning theory. Mathematics 2025, 13, 451. [Google Scholar] [CrossRef] [Scilit]
- Barreñada, L.; Dhiman, P.; Timmerman, D.; Boulesteix, A.L.; Calster, B.V. Understanding overfitting in random forest for probability estimation: A visualisation and simulation study. Diagn. Progn. Res. 2024, 8, 14. [Google Scholar] [CrossRef] [Scilit]
- Martin, L.C. Machine Learning vs Traditional Forecasting Methods: An Application to South African GDP; SA-TIED Working Paper No. 45; Stellenbosch University: Stellenbosch, South Africa, 2019; Available online: https://www.ekon.sun.ac.za/wpapers/2019/wp122019 (accessed on 17 March 2026).
- Tiffin, A. Seeing in the Dark: A Machine Learning Approach to Nowcasting in Lebanon; IMF Working Paper No. 16/56; International Monetary Fund (IMF): Washington, DC, USA, 2016. [Google Scholar]
- Heeks, R. Digital inequality beyond the digital divide: Conceptualising adverse digital incorporation in the global south. Inf. Technol. Dev. 2022, 28, 688–704. [Google Scholar] [CrossRef] [Scilit]
- Malephane, L. Digital Divide: Who in Africa Is Connected and Who Is Not; Dispatch No. 582; Afrobarometer: Accra, Ghana, 2022. [Google Scholar]
- Haini, H. Examining the impact of ICT, human capital and carbon emissions: Evidence from the ASEAN economies. Int. Econ. 2021, 166, 116–125. [Google Scholar] [CrossRef] [Scilit]
- Adam, I.O. ICT development, e-government development, and economic development: Does institutional quality matter? Inf. Technol. Int. Dev. 2020, 16, 1–19. [Google Scholar] [CrossRef] [Scilit]
- Rogers, E.M. Diffusion of Innovations, 5th ed.; Free Press: Mumbai, India, 2003. [Google Scholar]
- Chabi, M.N. Diversity of Industrialization in Africa: Transformation of Employment and Emergence of Telecommunication (1960–2021). Doctoral Dissertation, Hokkaido University, Sapporo, Japan, 2024. [Google Scholar] [CrossRef]
- Bass, F.M. A new product growth for model consumer durables. Manag. Sci. 1969, 15, 215–227. [Google Scholar] [CrossRef] [Scilit]
- Gilbert, P. Ethiopia’s Telecoms liberalisation Makes Progress–Omdia. Connecting Africa. 2024. Available online: https://www.connectingafrica.com/connectivity/ethiopia-s-telecoms-liberalization-makes-progress-omdia (accessed on 27 February 2026).
- International Telecommunication Union (ITU). East Africa One Network Area Roaming Initiative: A Case Study of ONA; ITU: Geneva, Switzerland, 2016; Available online: https://www.itu.int/dms_pub/itu-d/opb/pref/D-PREF-EF.ONA-2016-PDF-E.pdf (accessed on 26 February 2026).

Disclaimer/Publisher’s Note: The statements, opinions and data contained in all publications are solely those of the individual author(s) and contributor(s) and not of MDPI and/or the editor(s). MDPI and/or the editor(s) disclaim responsibility for any injury to people or property resulting from any ideas, methods, instructions or products referred to in the content. |
© 2026 by the authors. Licensee MDPI, Basel, Switzerland. This article is an open access article distributed under the terms and conditions of the Creative Commons Attribution (CC BY) license.