


Abstract
The use of virtual reality for pilot flight training, whether as a stand-alone device, or to augment or replace a conventional simulator, has gained significant attention in recent years. The primary purported benefit of virtual reality is its increased ability to achieve immersion of the trainee, which has particular benefits for visuospatial awareness. This benefit of the technology would appear to offer little advantage in the training of instrument-flying skills, where only the aircraft’s instrumentation needs to be accurately rendered in order that the status of the ownship can be known. However, given the wide-scale intention toward the adoption of the technology, it is likely that instrument flight training will be one of its uses at flight schools. In order that the effectiveness of the VR Simulator can be evaluated, for instrument flight training, a quasi-randomised separate-sample pretest–posttest design study was completed. The ability of this low-cost VR simulator to transfer the flying skills required to conduct an ILS approach, after establishment on approach, was evaluated with 44 participants. Results indicate significant improvement in participants’ flying skills based on operational (rrb = 0.508) and synthetic (g = 0.844) performance metrics. The findings indicate that the VR simulator appears effective for the training of these skills, and that the immersion and presence are not detrimental, even when the primary focus is the instrument panel. The idea that VR is an effective tool for training instrument flight skills has not previously been demonstrated. Due consideration must, however, be given to the context of this study and the noted limitations of the VR technology.
1. Introduction
Preparing trainee pilots for learning airborne through use of simulators, including preparations for instrument flying, is well established in the literature and nearly universally accepted within industry. For many trainee pilots, their first exposure to instrument-flying skills will occur in a flight simulator. Such training might occur in a high-fidelity simulator (e.g., those used for airline type training) but will more usually be completed in a basic flight-training device (FTD) or Personal-Computer Aviation-Training Device (PCATD) [1]. The default to a PCATD for a pilot’s first instrument flying, known as basic instrument flying (BIF), or even the teaching of skills for attaining a command instrument rating, may be the cheapest option, but the practice must also be effective. This training has to cognitively prime the pilot for the experience airborne [2] and familiarise them with the procedures of instrument flying [3,4]. Instrument-flying skills are more complex than those skills required for visual flying but are necessary for those seeking to pursue piloting as a profession [5]. For those not intending to seek employment with charter or air transport operators, some training in instrument flying is still required. Owing to the extreme danger of visual-flight-rule (VFR) flight into instrument meteorological conditions (IMC) [6], many civil flight regulators, including the Australian Civil Aviation Safety Authority (CASA), require some amount of instrument training prior to the issuance of pilot licences [7].
The specific set of skills which are to be transferred to the trainee in the simulator will depend on whether they are completing BIF or are seeking a private or command instrument rating. The skills required for each of these, and indeed most flight skills, in the Australian context, are covered in the Manual of Standards Instrument for Part 61 of the Civil Aviation Safety Regulations. Regardless of the skills, increasing procedural familiarity and cognitive priming are usually the motives behind the use of the flight simulator. Some of the basic skills to be initially transferred are to perform manoeuvres without reference to the natural horizon (IFF.1), to navigate between locations using ground-based navigation aids (RNE.2), and to recover the aircraft to stabilised flight from unstable flight (IFF.3). For all of these skills, as well as for more complex skills, such as flying an instrument approach, visual reference to the ground and surroundings of the aircraft are unnecessary. In fact, visual reference is to be prevented, whether by imposition of clouds in the simulator, or by use of “foggles” [8] in the aircraft. While external vision is obscured the means of determining “owncraft” state, position, and relative position, are by use of the cockpit instrumentation. For this reason, high-fidelity flight simulators, with their advanced visual systems and motion systems, are often unnecessary [4]. Instead, simpler and cheaper procedure trainers and PCATDs are usually used.
Procedure trainers and PCATDs are the most common type of simulators in General Aviation (GA) and are also the simulators most likely to be replaced, or augmented, by virtual reality (VR). VR Flight simulators, and specifically those based on head mounted displays (VR-HMD) can be less expensive, more portable, and more engaging than conventional simulators [9]. In order for this innovative technology to be of best educational use, the specific output constraints (e.g., resolution, field of view, or motion-to-photon latency) must be suitably handled, lest they invoke negative effects such as simulator sickness [10,11]. Those same constraints may also provoke compensatory behaviours and negative transfer when trained skills are applied in real-world contexts [4,12,13].
The greatest advantage of VR—the increased immersion [14]—is not an obvious benefit for instrument flight training. The exterior view from the cockpit, and the natural means of observing that view, which are enabled by VR, and which enables greater visuospatial understanding of positional relationships [15], is likely made irrelevant by flight in cloud. There is even the risk that, given the greater immersion and similarity of the cockpit, VR might result in interference in the learning process [16]. Nonetheless, the widespread intention to adopt VR for flight training [9,17], and the likely further reduction in costs and increase in processing power of VR-HMDs (i.e., Moore’s law), is likely to see such devices put into service for instrument training, if for no other reason than to experience a transition from visual to instrumented flying with the associated change in procedures and skills. It is therefore critical to understanding whether VR-HMDs are suitable for this training. If the training has negative transfer, then it may be necessary to prohibit that use.
The effectiveness of VR, and particularly VR-HMDs, for the training of many kinds of complex skills (e.g., sign language [18], surgery [19], or certain other flight skills [20]), including instrument flight skills, is not yet fully established. Immersion, which is the primary benefit of a VR simulators, would seem to offer negligible benefit in the transfer of instrument flying skills. Nonetheless, the other benefits of VR, such as cost and dematerialisation, are likely to make it an attractive option for such training. The clear pressure toward adoptions of the technology—and the lack of existing research in this area—is of concern, given that the simulators mostly likely to be displaced by VR-HMDs are those used for initial instrument training. The broader literature on extended-reality technology flight simulation, for various reasons, has a strong focus on GA, where initial exposure to instrument flying occurs. Given the significance, the question underlying the current research is as follows: does using a low-cost virtual reality headset as the visual system for a Personal-Computer Aviation-Training Device (PCATD) support positive transfer of skills required for accurately flying the Instrument-Landing System (ILS), based on an operational and a synthetic metric? In order that this question can be fully answered, this research undertook empirical evidence on the effectiveness of the VR flight simulator in this mode.
2. Materials and Methods
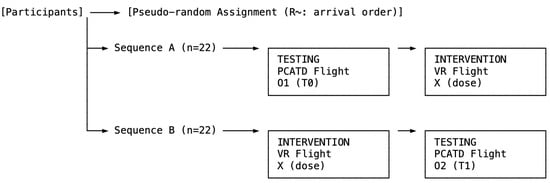
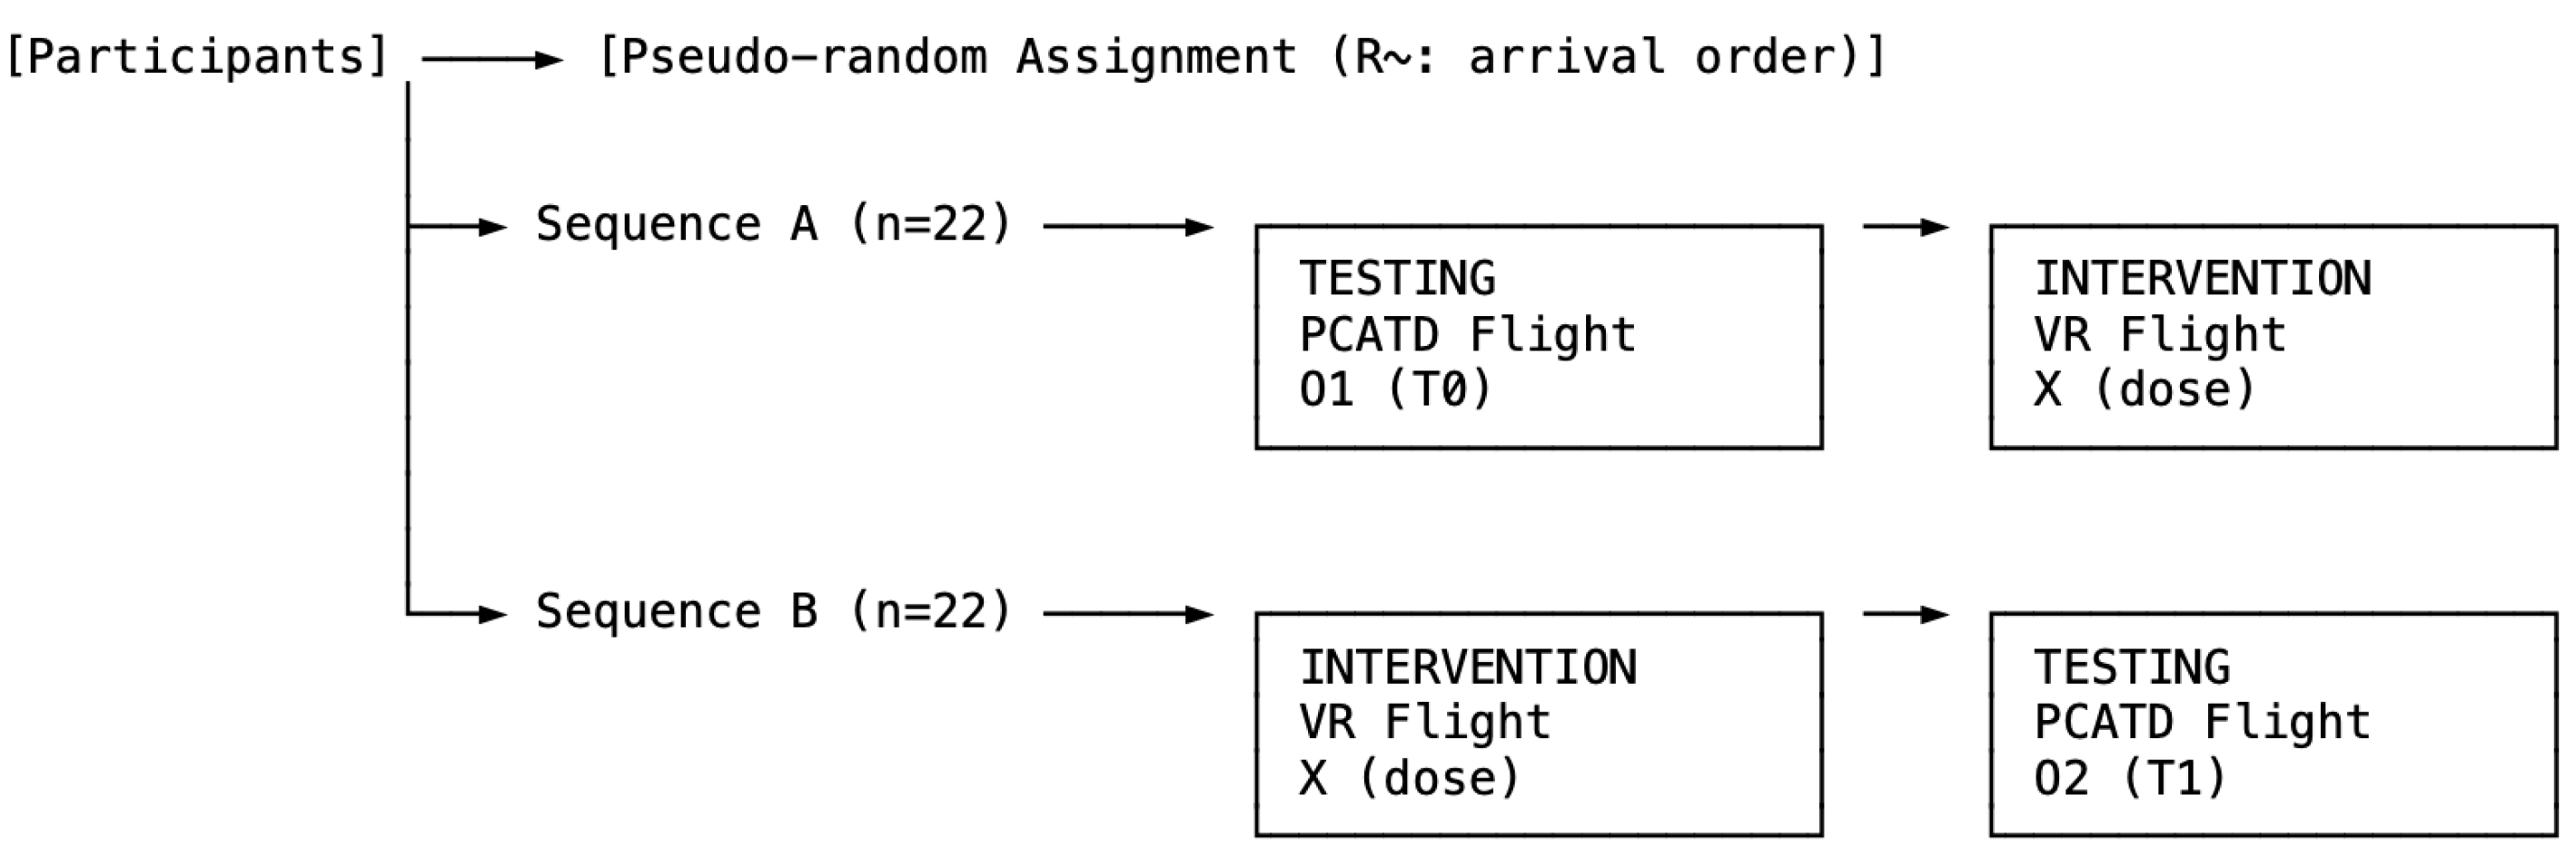
A quasi-randomised separate-sample pretest–posttest design was employed for this study. The separate-sample pretest–posttest design, which, in this study, has a single pair of groups, exposes all participants to the intervention, but with performance (or status) of one group assessed only before the intervention, and the performance of the second group assessed only after the intervention [21]. The intervention effect is the differential in performance between the separate pretest group and the posttest group [22]. The data upon which this research is based were the result of, and originally solely for the purposes of, an educational laboratory activity at an Australian university. The structuring of the data and the chosen experimental design were limited by the conduct of the educational activity, particularly insufficient hardware and time. There were insufficient VR-HMDs to have all participants perform the VR activity (i.e., intervention) simultaneously, as well as insufficient time to allow for sequential completion of one or the other activity in a set order. The origins of the data therefore excluded true randomisation. However, the order of arrival, which is random to an extent, determined whether the flight was conducted in VR or on the PCATD first, id est, quasi-random. This study’s flow is summarised in Figure 1.
Figure 1.
Quasi-randomised separate-sample pretest–posttest study design. Pseudo-randomised assignment by arrival order (R~) allocated participants to a pretest group (n = 22) tested on the PCATD at T0 (O1), or to a posttest group (n = 22) receiving the VR intervention (X, single dose) and then tested on the PCATD at T1 (O2).
The flight (simulator) data were fully anonymised prior to their provision to the researcher. No demographic information on participants was provided to the researchers, and owing to the ethics approval restrictions, such data were not subsequently sought. Data were provided for 44 participants (n = 44), of whom 22 (n = 22) were in the pretest group (i.e., tested before intervention) and 22 (n = 22) were in the posttest group (i.e., tested after intervention). This sample size, though relatively small, compares favourably with other research within this domain [20]. Previous research in the field of xR flight simulations has been underpinned by the assumption, as per Ericsson et al. [23], that the practice of skills, through flight simulation experience, would increase performance (i.e., expertise). However, as some previous xR flight simulation research has shown negative skills transfer [24] (based upon analysis in [9]), it is unclear whether that underpinning research assumption is valid, particularly in instrumented flying.
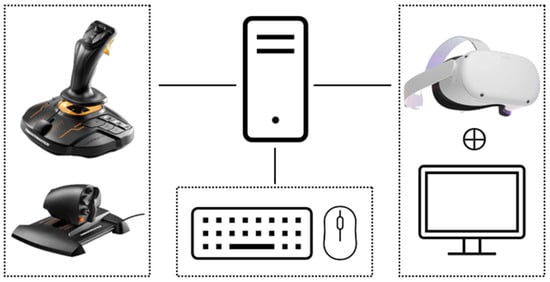
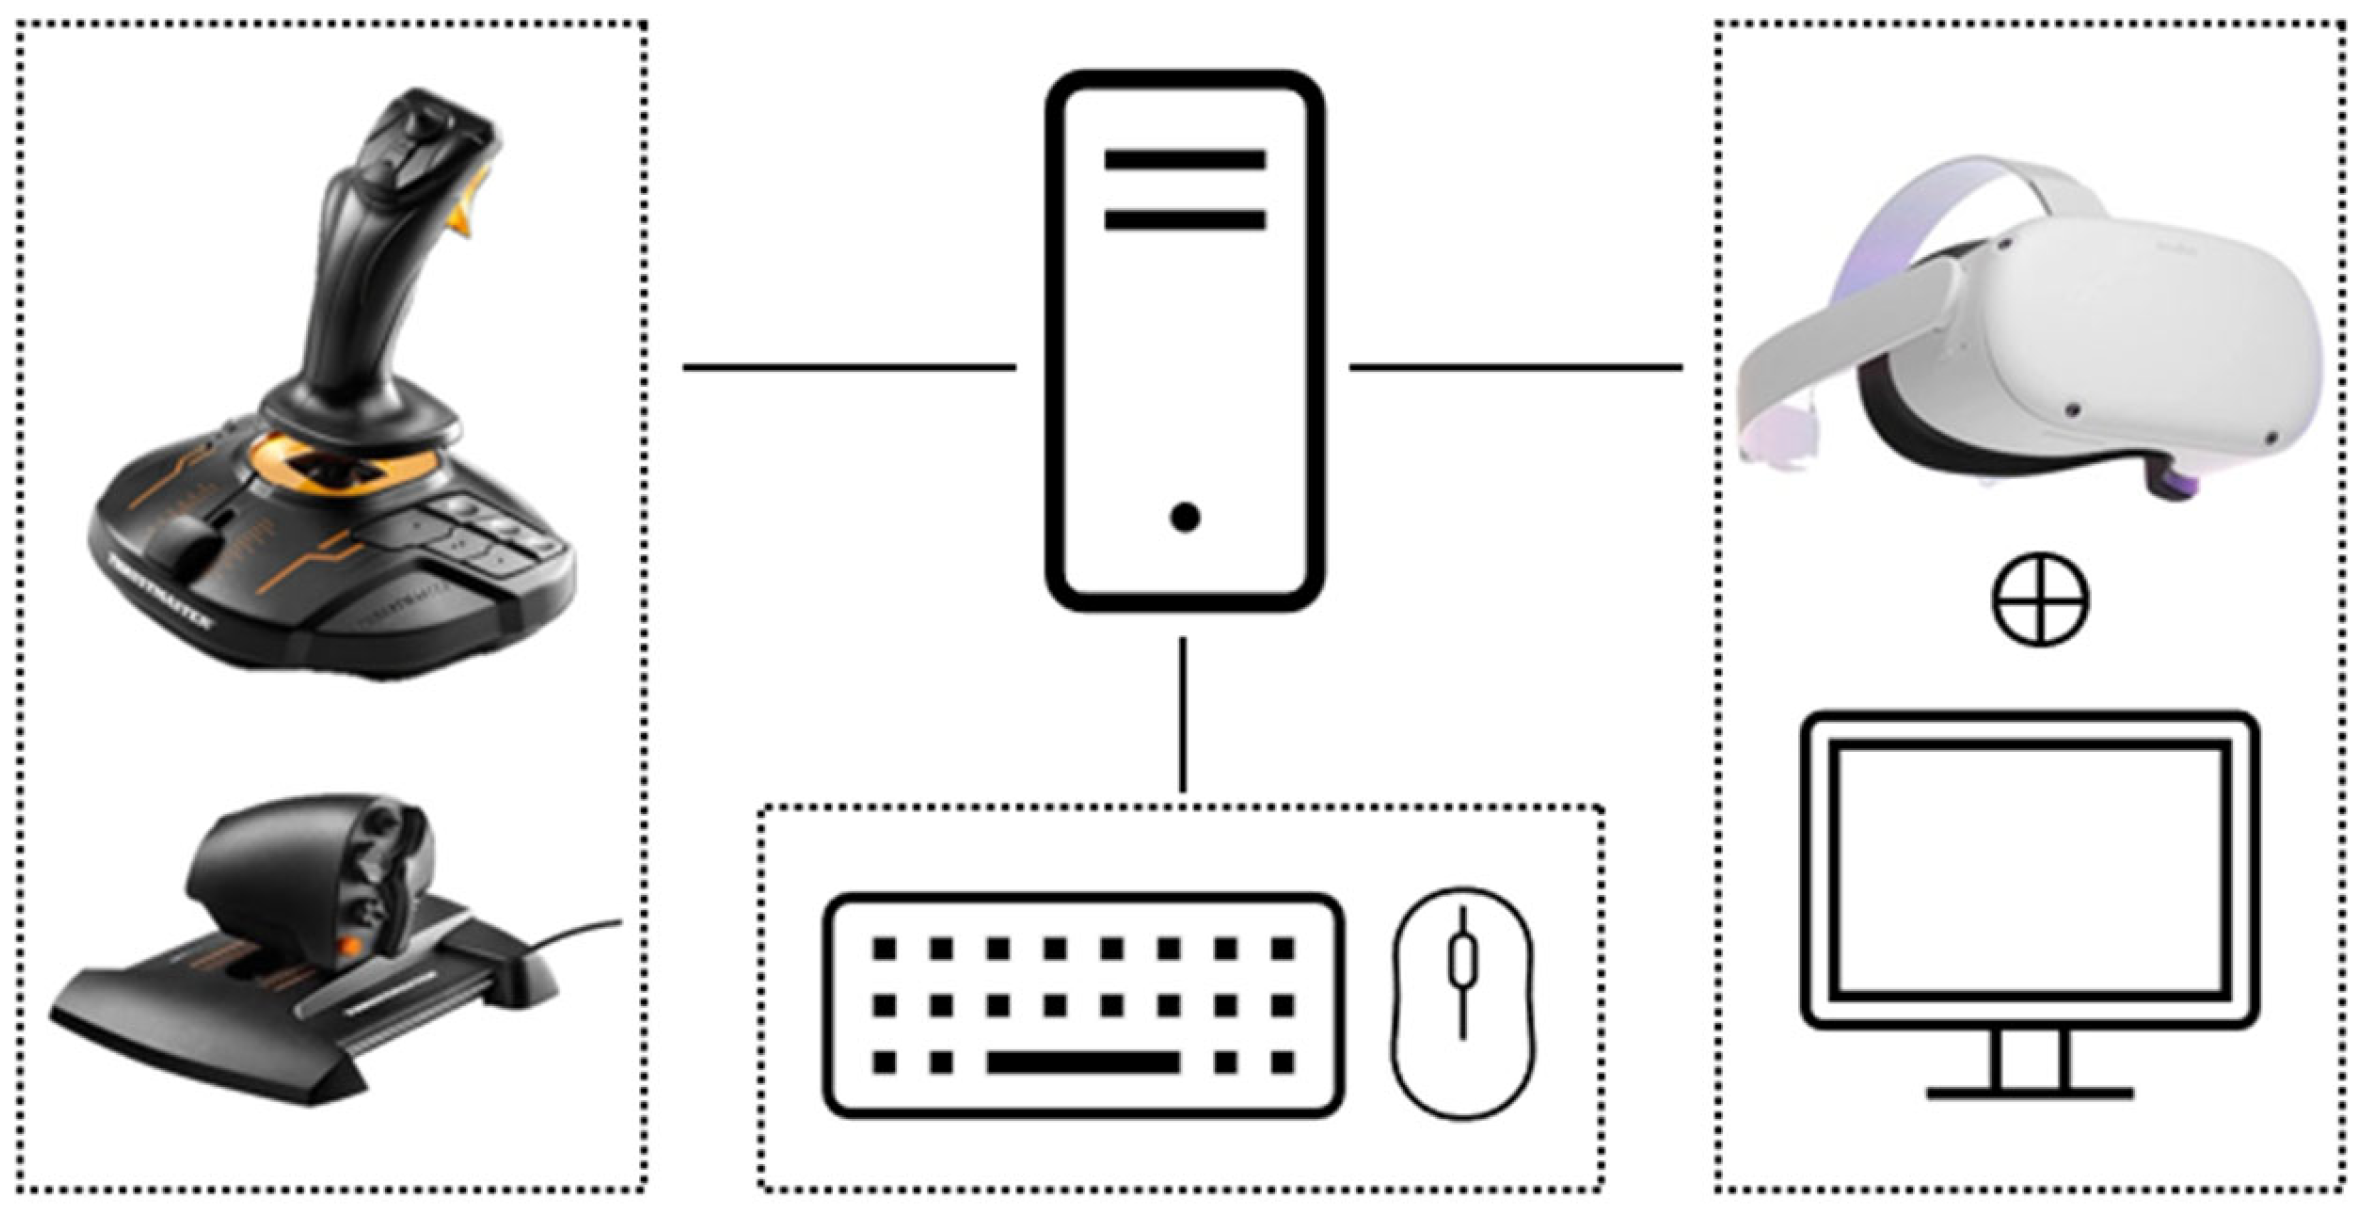
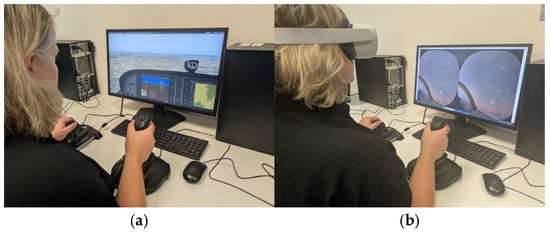
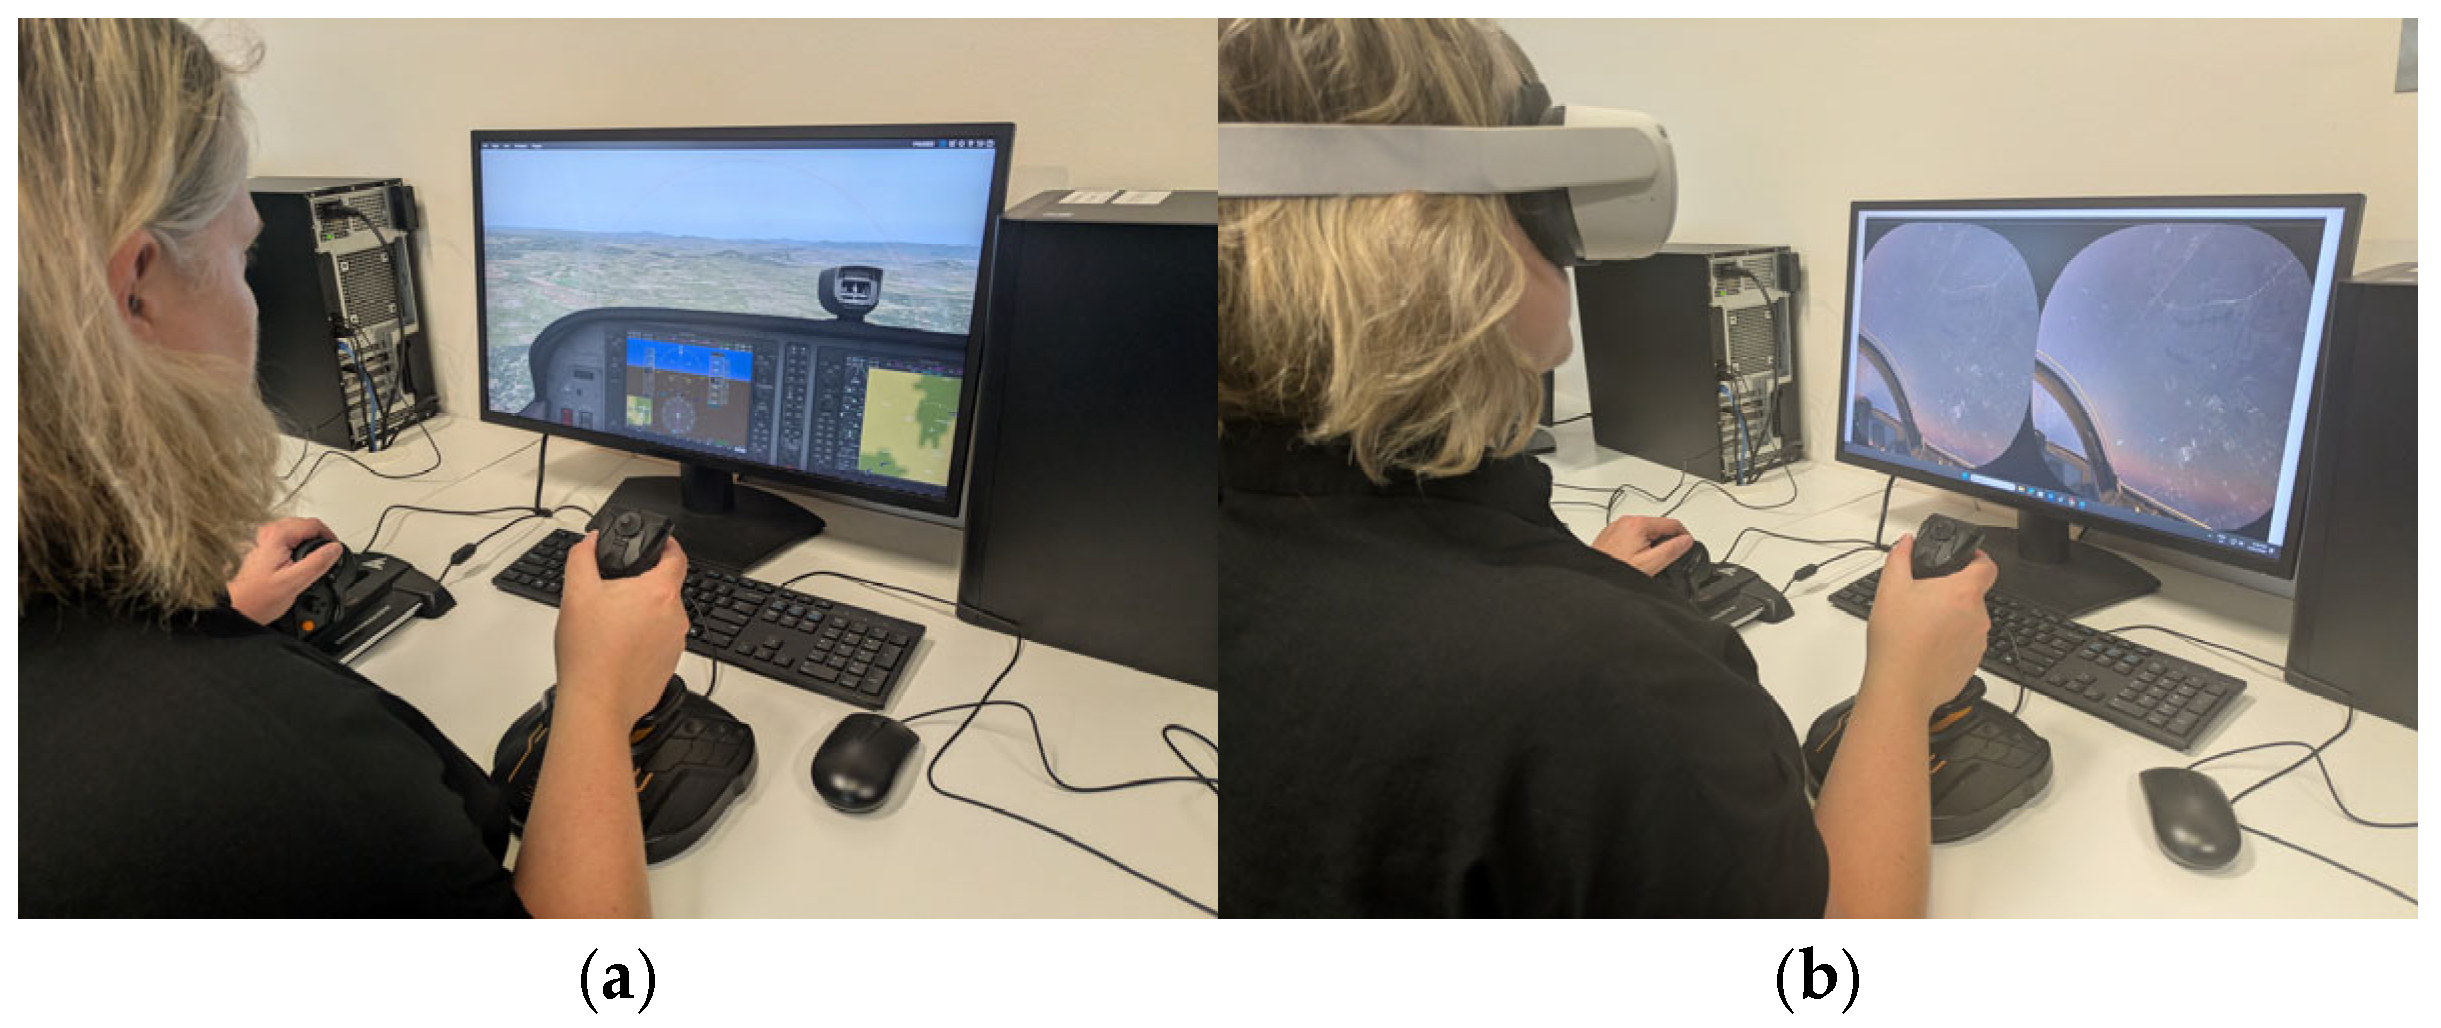
For both the PCATD and the VR Simulator—which was the same type of PCATD with the visual systems constituted by a VR-HMD, as shown in Figure 2 and Figure 3—the computer used the Windows 11 operating system. The hardware of the computer tower used an Intel i7 (2.5 GHz) CPU, a Nvidia RTX3060 (16 GB) GPU, and 16 GB of DDR4 RAM. The visual system for the PCATD, which was used for testing before and after intervention, was a 27″ flatscreen computer monitor with a resolution of 1920 × 1080p and a refresh rate of 60 Hz. The visual system for the VR Simulator, which was used only for the intervention (i.e., the training), was a Meta (Menlo Park, CA, USA) Quest 2. The Meta Quest 2 is a lightweight (~0.5 kg) VR-HMD with a 1832 × 1920p resolution screen for each eye, and a maximum refresh rate of 90 Hz [25]. The operating system of the headset (version: v61) was relatively recent at the time the activity took place. The delay between a user’s physical movement and the updating of imagery displayed within the headset, known as motion-to-photon (MTP) latency, is comparatively low in the Meta Quest 2 device [26]. The latency of this device, which is in the low tens of milliseconds, is unlikely to materially interfere with the instrument-scan performance that is the core of the simulated task. Despite the satisfactory latency, which is comparable to other contemporary devices, this remains an inherent technical limitation.
Figure 2.
Block diagram of VR and conventional simulator setup.
Figure 3.
Physical experimental setup: (a) Conventional PCATD configuration with flat-panel visual display. (b) PCATD configuration using a low-cost VR head-mounted display (VR-HMD) as the visual system.
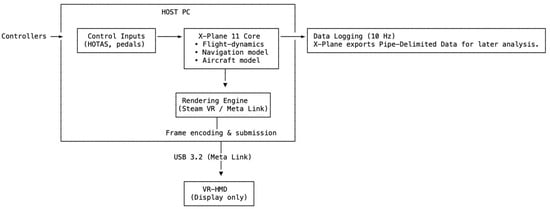
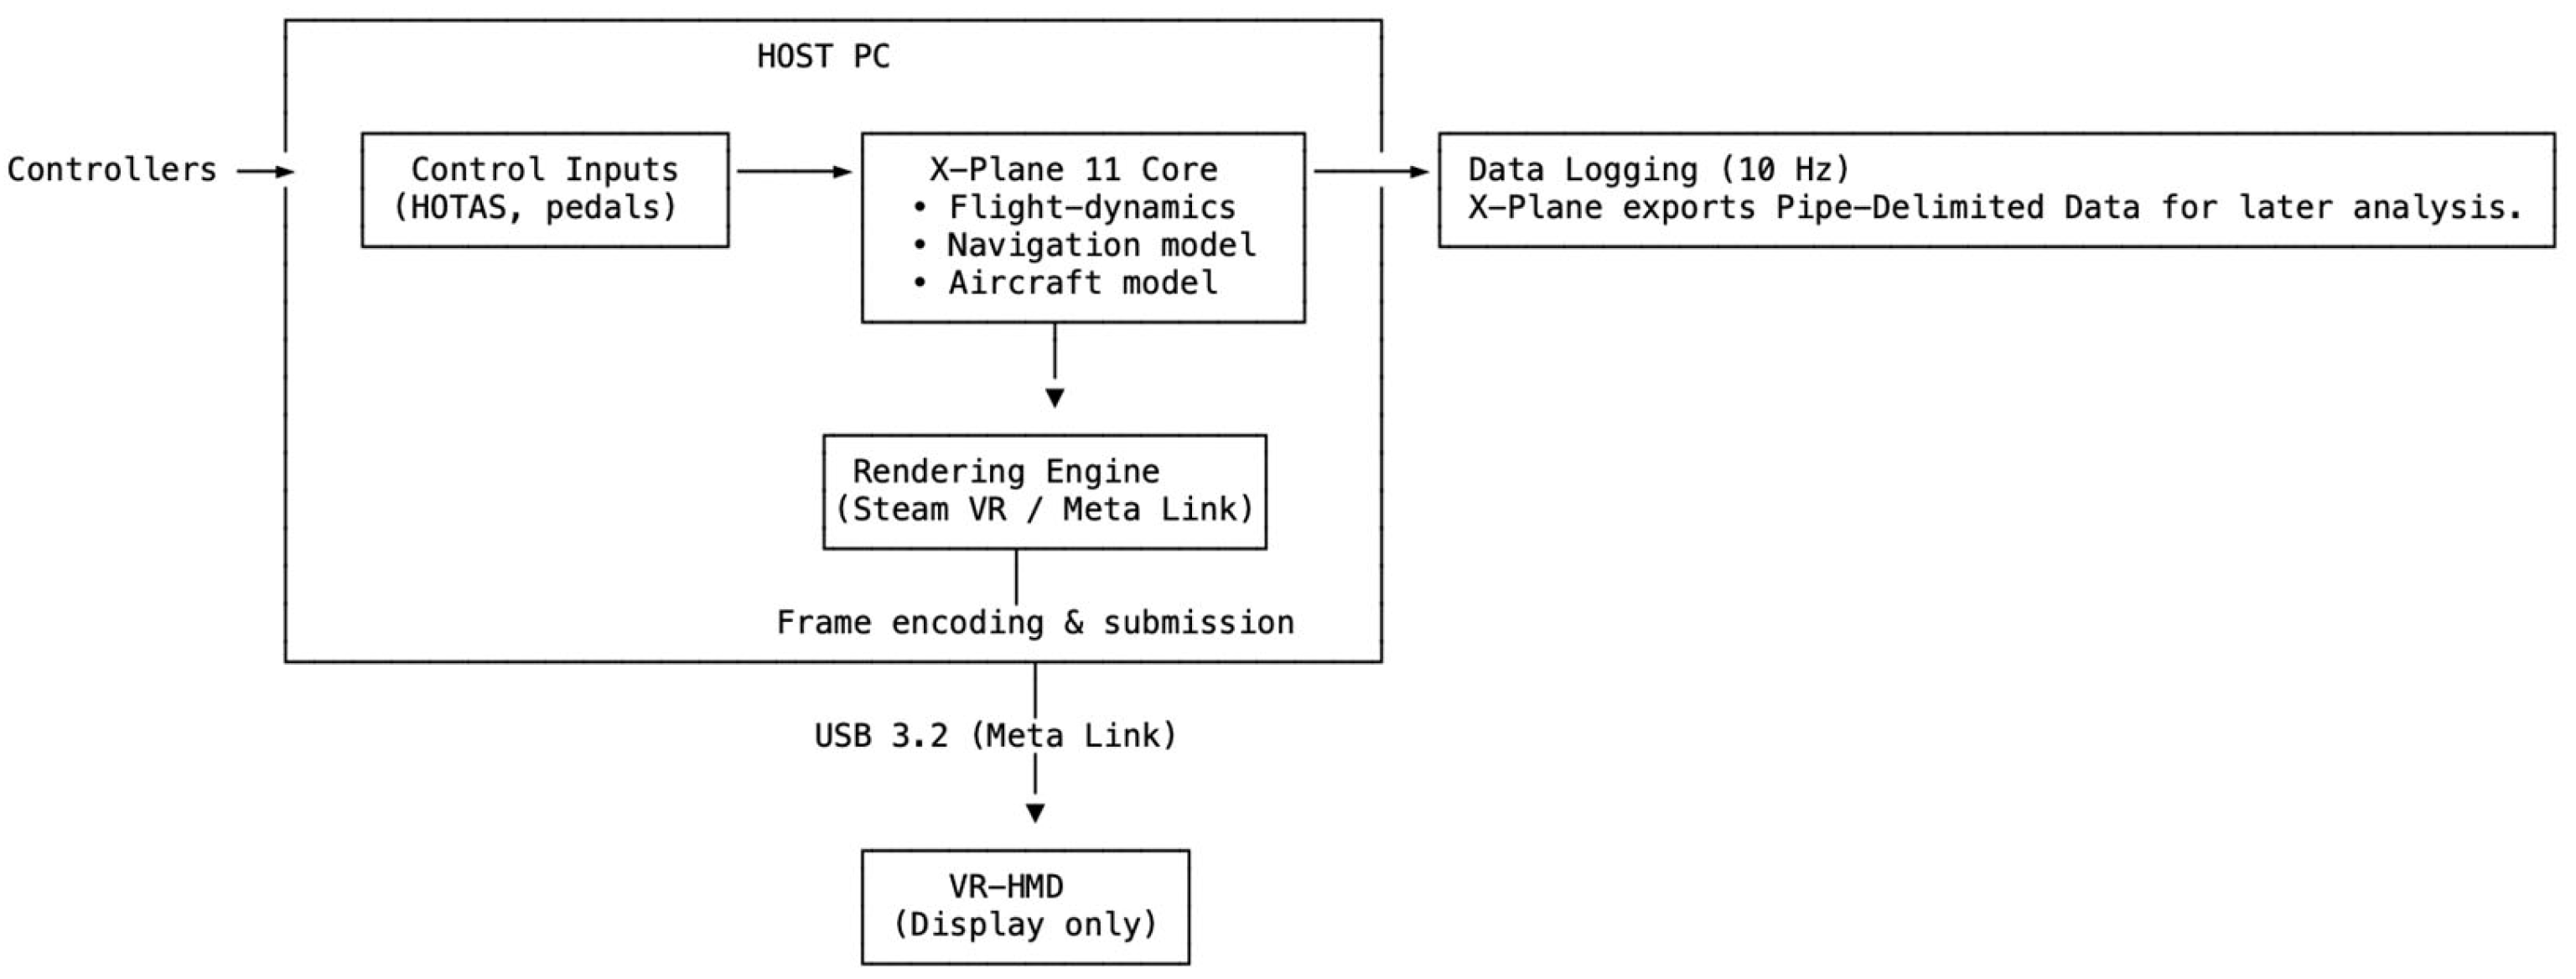
Connection between the VR-HMD and PCATD, for the VR Simulator only, was via a supported USB cable (USB3.2 gen one) [27]. The Laminar Research (Columbia, SC, USA) X-Plane 11 flight simulator software [28] was used, with all graphical settings at medium. Due to the limitations of on-headset rendering, this setup relies on the generation of imagery on the host PC prior to transmission to the VR-HMD. Such a rendering pipeline, necessarily, introduces the potential for additional delays, as frames generated on the host PC are transmitted to the VR-HMD via the Link protocols, as shown schematically in Figure 4. As both this system and the activity in its entirety were not originally designed for research, no direct measures of the specific latency of the pipeline were made. Similarly, the motion-to-photon latency of the headset itself was not directly assessed during the activity.
Figure 4.
System architecture of the VR-equipped PCATD configuration.
The built-in model of the Cessna 172, with a Garmin G1000-style flightdeck, was used for the aircraft. The data from the flight simulator were recorded at 10 Hz. Identical controllers—specifically, the Thrustmaster (Hillsboro, OR, USA) T.16000 HCS HOTAS [29]—were used for both simulators. The control inputs (i.e., the yoke, throttle, and rudder) were processed directly by the X-Plane 11 software (Version 11.20), and thus they were unaffected by the VR pipeline. The VR-HMD served solely as the visual system for the simulator; all flight-dynamics computations were natively handled by X-Plane on the host PC.
All participants were initially briefed to discontinue use of the simulator(s) if they experienced discomfort during use. The instrument flight task to be flown, for both intervention and testing, was the latter part of an Instrument-Landing System (ILS) approach to the required position for the landing sequence to commence, known as the “minima”. The ILS(Z) for runway 35 at Canberra International Airport (ICAO: YSCB) was selected, with the approach to be based upon charts (approach plates) that were recent at the time of the activity. The specific approach was selected both due to its contextual relevance to the participants and because it is representative of a standard, procedurally well-defined instrument task. The glideslope for this approach is 3 degrees, with a signal span of approximately 0.7 degrees above and below path. The localiser for this approach is aligned to a heading of 348 degrees, with a signal span of approximately 2.5 degrees either side of centreline, and set to 210 m wide at threshold [30]. The glideslope and localiser originate at the runway 35 threshold, are collocated with the DME (ICB), and are not supported by the use of radio marker beacons. The theoretically perfect approach path would show no deflection, above or below, right or left, on the associate in-cockpit instrumentation. The requirement in Australia, and indeed most nations, is that the aircraft is to be flown such that the provided azimuth guidance instrumentation and the provided glideslope instrumentation do not exceed half the full scale of deflection representable—half-scale deflection [31]. Under operational conditions, exceeding this tolerance requires that the pilots initiate a missed approach. However, participants were instructed to attempt to restore the aircraft to within the acceptable tolerance. Further, the speed restrictions that would otherwise apply to a Category A aircraft [31], such as the Cessna 172, were not enforced. The pilots’ rule of thumb that the required rate of descent (RoD) is the ground speed multiplied by five, for a three-degree descent, was given. The decision altitude (height) for the approach was, for the purpose of the activity, 2170 ft (301 ft). Upon reaching the decision altitude, the simulation was paused, as it was considered that the landing would be more difficult in the simulated conditions.
In order that the participants need not make intercept of the localizer, and subsequently initiate the descent on glideslope, the simulation started with the aircraft on both glideslope and centreline. No requirements for the various approach checks were imposed. Prior to completing the approach (i.e., the activity), all participants received a three-hour technical briefing on the operational principles of the ILS, including the enabling technology, glideslope and localiser geometry, and the operational aspects of the use of the system. For the VR activity, each participant flew a single ILS approach, with the task lasting approximately five minutes, subject to speed management during the approach. Participants received written instructions only; no coaching, prompting, or verbal guidance on the approach occurred during the task, and no additional attempts were subsequently permitted. This single-exposure training dose is appropriate to the separate-sample pretest–posttest design employed.
For the purpose of evaluating the change in performance attributable to the VR Simulator intervention, the provided pretest and posttest flight simulator data, which included glideslope and localiser instrument deflection, were used to calculate two performance metrics—one metric representing an operationally relevant performance characteristic, and one metric based upon the established flight-training academic literature. From an operational perspective, the ability to fly to the instrument minima without exceeding the limits of instrument deflection—which would require the premature execution of the published missed approach—is of paramount importance. Therefore, the percentage of the approach completed without exceeding the half-scale deflection was calculated based upon the instrument deflection data—this being the percentage to missed (PtM). A PtM of 100% indicates that the participant reached the DA having maintained within half-scale deflection on both instruments. Any value under 100% for the PtM represents an operationally consequential failure in the piloting of the aircraft. Notably, these deflection data represent half-scale deflection as the range of −1 through to 1 for the localiser, and they separately represent half-scale deflection as the range of −1 through to 1 for the glideslope. The maximum deflection for both instruments is −2 through 2, and the maximum deflection recorded in the data is −2.5 through 2.5. Based upon this same deflection data, the combined absolute value of the deflection from the glideslope and centreline, at each point along the approach, was used to calculate the combined deflection by use of basic Pythagorean theorem. This combined deflection was, necessarily, limited to a maximum value of 3.54 at each point along the approach. By treating zero as the ideal deflection at each point along the approach, the combined deflection could be used to calculate the root mean-squared error (RMSE) of the approach path. That is
where yi represents the absolute displacement at each recorded point on the approach (per the earlier calculation); ŷi represents the ideal deflection from the glide slope and centreline (i.e., zero at all points); and n represents the total number of observations, which is the total number of recorded points in the data for each participant. Thus, RMSE reflects how far the aircraft’s combined path deviates from the ideal path along the ILS centreline and glideslope over the entire descent; lower RMSE values are therefore indicative of a more stable and accurate approach. RMSE is frequently used in the research literature to quantify pilot performance [32], including instrument flying and ILS performance [33].
For the present research, the null hypothesis (H0) was that there would be no significant difference in participants’ performance, on either of the two metrics (i.e., PtM and RMSE), between the pretest and the posttest. That is to say, no transfer (or quasi-transfer) of required skills will have resulted from the use of the low-cost VR Simulator. By contrast, the alternate hypothesis (H1) was that the posttest PtM or RMSE, or both, would be different to the pretest, indicating changed instrument flight performance. Therefore, the null hypothesis is
where the changes in the mean of the PtM and the RMSE are, respectively, Δμ,PtM and Δμ,RMSE. And the alternate hypothesis is
where the posttest means of the PtM or the RMSE, or both, are significantly different from the pretest. That is, exposure to the VR Simulator intervention will have changed the flight performance. Note that the change in performance may be positive (i.e., performance is better) or negative (i.e., performance is worse), and therefore positive or negative transfer would have occurred.
H0: Δμ,PtM = 0 and Δμ,RMSE = 0
H1: Δμ,PtM ≠ 0 or Δμ,RMSE ≠ 0
Prior to conducting statistical testing, which would necessarily have always used some variant of independent t-test, data were tested to confirm normality of distributions and homogeneity of variances. Some of the statistical analysis methods described here for normality and homogeneity were necessarily sourced based on the analysis; hence, some discussion of data outcomes is disclosed here to show the key transformation and analysis methods used for each of the two performance metrics. These tests, along with full test statistics and p-values, are provided in Section 3. Distributional assumption test results, transformation results, and transformation outcomes are reported alongside the results for each metric, as the analytical decisions and their implications differ between the PtM and the RMSE.
The distributional assumptions for the PtM data were checked using the Shapiro–Wilk test. Upon identification of non-normality in the data, the equality of variances for the PtM metric was tested by the Brown–Forsythe test [34,35]. The PtM metric was found to be homoscedastic. With the intent of using the parametric variant of the independent t-test, which is more readily comparable with previous simulator research, the PtM data were transformed by use of the Box–Cox transformation—a data transformation suitable for stabilising variance and approximating normality, and that is well suited to ratio-scale data that are strictly non-negative, such as the PtM data [36]. The Box–Cox-transformed PtM data were retested with the Shapiro–Wilk test and found to still be non-normally distributed, and they were again tested with the Brown–Forsythe test and found to still be homoscedastic. These results show that the PtM transformation was unsuccessful, and, as such, a non-parametric statistical test was required for the PtM data. The raw PtM values were therefore used for the analysis.
The distributional assumptions for the RMSE data were also checked using the Shapiro–Wilk test. Upon identification of non-normality in the data, the equality of variances for the RMSE metric was tested by the Brown–Forsythe test, and the RMSE metric was found to be heteroscedastic. As with PtM, the RMSE data were transformed by use of the Box–Cox transformation. The Box–Cox-transformed RMSE (tRMSE) data were retested with the Shapiro–Wilk test and found to now be normally distributed, and they were tested with Levene’s test—Levene’s test being most suitable now that the data were normally distributed [35]—and found to be homoscedastic. In order to dimensionally align this second metric with the PtM, the tRMSE was then reverse-scored. That is, an increase in the PtM (i.e., a greater portion of the approach flown within tolerance) or in the reverse-scored tRMSE (i.e., a reduction in flight-path error) is indicative of better flight performance.
Following data extraction, cleaning, calculation, and assumption checking, the use of different tests for the two metrics was determined to be needed to check the difference in performance between the pretest and posttest. In order to check the difference in performance between the pretest and posttest for the PtM, the Mann–Whitney U test was employed. The U test does not assume homoskedasticity or normality of the distribution(s). The rank-biserial correlation coefficient (rrb) was calculated so as to determine direction and strength between the intervention and the change in performance ranks between the pretest and the posttest. The rrb is treated as an effect size, evaluated in the same manner as Pearson’s correlation [37]. The Hodges–Lehmann estimate () was calculated so as to measure the central tendency difference. In order to check the difference in performance between the pretest and the posttest for the tRMSE, the independent t-test was employed. The Hedges’ g effect size [38] was calculated so as to determine the mean difference between the pretest and the posttest, and thus the intervention effect. The relatively small sample size makes Hedges’ g more suitable than Cohen’s d [39].
The two tests, and the associated measures, in combination, assess the statistical significance and practical implications of the intervention. The nature of the trial that originated the data meant that a priori power calculations were not possible. No post hoc power calculations were performed, as such calculations provide no additional information not already provided by confidence intervals and, therefore, risk needless misinterpretations, as highlighted by Hoenig and Heisey [40].
3. Results
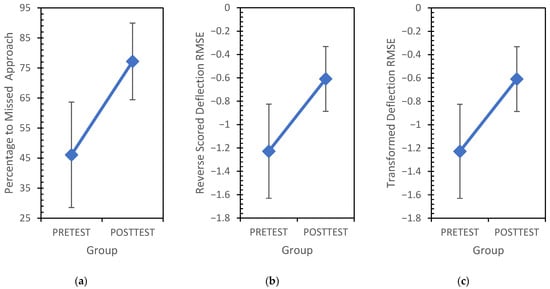
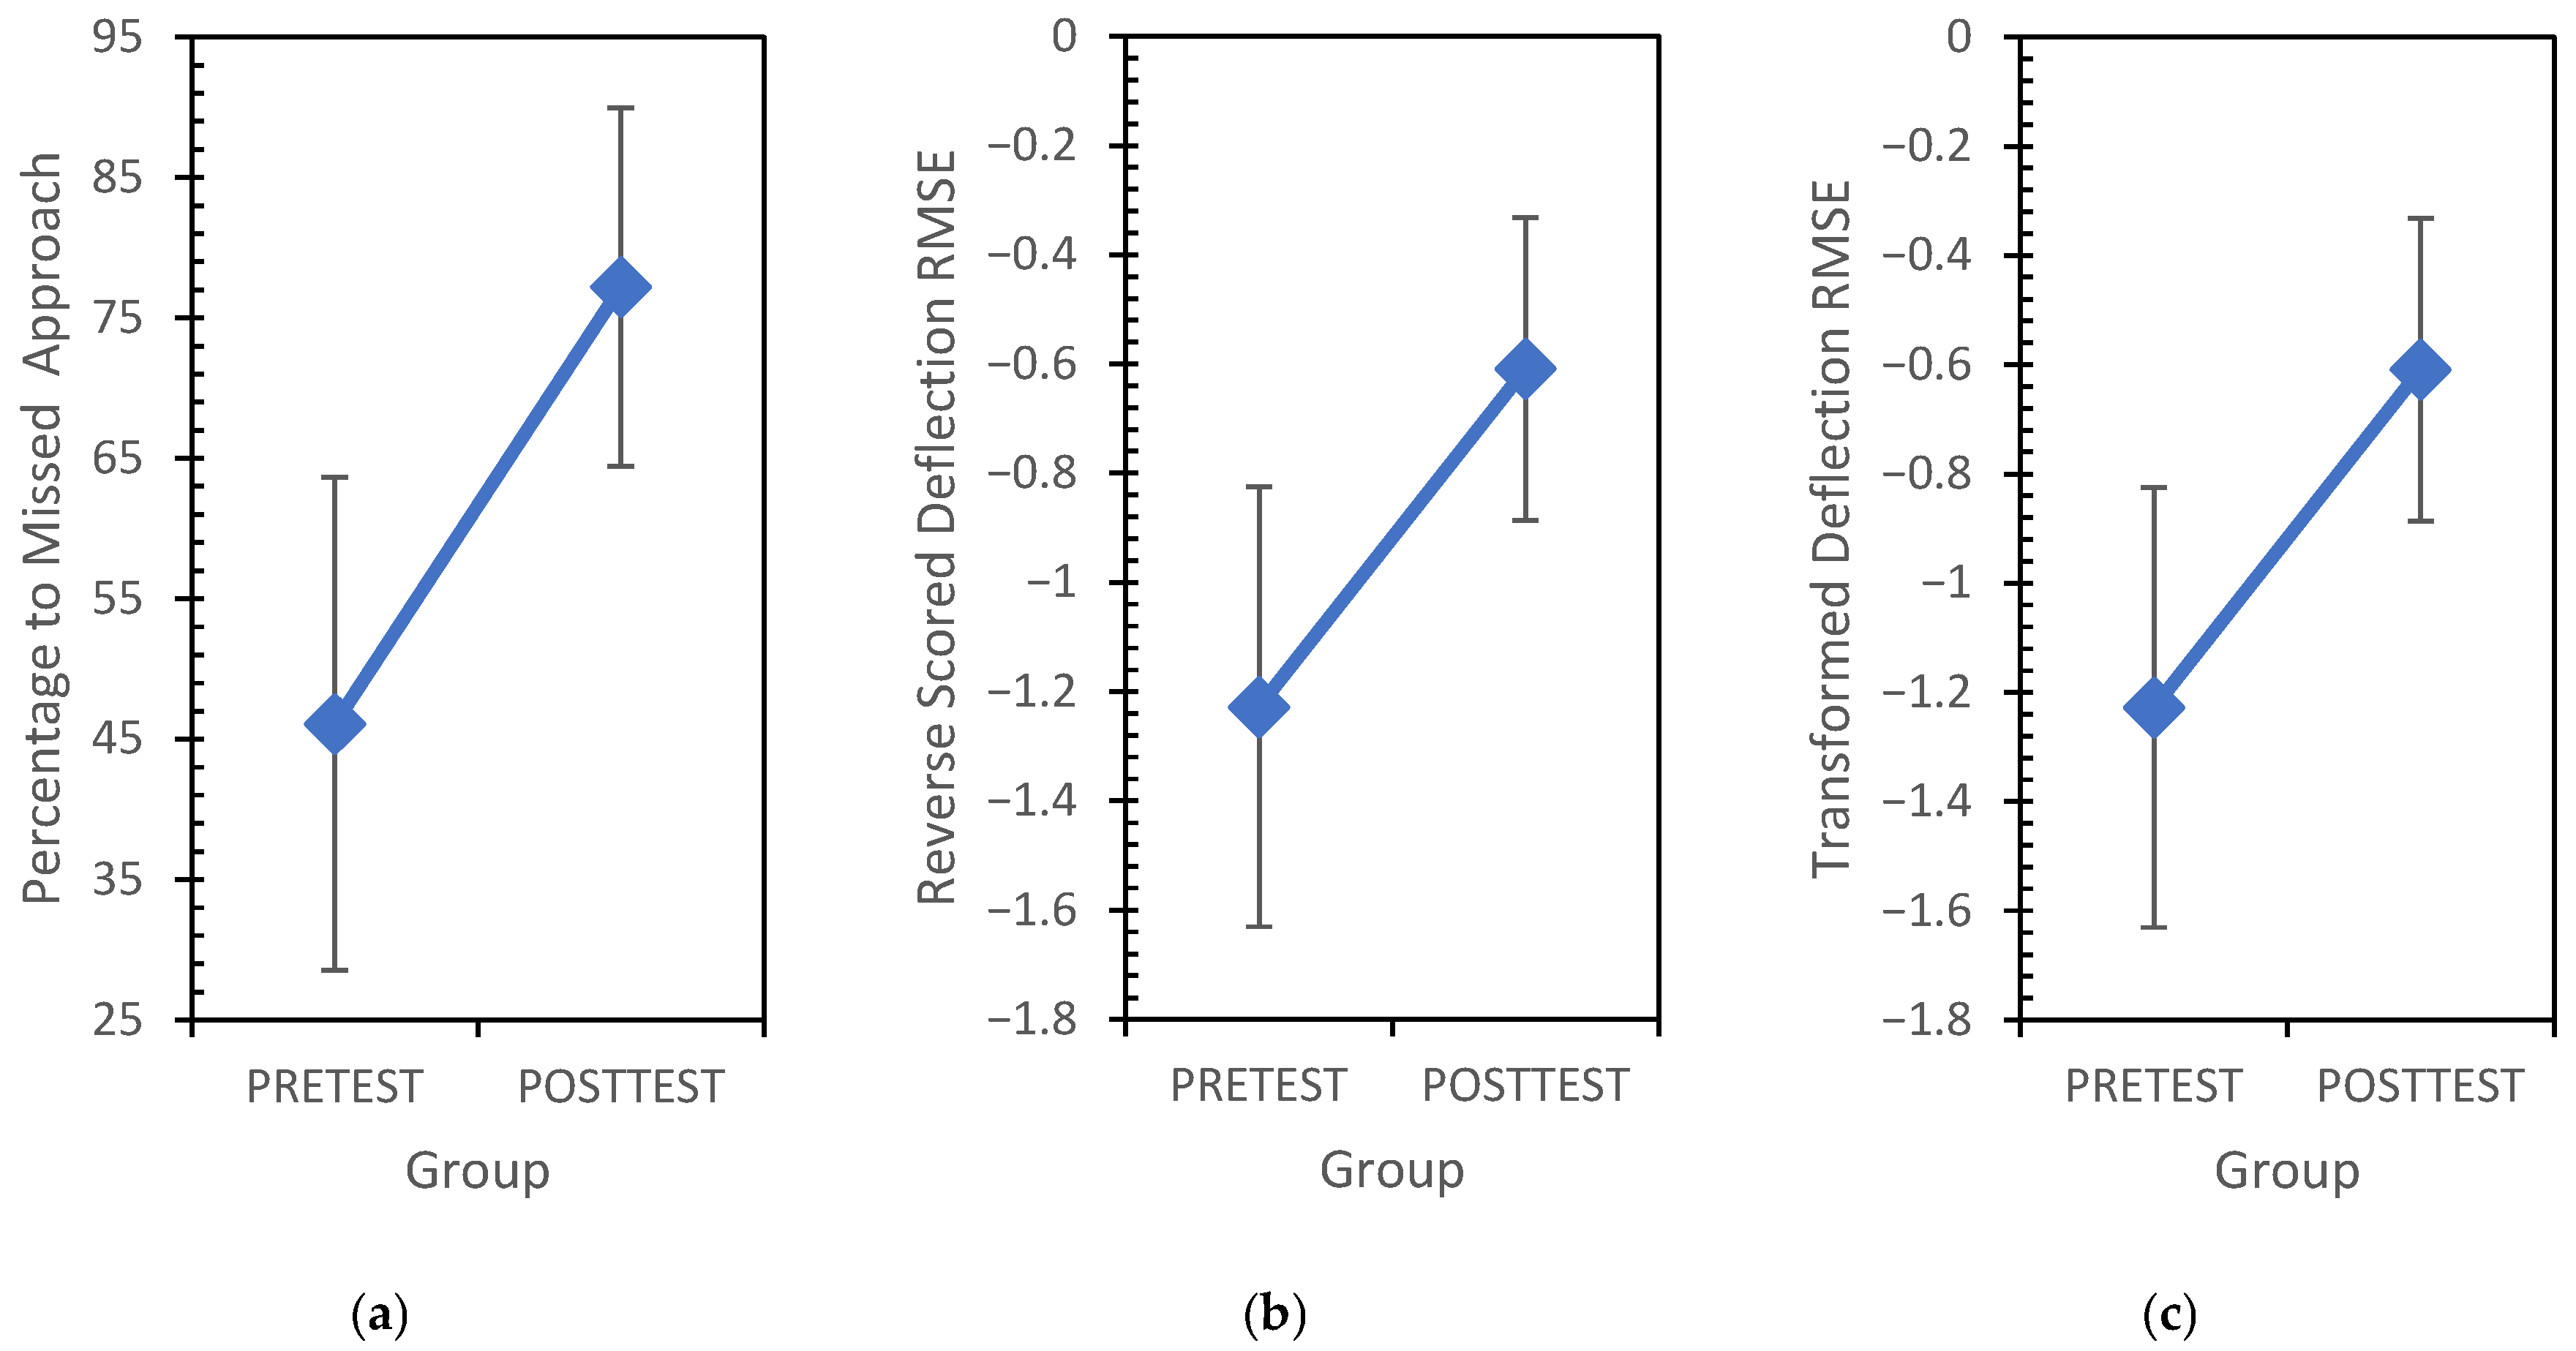
The PtM metric for the pretest group (M = 46.1%, SD = 39.6%, Md = 28.7%) and the posttest group (M = 77.2%, SD = 28.8%, Md = 100%), shown in Figure 5, required assumption checking prior to statistical testing. The Shapiro–Wilk test showed that for the PtM metric, both the pretest data (W = 0.810, p < 0.001) and the posttest data (W = 0.763, p < 0.001) were non-normally distributed. The Brown–Forsythe test (FBrown-Forsythe(1, 42) = 1.316, p = 0.258), which is best suited when data deviate from normality, showed homoskedasticity between the pretest and posttest data. The Box–Cox transformation was applied to the PtM data, having first determined the optimal lambda value (λ ≈ 0.703). Retesting the PtM data using the Shapiro–Wilk test showed that the pretest (W = 0.855, p = 0.004) and posttest data (W = 0.763, p < 0.001) still did not meet the assumption of normality. Retesting for the equality of variances using Brown–Forsythe (FBrown-Forsythe(1, 42) = 3.049, p = 0.088) showed that there was homoskedasticity. Transformation of the PtM data by the use of the Box–Cox transformation was unsuccessful. As such, statistical testing of the untransformed PtM proceeded using the Mann–Whitney U test, which is robust to violation of the assumptions of normality [41]. Figure 5 shows the PtM data for the pretest and posttest groups.
Figure 5.
(a) Performance metrics for pretest and posttest groups. (a) Percentage-to-missed approach (PtM), defined as the proportion of the ILS approach completed without exceeding half-scale deflection on either localiser or glideslope. (b) Box–Cox-transformed root mean-squared error (RMSE) of combined lateral and vertical deviation from the ideal ILS path. (c) Reverse-scored transformed RMSE, rescaled so that higher values indicate lower flight-path error and, thus, better performance. Error bars show 95% confidence intervals.
The RMSE metric for the pretest group (M = −1.22; SD = 0.908) and the posttest group (M = −0.609; SD = 0.625), shown in Figure 5, also required assumption checking prior to statistical testing. The Shapiro–Wilk test showed that for the RMSE metric, both the pretest data (W = 0.903, p = 0.034) and the posttest data (W = 0.745, p < 0.001) were non-normally distributed. The Brown–Forsythe test (FBrown-Forsythe(1, 42) = 5.567, p = 0.023) showed heteroskedasticity between the pretest and posttest data. The Box–Cox transformation was applied to the RMSE data after first determining the optimal lambda value (λ ≈ −0.003). Retesting of the RMSE data using the Shapiro–Wilk test showed that the pretest (W = 0.941, p = 0.205) and posttest data (W = 0.948, p = 0.286) were now normally distributed. Retesting for the equality of variances using Levene’s test (FLevene(1, 42) = 0.145, p = 0.705), as the data were now normally distributed, showed homoskedasticity. Transformation of the RMSE by the use of the Box–Cox transformation was successful. As such, statistical testing of the reverse-scored tRMSE (Mpretest = 0.132, SDpretest = 0.913; Mposttest = 0.922, SDposttest = 0.926) proceeded using the parametric variant of the independent t-test.
The results of the Mann–Whitney U test (W = 365, p < 0.003) for the PtM, shown in Table 1, comparing pretest and posttest groups’ performance, indicates that the VR Simulator training (i.e., the intervention) changed flight performance significantly. The Hodges–Lehmann estimate (HL = 28.812) indicates that the change in the flight performance between pretest and posttest was an improvement. The change in performance, as shown in Figure 5, suggests that the intervention was effective. The Glass rank-biserial correlation (rrb = 0.508, 95% CI [0.21, 0.72]), herein treated as the effect size, indicates a large positive effect on flight performance. The significant U test, the change in the central tendency, and the positive effect size require that the null hypothesis (H0) be rejected.
Table 1.
Mann–Whitney U-test results for PtM performance between pretest and posttest groups.
The results of the Independent Samples t-test (t(42) = 2.852, p = 0.006), shown in Table 2, comparing the separate pretest and posttest groups’ transformed RMSE, also indicate that the VR intervention changed flight performance significantly. The mean difference of 0.791 (95% CI [0.231, 1.350]), though not directly interpretable due to the data transformation, suggests that the VR intervention reduced the distance between the approach paths flown and the ideal approach centreline for the posttest group, thereby improving their flight performance. The Hedges’ g effect size, between pretest and posttest, indicates a positive transfer for the RMSE metric (g = 0.844, 95% CI [0.222, 1.458]). This effect size would indicate a large training effect, as per the convention set by Cohen [42]. The significant t-test, the mean difference, and the positive Hedge’s g effect size again require that the null hypothesis (H0) be rejected. The results of the two statistical tests support the alternate hypothesis (H1) that the posttest means of the PtM and the RMSE are statistically significantly different from that of the pretest.
Table 2.
Independent t-test results for transformed RMSE performance between pretest and posttest groups.
4. Discussion
The use of flight simulators, including VR flight simulators, for the training of instrument flying skills requires accurate evaluation of their effectiveness in transferring those skills. The evaluation of the VR simulator in this way is of particular importance, given the conventional devices it is likely to displace, as well as the widespread intention to make such use of the technology. The percentage-to-missed approach (PtM), representing an operationally relevant metric, and the root mean-squared error (RMSE) of the approach path relative to the ideal approach centreline, representing a synthetic but valid measure of approach accuracy, were both statistically significantly improved by the VR training intervention. The PtM data, which are interpretable in the tested form, showed a statistically significant improvement between the pretest and the posttest—an increase from a pretest mean of 46.1% to a posttest mean of 77.2%. The nature of the data having required the use of a non-parametric test, a review of the group medians—28.7% for the pretest and 100% for the posttest—demonstrates the dramatic improvement. The posttest group most often completed the entire ILS approach, and even those participants who did exceed the acceptable instrument tolerance did so further down the approach. The RMSE data, which are best interpreted before transformation and reverse scoring, showed an increase in the accuracy with which the approach was flown after the training—a reduction in combined instrument deflection from a pretest mean of 1.22 to a posttest mean of 0.609. In practical terms, the posttest group maintained closer to the centreline of the localizer and the three-degree ILS glideslope. These results, in combination, as well as the large positive effect size (g = 0.844, 95% CI [0.222, 1.458]) for the RMSE, suggest that the VR intervention was associated with improved ILS performance in the aircraft analogue (i.e., the flatscreen-equipped PCATD), likely indicating a positive transfer of training. The use of the VR simulator, which will most likely first be adopted in place of the conventional PCATD, appears, within the limitations of this quasi-experimental design, to be promising for training the ILS approach in instrument flight conditions. The inherent immersion of virtual reality, which is the closest of the xR spectrum technologies to full virtuality [43], whilst not integral to instrument flying training, is not detrimental to it either. For the training of instrument flight, the computer-generated three-dimensional cockpit and its instrumentation are produced, while the external view is simply rendered as cloud; the understanding of visuospatial relationships made possible by VR is irrelevant under these conditions. It is, however, conceivable, though this is wholly speculative, that the immersion that was achieved in VR served to also isolate the participant in the training. That is, the computer-generated three-dimensional cockpit did not distract from the flight instruments that were the focus, while that same generated scene prevented the distractions of the real world. Portability and dematerialisation—often justification in and of themselves [44]—in combination with the ever-increasing power of mobile computing, may soon make the VR simulator yet more viable. Given the lack of need for further rendering of the external view from the cockpit for instrument flying, it is likely that such simulation will be possible without the use of an external computer. Regardless, the current iteration of PCATD-tethered VR simulator is presently suitable for this kind of instrument flying training, as well as the various applications that other research have proven [15,45,46,47,48].
The results of the present research must be examined in proper consideration of the framework and design employed, and the associated limitations. Most consequentially, the present research framing—quasi-transfer of training—is more usually based upon training to the required standard followed by testing, rather than a set number of approaches (i.e., one in this research). However, the median PtM of 100% would seem to indicate that the conventional approach was not needed to achieve the measured standard. Some recent research has made use of a very similar “set time approach” for quasi-transfer of training [49,50], but this literature was, like much of the xR literature [9], focused on visual flying. The design of this research—the quasi-experimental, separate–sample pretest–posttest design—though common in medical education research [49,50], has only recently started to be used in aviation education research [15,48]. The use of this design for the present research was necessary due to the origins and structure of the available data. Though the design is not without sources of invalidity, its use, in place of a one-shot case study, which would be the most obvious design in such circumstances, results in fewer such sources. External sources of invalidity are not generally an issue for this design [22]. However, the interaction of selection on X, when combined with the quasi-transfer framework, has, in this research particularly, the potential to overstate the effect generalisable to the population. The participants who undertook the originating learning activity were enrolled in undergraduate studies at a well-regarded university. The portion of those with tertiary qualification working as aviation professionals [51] would seem to indicate that the sample was, at least somewhat, representative of the population. However, if these participants were performing better than the general population of those enrolled in flight training, this could compound the tendency of quasi-transfer research to overstate the true transfer achievable [52].
The sources of internal validity inherent in the separate-sample pretest–posttest—history, maturation, instrumentation, and mortality [22]—are partially or fully addressed as an incidental result of the learning activity that originated the data. The risk of intervening events between pretest and posttest (i.e., history) was minimised by the simultaneous conduct of pretest and posttest. Had some known or unknown event occurred, the groups would have been affected equally after said event. Maturation, which could involve the aging of participants or their growing more hungry and tired, is unlikely to introduce issues, given the short period of the educational activity (i.e., ~30 min). As the instructions given were written, and the data from which the scores were derived, as well as the scores themselves, are wholly objective, this reduces the risk from instrumentation. The initial instruction to participants about ceasing use of the simulators if they experienced simulator sickness, and the literature regarding experiences of simulator sickness in VR flight simulators [53,54], surprisingly did not result in experimental mortality. Additionally, given the use of the same task for assessment and training, the posttest group had nearly twice the experience of the pretest group toward the end of the tested instrument approach. As only that portion of the approach that the participant would otherwise have already flown within instrument tolerance, as a result of skills transferred during intervention, would be available for further learning, this is unlikely to have biased the results. That is, if the intervention were ineffective, despite the fact that RMSE could continue to be practised for the whole of the approach, the first departure from instrument tolerance represents the end of the learning representable by the PtM. This sort of learning would, of course, also occur during real-world training in the aircraft.
Notwithstanding the positive training effect shown herein and elsewhere, the VR flight simulation literature—and the xR flight-training literature more broadly—has yet to reach the quality and depth of that for conventional flight simulators [7]. This research has examined the effectiveness of only one of many instrument approaches and does not thoroughly address the broader instrument flying skills required by pilots. Regarding the likely adoption of this technology for this purpose, future researchers should consider and investigate the full range of associated skills—preferably in line with the existing codification. In particular, the potential for training circling approaches at the end of instrument approaches holds promise. Circling approaches would be especially suited to VR, due to the need to maintain constant visual contact with the aerodrome surface in reduced visibility conditions, while remaining within a specified distance of that surface. Given the truncation of the visual field required when using a two-dimensional display [55], conducting this type of training is challenging. Even so, the present research advances the adoption of VR simulators for instrument flight training.
5. Conclusions
This research tentatively supports the use of a VR simulator as the visual system for a PCATD, demonstrating its effectiveness as a tool for training instrument-flying skills, specifically for conducting the ILS after establishment on approach. Between pretest and posttest, both the operational (i.e., PtM) and the synthetic (i.e., RMSE) metrics demonstrated statistically significant improvements. Within the constraints of the quasi-randomised separate-sample pretest–posttest design, the answer to the question, “Does using a low-cost virtual reality headset as the visual system for a Personal-Computer Aviation-Training Device (PCATD) support positive transfer of skills required for accurately flying the Instrument-Landing System (ILS), based on an operational and a synthetic metric?” is, therefore, yes. Although the inherent immersion of VR cannot be shown to have been the reason for the effectiveness of the VR simulator, it did not negatively affect the training outcome. That the VR simulator appears effective for this purpose, and that the costs and power of the technology will continue to improve suggest that wider adoption for this purpose is—or will be—viable. The replacement of PCATD with VR simulators is, based upon current evidence, and with due consideration of the limitations, potentially viable for this purpose. Uptake of VR simulators, as an adjunct to, or a replacement of existing and future PCATD, ought to be performed in consideration of the noted limitations.
Author Contributions
Conceptualisation, A.S. and G.W.; methodology, A.S.; validation, A.S., G.W. and K.J.; formal analysis, A.S. and G.W.; investigation, A.S. and G.W.; resources, G.W.; data curation, A.S.; writing—original draft preparation, A.S.; writing—review and editing, A.S., G.W. and K.J.; visualisation, A.S. and G.W.; supervision, G.W. and K.J.; project administration, G.W. All authors have read and agreed to the published version of the manuscript.
Funding
This research received no external funding.
Institutional Review Board Statement
This study was conducted in accordance with approval from the Human Research Advisory Panel of the University of New South Wales (Approval HC220421 on the 31 August 2022).
Informed Consent Statement
Participant consent was waived by the Human Research Advisory Panel of the University of New South Wales, as the data and the task upon which this research was based were part of, and originally solely for the purpose of, an undergraduate laboratory course. All data were deidentified prior to provision to the researchers.
Data Availability Statement
The datasets presented in this article are not readily available because of restrictions on their distribution to parties external to the original research, as imposed by the ethics approval. Requests to access the datasets should be directed in the first instance to the corresponding author.
Conflicts of Interest
The authors declare no conflicts of interest.
Abbreviations
The following abbreviations are used in this manuscript:
| BIF | basic instrument flight |
| DA | decision altitude |
| DME | distance-measuring equipment |
| FTD | flight-training device |
| ILS | Instrument-Landing System |
| IMCs | instrument meteorological conditions |
| PCATD | Personal-Computer Aviation-Training Device |
| PtM | percentage-to-missed approach |
| RMSE | root mean-squared error |
| tRMSE | transformed root mean-squared error |
| VR | virtual reality |
| VR-HMD | virtual reality head-mounted display |
| xR | extended reality |
References
- Beckman, W. A evaluation of the perceived effect of personal computer aviation training devices for instrument flight training. J. Aviat./Aerosp. Educ. Res. 2003, 12, 1. [Google Scholar] [CrossRef] [Scilit]
- Dennis, K.A.; Harris, D. Computer-based simulation as an adjunct to ab initio flight training. Int. J. Aviat. Psychol. 1998, 8, 261–276. [Google Scholar] [CrossRef] [Scilit]
- Turner, T.P. Instrument Flying Handbook; McGraw-Hill: New York, NY, USA, 2000. [Google Scholar]
- Lee, A.T. Flight Simulation: Virtual Environments in Aviation; Ashgate: Aldershot, UK, 2005. [Google Scholar]
- Aircraft Owners and Pilots Association. Instrument Rating. Available online: https://www.aopa.org/training-and-safety/active-pilots/ratings-and-endorsements/instrument-rating (accessed on 28 October 2024).
- Ayiei, A.; Murray, J.; Wild, G. Visual flight into instrument meteorological condition: A post accident analysis. Safety 2020, 6, 19. [Google Scholar] [CrossRef] [Scilit]
- Federal Register of Legislation (Australian Government). Civil Aviation Safety Regulations 1998; Federal Register of Legislation (Australian Government): Canberra, Australia, 1998.
- Estrada, A.; LeDuc, P.A.; Teri, L.C.W.; Rowe, J.; Stokes, E.G.; Crowley, J.S. A Comparison Study of Peripheral Vision-Restricting Devices Used for Instrument Training; Citeseer: University Park, PA, USA, 2005. [Google Scholar]
- Wild, G.; Nanyonga, A.; Iqbal, A.; Bano, S.; Somerville, A.; Pollock, L. Lightweight and mobile artificial intelligence and immersive technologies in aviation. Vis. Comput. Ind. Biomed. Art 2025, 8, 21. [Google Scholar] [CrossRef] [Scilit] [PubMed]
- Caserman, P.; Garcia-Agundez, A.; Gámez Zerban, A.; Göbel, S. Cybersickness in current-generation virtual reality head-mounted displays: Systematic review and outlook. Virtual Real. 2021, 25, 1153–1170. [Google Scholar] [CrossRef] [Scilit]
- Stanney, K.M.; Mourant, R.R.; Kennedy, R.S. Human factors issues in virtual environments: A review of the literature. Presence 1998, 7, 327–351. [Google Scholar] [CrossRef] [Scilit]
- AGARD. Fidelity of Simulation for Pilot Training; Advisory Group for Aerospace Research Development: Neuilly-sur-Seine, France, 1980. [Google Scholar]
- Myers, P.L., III; Starr, A.W.; Mullins, K. Flight simulator fidelity, training transfer, and the role of instructors in optimizing learning. Int. J. Aviat. Aeronaut. Aerosp. 2018, 5, 6. [Google Scholar] [CrossRef] [Scilit]
- Lawrynczyk, A. Exploring Virtual Reality Flight Training as a Viable Alternative to Traditional Simulator Flight Training. Master’s Thesis, Carleton University, Ottawa, ON, Canada, 2018. [Google Scholar]
- Somerville, A.; Lynar, T.; Joiner, K.; Wild, G. Enhancing Pilot ‘Mission’ Projection Through a Virtual Reality Flight Simulator: A Quasi-Transfer of Training Study. Preprints 2026, 2026010758. [Google Scholar] [CrossRef] [Scilit]
- Osgood, C.E. The similarity paradox in human learning: A resolution. Psychol. Rev. 1949, 56, 132–143. [Google Scholar] [CrossRef] [Scilit]
- Fussell, S.G. Determinants of Aviation Students’ Intentions to Use Virtual Reality for Flight Training. Doctoral Thesis, Embry-Riddle Aeronautical University, Ann Arbor, MI, USA, 2020. [Google Scholar]
- Berrezueta-Guzman, S.; Daya, R.; Wagner, S. Virtual reality in sign language education: Opportunities, challenges, and the road ahead. Front. Virtual Real. 2025, 6, 1625910. [Google Scholar] [CrossRef] [Scilit]
- Alaker, M.; Wynn, G.R.; Arulampalam, T. Virtual reality training in laparoscopic surgery: A systematic review & meta-analysis. Int. J. Surg. 2016, 29, 85–94. [Google Scholar] [CrossRef] [Scilit]
- Somerville, A.; Joiner, K.; Lynar, T.; Wild, G. Applications of extended reality in pilot flight simulator training: A systematic review with meta-analysis. Vis. Comput. Ind. Biomed. Art 2025, 8, 25. [Google Scholar] [CrossRef] [Scilit] [PubMed]
- Russ-Eft, D.; Hoover, A.L. Experimental and Quasi-Experimental Designs; Berrett-Koehler Publishers: Oakland, CA, USA, 2005; pp. 75–95. [Google Scholar]
- Campbell, D.T.; Stanley, J.C. Experimental and Quasi-Experimental Designs for Research; Ravenio Books: Dublin, Ireland, 2015. [Google Scholar]
- Ericsson, K.A.; Krampe, R.T.; Tesch-Römer, C. The role of deliberate practice in the acquisition of expert performance. Psychol. Rev. 1993, 100, 363. [Google Scholar] [CrossRef]
- Auer, S.; Gerken, J.; Reiterer, H.; Jetter, H.C. Comparison between virtual reality and physical flight simulators for cockpit familiarization. In Proceedings of the Mensch und Computer, Ingolstadt, Germany, 5–8 September 2021; pp. 378–392. [Google Scholar]
- Meta Platform Incorporated. Introducing Oculus Quest 2, the Next Generation of All-in-One VR. Available online: https://about.fb.com/news/2020/09/introducing-oculus-quest-2-the-next-generation-of-all-in-one-vr/ (accessed on 16 November 2021).
- Deveci, M.; Sarviluoma, J. Comprehensive latency testing for head-mounted displays. In Proceedings of the Optical Architectures for Displays and Sensing in Augmented, Virtual, and Mixed Reality (AR, VR, MR) VI, San Francisco, CA, USA, 27–28 January 2025; pp. 363–366. [Google Scholar]
- Meta Platform Incorporated. Requirements to Use the Meta Quest Link Cable. Available online: https://www.meta.com/en-gb/help/quest/articles/headsets-and-accessories/oculus-link/requirements-quest-link/ (accessed on 3 March 2023).
- X-Plane 11, Version 11.20; Computer Software; Laminar Research: Columbia, SC, USA, 2023.
- Guillemot Corporation S.A. THRUSTMASTER T.16000M FCS Hotas. Available online: https://www.thrustmaster.com/products/t-16000m-fcs-hotas/ (accessed on 10 February 2023).
- Civil Aviation Authority. Operational Notes of Instrument Landing System: Reproduction of a booklet Originally Published by the Department of Aviation; Civil Aviation Safety Authority: Canberra, Australia, 2005.
- Airservice Australia. Aeronautical Information Publication (AIP) Book; Airservice Australia: Canberra, Australia, 2024. [Google Scholar]
- Lounis, C.; Peysakhovich, V.; Causse, M. Visual scanning strategies in the cockpit are modulated by pilots’ expertise: A flight simulator study. PLoS ONE 2021, 16, e0247061. [Google Scholar] [CrossRef] [Scilit] [PubMed]
- Haslbeck, A.; Kirchner, P.; Schubert, E.; Bengler, K. A flight simulator study to evaluate manual flying skills of airline pilots. In Proceedings of the Human Factors and Ergonomics Society Annual Meeting, Chicago, IL, USA, 27–31 October 2014; pp. 11–15. [Google Scholar]
- Li, X.; Qiu, W.; Morrow, J.; DeMeo, D.L.; Weiss, S.T.; Fu, Y.; Wang, X. A comparative study of tests for homogeneity of variances with application to DNA methylation data. PLoS ONE 2015, 10, e0145295. [Google Scholar] [CrossRef] [Scilit]
- Brown, M.B.; Forsythe, A.B. Robust tests for the equality of variances. J. Am. Stat. Assoc. 1974, 69, 364–367. [Google Scholar] [CrossRef]
- Sakia, R.M. The Box-Cox transformation technique: A review. J. R. Stat. Soc. Ser. D Stat. 1992, 41, 169–178. [Google Scholar] [CrossRef] [Scilit]
- Goss-Sampson, M. Statistical Analysis in JASP: A Guide for Students; JASP: Tokyo, Japan, 2019. [Google Scholar]
- Hedges, L.V. Statistical Methods for Meta-Analysis; Academic Press: Orlando, FL, USA, 1985. [Google Scholar]
- Hoyt, W.T.; Del Re, A. Effect size calculation in meta-analyses of psychotherapy outcome research. Psychother. Res. 2018, 28, 379–388. [Google Scholar] [CrossRef] [Scilit]
- Hoenig, J.M.; Heisey, D.M. The abuse of power: The pervasive fallacy of power calculations for data analysis. Am. Stat. 2001, 55, 19–24. [Google Scholar] [CrossRef] [Scilit]
- Zimmerman, D.W. Comparative Power of Student T Test and Mann-Whitney U Test for Unequal Sample Sizes and Variances. J. Exp. Educ. 1987, 55, 171–174. [Google Scholar] [CrossRef] [Scilit]
- Cohen, J. Statistical Power Analysis for the Behavioral Sciences; Routledge: London, UK, 1988. [Google Scholar]
- Skarbez, R.; Smith, M.; Whitton, M.C. Revisiting Milgram and Kishino’s Reality-Virtuality Continuum. Front. Virtual Real. 2021, 2, 647997. [Google Scholar] [CrossRef] [Scilit]
- Herman, R.; Ardekani, S.A.; Ausubel, J.H. Dematerialization. Technol. Forecast. Soc. Change 1990, 38, 333–347. [Google Scholar]
- Redei, A. Applications and Evaluation of a Motion Flight Simulator. Ph.D. Thesis, University of Nevada, Reno, Reno, NV, USA, 2019. [Google Scholar]
- Zhang, T. Comparing Training Effects of Virtual Reality Flight Simulation to Conventional PC-Based Flight Simulation. Ph.D. Thesis, Embry-Riddle Aeronautical University, Daytona Beach, FL, USA, 2022. [Google Scholar]
- Hight, M.P.; Fussell, S.G.; Kurkchubasche, M.A.; Hummell, I.J. Effectiveness of Virtual Reality Simulations for Civilian, Ab Initio Pilot Training. J. Aviat./Aerosp. Educ. Res. 2022, 31, 1. [Google Scholar] [CrossRef] [Scilit]
- Somerville, A.; Lynar, T.; Joiner, K.; Wild, G. Virtual Reality Flight Simulation: A Quasi-Transfer of Training Study. Preprints 2026, 2026010964. [Google Scholar] [CrossRef] [Scilit]
- Markert, R.J.; O’Neill, S.C.; Bhatia, S.C. Using a quasi-experimental research design to assess knowledge in continuing medical education programs. J. Contin. Educ. Health Prof. 2003, 23, 157–161. [Google Scholar] [PubMed]
- AlFaris, E.; Naeem, N.; Irfan, F.; Qureshi, R.; Saad, H.; Al Sadhan, R.E.; Abdulghani, H.M.; Van der Vleuten, C. A one-day dental faculty workshop in writing multiple-choice questions: An impact evaluation. J. Dent. Educ. 2015, 79, 1305–1313. [Google Scholar]
- Osigbemeh, B.O.; Musa, I.; Danjuma, A. Assessment of the Impact of Human Factors and Safety Interventions on Air Transportation Management in North-west Nigeria. ATBU J. Sci. Technol. Educ. 2024, 12, 374–386. [Google Scholar]
- Tak, A.Y.; Ercan, I. Comprehensive Evaluation of Reference Values of Parametric and Non-Parametric Effect Size Methods for Two Independent Groups. Int. J. Stat. Med. Res. 2022, 11, 88–96. [Google Scholar]
- Chang, E.; Kim, H.T.; Yoo, B. Virtual reality sickness: A review of causes and measurements. Int. J. Hum.-Comput. Interact. 2020, 36, 1658–1682. [Google Scholar]
- Somerville, A.; Lynar, T.; Joiner, K.; Wild, G. Effect of Virtual Reality Flight Simulation on Simulator Sickness in ab initio Trainees. Multimodal Technol. Interact. 2024, 9, 24. [Google Scholar]
- Bradley, D.R.; Abelson, S.B. Desktop flight simulators: Simulation fidelity and pilot performance. Behav. Res. Methods Instrum. Comput. 1995, 27, 152–159. [Google Scholar] [CrossRef] [Scilit]

Disclaimer/Publisher’s Note: The statements, opinions and data contained in all publications are solely those of the individual author(s) and contributor(s) and not of MDPI and/or the editor(s). MDPI and/or the editor(s) disclaim responsibility for any injury to people or property resulting from any ideas, methods, instructions or products referred to in the content. |
© 2026 by the authors. Licensee MDPI, Basel, Switzerland. This article is an open access article distributed under the terms and conditions of the Creative Commons Attribution (CC BY) license.