


Abstract
Feature preprocessing directly shapes the geometry seen by distance- and similarity-based classifiers. This study introduces DART (Discriminative Adaptive Robust Transformation), a supervised preprocessing method combining median/MAD normalization, bounded nonlinear saturation, and continuous Fisher-mutual-information relevance weighting. DART is compared with supervised feature weighting and metric learning. Across the original conventional-preprocessing 41-dataset benchmark, DART achieved an overall balanced accuracy of 0.8118. In a separate supervised-control experiment, kNN results were NCA 0.8003, FisherWeight 0.7966, DART 0.7960, MIWeight 0.7855, and StandardScaler 0.7742; for RBF-SVM, DART obtained the highest aggregate BA (0.8308). Training-only RBF gamma selection retained a smaller DART advantage (0.8320 vs. 0.8286), and five independent subsamples of the datasets affected by the 20,000-sample cap produced stable conclusions. In US Accidents, default Full DART improved repeated-CV BA from 0.2774 to 0.2906 relative to StandardScaler (paired difference +0.01316; approximate dependence-corrected 95% CI 0.00327–0.02304), while equally budgeted nested k selection yielded 0.3011 versus 0.2797. State-disjoint BA was 0.2814 versus 0.2746 at fixed k and 0.2915 versus 0.2747 for the nested pair. Default Full DART did not rank first among every fixed-setting US control, and rare-class recall remained poor. STATS19 and India likewise show that gains are method-, class-, and validation-dependent; India additionally exhibited a substantial chronological generalization gap. Overall, DART is best interpreted as a competitive supervised geometry transformation whose benefit is classifier- and representation-dependent and comes with additional training cost.
1. Introduction
Road safety remains a major concern despite continued improvements in vehicles, infrastructure, and traffic-management systems. According to the World Health Organization, road crashes are responsible for approximately 1.19 million deaths every year and remain the leading cause of death among people aged 5–29 years [1]. The problem is therefore not limited to transportation efficiency; it also represents a significant public-health and societal challenge. Reducing the number and severity of crashes requires a better understanding of the circumstances under which dangerous events occur and, increasingly, the ability to extract useful patterns from the large volumes of traffic and accident data now available.
Machine learning provides one way of exploiting these data. Accident records can contain information about road geometry, weather, lighting conditions, vehicles, time, location, and several other factors that may be related to crash severity. Such information has motivated the use of classification algorithms for identifying severity patterns and supporting road-safety analysis. However, these datasets are rarely straightforward from a machine-learning perspective. Their variables can have very different numerical ranges and distributions, extreme observations are common, and severe accident categories are usually much less frequent than minor ones. Recent work on accident-severity prediction continues to identify class imbalance as an important difficulty when developing reliable predictive models [2].
Much of the attention in classification research naturally falls on the predictive model. However, the representation presented to that model can be equally important. Algorithms that rely directly on distances or similarities are particularly affected by feature scale. A variable with a large numerical range can have a disproportionate effect on distances even when it is not especially useful for distinguishing between classes. Standardization is commonly used to reduce this problem, while robust scaling provides an alternative when extreme values are present. Distributional transformations can also be applied when the original variables are strongly skewed. The Yeo–Johnson transformation, for example, was introduced as a power-transformation family defined over the whole real line and intended to reduce skewness and improve symmetry [3].
These approaches address important properties of the data, but they share a limitation that motivated this work: the transformation itself generally has no knowledge of the classification problem. A scaler can determine that one feature has a large variance or contains extreme observations, but it does not know whether that feature is useful for separating the target classes. Consequently, variables with very different predictive relevance may still be treated in essentially the same way during preprocessing.
This issue is related to, but distinct from, feature selection. Feature-selection methods explicitly search for variables that contain useful information about the prediction target. As discussed by Guyon and Elisseeff [4], selecting informative variables can improve predictive performance, reduce computational requirements, and provide a clearer understanding of the underlying data-generating process. A variety of criteria have been proposed for estimating this relevance. Fisher-type measures emphasize separation between classes relative to variation within classes, whereas mutual information evaluates statistical dependence between a feature and the target.
Mutual information is particularly attractive because it is not restricted to linear relationships. Battiti [5] used mutual information to assess candidate variables according to the information they provide about the output class. Subsequent studies developed related strategies for identifying informative feature subsets. Huang and Chow [6], for example, proposed an MI-based feature-selection scheme designed to identify salient variables across classification problems, while Cang and Yu [7] considered mutual information between combinations of input variables and the class rather than considering only individual features.
Feature selection, however, answers a somewhat different question from feature transformation. Selection determines which variables should remain in the model. Transformation determines how the retained variables are represented and how strongly they influence the geometry of the feature space. This distinction is especially relevant for distance-based classifiers such as k-nearest neighbors (kNN) and kernel methods such as the radial basis function support vector machine (RBF-SVM), for which the numerical representation of observations directly affects neighborhood or similarity relationships.
Motivated by this observation, this study introduces DART. The novelty claimed here is not the individual invention of median/MAD scaling, nonlinear compression, Fisher scoring, or mutual information. The contribution is their leakage-safe integration into one supervised diagonal geometry transformation: robust normalization controls scale, bounded saturation limits extreme standardized values, and continuous class-informed weights modify each retained dimension without hard feature deletion. This distinguishes DART from unsupervised scalers, filter-style feature selection, direct supervised feature weighting, and full metric-learning methods that learn general projections or pairwise metrics.
This formulation gives DART two complementary roles. The robust component deals with irregular distributions and extreme observations, while the discriminative component incorporates information about the relationship between the predictors and the target classes. Rather than eliminating variables through a hard selection decision, DART changes their relative influence continuously. Features carrying stronger discriminative information can therefore contribute more to the transformed representation, whereas less informative dimensions are attenuated without necessarily being removed.
A new transformation should not, however, be judged from its behavior on a small number of favorable datasets. For this reason, the experimental design adopted in this study examines DART across heterogeneous classification problems and compares it with commonly used preprocessing alternatives, including standard scaling, robust scaling, the Yeo–Johnson transformation, and quantile-based normalization. The evaluation is complemented by ablation experiments to determine which components contribute to the observed behavior, parameter-sensitivity analysis, robustness tests under controlled perturbations, computational analysis, and statistical comparisons across datasets.
A second objective is to investigate whether the proposed transformation remains useful in an application closely related to road safety. Accident-severity prediction provides an appropriate test case because the data combine heterogeneous variables with strongly imbalanced outcome classes. The road-safety analysis therefore considers accident datasets collected in different geographical settings, including the United States, the United Kingdom, and India. Particular care is taken to remove variables that directly encode accident consequences, such as injury- or severity-derived information, because retaining such attributes could lead to target leakage and an unrealistic estimate of predictive performance.
The contributions are fivefold. First, DART is formulated as a supervised diagonal geometry transformation combining robust normalization, bounded influence, and continuous Fisher-MI relevance weighting. Second, FisherWeight, MIWeight, and Neighborhood Components Analysis (NCA) enable comparison with supervised weighting and metric learning. Third, RBF-SVM robustness is evaluated under fixed and training-only tuned gamma values. Fourth, sensitivity to the 20,000-observation sampling cap is evaluated using five stratified seeds. Fifth, the road-safety analysis distinguishes heterogeneous target meanings, reports class-specific behavior and uncertainty, examines predictor availability, and includes chronological validation where supported.
The remainder of the paper is organized as follows. Section 2 discusses related work on data transformation, supervised feature relevance, accident-severity prediction, and traffic-sign recognition. Section 3 presents the mathematical formulation of DART. Section 4 describes the experimental protocol, datasets, comparison methods, classifiers, and evaluation criteria. Section 5 and Section 6 report the general benchmark, statistical evidence, ablation, robustness, sensitivity, and computational analyses. Section 7 presents the road-safety validation across structured accident records and visual traffic-sign feature spaces, followed by the discussion, limitations, and concluding remarks.
2. Related Work
2.1. Feature Scaling and Distributional Transformation
Data preprocessing is often treated as a routine step in a classification pipeline, although its influence can be substantial when the learning algorithm depends on distances, similarities, or kernel functions. Variables collected from heterogeneous sources may differ considerably in scale, dispersion, skewness, and sensitivity to extreme observations. Without an appropriate transformation, variables with large numerical ranges can dominate the representation even when their contribution to the classification task is limited.
Standardization is among the most widely used solutions and transforms each variable using its mean and standard deviation. Its simplicity is useful in many applications, but the resulting representation can be affected by extreme observations because both statistics are sensitive to outliers. Robust scaling replaces these quantities with more resistant statistics, typically the median and an interquartile measure, and is therefore better suited to datasets containing unusually large or small values. These transformations mainly modify the scale of the data; they do not attempt to change the overall shape of the underlying distribution.
Power transformations address a different aspect of the problem. The Yeo–Johnson family extends power transformation to variables containing zero or negative values and was originally proposed to improve normality and symmetry. Quantile-based transformations take a more direct approach by mapping empirical distributions toward a predefined distribution such as the normal distribution. These techniques can produce substantial changes in feature geometry and may consequently affect classifiers such as kNN and RBF-SVM.
Despite their differences, these transformations are driven primarily by the marginal distribution of each predictor. The target labels generally do not participate in determining how strongly a particular feature should influence the transformed space. This distinction is central to the motivation of the present work. DART retains the benefits of robust scaling and nonlinear transformation but introduces supervised information during construction of the transformed representation.
2.2. Discriminative Feature Relevance and Information-Theoretic Methods
Feature-selection research provides a different perspective on preprocessing. Instead of modifying the distribution of every predictor, feature-selection methods attempt to identify variables that are useful for the learning task while reducing irrelevant or redundant information. Guyon and Elisseeff [4] provide a broad discussion of this problem and distinguish filter, wrapper, and embedded strategies for identifying informative variables.
Among filter-based approaches, the Fisher score remains attractive because of its relatively simple interpretation. A useful feature is expected to produce compact observations within the same class while maintaining separation between different classes. The resulting criterion therefore expresses discriminative relevance through the relationship between within-class variation and between-class separation.
Information-theoretic approaches capture relevance differently. Mutual information measures the dependence between variables and can identify associations that are not restricted to linear relationships. Battiti [5] introduced an influential mutual-information-based strategy for supervised feature selection, in which relevance to the target is considered together with redundancy among candidate variables. Huang and Chow [6] subsequently proposed an effective feature-selection scheme based on mutual information, while Cang and Yu [7] investigated mutual information between combinations of input variables and the class label.
Researchers have also explored combinations of Fisher-type criteria and information-theoretic measures. For example, approaches combining Fisher scores with mutual information-related criteria have been developed to improve feature ranking and selection [8]. More recent work has continued this direction by incorporating mutual information into modified Fisher-score formulations for classification problems [9].
These studies are particularly relevant to the present work because they demonstrate that Fisher-based separability and mutual information can provide complementary information about feature relevance. Their primary objective, however, is generally feature selection: features are scored, ranked, retained, or discarded. DART uses these principles differently. The relevance information is incorporated into a continuous transformation of the feature space rather than being used only to determine a subset of predictors. Thus, the proposed method connects robust transformation and supervised relevance weighting without requiring a hard selection boundary.
2.3. Machine Learning for Road-Accident Severity Prediction
Machine learning has become increasingly common in road-safety research as larger accident databases have become available. Applications include crash occurrence modelling, crash-frequency estimation, real-time risk assessment, and injury-severity prediction. A systematic review by Ali et al. [10] examined these different applications and identified several unresolved methodological issues, including data imbalance, model evaluation, heterogeneous severity definitions, and the need for more rigorous validation procedures.
Accident-severity prediction is particularly challenging because the classes of greatest practical importance are often those with the fewest observations. Fatal and serious crashes occur much less frequently than lower-severity events, causing conventional classifiers to favor majority classes. Recent research continues to demonstrate the importance of this problem. Kuo et al. [11], for instance, investigated autonomous-vehicle crash severity under both small-sample and class-imbalance constraints and found that data-balancing strategies could substantially affect classification behavior.
Similar observations have been reported for conventional traffic crashes. A 2024 comparative study evaluated several classifiers and sampling approaches on highly imbalanced crash data and showed that performance depends strongly on the interaction between the classifier and the strategy used to address imbalance [12]. More recent work has combined resampling, machine-learning models, and explainability methods such as SHAP to improve both severity prediction and interpretation of influential crash factors [13].
The problem is therefore broader than simply selecting the classifier with the highest raw accuracy. Recent reviews emphasize issues such as imbalance handling, evaluation reliability, heterogeneity, interpretability, and transferability between traffic environments [14]. This is particularly important when severity distributions are strongly skewed since high overall accuracy may coexist with poor recognition of serious or fatal crashes.
For this reason, the road-safety experiments in the present study rely on balanced accuracy, macro-averaged F1 score, and Matthews correlation coefficient in addition to conventional accuracy. The intention is not to propose a complete accident-prediction framework or to claim that feature transformation alone resolves class imbalance. Instead, road-accident severity prediction is used as a demanding external application in which the proposed transformation can be evaluated under heterogeneous features, outliers, and unequal class distributions.
Visual perception provides a complementary road-safety setting. Traffic-sign recognition is a long-standing intelligent-transportation task in which illumination, viewpoint, occlusion, sign size, and inter-class similarity can substantially alter the resulting feature representation. GTSRB provides a widely used German benchmark for multi-class traffic-sign recognition, while the LISA dataset contributes annotated US traffic signs captured under heterogeneous imaging conditions. BelgiumTSC provides an additional European classification benchmark derived from the Belgium Traffic Sign Dataset. These datasets are used in the present study not to claim a new end-to-end traffic-sign recognition architecture but to test whether DART can improve the geometry of fixed handcrafted and pretrained deep visual representations.
2.4. Research Gap and Positioning of DART
The literature reviewed above reveals two largely separate directions. The first concerns scaling and distributional transformation, where the objective is to improve the numerical representation of predictors through standardization, robust statistics, power transformations, or quantile mappings. These approaches generally operate without information about the class labels. The second concerns supervised feature relevance, where Fisher scores, mutual information, and related criteria are used primarily to select or rank predictors.
This separation leaves room for a different formulation. A feature can simultaneously present an irregular distribution, contain extreme observations, and carry a particular degree of information about the target. Treating these properties independently may therefore overlook useful interactions between distributional robustness and discriminative relevance.
Recent work makes clear that supervised weighting and metric learning are necessary comparators. Contemporary methods learn task-dependent feature weights, projections, or pairwise geometries, including recent discriminative projective metric learning, transfer metric learning under class imbalance, and class-consistent metric learning [15,16,17,18,19]. These approaches can be more flexible than diagonal weighting. DART is intentionally narrower: it preserves the original feature axes and combines robust bounded transformation with supervised diagonal weighting. The research gap is therefore whether a simple, interpretable, leakage-safe diagonal transformation can capture useful supervised geometry adaptation while remaining easier to fit and interpret than general metric learning.
DART is developed around this observation. Rather than replacing existing scaling or feature-selection methods, it combines three operations within the same transformation: robust normalization, nonlinear control of extreme standardized values, and supervised weighting of the transformed dimensions. Fisher-based separability and mutual information are used to estimate the relevance of each feature, but this relevance does not produce a binary retain/discard decision. It modifies the geometry presented to the subsequent classifier.
This distinction is especially relevant for kNN and RBF-SVM. Both algorithms depend strongly on the geometry of the input space, although in different ways: kNN relies directly on distances between observations, while the RBF kernel converts pairwise distances into similarities. Consequently, changing the relative contribution of informative and weakly informative dimensions can alter neighborhood structure and kernel relationships without modifying the classifier itself.
The present study therefore investigates the following central question: can robust distributional transformation and supervised discriminative relevance be combined into a simple preprocessing operation that improves classification across heterogeneous datasets while remaining computationally practical? The general benchmark addresses this question across multiple classification problems, while the road-safety experiments examine whether the same behavior extends to real-world accident-severity data.
3. Proposed DART Method
3.1. Motivation and Problem Formulation
Consider a supervised classification dataset:
where xi ∈ ℝᵈ denotes a d-dimensional feature vector and yi ∈ {1, …, C} is its corresponding class label. The objective of preprocessing is to construct a transformed representation:
that provides a suitable input space for a subsequent classifier.
Conventional scaling methods estimate T(·) mainly from the marginal distribution of each feature. For example, standardization uses the sample mean and standard deviation, while robust scaling can rely on median- and quantile-based statistics. These transformations reduce differences in numerical scale, but they do not explicitly consider whether a particular feature contributes to class discrimination.
DART follows a different principle. The transformation is constructed from two sources of information: the distributional characteristics of the predictors and their relevance to the target classes. Its formulation contains three consecutive operations:
- Robust centering and scaling;
- Nonlinear bounding of standardized values;
- Supervised weighting based on Fisher separability and mutual information.
The resulting transformation modifies both the magnitude of individual observations and the relative contribution of feature dimensions.
3.2. Robust Median-Based Normalization
The first stage reduces sensitivity to feature scale and extreme observations. For feature j, its median is estimated from the training data as:
The median absolute deviation (MAD) is then calculated as
DART uses the scaled MAD:
where the factor 1.4826 provides consistency with the standard deviation under a Gaussian distribution [20].
The robust standardized value is consequently:
When the MAD of a feature is numerically close to zero, its standard deviation is used as a fallback. If both quantities are degenerate, the scale is set to one. This prevents division by zero while preserving a deterministic transformation.
Median/MAD normalization is preferred at this stage because the mean and standard deviation can be strongly affected by extreme observations. The robustness properties of the median and MAD have long made them useful estimators when contamination or heavy-tailed distributions are present.
3.3. Bounded Nonlinear Transformation
Robust normalization reduces the effect of outliers on the estimated center and scale, but a transformed observation can still obtain a large magnitude. DART therefore introduces a nonlinear bounding operation:
where τ controls the degree of compression.
For values close to zero, the denominator approaches one and the mapping behaves approximately linearly:
As ∣uij∣ increases, the denominator grows and the magnitude of the transformed value is progressively compressed. Moreover,
and
The transformation therefore satisfies
|bij| < τ.
This property is useful because an isolated extreme observation cannot produce an arbitrarily large contribution to a Euclidean distance or an RBF-kernel distance after transformation.
The parameter determines the trade-off between preserving the approximately linear region and suppressing extreme standardized values. Smaller values introduce stronger compression, whereas increasing makes the mapping progressively closer to robust linear scaling. Its effect is examined experimentally through the parameter-sensitivity analysis rather than selecting its value from the test data.
3.4. Discriminative Relevance Estimation
The first two stages of DART are independent of the class labels. The third stage introduces supervised information by estimating the relevance of each feature to the classification problem.
Two complementary criteria are considered: the Fisher score and mutual information.
3.4.1. Fisher-Based Relevance
For feature j, Fisher-based relevance evaluates the separation between class-specific distributions relative to their within-class variability. A general multiclass formulation can be expressed as
where nc is the number of observations belonging to class c, and are the class-specific mean and variance of feature j, μj denotes its global mean, and ε is a small numerical constant.
A large Fj indicates that the class-specific means are well separated relative to the dispersion observed within individual classes. Fisher-type criteria are therefore useful for identifying features with explicit class-separation capability [21].
To make Fisher relevance comparable with the second relevance criterion, the scores are normalized:
3.4.2. Mutual-Information Relevance
Fisher relevance is closely associated with class separability expressed through distributional moments. It may not fully characterize more complex statistical dependencies. DART therefore complements it with mutual information.
For feature Xj and target Y, mutual information is defined as:
When Xj and Y are statistically independent,
Increasing values indicate stronger statistical dependence between the feature and the target. Unlike simple correlation-based measures, mutual information can capture nonlinear dependencies, making it useful for supervised relevance estimation [5].
The MI scores are normalized similarly:
In implementation, mutual information is estimated from the training partition only. This point is important: neither Fisher relevance nor MI is estimated from validation or test observations.
3.5. Hybrid Relevance Score
Fisher score and mutual information describe different aspects of feature relevance. Rather than choosing one criterion exclusively, DART combines them:
Here, λ controls their relative contributions.
When
the relevance estimate depends exclusively on Fisher separability, whereas
reduces the formulation to mutual-information relevance.
λ = 1
λ = 0
The default formulation used in the experiments assigns equal importance to the two components: the defaults τ = 3, γ = 1, and λ = 0.5 were fixed before the main benchmark and were not selected from test performance. τ = 3 provides moderate compression, γ = 1 leaves the normalized relevance profile unamplified, and λ = 0.5 gives equal prior weight to Fisher and MI. Section 6.3 varies these values post hoc to evaluate sensitivity rather than to redefine the defaults.
λ = 0.5
The hybrid score is then optionally controlled through a relevance-strength parameter γ:
When γ = 0, the discriminative weighting is effectively disabled because all dimensions receive equal relevance before normalization. Values greater than one accentuate differences between highly and weakly relevant dimensions, whereas values between zero and one reduce these differences.
The final normalized feature weight is
Thus,
3.6. Final DART Transformation
Direct multiplication would reduce the global scale of the representation as dimensionality increases. DART instead converts the normalized relevance score into a feature multiplier:
This choice has an important property. If all features have identical relevance,
Then
Consequently, equal relevance leaves the bounded robust representation unchanged.
The complete DART transformation is therefore:
with
Equations (22) and (23) summarize the proposed method.
The transformation can consequently be interpreted as
DART = Robust normalization + Nonlinear bounding + Discriminative adaptation.
The first component controls heterogeneous scales, the second limits the influence of extreme observations, and the third modifies feature-space geometry according to class relevance.
3.7. Geometric Interpretation
The weighting stage has a direct interpretation for distance-based learning.
For two transformed observations za and zb, their squared Euclidean distance is:
Substituting the feature multiplier gives
DART therefore induces a supervised weighted geometry. Differences along dimensions with greater estimated relevance contribute more strongly to the resulting distance, whereas differences along weakly informative dimensions contribute less.
This provides a direct connection to kNN. The nearest-neighbor structure is no longer determined only by the raw numerical scale of the variables but also by their estimated relevance to the classification task.
A related effect occurs for an RBF-SVM. The RBF kernel is:
where η is the kernel parameter. Since DART changes the pairwise distances supplied to the kernel, it indirectly changes the similarity structure used by the SVM.
This geometric interpretation explains why kNN and RBF-SVM are particularly relevant classifiers for evaluating the proposed transformation.
3.8. Training and Data-Leakage Prevention
Because DART uses class labels when estimating Fj and I(Xj; Y), it must be treated as a supervised preprocessing operation.
For each cross-validation split, all DART parameters are estimated exclusively from the training partition:
The fitted transformation is subsequently applied unchanged to the corresponding validation/test partition.
Formally,
followed by
and
No information from Ytest is involved in construction of the transformation. Applying Fisher or mutual-information estimation before cross-validation would constitute target leakage and could produce optimistic results. The experiments in this study therefore fit DART independently within every training fold. Figure 1 summarizes the transformation and its main parameters.
Figure 1.
Overview of the proposed Discriminative Adaptive Robust Transformation (DART), combining robust median/MAD normalization, nonlinear bounding, and supervised Fisher–mutual-information relevance weighting. Arrows indicate the processing flow; blue, orange, and green distinguish the input, transformation stages, and output. Dashed lines indicate reference levels in the schematic plots. In the diagram, α denotes the mixing coefficient λ, and w denotes the feature multiplier a used in the text. The bounding curve is schematic; its analytical limits are ±τ, as given in Equations (9) and (10).
4. Experimental Methodology
The experimental study was designed to evaluate DART from several complementary perspectives rather than relying on a single classification benchmark. The evaluation consisted of five components: (i) a broad multi-dataset comparison with conventional preprocessing methods, (ii) an ablation study, (iii) controlled robustness experiments, (iv) parameter-sensitivity and computational analyses, and (v) a separate road-safety-oriented validation. This design makes it possible to examine not only whether DART improves classification performance but also which components contribute to its behavior, how sensitive it is to its parameters, and what computational overhead is introduced by the transformation.
4.1. General Benchmark Datasets
The main evaluation considered 41 heterogeneous classification datasets, covering both binary and multiclass problems with different sample sizes, dimensionalities, class distributions, and feature characteristics. The collection included the Iris, Wine, Breast Cancer, and Digits datasets distributed with scikit-learn, together with a broader group of datasets obtained through OpenML.
OpenML was selected as the principal source for the extended benchmark because it provides standardized dataset representations, programmatic access, metadata, and facilities for reproducible machine-learning experiments [22].
The benchmark included datasets such as Diabetes, Sonar, Spambase, Ionosphere, Vehicle, German Credit, Yeast, Banknote Authentication, Blood Transfusion, Madelon, Phoneme, QSAR Biodegradation, Adult, Electricity, KC1, PC1, Bank Marketing, Nomao, Steel Plates Fault, Hill-Valley, Climate Model Crashes, Semeion, and several MFeat datasets, among others. The purpose of using this heterogeneous collection was to evaluate DART under substantially different classification conditions rather than optimizing it for a particular application domain.
OpenML categorical columns were one-hot encoded before cross-validation partitioning. Missing numerical values were replaced by medians estimated from the corresponding training partition, and fitted transformations, including supervised relevance weights, were estimated from training partitions only. The supervised-control experiments additionally removed zero-variance features using the training partition; the original conventional benchmark pipeline did not use this filter. Because category vocabularies were constructed before cross-validation, these OpenML experiments do not establish strictly fold-local category discovery.
The original conventional-preprocessing benchmark used caps of 12,000 observations and 2500 features. The separate supervised-control experiment used caps of 20,000 observations and 5000 features; both used five stratified folds and seed 42. In the 20,000-observation sensitivity study, Adult (48,842), Electricity (45,312), Bank Marketing (45,211), and Nomao (34,465) exceeded the sample cap. Five independent stratified seeds (42, 2026, 3407, 7777, 12,021) were evaluated; DART mean BA ranged from 0.7944–0.7996 with kNN and 0.8517–0.8531 with RBF-SVM and exceeded StandardScaler for every seed. These subsamples assess sampling sensitivity rather than five repetitions of the original complete benchmark. Methods were compared within each experiment. Sampled-row ordering and training-fold zero-variance filtering differed between the conventional and supervised-control protocols, so a common seed does not establish identical cross-validation partitions across them.
4.2. Road-Safety Datasets
In addition to the general benchmark, a separate application-oriented evaluation was conducted using two complementary families of road-safety data. Structured accident-severity prediction was evaluated on US Accidents, STATS19, and an Indian highway dataset, while visual feature-space validation was conducted on GTSRB, LISA, and BelgiumTSC. The two groups were kept separate from the 41-dataset benchmark because their purpose was domain-oriented cross-dataset evaluation rather than inclusion in the general statistical comparison.
4.2.1. Structured Road-Safety Outcome Datasets
US Accidents
US Accidents contains 7,728,394 records with Start_Time spanning 14 January 2016 to 31 March 2023 and all four Severity codes [23]. The target counts are 67,366 (code 1), 6,156,981 (code 2), 1,299,337 (code 3), and 204,710 (code 4). The source contains 49 state codes. The restricted-predictor experiment used a stratified 20,000-record cohort sampled with seed 42, with class supports 174, 15,933, 3363, and 530; 48 state codes are represented in this cohort.
The US Accidents Severity field represents traffic impact/disruption rather than injury severity. The restricted-predictor experiment used seven numerical weather variables, thirteen roadway/context indicators, six categorical weather/daylight variables, and Start_Time-derived year, month, weekday, and hour. Identifiers, source, end time, coordinates, distance (mi), description, street, city, county, ZIP code, country, time zone, airport code, and weather timestamp were excluded from the fitted predictor set. State was used only as a grouping key for geographic holdouts. Weather timestamps occur after Start_Time for many source records, so predictor availability at incident onset is not established. This experiment evaluates retrospective traffic-event classification rather than prospective injury-severity prediction or deployment.
STATS19
The second dataset was obtained from the UK Department for Transport STATS19 system. STATS19 provides record-level information on police-reported personal-injury road collisions in Great Britain, including collision, vehicle, casualty, roadway, lighting, weather, and environmental characteristics [24]. Collision severity was selected as the target variable.
STATS19 was modeled at the collision level using police-reported collision severity as the target. Post-collision consequence fields were excluded, including collision identifiers/references, latitude/longitude, number_of_casualties, collision_injury_based, enhanced_severity_collision, collision_adjusted_severity_serious, and collision_adjusted_severity_slight. The conventional-preprocessing experiment used 20,000 stratified observations and 38 prepared predictors, with class supports 286, 4963, and 14,751. Excluding these fields reduces direct target-derived information but does not establish the prediction-time availability of every remaining variable.
Indian Highway Accident Dataset
The Indian highway dataset contains 8116 accident records [25]. Its target accident_severity_c uses code 1 for fatal accidents (n = 708), code 2 for grievous injury (n = 2904), code 3 for minor injury (n = 3088), and code 4 for no injury (n = 1416), following the dataset authors’ published coding scheme [26]. These codes were treated as categorical outcomes. Predictors were day_of_week, time_of_accident, accident_location_a, accident_location_a_chainage_km, accident_location_a_chainage_km_roadside, causes_d, road_feature_e, road_condition_f, weather_conditions_h, vehicle_type_involved_j_v1, vehicle_type_involved_j_v2, and date-derived year, month, day-of-week, and hour. No explicit highway-group identifier was available, preventing leave-one-highway-group-out validation. Temporal and location-sensitivity analyses were used to examine generalization.
4.2.2. Traffic-Sign Recognition Datasets
GTSRB
The German Traffic Sign Recognition Benchmark (GTSRB) is a multi-class traffic-sign recognition dataset containing 43 sign categories and an established train/test partition [27]. It was selected as the principal visual validation benchmark because it combines substantial intra-class variability with fine-grained inter-class differences. In the present study, the original images were not used to train a new classifier end to end; instead, HOG descriptors and fixed pretrained ResNet18 embeddings were extracted and subsequently transformed by the competing preprocessing methods.
LISA Traffic Signs
The LISA Traffic Sign Dataset contains US traffic-sign imagery collected using different cameras and under heterogeneous visual conditions [28]. The adopted classification split contained 6621 training images and 1234 test images. Forty-seven classes were represented in the training partition and forty-one in the test partition; six training classes therefore had no corresponding test examples. This split characteristic was retained and reported explicitly rather than artificially modifying the test composition.
BelgiumTSC
BelgiumTSC is the cropped traffic-sign classification split derived from the Belgium Traffic Sign Dataset [29]. The experiment used 4575 training images and 2520 test images. Sixty-two classes were represented in training and fifty-three in testing, with nine training classes absent from the test partition. As for LISA, evaluation metrics were interpreted over the classes represented in the corresponding test set.
Together, the six road-safety datasets provide complementary cross-dataset evaluation. The accident datasets test DART on heterogeneous and imbalanced structured records, whereas GTSRB, LISA, and BelgiumTSC test whether the same geometric transformation can operate on fixed visual representations derived from independent traffic-sign datasets.
4.3. Preprocessing Methods and Classifiers
The broad benchmark compared no transformation, StandardScaler, RobustScaler, MinMaxScaler, MaxAbsScaler, Yeo–Johnson, Quantile-Normal, Quantile-Uniform, L2 normalization, PCA whitening, and DART. Four classifiers were used: kNN, logistic regression, RBF-SVM, and random forest. Focused analyses retained kNN and RBF-SVM because their predictions are directly affected by feature-space geometry.
kNN used k = 5 with distance-weighted voting. RBF-SVM used C = 1. The original benchmark used gamma = ‘scale’ with balanced class weights. Because gamma = ‘scale’ changes with transformed variance, an added robustness experiment compared gamma = ‘scale’, fixed 0.1/d, 1/d, 10/d, and training-only inner-CV selection. The 41-dataset benchmark was also extended with FisherWeight, MIWeight, and NCA supervised controls. All supervised transformations and gamma selection were fitted exclusively inside training partitions.
The fixed k = 5 road-safety experiment isolates preprocessing under a common downstream configuration and is not presented as evidence that k = 5 is optimal. Supervised Fisher and MI controls and a class-weighted ExtraTrees comparator were also evaluated. For US Accidents, an equally budgeted nested sensitivity selected k from {3, 5, 9, 15, 25} independently for Full DART and StandardScaler using training-only inner folds; all preprocessing and relevance estimation were refitted inside those inner partitions. The US analysis also used 10 state-disjoint folds as a descriptive geographic robustness check. These state holdouts remain within the same source and cohort and are not interpreted as cross-country transfer.
For the traffic-sign experiments, the downstream classifier was distance-weighted kNN with k = 5. Each image was represented either by a 1764-dimensional HOG descriptor extracted after resizing to 64 × 64 pixels or by a 512-dimensional embedding from a pretrained ResNet18 whose classification layer was removed. The feature extractor was fixed across preprocessing methods. In addition to no transformation, StandardScaler, RobustScaler, Quantile-Normal, and Full DART, the visual control experiment included direct Fisher weighting, direct mutual-information weighting, DART-Fisher, and DART-MI. These controls were introduced to determine how much of the visual improvement could be explained by supervised relevance weighting alone.
4.4. Cross-Validation Protocol and Metrics
The 41-dataset benchmark used five-fold stratified cross-validation with random seed 42, with exactly the same folds reused for all preprocessing methods. Focused analyses used 10-fold stratified CV repeated five times, as did the structured road-safety experiments. All seeds, fold assignments, dataset IDs, sample counts, class distributions, and subsampling metadata were exported. No supervised preprocessing quantity was estimated before a fold split.
Performance was measured using Accuracy, Balanced Accuracy (BA), Macro-F1, and Matthews correlation coefficient (MCC). BA was the principal ranking metric because several datasets were imbalanced [30].
where 𝕀(.) is the indicator function, yi is the true class, and is the predicted class.
where
Equivalently,
Macro-F1 was used to assign equal importance to every class independent of its frequency. Let F1c denote the F1 score of class c, where:
The macro-averaged F1 score is then
Fold-level results were retained and aggregated by the mean and standard deviation. Dataset-wise ranks were computed from mean BA, with a lower average rank indicating better overall performance.
For readability, all tables use BA = balanced accuracy, Macro-F1 = unweighted mean of class-wise F1 scores, and MCC = Matthews correlation coefficient. Best values within each directly comparable block are emphasized, while tables that mix heterogeneous road-safety outcomes are interpreted dataset by dataset rather than as a common physical severity scale.
The structured road-safety kNN experiment used 10-fold stratified cross-validation repeated five times, yielding 50 train–test evaluations for each preprocessing configuration. The traffic-sign datasets instead used their fixed training and testing partitions. All supervised quantities, including Fisher scores, mutual-information estimates, DART scales, and feature multipliers, were fitted exclusively on the training partition and then applied unchanged to the held-out test representation. For the visual experiments, the same DART parameters (τ = 3, γ = 1, λ = 0.5) were used across all three datasets without dataset-specific tuning, and mutual information was estimated from at most 12,000 training observations.
4.5. Ranking and Statistical Comparison
Mean performance alone does not establish whether one preprocessing method performs consistently across heterogeneous datasets. A dataset-wise ranking procedure was therefore used.
For each dataset d, preprocessing methods were ranked according to their mean balanced accuracy. Rank 1 was assigned to the highest-performing method. When methods obtained equal performance, average ranks were assigned.
For preprocessing method m, the overall average rank was calculated as:
where rm,d denotes the rank of method m on dataset d, and D is the total number of datasets included in the comparison. Lower values of Rm therefore indicate better overall ranking.
Because comparisons involved multiple algorithms evaluated on the same datasets, non-parametric statistical procedures were preferred following the recommendations of Demšar [31].
The Friedman test was used for simultaneous comparison of multiple preprocessing methods. If kp preprocessing methods are evaluated across D datasets, the Friedman statistic can be written as
When pairwise comparisons were required, DART was compared with individual baseline transformations using the Wilcoxon signed-rank test on paired dataset-level performance values.
When several pairwise hypotheses were evaluated simultaneously, Holm’s step-down procedure was used to control the family-wise error rate. The significance threshold was fixed at
α = 0.05
In addition to p-values and average ranks, win/tie/loss counts were reported. For DART and baseline B, these quantities were defined according to the sign of
Δd = BADART,d − BAB,d
Thus, Δd > 0 represents a DART win, Δd = 0 a tie, and Δd < 0 a loss.
4.6. Ablation, Robustness, Sensitivity, and Computation
The ablation study compared Robust, Robust + saturation, DART-Fisher, DART-MI, and Full DART. Robustness was evaluated under Gaussian noise (5%, 10%, 20% of feature standard deviation), cell-wise outlier contamination (1%, 5%, 10%), and added irrelevant Gaussian dimensions (+25%, +50%, +100% of original dimensionality). Sensitivity experiments varied τ ∈ {0.5, 1, 2, 3, 5, 10}, γ ∈ {0.25, 0.5, 1, 2}, and λ ∈ {0, 0.25, 0.5, 0.75, 1} one factor at a time.
Computational profiling compared fit-transform time, test-transform time, and peak preprocessing memory for StandardScaler, RobustScaler, Quantile-Normal, Yeo–Johnson, and DART.
4.7. Reproducibility and Fairness Controls
Three complementary controls were evaluated. First, supervised FisherWeight, MIWeight, and NCA were compared with DART on the same 41 datasets and folds within the supervised-control experiment. Second, RBF-SVM gamma was tested under fixed values and training-only inner-CV selection. Third, the 20,000-observation cap was evaluated over five stratified sampling seeds for every affected dataset. Methods had equal access to labels within each experiment; the original conventional benchmark and supervised-control experiment used distinct preparation protocols. Dataset manifests, predictor-audit tables, and supplementary result summaries are provided in the Supplementary Materials (Tables S1–S12).
5. General Benchmark Results and Statistical Analysis
The first set of experiments examined whether DART provides a consistent advantage over conventional preprocessing approaches across heterogeneous classification problems. The analysis covered 41 datasets and four classifiers: kNN, logistic regression, RBF-SVM, and random forest. Eleven preprocessing configurations were evaluated using identical train/test partitions. Balanced accuracy was used as the principal criterion because it provides a more reliable comparison when class distributions differ substantially between datasets.
5.1. Overall Performance Across the 41 Benchmark Datasets
DART achieved the highest mean balanced accuracy, the best average rank, and the largest number of first-place results. Relative to StandardScaler, the mean BA improvement was 0.0082 (0.82 percentage points); relative to RobustScaler, it was 0.0200. The gain is modest in absolute mean but substantially clearer in the rank and win counts, indicating that the aggregate result is not driven only by a few unusually favorable datasets. Table 1 summarizes the overall benchmark and supervised-control results.
Table 1.
Original conventional-preprocessing benchmark across 41 datasets (12,000-observation and 2500-feature caps). (a) Separate supervised-control experiment (mean balanced accuracy across 41 datasets; 20,000-observation and 5000-feature caps).
DART was competitive with other supervised geometry methods. NCA led kNN (0.8003), with FisherWeight (0.7966) and DART (0.7960) close behind. DART led RBF-SVM (0.8308), but its pairwise differences versus Fisher/MI/NCA were small and did not remain significant after Holm correction. The advantage over RobustScaler remained significant. Thus, access to labels explains part, but not all, of DART’s behavior. Table 1 and Table 2 summarize the original conventional-preprocessing experiment, whereas Table 1a summarizes the separate supervised-control experiment. The respective DART balanced accuracies were 0.7950 and 0.7960 for kNN and 0.8306 and 0.8308 for RBF-SVM. The protocols differ in sample/feature caps, sampled-row ordering, and training-fold zero-variance filtering; the numerical effect of each difference has not been isolated through controlled reruns.
Table 2.
Principal preprocessing methods by classifier in the original conventional-preprocessing benchmark (12,000-observation and 2500-feature caps).
5.2. Classifier-Specific Behavior
The strongest effect occurred with kNN: DART improved mean BA by 0.0215 over StandardScaler and achieved 17 wins. For RBF-SVM, DART had the highest mean BA, although Yeo–Johnson had a marginally better average rank. Logistic regression showed small differences among the strongest transformations, and random forest was essentially insensitive to scaling. This classifier dependence supports the geometric motivation of DART rather than a claim of universal superiority.
5.3. Pairwise Statistical Evidence
For kNN, DART significantly outperformed all principal baselines after Holm correction. The strongest directional evidence was obtained against PCA whitening (38 wins, 3 losses), RobustScaler (31 wins, 10 losses), and Quantile-Normal (32 wins, 1 tie, 8 losses). Table 3 reports the paired comparisons.
Table 3.
Wilcoxon–Holm comparisons for kNN.
For RBF-SVM, DART significantly outperformed RobustScaler, no transformation, and PCA whitening but not StandardScaler, Quantile-Normal, or Yeo–Johnson after multiple-comparison correction. The correct conclusion is therefore that DART is highly competitive for RBF-SVM, not that it is significantly superior to every strong baseline. Table 4 reports these pairwise comparisons.
Table 4.
Wilcoxon–Holm comparisons for RBF-SVM. (a) RBF-SVM gamma robustness analysis (mean balanced accuracy).
Kernel width interacts with preprocessing. With training-only inner-CV gamma selection, DART retained the higher aggregate BA (0.8320 vs. 0.8286), although the margin fell from 0.78 to 0.34 percentage points. At gamma = 1/d, the methods were effectively tied. The tuned result is therefore the principal robustness evidence; the large 10/d contrast is treated only as a sensitivity observation. Table 4a summarizes the gamma analysis.
5.4. Global Rank Test
The null hypothesis of equivalent preprocessing ranks was rejected for every classifier. The Friedman result establishes that some preprocessing methods differ; the pairwise Wilcoxon tests provide the DART-specific evidence. Table 5 presents the global rank tests.
Table 5.
Friedman tests across the 11 preprocessing methods.
6. Ablation, Robustness, Sensitivity, and Computational Analysis
The general benchmark established that DART is particularly effective for geometry-sensitive classifiers. The next experiments were designed to determine why this behavior occurs and whether it remains stable under changes in data quality and parameter configuration. Four complementary analyses were therefore conducted: component ablation, controlled perturbation testing, parameter sensitivity, and computational profiling.
6.1. Ablation
Full DART produced the highest aggregate BA and best average rank, improving on robust normalization alone by 0.03272 (3.27 percentage points). Robust + saturation already raised BA to 0.80055, showing that nonlinear bounding contributes beyond robust scaling. Fisher-only slightly exceeded Full DART for kNN (0.79696 vs. 0.79500), while Full DART gave the highest RBF-SVM mean BA (0.83229). Thus, the results support complementary components without implying that every added component improves every individual classifier. Table 6 summarizes the component-ablation results.
Table 6.
Overall results from the separate component-ablation experiment (6000-observation and 1500-feature caps). Ten stratified folds were repeated five times, with the fold count adapted to the smallest class; yeast used five folds per repeat. Aggregates weight datasets equally.
6.2. Robustness Under Perturbation
DART remained strongest for kNN at every tested noise level. At 20% Gaussian noise, DART reached 0.7684 versus 0.7538 for StandardScaler. For RBF-SVM, DART retained the highest mean BA at 20% noise, but its advantage over StandardScaler was not statistically significant after correction. Table 7 summarizes the Gaussian-noise results.
Table 7.
Balanced accuracy under Gaussian noise.
The irrelevant-feature experiment provides the clearest evidence for the supervised weighting stage. When the dimensionality was doubled with random features, kNN with DART fell only from 0.7943 to 0.7833, whereas StandardScaler fell to 0.7048. DART outperformed StandardScaler on all 41 datasets at +100% irrelevant dimensions. RBF-SVM showed the same qualitative pattern (0.8258 vs. 0.7887). Table 8 reports the irrelevant-dimension results.
Table 8.
Balanced accuracy after adding irrelevant dimensions.
At 10% outlier contamination, kNN with DART retained 0.6727 BA compared with 0.5192 for StandardScaler, a difference of 0.1535. RBF-SVM showed a similarly large advantage over conventional scaling. Quantile-Normal remained a strong competitor under severe outliers; its 0.7197 BA was not significantly different from DART’s 0.7240 in the corresponding pairwise test. Table 9 summarizes the outlier-contamination results.
Table 9.
Balanced accuracy under cell-wise outlier contamination.
6.3. Parameter Sensitivity
Performance was stable over moderate τ values. kNN favored λ = 0.75 by a small margin, while RBF-SVM favored λ = 0.50. The default λ = 0.50 was retained because it was defined before examining the sensitivity results and provides a classifier-independent compromise. Strong relevance amplification (γ = 2) reduced RBF-SVM performance, indicating that excessive weighting can distort kernel geometry. Table 10 presents the parameter-sensitivity results.
Table 10.
DART parameter sensitivity (mean BA).
6.4. Computational Cost
DART has the highest fitting cost because supervised relevance must be estimated. Its mean fit-transform time was 0.6069 s, compared with 0.0021 s for StandardScaler. Inference-side transformation remained inexpensive: 0.000428 s (0.428 ms) on average, approximately twice StandardScaler in relative terms but still sub-millisecond in absolute terms. The principal computational trade-off is therefore training-time overhead. Table 11 summarizes the preprocessing costs.
Table 11.
Computational cost of preprocessing.
The NCA control contextualizes this cost: mean transformation fitting was approximately 0.002 s for StandardScaler, 0.006 s for FisherWeight, 0.768 s for MIWeight, 0.794 s for DART, and 106.7 s for NCA. These implementation-specific timings should not be generalized across hardware, but they show that DART occupied an intermediate computational regime: substantially slower than scaling, yet far cheaper than the tested metric-learning baseline.
7. Road-Safety Case Study
7.1. Evaluation Setting
The road-safety experiments are independent multi-dataset evaluations, not evidence of cross-country model transfer. No model trained in one country was tested in another. US Accidents, STATS19, and the Indian dataset have non-equivalent outcomes: US Severity represents traffic impact/disruption, STATS19 represents police-reported collision severity, and the Indian outcome distinguishes fatal, grievous-injury, minor-injury, and no-injury accidents [26]. Aggregate ranks are therefore only algorithmic summaries across heterogeneous tasks, not evidence that the targets are directly comparable.
For structured road-safety outcomes, US Accidents and STATS19 used stratified 20,000-record cohorts, while the complete 8116-record Indian dataset was retained. The principal preprocessing comparison used 10-fold stratified cross-validation repeated five times. The restricted-predictor US experiment additionally used 10 state-disjoint folds and an equally budgeted nested kNN sensitivity analysis. India included a chronological 80/20 analysis on records with usable dates and location/chainage sensitivity controls. For traffic-sign recognition, fixed train/test splits were used for GTSRB, LISA, and BelgiumTSC. In every setting, supervised transformations were fitted on training data only. BA remained the principal metric, with Accuracy, Macro-F1, and MCC as complementary measures.
7.2. kNN Accident-Severity Prediction Results
Table 12 reports the conventional-preprocessing road-safety comparison, while Table 12a reports the complementary supervised controls and validation analyses under their corresponding protocols. In the US fixed-k experiment, Full DART achieved BA 0.2906 versus 0.2774 for StandardScaler, with a paired gain of 0.01316 (approximate dependence-corrected 95% CI 0.00327–0.02304). FisherWeight and MIWeight achieved 0.2888 and 0.2894, Balanced-Fisher DART 0.2910, and DART with tau = 1.5 had the highest fixed-setting point mean at 0.2930. These small secondary differences were not used to retune the default. With equally budgeted nested k selection, Full DART reached 0.3011 versus 0.2797 for StandardScaler (paired gain 0.02134; approximate 95% CI 0.01015–0.03253). For STATS19, Full DART reached 0.3559 versus 0.3499 for StandardScaler, while FisherWeight reached 0.3592 and Balanced-Fisher DART 0.3648. The evidence therefore supports competitiveness and matched improvements over StandardScaler, not universal dominance over every supervised control.
Table 12.
kNN balanced accuracy under the conventional-preprocessing road-safety protocol. The US experiment used 43 predictors, including end-time-derived variables and distance (mi), and therefore does not establish predictor availability at incident onset. (a) Supervised-control, geographic, and temporal results for structured road-safety datasets. US results use the restricted-predictor protocol; temporal results concern India.
The conventional-preprocessing US experiment in Table 12 used 43 predictors and yielded DART BA 0.3292. The restricted-predictor experiment in Table 12a used the 30 predictors described in the “US Accidents” subsection of Section 4.2.1 and yielded fixed-k DART BA 0.2906 versus 0.2774 for its matched StandardScaler comparison. Predictor selection and sampling differed between these protocols; equal cohort sizes and class supports do not establish identical sampled observations. The numerical difference cannot be attributed to a single adjustment without controlled reruns. None, IQR RobustScaler, and Quantile-Normal were not evaluated under the restricted-predictor protocol. Its RobustOnly variant denotes median/MAD normalization rather than IQR RobustScaler. Results and cross-dataset summaries are interpreted within their respective protocols.
The US fixed-k result was supported by complementary metrics: Full DART Macro-F1 was 0.2955 versus 0.2780 for StandardScaler, and MCC was 0.1577 versus 0.1229. The equally tuned nested pair yielded BA 0.3011 versus 0.2797. In 10 state-disjoint folds, fixed-k Full DART achieved mean BA 0.2814 versus 0.2746 for StandardScaler; the nested pair achieved 0.2915 versus 0.2747. These state-disjoint results are descriptive geographic checks within the same US source/cohort, not evidence of transfer to another country or source.
Class-specific analysis shows why aggregate BA must be interpreted cautiously. In the US repeated-CV experiment, Full DART recall for Severity codes 1–4 was 2.53%, 92.41%, 20.83%, and 0.45%, compared with 0%, 93.02%, 16.66%, and 1.28% for StandardScaler; thus code-4 recall decreased despite the aggregate BA improvement. Nested Full DART recall was 5.86%, 89.48%, 23.74%, and 1.36%. The majority-prior baseline achieved 79.7% accuracy but BA 0.25, illustrating why accuracy alone is misleading under this imbalance. On STATS19, Full DART recall was also highly heterogeneous across source codes, and India temporal testing similarly exposed weak recall for some classes. These results do not support a claim that DART resolves rare-class safety prediction.
The Indian chronological analysis used 3220 observations with usable dates: 2576 earlier observations for training and 644 later observations for testing. Full DART BA fell from 0.9285 under repeated CV to 0.3219 temporally. Removing chainage reduced repeated-CV Full DART BA only to 0.9204, and removing location plus chainage yielded 0.9196; temporal BA remained low (0.3072 without location/chainage). Thus, spatial variables contribute to prediction but do not explain the temporal generalization gap. Leave-one-highway-group-out validation was not possible because no defensible highway-group identifier was available.
7.3. Cross-Dataset Traffic-Sign Feature-Space Validation
The visual experiment evaluates DART as a transformation of fixed image-derived feature spaces rather than as an end-to-end traffic-sign classifier. HOG descriptors and pretrained ResNet18 embeddings were extracted from GTSRB, LISA, and BelgiumTSC, after which the same distance-weighted kNN classifier was applied. This design isolates the effect of feature-space transformation and allows the same DART configuration to be tested across different countries, class structures, and representation types. Table 13 summarizes the conventional-preprocessing comparisons.
Table 13.
Balanced accuracy across traffic-sign datasets under conventional preprocessing and Full DART.
The visual study is deliberately feature-space classification rather than an operational traffic-sign detection system. Consequently, it does not establish robustness to unseen roads, physical-sign identity, video sequence dependence, or deployment corruptions. Aggregate accuracy does not guarantee improved recognition of every safety-critical stop, yield, or speed-limit class. Low-light, blur, occlusion, and small-sign stress testing would require a controlled image-level protocol and is identified as follow-up work rather than inferred from the fixed-feature benchmark.
Full DART improved the untreated representation in five of the six dataset-representation configurations. The strongest effect occurred for GTSRB-HOG, where balanced accuracy increased from 0.7273 to 0.8574, a gain of approximately 13.02 percentage points. BelgiumTSC-HOG provided a second substantial improvement, from 0.8039 to 0.8557 (+5.18 points). The ResNet18 representation improved on all three datasets: +2.95 points on GTSRB, +0.82 points on LISA, and +3.08 points on BelgiumTSC.
The visual results also expose important boundary conditions. LISA-HOG is the only configuration in which Full DART slightly underperformed the untreated representation (0.8876 versus 0.8933), while Quantile-Normal produced the strongest conventional result for LISA-ResNet18 (0.6443). These cases indicate that the benefit of DART depends on the geometry already present in the representation; an already highly discriminative feature space may receive little additional benefit from further transformation.
7.4. Supervised Relevance Control
Because DART uses class labels to estimate Fisher and mutual-information relevance, direct supervised weighting baselines were included to determine whether the visual gains could be explained solely by access to the target labels. Table 14 compares FisherWeight and MIWeight with DART-Fisher, DART-MI, and the complete formulation.
Table 14.
Supervised control analysis across the traffic-sign datasets (balanced accuracy).
The controls show that supervised relevance accounts for a substantial part of the visual improvement, but the strongest formulation varies with the representation. On GTSRB-HOG, DART-MI achieved the highest balanced accuracy at 0.8597, while FisherWeight was strongest for GTSRB-ResNet18. On LISA-HOG, direct Fisher weighting reached 0.9108, whereas Full DART was strongest among the supervised variants for LISA-ResNet18 at 0.6189. BelgiumTSC similarly favored MIWeight for HOG and FisherWeight for ResNet18. The complete formulation should therefore not be interpreted as universally optimal for every feature space.
At the same time, the control results do not reduce the visual experiment to supervision alone. For example, on GTSRB-HOG, incorporating mutual-information relevance inside the bounded DART geometry increased balanced accuracy from 0.8532 with MIWeight to 0.8597 with DART-MI. More generally, the controls reinforce the ablation findings from Section 6: robust normalization, nonlinear bounding, and supervised relevance interact differently across representations, while the complete DART formulation is intended to provide stable general-purpose behavior rather than maximize every individual dataset result.
7.5. Cross-Domain Interpretation
The accident and traffic-sign experiments provide complementary cross-dataset evaluation, but the structured outcomes are heterogeneous and are interpreted dataset by dataset rather than averaged as a common physical severity scale. US evidence shows a matched Full DART advantage over StandardScaler under repeated CV and descriptive state-disjoint validation, while specialized fixed-setting variants can have slightly higher point means. STATS19 similarly favors some supervised controls over default Full DART, and India reveals a large chronological generalization gap. On visual data, Full DART improved the untreated representation in five of six GTSRB, LISA, and BelgiumTSC configurations. The combined evidence therefore supports cross-domain applicability of the transformation without implying universal method ranking, cross-country transfer, or operational safety performance.
The magnitude of the effect is nevertheless representation dependent. Large gains occur when the original geometry leaves substantial room for improvement, as in GTSRB-HOG and BelgiumTSC-HOG. Smaller gains or near-equivalent performance occur when the baseline representation is already strongly discriminative, as in LISA-HOG or the Indian Highway accident dataset. This pattern is consistent with the central geometric interpretation of DART and supports positioning it as a supervised robust feature-space transformation rather than a universal replacement for every scaler or weighting strategy.
8. Discussion
The experiments presented in this study provide evidence that preprocessing can play a more substantial role than simple numerical normalization when the downstream learning algorithm depends directly on the geometry of the feature space. Across the general benchmark, DART achieved the highest overall balanced accuracy and the best average rank among the evaluated preprocessing strategies. More importantly, the subsequent ablation, robustness, and sensitivity experiments provide insight into the conditions under which these improvements occur and the mechanisms that appear to produce them.
8.1. Interpretation of the Geometric Effect
The general benchmark and perturbation experiments consistently show that DART is most useful when the classifier depends on pairwise geometry. kNN obtained the clearest gain, while RBF-SVM benefited more modestly, and random forest was largely unaffected. This pattern is theoretically coherent: DART changes feature magnitudes, bounds extreme standardized values, and reweights dimensions according to supervised relevance, all of which directly influence distance or kernel similarity.
The +100% irrelevant-dimension experiment is particularly informative because it isolates a behavior the method was designed to provide. Standard scaling treats random dimensions as legitimate axes once they have been normalized, whereas DART assigns them little influence when Fisher/MI relevance is low. The much smaller degradation observed for DART therefore provides mechanistic support for the supervised weighting stage.
The practical significance of the main gain should be separated from statistical significance. DART improved overall BA from 0.8036 with StandardScaler to 0.8118, an absolute increase of 0.82 percentage points. This is modest as an average effect. Its practical value is more compelling in kNN, irrelevant-dimension, and outlier experiments, where geometry changes produce larger differences. Logistic regression and random forest show small or absent gains, consistent with weaker dependence on Euclidean neighborhood geometry.
8.2. Robustness and the Role of Nonlinear Bounding
Robust normalization alone did not reproduce full DART performance. Adding the rational saturation stage improved aggregate BA before any supervised relevance was introduced, and DART remained substantially stronger than conventional scaling under severe outlier contamination. The bounded mapping therefore appears to provide a distinct contribution beyond robust center and scale estimation.
Quantile-Normal remained highly competitive for RBF-SVM under severe outliers. This is an important boundary condition: DART should not be described as universally superior to distributional transformations. Its advantage is more compelling when outlier resistance and relevance weighting are both useful, particularly in high-dimensional or contaminated spaces.
8.3. Why Fisher and MI Are Combined
Fisher and MI capture different aspects of relevance. Fisher favors features with strong class separation relative to within-class dispersion, while MI can capture more general dependence. The ablation study shows that neither criterion dominates across all settings: Fisher-only had the highest kNN mean BA, Full DART had the best overall rank and RBF-SVM mean BA, and MI-only achieved a competitive RBF-SVM rank. Equal weighting is therefore a pragmatic default rather than an empirical claim that λ = 0.5 is optimal for every learner.
8.4. Computational Trade-Off and Practical Scope
DART’s principal disadvantage is its fitting cost. Mutual-information estimation is substantially more expensive than ordinary scaling, and the method should therefore be used where training-time preprocessing is acceptable. Once fitted, however, DART transformation is simple and inexpensive, making it suitable for workflows that train periodically and perform many subsequent predictions.
The method is not intended as a universal replacement for standard preprocessing. Its strongest evidence concerns geometry-sensitive classification; scale-insensitive tree ensembles showed little benefit. DART is therefore best positioned as a supervised robust transformation for tasks in which irrelevant dimensions, extreme observations, or heterogeneous feature scales materially affect distances or kernel similarities.
8.5. Road-Safety and Cross-Modal Interpretation
The road-safety results provide a cautious external test of DART under heterogeneous structured outcomes. In the US cohort, default Full DART improved fixed-k repeated-CV BA over StandardScaler (0.2906 vs. 0.2774; approximate corrected 95% CI for the paired gain 0.00327–0.02304) and retained a smaller descriptive advantage in state-disjoint folds (0.2814 vs. 0.2746). However, DART-tau1.5 and Balanced-Fisher DART had slightly higher fixed-setting US point means, and rare-class recall remained poor. STATS19 showed a small Full DART improvement over StandardScaler but stronger performance from FisherWeight and Balanced-Fisher DART. India reproduced high within-distribution BA yet showed a major chronological generalization gap. These findings do not establish operational crash-severity prediction, future-period robustness, or cross-country transfer. Predictor relevance is associative rather than causal and should not be interpreted as countermeasure effectiveness.
The traffic-sign experiments broaden this evidence from structured records to visual feature spaces. Full DART improved the untreated HOG or ResNet18 representation in five of six configurations across GTSRB, LISA, and BelgiumTSC, with the largest gains on GTSRB-HOG and BelgiumTSC-HOG. The supervised controls also show that relevance weighting is an important contributor and that Full DART is not uniformly superior to specialized Fisher or MI weighting. The road-safety evidence therefore supports cross-domain applicability while preserving the more cautious conclusion established by the general benchmark: DART is most useful when feature-space geometry can be materially improved.
8.6. Limitations
DART is a supervised transformation and must therefore be fitted exclusively on training data to prevent information leakage. Its benefits are most pronounced for geometry-sensitive classifiers such as kNN and RBF-SVM, while the estimation of supervised relevance, particularly mutual information, introduces additional training-time cost compared with conventional scaling. The road-safety experiments also indicate that performance can vary across datasets, classes, and validation settings, motivating further evaluation under temporal and geographic distribution shifts and for rare safety-critical classes. Finally, DART relevance weights represent predictive associations rather than causal effects. These considerations motivate future work on more efficient relevance estimation, interaction-aware weighting, and broader validation across classifiers, representations, and application domains.
8.7. Future Research Directions
The present results suggest several extensions.
One direction is to develop an adaptive formulation in which τ, γ, or λ are estimated from training data rather than fixed globally. Such adaptation should be designed carefully to avoid introducing excessive computational cost or dataset-specific overfitting.
A second direction concerns feature interactions. Extending the relevance mechanism from individual features to feature groups could allow DART to preserve dimensions that are weak individually but informative jointly.
A third direction is computational optimization. Parallel mutual-information estimation, GPU acceleration, or approximate relevance estimation could reduce training time on large datasets.
Another promising extension is tighter integration with learned representations. The present traffic-sign experiments apply DART after extracting fixed ResNet18 embeddings; a future formulation could incorporate relevance-weighted bounded geometry during representation learning itself, allowing the feature extractor and transformation to be optimized jointly while preserving leakage-safe supervision.
Finally, the road-safety evaluation could be extended beyond the present accident-severity and traffic-sign recognition tasks to crash-risk prediction, hazardous-location identification, pedestrian or cyclist risk assessment, and multimodal transportation-safety analysis. Such studies would help determine whether the robustness properties observed here remain useful across additional intelligent-transportation problems.
9. Conclusions
This study introduced DART, a supervised preprocessing transformation that integrates robust median/MAD normalization, bounded nonlinear compression, and continuous feature relevance weighting based on Fisher separability and mutual information. The method modifies feature-space geometry rather than merely placing variables on comparable numerical scales, with the objective of reducing the influence of extreme observations while emphasizing dimensions that carry useful class-discriminative information.
The road-safety analysis further limits the scope of the claims. US Accidents is treated as retrospective traffic-impact severity rather than injury severity. For the 20,000-record US cohort, default Full DART improved fixed-k repeated-CV BA from 0.2774 to 0.2906 relative to StandardScaler and nested Full DART reached 0.3011 versus 0.2797 under an equal tuning budget. State-disjoint results remained directionally favorable, but default Full DART was not the top fixed-setting point estimate, and rare-class recall remained poor. For STATS19, Full DART improved modestly over StandardScaler but did not outperform every supervised control. For India, the repeated-CV BA of 0.9285 contrasted sharply with the temporal BA of 0.3219, and location-removal experiments did not eliminate the temporal gap. Traffic-sign results likewise remain representation-dependent.
Taken together, the results support DART as a geometry-aware supervised preprocessing strategy whose value is greatest for distance- and kernel-sensitive classifiers in heterogeneous, contaminated, or partially irrelevant feature spaces. The principal limitations are the modest average improvement, classifier dependence, additional fitting cost, vulnerability to distribution shift, and the predictive—not causal—meaning of class-informed feature relevance. DART should therefore be considered a practical geometry-adaptation option rather than a universal replacement for standard scaling, supervised weighting, or metric learning.
Supplementary Materials
The following supporting information can be downloaded at: https://www.mdpi.com/article/10.3390/technologies14110688/s1, Table S1: Conventional-benchmark dataset manifest (reconstructed); Table S2: Supervised-control dataset manifest; Table S3: US restricted-predictor audit; Table S4: US conventional-protocol predictor documentation; Table S5: STATS19 predictor and missingness audit (reconstructed); Table S6: Indian source-field missingness; Table S7: Indian retained and derived predictors; Table S8: Indian severity code definitions and counts; Table S9: Dataset-level kNN-DART results; Table S10: US matched result summaries; Table S11: STATS19 supervised-control result summary; Table S12: Protocol-specific table-value comparison. The Indian severity definitions in Table S8 follow References [25,26].
Author Contributions
Conceptualization, T.B.-A.; methodology, T.B.-A.; software, T.B.-A.; validation, T.B.-A. and M.E.G.; formal analysis, T.B.-A., K.E.F. and M.A.M.; investigation, T.B.-A. and M.E.G.; data curation, T.B.-A. and M.E.G.; writing—original draft preparation, T.B.-A.; visualization, T.B.-A.; supervision, H.T. and J.R.; project administration, J.R. All authors have read and agreed to the published version of the manuscript.
Funding
This research received no external funding.
Data Availability Statement
The code supporting the findings of this study is available from the corresponding author upon reasonable request. During the preparation of this manuscript, the authors used large language model assistants to improve writing fluency and grammar. All scientific content, experimental design, results, and conclusions were generated, verified, and edited exclusively by the authors.
Conflicts of Interest
The authors declare no conflict of interest.
References
- World Health Organization. Global Status Report on Road Safety 2023; WHO: Geneva, Switzerland, 2023; Available online: https://www.who.int/publications/i/item/9789240086517 (accessed on 14 August 2026).
- Amiri, M.A.; Afshari, S.; Soltani, A. Machine learning approaches to traffic accident severity prediction: Addressing class imbalance. Mach. Learn. Appl. 2025, 22, 100792. [Google Scholar] [CrossRef] [Scilit]
- Yeo, I.-K.; Johnson, R.A. A new family of power transformations to improve normality or symmetry. Biometrika 2000, 87, 954–959. [Google Scholar] [CrossRef] [Scilit]
- Guyon, I.; Elisseeff, A. An Introduction to Variable and Feature Selection. J. Mach. Learn. Res. 2003, 3, 1157–1182. [Google Scholar] [CrossRef] [Scilit]
- Battiti, R. Using mutual information for selecting features in supervised neural net learning. IEEE Trans. Neural. Netw. 1994, 5, 537–550. [Google Scholar] [CrossRef] [Scilit] [PubMed]
- Huang, D.; Chow, T.W.S. Effective feature selection scheme using mutual information. Neurocomputing 2005, 63, 325–343. [Google Scholar] [CrossRef] [Scilit]
- Cang, S.; Yu, H. Mutual information based input feature selection for classification problems. Decis. Support Syst. 2012, 54, 691–698. [Google Scholar] [CrossRef] [Scilit]
- Xue, B.; Zhang, M.; Browne, W.N.; Yao, X. A Survey on Evolutionary Computation Approaches to Feature Selection. IEEE Trans. Evol. Comput. 2016, 20, 606–626. [Google Scholar] [CrossRef] [Scilit]
- Sun, L.; Wang, T.; Ding, W.; Xu, J.; Lin, Y. Feature selection using Fisher score and multilabel neighborhood rough sets for multilabel classification. Inf. Sci. 2021, 578, 887–912. [Google Scholar] [CrossRef] [Scilit]
- Ali, Y.; Hussain, F.; Haque, M.M. Advances, challenges, and future research needs in machine learning-based crash prediction models: A systematic review. Accid. Anal. Prev. 2024, 194, 107378. [Google Scholar] [CrossRef] [Scilit] [PubMed]
- Kuo, P.-F.; Hsu, W.-T.; Lord, D.; Putra, I.G.B. Classification of autonomous vehicle crash severity: Solving the problems of imbalanced datasets and small sample size. Accid. Anal. Prev. 2024, 205, 107666. [Google Scholar] [CrossRef] [Scilit] [PubMed]
- Bazarnovi, S.; Mohammadian, A. Addressing imbalanced data in predicting injury severity after traffic crashes: A comparative analysis of machine learning models. Procedia Comput. Sci. 2024, 238, 24–31. [Google Scholar] [CrossRef] [Scilit]
- Chen, J.; Liu, P.; Wang, S.; Zheng, N.; Guo, X. Prediction and interpretation of crash severity using machine learning based on imbalanced traffic crash data. J. Saf. Res. 2025, 93, 185–199. [Google Scholar] [CrossRef] [Scilit] [PubMed]
- Chai, A.B.Z.; Lau, B.T.; Tee, M.K.T.; McCarthy, C. Enhancing road safety with machine learning: Current advances and future directions in accident prediction using non-visual data. Eng. Appl. Artif. Intell. 2024, 137, 109086. [Google Scholar] [CrossRef] [Scilit]
- Duan, J.; Zou, Y. Discriminative projective dictionary pair based broad metric learning system: Algorithm and its applications in pattern classification. Artif. Intell. Rev. 2025, 58, 319. [Google Scholar] [CrossRef] [Scilit]
- Yan, M.; Jiang, N.; Li, N. TML-DA: Transfer metric learning based distribution alignment framework for domain class imbalanced classification. Knowl.-Based Syst. 2025, 311, 113086. [Google Scholar] [CrossRef] [Scilit]
- Mou, Y.; Jian, Z.; Bai, H.; Gou, C. How Classification Baseline Works for Deep Metric Learning: A Perspective of Metric Space. In Proceedings of the 16th Asian Conference on Machine Learning, PMLR 260, Hanoi, Vietnam, 5–8 December 2025; pp. 64–78. Available online: https://proceedings.mlr.press/v260/mou25a.html (accessed on 27 August 2026).
- Niño-Adan, I.; Manjarres, D.; Landa-Torres, I.; Portillo, E. Feature weighting methods: A review. Expert Syst. Appl. 2021, 184, 115424. [Google Scholar] [CrossRef] [Scilit]
- Weinberger, K.Q.; Saul, L.K. Distance Metric Learning for Large Margin Nearest Neighbor Classification. J. Mach. Learn. Res. 2009, 10, 207–244. Available online: https://jmlr.org/papers/v10/weinberger09a.html (accessed on 27 August 2026).
- Rousseeuw, P.J.; Croux, C. Alternatives to the Median Absolute Deviation. J. Am. Stat. Assoc. 1993, 88, 1273–1283. [Google Scholar] [CrossRef]
- Duda, R.O.; Hart, P.E.; Stork, D.G. Pattern Classification, 2nd ed.; John Wiley & Sons: Hoboken, NJ, USA, 2000; ISBN 9780471056690. [Google Scholar]
- Vanschoren, J.; van Rijn, J.N.; Bischl, B.; Torgo, L. OpenML: Networked science in machine learning. SIGKDD Explor. 2013, 15, 49–60. [Google Scholar] [CrossRef] [Scilit]
- Moosavi, S. US Accidents (2016–2023). Available online: https://www.kaggle.com/datasets/sobhanmoosavi/us-accidents (accessed on 18 August 2026).
- Department for Transport. Road Safety Open Data, GOV.UK. Available online: https://www.gov.uk/government/statistical-data-sets/road-safety-open-data (accessed on 18 August 2026).
- Khanum, H.; Garg, A.; Faheem, M.I.; Kulkarni, R. Accident Data of Selected Indian Highways for Accident Severity Prediction Using Machine Learning Models, Dataset, Version 1; Zenodo: Geneva, Switzerland, 2025. [Google Scholar] [CrossRef]
- Khanum, H.; Garg, A.; Faheem, M.I.; Kulkarni, R. A methodological framework for road accident severity prediction for indian highways using machine learning models. MethodsX 2025, 15, 103728. [Google Scholar] [CrossRef] [Scilit] [PubMed]
- Stallkamp, J.; Schlipsing, M.; Salmen, J.; Igel, C. Man vs. computer: Benchmarking machine learning algorithms for traffic sign recognition. Neural. Netw. 2012, 32, 323–332. [Google Scholar] [CrossRef] [Scilit] [PubMed]
- Møgelmose, A.; Trivedi, M.M.; Moeslund, T.B. Vision-Based Traffic Sign Detection and Analysis for Intelligent Driver Assistance Systems: Perspectives and Survey. IEEE Trans. Intell. Transp. Syst. 2012, 13, 1484–1497. [Google Scholar] [CrossRef] [Scilit]
- Mathias, M.; Timofte, R.; Benenson, R.; Van Gool, L. Traffic sign recognition—How far are we from the solution? In Proceedings of the 2013 International Joint Conference on Neural Networks (IJCNN), Dallas, TX, USA, 4–9 August 2013; pp. 1–8. [Google Scholar] [CrossRef] [Scilit]
- Brodersen, K.H.; Ong, C.S.; Stephan, K.E.; Buhmann, J.M. The Balanced Accuracy and Its Posterior Distribution. In Proceedings of the 2010 20th International Conference on Pattern Recognition, Istanbul, Turkey, 23–26 August 2010; pp. 3121–3124. [Google Scholar] [CrossRef] [Scilit]
- Demšar, J. Statistical Comparisons of Classifiers over Multiple Data Sets. J. Mach. Learn. Res. 2006, 7, 1–30. Available online: https://jmlr.org/papers/v7/demsar06a.html (accessed on 27 August 2026).
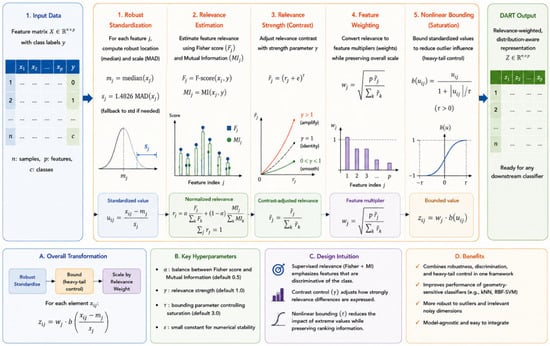
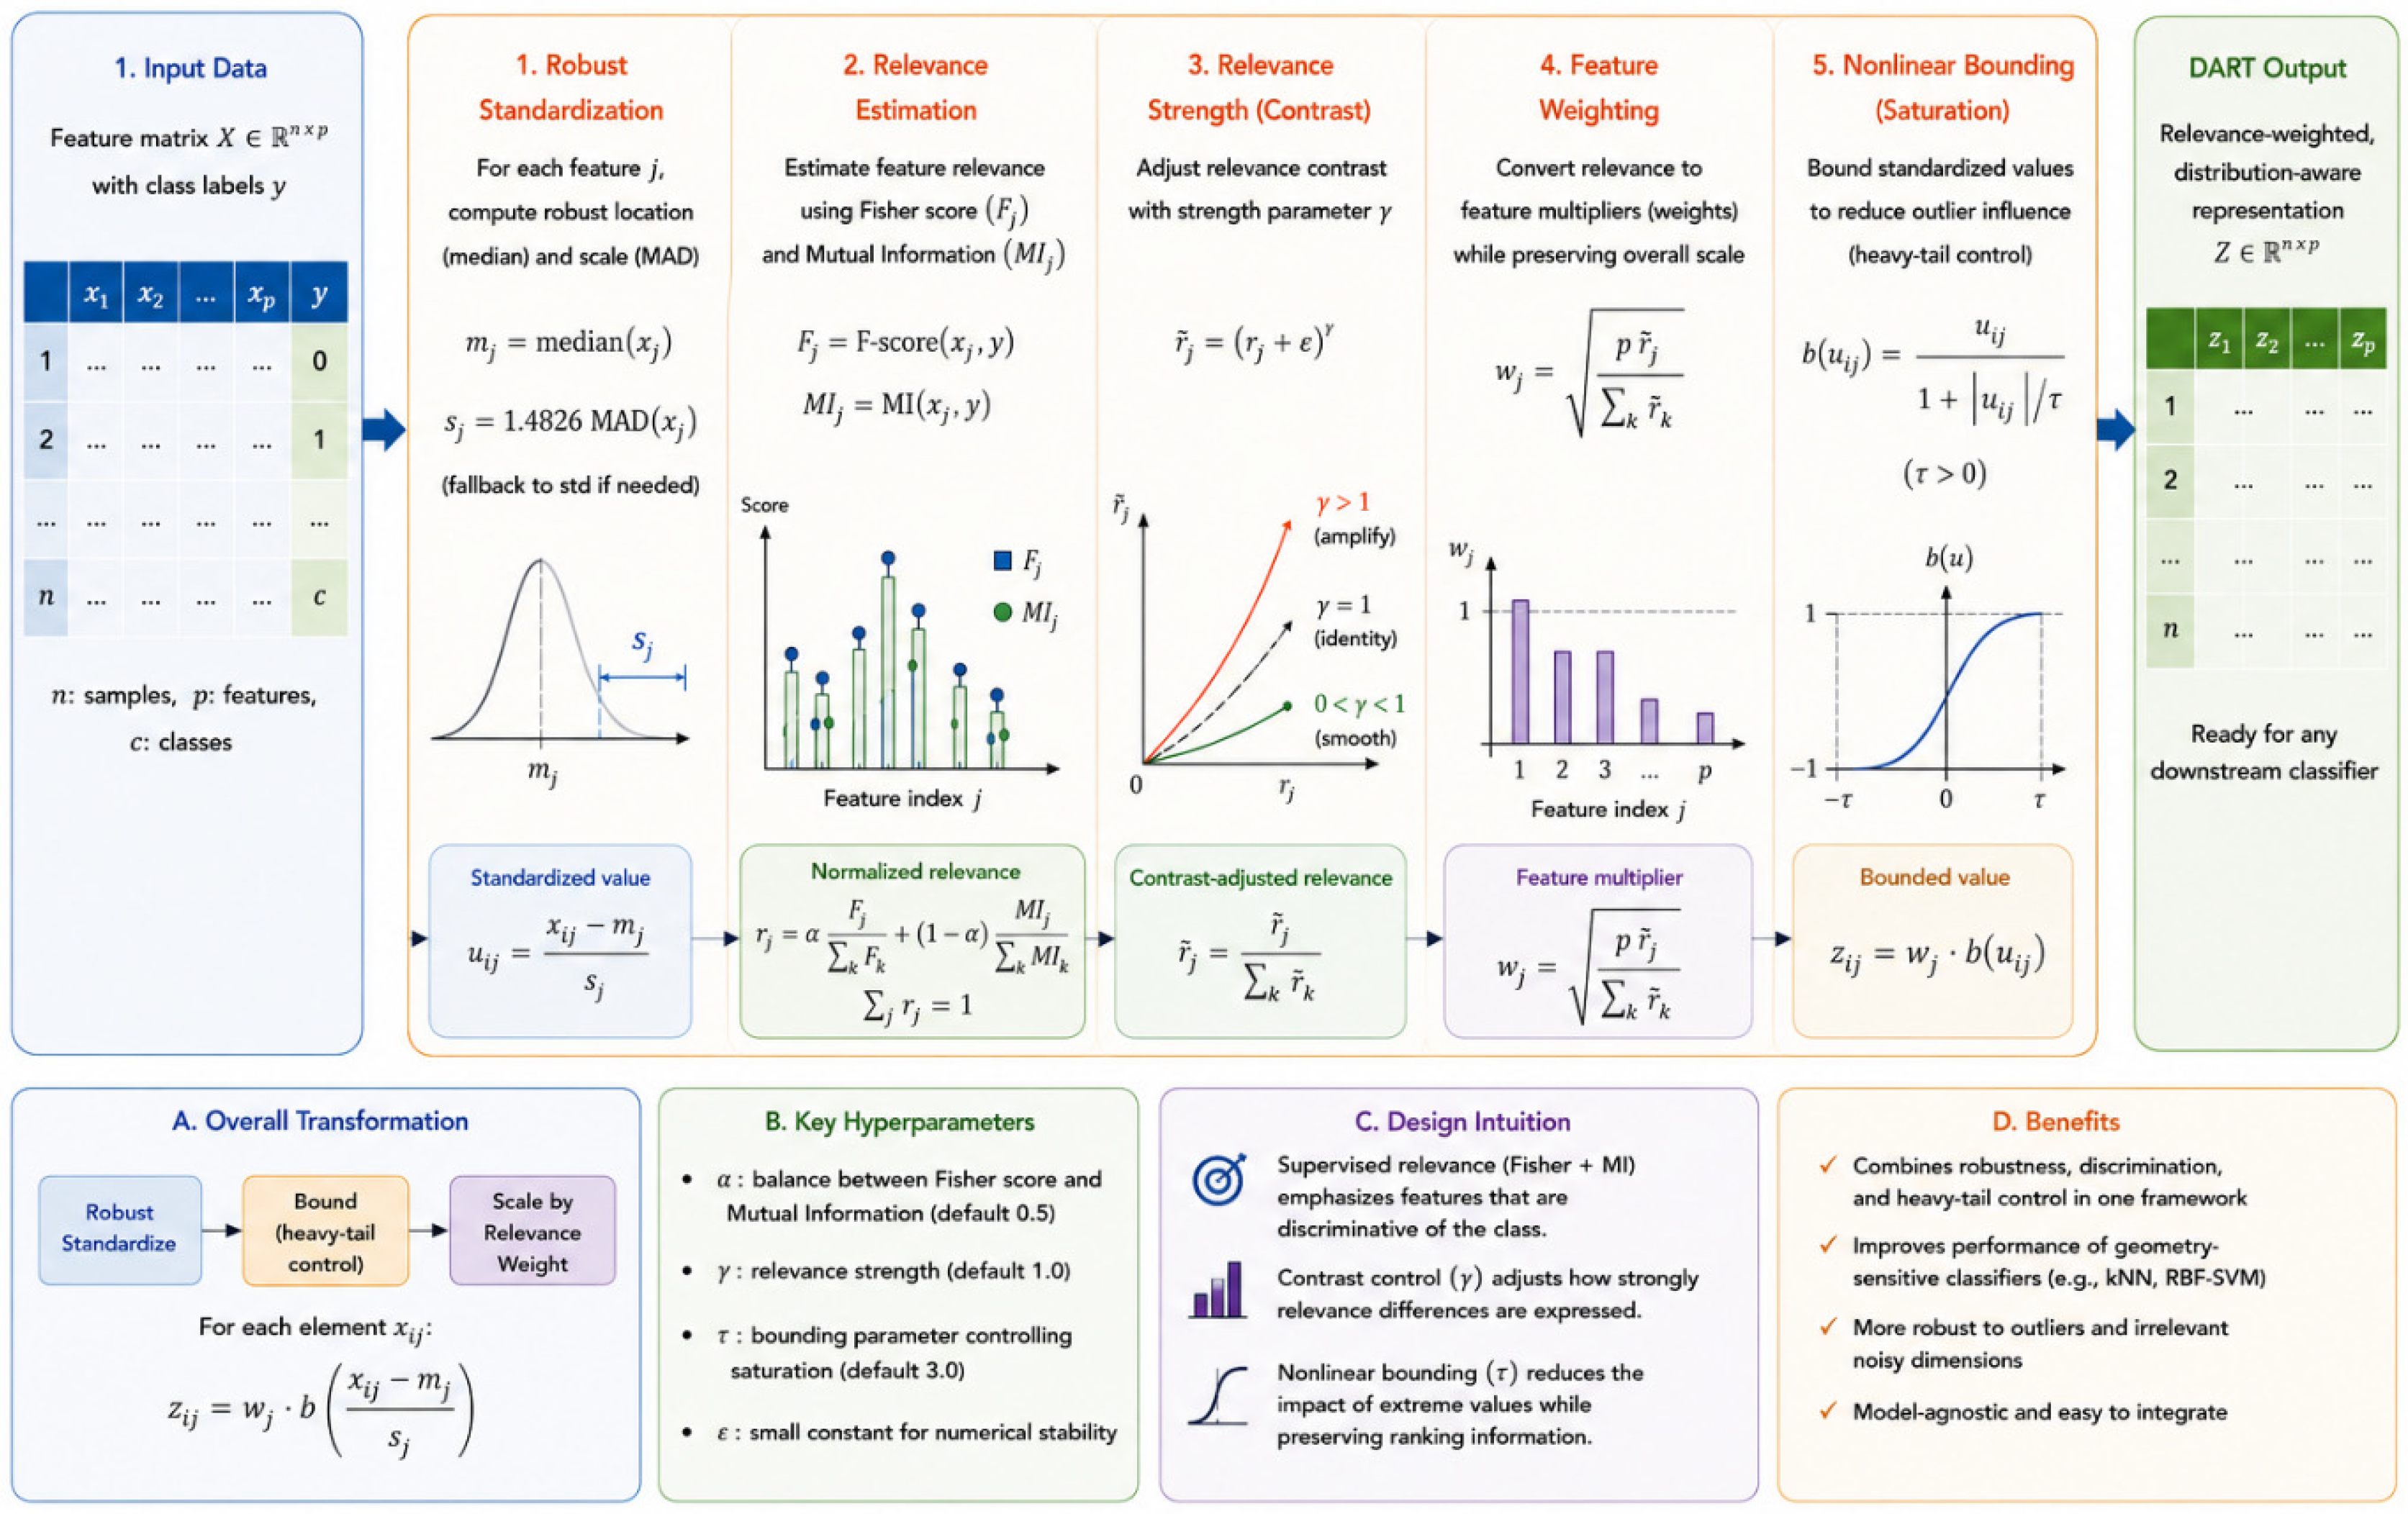

Disclaimer/Publisher’s Note: The statements, opinions and data contained in all publications are solely those of the individual author(s) and contributor(s) and not of MDPI and/or the editor(s). MDPI and/or the editor(s) disclaim responsibility for any injury to people or property resulting from any ideas, methods, instructions or products referred to in the content. |
© 2026 by the authors. Licensee MDPI, Basel, Switzerland. This article is an open access article distributed under the terms and conditions of the Creative Commons Attribution (CC BY) license.