


Abstract
This paper establishes an integrated framework combining self-induced vibration measurements with deep learning for vibration-based remaining useful life (RUL) prediction of mechanical frame structures in mobile robots. The main innovations comprise (1) a self-induced vibration excitation system that utilizes the robot’s drive wheels to generate controlled mechanical oscillations, using a five-sensor micro-electro-mechanical system (MEMS) accelerometer array to capture non-uniform vibration mode shapes across the robot’s structure, and (2) a processing pipeline for RUL prediction using accelerometer data and early feature fusion in two machine-learning models (long short-term memory (LSTM) and a convolutional neural network (CNN)). Our research methodology includes (i) modal analysis to identify the robot’s natural frequencies, (ii) verification platform evaluation, comparing low-cost MEMS accelerometers against a reference integrated electronic piezoelectric (IEPE) accelerometer, demonstrating industrial-grade measurement quality (coherence > 98%, uncertainty 4.79–7.21%), and (iii) data-driven validation using real data from the mechanical frame, showing that the LSTM model outperforms the CNN with a 2.61× root-mean-square error (RMSE) improvement (R2 = 0.99). Our solution demonstrates that early feature fusion provides sufficient information to model degradation and detect faults early at a lower cost, offering a feasible alternative to classical maintenance procedures through combined hardware validation and lightweight software suitable for Industrial Internet-of-Things (IIoT) deployment.
1. Introduction
Mobile robotics continues to expand across multiple industrial applications, including warehouse automation, manufacturing, logistics operations, healthcare, and emerging smart city deployments [1,2]. These systems perform tasks ranging from material transport to manipulation and inspection, often operating in environments where mechanical reliability is essential for continuous operation. In smart cities, mobile robots are increasingly deployed for surveillance, maintenance tasks, delivery services, infrastructure monitoring, and autonomous transportation, creating connected and efficient urban environments [3]. As mobile robots are deployed for longer operational periods and more demanding tasks across these diverse applications, the need for effective condition monitoring and fault detection becomes increasingly important.
Existing condition monitoring methods for industrial systems in general, and robotic systems in particular, primarily focus on continuous monitoring during operational tasks, utilizing motor current signatures, motor encoder signals, or permanently mounted vibration sensors [4,5,6,7,8,9,10].
For mechanical structures in industrial systems, vibration-based condition monitoring represents a well-established approach, as mechanical degradation often manifests through characteristic vibration patterns before catastrophic failure occurs [11,12,13,14]. Recent entropy-based feature extraction methods, including refined time-shift multi-scale phase entropy [15], cumulative spectrum distribution entropy [16], and multi-mode feature entropy [17], have demonstrated very good effectiveness for rotating-machinery fault diagnosis under varying operational conditions. Beyond rotating machinery, manipulator robots have also received attention for component-level fault detection, including vibration-based collision detection [18], gearbox fault diagnosis [8], and joint degradation monitoring.
Existing fault detection research for mobile robots has addressed diverse failure modes but primarily focuses on component-level diagnostics and operational monitoring rather than pre-operational structural health assessment. Early work developed kinematic and dynamic modeling approaches with torque-filtering techniques to detect wheel-level faults, such as radius changes from tire deformation, broken spokes, or flat tires, as well as slipping and skidding disturbances [19]. Recent advances have employed unsupervised anomaly detection frameworks combining audio and inertial measurement unit (IMU) sensors to identify collisions and internal mechanical faults during autonomous operation [20], while graph-based approaches utilizing fault-knowledge-enhanced graph convolutional networks have been proposed for multi-sensor fault diagnosis in mobile robots [21].
Multiple applications of vibration analysis in mobile robotics have been reported: suspension performance evaluation using piezoelectric accelerometers positioned at frame corners during obstacle crossing [22], terrain classification for adaptive navigation through online vibration signal analysis [23], and AI-enabled predictive maintenance frameworks employing single IMU sensors with a 1D CNN to classify operational faults, including loose assembly, structural imbalance, and collision-induced vibrations [24]. However, these approaches share common limitations: They either target specific component failures (wheels, motors, and sensors), employ single-point or dual-point measurement configurations lacking comprehensive spatial coverage, or focus on operational condition monitoring during task execution rather than controlled pre-operational diagnostics. The systematic characterization of progressive mechanical degradation in bolted-frame connections through multi-sensor spatial arrays under controlled pre-operational testing conditions—enabling the early detection of structural looseness before operational deployment—remains underexplored in mobile robot research.
Mobile wheeled robots present several distinct technical challenges for vibration-based condition monitoring that differentiate them from stationary industrial machinery. First, mobile robots operate across varying terrains, payload conditions, and movement patterns, creating non-stationary vibration baselines that complicate fault signature extraction. Second, spatial constraints and power limitations make permanent high-density sensor networks impractical, requiring strategic minimal sensor deployment with maximal diagnostic coverage. Third, onboard embedded computing requirements preclude laboratory-grade data acquisition systems, demanding computationally efficient signal processing and machine-learning architectures suitable for resource-constrained platforms. Fourth, controlled vibration excitation for diagnostic testing presents implementation tradeoffs for mobile platforms. While laboratory test benches employ dedicated electrodynamic shakers, and miniature electromagnetic shakers or piezoelectric actuators could be integrated onboard, this approach introduces practical challenges: increased payload mass reducing operational efficiency, elevated power consumption from limited battery capacity, additional signal conditioning electronics increasing system complexity, potential electromagnetic interference (EMI) affecting onboard sensors and communication systems, and spatial constraints within compact robot chassis. An elegant alternative—self-induced excitation through programmed drive wheel actuation patterns—eliminates auxiliary hardware, avoids EMI from amplifier circuits, consumes only operational-level power, and excites the structure without additional mass.
Traditionally, vibration analysis has relied on piezoelectric accelerometers, which involve high acquisition costs, complex signal-conditioning requirements, and challenges in distributed data collection. Micro-electro-mechanical system-type accelerometers have emerged as a compelling alternative, offering significant advantages, including lower acquisition costs (typically of the cost of IEPE sensors), compact form factors, low power consumption, and seamless integration with embedded computing platforms [25]. Studies have demonstrated that MEMS accelerometers provide feasible solutions for vibration pattern characterization across an expanding range of applications [26,27,28].
Machine-learning (ML) techniques have proven to be effective for condition monitoring across industrial machinery [29], mechanical components [30], and robotic systems, with applications ranging from simulated models to real experimental data [24,31]. Within this context, remaining useful life estimation has emerged as a critical metric for predictive maintenance, enabling the prediction of the operational time remaining before a component requires intervention. By monitoring mechanical degradation from a healthy condition through progressive fault stages, RUL models can predict the future component state, facilitating condition-based maintenance scheduling. Recent scientific literature has increasingly adopted hybrid deep learning architectures, particularly convolutional neural networks along with long short-term memory networks, for RUL prediction tasks [32]. This research similarly employs dual-paradigm CNN/LSTM architectures to estimate RUL for mobile robots’ mechanical structures [33]. This paradigm demonstrates the applicability of RUL-based predictive maintenance to mobile robots’ mechanical structures. Based on these findings, this work proposes a novel hybrid hardware–software methodology for the periodic vibration-based health assessment of mechanical frame structures in mobile wheeled robots.
The primary contributions of this research comprise three distinct aspects:
- We present the comparative verification of a MEMS accelerometer array against a reference IEPE accelerometer using a TIRA electrodynamic shaker, demonstrating its suitability for fault detection in mobile robot mechanical frame structures across the 20–120 Hz frequency range;
- We develop and experimentally validate the periodic testing methodology on a mobile bare-bones robot employing a self-induced vibration excitation method. We use a progressive degradation approach that includes four distinct fault categories representing coupling misalignment gaps of 0 m (baseline), 100 m, 250 m, and 500 m. This systematic approach models realistic mechanical degradation trajectories, enabling the detection of incipient faults at earlier stages to minimize catastrophic failures—a critical capability for predictive maintenance strategies;
- We propose an early feature-level fusion strategy employing five strategically positioned MEMS accelerometers (fifteen channels: five sensors × three axes) to capture spatially distributed vibration patterns across the robot’s mechanical frame structure. The multi-sensor architecture implements two parallel processing pathways: (i) a spectrogram-based CNN pipeline that stacks all 15 channels into unified frequency-domain methods [34,35], enabling convolutional filters to learn cross-sensor spatial–spectral correlations through implicit weight optimization, and (ii) a time-domain [36,37] LSTM pipeline that concatenates 160-dimensional feature vectors (eight statistical features × twenty signals, including triaxial magnitudes) to temporal sequences, allowing recurrent layers to model degradation dynamics across spatially fused representations. This early fusion approach preserves raw inter-sensor correlations that are critical for identifying spatially distributed failure modes, while the five-sensor redundancy provides five times more training data channels compared to single-sensor configurations, addressing the data-hungry nature of deep learning architectures and ensuring robust convergence in RUL prediction tasks [38].
The rest of the paper is structured as follows: In Section 2, we present the materials and research methodologies for both vibration pattern analysis and RUL prediction. Section 3 reports our experimental findings. In Section 4, we discuss the limitations and advantages of our solution and its potential impacts. Finally, in Section 5, we draw our conclusions and present future research directions, especially in the context of smart autonomous robots.
2. Materials and Methods
This paper presents an approach for the remaining useful life prediction of mobile robot mechanical frame structures based on vibration-based condition monitoring during controlled pre-operational diagnostic tests. Unlike many condition-monitoring approaches that focus on drivetrain components (motors, gearboxes, and bearings), this work attempts to address the structural integrity assessment of the robot’s assembled frame—the aluminum profile chassis and bolted-joint connections. Self-induced vibration patterns from the robot’s drive wheels are investigated as potential indicators of mechanical assembly degradation, particularly progressive looseness in bolted joints.
The approach is structured in five stages that aim to establish a comprehensive framework progressing from hardware validation through proof-of-concept demonstration:
- Modal Analysis of the Robot Structure (Section 2.1): This examines the natural vibration frequencies and mode shapes of the robot structure through finite element analysis. This stage seeks to establish the dynamic characteristics of the structure and to inform the selection of excitation frequencies and sensor bandwidths for the subsequent experimental validation;
- Verification Platform for the Vibration-Monitoring Array (Section 2.2): This evaluates the performance of low-cost MEMS accelerometers in relation to a reference IEPE accelerometer using a laboratory testbed. This stage aims to assess whether the MEMS sensors can provide sufficiently accurate and consistent measurements for use in machine-learning model training and evaluation;
- Wheeled Robot Experimental Platform (Section 2.3): This describes the bare-bone wheeled robot configuration and the controlled introduction of mechanical degradation via progressive bolted-joint gaps (0, 100, 250, and 500 m). This stage is designed to generate vibration datasets representing different structural health states for experimental validation using all five MEMS sensors;
- Multi-Model RUL Prediction Pipeline (Section 2.4): This presents the multi-layer software architectures that process raw multi-sensor vibration data to RUL predictions through CNN and LSTM models with early fused features. This stage demonstrates an attempt to combine spatial information from distributed accelerometers with temporal degradation patterns;
- Proposed Operational Diagnostic Workflow (Section 2.5): This outlines a proposed pre-operational diagnostic protocol with defined decision thresholds (OK, INFO, WARNING, and DANGER) that translate RUL predictions to practical maintenance considerations.
This five-stage structure seeks to provide systematic validation of each component—hardware, platform, algorithms, and operational integration—though the effectiveness of each stage, and their integration remains to be demonstrated through the experimental results presented in Section 3.
2.1. Modal Analysis of the Robot Structure
To ensure accurate fault detection and distinguish resonance phenomena from mechanical faults, a modal analysis of the robot structure was conducted, using the finite element method (FEM). Modal analysis identifies primarily the natural frequencies, damping characteristics, and mode shapes of the robotic structure—characteristics that are essential for understanding its dynamic behavior and to prevent resonance-induced damage during operation. Thus, the knowledge of structural natural frequencies might permit the proper selection of operational speeds and sensor frequency ranges to avoid resonance conditions that could amplify unwanted vibrations and baffle the fault detection algorithms.
A streamlined version of the computer-aided design (CAD) assembly was developed by simplifying the geometric features of the robotic mechanical structure to improve the computational efficiency in finite element analysis. Non-essential geometric details (i.e., small fillets, chamfers, and threaded features) were suppressed or simplified to reduce the mesh complexity while preserving the essential structural characteristics affecting the modal behavior (Figure 1).
Figure 1.
The bare-bone wheel robot (left) and its streamlined version (right).
2.2. Verification Platform for the Vibration-Monitoring Array
To assess the suitability of a cost-effective MEMS accelerometer array for monitoring the vibration distribution across the mechanical structure, a verification platform was developed to conduct preliminary short validation tests.
For mobile robot applications, digital accelerometers offer practical advantages: relatively easy permanent integration onto mechanical frames, simplified electrical connectivity, built-in signal conditioning, cost scalability for sensor arrays, and seamless integration with onboard computational resources for real-time fault diagnosis. Due to spatial limitations in the mobile robot platform, a multi-chip module (MCM) MPU-9250 was selected to integrate the triaxial accelerometer functionality. The MCM design enables versatile deployment configurations and supports multiple sensor usage scenarios within a minimal footprint.
Since the focus in this phase is limited to acceleration measurements, the MCMs were configured to function solely as triaxial accelerometers, with gyroscope and magnetometer modules disabled.
2.2.1. Accelerometer-Based Vibration-Monitoring Array
The sensor array consists of five MPU-9250 multi-chip modules (MCMs). Each MPU-9250 integrates three independent MEMS sensors: a triaxial accelerometer (from a ±2 g to a ±16 g range), a triaxial gyroscope (from a ±250°/s to a ±2000°/s range), and a triaxial magnetometer (with a ±4800 µT range), all managed by an onboard digital motion processor™ (DMP). In this setup, only the triaxial accelerometer is enabled to focus on vibration measurement.
A commercial MPU-9250 development board, equipped with the necessary support components for seamless integration into embedded systems, was used in this setup.
2.2.2. Embedded Processing Unit
The Raspberry Pi Pico 2W, built around the high-performance RP2350 dual-core microcontroller, serves as the embedded processing unit for the verification platform, enabling real-time acceleration data acquisition. It supports seamless integration with multiple MPU-9250 sensor modules via its serial peripheral interface (SPI).
2.2.3. Verification Platform Structure
Prior to mounting the MPU-9250 module on the robot, the sensor consistency and reliability must be verified to ensure accurate fault detection. MEMS-based accelerometers are susceptible to bias offsets, scale factor variations, thermal sensitivity, and cross-axis sensitivity errors. Therefore, it is essential to confirm that the sensor outputs are accurate and repeatable within the specified operating conditions [39,40].
Sensor consistency verification involves comparing multiple MCM units against a high-precision reference accelerometer sensor under identical excitation conditions to validate their measurement accuracies and identify discrepancies that may appear. This validation process is essential for multi-sensor systems, where inconsistent measurements can compromise fault detection performance and lead to false positives or missed fault events.
The testbed designed for verification purposes consists of precision vibration generation and measurement equipment to characterize MEMS accelerometer module response characteristics, as can be observed in Figure 2.
Figure 2.
Verification platform for the vibration-monitoring array: 1—function generator (DS 345), 2—power amplifier (BAA 120), 3—vibration exciter (S 51110), 4—digital oscilloscope, 5—accelerometer (Brüel & Kjær Type 4507-B-006), 6—battery-powered signal conditioner (model 480C02), 7—five multi-chip module accelerometers, 8—Raspberry Pi Pico 2W, 9—laptop.
The excitation signal is generated by a DS345 (1) function generator (Stanford Research Systems Inc., Sunnyvale, CA, USA), configured to produce a sinusoidal linear sweep waveform. The frequency sweep ranges from 20 Hz to 120 Hz, encompassing the fundamental natural frequencies of the robot structure, as identified through modal analysis. The amplitude of the signal is maintained constant at 1 Vpp throughout the frequency sweep to ensure consistent excitation levels for all the tested sensors.
The signal from the generator is applied to a vibration test system (TV 51110, TIRA GmbH, Schalkau, Germany), which comprises a power amplifier (BAA 120) (2) and a vibration exciter (S 51110) (3). This configuration enables controlled mechanical vibration generation across the desired frequency range, with sufficient force to excite the mounted sensor array. For visualization and signal quality verification purposes, the excitation signal is simultaneously applied to an SDS1202X-E (4) oscilloscope (Siglent Technologies, Shenzhen, China), allowing the real-time monitoring of waveform characteristics and ensuring signal integrity during testing.
On the vibration exciter flange, a mounting bracket with an aluminum alloy bar is installed that has on it five MCM units, MPU 9250, and a professional reference CCLD (Constant-Current Line Drive) accelerometer (5) Type 4507-B-006 (Brüel & Kjær, Nærum, Denmark).
The MCM units are mounted on the metallic bar by custom 3D-printed brackets, constructed based on the information gathered in [41] and secured with screws. The miniature single-axis Brüel & Kjær 4507-B-006 piezoelectric accelerometer, specifically designed for modal analysis, is attached to the same aluminum bar using a special wax. This accelerometer connects to a battery-powered signal conditioner (6), model 480C02 (PCB Piezotronics, Depew, NY, USA), providing low-noise signal amplification compatible with IEPE standards.
The five MPU 9250 MCMs (7) are connected to a Raspberry Pi Pico 2W (8) mini development board through an SPI bus, enabling high-speed data acquisition with minimal latency. The reference Brüel & Kjær accelerometer signal is connected to an analog input pin on the same Raspberry Pi Pico 2W board for synchronized data collection. All the MCMs are mounted with identical axis orientations to ensure consistent measurement references across the sensor array. The Raspberry Pi Pico 2W board is interfaced with a laptop computer via a universal serial bus (USB) connection, establishing a virtual serial port for real-time data logging and analysis.
The accelerometers’ output data rate of the MCMs is set at 1 kHz to capture high-frequency vibration components with sufficient temporal resolution. The full-scale range is configured to ±4 g, which is appropriate for the expected vibration amplitudes generated by the testbed. The internal digital low-pass filter (DLPF) included in the MPU9250 is configured with a bandwidth of 218.1 Hz to prevent aliasing while preserving all the relevant signal content within the 20–120 Hz test frequency range.
A series of experiments was conducted on the X-axis of the five MPU-9250 accelerometer modules. All five multi-chip module accelerometers were aligned with the excitation direction and tested simultaneously alongside the reference (Brüel & Kjær 4507-B-006 CCLD) accelerometer. This approach ensures that all the sensors experience identical vibration excitation conditions, eliminating variability due to temporal or environmental factors (Figure 3). The objectives of this experimental study were to observe and quantify the response characteristics of each MCM accelerometer within the frequency range of 20–120 Hz, relative to the reference accelerometer. The X-axis of the five MPU-9250 accelerometer modules underwent nine consecutive frequency sweeps, with data from all five MCM accelerometers and the reference sensor recorded synchronously at a 1 kHz sampling rate. The Y- and Z-axes were assumed to provide similar performance characteristics to the tested X-axis when subjected to axis-aligned excitation, based on the symmetry design of the triaxial MEMS sensors.
Figure 3.
A five multi-chip-module accelerometer (MPU9250) array, with X-axis oriented in the upward vertical direction (lateral) alongside the Brüel & Kjær 4507-B-006 CCLD accelerometer (on top).
2.2.4. Vibration Signal Analysis Methods
The data recorded from the five triaxial accelerometers, labeled S1 through S5, along with an analog reference sensor, were collected over nine successive measurement intervals, each lasting 20 s. This data underwent frequency response function (FRF) analysis, coherence analysis, and uncertainty assessment. The FRF estimation was conducted using FFT-based cross-spectral methods to characterize the system’s frequency-dependent response, providing detailed insights into the behavior of the accelerometers across the analyzed measurement bandwidth [42,43].
The frequency response function (FRF) represents the transfer function that describes how the sensor transforms the input (reference IEPE accelerometer) to output (MEMS sensor readings) at each frequency. The estimator is formulated as follows:
where is the cross-power spectrum between input (x) and output (y), and is the cross-power spectrum between input (x) and output (y).
Practically, is a frequency response function (FRF) estimation method that assumes noise is predominantly present in the output signal while the input measurement remains relatively noise free. In our case, each 180 s recording was segmented into windows of 20 s with 50% overlap, windowed using a Hanning function and transformed via FFT. Cross-spectral and auto-spectral densities were averaged across segments, and the FRF magnitude was extracted and smoothed using a Savitzky–Golay filter in order to reduce the spectral variance while preserving structural features.
Coherence evaluates the linear correspondence between the MEMS accelerometer signal and reference IEPE accelerometer signal across frequencies, providing a frequency-resolved measure of the correlation quality, with values ranging from 0 (no correlation) to 1 (perfect correlation).
Coherence was computed using Welch’s method, where the 180 s vibration signal was divided into overlapping segments (20 s each with 50% overlap). Each segment was windowed using a Hanning function to minimize spectral leakage then transformed to the frequency domain via a fast Fourier transform (FFT). The cross-spectral density (tested sensor reference correlation) and auto-spectral densities (signal powers) were calculated and averaged across all the segments, yielding coherence values via
where is the power spectral density of the MEMS accelerometer signal.
Measurement uncertainty quantifies how much the sensor’s sensitivity varies across the frequency range. It follows ISO/IEC Guide 98-3 (GUM—guide to the expression of uncertainty in measurement) [26]. Expanded uncertainty defines a confidence interval at specified probability as follows:
where k is the coverage factor (typically, for a 95% confidence level), and is the standard deviation. The relative expanded uncertainty enables comparison between sensors with different sensitivities and was expressed as
where W is the relative uncertainty (in percent), U is the expanded uncertainty, and is the mean FRF estimator value.
2.3. Wheeled Robot Experimental Platform
2.3.1. Platform Description
The tests on the mechanical structure were conducted on a bare-bone configuration of the robot to minimize unwanted harmonic frequencies and isolate the fundamental vibration signatures. This approach was designed to verify the initial hypothesis that the vibrational patterns of a healthy robot structure differ distinctly from those of a structure with mechanical faults, such as small gaps or loose connections. Therefore, the mechanical structure of the robot consists of metallic aluminum alloy rods held together with the help of screwed bolts and t-shaped nuts. The locomotion type of the robot is differential, with two front motor wheels and two caster wheels in the back (Figure 4). To simplify the robot’s construction, the front wheels are ODrive BotWheels (5), which are DC brushless hub motor wheel-type units, driven by an ODrive S1 (6) motor controller. The ODrive BotWheels feature built-in Hall sensors and 3200 counts-per-revolution (CPR) incremental encoders, with a wheel diameter of approximately 170 mm and a mass of 2.2 kg per wheel. Each motor–wheel can deliver a torque of 5 Nm at 110 rpm when operated at 24 V; these torque and speed ratings may increase if a higher input voltage is supplied.
Figure 4.
Wheeled robot experimental platform: 1—five multi-chip module accelerometers, 2—Raspberry Pi Pico 2W, 3—lithium battery pack, 4—low-voltage battery disconnect module, 5—ODrive BotWheels, 6—ODrive S1 motor controller.
The motor controller system is powered by a 36 V lithium battery pack (3), which is equipped with a low-voltage battery disconnect (LVBD) module (4). This LVBD provides critical battery protection by monitoring the pack’s voltage in real time and disconnecting it from the load when the voltage drops below a preset threshold, preventing deep discharge issues.
The ODrive BotWheels are mounted on a custom-made linear slide system, with guided rails mounted on the robot chassis and the mobile part attached to a strut that has the upper coupling mounted on the upper part of the robot. The helical spring of the strut has been compressed sufficiently to make the strut assembly quite rigid, in order to transmit the vibrations of the motor more efficiently to the system for fault detection purposes. This configuration enhances the propagation of mechanical vibrations generated during normal operation and fault conditions, facilitating more effective data acquisition.
The vibration in the system is generated by operating the motor in an oscillating control loop that sweeps through a frequency range from 30 to 150 Hz. This method creates controlled mechanical oscillations in the drive wheel, providing a reliable vibration source for sensor measurements. Therefore, there is no need for an additional vibration generator, as the motor itself effectively produces the required vibrations for the fault detection tests.
2.3.2. Experimental Procedure
The vibration signals required for fault detection were generated internally by operating a single drive wheel in an oscillating control loop configuration. The decision to utilize only one drive wheel as the vibration source was motivated by the need to minimize unwanted harmonic interference and cross-coupling effects that would arise from simultaneous multi-wheel excitation. This single-actuator approach ensures a cleaner frequency response and more controlled experimental conditions for signal analysis.
The selected drive motor was programmed to sweep through a controlled frequency range from 30 to 150 Hz, creating mechanical oscillations directly in the drive wheel assembly. This method creates controlled mechanical oscillations in the drive wheel, providing a reliable vibration source for sensor measurements. By utilizing the motor’s inherent capability to generate oscillations through programmed control signals, the experimental configuration eliminates the need for external vibration generators or shakers. This approach offers several advantages: It reduces system complexity, ensures that vibrations originate from the actual fault location within the drive system, and provides more realistic operating conditions for fault-detection algorithm validation.
Figure 5 shows the robotic structure in a healthy condition (left) and with the introduced bolted-joint gap (right).
Figure 5.
The bare-bone wheeled robot: (a) The robotic structure in a healthy condition. (b) The robotic structure with the affected zone, also showing zoomed in details.
The controlled gap clearances were established and verified using precision feeler gauges, with measurements taken at the location shown in Figure 5b. Post-test gap measurements confirmed that the 30 s diagnostic vibration cycles did not induce measurable gap migration, with no noticeable differences observed between pre-test and post-test measurements across all the test series. The affected bolted joint was intentionally loosened to create the specified gap while maintaining partial thread engagement to prevent complete disassembly. All the other bolted joints in the robot structure were secured using thread-lock adhesive, and motor-mounting assemblies incorporated Nord-Lock anti-vibration washers to prevent unintended loosening during testing. These measures ensured that only the deliberately affected joint exhibited controlled clearance, while the remainder of the structure maintained nominal mechanical integrity.
Four distinct test series were conducted to evaluate the fault detection capabilities of the proposed system. The first series established the baseline performance by testing the robotic structure in its healthy operational condition, with all the mechanical connections functioning within their nominal specifications. The remaining three test series introduced controlled fault conditions by progressively increasing the gap clearance of a single bolted joint within the drive system’s structural frame.
Specifically, the bolted joint affected was the mechanical connection between the aluminum profile bars linking the upper and lower sections of the robotic structure. Progressive loosening of the fastener created gap clearances of 100 m, 250 m, and 500 m, simulating wear-induced mechanical degradation that commonly occurs in mobile robotic platforms during extended operation. These incremental gap values were selected to represent mild, moderate, and severe degradation states, enabling the comprehensive evaluation of the fault detection system’s sensitivity and diagnostic capability across different fault severities.
Each test series consisted of multiple measurement cycles across the entire frequency sweep range, ensuring the repeatability and reliability of the acquired vibration data collection process.
2.4. Multi-Model RUL Prediction Pipeline
To address the remaining useful life (RUL) prediction challenge in autonomous robotic systems, we implement a comprehensive evaluation framework comparing two distinct deep learning architectures operating on complementary data representations. Our approach leverages a Python 3.11.9-based data science stack—JupyterLab 4.5.0, TensorFlow 2.20.0 with integrated Keras 3.11.0, and scikit-learn 1.7.2—to process multi-sensor vibration data through parallel processing pipelines.
The novelty of our solution lies in the systematic comparison and independent deployment of two specialized architectures as follows:
- A spectrogram–CNN architecture that uses a convolutional neural network composed of three convolutional blocks with increasing filter sizes (32, 64, and 128), where each block uses 3 × 3 convolutional layers with ReLU activation and the same padding, followed by batch normalization, max pooling with a (2, 1) window to preserve the temporal resolution, and progressively higher dropout rates to mitigate overfitting. The extracted feature maps are aggregated using global average pooling and passed through two fully connected layers with 256 and 128 neurons, respectively, each employing ReLU activation, batch normalization, and dropout for regularization, before a final linear output layer with a single neuron produces the continuous regression output;
- A feature–LSTM architecture with a first LSTM layer of 128 units that returns sequences to capture temporal dependencies, followed by a second LSTM layer with 64 units, a fully connected dense layer with 64 neurons using ReLU activation for nonlinear feature extraction, a dropout layer with a rate of 0.4 to reduce overfitting, and a final dense output layer with a single neuron and linear activation for continuous value prediction.
The two models operate on distinct feature spaces—spectrograms (frequency × time × 15 channels) versus hand-engineered temporal features (160-dimensional vectors across 20-window sequences)—providing complementary perspectives on the degradation process.
Our approach uses a three-type split strategy as follows: (i) 72.25% of the dataset is used for training both ML models, (ii) 12.75% of the dataset is used for validation for both ML models, and (iii) 15% of the dataset is used for testing both ML models.
Figure 6, illustrates the main components of the data-processing pipeline, which includesthree successive layers: (i) the data acquisition layer from the five MEMS accelerometer modules, (ii) an early feature fusion-engineering layer that uses a temporal batch-processing approach with a window size of 0.3 s, and (iii) a dual-ML model layer, where we implement two data-driven predictive modeling approaches (spectrogram–CNN and LSTM).
Figure 6.
Multi-layer RUL prediction pipeline.
Instead of relying on a binary “functional vs. non-functional” assessment of robotic systems, in this paper, we introduce the idea of modeling four distinct levels of degradation that can characterize the operational health of robotic systems in a more accurate manner. This multi-level modeling approach allows the system to detect early signs of degradation and anticipate performance decline earlier.
By incorporating granular degradation information into both predictive maintenance and control strategies, the framework improves decision making, reduces unexpected downtime, and enhances long-term system reliability. Therefore, we define four realistic levels of degradation trajectories based on the size of the gaps as follows: (i) no gap—OK, (ii) a 100 m gap—INFO, (iii) a 250 m gap—WARNING, and (iv) a 500 m gap—DANGER. Moreover, we propose a dual-model ML, as shown in Figure 7, that uses both an FFT spectrogram and LSTM prediction models. The results from these models are fused and show the RUL verdict.
Figure 7.
Multi-model RUL prediction pipeline.
The RUL prediction module implements a systematic evaluation of the two independent deep learning architectures to identify the optimal modeling paradigm for the vibration-based RUL prediction of mobile robots’ mechanical frame structures. We adopt a comparative evaluation strategy where distinct architectures are trained, validated, and assessed independently in the same real data degradation datasets. The rationale for this architectural design includes (i) architectural transparency—independent evaluation enables the clear attribution of predictive performance to specific modeling paradigms, which enables a clear vision of the degradation dynamics, and (ii) computational efficiency—separate models allow the deployment of the superior architecture alone, reducing inference latency and memory usage.
2.5. Proposed Operational Diagnostic Workflow
We propose the following operational workflow for the practical deployment of the validation framework. Each robot-testing cycle comprises standardized diagnostic steps designed to ensure repeatable fault detection under controlled conditions. At the beginning of each test session, the robot is positioned at a designated diagnostic location and executes a 30 s stationary diagnostic routine. During this test, the wheel drive motor performs a standardized frequency sweep (30–150 Hz) under controlled conditions. Vibration data from the five strategically positioned MEMS accelerometers undergoes multi-layer processing to generate RUL predictions and degradation state classifications (OK, INFO, WARNING, and DANGER).
We implement the following decision protocol based on diagnostic results:
- Healthy/mild degradation (OK, INFO): The robot proceeds to the next operational phase;
- Moderate degradation (WARNING): Additional visual inspection is performed before proceeding;
- Severe degradation (DANGER): The robot is taken offline, and maintenance is required before further testing.
This proposed pre-operational diagnostic approach ensures fault detection occurs under controlled, repeatable conditions, maximizing diagnostic reliability during the validation phase. As the robot platform evolves toward full autonomy, this framework can be integrated into automated pre-deployment health assessment protocols.
3. Results
3.1. Modal Analysis Results
The streamlined assembly of the mobile robot (Figure 1) was discretized using a high-quality blended-curvature-based solid mesh to optimize transitions between complex geometries. The mesh employed variable element sizes ranging from a minimum of 2.72 mm for critical details to a maximum of 54.35 mm, utilizing 16 Jacobian points to ensure element integrity and minimize distortion. The finite element model employs a multi-material assembly to replicate the physical prototype. Specifically, aluminum 6063-T6 is utilized for the chassis profiles, while AISI 304 stainless steel is applied to the spacers. Furthermore, ABS plastic and PA type 6 nylon are assigned to the suspension mounts and structural inserts, respectively.
To simulate the robot’s operational state, a fixed geometry boundary condition was applied to the base, constraining all the degrees of freedom to represent a grounded testing environment. A global bonded interaction was utilized for all the components, assuming perfect structural continuity (rigid connections) to effectively treat the assembly as a single stiffness matrix for linear dynamic analysis.
The modal analysis identified five distinct natural frequencies in the range from 32.58 Hz to 148.26 Hz, as presented in Table 1. These frequencies represent the structural vibration modes most likely to be excited during mobile robot operation and fault conditions.
Table 1.
Identified natural frequencies and corresponding mode numbers.
Figure 8 presents the modal analysis identifying the five distinct natural frequencies. The coordinate system of the CAD model defines the Y-axis as vertical (upward), the X-axis as longitudinal (forward), and the Z-axis as lateral (sideways).
Figure 8.
FEM modal analysis results showing the five natural vibration modes of the robot structure.
The modal analysis identified five critical natural frequencies for the mobile robot. Mode 1 (32.58 Hz) corresponds to a lateral sway in the X-axis, indicating flexibility in the vertical supports. Modes 2 (80.58 Hz) and 3 (109.57 Hz) are dominated by the Z-axis, representing global vertical bending and vertical torsion, respectively. Mode 4 (143.57 Hz) is a low-energy local vibration affecting minor components, while Mode 5 (148.26 Hz) exhibits the highest mass participation (0.533) as a powerful lateral shear in the X-axis, posing a critical resonance risk from motor excitation.
The first mode has a frequency of 32.58 Hz (204.71 rad/s) and is the lowest natural frequency mode, indicating the fundamental vibration of the structure. It exhibits the highest amplitude among the five, reflecting a significant mode shape at this frequency that may be sensitive to structural faults or looseness in components. Thus, this vibration mode corresponds to a lateral sway in the X-axis, indicating flexibility in the vertical supports.
The second mode shows a higher frequency (80.58 Hz) with a significant amplitude response, particularly in the Z-direction. This mode may represent bending or torsional vibrations influenced by specific robot parts or assembly interfaces. Practically, it represents a dominant vertical oscillation, likely the “bouncing” mode of the main chassis deck. High mass participation in the Z-direction confirms this is a vertical bending mode.
The third mode has a distinct frequency of 109.57 Hz and presents a moderate amplitude having a distribution mainly in the Z-directional response, likely related to higher-order bending modes or localized vibrations that may correspond to smaller structural elements. This mode induces a longitudinal twisting of the frame, as evidenced by persistent Z-axis dominance at a higher-energy state.
The fourth mode reveals a higher-frequency vibration (143.57 Hz) with a lower amplitude, but it is still important for identifying dynamic behavior and potential resonances in substructures or mounted components. The mass participation is low in all the global directions (X, Y, and Z), suggesting this mode is localized to specific lighter components (e.g., sensor mounts or the actual upper horizontal frame) rather than the main frame.
The highest frequency mode studied (148.26 Hz) exhibits a powerful lateral shear in the X-direction. Unlike local vibrations, this mode demonstrates the highest mass participation of all the analyzed frequencies, making it a critical resonance risk.
The mass participation factors indicate that these modes predominantly involve vibrations in the X- and Z-directions, which correspond to how the robot structure deforms dynamically under operational loads. Identifying these five frequencies allows the monitoring of corresponding vibrational signatures and detection of anomalies or early signs of faults, such as cracks, looseness, or component wear, enabling predictive maintenance and improved reliability.
These vibrational modes may serve as a preliminary framework for correlating operational vibration data with potential mechanical anomalies. However, experimental validation is necessary to confirm these hypotheses:
- Mode 1 (≈32 Hz): Vibrations with elevated amplitudes near 32 Hz could potentially be associated with structural looseness, such as bolt relaxation in the vertical aluminum profiles, since this mode corresponds to the fundamental lateral sway. However, other factors (e.g., external excitations) should also be investigated;
- Mode 2 (≈80 Hz): Given that vibrations near 80 Hz are predominantly vertical, an amplitude increase might suggest issues such as wheel suspension degradation or tire imbalance, which could excite the chassis’s vertical bending mode. Further diagnostic measurements would be required to isolate the root cause;
- Mode 5 (≈148 Hz): Increased amplitudes around 148 Hz appear to be consistent with high-speed motor operation harmonics. A resonance peak in this range may provide an indication of developing motor mount fatigue or shaft misalignment, potentially coupling energy into this lateral shear mode. Nonetheless, additional sensor data and time-series analysis are recommended to differentiate between operational variations and actual fault conditions.
Note: These correlations represent theoretical interpretations based on modal analysis. Field testing and comparative baseline measurements are essential to establish robust fault detection thresholds for practical deployment. Given the results of the modal analysis, a five-sensor vibration detection array architecture was adopted to capture spatial vibration distribution in the most affected area identified—the upper part of the robot. The sensors were strategically positioned at anti-nodal regions (maximum modal displacement zones) to maximize the vibration signal amplitude and detection sensitivity, following established structural health-monitoring principles, where mechanical faults manifest most prominently at locations with the greatest structural deformation. This upper-section placement also ensures the optimal sensitivity to the controlled mechanical looseness introduced at the aluminum profile joint connecting the upper and lower sections (described in Section 2.3.2). Since diagnostic testing occurs under controlled pre-operational conditions (before the robot begins operational tasks), this high-sensitivity placement strategy maximizes the signal-to-noise ratio without interference from operational vibrations, enabling the reliable detection of structural changes induced by progressive mechanical degradation.
Beyond the structural dynamics considerations, the five-sensor array addresses practical machine-learning and measurement reliability requirements. The proposed architecture requires multichannel spatial information for effective training—a single sensor provides limited spatial data, whereas the array generates the spatial diversity essential for robust fault feature learning. Additionally, sensor redundancy compensates for individual measurement uncertainties inherent to MEMS accelerometers, as discussed in the sensor verification section, ensuring robust fault detection, even when individual sensors experience temporary degradation.
3.2. MEMS Accelerometer Array Performance Results
Before deploying the MEMS accelerometer array on the mobile robot platform, comprehensive sensor validation was conducted using the testbed platform described in Section 2.2.3 and illustrated in Figure 2. This section presents the sensor characterization results obtained from controlled laboratory testing using the TIRA electrodynamic shaker and reference IEPE accelerometer, which established the measurement reliability of the five MPU-9250 accelerometer modules prior to robot integration.
Since the modal analysis simulation identified that the first three natural frequencies are in the range from 32.58 Hz to 109.57 Hz, the testing frequency sweep for the MPU 9250 MCMs was selected to range from 20 Hz to 120 Hz. This range covers all three fundamental modes while providing approximately 10 Hz margins below the first natural frequency and above the third natural frequency.
3.2.1. Frequency Response Function Results
Frequency response function analysis demonstrated excellent sensor performance for all five tested MEMS accelerometers (a detailed view of the test setup is shown in Figure 3). All the sensors showed mean FRF magnitudes of above 96% across the 20–120 Hz operational range (Figure 9, Figure 10, Figure 11, Figure 12 and Figure 13).
Figure 9.
Sensor 1—Frequency response function showing oscillatory behavior with a mean magnitude of 0.9650, exhibiting periodic fluctuations across the 20–120 Hz range.
Figure 10.
Sensor 2—Frequency response function demonstrating a stable magnitude response near unity, with a mean value of 0.9664, indicating consistent sensor–reference correlation.
Figure 11.
Sensor 3—Frequency response function displaying a smooth magnitude characteristic, with a mean of 0.9644 and minimal deviation from unity gain.
Figure 12.
Sensor 4—Frequency response function showing a near-unity magnitude response (a mean of 0.9644), with slight roll-off at frequency extremes.
Figure 13.
Sensor 5—Frequency response function exhibiting stable transfer characteristics, with a mean magnitude of 0.9652 across the measured bandwidth.
As illustrated in these figures, the unity gain reference line (gray dotted) and mean FRF line (orange dashed) reveal near-ideal amplitude reproduction, with only 3.5% attenuation. A prominent resonance peak at ≈23 Hz (a magnitude of –1.08) is consistently visible across all the sensors, likely attributable to the mounting fixture’s mechanical characteristics. Beyond 30 Hz, the FRF magnitude remains stable at ≈0.96–0.98, demonstrating broadband performance.
3.2.2. Coherence Analysis Results
Coherence analysis revealed a very good MEMS sensor performance, with all five MEMS accelerometer units exhibiting a mean coherence of slightly above 98%, indicating that more than 98% of the sensor output power is linearly related to the reference input, with less than 2% attributed to noise or nonlinear effects.
In Figure 14, Figure 15, Figure 16, Figure 17 and Figure 18, the orange dashed horizontal line represents the mean coherence value, averaging the MEMS sensor performance across the 20–120 Hz frequency range.
Figure 14.
Sensor 1—Magnitude-squared coherence maintaining high values (a mean of 0.9835), validating the strong linear correlation between the sensor and reference signals.
Figure 15.
Sensor 2—Coherence function demonstrating excellent signal quality (a mean of 0.9867), with minimal noise contamination throughout the frequency range.
Figure 16.
Sensor 3—Coherence plot showing robust measurement quality (a mean of 0.9851), with values consistently near unity, confirming reliable data acquisition.
Figure 17.
Sensor 4—Coherence function indicating superior signal fidelity (a mean of 0.9867) and minimal uncorrelated noise in the measurement system.
Figure 18.
Sensor 5—Coherence analysis revealing high-quality measurements (a mean of 0.9858), with strong causality between excitation and response signals.
Minor coherence dips to 0.95–0.97 can be observed in Figure 14, Figure 15, Figure 16, Figure 17 and Figure 18 at 90–110 Hz, likely resulting from mounting structure resonances, electrical noise at specific frequencies, or intrinsic MEMS mechanical damping characteristics. Since the coherence in our test remained above 0.95 throughout the 20–120 Hz frequency sweep range, it confirms the broadband performance without resonance-induced degradation. The minimal inter-sensor variability () demonstrates consistent manufacturing quality and validates the sensor array for mobile robot fault detection applications in the tested range of 20–120 Hz.
3.2.3. Uncertainty Analysis Results
The uncertainty analysis in Table 2 revealed relative expanded uncertainties of 4.79–7.21% across the MEMS sensor array, with all the values within acceptable industrial limits (<10%). Four sensors (S2–S5) achieved high-precision performance, while S1 demonstrated the standard industrial grade (7.21%). Sensor S2 exhibited the lowest uncertainty (4.79%), with a 95% confidence interval ([0.920, 1.013]) encompassing the unity gain. The tight clustering of S2–S5 uncertainties (4.79–4.92%, %) demonstrates exceptional manufacturing consistency, while S1’s elevated value correlates with higher spectral variance visible in the subsequent FRF analysis. These uncertainty bounds establish the measurement quality baseline for evaluating the coherence and transfer function performance.
Table 2.
MEMS accelerometer verification results (in the 20–120 Hz range).
These results compare favorably with those in previous MEMS validation studies. Galetto et al. [26] reported relative expanded uncertainties of between 0.4% and 11.9% when calibrating MEMS accelerometers against laser–Doppler vibrometers in the 315–3000 Hz range, while Iqbal et al. [27] achieved frequency detection errors of within ±1.1% across the 5–1000 Hz range using combined IEPE and laser interferometer references. The coherence analysis in the present study revealed a strong correlation () between MEMS and IEPE measurements. These performance characteristics, combined with the lower-frequency range examined (20–120 Hz) relevant to mechanical fault detection in mobile robotic systems, demonstrate that cost-effective MEMS accelerometers provide reliable performance suitable for the proposed fault detection methodology.
3.3. The Multi-Model RUL Prediction Pipeline—Experimental Results
Two deep learning models are evaluated for predicting the remaining useful life of mechanical components in mobile robots experiencing progressive looseness faults in their mechanical structure: a spectrogram-based CNN exploiting frequency domain vibration signatures and a sequential LSTM capturing temporal degradation trajectories.
3.3.1. The FFT Spectrogram Model
This solution explores the frequency domain analysis as the basis of the RUL prediction model. Our approach uses spectrograms as input for a CNN regression pipeline. The spectrogram–CNN regressor uses a hierarchical feature extraction method that is optimized for frequency-domain vibration analysis. The model starts with two Conv2D blocks (32 filters with 3 × 3 kernels) using rectified linear unit (ReLU) activation and batch normalization for capturing low-level spectral patterns, then MaxPooling2D (2, 1) downsamples only the frequency axis but keeps the temporal resolution intact. The same pattern repeats with deeper filters (64 and 128) for learning more abstract spectral–temporal features that represent vibration signatures in different degradation stages, with dropout rates increasing from 0.2 to 0.4 for preventing overfitting.
A GlobalAveragePooling2D layer converts spatial dimensions to a compact feature vector, which goes into two dense layers (256 → 128 neurons) with strong regularization (50% dropout) that learn the nonlinear mapping between spectral patterns and the remaining useful life. The architecture ends with a single linear neuron that produces continuous RUL predictions in seconds, trained using the mean absolute error (MAE) loss with the Adam optimizer (at a learning rate of ), so it effectively learns that mechanical looseness shows as specific frequency modulations in the 30–150 Hz range, which is captured by spectrogram representations. Figure 19 presents the loss and MAE for the proposed CNN approach.
Figure 19.
The loss and mean absolute error for the proposed CNN approach.
3.3.2. The Time Feature LSTM Model
Next, we propose a second time-domain approach that uses LSTM. The LSTM RUL model implements a sequential architecture for capturing temporal degradation patterns in time-domain vibration features.
The model begins with the first LSTM layer (128 units) with return_sequences = True, which processes the entire sequence of 20 windows and outputs hidden states at each timestep, allowing it to capture both short-term fluctuations and long-term trends in feature evolution. The second LSTM layer (64 units) consolidates these temporal patterns into a single context vector representing the current degradation state by processing sequence outputs from the first layer.
A dense layer with 64 neurons and ReLU activation learns nonlinear relationships between LSTM-extracted temporal features and RUL, with 40% dropout applied for regularization to prevent the model from memorizing training sequences. The final linear neuron produces continuous RUL prediction in seconds, and the whole network is trained with the mean absolute error loss using the Adam optimizer (at a learning rate of ).
This architecture is particularly effective because it learns that fault progression follows a temporal trajectory—statistical features, like root-mean-square (RMS) error and kurtosis, gradually increase as mechanical gaps widen from 0 m to 500 m, and stacked LSTM layers can model these progressive changes better than single-window approaches. Figure 20 illustrates the loss and mean absolute error (MAE) for the proposed LSTM approach.
Figure 20.
The loss and mean absolute error for the proposed LSTM approach.
The experimental evaluation of the proposed multi-layer data-processing model is conducted using a Google Colab instance. We evaluate our approach based on real data collected in the Research Laboratory of Robotics at the Department of Mechatronics and Precision Mechanics, consisting of 4,548,459 samples. The features of the dataset are the following: (i) the X, Y, and Z coordinates for all five accelerometer modules and (ii) the timestamp and (iii) frequency of the experimental vibration induced by the drive wheel. Based on these features, a series of additional features are computed and are used in addition to the existing ones in the modeling stage. Having the timestamp as a reference, the window frames are extracted with WINDOW_SIZE = 0.3 s.
We implement a sliding window approach to create training samples with corresponding RUL labels from the continuous vibration dataset. The computed window frames have an 85% overlap, which means that consecutive windows share most of their samples for capturing smooth degradation transitions. Additional metadata, including the failure category, start/end timestamps, and failure time, are stored for each window, which is useful for debugging and temporal sequence reconstruction during the LSTM training phase.
An early feature fusion procedure based on the transformation from temporal vibration windows to spectrogram representations is implemented. First, the acceleration signals from multiple sensors and axes are collected, and then the spectrogram is computed for each channel, since this representation provides a more stable frequency resolution for non-stationary signals. The frequency information is extracted from the median sampling rate inside each window, and the power spectrum is converted to a logarithmic scale to reduce the dynamic range and highlight subtle frequency patterns.
After the spectrograms are obtained for all the accelerometer axes, they are stacked together along the channel dimension, so the resulting tensor preserves both temporal and frequency structures while fusing the multichannel information.
Finally, we apply a global normalization using the mean and standard deviation of the whole dataset, as this step makes the spectrograms more homogeneous and helps the learning model to converge more efficiently. By following this strategy, complementary spectral cues from different accelerometers and their axes are integrated, which allows for the capture of complex mechanical behaviors and improves the robustness of the prediction approach.
We implement a comprehensive processing pipeline that employs multiple complementary performance metrics to rigorously assess the RUL prediction quality across both architectures. First, basic regression indicators, such as MAE, RMSE, and R2, are implemented, as shown in Figure 21, as they offer a direct quantitative measurement of the prediction quality.
Figure 21.
Quantitative measurement of predictions.
The LSTM model achieves a modest MAE improvement (7.4% reduction) but demonstrates a substantially superior RMSE performance (a 2.61-times lower error), indicating more consistent predictions with fewer outliers. Both models achieve exceptional R2 scores (>0.98), with LSTM reaching near-perfect correlation (0.99). These results validate the LSTM architecture as being superior for robust RUL predictions.
We also analyze early and late predictions, since in RUL estimation, an early forecast is usually conservative, while a late estimation may be risky for maintenance planning. Moreover, we divide the RUL domain into several ranges and compute the performance inside each interval, so we can observe if the model degrades when the remaining life is short or long. By fusing these different perspectives, we achieve a more comprehensive evaluation that helps us to identify not only how accurate the model is overall but also how safe and stable the predictions behave in practical scenarios.
Our pipeline demonstrates a promising approach for the remaining useful life prediction of mechanical frame structures in mobile robots. The proposed design achieves 99.8% conservative predictions, which aligns with the findings of Raj et al. [30], who reported test accuracies ranging from 70% to 99% using a similar approach.
The proposed LSTM model has a significant advantage in comparison to the CNN–spectrogram model because the LSTM processes 20 window sequences that enable the direct learning of degradation trajectories through recurrent hidden states, whereas the CNN processes each 0.3 s spectrogram independently without a temporal context. Moreover, the LSTM receives pre-computed statistical descriptors (mean, RMS, kurtosis, etc.) encoding established vibration degradation indicators, while the CNN must discover relevant spectral patterns from raw frequency domain data with limited training samples.
In terms of the inference time and model size, the LSTM model proves to have a shorter inference latency (23.6 ms/sample) in comparison with that of the CNN model (26.8 ms/sample). Also, the LSTM model is 6.2 times smaller than the CNN model, having a total size of 0.76 MB, while the CNN model has a total size of 4.73 MB.
4. Discussion
4.1. Scope and Limitations: Fault-Type Specificity
This research specifically targets the structural mechanical integrity of the mobile robot frame—the bolted-aluminum profile connections that constitute the load-bearing structure. Progressive mechanical looseness was deliberately selected as the fault mode because the bare-bone robot platform architecture (aluminum profile bars assembled with bolted joints) makes structural looseness the predominant failure mode for this specific configuration. Our focus is on the structural frame’s integrity, not on the drivetrain components’ degradation, such as the bearing wear, gear defects, or gearbox clearance. These different degradation mechanisms manifest through distinct vibration signatures in different frequency ranges. Drivetrain component faults, such as bearing defects and gear wear, typically generate high-frequency vibration patterns, often requiring sampling rates exceeding 1 kHz for effective detection. In contrast, structural–mechanical looseness exhibits vibration characteristics in lower-frequency ranges (30–150 Hz in our testing). Our MEMS accelerometer sampling rate (1 kHz) and frequency sweep range (30–150 Hz) were specifically designed to capture structural frame vibrations, not high-frequency drivetrain component fault signatures, which would require significantly higher sampling rates and extended bandwidth.
While our experimental validation focused exclusively on structural looseness, the dual-paradigm CNN/LSTM architecture is theoretically extensible to other fault types through retraining with appropriate labeled datasets. The CNN pathway extracts frequency domain features agnostic to specific fault mechanisms, while the LSTM captures temporal degradation trajectories. However, validation against bearing wear, gear defects, or gearbox clearance remains necessary before claiming universal applicability across all the mobile robot mechanical systems. Future work should systematically evaluate the framework’s performance on bearing wear in wheel hub motors, gear degradation in drivetrain assemblies, gearbox clearance increases, and compound fault scenarios with multiple simultaneous degradation types.
4.2. Environmental Conditions and Testing Protocol Limitations
This proof-of-concept study was conducted under controlled laboratory conditions that do not systematically evaluate the effects of environmental and operational variations on the RUL prediction accuracy. The experimental protocol employed standardized conditions: Tests were performed with the robot in an unloaded baseline configuration on smooth laboratory flooring to minimize confounding variables and isolate structural fault signatures.
Several operational factors were not systematically characterized in this preliminary validation: ambient temperature fluctuations, humidity variations, variable payload scenarios, different floor surface materials, tire-aging effects, and electromagnetic interference. MEMS accelerometers exhibit known sensitivities to temperature drift and environmental factors that may affect measurement consistency. Variable payloads alter the mass distribution and natural frequencies, while different surface materials introduce damping effects that may attenuate vibration signatures.
While the periodic testing protocol, multi-sensor early fusion, and dual-pathway analytical framework provide inherent robustness mechanisms, systematic validation under diverse environmental and operational conditions remains necessary as future work. This includes environmental chamber testing, controlled payload variation experiments, multi-surface validation, long-term tire-aging studies, and temperature compensation algorithms to quantify framework performance boundaries before the consideration of real-world deployment scenarios.
4.3. MEMS Sensor Validation and Data Acquisition
The validation tests conducted with the five MEMS accelerometers provided valuable insights into both the sensor’s performance and data acquisition system’s capabilities under realistic deployment conditions. The experimental configuration necessitated the integration of mechanical fixtures and an aluminum mounting bar, which inevitably introduced additional mass to the measurement system. This added mass represents a well-documented challenge in accelerometer testing, as fixtures can alter the effective mass and dynamic characteristics of the sensing assembly.
The simultaneous acquisition approach served dual validation purposes: evaluating the MEMS accelerometer’s performance in concurrent measurement scenarios and stress-testing the data acquisition system’s ability to handle multiple sensor inputs without signal degradation. While multichannel simultaneous acquisition systems can potentially introduce noise through settling transients at multiplexer inputs and increased electromagnetic interference, especially in unshielded MEMS devices, the results obtained were highly satisfactory and aligned with findings reported by other researchers investigating similar measurement configurations. The isolation box methodology employed in comparable studies has proven to be effective in minimizing electromagnetic interference and ensuring stable readings, validating the approach of accepting modest noise increases in exchange for practical measurement capabilities [26,27].
The validation of the MEMS accelerometers was essential to ensure measurement reliability, given that the robot’s vibration signatures would not originate from a controlled external excitation shaker. Instead, the MEMS accelerometers operate under self-induced vibration conditions generated by the robot’s internal wheel drive motors. This approach eliminates the need for an additional external vibration generator, thereby avoiding increased costs, additional system mass, and heightened complexity.
Although the self-induced excitation method precludes the precise control of the excitation signal, the integration of properly validated MEMS accelerometers with machine-learning techniques facilitates the effective management of excitation fluctuations. This operational constraint was specifically addressed during the validation phase to verify that the sensors could reliably capture vibration signatures under the variable excitation conditions characteristic of mobile robot operation.
The successful validation of MEMS accelerometers under controlled fixture-based conditions established the foundation necessary for subsequent real-world robot testing. This validation-to-deployment pipeline was critical for ensuring the reliability of vibration data fed into machine-learning algorithms, as the quality of sensor measurements directly influences the accuracy of fault detection models.
5. Conclusions
This study established an integrated framework for fault detection in mobile robots experiencing progressive looseness in their mechanical structure, combining MEMS sensor validation with deep learning for remaining useful life predictions and design considerations for future IIoT deployment.
The methodology employs self-induced vibrations generated by the robot’s wheel drive during controlled pre-operational diagnostics—performed before daily operations or at scheduled maintenance intervals—as the excitation source, eliminating dependencies on external vibration generators or dedicated excitation controllers. By monitoring variations in these controlled vibration patterns using a multi-sensor MEMS accelerometer array, the system systematically characterizes progressive mechanical degradation in bolted-frame connections, enabling the early detection of structural looseness before operational deployment.
Our comprehensive characterization demonstrates that the five-sensor MEMS accelerometer array achieves industrial-grade measurement quality, with relative expanded uncertainties of 4.79–7.21% (k = 2, 95% confidence), coherence exceeding 98% across the 20–120 Hz operational bandwidth, and a frequency response function magnitude of above 96%, validating data reliability for a suitable software-based data-driven approach. To address the challenge of RUL prediction from multi-sensor vibration data, we developed and systematically compared two complementary deep learning architectures: a frequency domain CNN with spectrogram-based early fusion and a time-domain LSTM with sequential feature analysis. Comparative evaluation revealed that LSTM temporal modeling significantly outperforms the CNN–spectrogram model, with the LSTM (RMSE = 4.5%) capturing mechanical degradation dynamics better than the CNN (RMSE = 11.8%).
The validated framework enables trustworthy predictive maintenance deployment with end-to-end traceability from sensor measurements to RUL predictions. The current study validates the framework specifically for structural mechanical looseness in bolted joints (0–500 m clearances). While the software-based data-driven architectures are theoretically extensible to other fault types through retraining with appropriate labeled datasets, validation against bearing wear, gear defects, or gearbox clearance remains necessary before claiming universal applicability across all the mobile robot’s mechanical systems.
Future work should systematically evaluate the framework’s performance on bearing wear in wheel hub motors, gear degradation in drivetrain assemblies, gearbox clearance increases, and compound fault scenarios with multiple simultaneous degradation types. Additionally, the exploration of physics-informed learning approaches and edge-computing implementations for real-time deployment in resource-constrained robotic systems should be pursued.
6. Patents
The authors are exploring patent protection and filing options related to aspects of this work.
Author Contributions
Conceptualization, V.I.G. and B.-C.M.; methodology, V.I.G., C.D.C., and B.-C.M.; software, B.-C.M., V.I.G., M.-V.V., and Ș.A.T.; validation, L.A.C., C.D.C., M.-I.N., and B.-C.M.; formal analysis, B.-C.M., L.A.C., A.R., and C.D.C.; resources, M.-I.N. and A.R.; data curation, B.-C.M., A.R., V.I.G., M.-V.V., and Ș.A.T.; writing—review and editing, A.R., V.I.G., B.-C.M., L.A.C., and M.-I.N.; visualization, L.A.C., V.I.G., M.-V.V., and Ș.A.T.; supervision, V.I.G. and B.-C.M.; project administration, V.I.G. All authors have read and agreed to the published version of the manuscript.
Funding
This research was funded by a grant from the National Program for Research of the National Association of Technical Universities—GNAC ARUT 2023 “Service Robot with Enhanced Safety Systems for Indoor Environments” (Grant No. 39/09.10.2023).
Institutional Review Board Statement
Not applicable.
Data Availability Statement
The data are available upon request to the corresponding author.
Acknowledgments
This work is partially backed by project number PN-IV-PCB-RO-MD-2024-0364 (DACISLab) and by the project “Romanian Hub for Artificial Intelligence”—HRIA, Smart Growth, Digitization, and Financial Instruments Program, 2021–2027, MySMIS No. 334906.
Conflicts of Interest
The funders had no role in the design of the study; in the collection, analyses, or interpretation of the data; in the writing of the manuscript; or in the decision to publish the results.
Abbreviations
The following abbreviations are used in this manuscript:
| CAD | Computer-Aided Design |
| CNN | Convolutional Neural Network |
| DLPF | Digital Low-Pass Filter |
| EMI | Electromagnetic Interference |
| FEM | Finite Element Method |
| FFT | Fast Fourier Transform |
| FRF | Frequency Response Function |
| IEPE | Integrated Electronic Piezoelectric |
| IIoT | Industrial Internet-of-Things |
| IMU | Inertial Measurement Unit |
| LSTM | Long Short-Term Memory |
| LVBD | Low-Voltage Battery Disconnect |
| MAE | Mean Absolute Error |
| MAPE | Mean Absolute Percentage Error |
| MCM | Multi-Chip Module |
| ML | Machine Learning |
| MSE | Mean Square Error |
| R2 | R-Squared (Coefficient of Determination) |
| ReLU | Rectified Linear Unit |
| RMS | Root Mean Square |
| RMSE | Root-Mean-Square Error |
| RUL | Remaining Useful Life |
| SMAPE | Symmetric Mean Absolute Percentage Error |
| SPI | Serial Peripheral Interface |
| USB | Universal Serial Bus |
References
- Unger, H.; Markert, T.; Müller, E. Evaluation of use cases of autonomous mobile robots in factory environments. Procedia Manuf. 2018, 17, 254–261. [Google Scholar] [CrossRef] [Scilit]
- Kyrarini, M.; Lygerakis, F.; Rajavenkatanarayanan, A.; Sevastopoulos, C.; Nambiappan, H.R.; Chaitanya, K.K.; Babu, A.R.; Mathew, J.; Makedon, F. A Survey of Robots in Healthcare. Technologies 2021, 9, 8. [Google Scholar] [CrossRef] [Scilit]
- Chand, R.; Sharma, B.; Kumar, S.A. Systematic review of mobile robots applications in smart cities with future directions. J. Ind. Inf. Integr. 2025, 45, 100821. [Google Scholar] [CrossRef] [Scilit]
- Sabry, A.H.; Amirulddin, U.A.B.U. A review on fault detection and diagnosis of industrial robots and multi-axis machines. Results Eng. 2024, 23, 102397. [Google Scholar] [CrossRef] [Scilit]
- Anghel, D.; Stroia, M.D.; Spunei, E.; Liuba, G. Evaluation of Automatic Speed Regulation Performance of Micro-Hydro Units by Monitoring Vibrations in Bearings and Turbine Housing. UPB Sci. Bull. Ser. D Mech. Eng. 2024, 86, 223–234. [Google Scholar]
- Popa, G.; Andrei, M.; Tudor, E.; Vasile, I.; Ilie, G. Fast Detection of the Stick–Slip Phenomenon Associated with Wheel-to-Rail Sliding Using Acceleration Sensors: An Experimental Study. Technologies 2024, 12, 134. [Google Scholar] [CrossRef] [Scilit]
- Coanda, P.; Avram, M.; Comeaga, D.; Gramescu, B.; Constantin, V.; Nita, E. A Review of Fault Detection Methods in Smart Pneumatic Systems and Identification of Key Failure Indicators. In Innovations in Mechatronics Engineering II; Springer: Cham, Switzerland, 2022; pp. 132–142. [Google Scholar] [CrossRef] [Scilit]
- Raouf, I.; Lee, H.; Kim, H.S. Mechanical fault detection based on machine learning for robotic RV reducer using electrical current signature analysis: A data-driven approach. J. Comput. Des. Eng. 2022, 9, 417–433. [Google Scholar] [CrossRef] [Scilit]
- Cui, G.; Li, B.; Tian, W.; Liao, W.; Zhao, W. Dynamic modeling and vibration prediction of an industrial robot in manufacturing. Appl. Math. Model. 2022, 105, 114–136. [Google Scholar] [CrossRef] [Scilit]
- Sandu, A.; Bogatu, L.; Ionascu, G.; Manea, E.; Gheorghe, V. Modeling, simulation and experimental research for MEMS cantilevers of complex geometry. MATEC Web Conf. 2019, 290, 08002. [Google Scholar] [CrossRef] [Scilit]
- Jiao, Y.; Chen, X.; Peng, Y.; Mao, X.; Guo, Q. Autonomous modal analysis method for industrial robots considering dynamic spatial sensitivity and excitation randomness. Sci. Rep. 2025, 15, 12581. [Google Scholar] [CrossRef] [Scilit]
- Hassan, I.U.; Panduru, K.; Walsh, J. An In-Depth Study of Vibration Sensors for Condition Monitoring. Sensors 2024, 24, 740. [Google Scholar] [CrossRef] [Scilit] [PubMed]
- Wang, T.; Meng, H.; Zhang, F.; Qin, R. Fault Detection of Wheelset Bearings through Vibration-Sound Fusion Data Based on Grey Wolf Optimizer and Support Vector Machine. Technologies 2024, 12, 144. [Google Scholar] [CrossRef] [Scilit]
- Wang, X.B.; Luo, L.; Tang, L.; Yang, Z.X. Automatic representation and detection of fault bearings in in-wheel motors under variable load conditions. Adv. Eng. Inform. 2021, 49, 101321. [Google Scholar] [CrossRef] [Scilit]
- Wang, Z.; Zhang, M.; Chen, H.; Li, J.; Li, G.; Zhao, J.; Yao, L.; Zhang, J.; Chu, F. A generalized fault diagnosis framework for rotating machinery based on phase entropy. Reliab. Eng. Syst. Saf. 2025, 256, 110745. [Google Scholar] [CrossRef] [Scilit]
- Wang, S.; Chen, Y.; Dong, S.; Zhang, W.; Yang, Y.; Peng, Z. Cumulative spectrum distribution entropy for rotating machinery fault diagnosis. Mech. Syst. Signal Process. 2024, 206, 110905. [Google Scholar] [CrossRef] [Scilit]
- Zhang, X.; Chen, W.; Chen, B.; Zhang, Z.; Wang, B. A fault diagnosis method for rotating machinery by multi-mode feature entropy and mutual cooperation broad learning system. IEEE Sens. J. 2023, 24, 4722–4736. [Google Scholar] [CrossRef] [Scilit]
- Min, F.; Wang, G.; Liu, N. Collision detection and identification on robot manipulators based on vibration analysis. Sensors 2019, 19, 1080. [Google Scholar] [CrossRef] [Scilit]
- Dixon, W.; Walker, I.; Dawson, D.; Hartranft, J. Fault detection for wheeled mobile robots with parametric uncertainty. In Proceedings of the 2001 IEEE/ASME International Conference on Advanced Intelligent Mechatronics, Como, Italy, 8–12 July 2001; IEEE: Piscataway, NJ, USA, 2001; pp. 1245–1250. [Google Scholar] [CrossRef] [Scilit]
- Yang, Y.; Zhao, J.; Xu, X.; Cao, K.; Yuan, S.; Xie, L. Unsupervised Anomaly Detection for Autonomous Robots via Mahalanobis SVDD with Audio-IMU Fusion. arXiv 2025, arXiv:2505.05811. [Google Scholar] [CrossRef] [Scilit]
- Zhang, L.; Zhou, F.; Duan, P.; Yuan, X. Fault diagnosis of mobile robot based on dual-graph convolutional network with prior fault knowledge. Adv. Eng. Inform. 2024, 62, 102865. [Google Scholar] [CrossRef] [Scilit]
- Klimenda, F.; Cizek, R.; Suszynski, M. Measurement of a vibration on a robotic vehicle. Sensors 2022, 22, 8649. [Google Scholar] [CrossRef] [Scilit] [PubMed]
- Wang, L.; Su, J. Adaptive online terrain classification method for mobile robot based on vibration signals. Int. J. Adv. Robot. Syst. 2022, 19, 17298814211062035. [Google Scholar] [CrossRef] [Scilit]
- Pookkuttath, S.; Elara, M.R.; Sivanantham, V.; Ramalingam, B. AI-Enabled Predictive Maintenance Framework for Autonomous Mobile Cleaning Robots. Sensors 2022, 22, 13. [Google Scholar] [CrossRef] [Scilit] [PubMed]
- Tabandeh, S.; Vedurmudi, A.P.; Söderblom, H.; Pourjamal, S.; Harris, P.; Luo, Y.; Gruber, M.; Vaa, M.I.; Johansen, M.; Koval, M.; et al. Sensor network metrology: Current state and future directions. Meas. Sens. 2025, 38, 101798. [Google Scholar] [CrossRef] [Scilit]
- Galetto, M.; Schiavi, A.; Genta, G.; Prato, A.; Mazzoleni, F. Uncertainty evaluation in calibration of low-cost digital MEMS accelerometers for advanced manufacturing applications. CIRP Ann. 2019, 68, 535–538. [Google Scholar] [CrossRef] [Scilit]
- Iqbal, A.; Mian, N.S.; Longstaff, A.; Fletcher, S. Performance Evaluation of Low-Cost Vibration Sensors in Industrial IoT Applications. Int. J. Autom. Technol. 2022, 16, 329–339. [Google Scholar] [CrossRef] [Scilit]
- Fidali, M.; Augustyn, D.; Ochmann, J.; Uchman, W. Evaluation of the Diagnostic Sensitivity of Digital Vibration Sensors Based on Capacitive MEMS Accelerometers. Sensors 2024, 24, 4463. [Google Scholar] [CrossRef] [Scilit]
- Surucu, O.; Gadsden, S.A.; Yawney, J. Condition Monitoring using Machine Learning: A Review of Theory, Applications, and Recent Advances. Expert Syst. Appl. 2023, 221, 119738. [Google Scholar] [CrossRef] [Scilit]
- Raj, K.K.; Kumar, S.; Kumar, R.R.; Andriollo, M. Enhanced Fault Detection in Bearings Using Machine Learning and Raw Accelerometer Data: A Case Study Using the Case Western Reserve University Dataset. Information 2024, 15, 259. [Google Scholar] [CrossRef] [Scilit]
- Urrea, C.; Domínguez, C. Fault Diagnosis in a Four-Arm Delta Robot Based on Wavelet Scattering Networks and Artificial Intelligence Techniques. Technologies 2024, 12, 225. [Google Scholar] [CrossRef] [Scilit]
- Khumprom, P.; Davila-Frias, A.; Grewell, D.; Buakum, D. A Hybrid Evolutionary CNN-LSTM Model for Prognostics of C-MAPSS Aircraft Dataset. In Proceedings of the 2023 Annual Reliability and Maintainability Symposium (RAMS), Orlando, FL, USA, 23–26 January 2023; pp. 1–8. [Google Scholar] [CrossRef] [Scilit]
- Wei, J.; Meng, L.; Du, J.; Yin, Z. Remaining Useful Life Prediction of Turbofan Engines based on CNN-LSTM Hybrid Model. In Proceedings of the 2024 3rd International Conference on Cloud Computing, Big Data Application and Software Engineering (CBASE), Hangzhou, China, 11–13 October 2024; pp. 153–157. [Google Scholar] [CrossRef] [Scilit]
- Mian, T.; Choudhary, A.; Fatima, S.; Panigrahi, B.K. Mel-spectrogram based Approach for Fault Detection in Ball Bearing using Convolutional Neural Network. In Proceedings of the ICECC ’23: 2023 6th International Conference on Electronics, Communications and Control Engineering, Fukuoka, Japan, 24–26 March 2023; Association for Computing Machinery: New York, NY, USA, 2023; pp. 283–289. [Google Scholar] [CrossRef] [Scilit]
- Xie, Y.; Zhang, T. Fault Diagnosis for Rotating Machinery Based on Convolutional Neural Network and Empirical Mode Decomposition. Shock Vib. 2017, 2017, 3084197. [Google Scholar] [CrossRef] [Scilit]
- Fajar, M.; Hakim, T.M.I.; Wirawan, A.; Suseno, P.A.P.; Soemaryanto, A.R.; Pramutadi, A.M. Comparative Analysis of LSTM Variants for Fault Detection and Classification in Aircraft Control Surfaces. Int. J. Progn. Health Manag. 2025, 4231. [Google Scholar] [CrossRef] [Scilit]
- Dong, J.; Li, Z.; Zheng, Y.; Luo, J.; Zhang, M.; Yang, X. Real-time fault detection for IIoT facilities using GA-Att-LSTM based on edge-cloud collaboration. Front. Neurorobotics 2024, 18, 1499703. [Google Scholar] [CrossRef] [Scilit]
- Hasan, A.; Tahavori, M.; Midtiby, H.S. Model-Based Fault Diagnosis Algorithms for Robotic Systems. IEEE Access 2023, 11, 2250–2258. [Google Scholar] [CrossRef] [Scilit]
- Xuan, J.; Zhu, T.; Peng, G.; Sun, F.; Dong, D. A Review on the Inertial Measurement Unit Array of Microelectromechanical Systems. Sensors 2024, 24, 7140. [Google Scholar] [CrossRef] [Scilit] [PubMed]
- Ru, X.; Gu, N.; Shang, H.; Zhang, H. MEMS Inertial Sensor Calibration Technology: Current Status and Future Trends. Micromachines 2022, 13, 879. [Google Scholar] [CrossRef] [Scilit]
- Besnea, D.; Rizescu, C.I.; Spanu, A.; Moraru, E.; Rizescu, D.; Constantin, V.; Panait, I. Research regarding the influence of different printing strategies on the mechanical characteristics of some FDM manufactured structures. IOP Conf. Ser. Mater. Sci. Eng. 2022, 1262, 012032. [Google Scholar] [CrossRef] [Scilit]
- Miles, J.H. Estimation of signal coherence threshold and concealed spectral lines applied to detection of turbofan engine combustion noise. J. Acoust. Soc. Am. 2011, 129, 3068–3081. [Google Scholar] [CrossRef] [Scilit]
- Rahman, A.G.A.; Ong, Z.C.; Ismail, Z. Enhancement of coherence functions using time signals in Modal Analysis. Measurement 2011, 44, 2112–2123. [Google Scholar] [CrossRef] [Scilit]
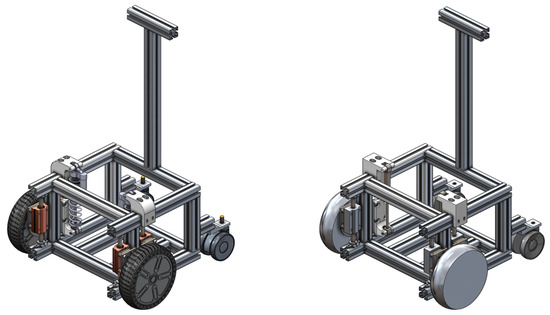
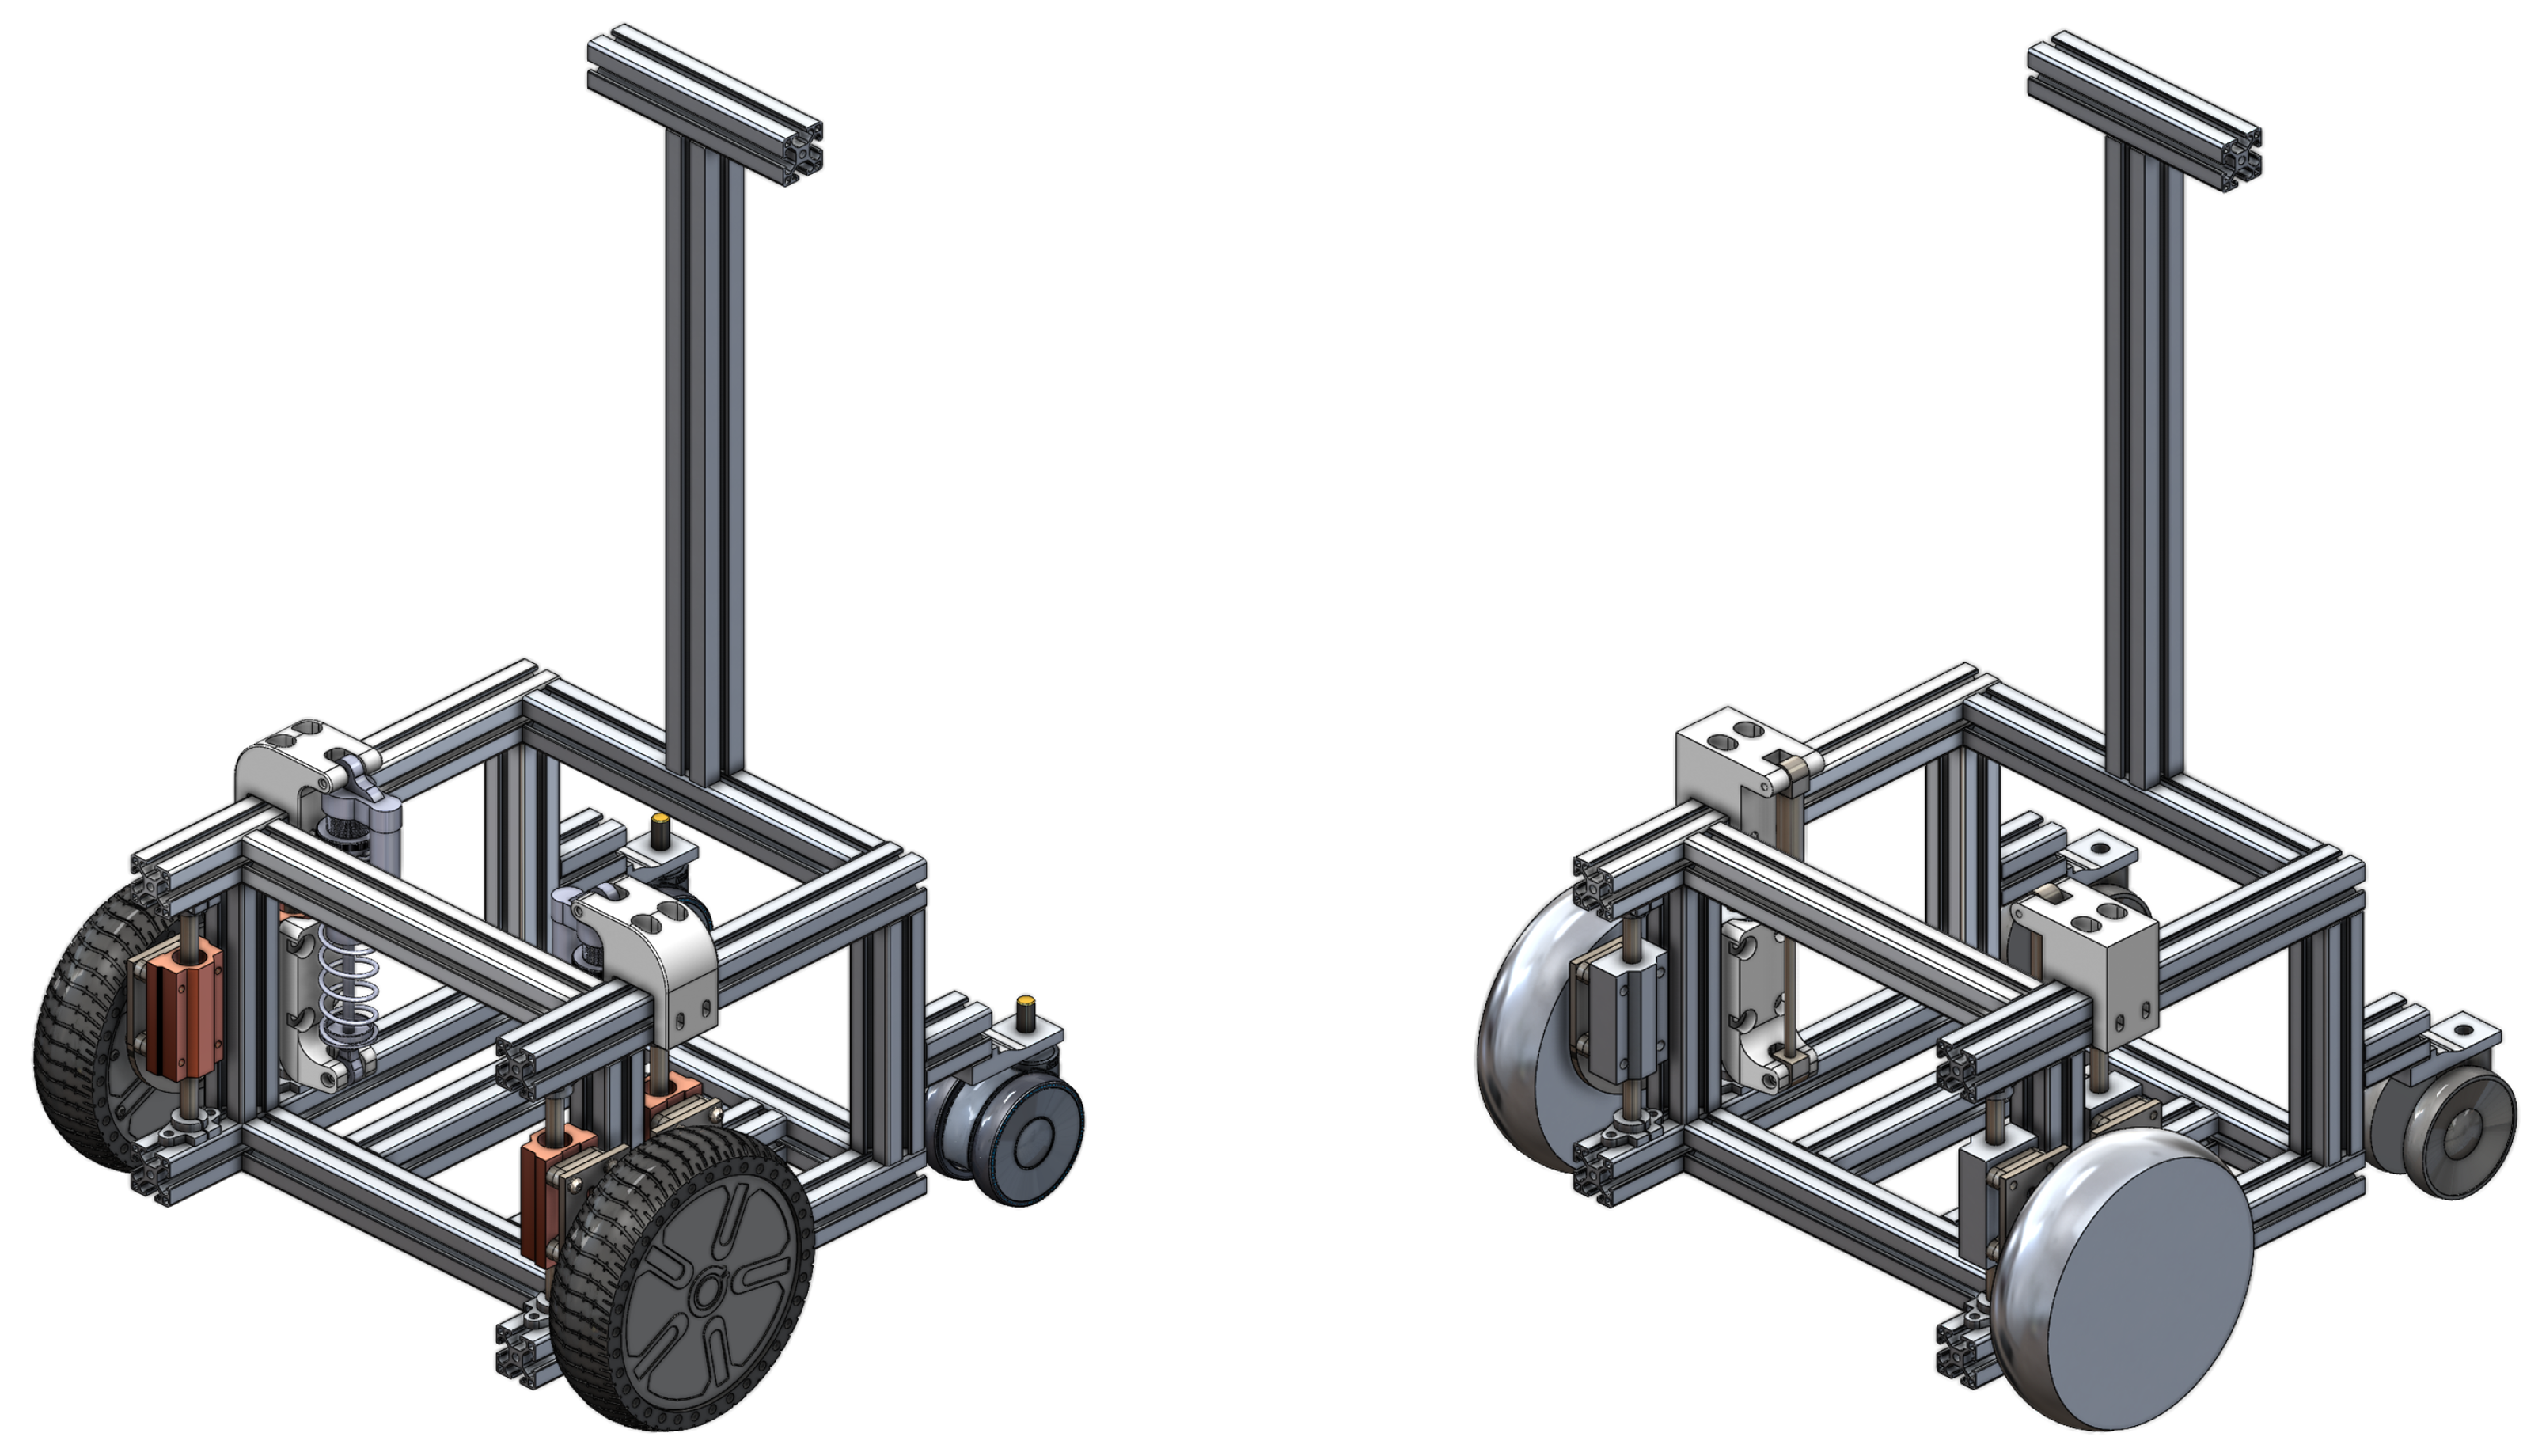
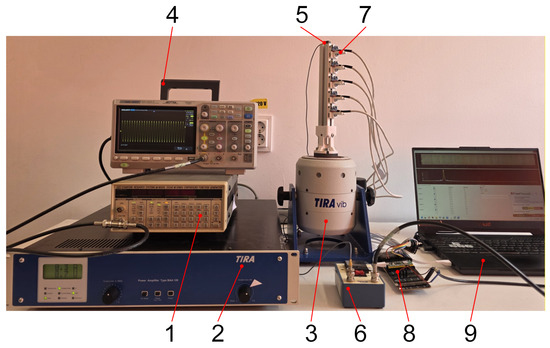
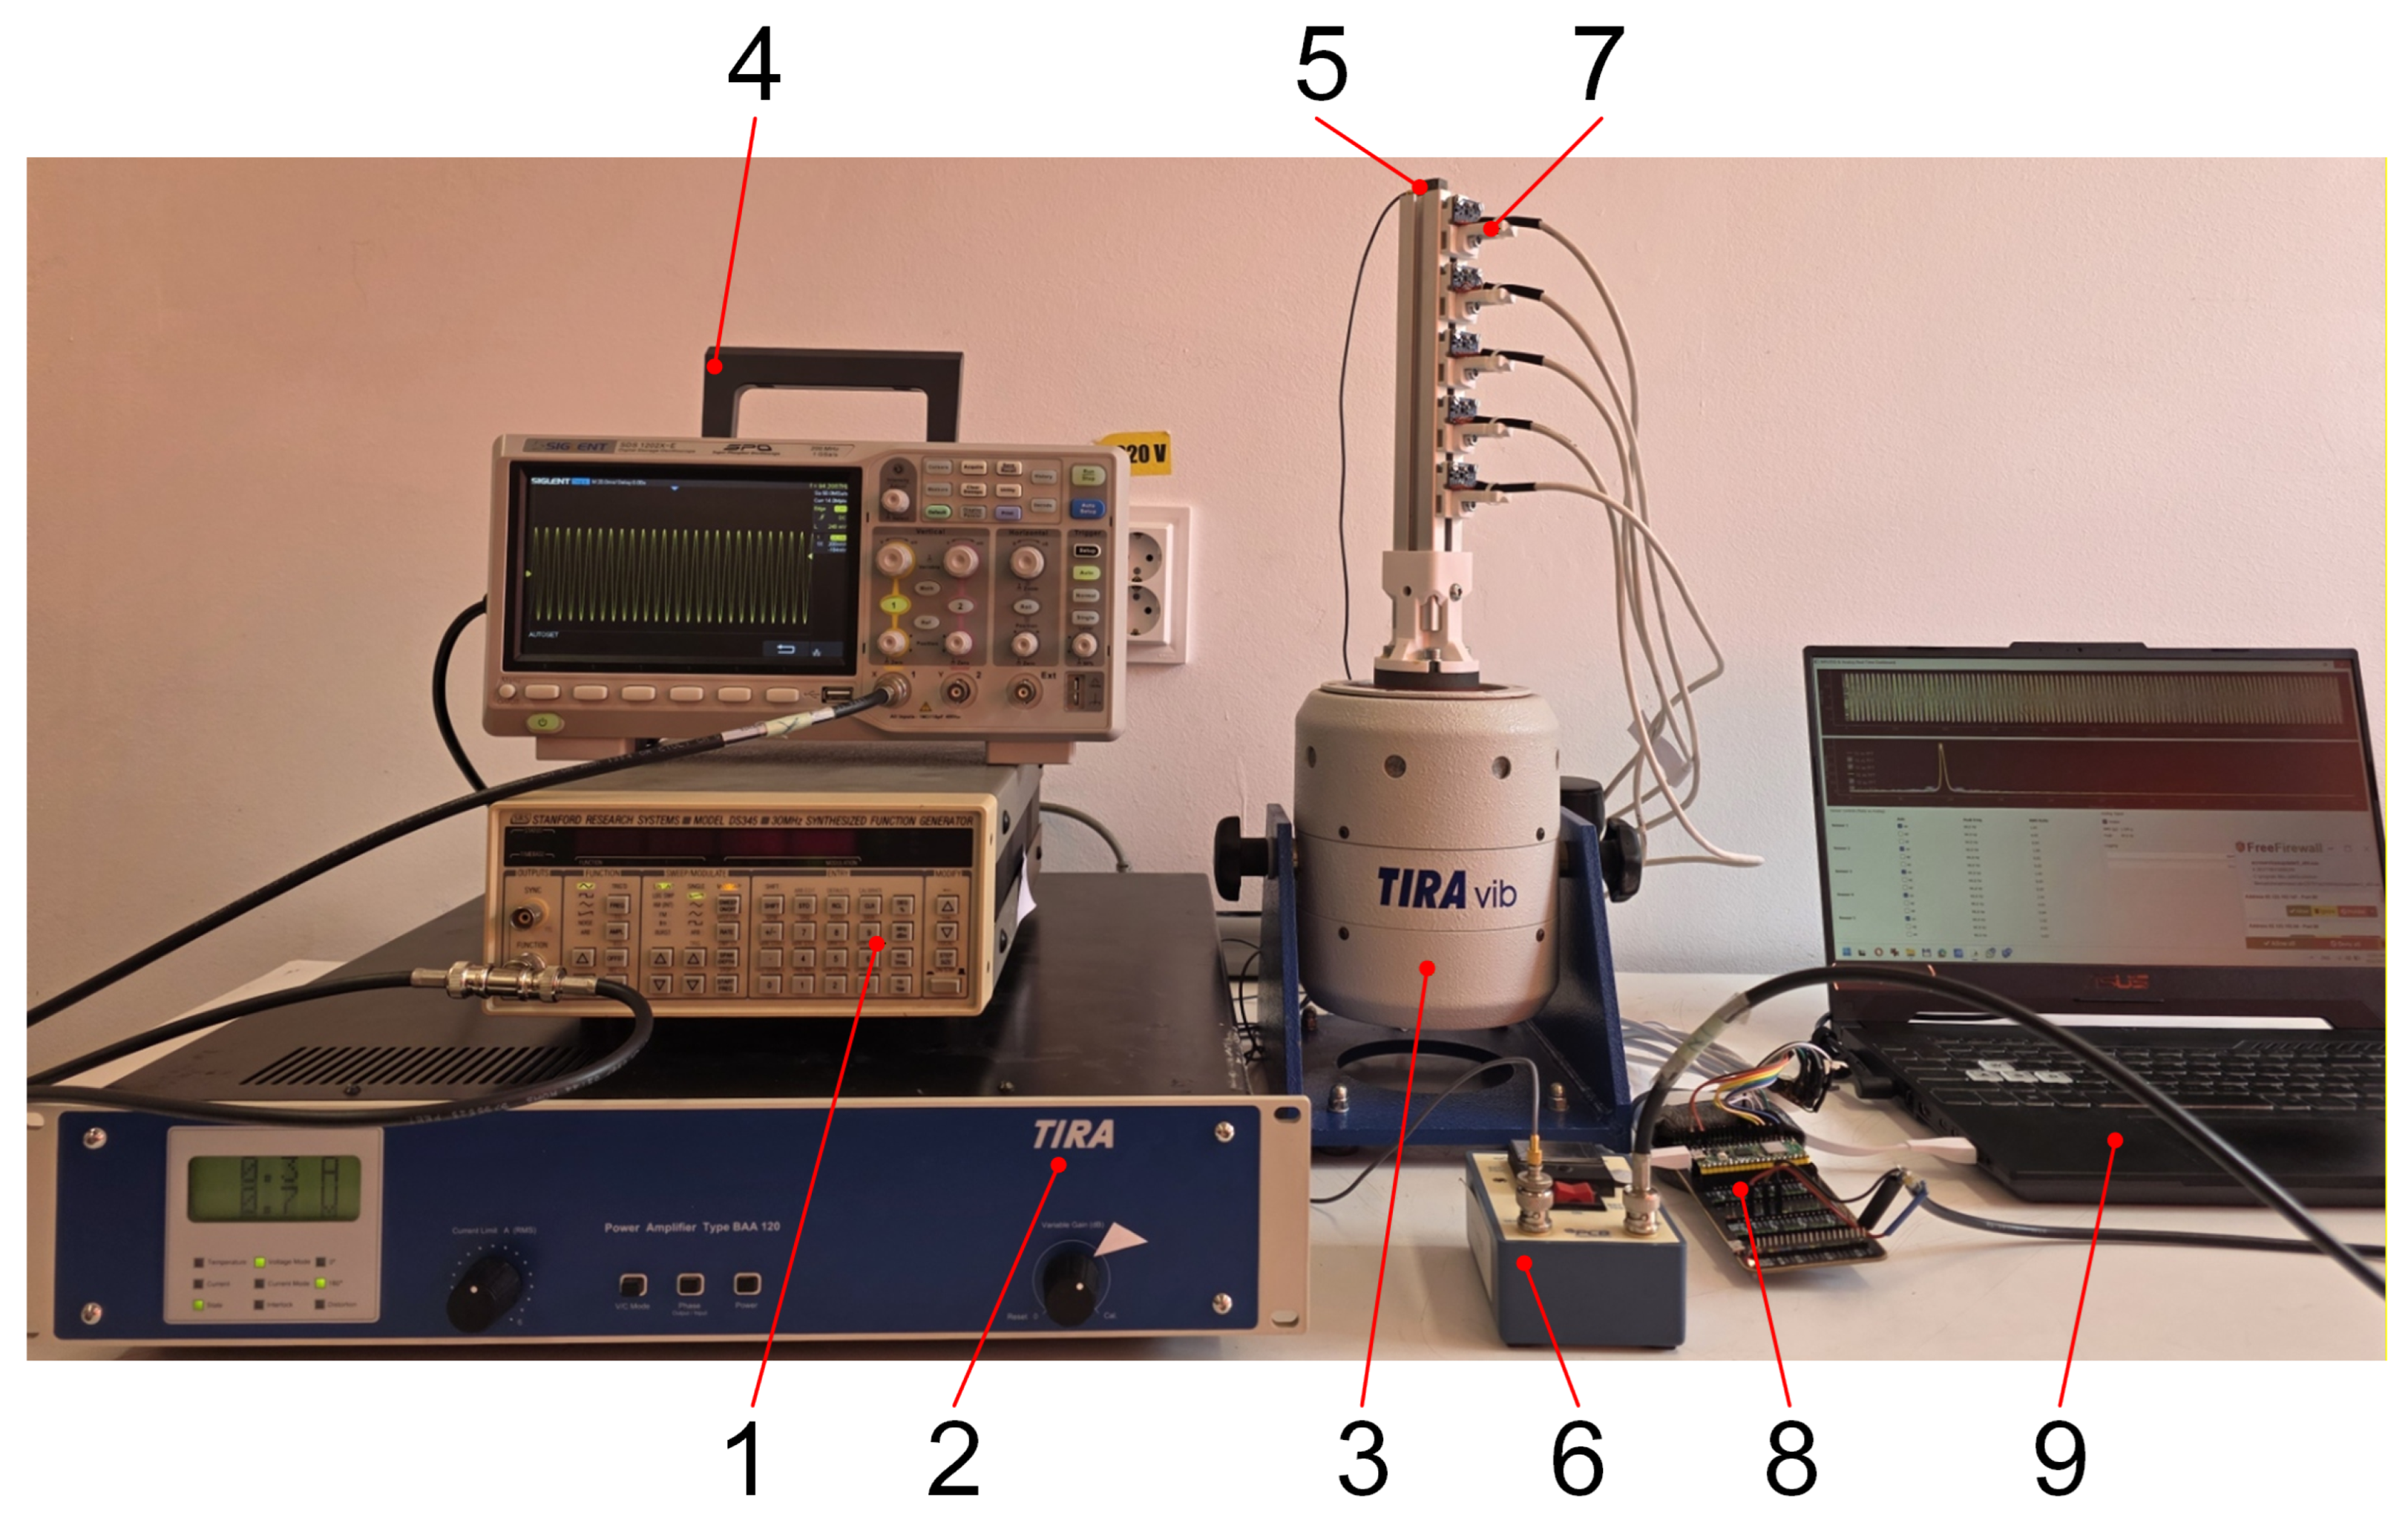
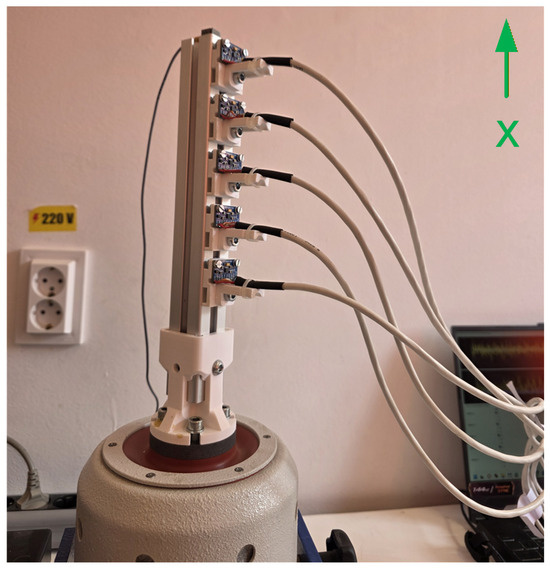
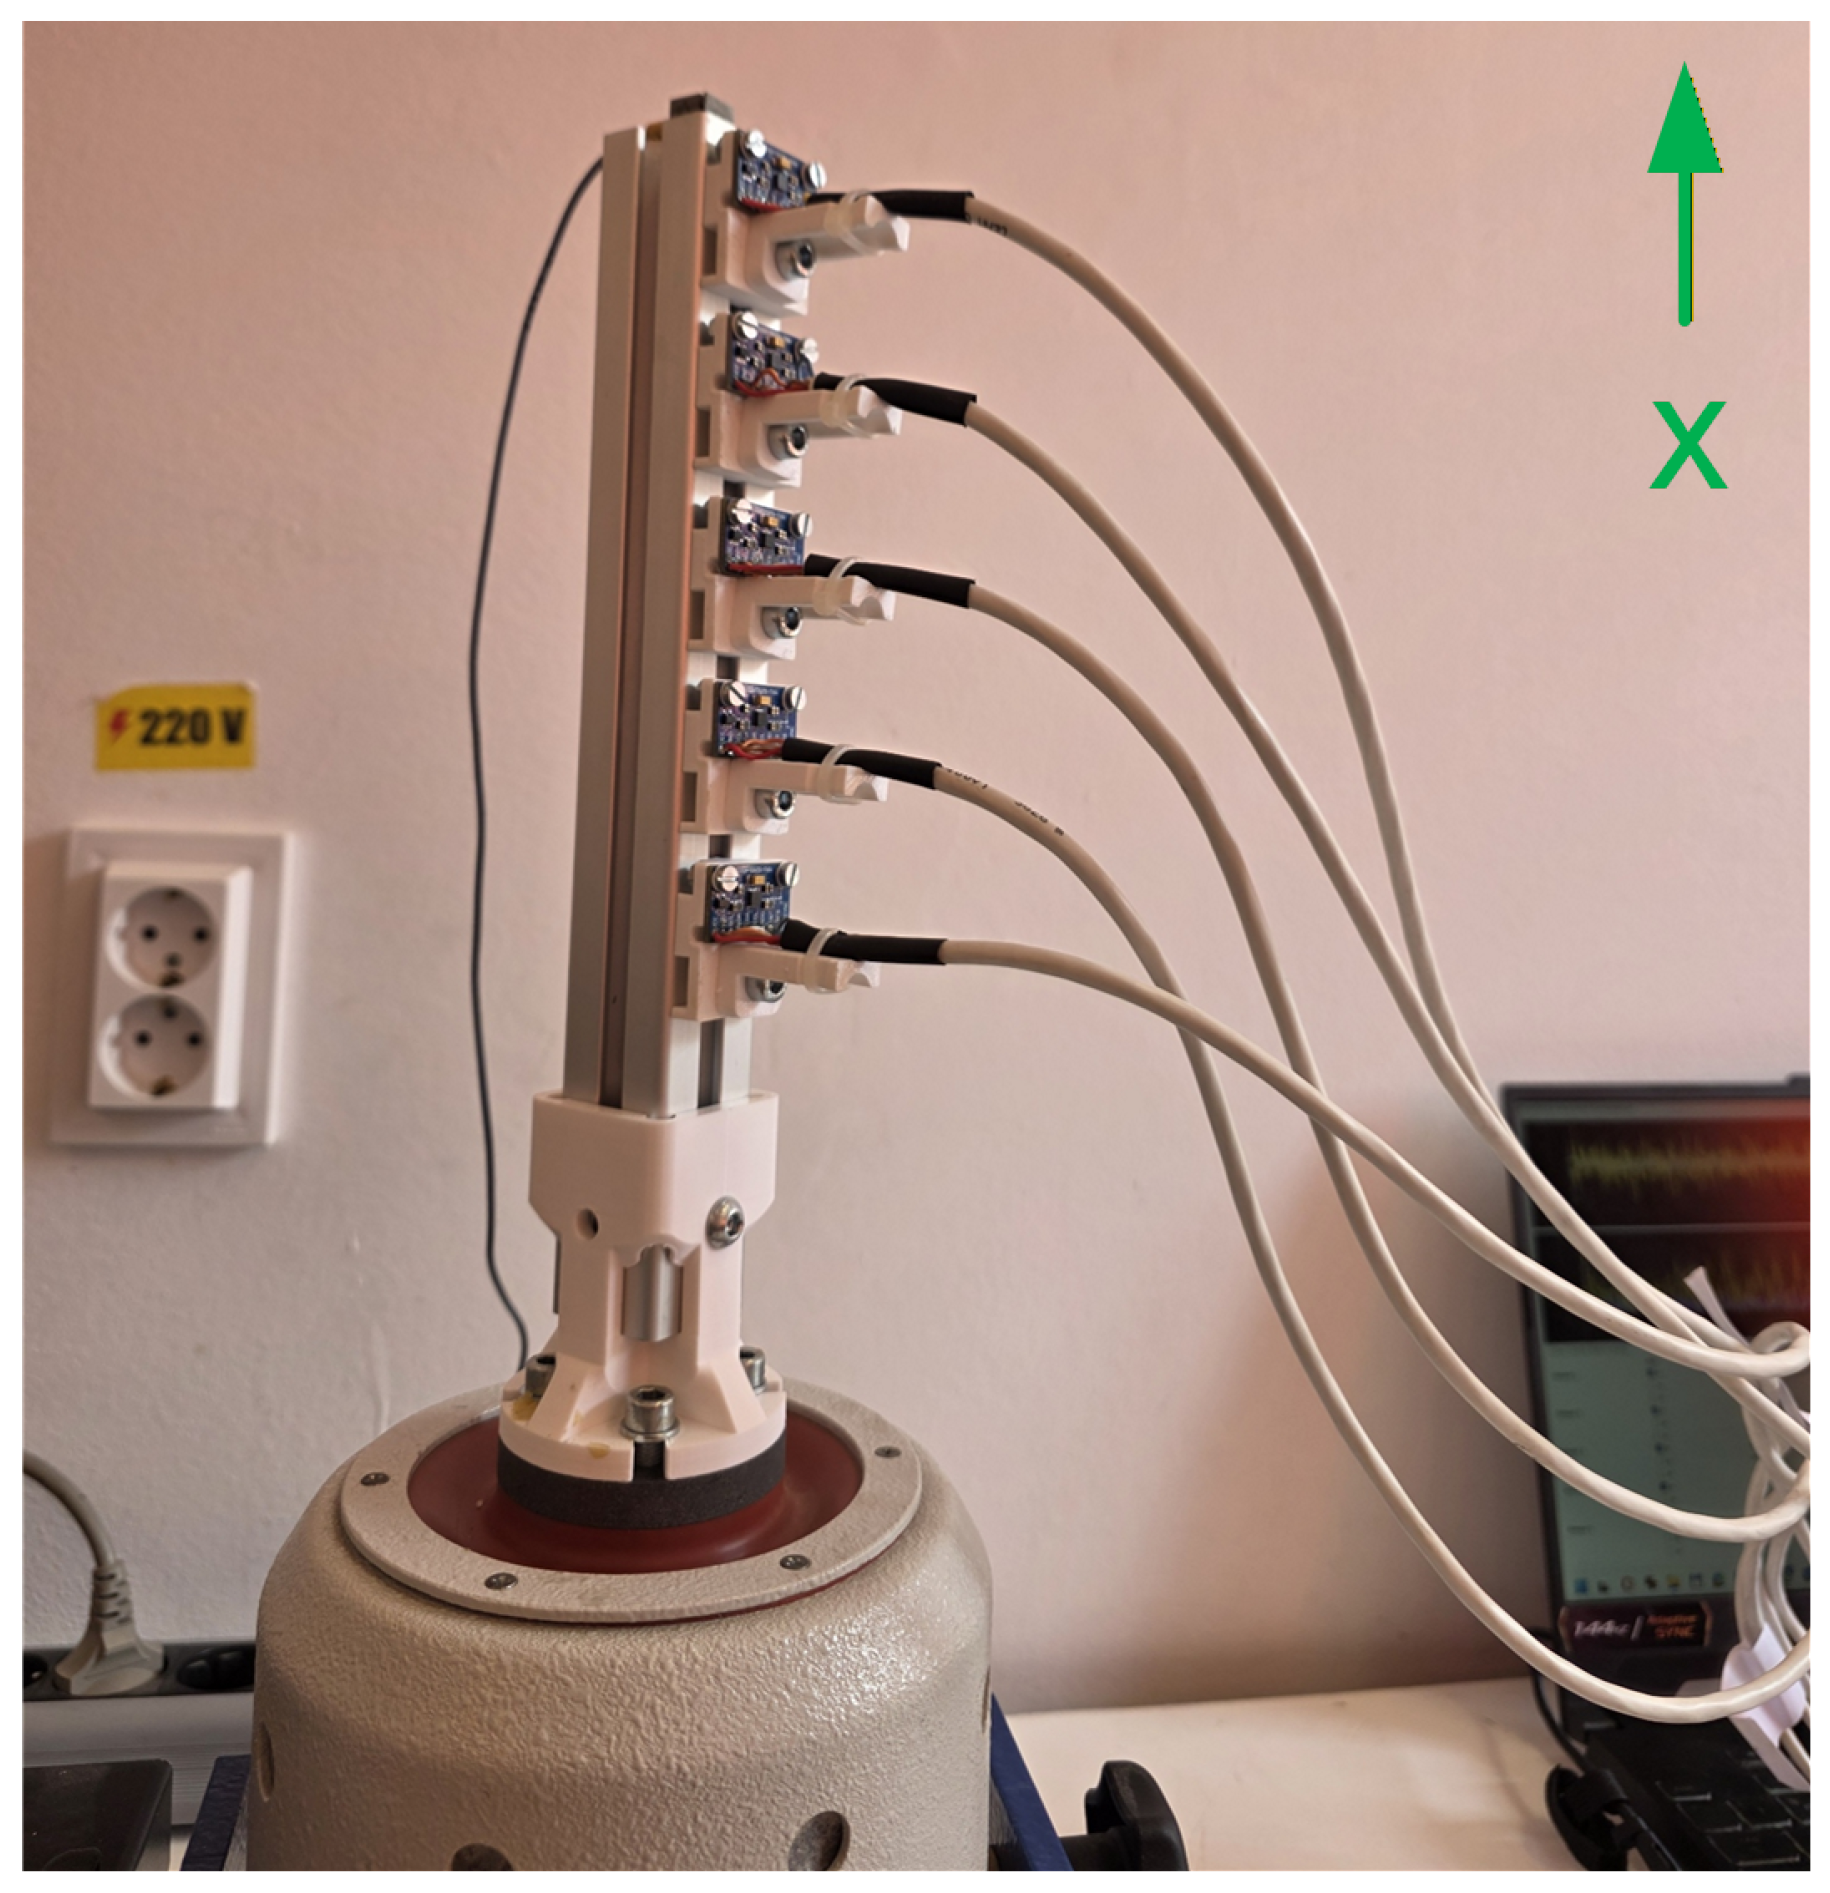
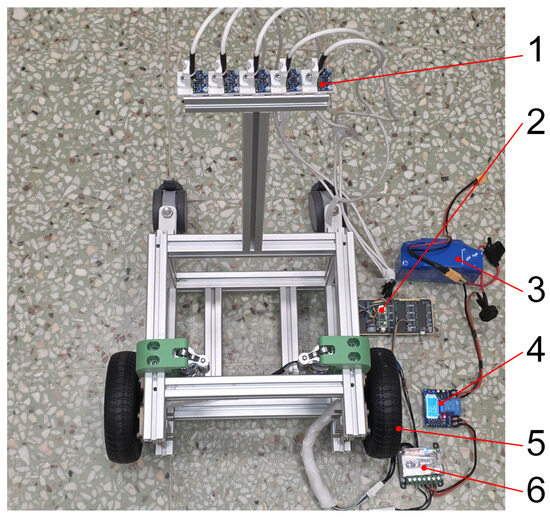
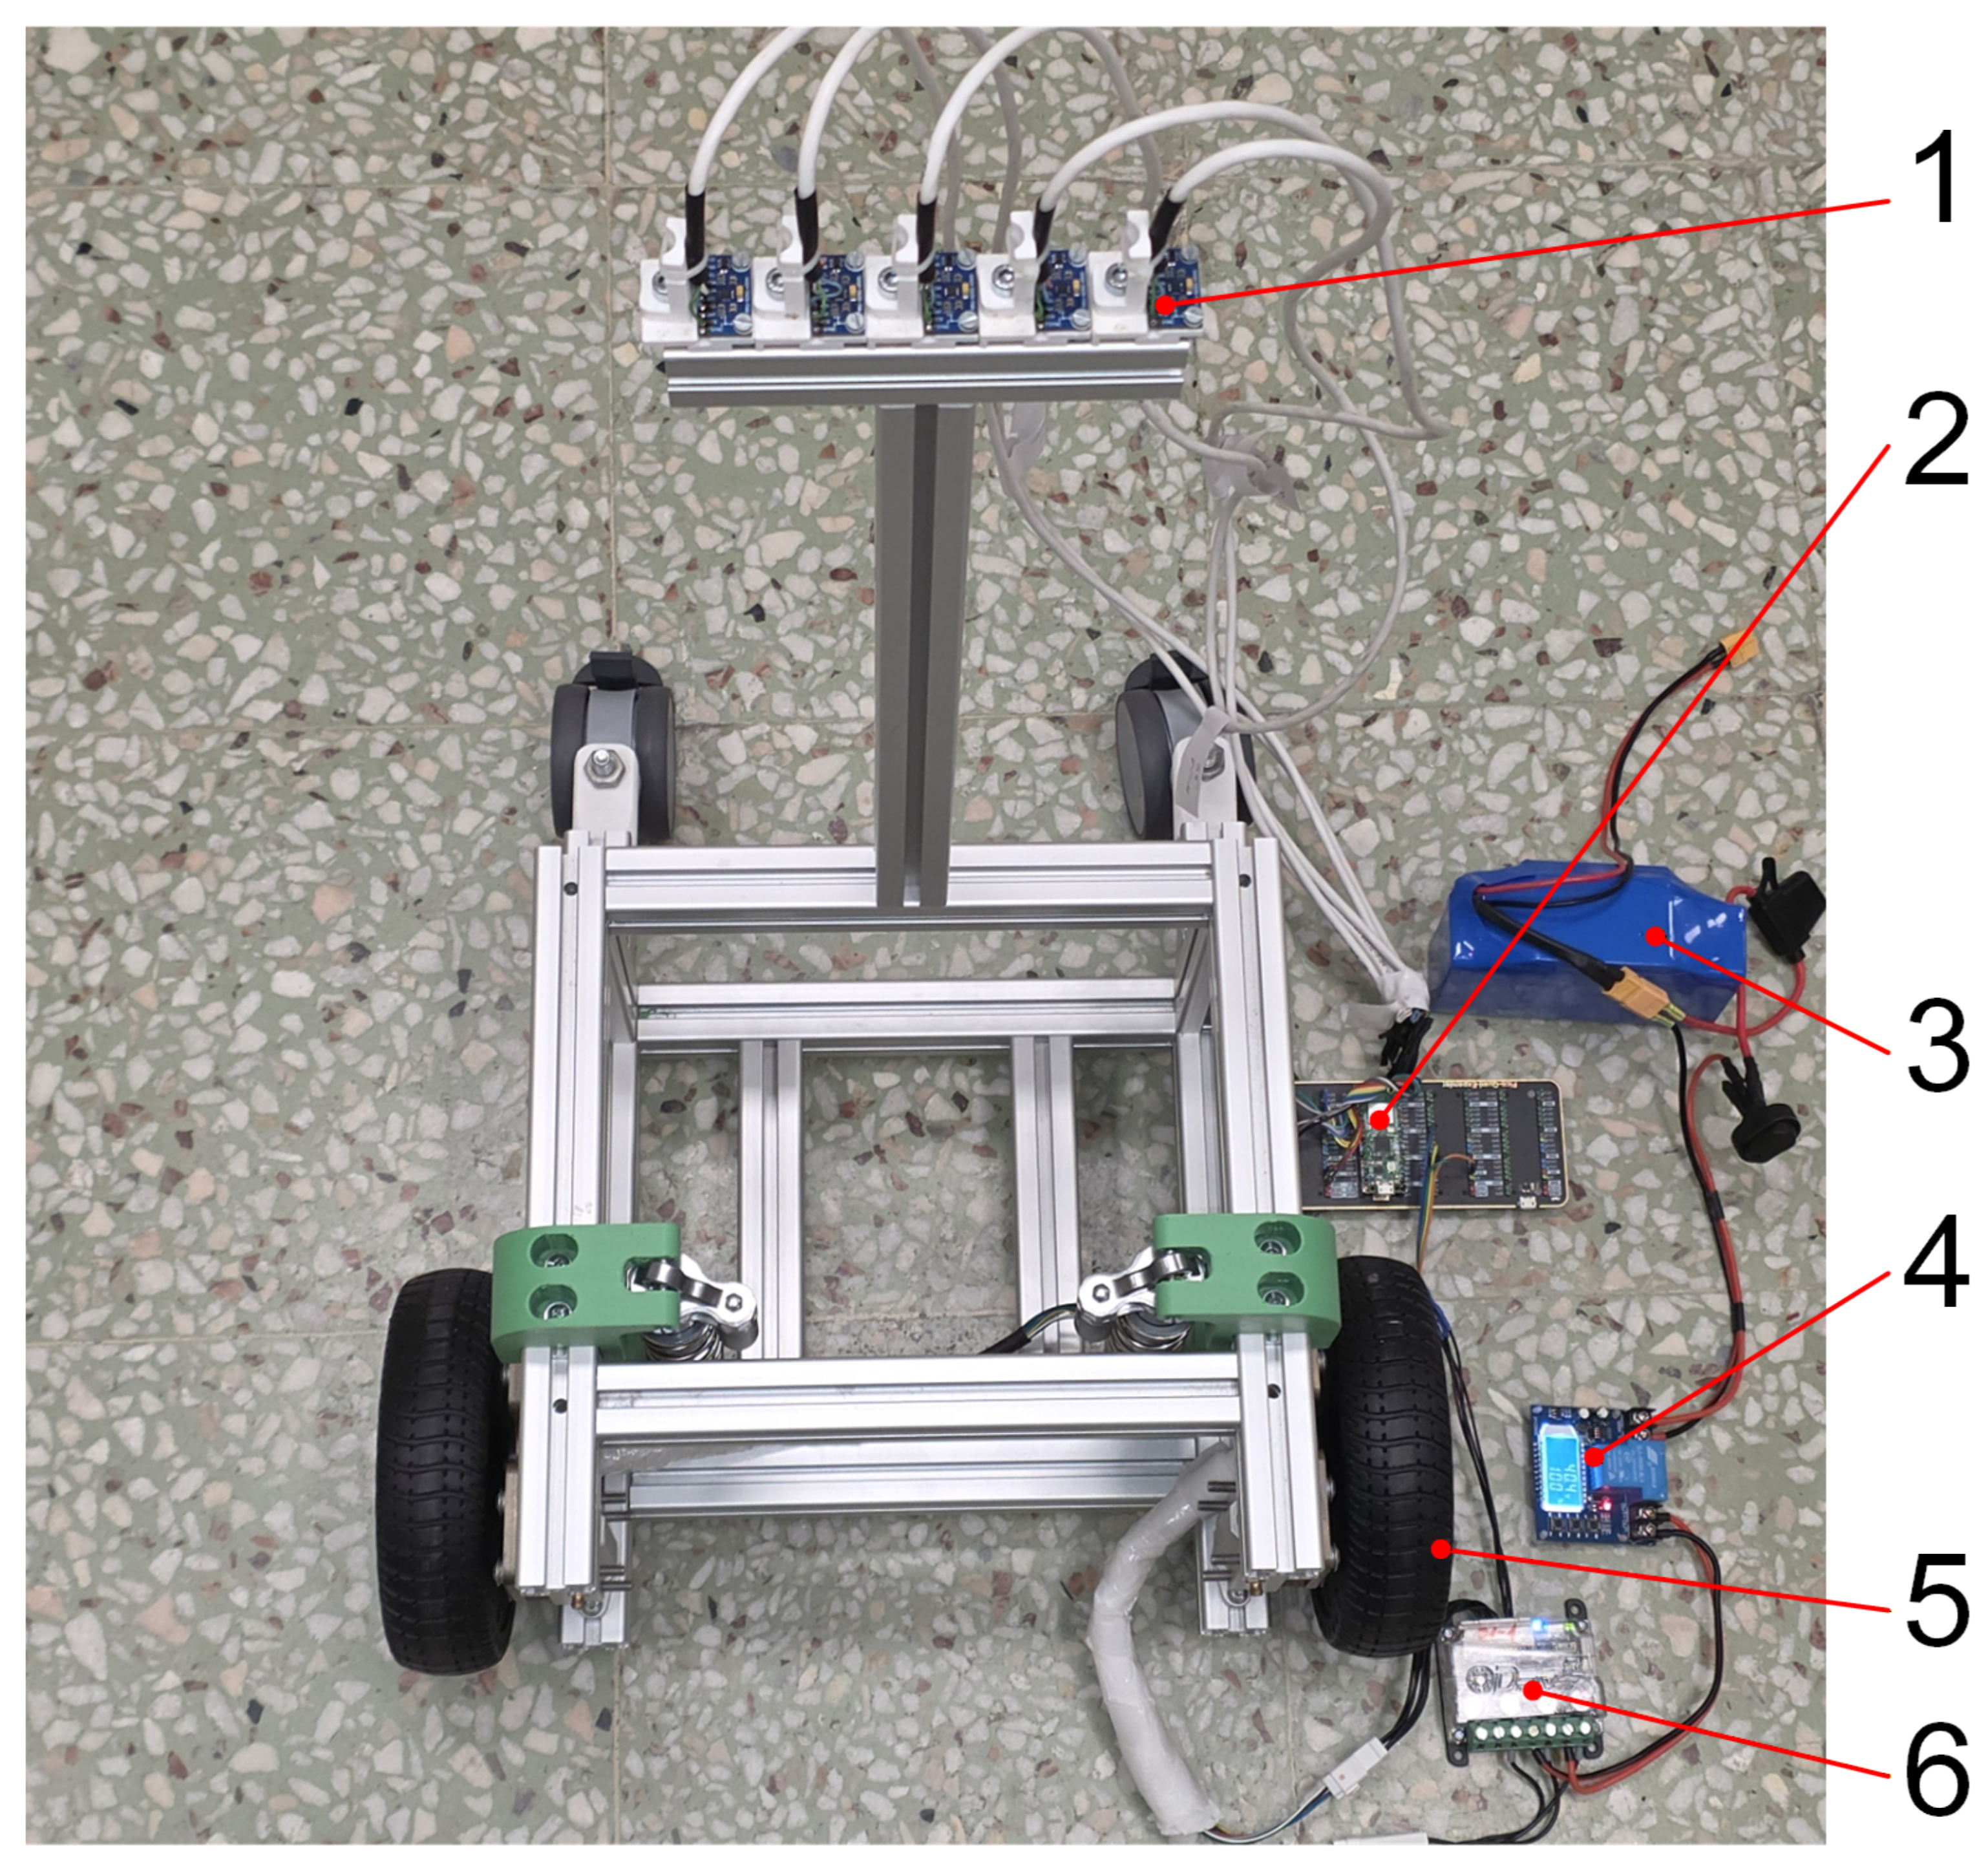
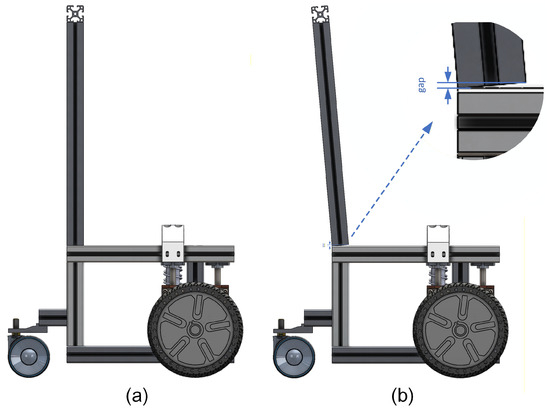
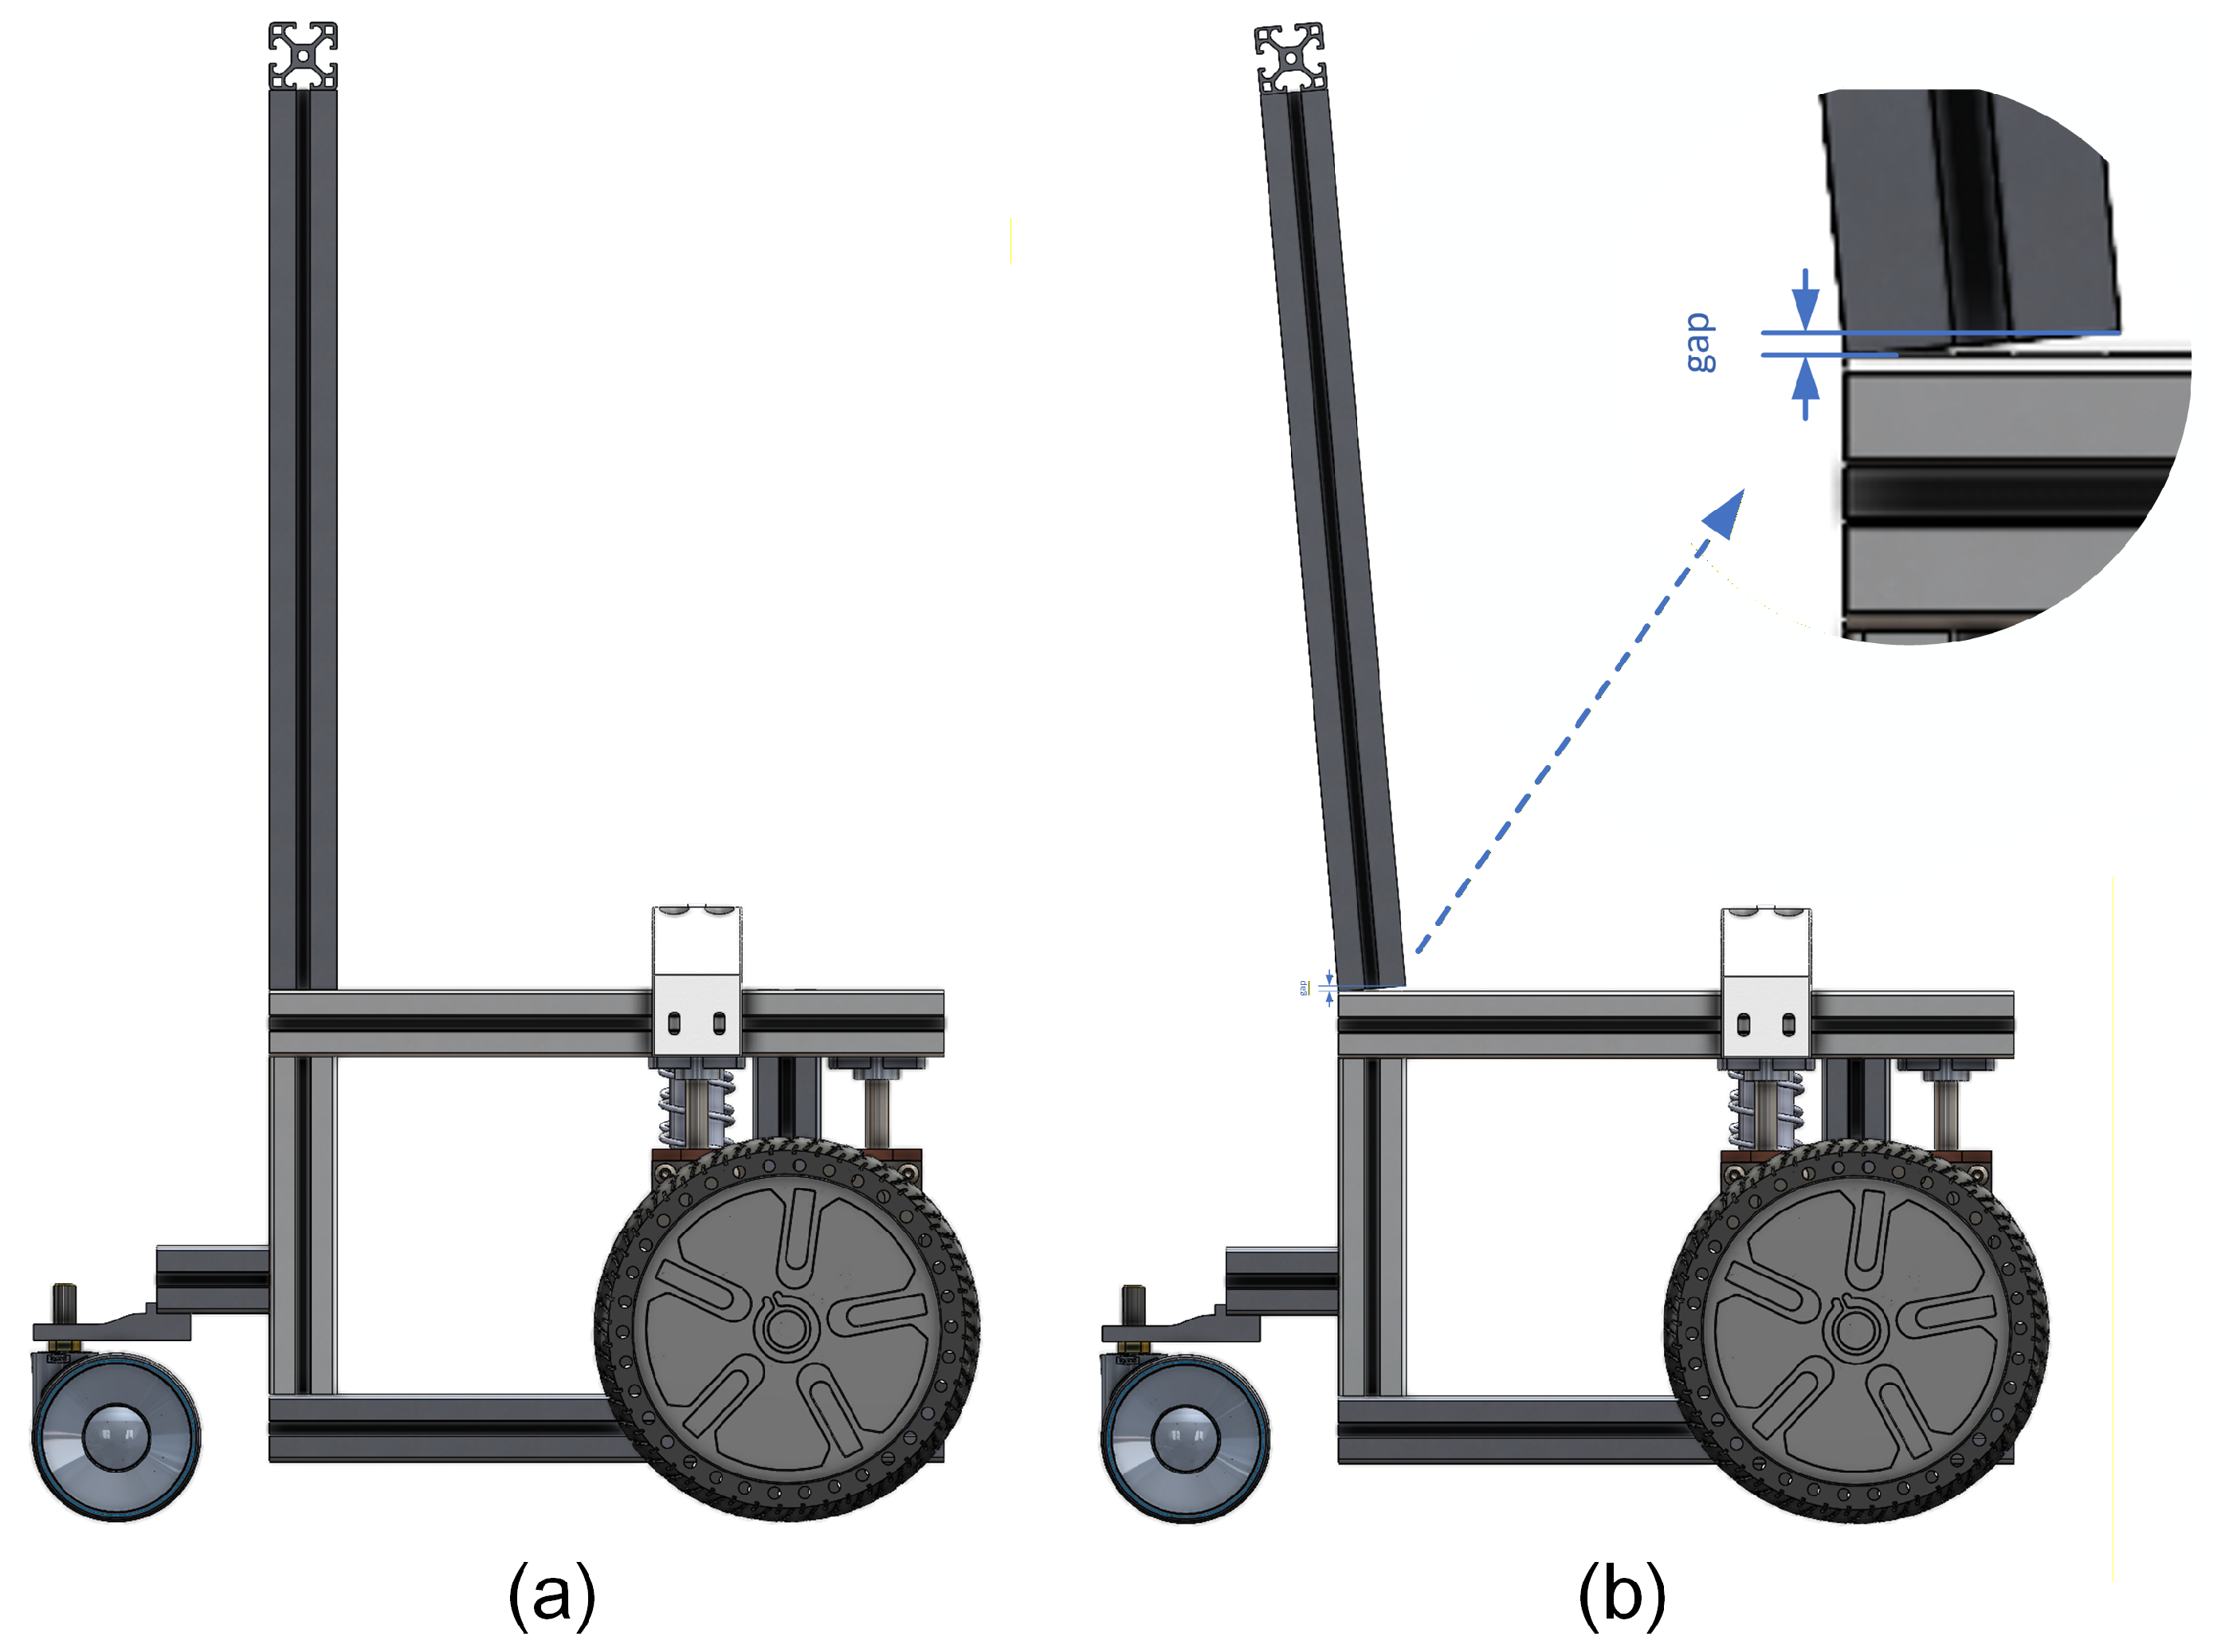
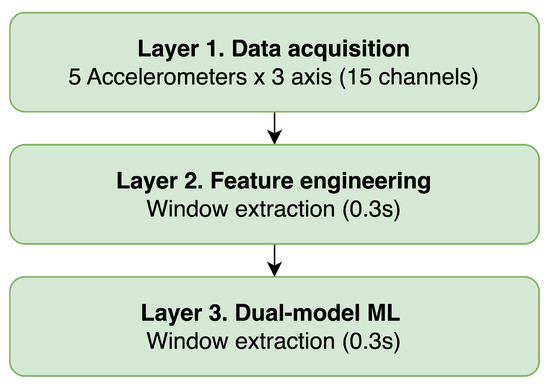
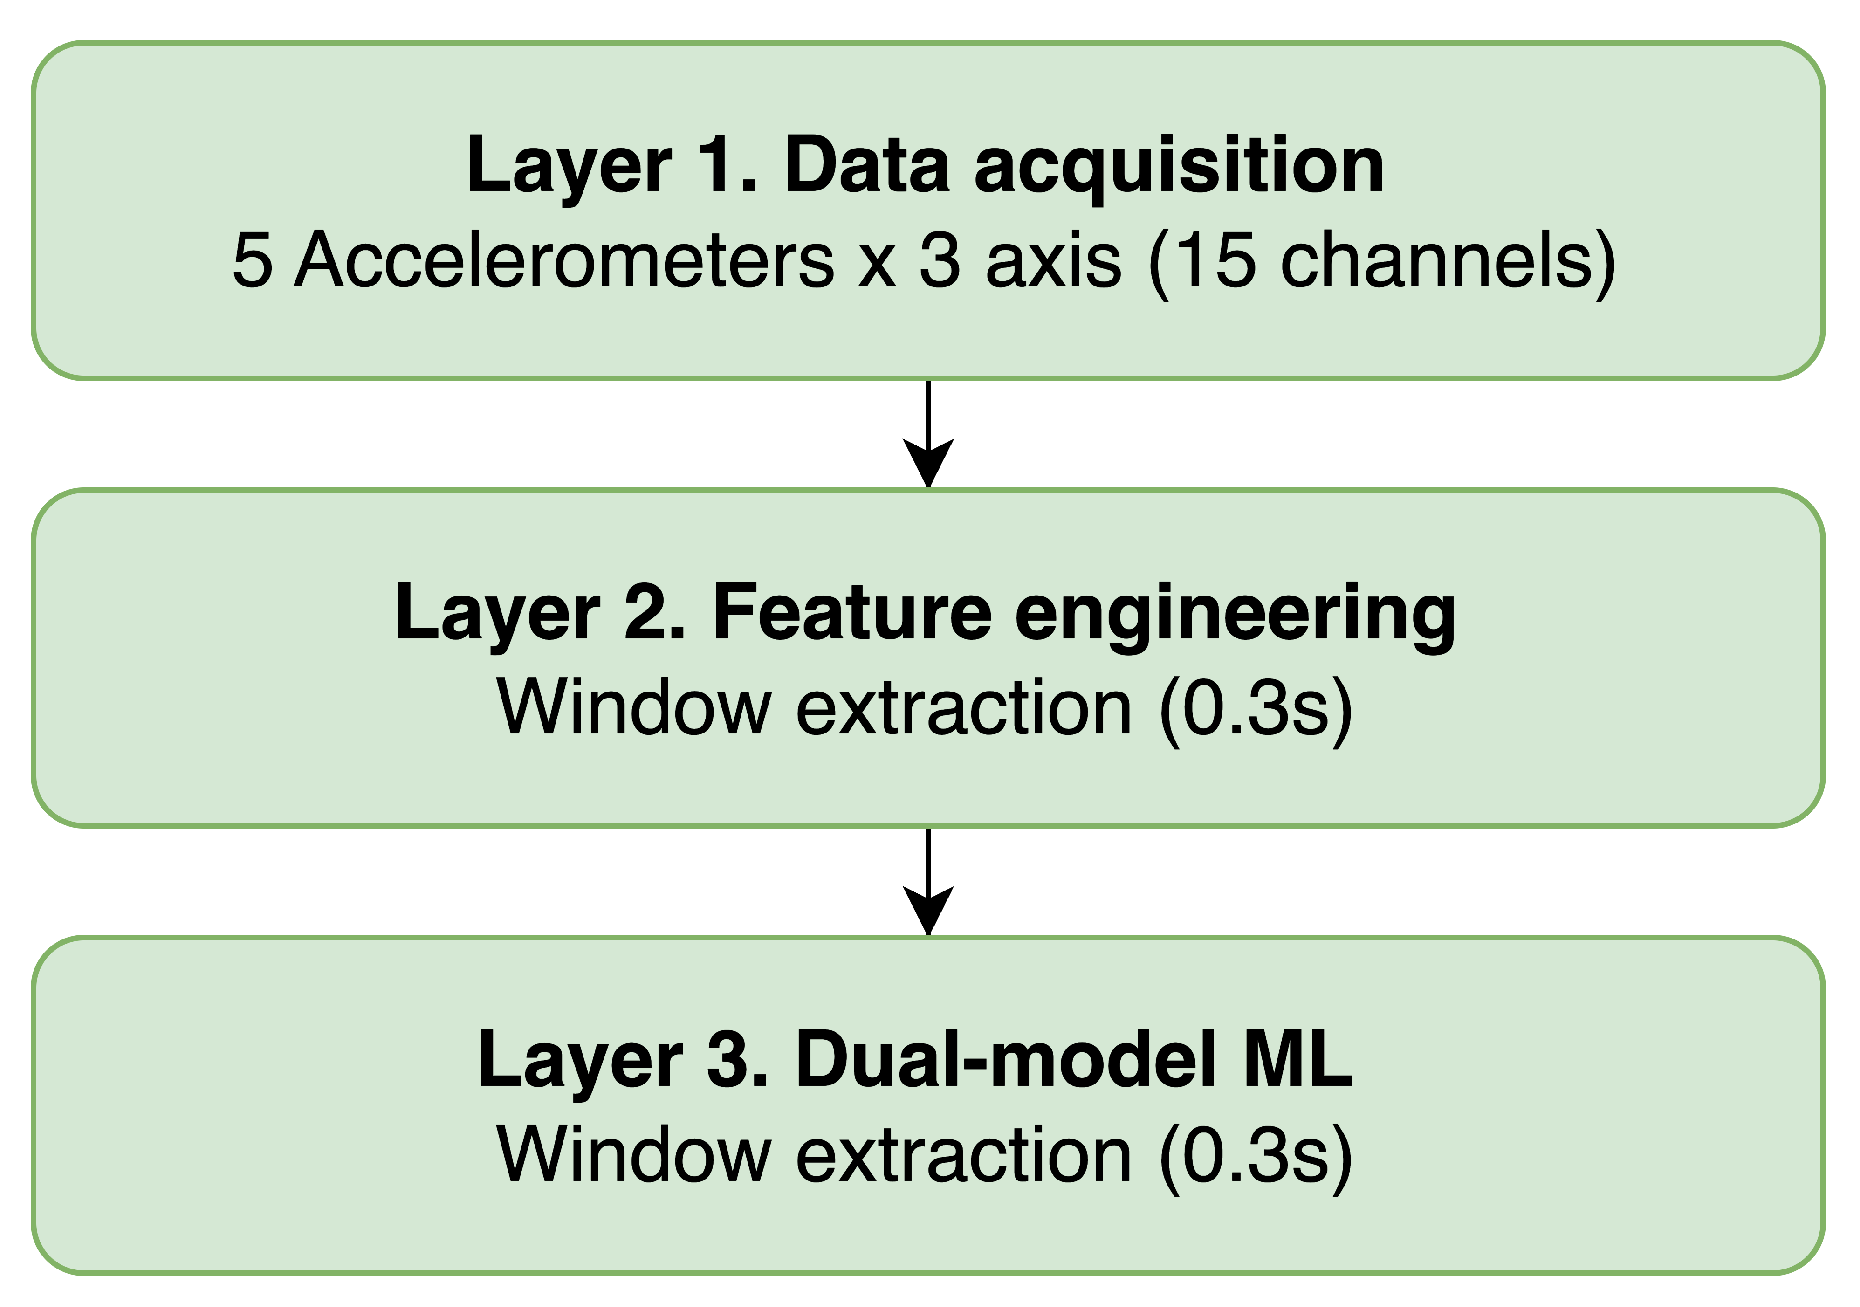
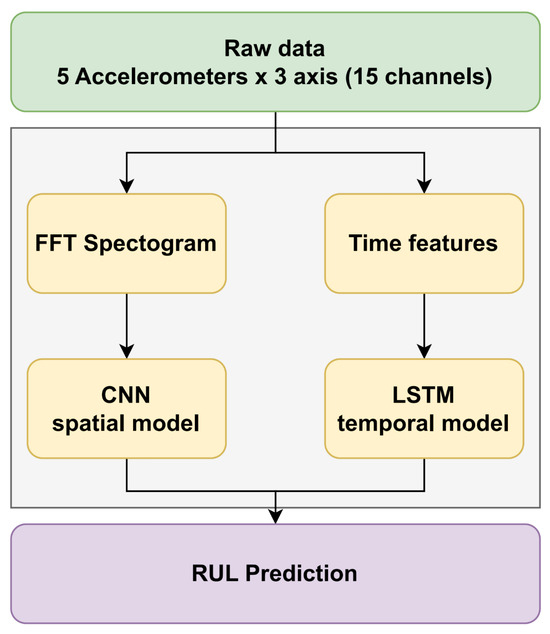
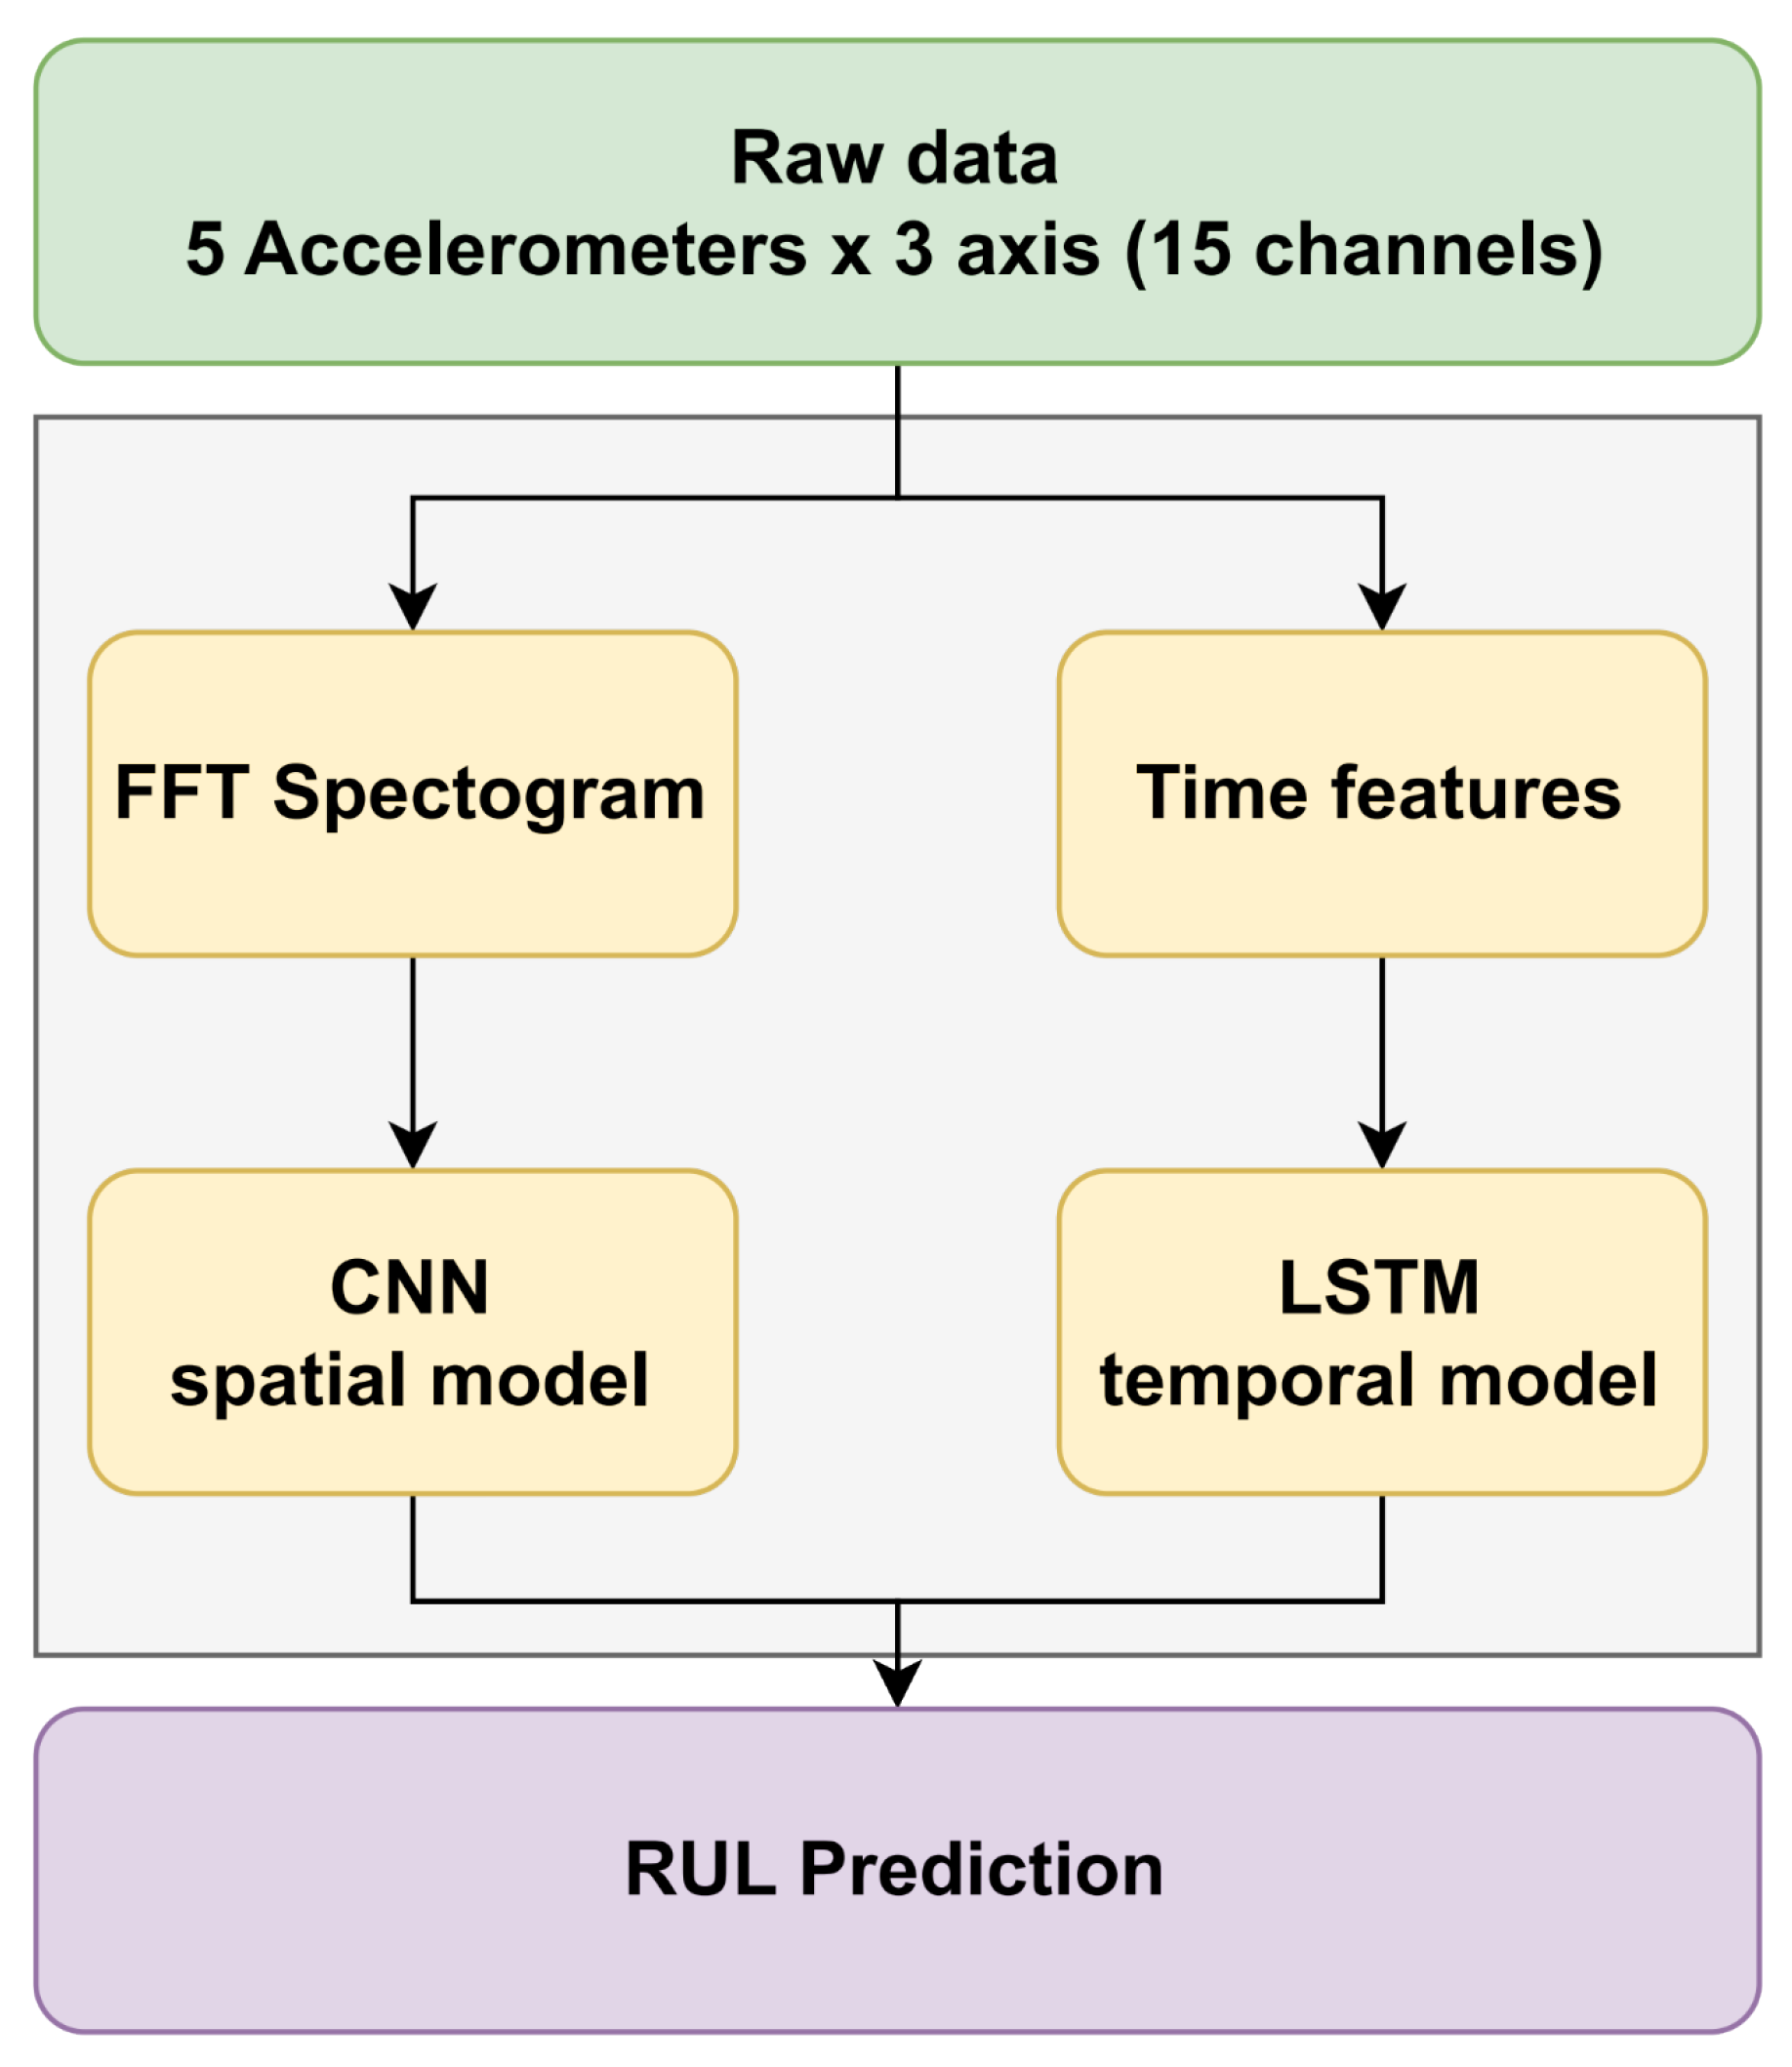
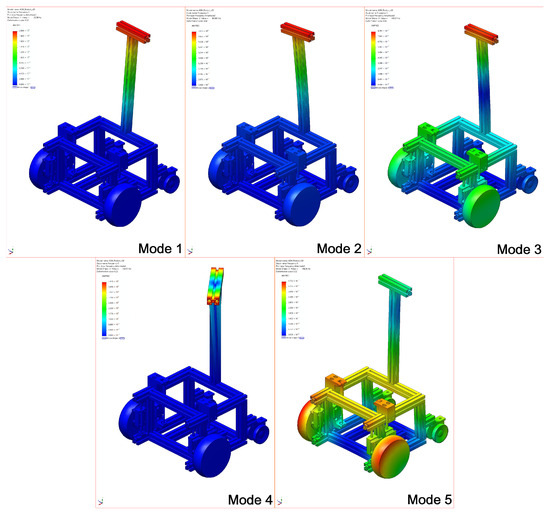
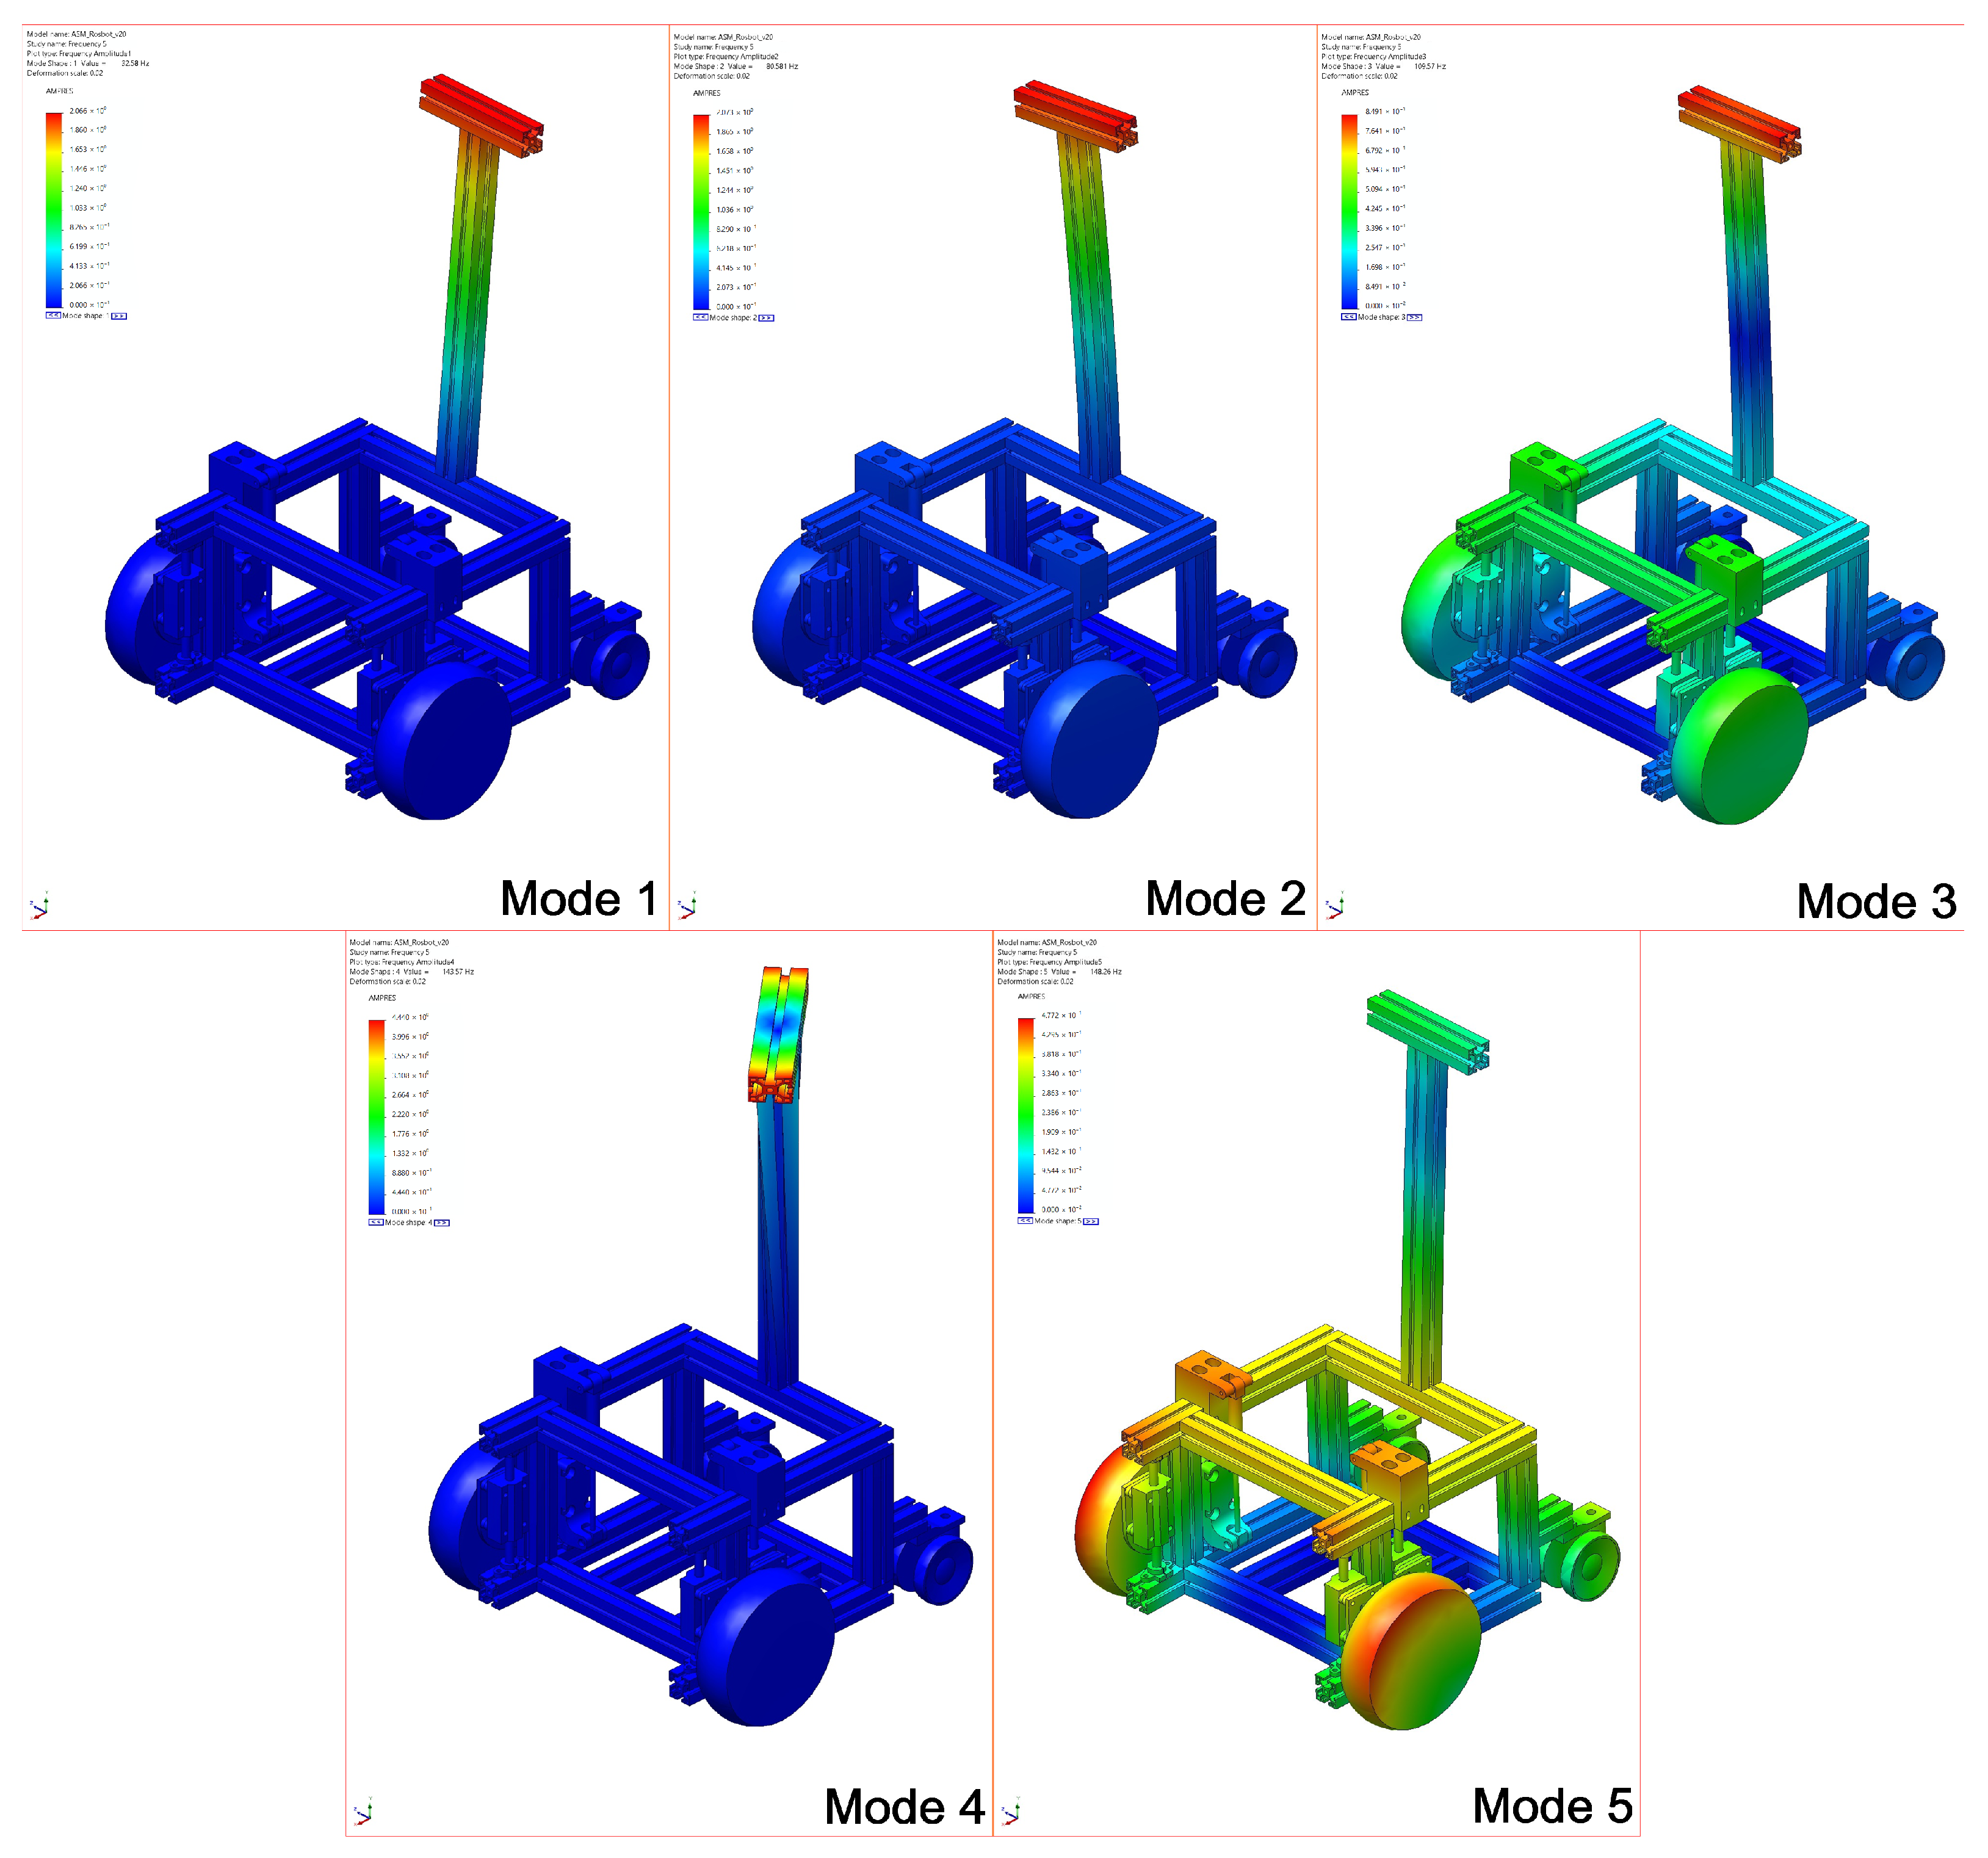
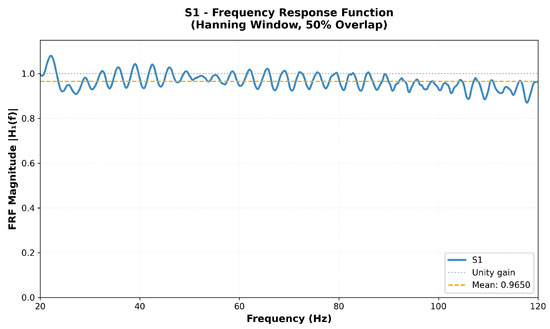
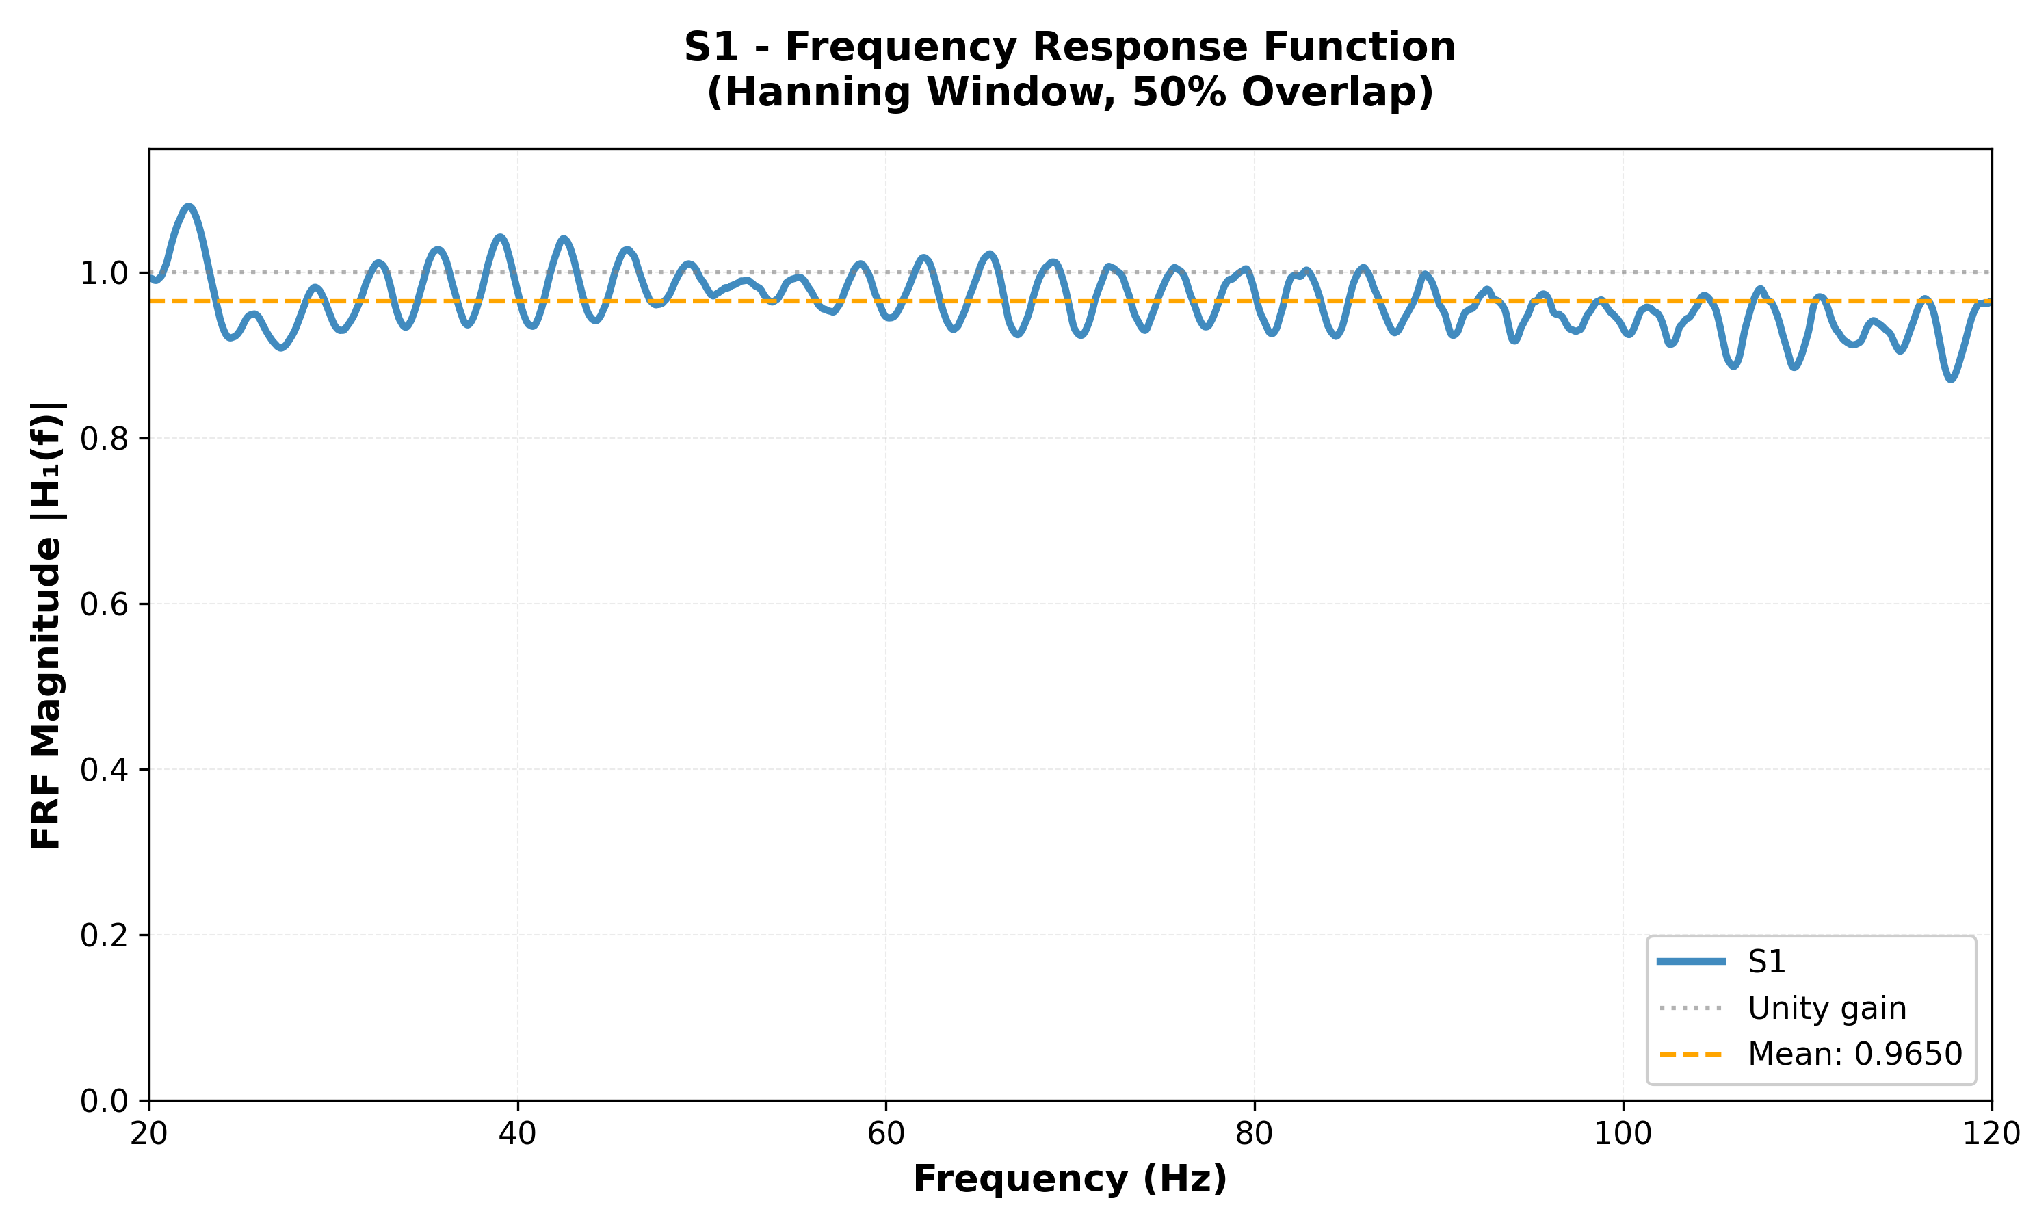
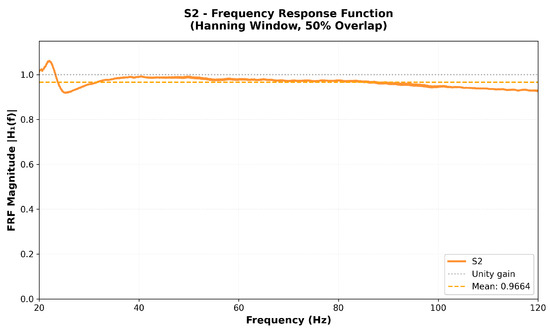
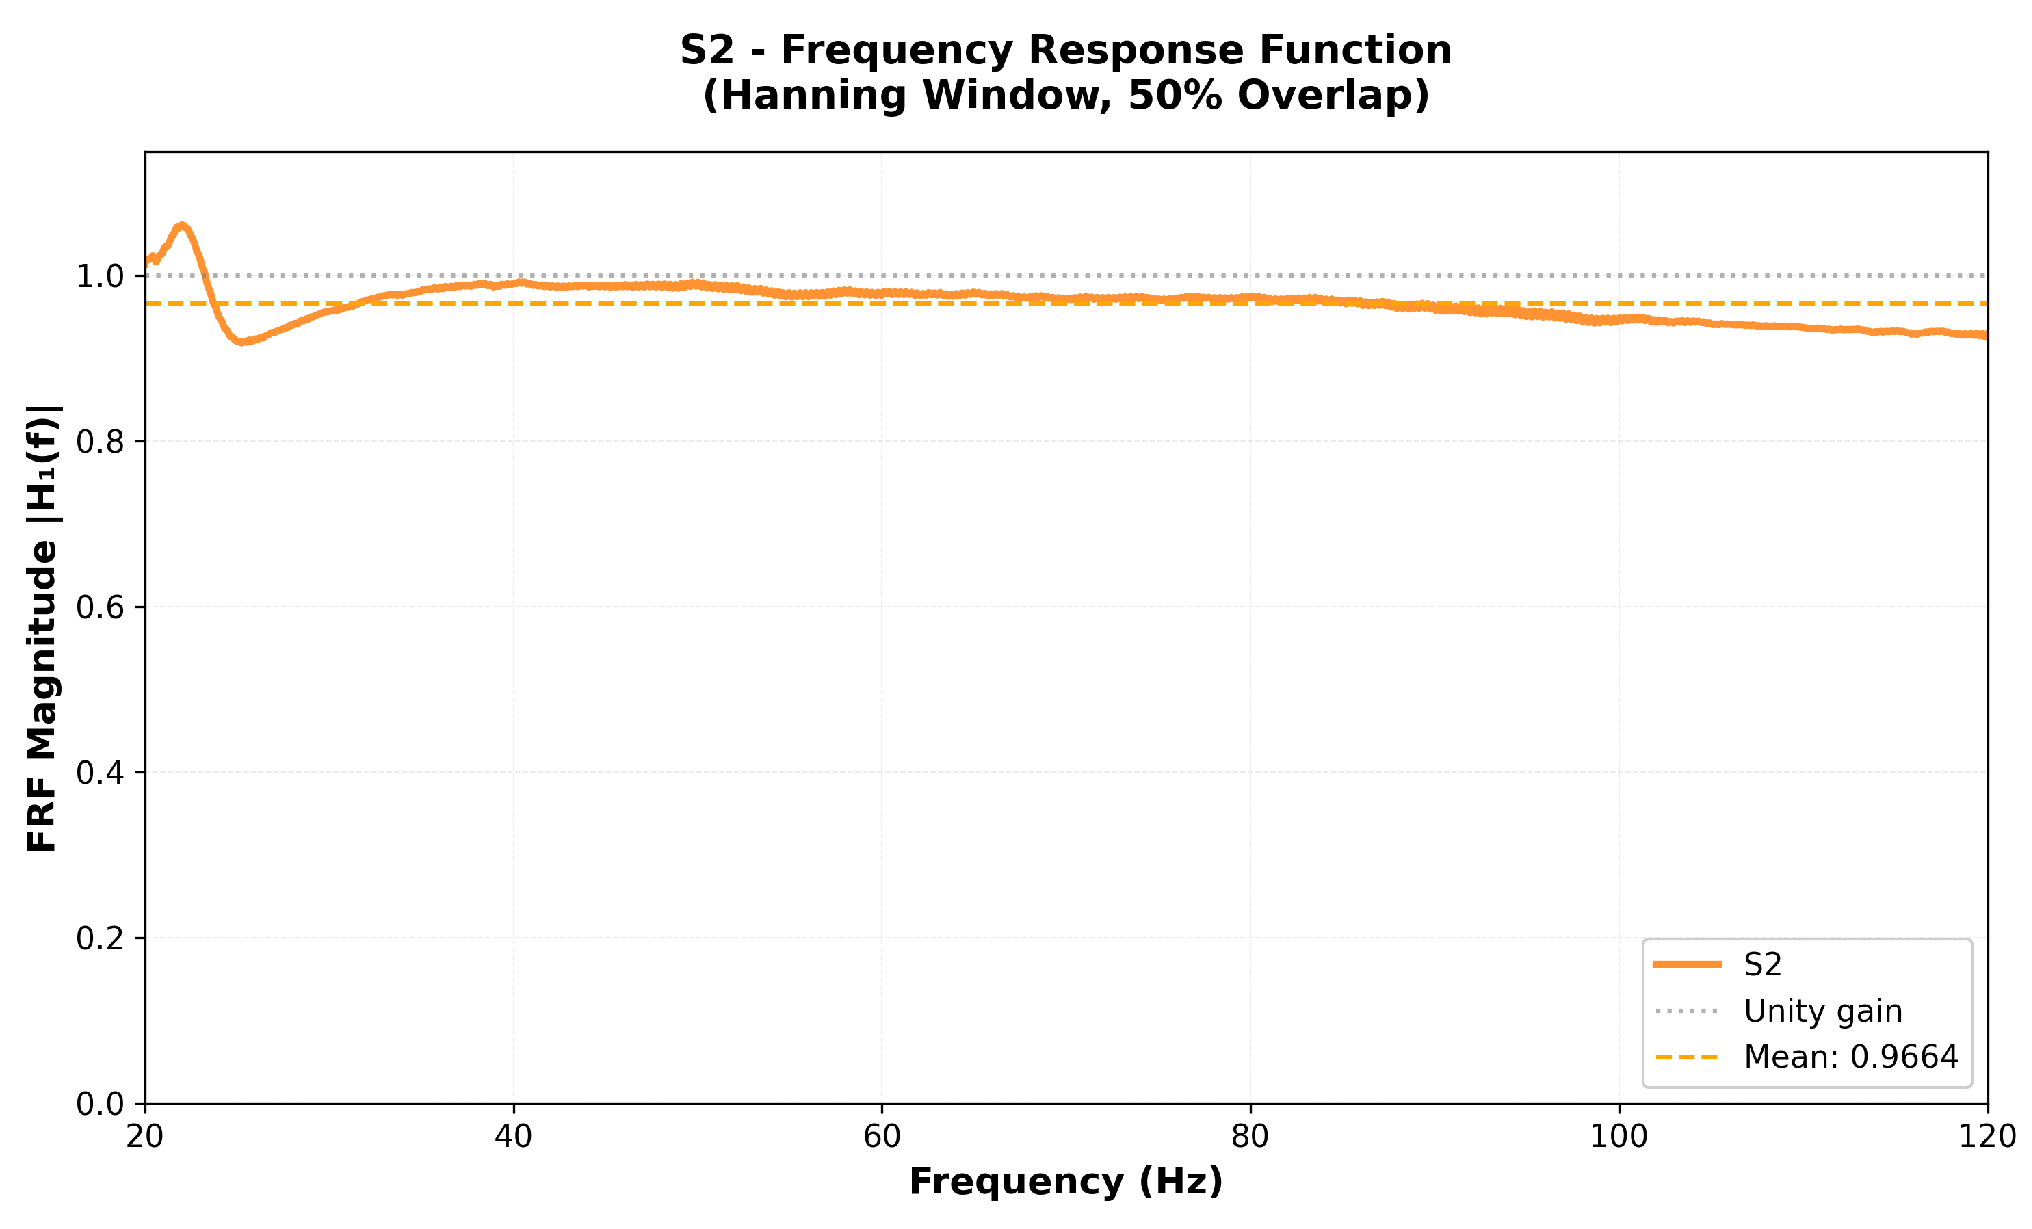
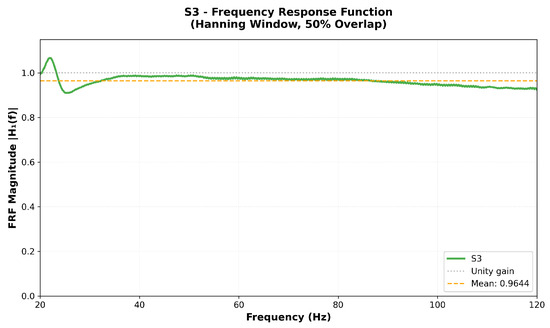
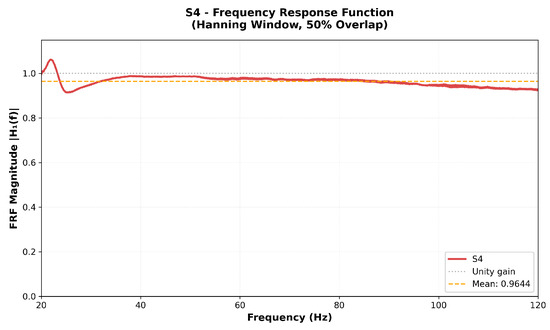
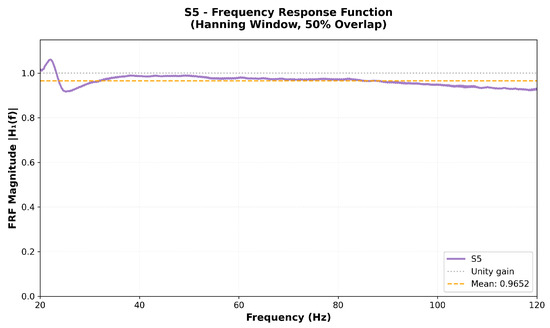
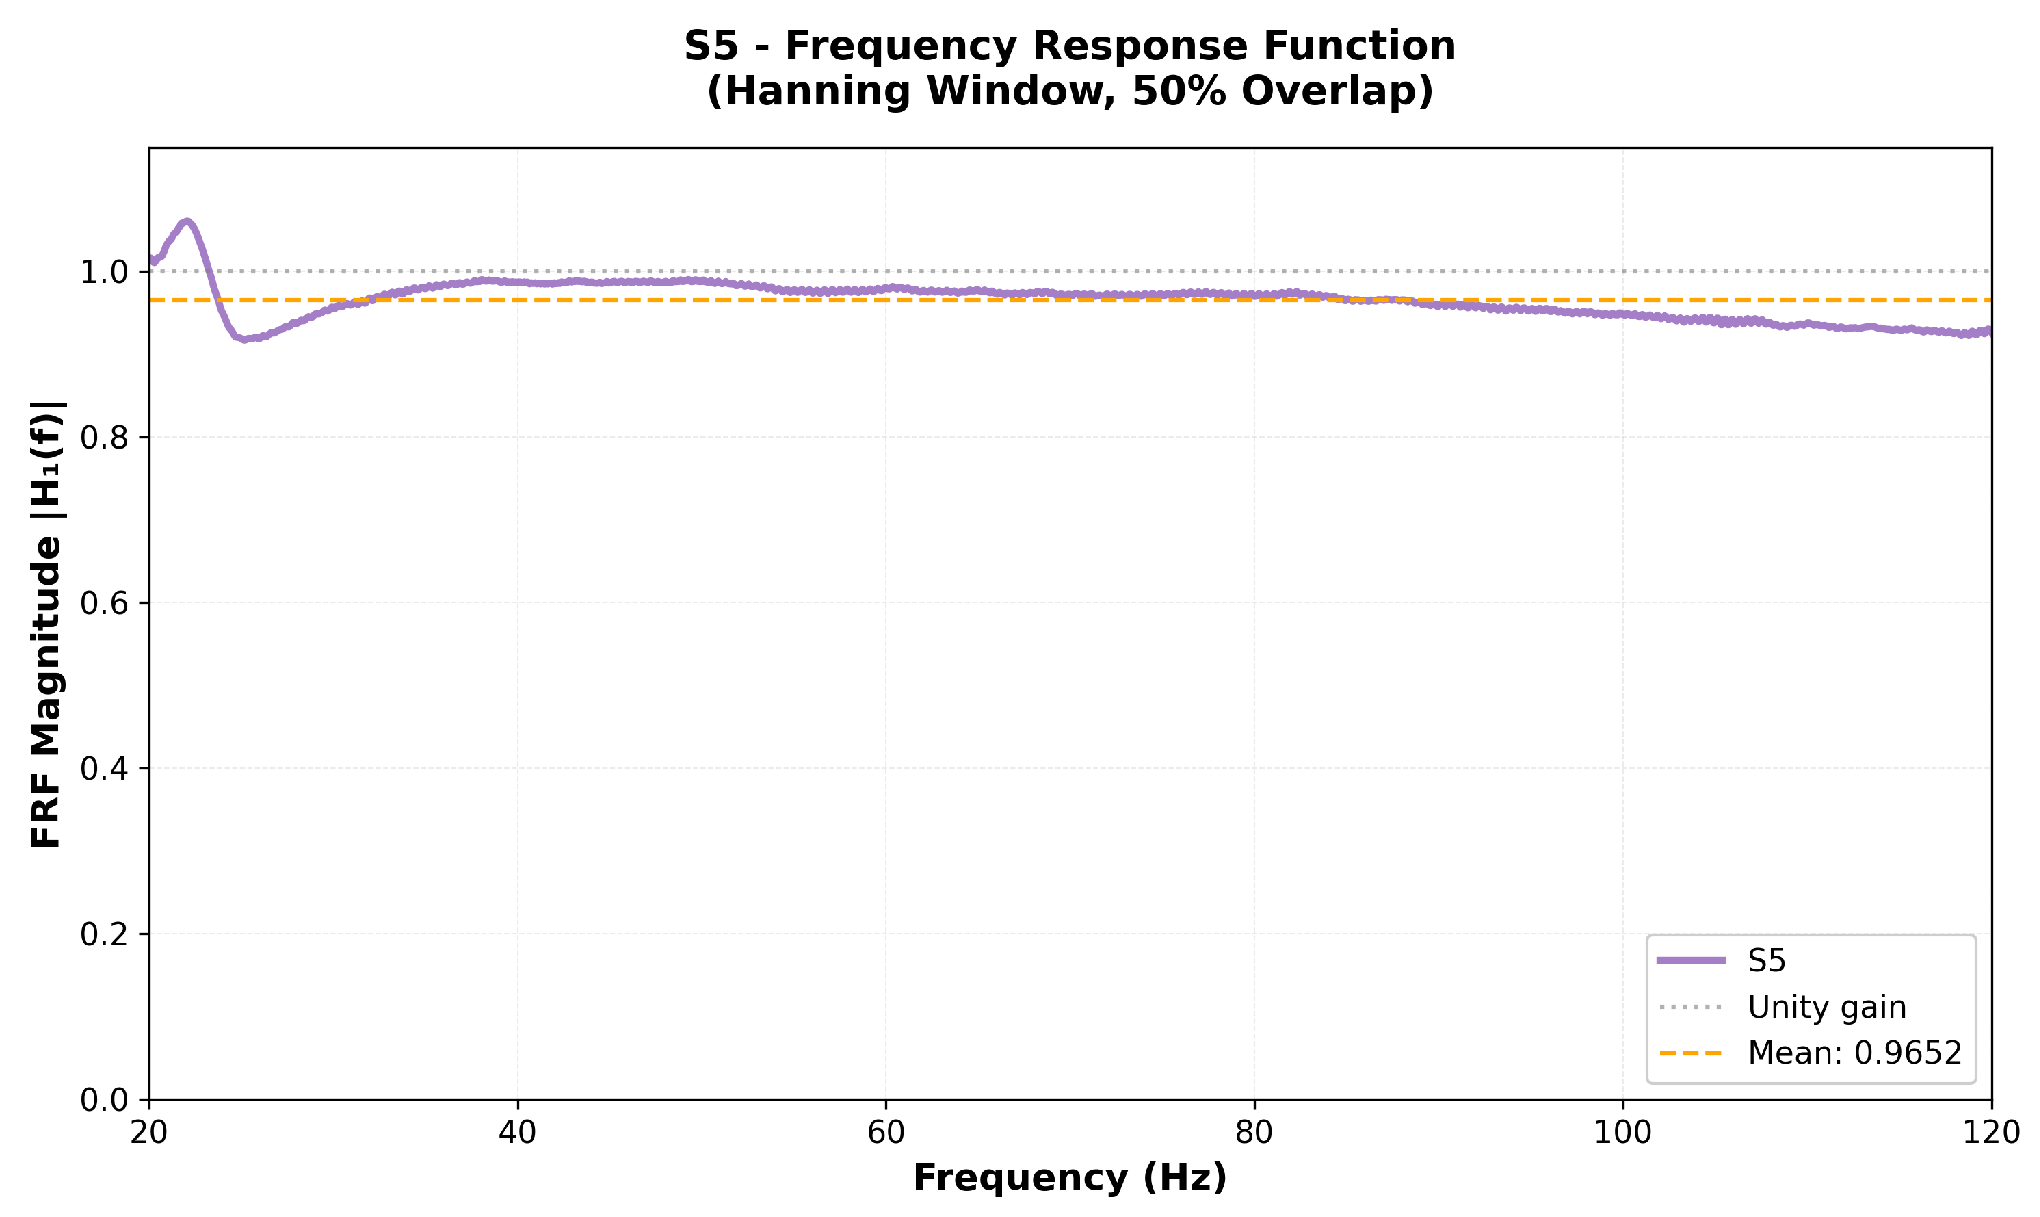
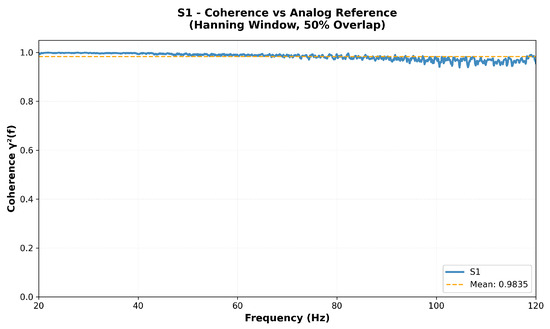
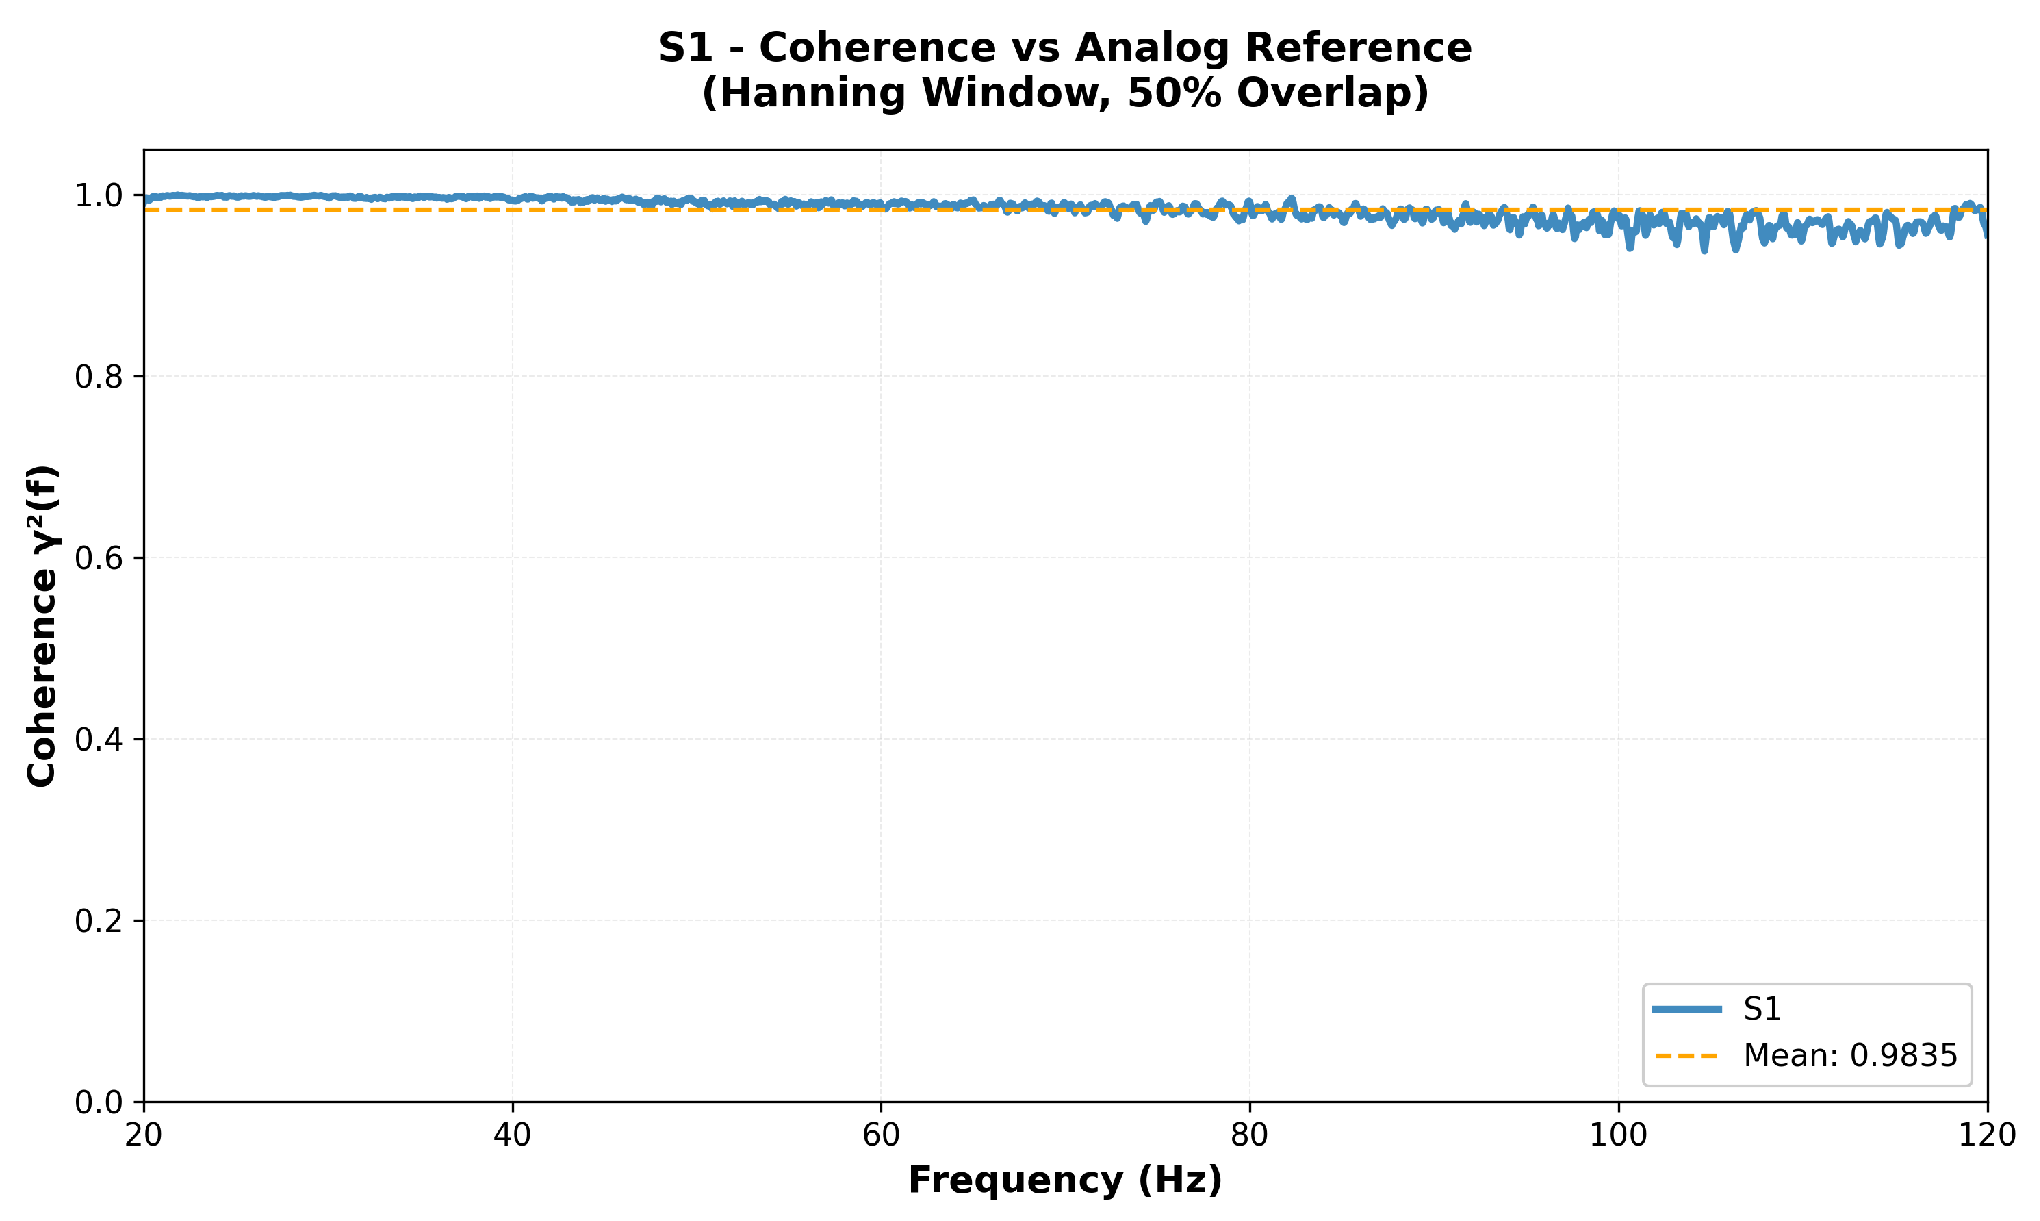
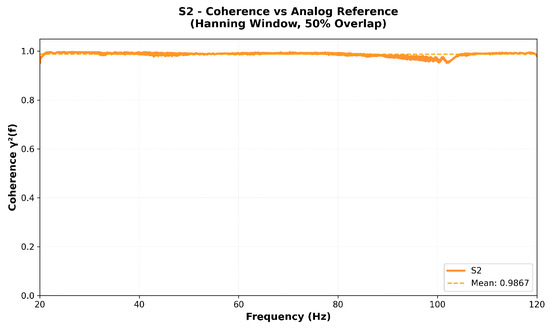
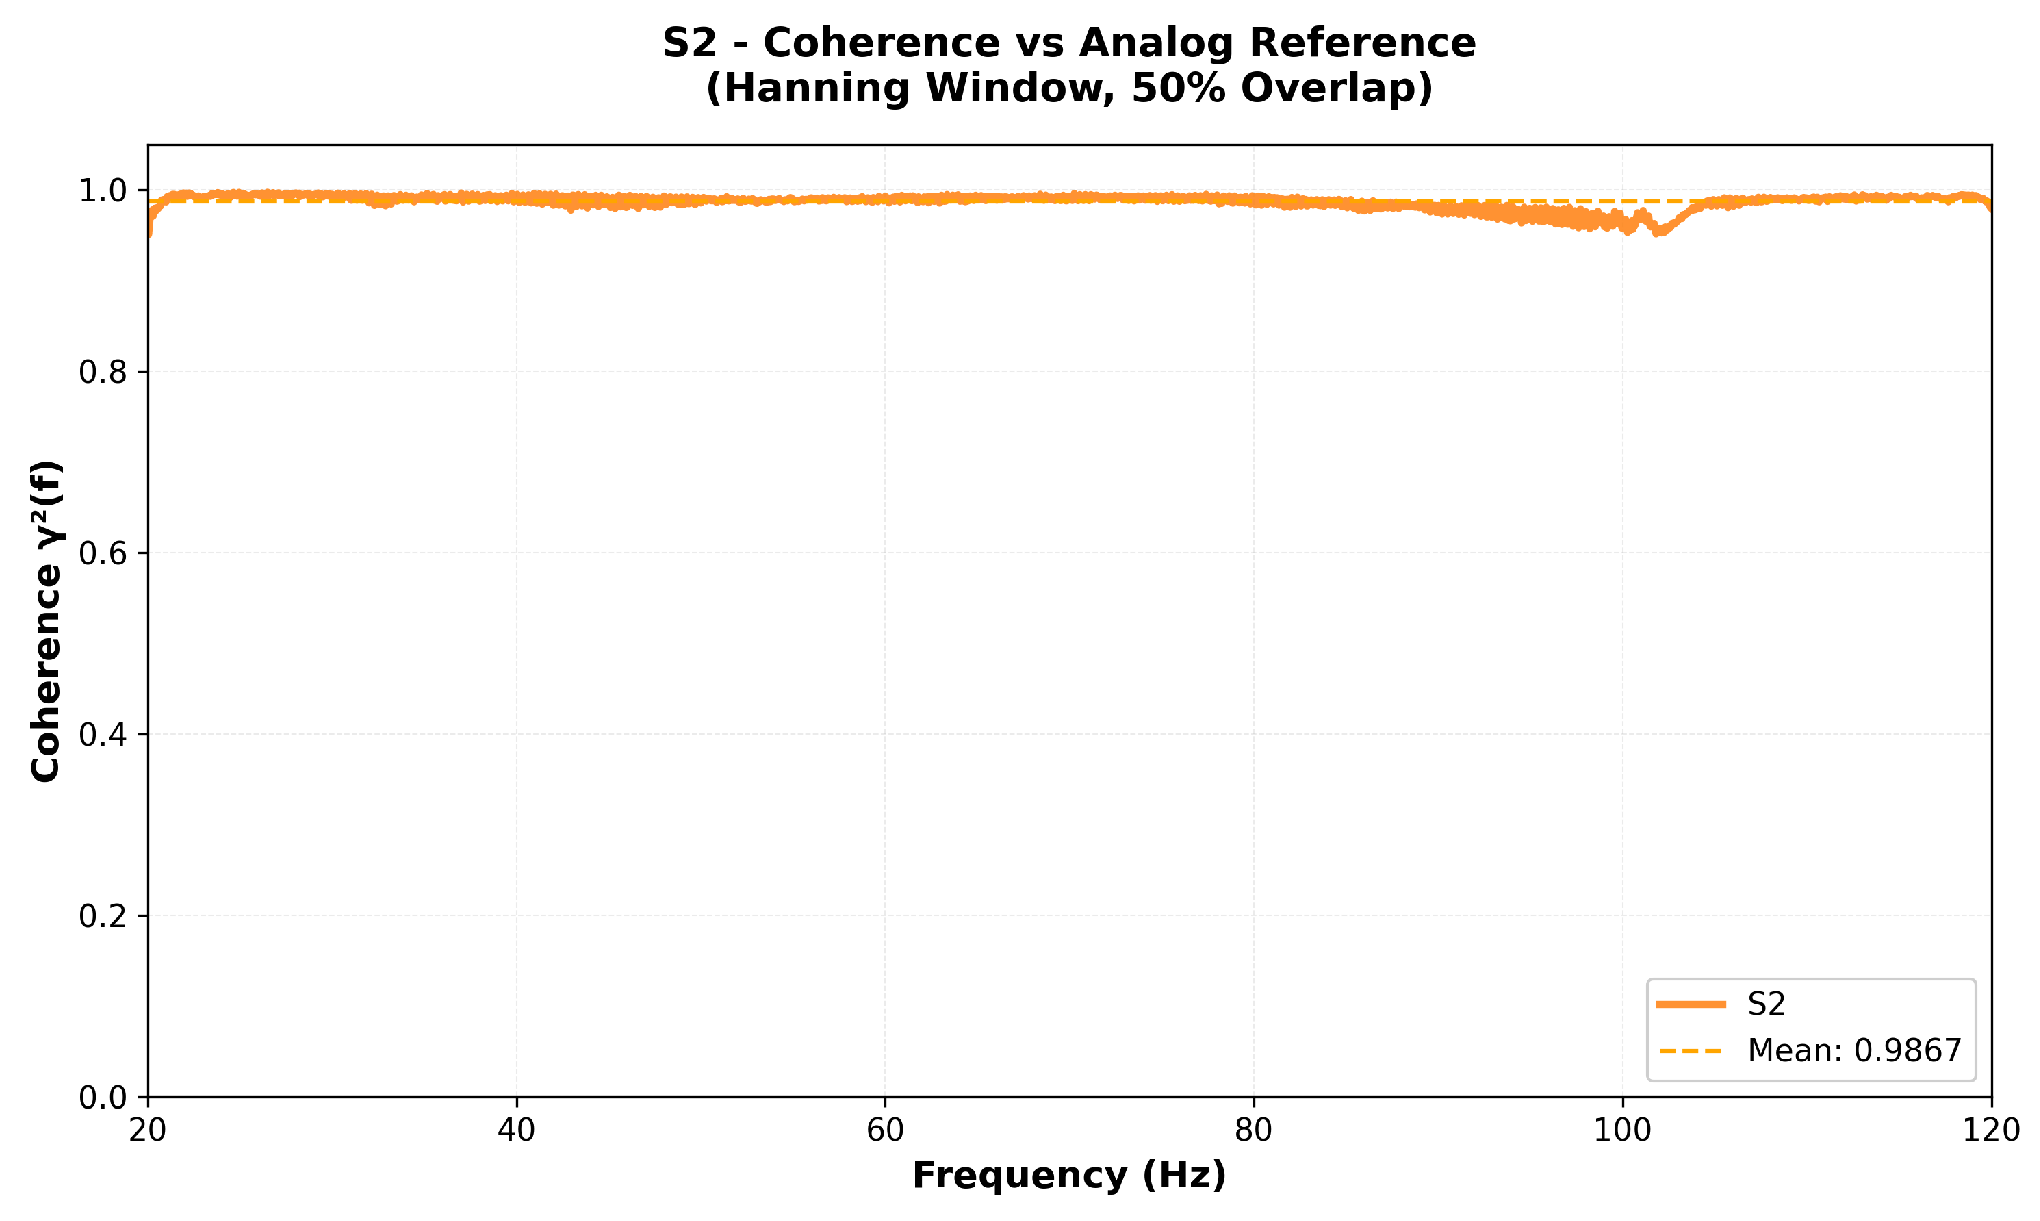
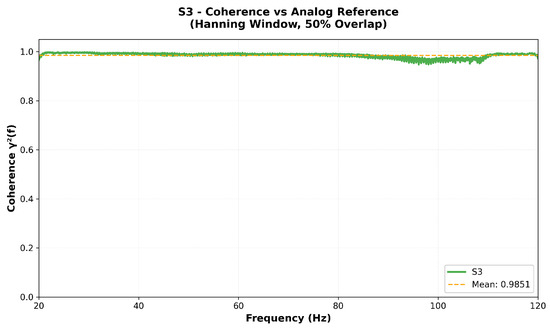
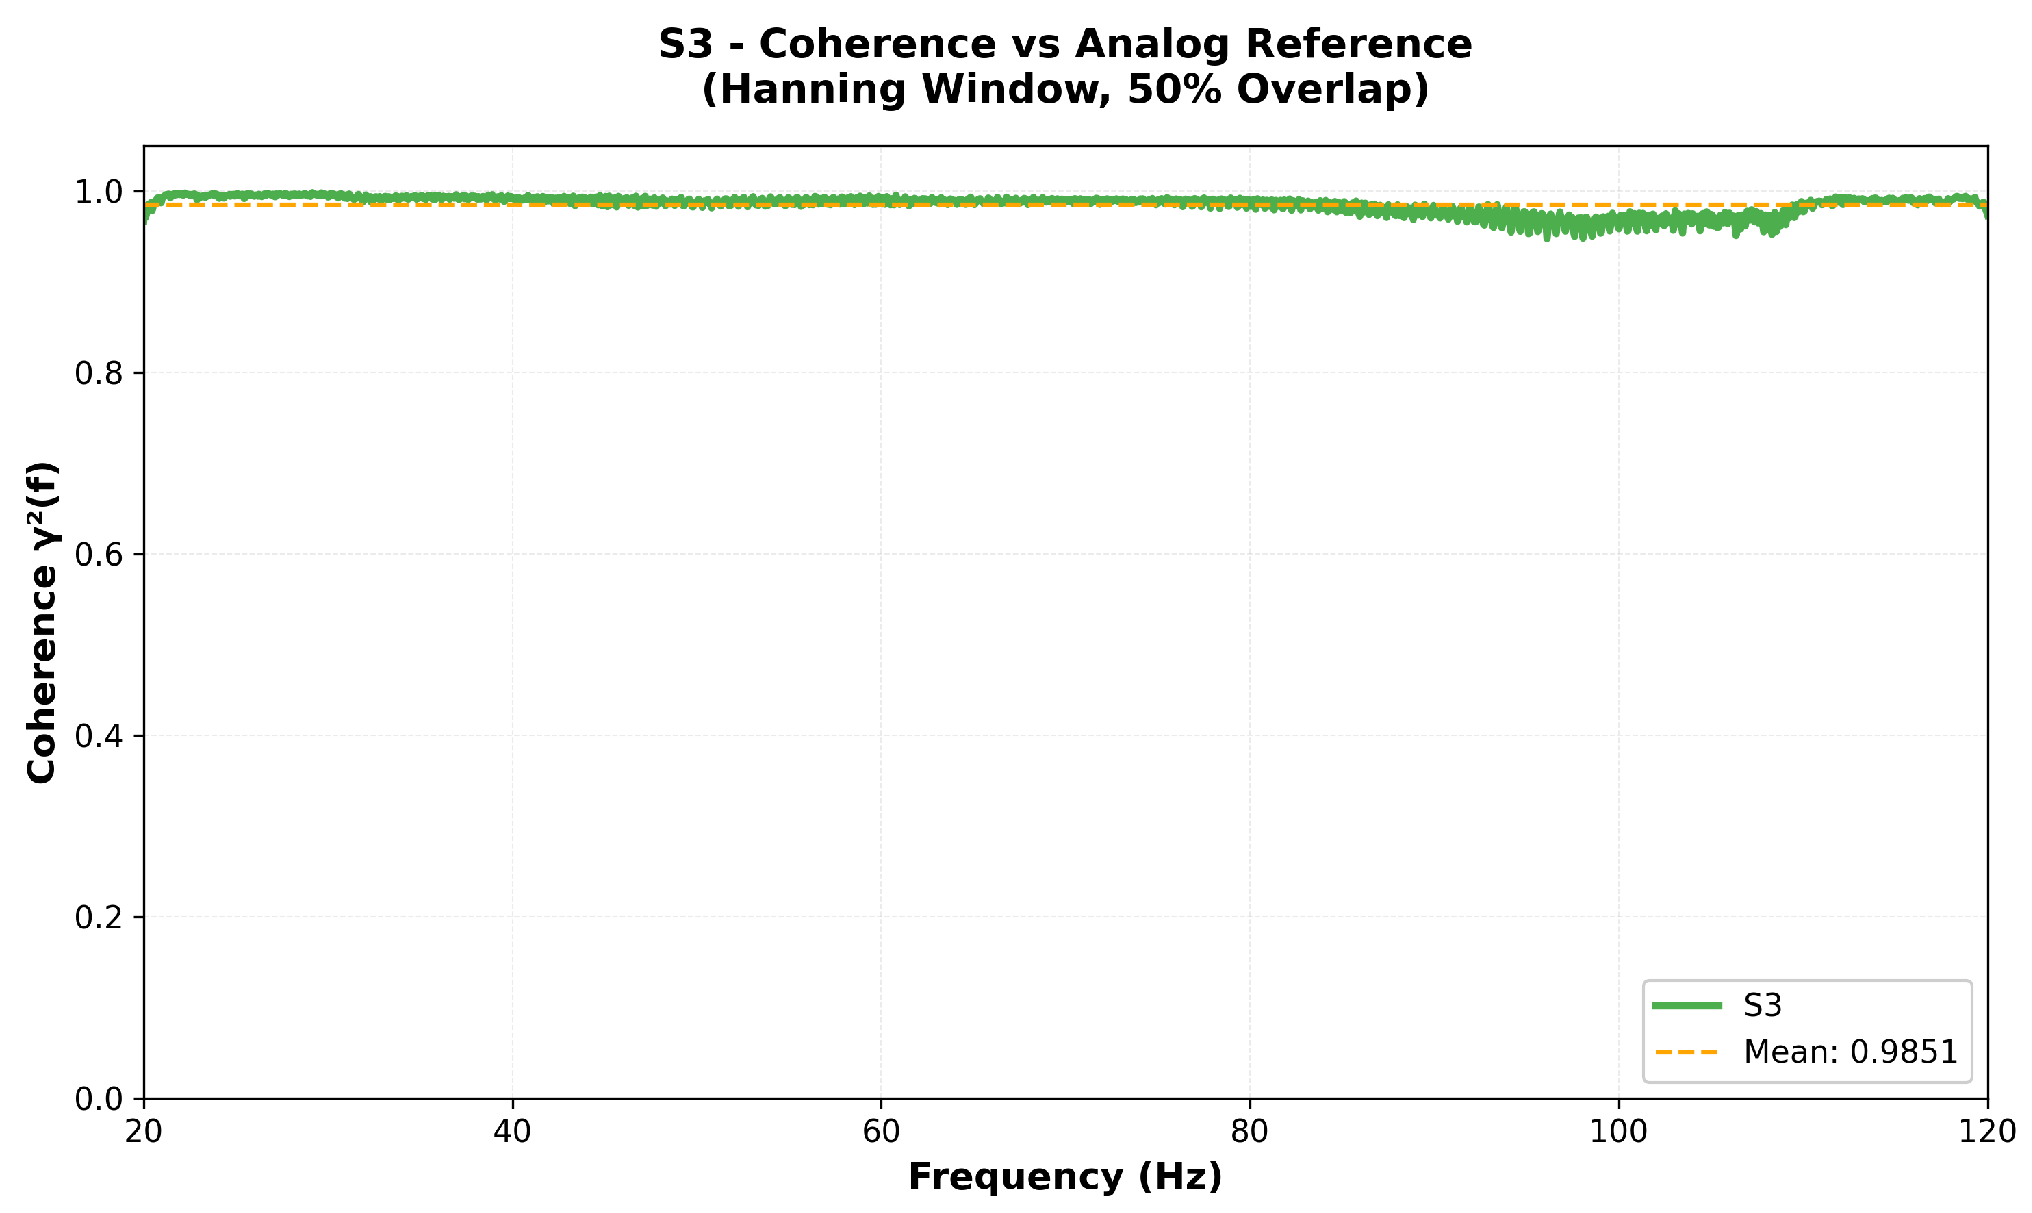
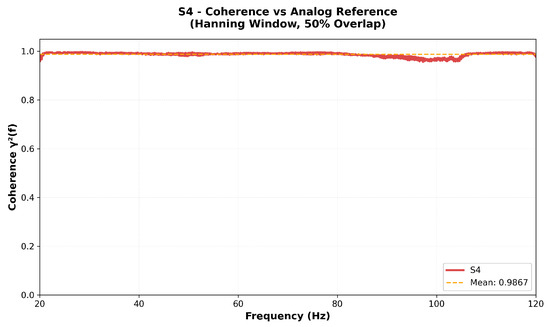
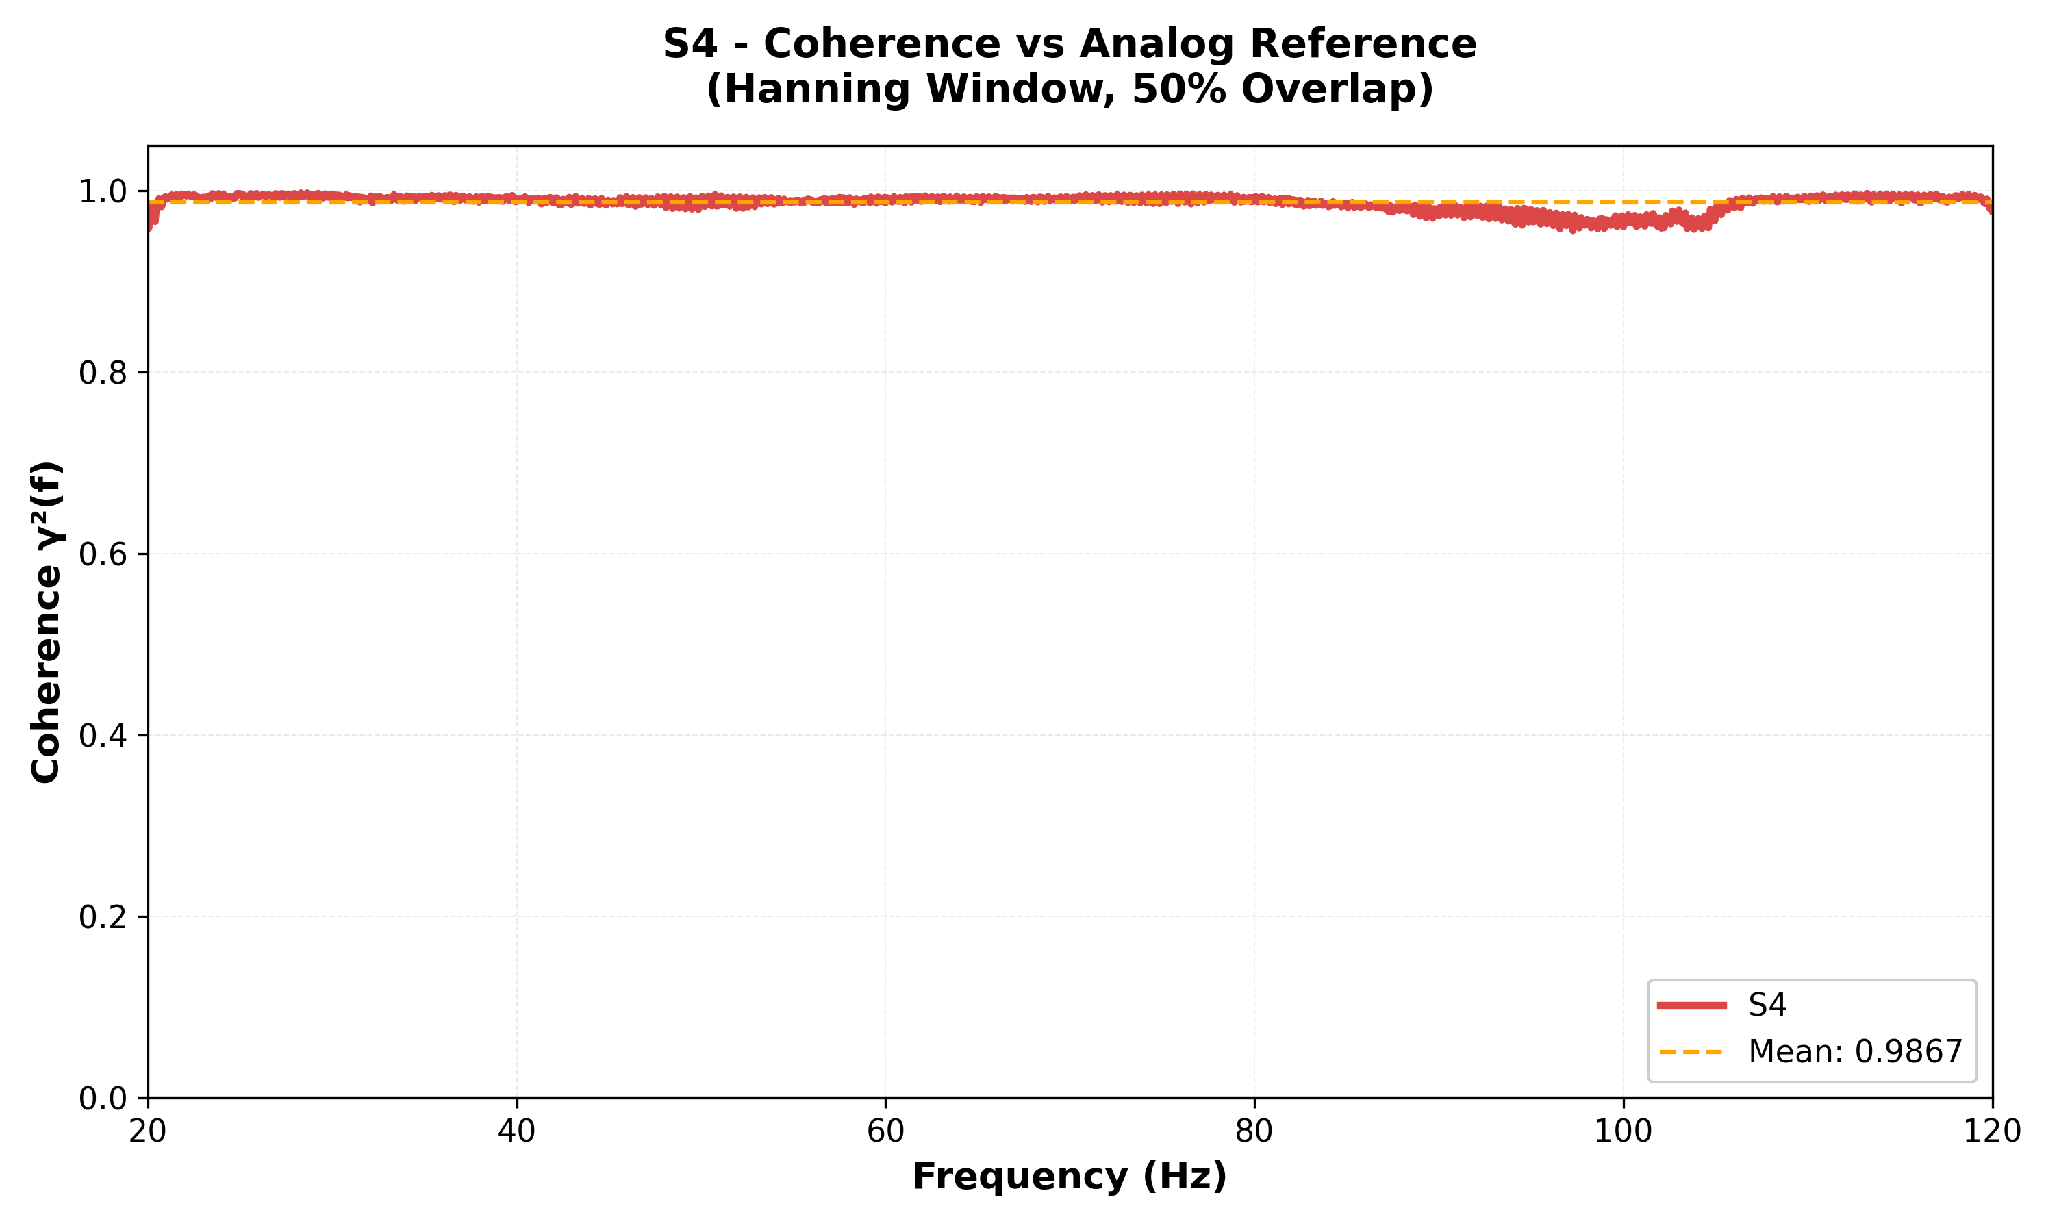
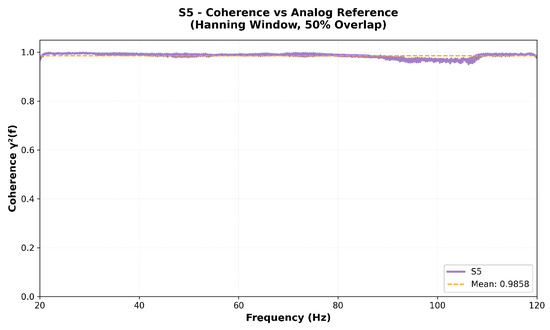
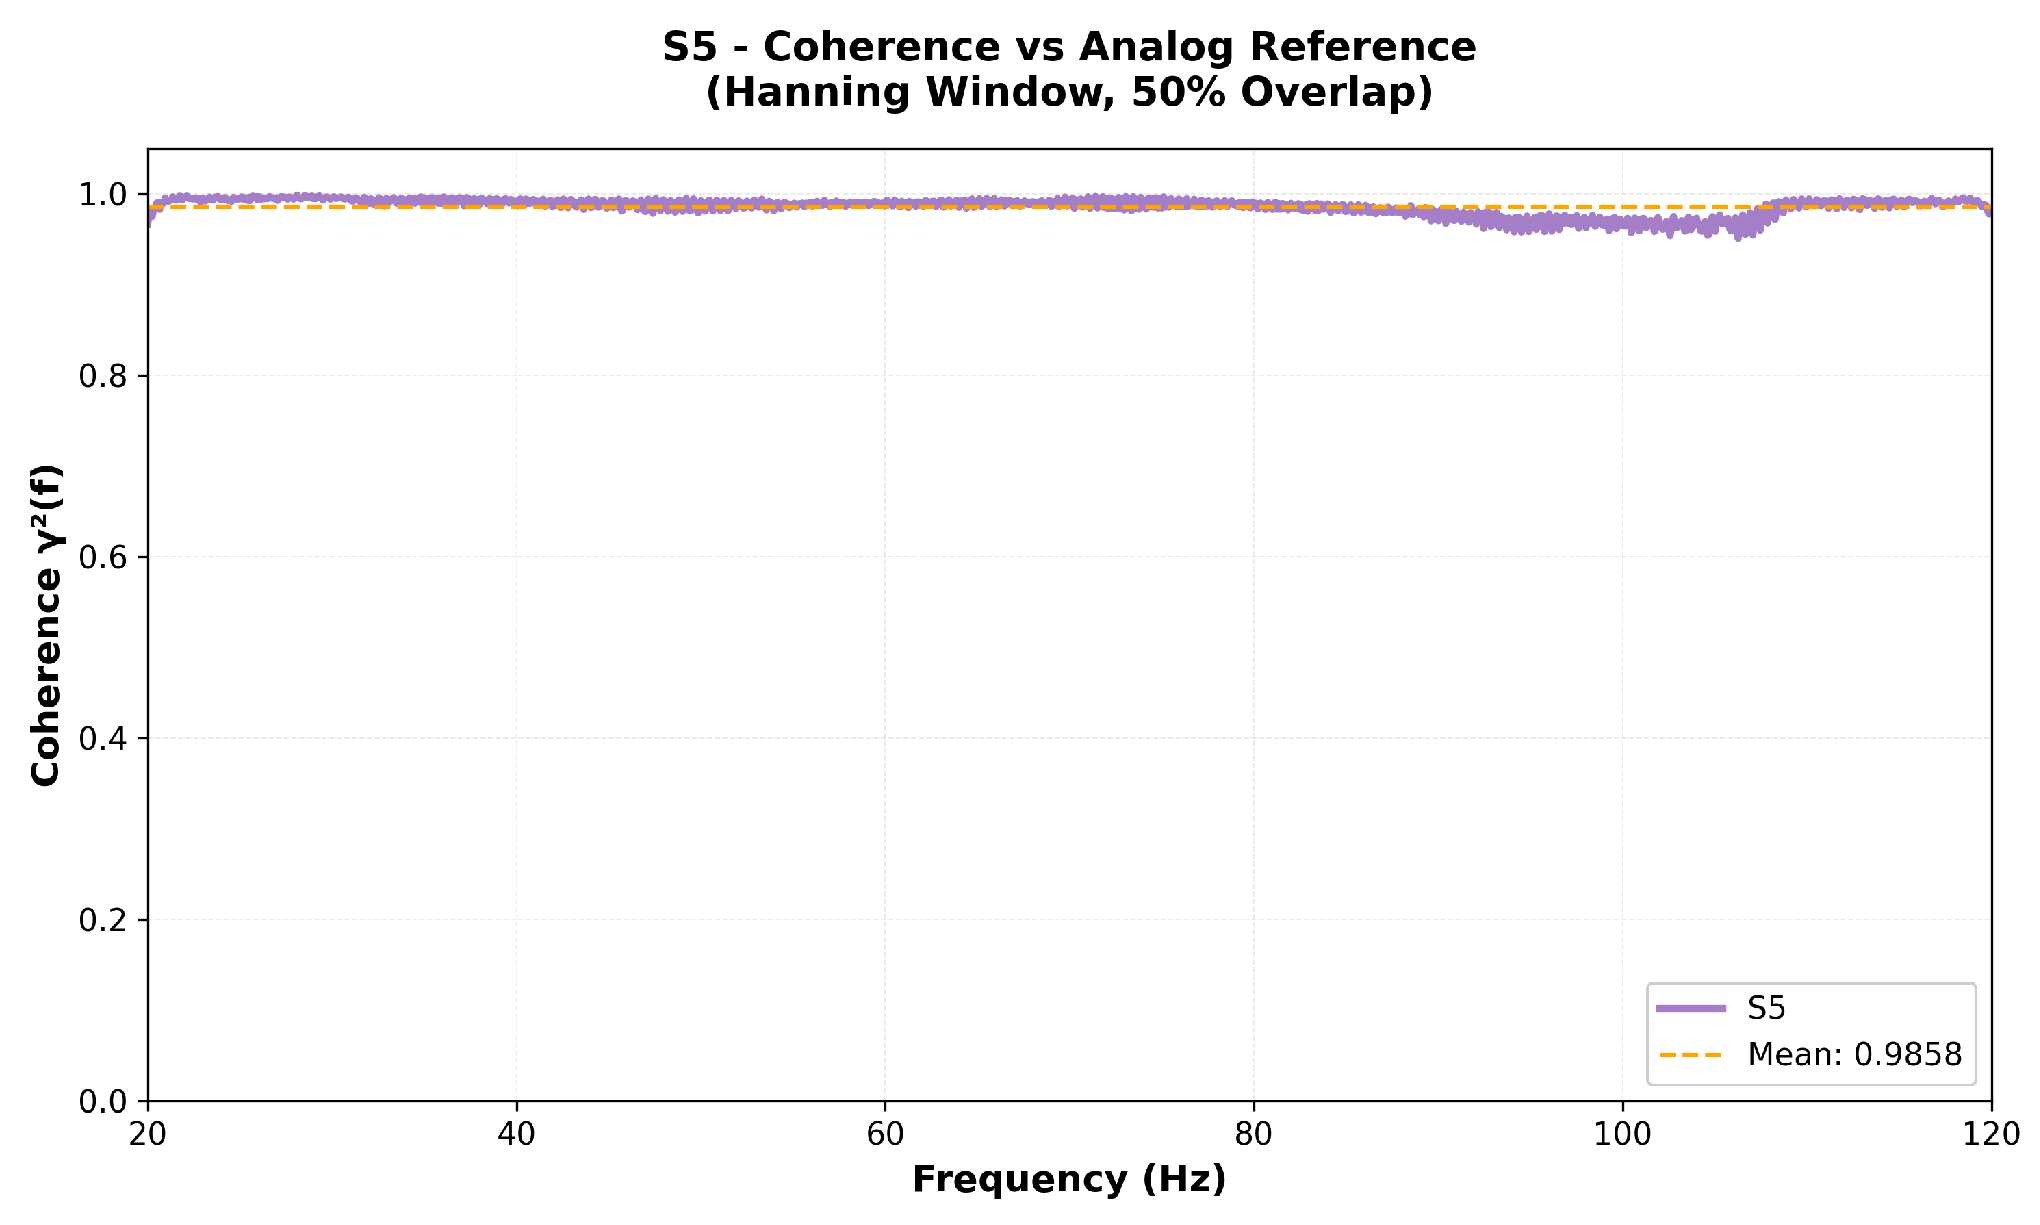
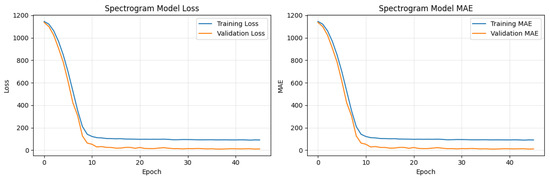
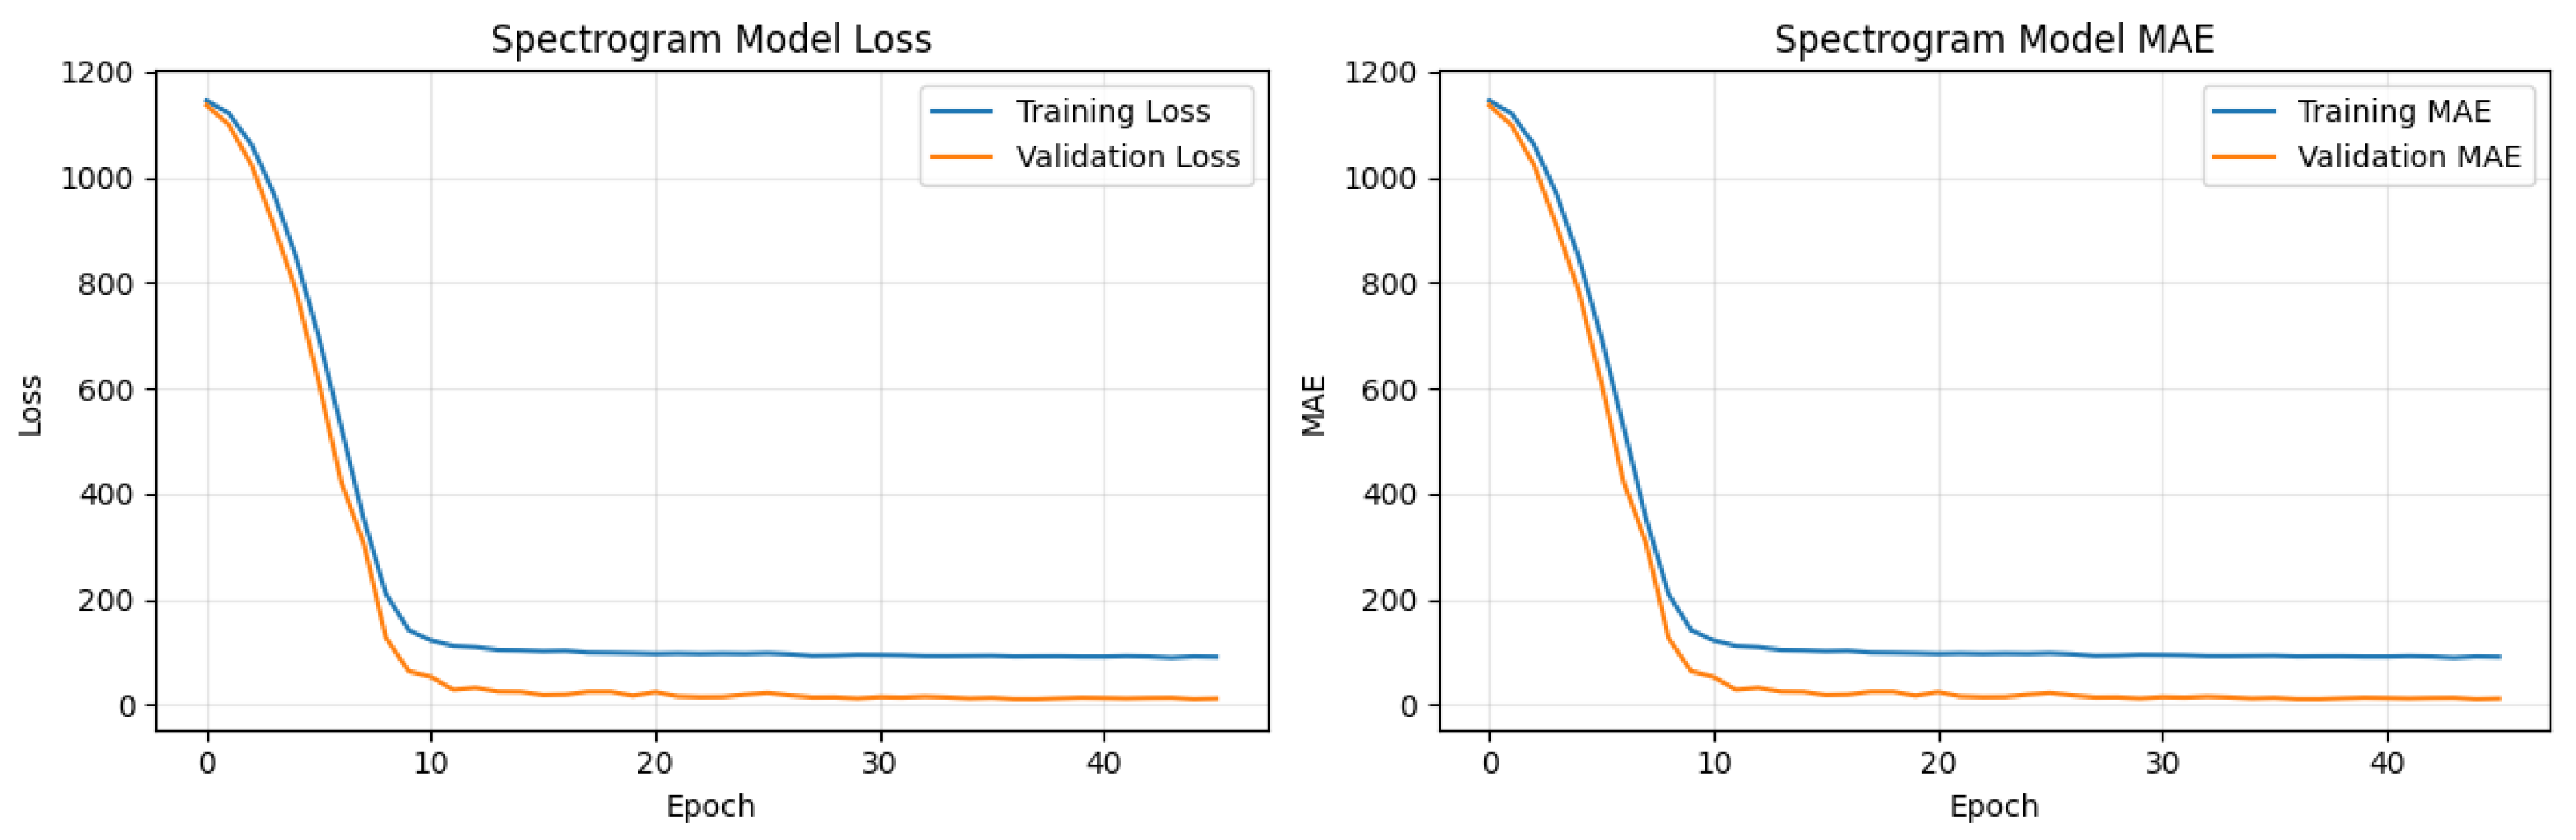
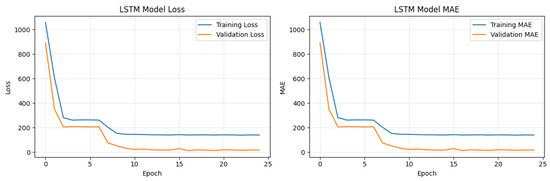
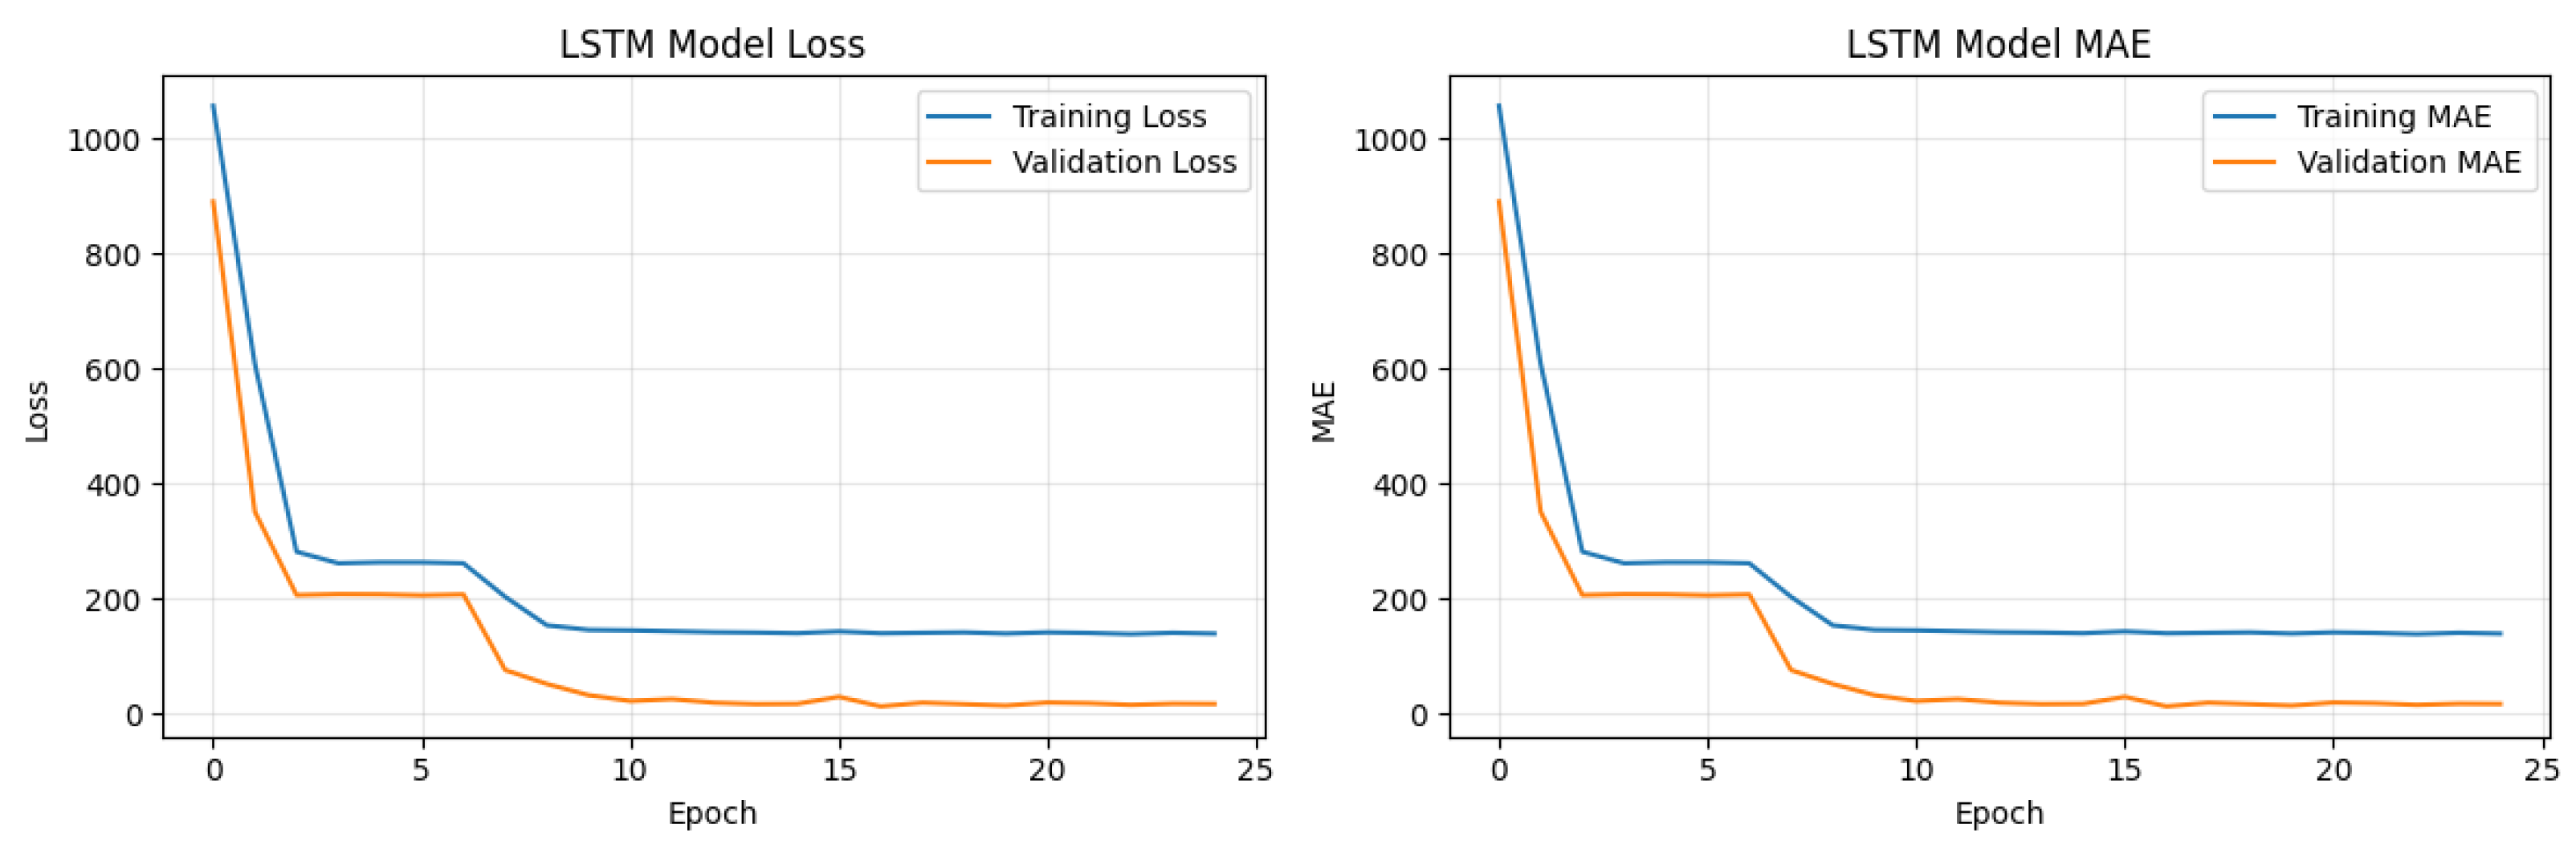
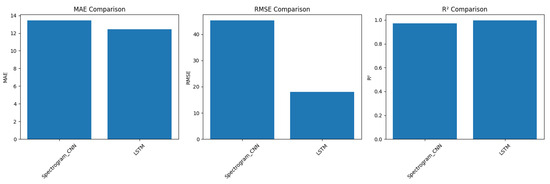
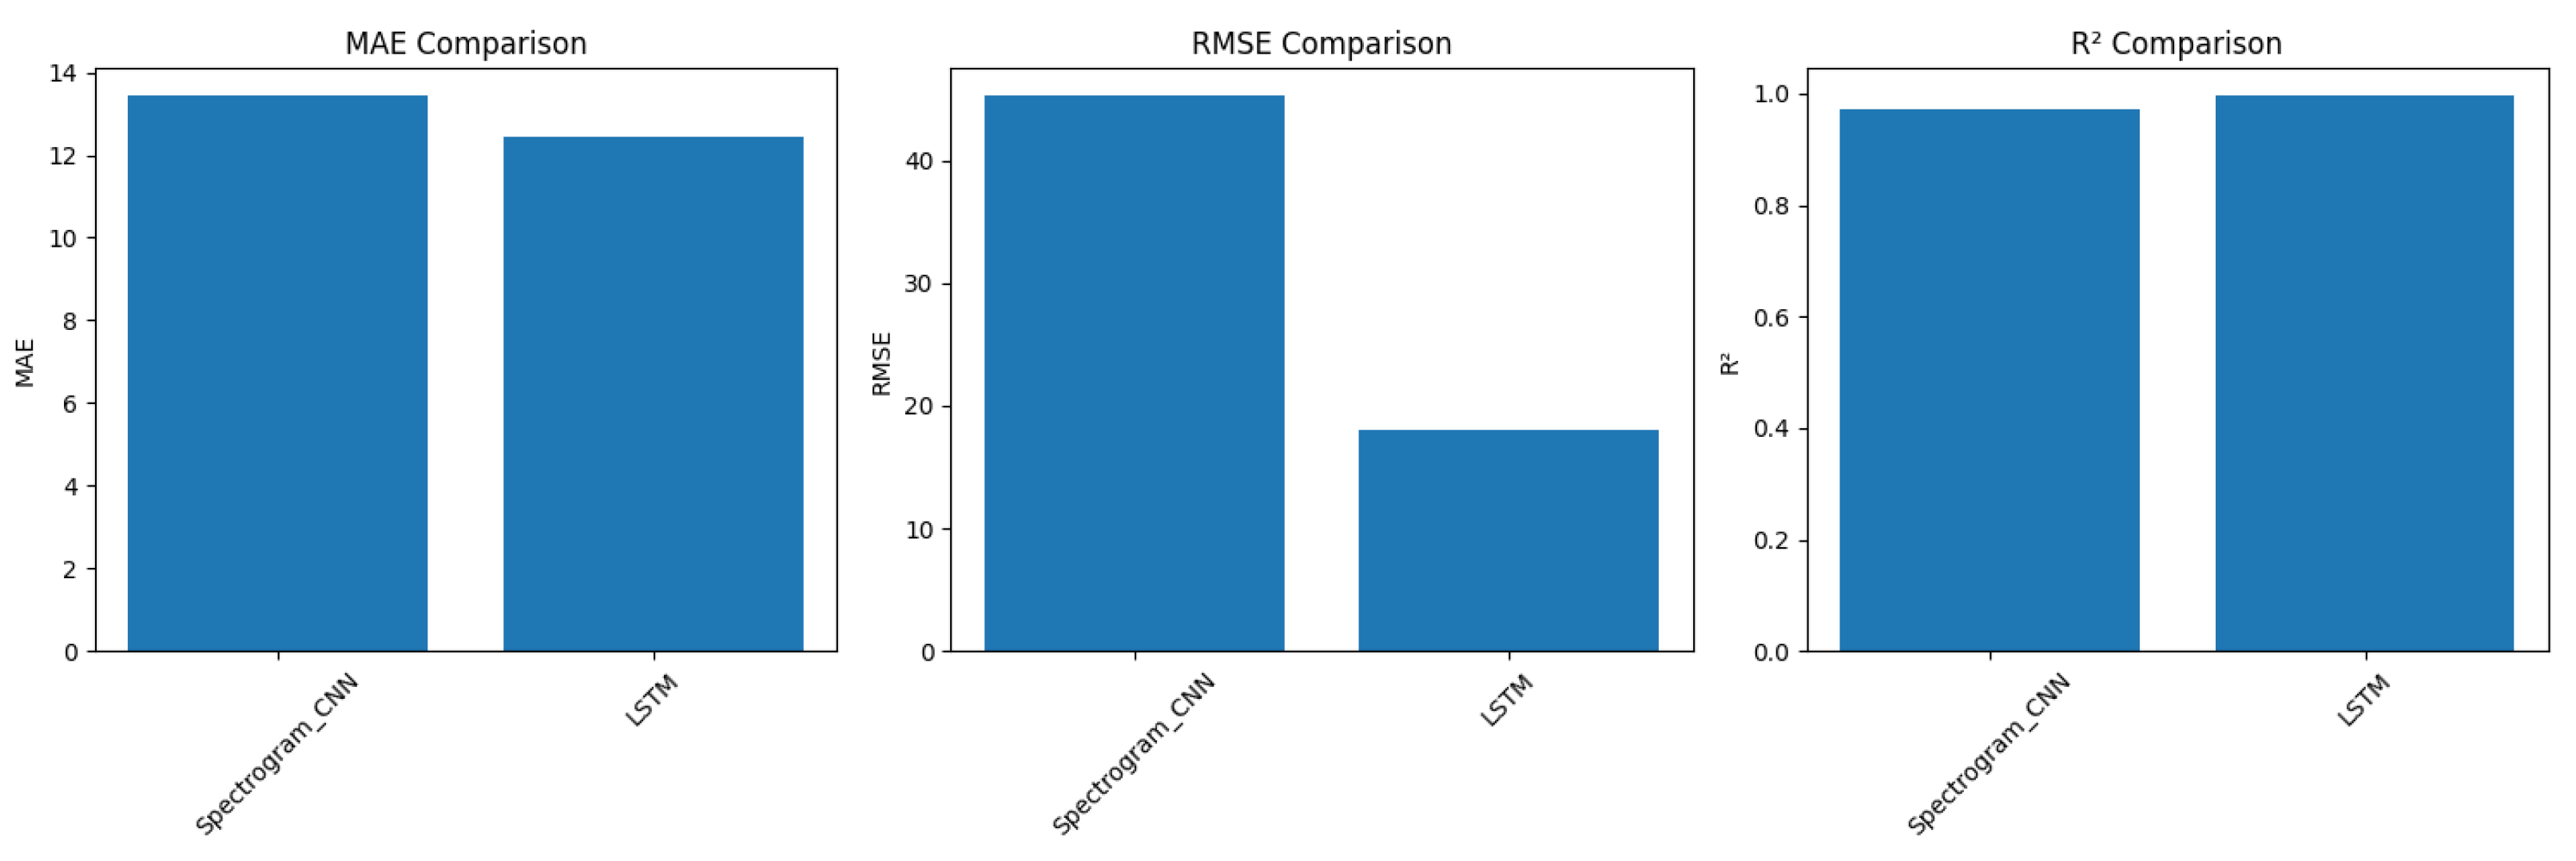

Disclaimer/Publisher’s Note: The statements, opinions and data contained in all publications are solely those of the individual author(s) and contributor(s) and not of MDPI and/or the editor(s). MDPI and/or the editor(s) disclaim responsibility for any injury to people or property resulting from any ideas, methods, instructions or products referred to in the content. |
© 2026 by the authors. Licensee MDPI, Basel, Switzerland. This article is an open access article distributed under the terms and conditions of the Creative Commons Attribution (CC BY) license.