


Abstract
This study investigates the long-run and short-run relationships between capital market development, foreign direct investment, trade openness, and real GDP per capita in Romania over 2003–2024, employing the Autoregressive Distributed Lag (ARDL) bound testing approach, complemented by lag-augmented VAR Granger-causality analysis and a comprehensive set of diagnostic and stability tests. The bounds tests strongly reject the null of no cointegration, confirming a long-run relationship that remains robust under finite-sample critical values. The causality analysis demonstrates a supply-leading mechanism from the equity market to real economic activity, while economic growth in turn Granger-causes both market liquidity and trade openness, pointing to demand-following dynamics for these channels. The analysis shows that foreign direct investment, market liquidity, and trade openness exert positive and significant short-run effects; yet their long-run coefficients are negative, significantly for FDI (foreign direct investments), capturing an asymmetry between immediate output gains and durable structural contribution that is characteristic of emerging European economies. The error-correction term is positive, demonstrating that real GDP (gross domestic product) per capita does not adjust back toward the long-run relationship in the conventional sense, but, instead, it behaves as a forcing variable that leads the financial and trade channels rather than being led by them. All in all, the findings describe an economy with functional short-run transmission channels, but limited long-run structural anchoring, with direct relevance for Sustainable Development Goals 8 and 17 and Romania’s ongoing OECD accession.
1. Introduction
1.1. Research Context and Motivation
Few questions in the economics literature have proven as enduring or as consequential as the relationship between financial market development and economic growth. Beginning with Schumpeter (1911/1934) and formalized by Goldsmith (1969), the foundational insight that financial intermediation shapes both the pace and quality of development has remained central to the field, even if the channels through which finance affects growth have become increasingly contested. Rather than treating finance as uniformly growth-enhancing, contemporaneous research demonstrates that its effects are conditional on institutional quality, financial structure, and macroeconomic context, and that the finance–growth relationship weakens or becomes insignificant during periods of economic stress (Asteriou et al., 2024). At the firm level, Didier et al. (2021) show that capital market financing supports faster expansion of assets, sales, and employment, particularly among smaller, younger, and more R&D-intensive firms that face structural barriers to bank credit. These findings suggest that capital markets matter not simply because they expand the volume of finance, but because they shape how risk is shared, how information is incorporated into prices, and how long-term investment is governed (Beck & Levine, 2004; Levine, 2005).
In this paper, macroeconomic outcomes are examined through the lens of capital market development and its capacity to support patient, well-governed financing. Rather than defining a separate construct of macroeconomic sustainability, we adopt the broader view that economic performance should be assessed beyond GDP growth alone (Stiglitz et al., 2009), and use the Sustainable Development Goals (SDGs) as an interpretive frame: the analysis connects to SDG 8, which targets sustained, inclusive, and sustainable economic growth, and to SDG 17, which calls for investment promotion regimes aligned with sustainable development priorities. The importance of domestic market depth has grown considerably since 2020, as the COVID-19 pandemic and Russia’s subsequent invasion of Ukraine demonstrated that external shocks propagate rapidly through increasingly integrated financial networks, and that domestic market depth matters substantially for how economies absorb and adjust to these disruptions (Ramelli & Wagner, 2020; Uddin et al., 2021). Countries with deeper, better-governed financial markets proved more capable of sustaining investment and recovering without lasting structural damage, a point that carries direct relevance for Romania, where capital market development remains partial and its contribution to macroeconomic sustainability remains an open empirical question.
Romania’s experience in this transition is particularly revealing. By the end of 2024, the Bucharest Stock Exchange (BSE) reported total market capitalization of RON 363.7 billion and more than 226,000 retail investors; however, the World Bank (2024) still recorded only 83 listed domestic companies, and market capitalization as a share of GDP stood at approximately 15%, well below Poland (25%), the Czech Republic (20%), and Hungary (18%), despite Romania’s larger population and comparable per capita income (Bucharest Stock Exchange, 2024).
Furthermore, while the Markets in Financial Instruments Directive (MiFID) improved price informativeness and liquidity across European markets more broadly (Aghanya et al., 2020), the evidence for Romania under MiFID II is more mixed, pointing to limited liquidity gains despite formal regulatory compliance (Miloș et al., 2021). Moreover, Boussetta et al. (2025) demonstrate that the Russian invasion of Ukraine produced heterogeneous effects across European capital markets, with emerging markets, including Romania, experiencing more pronounced and persistent negative effects on equity returns than developed markets. Against this background, the central research question is no longer whether capital markets matter, in principle, but whether Romania’s market has developed enough in terms of depth, liquidity, and institutional credibility to contribute meaningfully to macroeconomic sustainability in practice, and whether the post-2003 period provides sufficient evidence to characterize these structural relationships empirically.
1.2. Theoretical and Empirical Background
1.2.1. Finance, Innovation, and Capital Allocation
The intellectual case for finance as a driver of growth rather than a result of it originates from Schumpeter (1911/1934), who argued that financial intermediaries actively identify and fund productive investments, thereby making technological innovation possible. Modern endogenous growth theory formalized this intuition by emphasizing the role of finance in reducing information asymmetries, screening projects, and allocating capital toward innovative activities (Aghion et al., 2005). Capital markets extend this logic beyond what banking institutions can easily provide: equity financing imposes no fixed repayment schedule, aligns investor and entrepreneur incentives through shared ownership, and is particularly well-suited to sectors characterized by high uncertainty, long incubation periods, and intangible investment, conditions under which bank debt is structurally not well adapted (J. R. Brown et al., 2009; Kortum & Lerner, 2000). King and Levine (1993) confirmed the growth-enhancing effect of financial development empirically across a large cross-country sample, and more recent firm-level evidence reinforces this mechanism: Didier et al. (2021) demonstrate that firms accessing capital markets subsequently expand faster than comparable non-issuers, with especially pronounced effects among smaller, younger, and R&D-intensive firms. For Romania, this evidence matters because the development challenge is not only to increase the quantity of finance intermediated through domestic markets, but to improve its capacity to support innovation-oriented structural change in an economy still heavily reliant on low-complexity manufacturing and commodity exports.
A second channel operates through capital allocation and corporate discipline. Stock prices aggregate dispersed information and guide resources toward firms with stronger growth opportunities, while public listing strengthens disclosure and accountability (Holmström & Tirole, 1993; Tobin, 1969; Wurgler, 2000; Shleifer & Vishny, 1997). However, Aghanya et al. (2020) show that MiFID improved stock price information, particularly where pre-existing regulation was weaker, implying that regulatory quality moderates allocative gains. The balance of liquidity, disclosure, and investor protection is one that Romania has not yet fully achieved (La Porta et al., 2000).
1.2.2. Financial Openness, FDI, and Trade Integration
The growth effects of financial openness have proven more conditional than the early liberalization models anticipated. Neoclassical frameworks predicted that foreign capital should flow toward capital-scarce developing economies and accelerate income convergence (Fischer, 1998), but subsequent research showed that these gains depend heavily on domestic financial depth, regulatory quality, and macroeconomic stability (Kose et al., 2010; Rodrik, 1998; Stiglitz, 2000). These findings are directly relevant for Romania, where the developmental role of openness depends less on the degree of capital account liberalization and more on the domestic capacity to absorb external capital.
FDI has generally received a more favorable assessment than portfolio investment flows, since it carries longer-term commitments, organizational capabilities, and the potential for technology transfer (Alfaro et al., 2004; Borensztein et al., 1998). Even here, however, the ability of FDI to contribute to growth depends on institutional quality, financial development, and the host economy’s absorptive capacity. Trade openness itself matters through learning-by-exporting effects that accelerate productivity growth and technological upgrading (Edwards, 1998; Grossman & Helpman, 1991), and Rajan and Zingales (2003) argue that trade and financial openness are complementary, since liberalization creates demand for financial services that pulls market development forward, a mechanism with direct relevance for Romania’s deepening integration into European value chains.
1.2.3. Supply-Leading vs. Demand-Following Hypotheses
Whether financial development drives growth or responds to it, remains contested in the empirical finance–growth literature. Patrick (1966) framed the debate through two competing hypotheses: the supply-leading view, according to which financial markets mobilize savings, reduce information asymmetries, and enable innovative investment before the real economy demands it (King & Levine, 1993), and the demand-following view, according to which financial deepening responds to rising incomes and expanding corporate financing needs rather than preceding them (Robinson, 1952). A third possibility, the feedback hypothesis, acknowledges bidirectional causality, with finance and growth reinforcing each other dynamically (Demetriades & Hussein, 1996). Sethi et al. (2021) demonstrate that the direction of causality depends partly on the financial indicator used, since stock-market-based indicators support more supply-leading effects, while bank-based indicators more frequently support demand-following dynamics. This finding is directly relevant to our equity markets focus. Furthermore, Asteriou et al. (2024) show that, for a sample of 26 EU countries, financial development is more clearly associated with growth in normal times than in stress periods, when the relationship weakens substantially, while Tang (2024) finds for Central and Eastern European (CEE) economies that banking development played a stronger role than stock-market development over 2001–2020.
1.2.4. Institutional Quality and Financial Development
Institutions are not merely a background condition for financial market development; rather, they are among its primary determinants. La Porta et al. (1998) and Acemoglu et al. (2005) establish that legal origin, investor protection, and contract enforcement significantly shape financial market depth and liquidity across countries. Khan et al. (2022) further demonstrate that stronger institutions support financial development directly, while the positive effect of finance on growth becomes much weaker, or even insignificant, in settings where institutional quality is poor. Furthermore, Uzar et al. (2023) provide causality evidence suggesting a reciprocal relationship between institutional quality and financial development, implying that the two dimensions must be strengthened together rather than sequentially.
This distinction is especially important in post-transition contexts. As Pistor et al. (2000) argue, formal adoption of advanced legal frameworks does not automatically generate the liquidity, depth, or investor confidence that such frameworks are designed to support, in the absence of the complementary enforcement institutions and culture that give these rules their market impact. Aghanya et al. (2020) and Miloș et al. (2021) demonstrate that MiFID compliance improved formal regulatory standards in Romania, while the liquidity and information gains observed elsewhere in Europe remained more limited in the Romanian market, underscoring that rules without enforcement culture produce only partial regulatory convergence.
1.2.5. Capital Markets, Sustainability, and Macroeconomic Adjustment
Capital markets can contribute to macroeconomic outcomes through channels that banking intermediation alone cannot fully replicate. Levine (1997) argues that broader range of financing instruments allow firms and governments to absorb losses more diversely and reduce the excessive bank-dependence that amplifies financial sector stress, while Adrian et al. (2012) show that, during periods of credit contraction, firms with access to equity markets can substitute capital market financing for bank loans, mitigating the real economic effects of credit crunches. Developed capital markets also reduce vulnerability to sudden stops by providing governments access to domestic bond markets (Caballero & Krishnamurthy, 2004), a mechanism that proved directly relevant during the COVID-19 pandemic, when Romania financed pandemic-related expenditure through domestic issuance. Within the SDG framework, these contributions are most directly related to SDG 8.10 and SDG 17.5.
However, these contributions are conditional rather than automatic. Asteriou et al. (2024) show that financial development supports growth more strongly in normal times than in stress periods. The present study does not measure resilience directly: with real GDP per capita as the single dependent variable, the SDG framing functions as a qualitative interpretive lens. Boussetta et al. (2025) show the Russian invasion of Ukraine produced differential effects across European markets, with emerging markets experiencing more severe disruptions.
1.2.6. Cross-Country and Time-Series Evidence
Classic cross-country studies established that financial depth and stock-market liquidity are positively associated with subsequent economic growth, capital accumulation, and productivity gains (Beck & Levine, 2004; King & Levine, 1993; Levine & Zervos, 1998). More recent evidence has substantially shifted the emphasis from average effects toward heterogeneity and regime dependence. Asteriou et al. (2024) show that the finance–growth relationship differs systematically by development level and macroeconomic regime across 26 EU member states. In the CEE context specifically, Tang (2024) finds that stock-market development did not consistently stimulate growth over 2001–2020, whereas banking development proved to be more robust across the region, though with important cross-country variation. Moreover, Égert et al. (2016) documents that financial deepening dynamics in post-transition economies are sufficiently heterogeneous to caution against strong generalization from regional panel averages, even for geographically proximate economies. This finding directly motivates the country-specific time-series approach taken in this paper.
Country-level time-series analysis highlights dynamics that panels suppress. Demetriades and Hussein (1996) found substantial heterogeneity in causality patterns across 16 developing countries, with no universal direction of causality emerging from their analysis, reinforcing the case for country-specific empirical investigation. The ARDL bounds testing framework of Pesaran et al. (2001) accommodates small samples and mixed integration orders. Furthermore, Demetriades and Hussein (1996) demonstrate that finite-sample critical values improve inference in exactly this small-sample context. For Romania specifically, Obreja Brașoveanu et al. (2008) provide the foundational country-specific evidence, documenting positive correlations between stock-market capitalization and GDP growth over 1995–2005 through correlation analysis, while Dragotă and Mitrică (2004) analyze the efficiency of the Romanian capital market in the context of EU accession. Both studies establish a baseline against which the more rigorous causal analysis of the present paper can be compared.
1.3. Research Gaps and Contributions
The literature reviewed above, while extensive, leaves important questions open, particularly in the Romanian context. Most CEE finance–growth studies prioritized banking or aggregate depth over equity-market performance, liquidity, and openness (Égert et al., 2016). Methodologically, the dominance of cross-country panel approaches (Levine, 2005), which impose parameter homogeneity across institutionally diverse economies, can mask the country-specific dynamics that matter most for policy design. Single-country time-series studies have accordingly been used to recover such dynamics where panel averages cannot (Ang & McKibbin, 2007). The potential interactions between capital market development, FDI inflows, and trade openness remain empirically underexplored in the CEE context, despite theoretical arguments in favor of their complementarity (Alfaro et al., 2004, Rajan & Zingales, 2003, Soumaré & Tchana Tchana, 2015). In addition, existing empirical studies for Romania have not explicitly framed capital market development in terms of the Sustainable Development Goals (Uddin et al., 2021).
In this paper, we address these gaps through a comprehensive time-series analysis of Romania’s capital market over 2003–2024, employing the ARDL bounds testing framework of Pesaran et al. (2001) and a lag-augmented VAR Granger-causality analysis. We make four contributions. First, we provide a rigorous analysis of Romania’s equity-market–growth nexus, disaggregating financial development into performance, liquidity, and openness rather than relying on composite indices. Second, we integrate these dimensions together with FDI and trade openness in a unified dynamic framework, which captures complementarities that single-indicator approaches cannot detect. Third, we document a horizon asymmetry: positive short-run effects coexisting with negative or insignificant long-run coefficients, and show, through the causal architecture, that real GDP per capita occupies a forcing position in the system rather than an equilibrium-adjusting one. Fourth, by establishing causality direction and estimating long-run coefficients across distinct channels, we generate actionable insight for capital-market development strategy in post-transition economies, framed by reference to SDG 8 and SDG 17 as a qualitative lens.
1.4. Research Hypotheses
Drawing on the theoretical frameworks and empirical evidence reviewed in the preceding sections, we formulate four research hypotheses.
Hypothesis 1 (long-run relationship).
A stable long-run relationship links capital market performance, market liquidity, FDI inflows, and trade openness to real GDP per capita in Romania. Endogenous growth theory and cross-country evidence support the view that financial development and growth move together over the long-run despite short-run fluctuations (Levine & Zervos, 1998).
Hypothesis 2 (supply-leading causality).
Capital Market development Granger-causes economic growth, in line with the supply-leading hypothesis. The institutional reforms implemented through EU accession support supply-leading dynamics (King & Levine, 1993; Patrick, 1966), and Sethi et al. (2021) shows that stock-market-based indicators support supply-leading causality more consistently than bank-based indicators, which strengthens this expectation for an equity-market-focused analysis.
Hypothesis 3 (horizon asymmetry).
The financial and trade channels exert asymmetric effects across time horizons: positive in the short run, but not necessarily positive in the long run. In emerging European economies, profit repatriation, limited domestic backward linkages, and exposure to external demand can dampen or reverse the long-run contribution of FDI and trade openness even where their short-run effects are expansionary (Alfaro et al., 2004; Borensztein et al., 1998; Pavlínek & Ženka, 2011; Rajan & Zingales, 2003). We therefore expect positive short-run effects alongside long-run coefficients that may be negative or insignificant, particularly for FDI and openness.
Hypothesis 4 (adjustment and the position of growth in the system).
The manner in which real GDP per capita relates to the long-run relationship is shaped by its position within the causal structure. Where growth leads, rather than follows, the financial and trade channels, real output behaves as a forcing variable and does not error-correct toward a financial equilibrium in the conventional sense (Patrick, 1966). This hypothesis reframes the adjustment question as an empirical matter to be resolved by the error-correction term and the causality structure jointly, rather than presupposing rapid convergence.
2. Materials and Methods
2.1. Data and Variables
The empirical analysis draws on annual data for Romania covering 2003–2024, yielding 22 observations. The starting point reflects the practical boundary of data availability for the BET-EURO index in a consistent series, and it encompasses several major structural episodes within a single continuous sample: EU accession in 2007, the global financial crisis of 2008–2009, the COVID-19 shock of 2020–2021, and the geopolitical disruption following Russia’s invasion of Ukraine in 2022. The short sample represents an acknowledged constraint on degrees of freedom, and it is the principal methodological reason for employing the ARDL bounds testing framework rather than multivariate cointegration procedures, which require larger samples for reliable asymptotic inference. We treat the results as indicative rather than definitive and report finite-sample robustness evidence throughout.
All data are drawn from primary official sources: Eurostat provides real GDP per capita; the Bucharest Stock Exchange provides the BET-EURO index and stock-market turnover, the National Bank of Romania provides FDI inflows, the National Institute of Statistics of Romania provides trade openness, and the World Bank Global Financial Development Database provides broad money. We deliberately use national primary sources rather than aggregate international databases, since the BSE and NBR provide more granular and timely series for equity market and capital flow data than the World Bank’s World Development Indicators.
Table 1 summarizes the variables, notation, measurement, and data sources.
Table 1.
Description of the variables.
Real GDP per capita (lnRGDPC), the dependent variable, is real GDP divided by mid-year population, expressed in constant euros per capita and log-transformed; the logged values in Table 2 correspond to this constant-euro per-capita measure. Log-transformation allows the coefficient on any log-transformed regressor to be read as a pure elasticity, while the coefficient on any percentage-ratio regressor is interpreted as a semi-elasticity (Wooldridge, 2020).
Table 2.
Descriptive statistics of the analyzed economic variables for the period 2003–2024, in Romania.
The BET-EURO index (lnBETEURO) is the BSE’s main reference index, a price index expressed in euros rather than Romanian leu. This denomination choice is methodologically important: over 2003–2024, the Romanian leu experienced significant nominal depreciation during the 2008–2009 crisis and recurring volatility tied to fiscal imbalances and political uncertainty. A leu-denominated index would embed these movements into a measure intended to capture equity-market performance and investor expectations, conflating two distinct phenomena; euro denomination isolates genuine changes in market valuation from currency noise, providing a cleaner proxy for the capital market channel. Table 2 illustrates the index’s major cycles over the sample period.
Stock-market turnover (STOCKTURN) is the ratio of total value of shares traded to average market capitalization, capturing the liquidity and efficiency dimension of capital market development; the cross-country literature has consistently found this variable more robustly associated with growth than market size alone (Levine & Zervos, 1998; Yartey, 2010). FDI/GDP is net FDI inflows from the NBR balance-of-payments statistics (National Bank of Romania, 2024), expressed as a percentage of GDP and following the NBR’s standard presentation; it follows a boom–bust pattern, peaking before the financial crisis and recovering moderately thereafter, and in Romania remains an important engine of short-run growth whose long-run impact depends on integration into the domestic economy. Trade openness (OPENNESS) is the sum of exports and imports as a percentage of GDP, drawn from the National Institute of Statistics; it controls for the independent growth effects of trade integration (Edwards, 1998; Grossman & Helpman, 1991) while allowing assessment of complementarity with capital market development (Rajan & Zingales, 2003). Broad money (BROADM) is broad money as a percentage of GDP, capturing banking-sector intermediation depth; although included among the candidate regressors, it is excluded from the final specification on grounds of parsimony, a decision supported by formal diagnostics and verified by robustness checks. Index and monetary variables are log-transformed; percentage-ratio variables remain in levels and are interpreted as semi-elasticities.
A more detailed description of the data used in the analysis is shown in Table 2. This table reports descriptive statistics; the full annual series is provided in the Supplementary Materials.
2.2. Conceptual Framework
The empirical model organizes the finance–growth relationship around three transmission channels. The capital market channel captures the valuation and liquidity dimensions of equity-market activity (lnBETEURO and STOCKTURN). As Levine (1997) and Wurgler (2000) argue, stock markets function as forward-looking aggregators of dispersed information about corporate earnings, macroeconomic risks, and institutional conditions; market liquidity determines whether this informational role translates into efficient capital allocation. The FDI channel operates through domestic capital-stock augmentation and, conditionally, through technology transfer and productivity spillovers (Borensztein et al., 1998). The trade-openness channel exposes domestic firms to international competition and to knowledge embedded in imported intermediates (Edwards, 1998; Rajan & Zingales, 2003).
Consistent with the scope of the model, whose single dependent variable is real GDP per capita, we treat sustainability as a qualitative interpretive lens rather than a directly measured quantity. The analysis identifies structural finance–growth patterns and interpret their relevance through SDG 8 (sustained and inclusive growth) and SDG 17 (investment promotion and partnerships), without claiming to estimate environmental, social, or governance outcomes. This framing is stated explicitly to keep the econometric findings distinct from their interpretation.
2.3. Econometric Methodology
We employ the Autoregressive Distributed Lag (ARDL) model, well suited to small-sample time-series analysis in systems with mixed orders of integration (Kripfganz & Schneider, 2023, Shrestha & Bhatta, 2018). Three features of the Romanian data make this appropriate. First, with 22 annual observations, multivariate cointegration procedures lack sufficient degrees of freedom. Second, the variable mix I(0) and I(1) series (Section 3.1), which the ARDL framework accommodates without pre-classification. Third, the ARDL error-correction representation recovers long-run and short-run dynamics within a single model. The analysis proceeds through four stages.
2.3.1. Unit-Root Testing
We apply three complementary tests to each variable in levels and first differences: the ADF test (Dickey & Fuller, 1979), with lag length selected by the Schwarz Information Criterion (Schwarz, 1978); the PP test, robust to serial correlation; and the KPSS test (Kwiatkowski et al., 1992), which treats stationarity as the null. Integration orders are assigned by the preponderance of evidence across the three tests (Shrestha & Bhatta, 2018). The deterministic specification is determined empirically rather than imposed uniformly: for each variable, we first assess the significance of a linear trend term in the level equations, applying the trend-and-intercept specification only to variables for which the trend is significant and the intercept-only specification otherwise. We additionally apply breakpoint unit-root tests with an endogenously determined break date to lnRGDPC and lnBETEURO.
2.3.2. Model Selection and the Treatment of Broad Money
We build the model using a general-to-specific strategy, guided by the Schwarz Information Criterion, preferred in small samples because it favors more parsimonious specifications (Schwarz, 1978). The maximum lag considered is two, and the effective number of observations is reported for each specification. The treatment of broad money warrants explicit justification. Rather than relying on pairwise correlations alone, we compute formal Variance Inflation Factors for the general specification. The centered VIF for BROADM is 4.10, below the conventional threshold, so multicollinearity in the strict sense is not severe. BROADM is nonetheless excluded on grounds of parsimony: in a 22-observation sample, the SIC-preferred model retaining BROADM is heavily over-parameterized, with coefficient sign instability and inflated standard errors. We verify that the exclusion does not bias the remaining estimates by re-estimating with BROADM retained; the sign and significance of the core variables are unchanged. The exclusion is therefore robustness-checked rather than asserted.
2.3.3. ARDL Bounds Testing for Cointegration
The presence of a long-run relationship is evaluated using the ARDL bounds test (Pesaran et al., 2001), comparing the F-statistic against critical values for the I(0) and I(1) bounds. Because the asymptotic critical values are derived for large samples, we additionally evaluate the F-statistic against the finite-sample critical values of Narayan (2005), tabulated for small samples. When a long-run relationship is established, the ARDL model is re-expressed in its error-correction form.
We note the EViews parameterization explicitly to avoid misinterpretation: in the conditional error-correction regression, the reported coefficient on the lagged level of the dependent variable equals the deviation of the autoregressive parameter from unity, so that a negative value indicates conventional error correction and a positive value indicates its absence. The sign and significance of this coefficient, together with the t-Bounds statistic, are interpreted accordingly in Section 3.4.
2.3.4. Diagnostic Testing, Stability and Causality
Residual diagnostics include the Breusch–Godfrey LM test for serial correlation, the Breusch–Pagan–Godfrey test for heteroscedasticity, the Jarque–Bera test for normality, the Ramsey RESET test for functional form, and Variance Inflation Factors for multicollinearity. Parameter stability is evaluated using the CUSUM and CUSUM-of-squares tests (R. L. Brown et al., 1975). Robustness to the major shocks is assessed through shock dummies and a leave-one-out analysis (Section 3.6).
Causality is assessed using Granger-causality tests within a lag-augmented vector autoregression. Estimating the VAR with an additional lag beyond the optimal order, following the logic of Toda and Yamamoto (1995), mitigates the dependence of standard Granger tests on the integration and cointegration status of the variables, which is advantageous for the mixed I(0)/I(1) system documented in Section 3.1. Given the sample size, the tests are implemented in bivariate form to keep degrees of freedom, and the lag length, augmentation, and effective sample are reported with the results.
As in Drob et al. (2026), the ARDL model takes the form below, where lnRGDPC is the dependent variable and the x-regressors are lnBETEURO, STOCKTURN, FDI/GDP, and OPENNESS:
where ΔlnRGDPCt is the first difference of the dependent variable; c is the constant; αi and βij are the short-run coefficients on the lagged differences of the dependent variable and of the regressors xj (lnBETEURO, STOCKTURN, FDI/GDP, and OPENNESS), respectively; θ0 and θj are the long-run coefficients on the lagged levels; p and qj are the lag orders selected by the Schwarz Information Criterion; k is the number of regressors; and εt is a white-noise error term.
3. Results
3.1. Stationarity Test Results
The first stage of the empirical analysis evaluated the integration properties of the variables using the ADF (Dickey & Fuller, 1979), PP, and KPSS unit-root tests. All tests were performed in EViews 12. The deterministic specification was determined empirically: for each variable, the significance of a linear trend term was first assessed in the level equations, with lag length selected by the Schwarz Information Criterion (Schwarz, 1978). The trend was significant at the 5% level for lnRGDPC, BROADM, and STOCKTURN, which were tested under the trend-and-intercept specification; for lnBETEURO, FDI/GDP, and OPENNESS, the trend was insignificant, and these were tested under the intercept-only specification. At first differences, the intercept-only specification was applied throughout.
The results summarized in Table 3 show that the variables exhibit heterogeneous integration orders.
Table 3.
Unit-root test results and classification by order of integration.
STOCKTURN is stationary in levels, I(0), by the unanimous agreement of all three tests. The remaining five variables—lnRGDPC, lnBETEURO, FDI/GDP, OPENNESS, and BROADM—are integrated of order one, I(1). Where the tests diverge at levels, this reflects the well-documented low power of unit-root tests in small samples, while the first-difference results were unanimous in every case. No variable is integrated of order I(2), which would invalidate the bound-testing procedures (Pesaran et al., 2001). The combination of I(0) and I(1) series confirms the suitability of the ARDL framework.
Breakpoint unit-root tests for lnRGDPC and lnBETEURO confirm that the I(1) classification survives the inclusion of an endogenous structural break (identified at 2015 and 2019 respectively).
The endogenously identified break dates are economically interpretable. The 2015 break for lnRGDPC coincides with a period of fiscal relaxation and a return to robust consumption-led growth following the 2010–2012 austerity adjustment, alongside a shift into mild deflation. The 2019 break for lnBETEURO aligns with the pre-pandemic peak of the equity market and the period of heightened fiscal and political uncertainty that preceded the COVID-19 shock. We note these associations as contextual; the breakpoint tests are used here to confirm that the integration-order classification is robust to a structural break, rather than to model the breaks directly.
3.2. Cointegration Testing and Model Selection
Model selection followed a general-to-specific strategy. A first concern was broad money (BROADM). Rather than relying solely on pairwise correlations, we computed formal Variance Inflation Factors for the full specification. The centered VIF for BROADM was 4.10, below the conventional threshold, so multicollinearity in the strict sense is not severe. However, in a 22-observation sample, the inclusion of BROADM produced an over-parameterized specification with sign instability and inflated standard errors. BROADM was therefore excluded on grounds of parsimony rather than multicollinearity. Re-estimating with BROADM-retained leaves the equity-market, FDI, openness, and liquidity coefficients qualitatively unchanged, so the exclusion does not bias the remaining estimates (Wooldridge, 2020).
The optimal specification was selected using the Schwarz Information Criterion (Schwarz, 1978), which selected an ARDL(1,0,0,0,1) model. The bounds test results are reported in Table 4.
Table 4.
Preferred model: ARDL(1,0,0,0,1) conditional ECM, levels equation, and bounds tests.
The F-Bounds statistic of 9.268 exceeds the 1% upper critical bound under both the asymptotic critical values (5.06) and the finite-sample critical values appropriate to the sample size (6.670 for n = 30) (Narayan, 2005). Cointegration is therefore confirmed at the 1% level even under small-sample-adjusted inference, supporting Hypothesis 1.
3.3. Long-Run Coefficient Estimates
The long-run coefficients (Table 4, Panel B) reveal a structured pattern. The equity-market index lnBETEURO carries a positive long-run coefficient (0.214) that does not reach conventional significance. FDI/GDP carries a negative and statistically significant long-run coefficient (−0.174, p = 0.035). OPENNESS and STOCKTURN carry negative long-run point estimates (−0.045 and −0.061) that are marginal, not reaching significance at the 5% level. The negative long-run FDI coefficient is the study’s most analytically notable long-run result; it retains its sign and approximate magnitude across alternative specifications and across the leave-one-out analysis reported in Section 3.6. We defer its economic interpretation to Section 4.
3.4. Short-Run Dynamics and the Error-Correction Representation
A central methodological point concerns the error-correction term. In the conditional error-correction representation reported by EViews 12, the coefficient on the lagged level of the dependent variable, lnRGDPC(−1), is +0.081; the autoregressive coefficient in the levels-form equation is 1.081, so the implied error-correction coefficient is positive (+0.081), not negative. This is confirmed by the t-Bounds statistic, which is positive (+1.785) and of the opposite sign to that required for conventional error correction.
This finding requires careful interpretation. A positive error-correction coefficient is not consistent with rapid adjustment toward equilibrium; it indicates that real GDP per capita does not error-correct toward the estimated long-run relationship in the conventional sense. We therefore do not interpret the adjustment term as a measure of macroeconomic resilience, and Hypothesis 3 in its original form is not supported. The economically coherent interpretation, developed in Section 4.3 and supported by the causality results in Section 3.7, is that real GDP per capita behaves as a near-unit-root forcing variable within the system rather than a variable mechanically pulled back toward a financial equilibrium. This refinement does not diminish the evidence for a long-run relationship, which the F-Bounds test confirms strongly.
Within the preferred ARDL(1,0,0,0,1) specification the short-run effects are economically meaningful. The differenced stock-market turnover term, ΔSTOCKTURN, is positive and significant (0.005, p = 0.016), indicating that increases in market liquidity are associated with immediate increases in real GDP per capita. The contemporaneous effects of FDI/GDP (0.014, p = 0.001) and OPENNESS (0.004, p = 0.002) are likewise positive and significant. The short-run responsiveness of the Romanian economy to capital flows, trade integration, and market liquidity is clearly evident, in contrast to the more ambiguous long-run pattern.
A positive error-correction coefficient accompanied by a positive t-Bounds statistic is an atypical configuration in the ARDL literature, where the dependent variable is most often found to adjust toward the long-run relationship. We therefore treat its economic interpretation with caution. The configuration is consistent with a system in which the dependent variable is long-run forcing rather than equilibrium-adjusting: the conditional ARDL bounds framework is itself derived under the assumption that the regressors are long-run forcing for the dependent variable (Pesaran et al., 2001), so a non-adjusting dependent variable is accommodated within, rather than anomalous to, the framework. We make the weak-exogeneity basis of this reading explicit in the following subsection, while acknowledging that, in a sample of this size, the result is best regarded as indicative.
To assess directly whether real GDP per capita adjusts toward the long-run relationship, we conduct a weak-exogeneity test. The error-correction term is recovered as the residual from the long-run levels equation, and its first lag is included in a short-run equation for each variable. In the equation for ΔlnRGDPC, the error-correction term is statistically insignificant (coefficient −0.094, t = −1.10, p = 0.29), confirming that real GDP per capita does not respond to deviations from the long-run relationship and is therefore weakly exogenous within the system. By contrast, the error-correction term is negative and significant in the equation for stock-market turnover (coefficient −16.77, t = −2.13, p = 0.053), indicating that market liquidity, rather than real output, bears the burden of adjustment toward equilibrium; the corresponding terms for FDI and trade openness are not significant. This pattern provides direct technical support for the interpretation of real GDP per capita as a forcing variable: it is led by the equity market and leads the financial and trade channels, while the adjustment toward the long-run relationship operates through market liquidity rather than through output itself. Given the sample size, we regard this as indicative rather than definitive evidence, consistent with the cautious reading adopted throughout.
3.5. Diagnostic Tests and Stability
The preferred model satisfies all standard residual diagnostics. The Breusch–Godfrey LM test indicates no serial correlation (F = 1.132, p = 0.354); the Breusch–Pagan–Godfrey test indicates homoskedasticity (F = 0.380, p = 0.880); the Jarque–Bera test confirms normality (JB = 0.491, p = 0.782), with skewness (0.124) and kurtosis (2.293) close to Gaussian benchmarks; and the Ramsey RESET test confirms correct functional form (F = 0.004, p = 0.953). Parameter stability was assessed using the CUSUM and CUSUM-of-squares tests (R. L. Brown et al., 1975), shown in Figure 1 and Figure 2. Both statistics remain within the 5% significance bands throughout the sample period.
Figure 1.
CUSUM test of parameter stability (5% significance bands).
Figure 2.
CUSUM of squares test of parameter stability (5% significance bands).
3.6. Robustness Checks
Given the inferential constraints of a 22-observation sample, two robustness exercises were conducted. First, the preferred specification was augmented with dummy variables for the 2008–2009 crisis, the 2020–2021 pandemic, and the 2022 shock. The pandemic and war dummies are significant and negative (p = 0.006 and p = 0.003), confirming identifiable contractionary effects, while the core short-run findings survive their inclusion. The dummy-augmented model is heavily parameterized relative to the sample (sixteen parameters on twenty observations) and is reported solely as a sensitivity check; its inflated fit reinforces the case for the parsimonious preferred specification.
Second, a leave-one-out analysis re-estimated the preferred model excluding each major shock year in turn (Table 5). Cointegration remained supported in every case, with the F-Bounds statistic exceeding the 5% finite-sample critical value throughout and the 1% value in four of five cases. The negative long-run FDI coefficient retained its sign and approximate magnitude (−0.14 to −0.18) in every case in which the levels equation was numerically identified. The exclusion of the 2008 observation drove the autoregressive coefficient toward zero and rendered the long-run estimates numerically unidentified (denoted n.i.); we report this transparently as a direct illustration of the small-sample fragility that constrains precise long-run inference, while noting that the cointegration finding itself survives even in that case (F = 8.45).
Table 5.
Leave-one-out sensitivity analysis (preferred ARDL specification).
3.7. Granger Causality Analysis
To examine the dynamic causal architecture while accommodating the mixed integration orders, Granger causality was assessed within bivariate lag-augmented vector autoregressions. Estimating each VAR with one lag beyond the optimal order, following the logic of Toda and Yamamoto (1995), reduces the dependence of the test on the integration and cointegration status of the variables; the bivariate implementation conserves degrees of freedom in the small sample. Lag length, augmentation, and effective sample (19 observations) are reported. The results are in Table 6.
Table 6.
Granger non-causality tests within bivariate lag-augmented VARs.
The results reveal a coherent and asymmetric pattern. The clearest relationship is a strong unidirectional causality from the equity market to real output: lnBETEURO Granger-causes lnRGDPC at the 1% level (χ2 = 15.44, p = 0.002), while the reverse is only marginal. This is direct evidence of a supply-leading mechanism in which equity-market valuations predictively precede real economic activity (Levine, 1997; Robinson, 1952; Wurgler, 2000), supporting Hypothesis 2.
In the opposite direction, real GDP per capita Granger-causes both trade openness (χ2 = 13.52, p = 0.004) and stock-market turnover (χ2 = 7.91, p = 0.048), while the reverse directions are not significant at the 5% level. Economic growth thus predictively leads trade integration and market liquidity, a demand-following pattern (Robinson, 1952). The bidirectional causality between FDI and stock-market development documented by Soumaré and Tchana Tchana (2015) is not supported here: neither direction reaches significance (FDI/GDP ⇏ STOCKTURN, p = 0.711; STOCKTURN ⇏ FDI/GDP, p = 0.154). Taken together, the causality results describe a system in which the equity market leads real activity while real activity in turn leads trade and liquidity. This architecture is consistent with the positive error-correction coefficient documented in Section 3.4: real GDP per capita occupies a central, forcing position in the system rather than an equilibrium-adjusting one.
4. Discussion
4.1. Capital Markets and Growth: Interpreting the Supply-Leading Evidence
Before interpreting the findings, we state explicitly the sense in which this paper engages with sustainability. The empirical model has real GDP per capita as its single dependent variable and does not directly measure environmental, social, or governance outcomes. We therefore do not claim to quantify macroeconomic sustainability. Instead, we use SDG 8 (decent work and economic growth) and SDG 17 (partnerships and investment promotion) as a qualitative interpretive lens, through which the structural finance–growth patterns we document acquire policy relevance. All claims about sustainability are interpretive rather than estimated, and we separate the econometric findings from their broader interpretation throughout.
The most robust empirical result is the supply-leading role of the equity market. The bounds test confirms a long-run relationship (Hypothesis 1), and the causality analysis establishes that lnBETEURO Granger-causes lnRGDPC at the 1% level while the reverse holds only marginally (Hypothesis 2). The BET-EURO index aggregates and transmits forward-looking information about macroeconomic prospects in a way that predictively precedes real output changes (Levine, 1997; Patrick, 1966; Wurgler, 2000). Interpreted through the SDG lens, this suggests the market can in principle orient investment toward productive uses.
This coordinating role is credible only to the extent that the market is sufficiently deep, transparent, and liquid. The positive long-run elasticity of lnBETEURO does not reach conventional significance, consistent with the structural shallowness of the Bucharest Stock Exchange: a small number of listed firms, market capitalisation of roughly 15% of GDP, and a free float concentrated in a handful of energy and financial stocks (World Bank, 2024; Bucharest Stock Exchange, 2024). A market of this depth can generate informational signals without yet providing the intermediation scale that would translate them into measurable long-run structural contributions (Didier et al., 2021). This explains why the supply-leading role coexists with a statistically weak long-run elasticity.
4.2. Short-Run Effects Versus Long-Run Structure
A defining feature of the results is the divergence between the short-run and long-run behavior of the financial and trade variables. FDI/GDP, OPENNESS, and STOCKTURN each exert positive and significant contemporaneous effects on real GDP per capita, yet their long-run coefficients are negative (FDI, significant) or negative and marginal (openness, turnover). We interpret this asymmetry cautiously and distinguish what the model establishes from what it suggests.
What the model establishes is the negative and significant long-run FDI coefficient (−0.174, p = 0.035), robust across specifications and across the leave-one-out analysis. What the model does not directly test are the mechanisms that might generate this sign. Two interpretations are consistent with the evidence and the literature but are not estimated here. First, profit repatriation: where foreign investment is concentrated in sectors with limited domestic backward linkages, as with Romania’s banking, automotive-assembly, and retail FDI, the initial output boost may erode as earnings flow to parent companies (Alfaro et al., 2004; Borensztein et al., 1998). Second, structural composition: FDI skewed toward market-seeking rather than efficiency-seeking investment can generate immediate demand effects without strengthening domestic absorptive capacity, a pattern documented for several CEE economies (Pavlínek & Ženka, 2011). The present model contains no variable for sectoral FDI composition, profit repatriation, or domestic linkages; these mechanisms are offered as interpretation requiring dedicated future testing, not as results of the ARDL model.
For OPENNESS and STOCKTURN the negative long-run point estimates do not reach significance at the 5% level, and we are correspondingly more restrained. The directions are consistent with the argument that trade openness yields durable benefits primarily when domestic financial markets are deep enough to intermediate the risks integration creates (Kose et al., 2010; Rajan & Zingales, 2003), and with evidence that financial activity exhibits diminishing returns when trading is predominantly speculative (Arcand et al., 2015). Given the lack of significance, we treat these as directional hypotheses for future work rather than established findings. Hypothesis 3, which anticipates asymmetric horizon effects, is supported for FDI and directionally consistent for openness and turnover.
We reiterate that the estimated long-run relationships should be read as exploratory: the leave-one-out analysis in Section 3.6 shows that the long-run coefficients are sensitive to influential observations, particularly the 2008 crisis year, so the magnitudes reported here are best interpreted as indicative of direction rather than as precisely identified structural parameters.
4.3. A Confirmed Long-Run Relationship Without Conventional Error Correction
A central feature of the results concerns the error-correction term. The estimation yields a positive error-correction coefficient (+0.081), and the t-Bounds statistic is likewise positive, indicating that real GDP per capita does not error-correct toward the long-run relationship in the conventional sense. We therefore do not interpret the adjustment term as evidence of rapid equilibrium adjustment, and we make no claim of macroeconomic resilience on this basis.
Rather than an anomaly, we read this as economically coherent once placed alongside the causality results. The evidence shows that real GDP per capita Granger-causes both trade openness and stock-market turnover, while being predictively led by the equity market. Real output therefore occupies a central, forcing position within the system: it is led by forward-looking equity-market information and in turn leads trade integration and market liquidity, rather than being mechanically pulled back toward a financial equilibrium. The positive error-correction coefficient and the forcing-variable role are two expressions of the same underlying structure. This interpretation is directly supported by a weak-exogeneity test (Section 3.4): the error-correction term is insignificant in the equation for real GDP per capita (p = 0.29), but significant for stock-market turnover (p = 0.053), confirming that output does not adjust toward the long-run relationship, while market liquidity does. This interpretation is consistent with the near-unit-root behavior of lnRGDPC documented in Section 3.1 and with the finding that, in post-transition EU economies, financial development supports growth more robustly in normal times than as an automatic stabilizing mechanism (Asteriou et al., 2024).
The substantive implication is that the existence of a long-run relationship (strongly confirmed by the F-Bounds test, including under finite-sample critical values) does not imply a self-correcting one. Romania’s economy transmits information efficiently, but the evidence does not support the stronger claim that the system rapidly restores a domestically anchored equilibrium following shocks.
4.4. Policy Implications
We frame the following as evidence-consistent guidance rather than established causal prescription, acknowledging that the inferential limits of a 22-observation sample preclude definitive conclusions. Each direction is tied to a specific result and bounded by what the model does and does not test.
Before stating these directions, we emphasize that several of the instruments they involve (local content requirements, technology-transfer conditions, and sustainable-finance tools such as green bonds) are not variables in the empirical model and are therefore not directly tested by it. They are offered as interpretive policy implications consistent with the estimated relationships and the supporting literature, not as empirically validated prescriptions.
First, the supply-leading relationship between lnBETEURO and lnRGDPC indicates that equity-market valuations carry genuine forward-looking signal value in Romania. Strengthening this channel plausibly requires deepening the informational quality of the market, through enhanced disclosure, improved minority-shareholder protection, and a broader issuer base, rather than simply expanding capitalization. Expanding sustainable-finance instruments consistent with the EU Taxonomy would diversify the investor base toward longer-horizon participants. This direction speaks to SDG 8.10, with the caveat that our evidence supports the existence of the signaling channel, not the effectiveness of any particular reform.
Second, the negative long-run FDI coefficient, combined with its positive contemporaneous effect, is consistent with the view that Romania absorbs foreign capital effectively in the short run but does not reliably retain its growth contribution over the full cycle. This is consistent with a case for reorienting investment promotion from volume toward quality, conditioning incentives on technology transfer, local content, and domestic R&D linkages (Borensztein et al., 1998). The interpretation aligns with SDG 17.5, though sectoral composition and repatriation are not variables in the model.
Third, the negative long-run point estimates for openness and turnover, while marginal, point in a common direction: Romania’s external integration may exceed its domestic financial system’s capacity to intermediate the flows it generates. Strengthening domestic absorptive capacity is therefore a plausible precondition for sustainable openness, consistent with the institutional-quality literature (Acemoglu et al., 2005; La Porta et al., 1998). Given the lack of significance, this is the most tentative of our policy observations.
Finally, because the evidence does not support a rapid self-correction mechanism, we do not suggest that structural reforms would transmit quickly into outcomes through fast adjustment. The appropriate emphasis is the slower, structural task of deepening domestic intermediation and improving the quality of external capital, so that the confirmed long-run relationship comes to rest on more domestically anchored foundations.
5. Conclusions
5.1. Final Remarks
This study analyses the long-run and short-run relationships between capital market development, foreign direct investment, trade openness, and real GDP per capita in Romania over 2003–2024, using an ARDL bounds testing framework complemented by lag-augmented VAR Granger-causality analysis and comprehensive diagnostic and stability testing.
The findings describe an economy with functional short-run transmission channels and limited long-run structural anchoring. The bounds test confirms a long-run relationship, and the diagnostics confirm a stable, well-specified model. The error-correction term, however, is positive, demonstrating that real GDP per capita does not adjust back toward the long-run relationship in the conventional sense. Together with the causality evidence, this shows that real output occupies a forcing position within the system: it is led by the equity market and, in turn, leads trade openness and market liquidity. Consistent with the broader view that economic performance should be judged beyond headline output alone (Stiglitz et al., 2009), the relevant question is not only how the economy adjusts but whether the structure it embodies is one worth sustaining; our evidence points to functional transmission alongside shallow domestic intermediation and limited domestic value creation.
We position this paper as a contribution to the empirical finance–growth literature on emerging European economies, framed by reference to SDG 8 and SDG 17. Consistent with the scope of the model, this framing is interpretive: the analysis identifies structural finance–growth patterns and reads their policy relevance through the SDG lens rather than measuring sustainability directly.
The supply-leading role of the equity market (Hypothesis 2) is relevant to SDG 8’s target of sustained and inclusive growth. A capital market that leads real activity can serve as a coordination mechanism for productive investment; this role is credible only where the market is sufficiently deep, transparent, and accessible. The Bucharest Stock Exchange has not yet reached this standard, and the practical implication for SDG 8 is that broadening the diversity of market participation, not merely increasing market size, is the priority intervention.
The negative long-run FDI coefficient engages directly with SDG 17.5. The result is consistent with an FDI composition dominated by profit repatriation and limited domestic spillovers, though the model does not test sectoral composition directly. On this interpretive basis, our evidence supports the case for shifting Romania’s FDI policy from quantity toward quality, attracting investment that embeds technology, generates higher-complexity employment, and builds backward linkages, as an evidence-consistent priority rather than an established causal prescription.
The positive error-correction term should not be read as evidence either of resilience or of sustainability. Because real output does not error-correct toward the estimated relationship, the appropriate emphasis falls on the slower structural task of deepening domestic intermediation and improving the quality of external capital, so that the confirmed long-run relationship comes to rest on more domestically anchored foundations.
Table 7 summarizes the four hypotheses, the relevant evidence, the verdict, and the confidence attached to each, separating findings that are statistically confirmed from those that are directional.
Table 7.
Summary of research hypotheses, evidence, and verdicts.
5.2. Limitations and Directions for Future Research
We acknowledge several limitations that define a clear agenda for future research.
The most consequential limitation is the sample size. With 22 annual observations and 21 effective regression observations, several parameters, particularly the long-run coefficients for OPENNESS and STOCKTURN, carry imprecision the data cannot resolve. The leave-one-out analysis makes this concrete: excluding the 2008 crisis observation drives the autoregressive coefficient toward zero and renders the long-run coefficients numerically unstable, demonstrating that a single influential observation can materially affect the level estimates even where cointegration itself remains robust. We therefore frame the long-run results as indicative and the policy discussion as evidence-consistent guidance.
Beyond the precision of individual coefficients, the limited sample affects the analysis in three specific ways: the power of the unit-root and bounds tests to reject false nulls is reduced; the stability of the estimated coefficients across specifications is lower, as the leave-one-out analysis makes explicit; and the causality inferences, conducted within bivariate lag-augmented VARs to conserve degrees of freedom, cannot exploit the full multivariate information set. We regard the results as robust in direction, but acknowledge that all three constraints are against over-precise interpretation.
A second limitation concerns the near-unit-root behavior of lnRGDPC, which renders the t-Bounds criterion uninformative and contributes to the positive error-correction term. Future research could address this through fractional integration methods or nonlinear unit-root tests with greater power against near-unit-root alternatives.
Third, the linear ARDL specification assumes symmetric adjustment to positive and negative shocks, an assumption the literature increasingly questions for emerging markets facing recurring external crises (Asteriou et al., 2024). The positive error-correction term may itself reflect asymmetric dynamics a linear model cannot capture. Nonlinear ARDL (NARDL) models, which separate positive and negative shock responses, would allow this to be tested and represent a natural extension.
Fourth, the single-country focus, while appropriate for the country-specific institutional analysis this study pursues, cannot benchmark Romania against peer economies. A comparative framework allowing for heterogeneous parameters across Romania, Poland, and Hungary, motivated by the heterogeneity documented across the CEE literature (Demetriades & Hussein, 1996; Égert et al., 2016), would contextualize these findings and separate features specific to Romania from those common to the post-transition experience.
Fifth, the model does not incorporate environmental, social, or governance variables. The negative long-run FDI coefficient raises the question of whether inward investment is concentrated in carbon-intensive sectors that generate short-run output at long-run environmental cost. Extending the framework to include renewable-energy investment shares, carbon intensity of GDP, green-bond issuance, and ESG indices would allow future research to test whether the finance–growth nexus in Romania supports or undermines the environmental and social dimensions of sustainable development. Given the EU’s commitment to aligning financial flows with climate objectives under the European Green Deal and the Taxonomy Regulation, we consider this extension to be necessary for any emerging market aspiring to sustainable convergence.
Future research could extend this analysis along several lines: re-estimation at quarterly frequency to increase statistical power; the use of sectoral measures of FDI to test the composition mechanisms discussed above directly; the incorporation of institutional-quality indicators and alternative proxies for financial development.
Supplementary Materials
The following supporting information can be downloaded at https://www.mdpi.com/article/10.3390/ijfs14070170/s1, Table S1: Replication data: annual values for Romania, 2003–2024; Table S2: Variables-sources and transformations.
Author Contributions
Conceptualization, C.D., I.P. and V.Z.; methodology, C.D. and V.Z.; software, C.D. and I.P.; validation, V.Z., formal analysis, C.D. and I.P.; investigation, C.D. and I.P.; resources, C.D. and I.P.; data curation, C.D.; writing—original draft preparation, C.D. and I.P.; writing—review and editing, I.P.; visualization, C.D.; supervision, V.Z. All authors have read and agreed to the published version of the manuscript.
Funding
This research received no external funding.
Institutional Review Board Statement
Not applicable.
Informed Consent Statement
Not applicable.
Data Availability Statement
The data presented in this study are available in [Eurostat] at [https://ec.europa.eu/eurostat], accessed on 15 January 2026, [National Bank of Romania] at [https://www.bnr.ro/], accessed on 15 January 2026, [World Bank] at [https://data.worldbank.org/], accessed on 15 January 2026, and [Bucharest Stock Exchange] at [https://www.bvb.ro/], accessed on 15 January 2026.
Acknowledgments
During the preparation of this manuscript, the authors used Claude Opus 4.8 for the purposes of assisting with EViews coding syntax, language editing of revised sections, and references management. All statistical analyses were designed and executed independently by the author(s) in EViews 12, and all empirical results were verified against the original EViews output. The authors have reviewed and edited the output and take full responsibility for the content of this publication.
Conflicts of Interest
The authors declare no conflicts of interest.
References
- Acemoglu, D., Johnson, S., & Robinson, J. A. (2005). Institutions as a fundamental cause of long-run growth. In P. Aghion, & S. N. Durlauf (Eds.), Handbook of economic growth (Vol. 1A, pp. 385–472). Elsevier. [Google Scholar] [CrossRef] [Scilit]
- Adrian, T., Colla, P., & Shin, H. S. (2012). Which financial frictions? Parsing the evidence from the financial crisis of 2007–2009. NBER Macroeconomics Annual, 27, 159–214. [Google Scholar] [CrossRef] [Scilit]
- Aghanya, D., Agarwal, V., & Poshakwale, S. (2020). MiFID, stock price informativeness and liquidity. Journal of Banking & Finance, 113, 105730. [Google Scholar] [CrossRef] [Scilit]
- Aghion, P., Howitt, P., & Mayer-Foulkes, D. (2005). The effect of financial development on convergence: Theory and evidence. The Quarterly Journal of Economics, 120(1), 173–222. [Google Scholar] [CrossRef] [Scilit]
- Alfaro, L., Chanda, A., Kalemli-Ozcan, S., & Sayek, S. (2004). FDI and economic growth: The role of local financial markets. Journal of International Economics, 64(1), 89–112. [Google Scholar] [CrossRef] [Scilit]
- Ang, J. B., & McKibbin, W. J. (2007). Financial liberalization, financial sector development and growth: Evidence from Malaysia. Journal of Development Economics, 84(1), 215–233. [Google Scholar] [CrossRef] [Scilit]
- Arcand, J. L., Berkes, E., & Panizza, U. (2015). Too much finance? Journal of Economic Growth, 20(2), 105–148. [Google Scholar] [CrossRef] [Scilit]
- Asteriou, D., Spanos, K., & Trachanas, E. (2024). Financial development, economic growth and the role of fiscal policy during normal and stress times: Evidence for 26 EU countries. International Journal of Finance & Economics, 29(3), 2495–2514. [Google Scholar] [CrossRef] [Scilit]
- Beck, T., & Levine, R. (2004). Stock markets, banks, and growth: Panel evidence. Journal of Banking & Finance, 28(3), 423–442. [Google Scholar] [CrossRef] [Scilit]
- Borensztein, E., De Gregorio, J., & Lee, J.-W. (1998). How does foreign direct investment affect economic growth? Journal of International Economics, 45(1), 115–135. [Google Scholar] [CrossRef] [Scilit]
- Boussetta, S., Dragota, V., & Iordache, A. (2025). Military conflicts and stock markets: The Russia–Ukraine conflict and the European stock market. Eastern European Economics. Advance online publication. [Google Scholar] [CrossRef] [Scilit]
- Brown, J. R., Fazzari, S. M., & Petersen, B. C. (2009). Financing innovation and growth: Cash flow, external equity, and the 1990s R&D boom. The Journal of Finance, 64(1), 151–185. [Google Scholar] [CrossRef] [Scilit]
- Brown, R. L., Durbin, J., & Evans, J. M. (1975). Techniques for testing the constancy of regression relationships over time. Journal of the Royal Statistical Society: Series B (Methodological), 37(2), 149–163. [Google Scholar] [CrossRef] [Scilit]
- Bucharest Stock Exchange. (2024). Annual report 2024. Bucharest Stock Exchange (BSE). [Google Scholar]
- Caballero, R. J., & Krishnamurthy, A. (2004). Smoothing sudden stops. Journal of Economic Theory, 119(1), 104–127. [Google Scholar] [CrossRef] [Scilit]
- Demetriades, P. O., & Hussein, K. A. (1996). Does financial development cause economic growth? Time-series evidence from 16 countries. Journal of Development Economics, 51(2), 387–411. [Google Scholar] [CrossRef] [Scilit]
- Dickey, D. A., & Fuller, W. A. (1979). Distribution of the estimators for autoregressive time series with a unit root. Journal of the American Statistical Association, 74(366a), 427–431. [Google Scholar] [CrossRef] [Scilit]
- Didier, T., Levine, R., Llovet Montanes, R., & Schmukler, S. L. (2021). Capital market financing and firm growth. Journal of International Money and Finance, 118, 102459. [Google Scholar] [CrossRef] [Scilit]
- Dragotă, V., & Mitrică, E. (2004). Emergent capital markets’ efficiency: The case of Romania. European Journal of Operational Research, 155(2), 353–360. [Google Scholar] [CrossRef] [Scilit]
- Drob, C., Plescau, I., & Zichil, V. (2026). Foreign direct investments and economic growth in Romania: A time-series approach for sustainable development. Sustainability, 18(1), 343. [Google Scholar] [CrossRef] [Scilit]
- Edwards, S. (1998). Openness, productivity and growth: What do we really know? The Economic Journal, 108(447), 383–398. [Google Scholar] [CrossRef] [Scilit]
- Égert, B., Backe, P., & Zumer, T. (2016). Private-sector credit in Central and Eastern Europe: New (over)shooting stars? In J. C. Brada, & P. Wachtel (Eds.), Global banking crises and emerging markets. Palgrave Macmillan. [Google Scholar] [CrossRef] [Scilit]
- Fischer, S. (1998). Capital account liberalization and the role of the IMF. In Should the IMF pursue capital-account convertibility? (Princeton Essays in International Finance No. 207, pp. 1–10). Princeton University. [Google Scholar]
- Goldsmith, R. W. (1969). Financial structure and development. Yale University Press. [Google Scholar]
- Grossman, G. M., & Helpman, E. (1991). Innovation and growth in the global economy. MIT Press. [Google Scholar]
- Holmström, B., & Tirole, J. (1993). Market liquidity and performance monitoring. Journal of Political Economy, 101(4), 678–709. [Google Scholar] [CrossRef] [Scilit] [PubMed]
- Khan, H., Khan, S., & Zuojun, F. (2022). Institutional quality and financial development: Evidence from developing and emerging economies. Global Business Review, 23(4), 971–983. [Google Scholar] [CrossRef] [Scilit]
- King, R. G., & Levine, R. (1993). Finance and growth: Schumpeter might be right. The Quarterly Journal of Economics, 108(3), 717–737. [Google Scholar] [CrossRef] [Scilit]
- Kortum, S., & Lerner, J. (2000). Assessing the contribution of venture capital to innovation. The RAND Journal of Economics, 31(4), 674–692. [Google Scholar] [CrossRef] [Scilit]
- Kose, M. A., Prasad, E., Rogoff, K., & Wei, S.-J. (2010). Financial globalization and economic policies. In D. Rodrik, & M. Rosenzweig (Eds.), Handbook of development economics (Vol. 5, pp. 4283–4362). Elsevier. [Google Scholar]
- Kripfganz, S., & Schneider, D. C. (2023). ardl: Estimating autoregressive distributed lag and equilibrium correction models. The Stata Journal, 23(4), 983–1019. [Google Scholar] [CrossRef] [Scilit]
- Kwiatkowski, D., Phillips, P. C. B., Schmidt, P., & Shin, Y. (1992). Testing the null hypothesis of stationarity against the alternative of a unit root. Journal of Econometrics, 54(1–3), 159–178. [Google Scholar] [CrossRef] [Scilit]
- La Porta, R., Lopez-de-Silanes, F., Shleifer, A., & Vishny, R. (1998). Law and finance. Journal of Political Economy, 106(6), 1113–1155. [Google Scholar] [CrossRef] [Scilit] [PubMed]
- La Porta, R., Lopez-de-Silanes, F., Shleifer, A., & Vishny, R. (2000). Investor protection and corporate governance. Journal of Financial Economics, 58(1–2), 3–27. [Google Scholar] [CrossRef] [Scilit]
- Levine, R. (1997). Financial development and economic growth: Views and agenda. Journal of Economic Literature, 35(2), 688–726. [Google Scholar]
- Levine, R. (2005). Finance and growth: Theory and evidence. In P. Aghion, & S. N. Durlauf (Eds.), Handbook of economic growth (Vol. 1A, pp. 865–934). Elsevier. [Google Scholar] [CrossRef] [Scilit]
- Levine, R., & Zervos, S. (1998). Stock markets, banks, and economic growth. The American Economic Review, 88(3), 537–558. [Google Scholar]
- MacKinnon, J. G. (1996). Numerical distribution functions for unit root and cointegration tests. Journal of Applied Econometrics, 11(6), 601–618. [Google Scholar] [CrossRef] [Scilit]
- Miloș, M. C., Milos, L. R., Barna, F., & Botoc, C. (2021). Impact of MiFID II on Romanian stock market liquidity: A comparative analysis with a developed stock market. International Journal of Financial Studies, 9(4), 69. [Google Scholar] [CrossRef] [Scilit]
- Narayan, P. K. (2005). The saving and investment nexus for China: Evidence from cointegration tests. Applied Economics, 37(17), 1979–1990. [Google Scholar] [CrossRef] [Scilit]
- National Bank of Romania. (2024). Balance of payments and international investment position report 2024. National Bank of Romania. [Google Scholar]
- Obreja Brașoveanu, L., Dragota, V., Catarama, D., & Semenescu, A. (2008). Correlations between capital market development and economic growth: The case of Romania. Journal of Applied Quantitative Methods, 3(1), 64–75. [Google Scholar]
- Patrick, H. T. (1966). Financial development and economic growth in underdeveloped countries. Economic Development and Cultural Change, 14(2), 174–189. [Google Scholar] [CrossRef] [Scilit] [PubMed]
- Pavlínek, P., & Ženka, J. (2011). Upgrading and the automotive industry value chain: Evidence from Central and Eastern Europe. Journal of Economic Geography, 11(3), 559–586. [Google Scholar] [CrossRef] [Scilit]
- Pesaran, M. H., Shin, Y., & Smith, R. J. (2001). Bounds testing approaches to the analysis of level relationships. Journal of Applied Econometrics, 16(3), 289–326. [Google Scholar] [CrossRef] [Scilit]
- Pistor, K., Raiser, M., & Gelfer, S. (2000). Law and finance in transition economies. Economics of Transition and Institutional Change, 8(2), 325–368. [Google Scholar] [CrossRef] [Scilit]
- Rajan, R. G., & Zingales, L. (2003). The great reversals: The politics of financial development in the twentieth century. Journal of Financial Economics, 69(1), 5–50. [Google Scholar] [CrossRef] [Scilit]
- Ramelli, S., & Wagner, A. F. (2020). Feverish stock price reactions to COVID-19. The Review of Corporate Finance Studies, 9(3), 622–655. [Google Scholar] [CrossRef] [Scilit] [PubMed]
- Robinson, J. (1952). The generalization of the general theory. In The rate of interest and other essays (pp. 67–142). Macmillan. [Google Scholar]
- Rodrik, D. (1998). Who needs capital-account convertibility? In Should the IMF pursue capital-account convertibility? (Princeton Essays in International Finance No. 207, pp. 55–65). Princeton University. [Google Scholar]
- Schumpeter, J. A. (1934). Theorie der wirtschaftlichen Entwicklung [The theory of economic development]. Duncker & Humblot. (Original work published 1911). [Google Scholar]
- Schwarz, G. (1978). Estimating the dimension of a model. The Annals of Statistics, 6(2), 461–464. [Google Scholar] [CrossRef] [Scilit]
- Sethi, D., Tiwari, A. K., & Shahbaz, M. (2021). Is finance–growth nexus nonlinear? Evidence from linear and nonlinear causality analysis. In M. Shahbaz, A. Soliman, & S. Ullah (Eds.), Economic growth and financial development (pp. 95–121). Springer. [Google Scholar] [CrossRef] [Scilit]
- Shleifer, A., & Vishny, R. W. (1997). A survey of corporate governance. The Journal of Finance, 52(2), 737–783. [Google Scholar] [CrossRef]
- Shrestha, M. B., & Bhatta, G. R. (2018). Selecting appropriate methodological framework for time series data analysis. The Journal of Finance and Data Science, 4(2), 71–89. [Google Scholar] [CrossRef] [Scilit]
- Soumaré, I., & Tchana Tchana, F. (2015). Causality between FDI and financial market development: Evidence from emerging markets. The World Bank Economic Review, 29(Suppl. S1), S205–S216. [Google Scholar] [CrossRef] [Scilit]
- Stiglitz, J. E. (2000). Capital market liberalization, economic growth, and instability. World Development, 28(6), 1075–1086. [Google Scholar] [CrossRef] [Scilit]
- Stiglitz, J. E., Sen, A., & Fitoussi, J.-P. (2009). Report by the commission on the measurement of economic performance and social progress. Commission on the Measurement of Economic Performance and Social Progress. [Google Scholar]
- Tang, D. (2024). The effect of financial development on economic growth among the Central and Eastern European countries. Central European Economic Journal, 11(58), 406–423. [Google Scholar] [CrossRef] [Scilit]
- Tobin, J. (1969). A general equilibrium approach to monetary theory. Journal of Money, Credit and Banking, 1(1), 15–29. [Google Scholar] [CrossRef] [Scilit]
- Toda, H. Y., & Yamamoto, T. (1995). Statistical inference in vector autoregressions with possibly integrated processes. Journal of Econometrics, 66(1–2), 225–250. [Google Scholar] [CrossRef] [Scilit]
- Uddin, M., Chowdhury, A., Anderson, K., & Chaudhuri, K. (2021). The effect of COVID-19 pandemic on global stock market volatility: Can economic strength help to manage the uncertainty? Journal of Business Research, 128, 31–44. [Google Scholar] [CrossRef] [Scilit] [PubMed]
- Uzar, U., Eyuboglu, K., Akdag, S., & Alola, A. A. (2023). Causal inference of financial development and institutional quality across the globe. Physica A: Statistical Mechanics and Its Applications, 626, 129035. [Google Scholar] [CrossRef] [Scilit]
- Wooldridge, J. M. (2020). Introductory econometrics: A modern approach (7th ed.). Cengage Learning. [Google Scholar]
- World Bank. (2024). World development indicators 2024. World Bank. [Google Scholar]
- Wurgler, J. (2000). Financial markets and the allocation of capital. Journal of Financial Economics, 58(1–2), 187–214. [Google Scholar] [CrossRef] [Scilit]
- Yartey, C. A. (2010). The institutional and macroeconomic determinants of stock market development in emerging economies. Applied Financial Economics, 20(21), 1615–1625. [Google Scholar] [CrossRef] [Scilit]
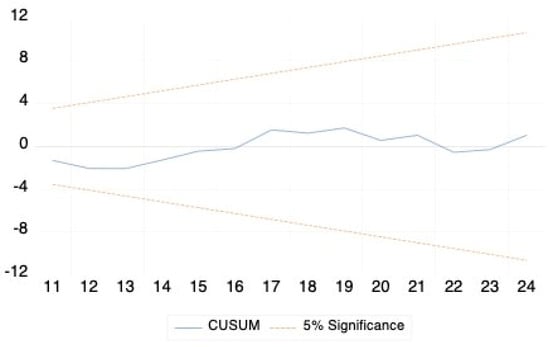
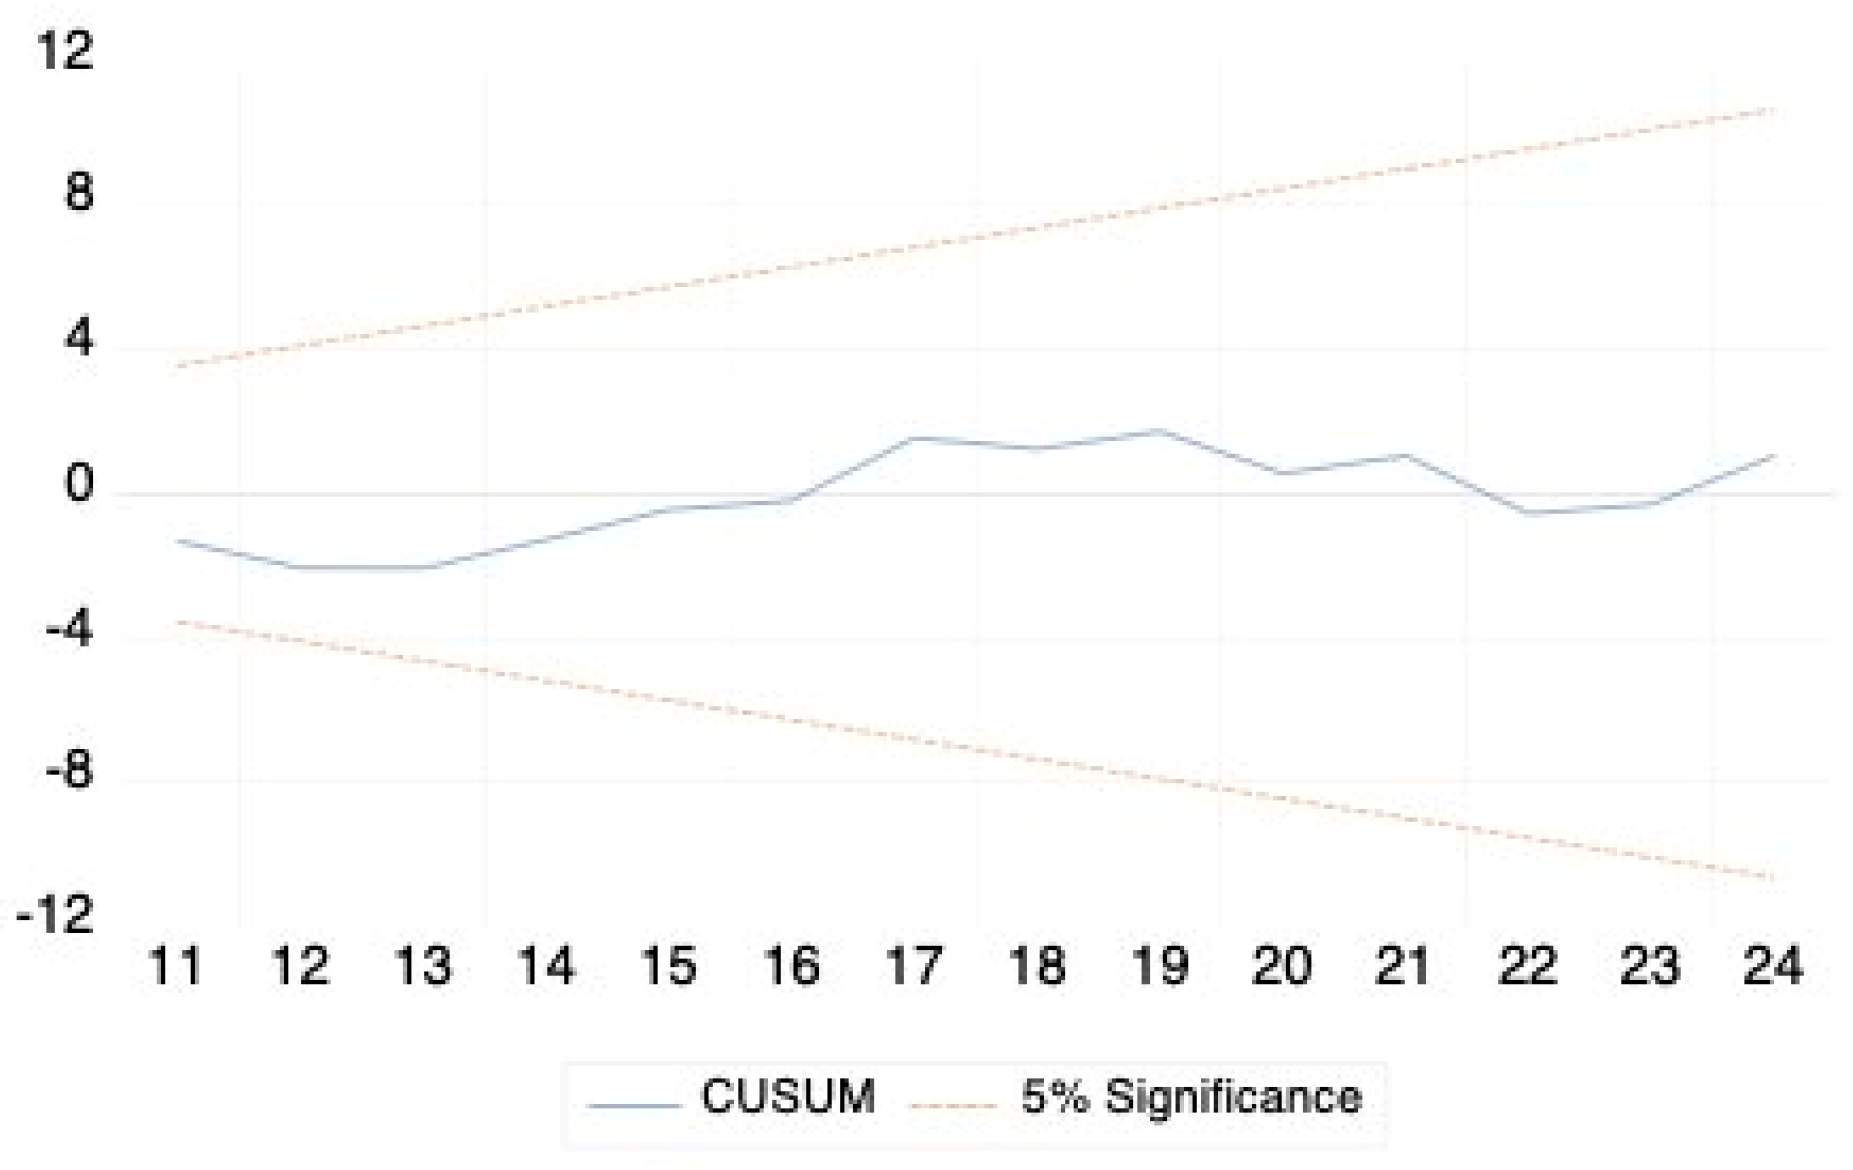
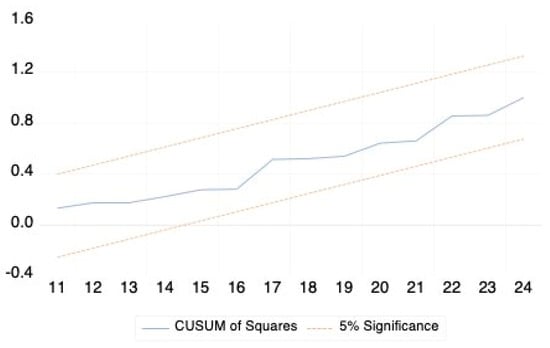
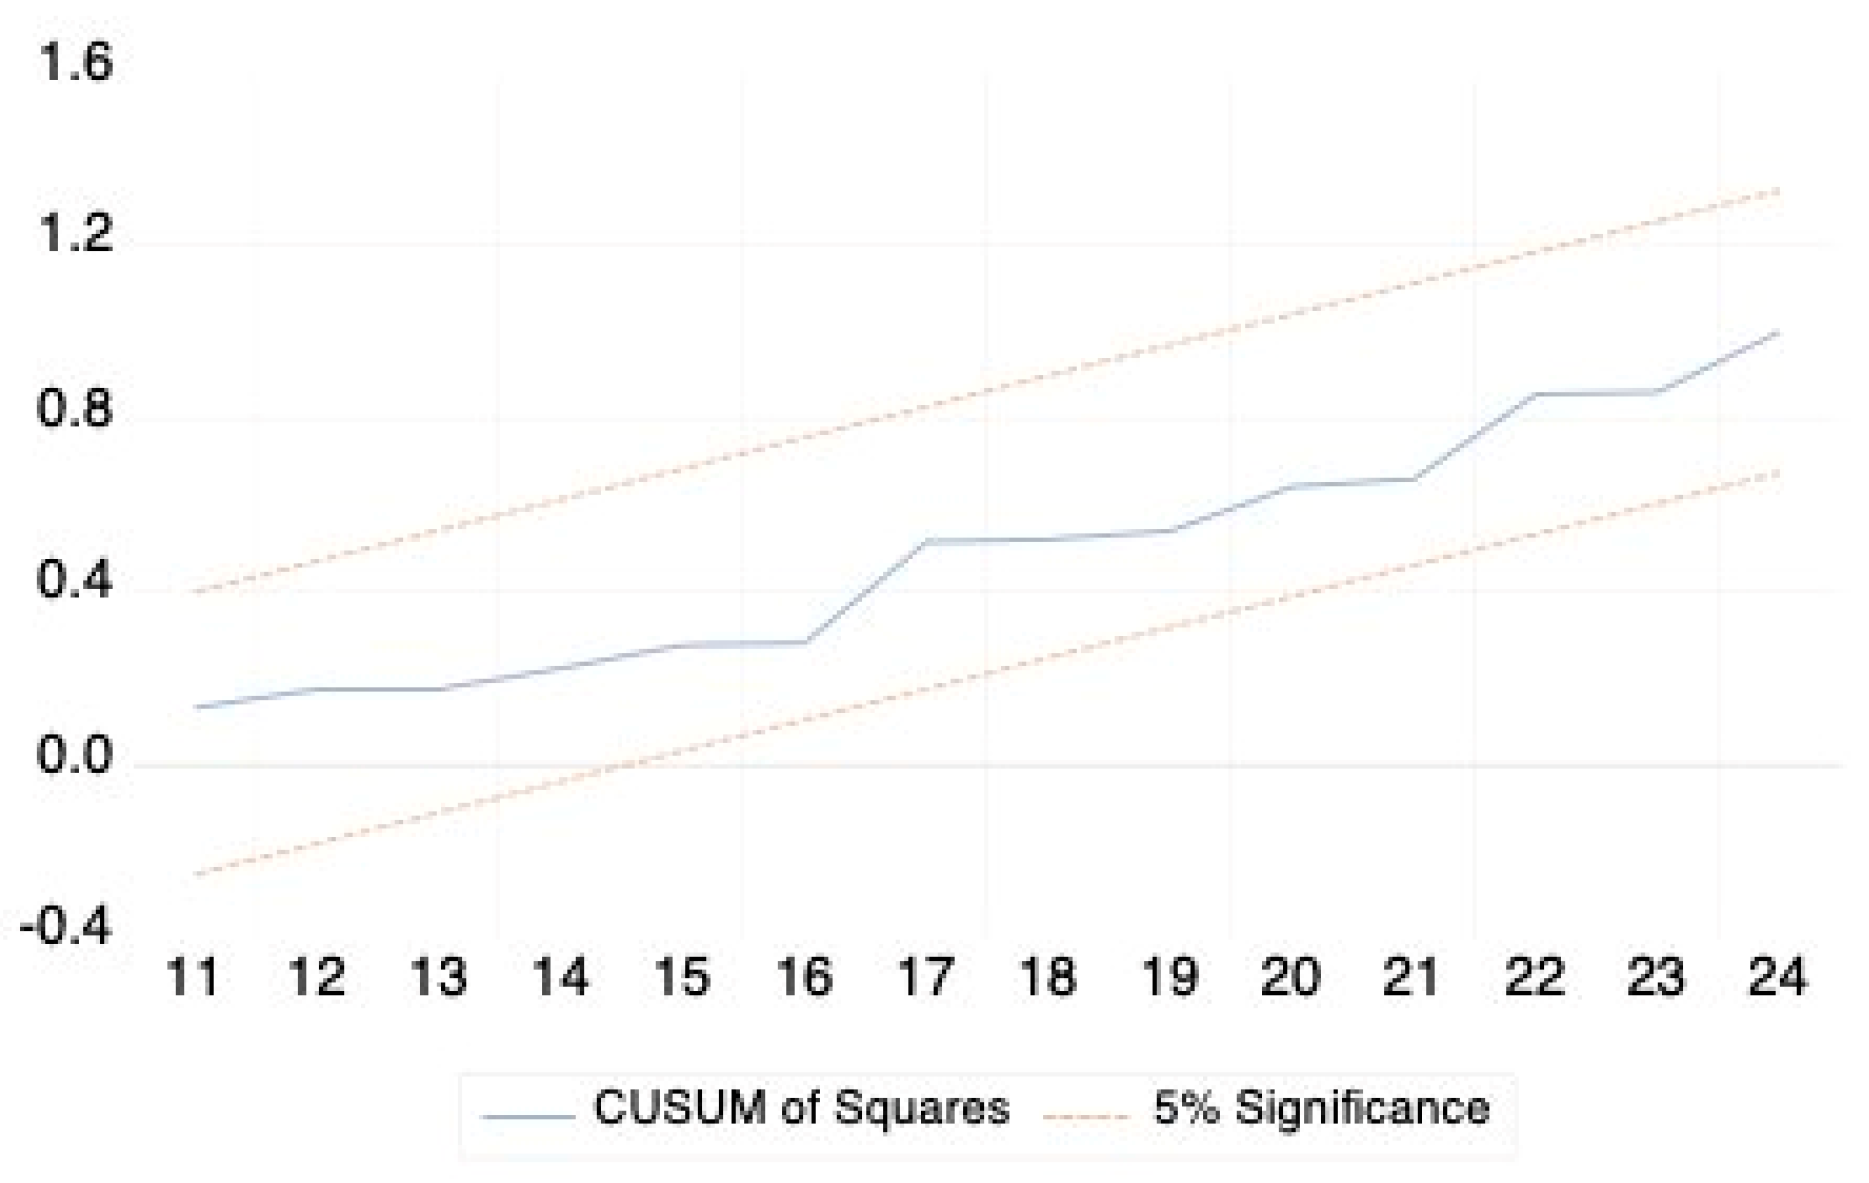

Disclaimer/Publisher’s Note: The statements, opinions and data contained in all publications are solely those of the individual author(s) and contributor(s) and not of MDPI and/or the editor(s). MDPI and/or the editor(s) disclaim responsibility for any injury to people or property resulting from any ideas, methods, instructions or products referred to in the content. |
© 2026 by the authors. Licensee MDPI, Basel, Switzerland. This article is an open access article distributed under the terms and conditions of the Creative Commons Attribution (CC BY) license.