


Abstract
The increasing demand for SmallSats requires launch systems providing responsive, independent, and mission-specific access to orbit. This study presents the conceptual design and feasibility assessment of a Nuri-derived SmallSat-dedicated launch vehicle for delivering a 500 kg-class payload to a 500 km sun-synchronous orbit. Unlike previous planning-level studies focused on development strategies, this study quantitatively derives a vehicle configuration through staging design by incorporating geopolitical constraints on launches from the Naro Space Center, Nuri technological heritage, and emerging upper-stage engine and lightweight structural manufacturing technologies. The required velocity increment was distributed between stages, and the preliminary configuration was established through vehicle sizing. The design was evaluated using an ASTOS-based multidisciplinary design optimization framework integrating trajectory optimization, aerodynamic analysis, flight-load evaluation, and load-bearing structural mass estimation. The optimized trajectory satisfied the target-orbit and range-safety constraints and yielded a payload capability of 530 kg. The estimated dry masses of the first and second stages were 4051 kg and 648 kg, corresponding to structural indices of 8.7% and 12.1%, respectively. These results support preliminary feasibility under the adopted modeling assumptions at the conceptual stage rather than providing detailed design verification of subsystems, while further validation is required to address structural and subsystem mass uncertainties.
1. Introduction
The global space sector has undergone a substantial transformation characterized by increasing commercialization, greater private-sector participation, and the diversification of space-based services [1]. Within this transition, small satellites (SmallSats) have evolved from primarily experimental platforms into an extensive innovation ecosystem supporting commercial, scientific, and governmental missions [2]. Advances in miniaturization, shorter development cycles, and reduced spacecraft costs have increased the demand for frequent and flexible access to orbit, positioning launch services as a core component of the commercial space value chain and generating greater requirements for launch frequency, orbit diversity, deployment accuracy, and mission-specific accessibility [2,3]. These trends indicate that launch services are becoming a core element of the commercial space value chain, with increasing demand in terms of not only launch volume but also launch frequency, orbit diversity, deployment accuracy, and mission-specific accessibility.
The available launch options for SmallSats can broadly be divided into rideshare missions aboard medium- and large-class launch vehicles and dedicated missions using small launch vehicles [4,5,6]. Rideshare services can reduce launch costs by sharing vehicle capacity among multiple spacecraft; however, they generally provide limited control over launch schedules, injection orbits, and deployment conditions, which can constrain mission design or require subsequent orbital transfer [4,5,6]. Dedicated small launch vehicles can provide more responsive, direct, and mission-specific access to orbit, but their economic and operational viability depends strongly on launch cost, reliability, production efficiency, and achievable flight rate [3,6,7]. Addressing these challenges requires an integrated conceptual-design process that balances vehicle performance, mission flexibility, and economic viability.
The conceptual design of a launch vehicle is intrinsically multidisciplinary because propulsion, stage sizing, aerodynamics, structures, and ascent trajectory are strongly coupled. Recent launch-vehicle studies have therefore increasingly adopted multidisciplinary design optimization (MDO) formulations to account for these interactions at the system level. Oliveira and Cerqueira [8] systematically reviewed MDO studies applied to launch-vehicle design and found that trajectory, propulsion, weights and sizing, and aerodynamics are the disciplines most frequently integrated, whereas cost, programmatic, and support disciplines remain comparatively underrepresented. This finding indicates that current launch-vehicle MDO remains primarily performance-oriented and that broader lifecycle integration is still required to fully support concurrent engineering. At the implementation level, Ko et al. [9] formulated a simultaneous optimization of launch-vehicle stage sizing and ascent trajectory subject to flight-requirement constraints, including maximum dynamic pressure and separated-stage impact locations, demonstrating the benefit of incorporating flight and range-safety requirements directly into system-level sizing.
Trajectory optimization methods have also advanced through direct-transcription and convexification-based approaches. Malyuta et al. [10] reviewed the growing use of lossless convexification and sequential convex programming (SCP) for space-vehicle trajectory design and guidance. More recently, Zhao et al. [11] proposed a smoothing-homotopy-based SCP method in which smoothed terminal-constraint surrogates are gradually transformed into the original nonlinear problem as the homotopy parameter decreases. Their ascent-trajectory examples demonstrated reduced sensitivity to the initial guess and improved convergence compared with conventional SCP. These developments primarily address the numerical robustness and computational efficiency of trajectory optimization, whereas an application-oriented launch-vehicle design study must additionally maintain consistency among vehicle sizing, trajectory-dependent loads, aerodynamic performance, and structural mass.
Against this industrial and methodological background, previous Korean studies have proposed SmallSat-dedicated launch vehicle concepts that leverage propulsion, structural, manufacturing, and ground-infrastructure technologies established through the Nuri development program [12,13,14]. The development concept investigated in this study targets the injection of a 500 kg payload into a 500 km sun-synchronous orbit (SSO), reflecting the mass class and target orbits of next-generation medium-sized satellites and other domestic SmallSat missions [13,14]. To enhance competitiveness while limiting development cost and risk, the proposed strategy maximizes the use of Nuri-derived structures, manufacturing capabilities, engines, test facilities, and launch infrastructure [12,13,14]. Previous studies have also considered a high-performance upper-stage engine and structural-efficiency improvements using a common-bulkhead tank configuration to satisfy the target mission requirement [14]. However, these previous planning and review efforts have mainly focused on development strategies and applicable technologies, whereas the quantitative definition of vehicle specifications and configuration, together with an integrated feasibility assessment of orbit-insertion performance and structural mass, has not been fully addressed.
To address this Nuri-specific design gap, this study quantitatively derives the vehicle specifications and preliminary configuration of a Nuri-derived SmallSat-dedicated launch vehicle and evaluates its mission performance through a sequential design process. First, the mission requirements and design constraints were defined by considering the launch azimuth, dog-leg maneuver, and stage impact-point restrictions associated with launch operations from the Naro Space Center. Second, a staging design was performed by leveraging technologies accumulated through the Nuri development program, including the 75-ton-force-class engine (tonf; 1 tonf = 9.807 kN) manufacturing infrastructure and structural design heritage, while considering currently investigated technologies such as a high-performance upper-stage engine and lightweight common-bulkhead tank structures. Third, the staging results were translated into a preliminary vehicle configuration by sizing the propellant tanks, fairing, interstage, aft fuselage, and overall vehicle dimensions. Finally, an ASTOS-based multidisciplinary design optimization (MDO) framework integrating trajectory optimization, aerodynamic analysis, flight-load evaluation, and load-bearing structural mass estimation was used to assess whether the resulting configuration satisfied the target orbit-insertion performance and the structural-mass assumptions adopted in the staging design. Accordingly, the principal contribution of this study lies in the quantitative, application-level assessment of a Nuri-derived launch vehicle under Korean geopolitical and range-safety constraints, rather than in the development of a new general-purpose trajectory-optimization algorithm.
2. Mission Requirements and Design Constraints
2.1. Geopolitical Conditions in Korea
Given the unique geopolitical environment in East Asia, the Republic of Korea has limited design freedom in the development of launch vehicles. Therefore, the constraints imposed by geopolitical and range-safety conditions must be considered from the initial design stage. A northward launch trajectory from the Naro Space Center would overfly the Korean Peninsula, including densely populated land areas, and is therefore excluded primarily for range-safety reasons. In addition, with China located to the west of Korea and Japan to the east, practical launch corridors from the Naro Space Center are largely restricted to southward directions, which are suitable for injecting payloads into polar orbits, including sun-synchronous orbits (SSOs). However, because Okinawa and the Amami Islands of Japan lie along potential southward flight corridors, the launch azimuth must be selected by considering the safety of inhabited areas. Based on an analysis of the instantaneous impact point and the avoidance of inhabited islands, a launch azimuth of approximately 170° was selected. Launching at this azimuth requires a dog-leg maneuver to achieve the target SSO, resulting in an additional performance penalty that must be considered in the vehicle design.
The allowable impact locations of jettisoned launch vehicle components are also important design considerations. Japanese inhabited islands and their surrounding exclusive economic zones (EEZs) lie along potential southward flight corridors from the Naro Space Center. To avoid inhabited areas and minimize potential geopolitical concerns, the impact points of the separated first stage and payload fairing must be located in open-sea areas beyond these regions. Accordingly, a minimum ground-range distance of 1400 km from the Naro Space Center was imposed as a design requirement for the impact point.
2.2. Determination of Delta-V Requirement
The staging design of a launch vehicle mainly involves determining the configuration of each stage of the vehicle to achieve the target performance while accounting for vehicle loss. The configuration of each stage includes the total number of stages of the launch vehicle, propulsion system performance, structural index, and propellant mass as variables. The SmallSat-dedicated launch vehicle designed in this study aims to reduce development cost and shorten the development schedule by adding a high-performance second stage to the first stage, based on a Nuri test launch vehicle. Accordingly, the launch vehicle was configured with two stages, and the 75-tonf kerosene-liquid oxygen engine used in Nuri was applied to the first-stage propulsion system [9].
The target performance for the staging design of a launch vehicle can be expressed in the form of velocity increments [15,16]. Because the launch vehicle must reach the altitude and orbital velocity required by the payload after the burnout of the upper stage, it must be able to attain orbital velocity when all the propellants loaded through the propulsion system are depleted. The performance of the launch vehicle can be expressed as shown in Equation (1), known as the rocket equation.
where g0 is the acceleration due to gravity, Isp is the specific impulse of the propulsion system, and mi and mf are the initial and final masses of the launch vehicle, respectively.
Most launch vehicles are launched vertically and gradually turn toward the local horizontal as they ascend. During ascent, the thrust required to counteract gravity introduces gravity loss, while thrust-vector misalignment during guidance maneuvers introduces steering loss. Overcoming atmospheric drag also introduces drag loss. These loss terms are expressed in Equations (2)–(4):
where , = thrust vector, = velocity vector
Here, tf is the total combustion time of the launch vehicle, γ is the flight path angle, T is the engine thrust, m is the total mass of the launch vehicle, and D is the drag force.
In the present mission, an additional yaw-plane contribution to the resultant misalignment angle (δ) in Equation (3) arises from the dog-leg maneuver required for SSO insertion. For a launch from the Naro Space Center at an azimuth of 170°, a trajectory without out-of-plane steering would nominally result in a prograde orbit with an inclination of approximately 82°. This inclination differs substantially from the target inclination of 97.4° for the 500 km retrograde SSO considered in this study. Therefore, an out-of-plane dog-leg maneuver is required during ascent. To perform this maneuver, the thrust vector control system must deflect the thrust vector laterally from the velocity vector, thereby increasing δ and introducing an additional steering loss.
The launch vehicle target performance, expressed as Equation (1), can be written as Equation (5) to satisfy the requirements, where Equations (2)–(4) are added to the orbital velocity of the payload.
Since most launch vehicles fly through a similar sequence (vertical takeoff–kick turn–gravity turn–guidance flight), the values for each loss term in Equation (5) range from approximately 1.5 to 2.5 km/s for the gravity loss, from 0.1 to 0.4 km/s for the steering loss, and from 0.1 to 0.3 km/s for the drag loss, based on flight data of launch vehicles developed so far [15,16,17,18]. As the staging design of a launch vehicle is the initial design stage, known values can be used to set the target performance. Therefore, in this study, the gravity loss was set to 2 km/s, the steering loss to 0.3 km/s (considering yaw maneuver), and the drag loss to 0.2 km/s to configure the target performance of the SmallSat-dedicated launch vehicle.
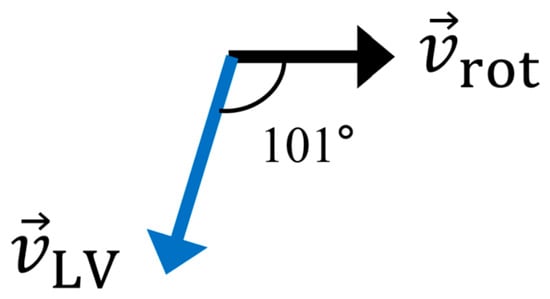
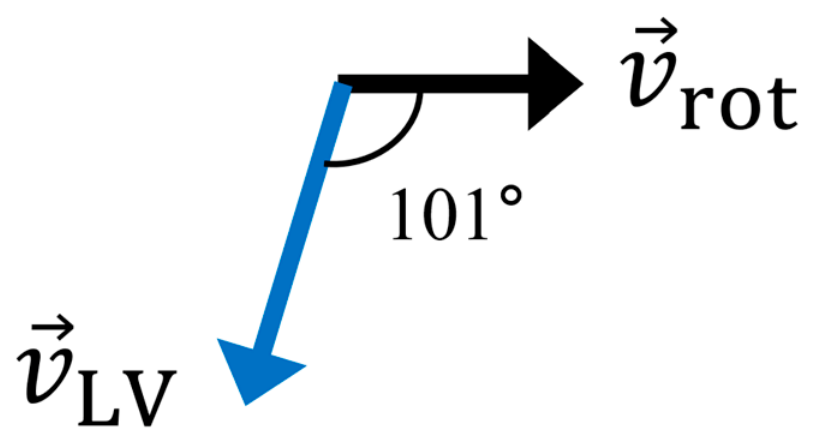
When a launch vehicle is launched at an azimuth of 170° and enters an SSO through a dog-leg maneuver, the resulting orbit is retrograde with respect to Earth’s rotation as shown in Figure 1. In this case, the effect of Earth’s rotation is considered a loss in terms of the launch vehicle’s performance. Therefore, a corresponding loss term should be added to Δvreq in Equation (5). Earth rotates at an approximately constant angular velocity. At the assumed SECO latitude, this angular motion corresponds to a local eastward tangential velocity, which can be estimated using Equation (6) [19].
Figure 1.
Geometric relationship between the local Earth-rotation velocity and the launch-vehicle velocity direction at SECO.
Here, veq is the equatorial surface velocity, and φSECO = 15° is the assumed latitude at SECO, adopted from the burnout position of Nuri’s third stage.
The heading angle of the launch vehicle at SSO insertion is approximately 191°, measured clockwise from north, whereas the local Earth-rotation velocity is directed eastward, corresponding to a heading of 90°. Therefore, only the component of the local Earth-rotation velocity projected onto the launch-vehicle velocity direction contributes to the required velocity increment, as expressed in Equation (7).
Here, vrot,∥ denotes the signed component of the local Earth-rotation velocity projected onto the launch-vehicle velocity direction. Its negative value indicates that Earth’s eastward rotational velocity acts opposite to the launch-vehicle flight direction during retrograde SSO insertion. From the viewpoint of the launch vehicle, an additional velocity increment of approximately 85 m/s is therefore required to attain the target orbital velocity. Accordingly, this value is added to the right-hand side of Equation (5), which can be finally expressed as Equation (8). Because the preliminary staging calculation used vacuum propulsion performance and prescribed trajectory-loss estimates, an approximately 3% allowance (303 m/s) was added for first-stage atmospheric-pressure effects and other unresolved losses. This increased the unmarginated requirement of 10,197 m/s from Equation (8) to the rounded value of 10,500 m/s in Table 1; its adequacy for the present design is assessed against the ASTOS-optimized trajectory in Section 6.
Table 1.
Delta-V requirement for SmallSat-dedicated launch vehicle.
2.3. Delta-V Distribution
The next step in the launch vehicle staging design is to allocate the determined delta-V requirements to each stage. Generally, in a two-stage configuration, if the same propellant combination and engine type are used in both the first and second stages, it is efficient to distribute the delta-V to the first and second stages at a ratio of approximately 1:1. However, if the propulsion system efficiency or structural index differs significantly, a strategy of distributing a slightly higher delta-V to the stage with higher efficiency and better structural index can also be applied. In the case of the SmallSat-dedicated launch vehicle designed in this study, the impact point of the first stage is an important constraint, which must be prioritized while distributing the delta-V. The required velocity of the launch vehicle on first-stage separation to satisfy the impact point constraint of 1400 km or more can be derived from Nuri’s flight data. The three-stage Nuri rocket is designed such that the impact point of the first stage is at a distance of approximately 400 km; however, the fairing is designed to impact at a distance of over 1400 km during the second-stage flight. Based on the results of Nuri’s second launch, the velocity of the launch vehicle at fairing separation is approximately 3.2 km/s [20]; therefore, if the estimated losses during the first-stage flight are added to this velocity, the delta-V required for the first stage can be calculated.
In the first-stage flight phase, maneuvering in the yaw direction is not required; therefore, the gravity, drag, and steering losses are the losses accounted for during flight, which can be calculated using Equations (2)–(4). In the case of gravity loss, which accounts for the highest proportion of the total loss, a rough estimate can be made, as in Equation (9), by referring to the cases of Nuri and other two-stage launch vehicles.
The three terms in Equation (9) represent the gravity losses during the vertical takeoff phase from 0 to 10 s, the kick-turn phase from 10 to 25 s, and the gravity-turn phase from 25 to 165 s, respectively. The 165 s duration was selected with reference to the representative first-stage flight profile of Firefly Alpha, a two-stage small launch vehicle in a comparable payload class [21]. For the preliminary staging design, the phase-dependent flight-path-angle histories, γ1(t), γ2(t), and γ3(t), were prescribed based on the Nuri flight data and a representative ascent sequence of a two-stage launch vehicle [15,20]. Numerical integration of Equation (9) using this preliminary flight-path-angle profile yielded an estimated first-stage gravity loss of approximately 1.28 km/s. This value was used only for the initial allocation of the velocity increment, whereas trajectory-dependent flight dynamics and losses were subsequently accounted for in the ASTOS-based MDO process. Since most of the drag loss occurs during the first-stage atmospheric flight phase, a drag loss of 200 m/s (Table 1) was applied. The combined steering loss and thrust loss due to atmospheric pressure were assumed to be 150 m/s. Adding these loss terms to the required velocity of 3200 m/s for satisfying the first-stage impact-point requirement yielded a total first-stage velocity increment of approximately 4830 m/s. The remaining 5670 m/s was allocated to the second stage.
3. Staging Design of the Nuri-Derived SmallSat-Dedicated Launch Vehicle
Staging design was performed to determine the specifications of each stage using the delta-V allocated to each stage. First, the specifications of Nuri’s 75-tonf-class engine were applied to the propulsion system performance of the first stage, and the specifications of the 3-tonf-class Metarox engine under development were applied for the propulsion system performance of the second stage [22]. The amount of propellant that satisfies the delta-V requirement allocated to each stage can be calculated using the specific impulse of the propulsion system and the structural index of each stage. The structural index is the ratio of the dry mass to the wet mass of each stage and is expressed as in Equation (10).
Using Equation (10), we can rewrite the dry mass of each stage as a function of the structural index and propellant mass, as in Equation (11).
Rewriting Equation (1) for the first and second stages yields Equations (12) and (13), respectively:
In Equation (13), the mass of the fairing can be excluded because it is jettisoned at the beginning of the second-stage flight phase. Using Equation (11), we can also express Equation (13) as a function of the structural index and propellant mass, as in Equation (14).
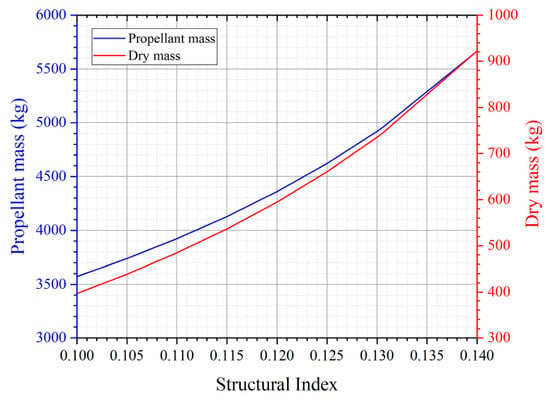
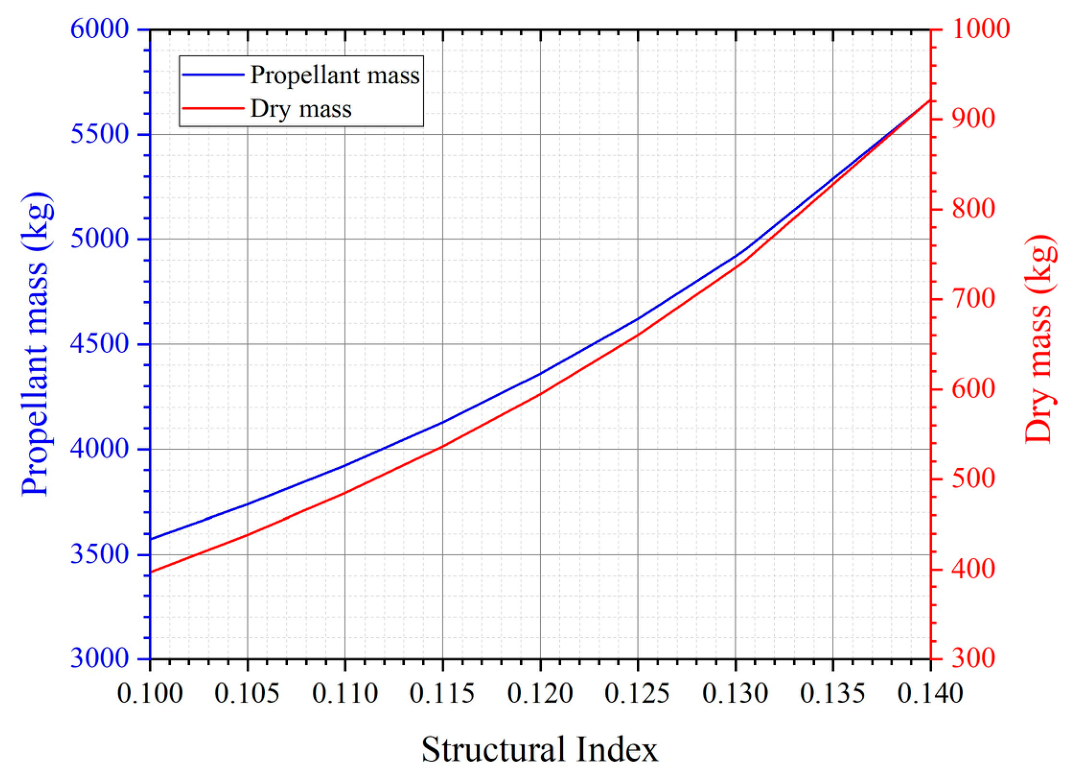
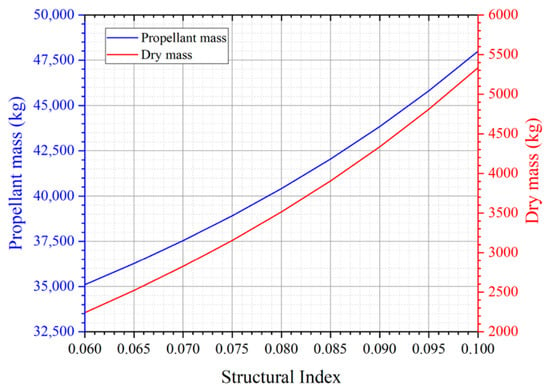
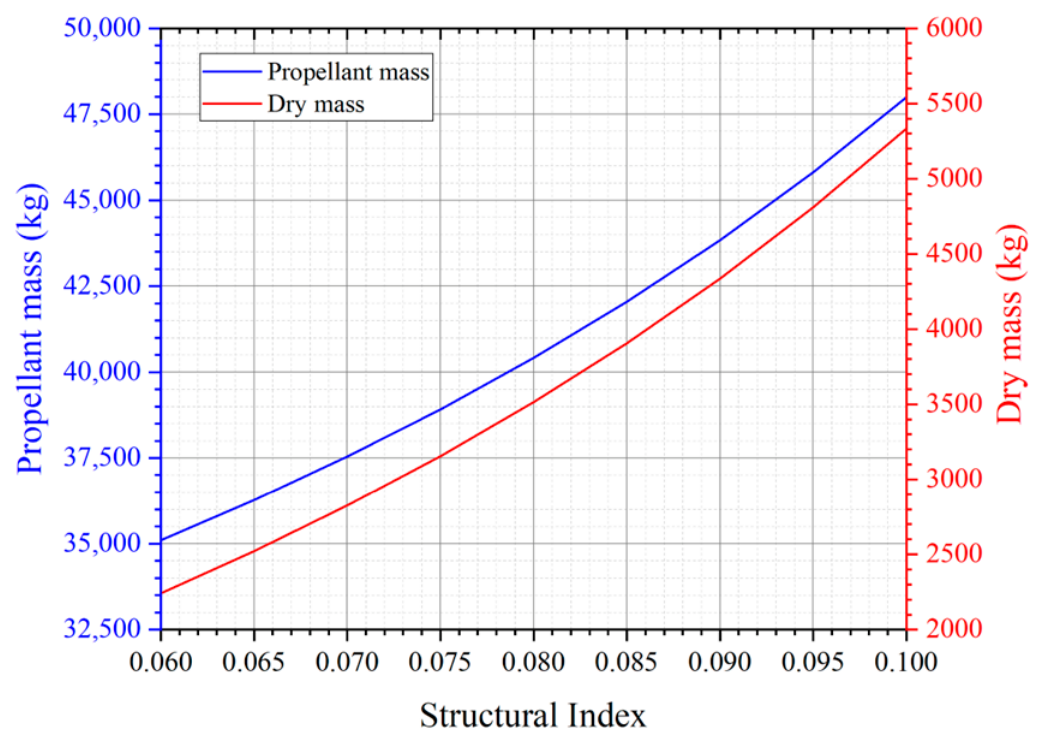
Since mpayload = 500 kg, Isp,2 = 360 s, and ∆vstage,2 = 5670 m/s, when these values are substituted into Equation (14), the propellant and dry masses of the second stage according to the structural index can be plotted as shown in Figure 2.
Figure 2.
Propellant and dry masses according to the structural index (Isp = 360 s).
The structural index depends on the design and manufacturing technology of the fuselage, and whether manufacturing facilities are secured. These factors are directly related to the development cost and period. Since the SmallSat-dedicated launch vehicle in this study is based on the premise of utilizing Nuri’s technology and infrastructure to minimize development costs and time, values at the structural index level of Nuri were first considered during the staging design phase. However, considering that the second-stage structural index of SmallSat-dedicated launch vehicles of the same class is approximately 10%, it was deemed necessary to improve the structural index compared with Nuri through design improvements and the application of common bulkhead tanks to secure competitive performance. Table 2 presents the calculated total, propellant, and dry masses of the second stage as the structural index is reduced from the Nuri baseline value of 14% in increments of 0.5 percentage points.
Table 2.
Masses of the second stage in terms of structural indices.
Similar to the second stage, Equation (12) for the first stage can be expressed as in Equation (15):
By substituting mpayload = 500 kg, m_fairing = 300 kg, Isp,1 = 299.8 s, ∆vstage,1 = 4830 m/s, and mstage,2 = 5377 kg, we can obtain the required propellant and dry masses for the first stage, as shown in Figure 3.
Figure 3.
Propellant and dry masses with respect to the structural index (Isp = 299.8 s).
Although the structural index for Nuri’s first stage is 10.1%, considering that the structural index for the first stage of comparable SmallSat launch vehicles is between 6% and 9%, it was determined that, similar to the second stage, the structural index for the first stage requires enhancements relative to Nuri’s technology. Table 3 lists the total, propellant, and dry masses of the first stage when the structural index for the first stage is reduced in increments of 0.5 percentage points from 10%.
Table 3.
Masses of the first stage in terms of structural indices.
For a launch vehicle to have reasonable take-off performance, the ratio of the ground thrust to takeoff weight (T/W) of the first-stage engine must be in the range of 1.3–1.5 [15]. Because this study is based on the premise that the Nuri rocket engine is used as the first-stage engine, the maximum possible takeoff weight is 53,240 kg for the T/W value to be 1.3 or higher, based on the ground thrust value of the first-stage engine of this rocket. Accordingly, combinations of second-stage structural indices satisfying a T/W of 1.3 or higher among the first-stage structural indices listed in Table 3 were derived, as shown in Table 4. Here, a payload mass of 500 kg and a fairing mass of 300 kg were added to the takeoff weight.
Table 4.
Combination of structural indices for each stage satisfying a ground thrust to takeoff weight (T/W) of 1.3 or higher.
For first-stage structural indices of 9% and 9.5%, the take-off mass exceeded 53,240 kg, even at the minimum second-stage structural index of 11.5% (Table 2), whereas for a first-stage structural index of 8.5%, values below the standard take-off mass were obtained under all second-stage structural indices. The results in Table 4 indicate that, for the development of a SmallSat-dedicated launch vehicle based on Nuri’s technology, the first-stage structural index must be designed and manufactured at the 8.5% level. Based on this value, the first-stage structural index was set to 8.6%, with the dry mass rounded up to 4000 kg. The second-stage structural index was set to 12.6%, with the propellant mass rounded up to 4700 kg based on a structural index of 12.5% by applying a performance margin. Table 5 presents the staging design results for the SmallSat-dedicated launch vehicle.
Table 5.
Staging design results.
4. Preliminary Configuration
Based on the staging results summarized in Table 5, a preliminary configuration was defined to provide the baseline geometry for the aerodynamic analysis and MDO-based structural mass estimation. The required oxidizer and fuel volumes were estimated from the propellant masses at each stage using the mixture ratio and propellant density. The residual propellant was incorporated by applying 2% of the total propellant mass for the first stage and 3% for the second stage, based on Nuri-derived design and operational considerations. Additional tank volume margins of 6% and 10% were applied to the first and second stages, respectively, to account for the ullage volume, manufacturing tolerance, and preliminary design uncertainty.
The fuselage diameter was selected by considering compatibility with the Nuri-derived manufacturing infrastructure. The 2.6 m tank diameter of Nuri’s second-stage fuel tank and the 2.0 m tank diameter of Nuri’s third-stage fuel tank were considered candidate diameters. Although a diameter of 2.6 m offers direct design heritage from Nuri, it was considered excessive for the required upper-stage propellant volume and unsuitable for implementing a compact common bulkhead configuration. Therefore, a 2.0 m fuselage diameter was selected for both stages. The tanks were modeled using ellipsoidal domes with an aspect ratio of 2, following Nuri’s tank geometry heritage. Table 6 presents the tank dimensions.
Table 6.
Summary of preliminary tank dimensions.
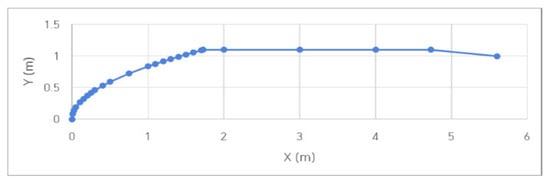
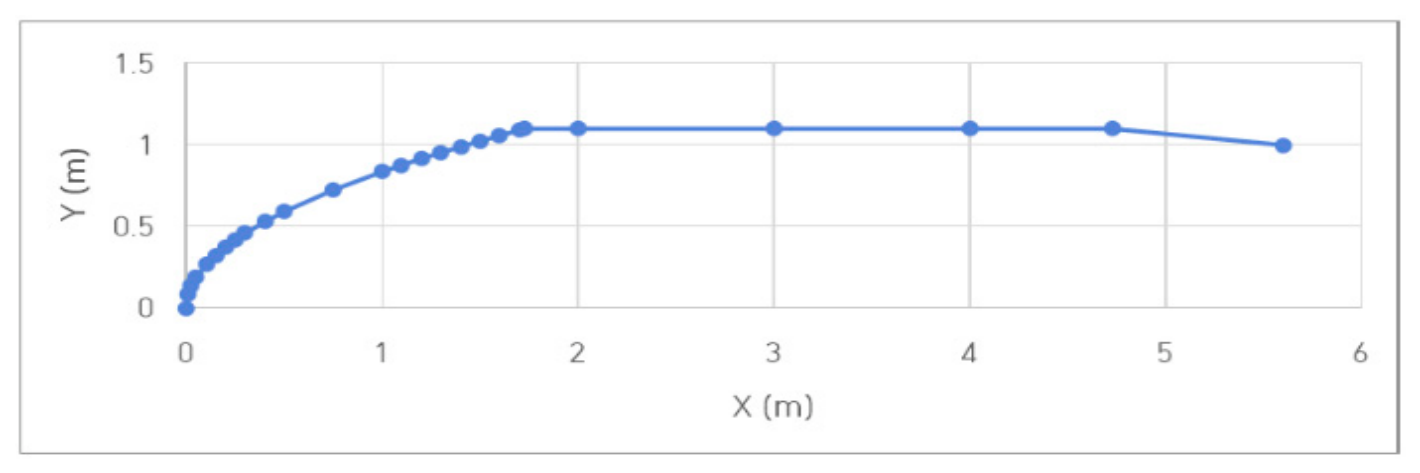
The payload fairing was designed as a hammerhead-type configuration to accommodate a 500 kg-class satellite envelope of approximately 1.5 m × 1.5 m × 3.0 m. An ogive nose was used for the fairing. Figure 4 shows the designed faring shape. The interstage length was determined by considering the nozzle length of the second-stage engine, whereas the forward and aft skirt lengths were defined based on the tank dome geometry and component arrangement. For the first-stage aft fuselage, a 2.6 m-diameter configuration derived from Nuri’s second-stage aft fuselage was adopted, because partial protrusion of the turbopump occurred when the 75-tonf-class engine was installed within the 2.0 m diameter fuselage. The 2.0 m fuel tank and 2.6 m aft fuselage were connected using a conical transition section.
Figure 4.
Designed fairing shape.
The resulting launch vehicle had an overall length of 27.87 m and an approximate slenderness ratio of 14. This slenderness value lies within the typical range of slender launch vehicles and indicates that the proposed configuration is reasonable for the conceptual design and MDO analysis. However, detailed controllability, aeroelastic stability, and structural interface analyses should be conducted in subsequent design phases. Figure 5 shows the layout of the launch vehicle configuration, and Table 7 shows the results of the station indicating the length of each component of the launch vehicle.
Figure 5.
Layout of SmallSat-dedicated launch vehicle.
Table 7.
SmallSat-dedicated launch vehicle station.
5. MDO-Based Trajectory Optimization and Structural Mass Estimation
In the launch vehicle design process, various design domains, such as trajectory, aerodynamics, launch vehicle mass, launch vehicle shape, propulsion system performance, and load analysis, mutually affect each other, and multiple iteration processes are required to design a launch vehicle that satisfies the target performance and constraints. The process of combining these domains to derive an optimized design that satisfies requirements and constraints is called the MDO. If this function is utilized during the initial design process of a launch vehicle to perform conceptual design, the feasibility of the design can be assessed rapidly during the early stages of development.
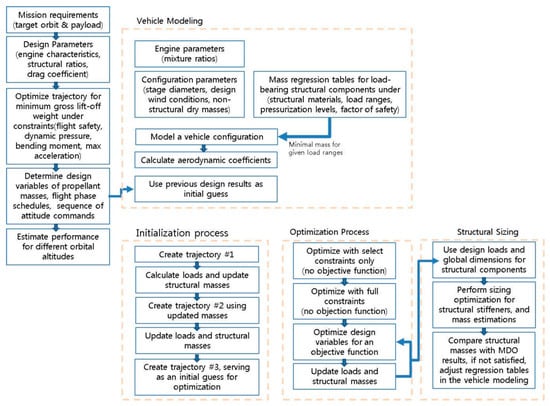
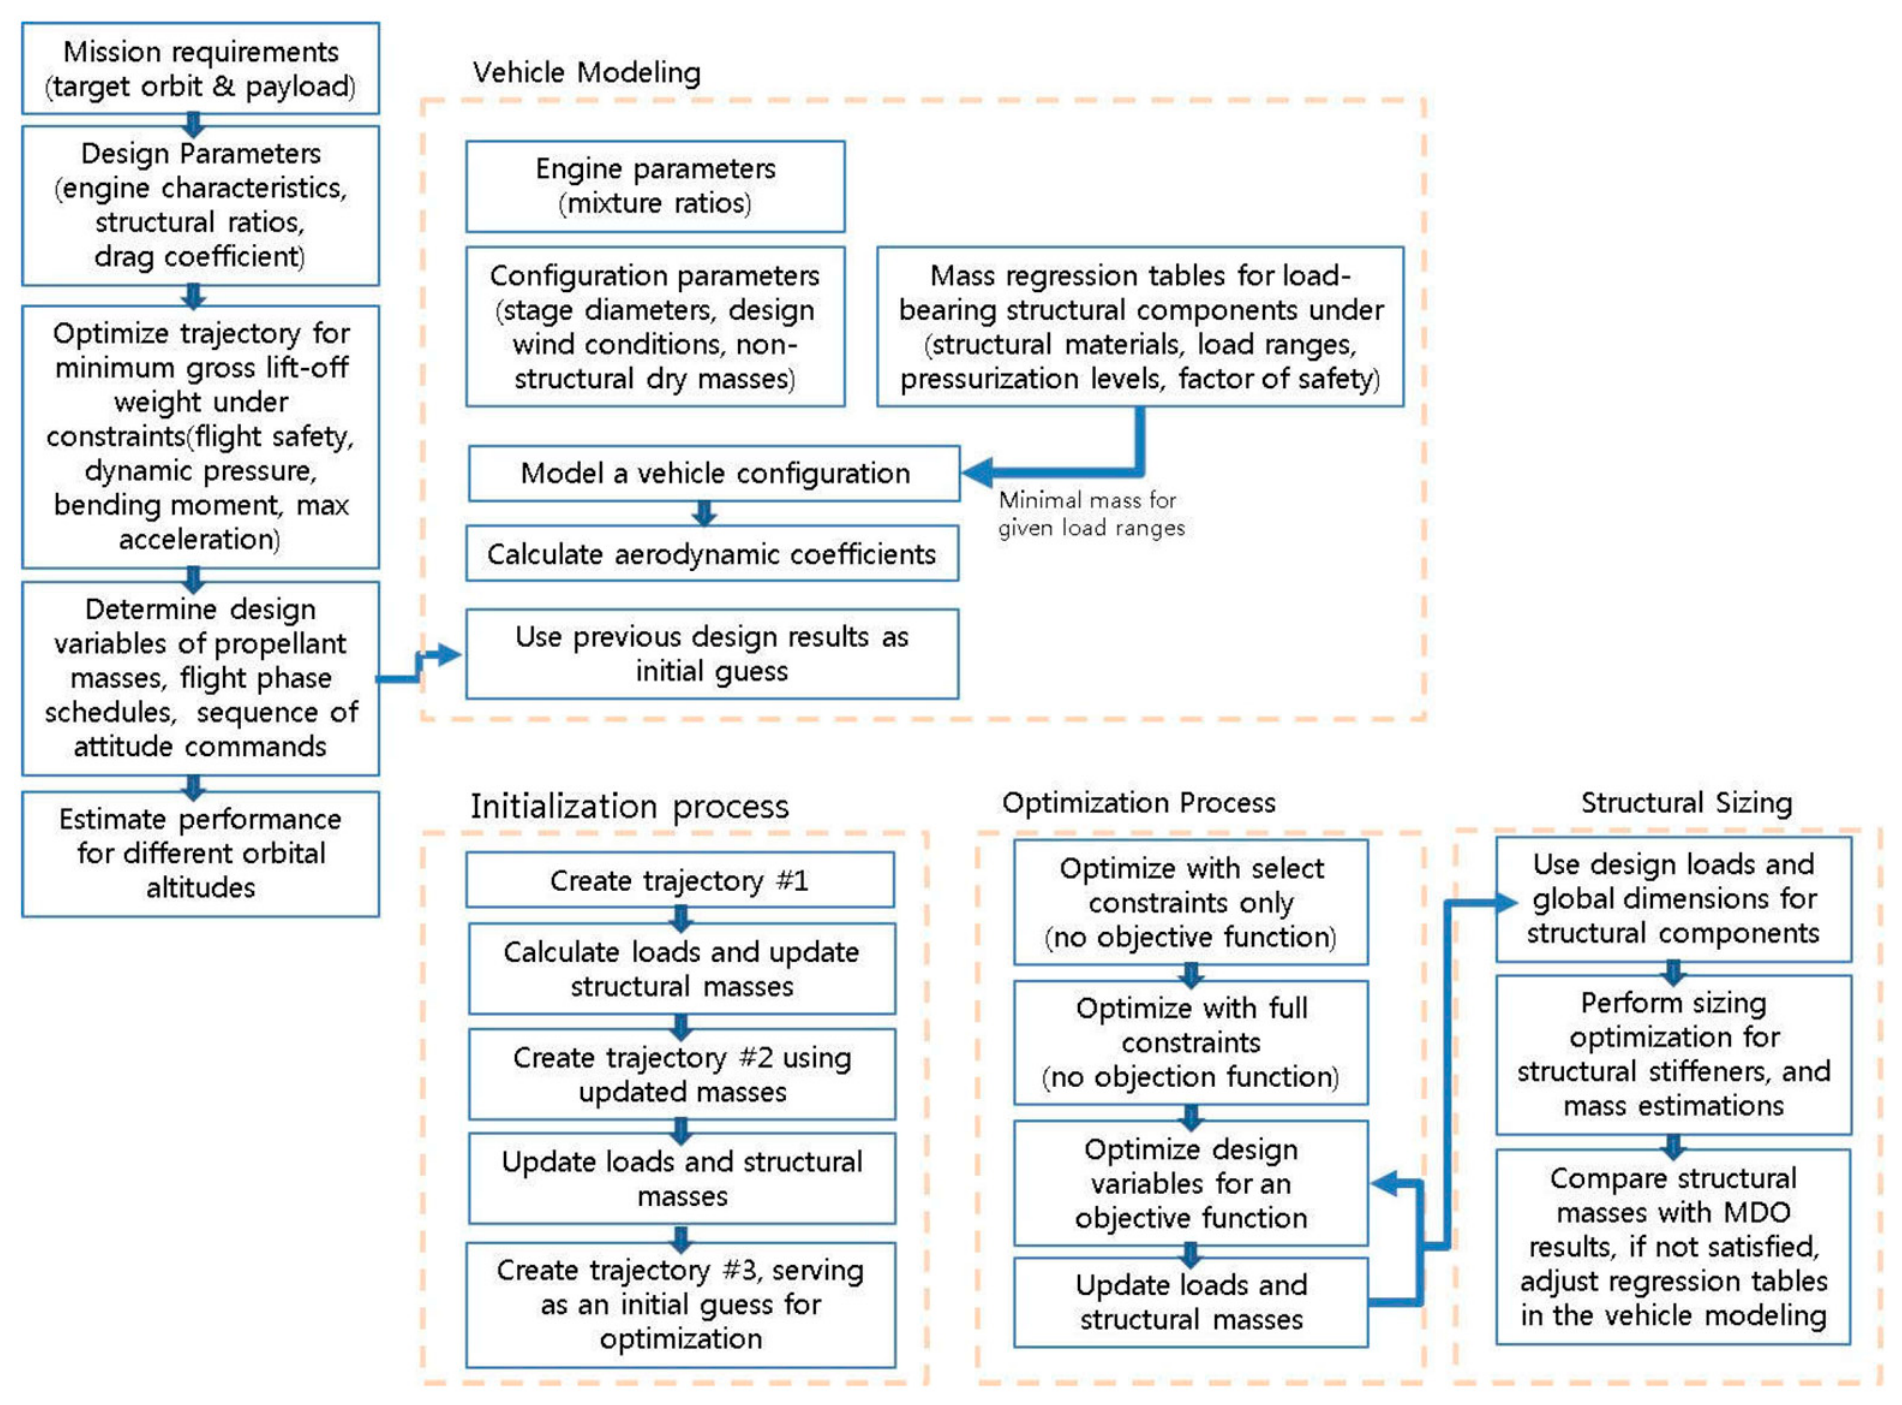
ASTOS, developed by Astos Solutions GmbH, is a graphical environment for simulation and optimization (GESOP)-based software tool for the analysis and optimization of space systems with support for trajectory optimization and MDO in launch vehicle designs [23]. In this study, by utilizing ASTOS’s MDO feature while maintaining the performance of the already-determined propulsion system and the shape of the launch vehicle, we performed the initial conceptual design of the launch vehicle. The design was optimized to satisfy the target performance, constraints, and safety factors. This analysis examined whether a first-stage structural index of 8.6% could be maintained and provided a basis for assessing the launch vehicle at the conceptual design level. Figure 6 shows a schematic of the MDO process in ASTOS [24].
Figure 6.
Process diagram of multidisciplinary design optimization (MDO) in ASTOS (Analysis, Simulation and Trajectory Optimization software for Space applications).
5.1. Mathematical Formulation of the Coupled Analysis
For clarity, the coupled trajectory-optimization and structural-mass estimation process illustrated in Figure 6 is summarized below in an equivalent compact mathematical form. The three-degree-of-freedom point-mass dynamics and vehicle-mass variation used for the trajectory analysis can be expressed in an Earth-fixed rotating reference frame as
where r and v are the position and velocity vectors, m is the vehicle mass, T is the thrust magnitude, is the thrust-direction unit vector, Fa is the aerodynamic-force vector, g is gravitational acceleration, ΩE is Earth’s angular-velocity vector, g0 is standard gravitational acceleration, and Isp is the specific impulse.
Using the state dynamics defined in Equations (16)–(18), the optimal-control problem configured in ASTOS was formulated as
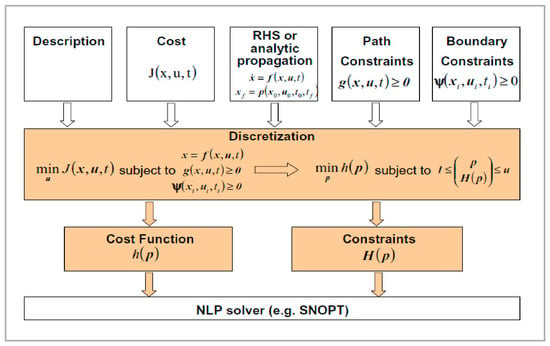
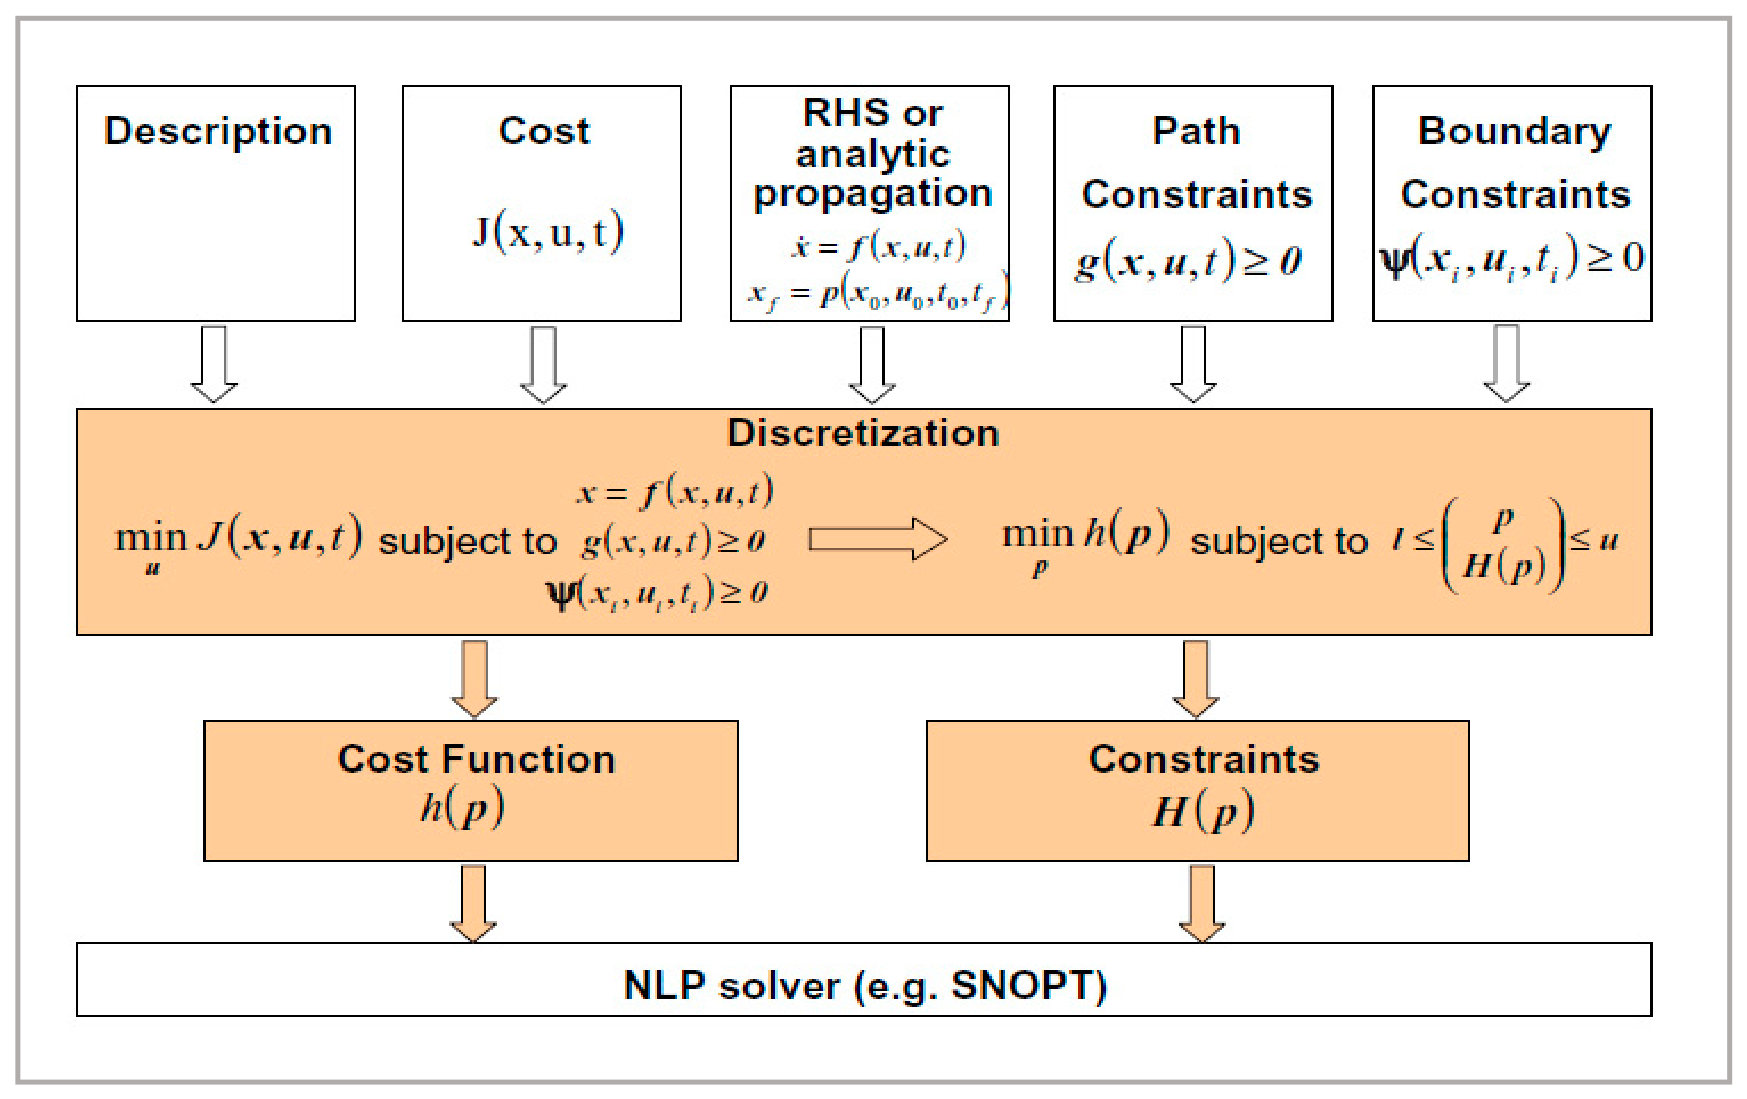
where mpl is the payload mass, x = [rT, vT, m]T is the state vector, u contains the pitch and yaw guidance controls, p represents the fixed vehicle and phase parameters, and z denotes the optimization variables, including payload mass, flight-event times, and guidance parameters. The functions h and c represent the boundary and path/event constraints, respectively. CAMTOS transcribed this problem into a nonlinear programming problem, which was solved using WORHP [25,26,27].
maximize_z mpl
subject to dx/dt = f(x, u, p, t),
h(x(t0), x(tf), p) = 0,
c(x, u, p, t) ≤ 0.
At each MDO iteration, ASTOS recalculated the trajectory-dependent axial forces, bending moments, and pressure loads. The total load-bearing structural mass was then updated using the ODINMER-generated mass-estimation regression tables [24,28], represented compactly as
where is the scalar-valued regression-table mapping for the th structural component; and are the vectors of geometric parameters and material properties, respectively; is the categorical variable identifying the stiffening type; is the vector of structural safety factors; is the vector of trajectory-dependent dimensioning loads; and is the number of load-bearing components. Consequently, the updated structural masses affected the subsequent trajectory and load calculations until the coupled solution converged.
5.2. Vehicle Modeling
The first step of the MDO process involves creating a launch vehicle model in ASTOS using the configuration defined in the preceding sections, including the staging design and station data, together with MERs for the load-bearing structural masses, estimates of the nonload-bearing masses, and wind conditions. In the MDO process, the load-bearing structure mass is estimated using the MER. ASTOS provides the function to generate the MER by pre-calculating the mass of each load-bearing structure based on the shape, material, stiffening type, size, safety factors, and loads using the Optimal Design Investigation Mass Estimation Regression (ODINMER) tool developed by MT Aerospace [28]. The shape information (common bulkhead tank) and size information, such as the diameter and cylinder length, were entered using the results shown in Figure 5 and Table 7. The safety factors required to generate the MER included four safety factors for the yield/ultimate strength and local/global buckling, as well as a mass correction factor. The yield/ultimate strength safety factors were determined to be 1.1 and 1.25, respectively, based on ECSS-E-ST-32-10C, while the safety factors for buckling were determined to be 1.5 and 1.31 based on values from Nuri’s development process [29]. The mass correction factor was set to 1.03 based on the standard value provided in the software manual.
In the case of the propellant tank, which is among the load-bearing structures, the basic technology for developing a common bulkhead propellant tank with an orthogrid reinforcement type using an aluminum-lithium alloy (AL2195) is currently underway in Korea. To apply this technology to the development of SmallSat-dedicated launch vehicles, AL2195 was selected as the tank material, and orthogrid was selected as the structural reinforcement type [30]. For the forward and aft skirts, the same material (AL2024) and reinforcement type (orthogrid) applied to Nuri were adopted to maximize the use of Nuri’s technology. Following the same concept, we applied the fairing, interstage, and engine support frames using the same material and reinforcement type as those used in Nuri. Table 8 shows the material and reinforcement type for each load-bearing component. MERs for the load-bearing components were generated using the ODINMER tool, based on the vehicle geometry information and values listed in Table 7 and Figure 5.
Table 8.
Material and reinforcement type of each load-bearing component.
The nonload-bearing mass of a launch vehicle refers to the mass of all structures other than the load-bearing structures, such as the engine, propellant piping, valves, avionics, high-pressure gas tanks, and reaction control system (RCS). Generally, in the initial design stage of a launch vehicle, the design is carried out through the estimation of the approximate value by referring to the data of existing launch vehicles, and the exact weight is determined through the preliminary design and detailed design stages. In this study, the nonload-bearing masses, including the engine mass, were estimated by applying the concept of component sharing based on the design results of Nuri. Table 9 lists the estimated load-bearing and nonload-bearing masses at each stage.
Table 9.
Estimated mass of load- and nonload-bearing structures.
5.3. Calculation of Aerodynamic Coefficients
The aerodynamic coefficients used during ascent were calculated from the designed launch vehicle geometry using DrNUM, a GPU-accelerated computational fluid dynamics (CFD) solver jointly developed by enGits GmbH and numrax GmbH [31]. Its integration with ASTOS enables the vehicle outer-mold-line geometry to be imported and the resulting aerodynamic coefficient tables to be applied directly in the vehicle-design process.
DrNUM solves the compressible viscous Navier–Stokes equations using a finite-volume formulation on Cartesian grids with immersed boundaries. For the CFD analyses conducted in this study, the Smagorinsky-IBL large-eddy simulation model (Cs=0.05) and a calorically perfect ideal-gas model for air were employed, with temperature-dependent viscosity represented by Sutherland’s law. The governing equations were advanced using a three-stage explicit Runge–Kutta scheme with local time stepping, a nominal CFL number of 1.5, the MULTISPEED-RB flux scheme, and MinMod reconstruction. The computational mesh generated for the present vehicle geometry comprised ten nested resolution levels ranging from 0.026 to 13.312 m, with a refinement ratio of two. For the full-domain cases, the mesh contained 46,404,480 cells in 55 patches, including overlap cells. When permitted by the flow symmetry of the calculation condition, half- and quarter-domain meshes containing 23,202,240 and 11,601,120 cells, respectively, were used. The cylindrical computational domain adopted for the present simulations had both an axial length and a diameter of approximately 557.4 m, corresponding to approximately 20 vehicle lengths. The boundary conditions used in these simulations comprised supersonic inflow and outflow conditions, a slip condition on the outer cylindrical boundary, and an immersed turbulent-wall condition on the vehicle surface. The finest resolution adopted in this study provided approximately 100 cells across the maximum vehicle diameter and is categorized as a fine mesh in the DrNUM modeling guidance. Given the conceptual-design scope of the present study, a formal multi-grid independence assessment was not performed; the associated discretization uncertainty is acknowledged as a limitation to be addressed in subsequent detailed aerodynamic validation.
Convergence was assessed from the stabilization of the surface-integrated pressure and skin-friction force histories, which were sampled at intervals of approximately 100 nondimensional time units over a monitoring window of 2000 nondimensional time units, corresponding to approximately 20 samples. For the representative case at M = 4.5, α = 5°, and β = 5°, the changes in the mean axial and resultant normal force coefficients between the final two monitoring windows were 0.154% and 0.008%, respectively, indicating statistically stable force histories. The aerodynamic database developed in this study comprised 42 CFD cases at Mach numbers of 0.3, 0.5, 0.9, 1.1, 2.0, 3.0, and 4.5; angles of attack of 0° and 5°; and sideslip angles of −5°, 0°, and 5°. ASTOS applied multidimensional linear interpolation within the tabulated range and retained the nearest boundary value outside this range without extrapolation or additional coefficient scaling. The angle of attack exceeded 5° only after the dynamic pressure had decreased below approximately 0.43 kPa, corresponding to approximately 1.5% of its maximum value of 28.6 kPa. Therefore, retaining the 5° coefficients during this low-dynamic-pressure interval was considered to have a limited effect on the integrated trajectory and structural-load results.
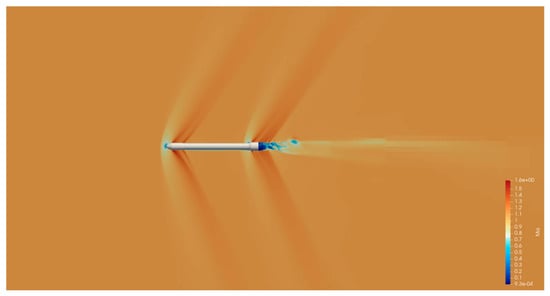
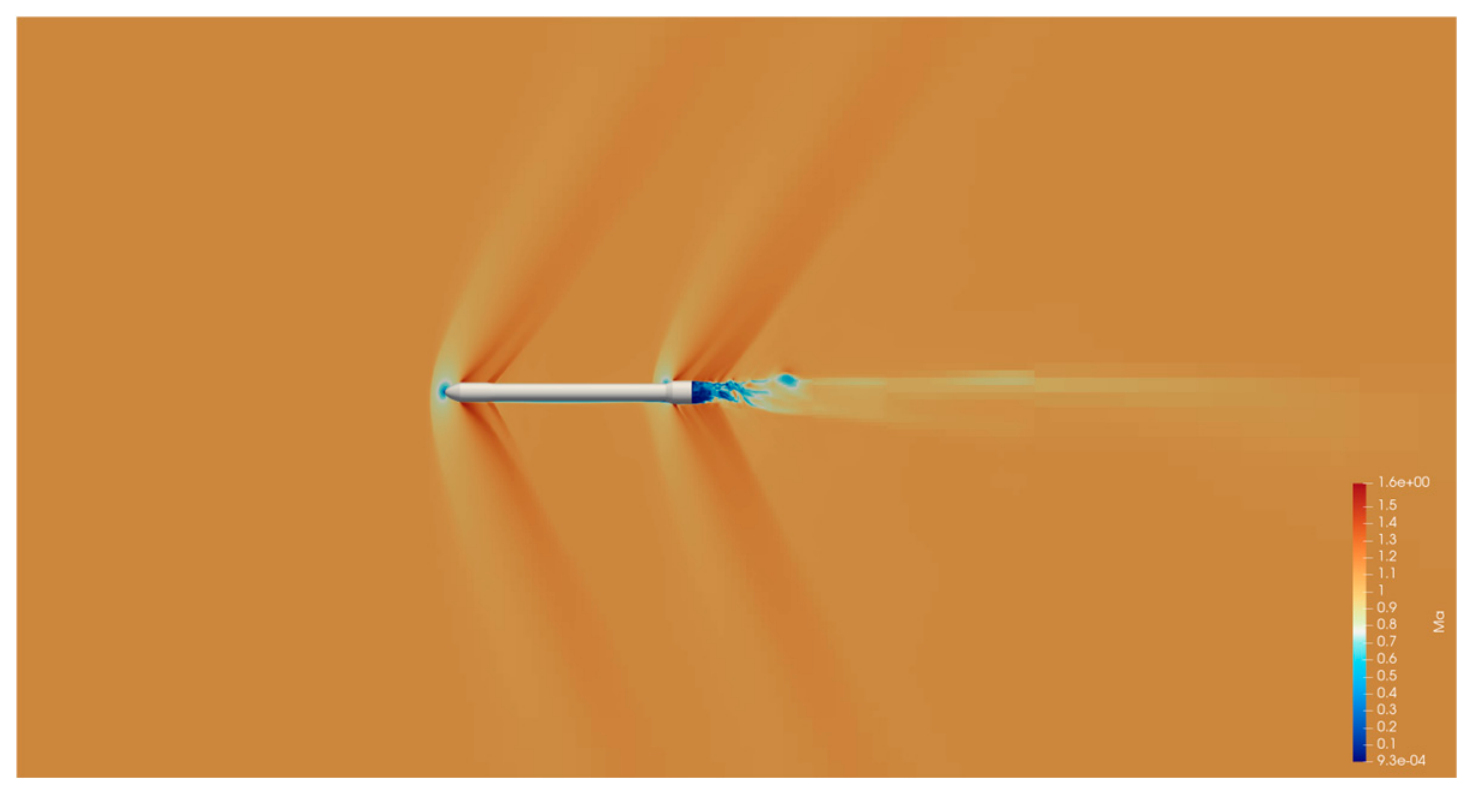
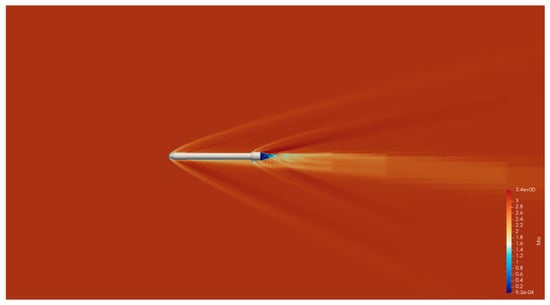
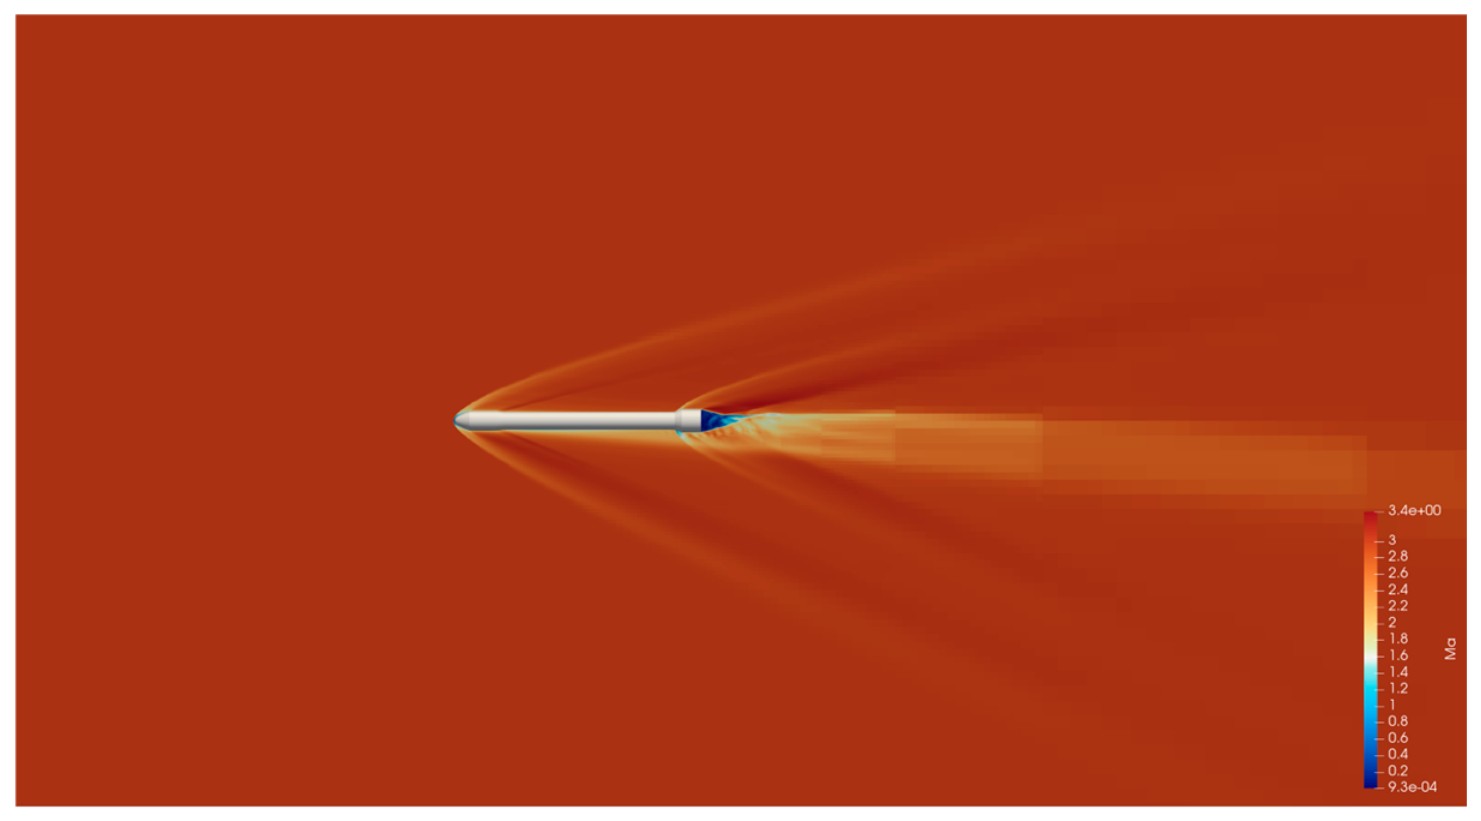
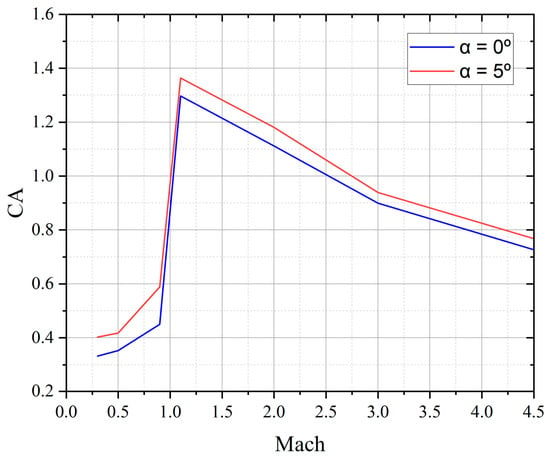
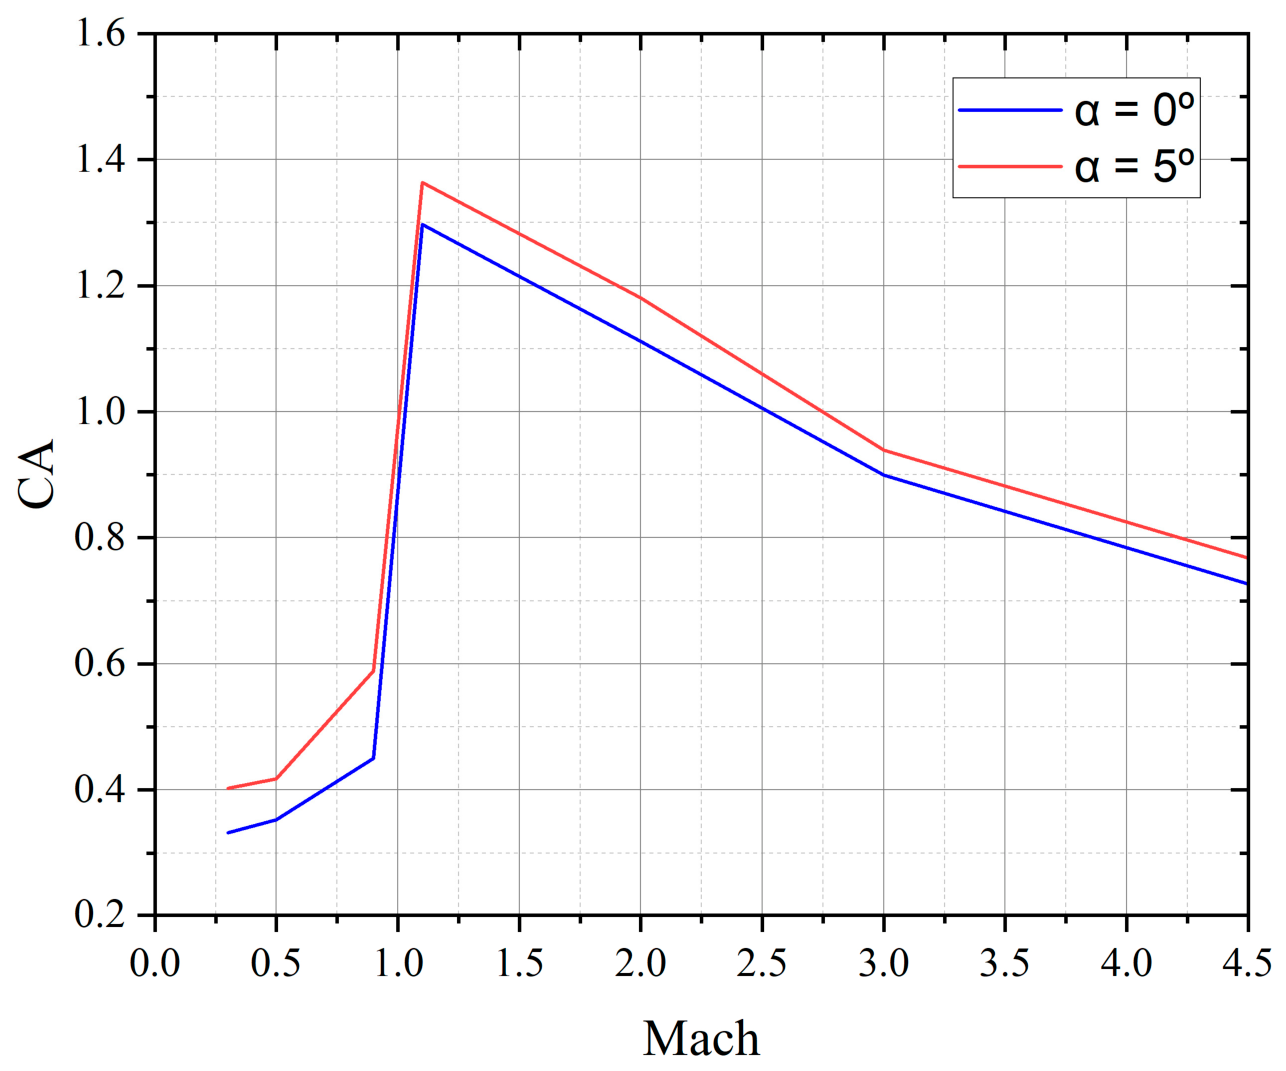
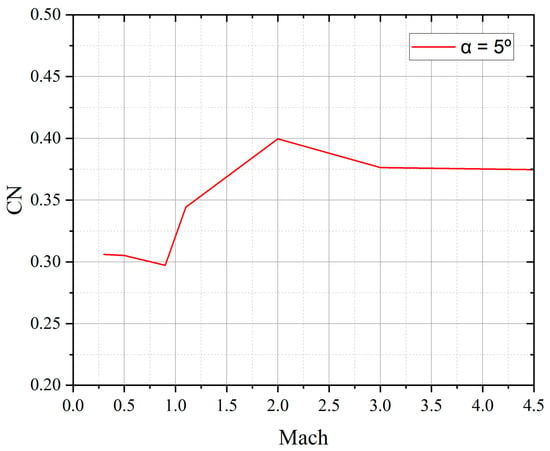
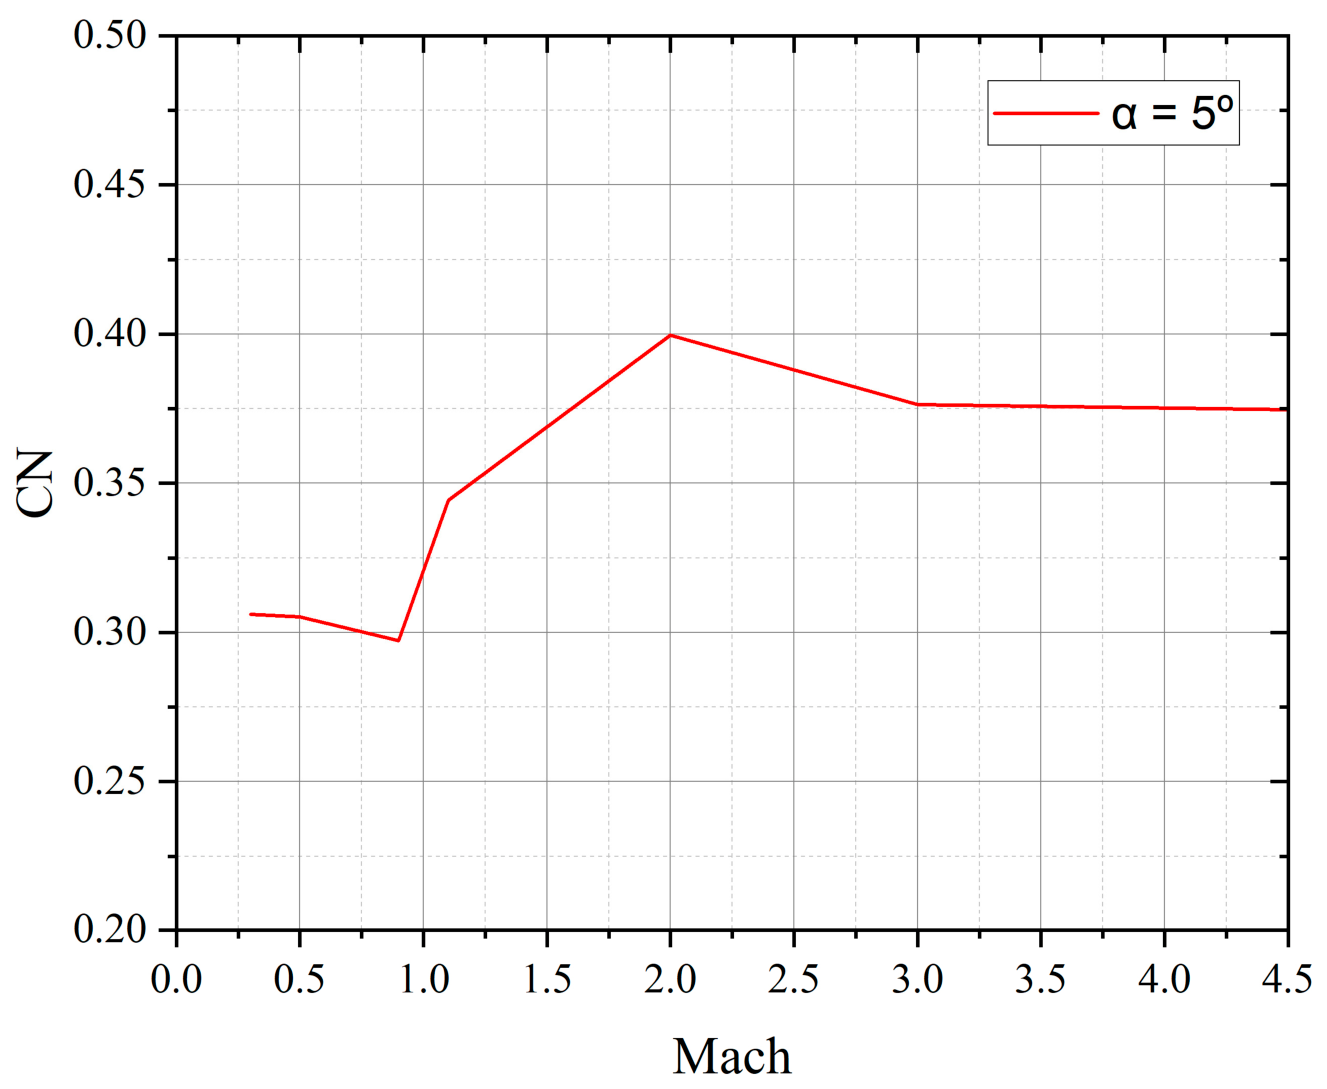
Figure 7 and Figure 8 present the Mach-number contours at (M = 1.1) and (M = 3.0), respectively, both at an angle of attack of 5°. Figure 9 and Figure 10 present the axial force coefficient (CA) and normal force coefficient (CN), respectively, as functions of Mach number for the evaluated angles of attack.
Figure 7.
Mach contour at Ma = 1.1 and angle of attack of 5°.
Figure 8.
Mach contour at Ma = 3.0 and an angle of attack of 5°.
Figure 9.
Calculated axial force coefficient (CA) as a function of the Mach number.
Figure 10.
Calculated normal force coefficient (CN) as a function of the Mach number at α = 5°.
5.4. Initial Process
The initial process of the MDO involves the generation of the initial trajectory of the launch vehicle and estimation of the initial mass of the load-bearing structure by calculating the loads applied to the body during ground operations and atmospheric flight. The initial trajectory was designed in the order of takeoff–kick turn–gravity turn–guidance flight phases according to the sequence of a typical two-stage launch vehicle, and an L-coordinate system was used in the trajectory design [15]. The time and pitch angle change information for the take-off and kick-turn phases in the initial trajectory were obtained by referring to Nuri’s flight data [20]. The duration for the gravity turn and subsequent phases was set by referring to the burn times of each stage engine, listed in Table 5, and the pitch and yaw angle change information was set such that at the end of the second-stage engine burn, the altitude was 500 km, the flight path angle was 0°, and the speed was 7.62 km/s. The upper-atmospheric wind conditions above the Naro Space Center were incorporated into the trajectory model to account for wind-induced flight loads. After the initial trajectory was designed, the load applied to the load-bearing structure during flight in the initial trajectory was calculated using the load analysis function supported by ASTOS. The mass of the load-bearing structure was estimated using the MER based on the load value.
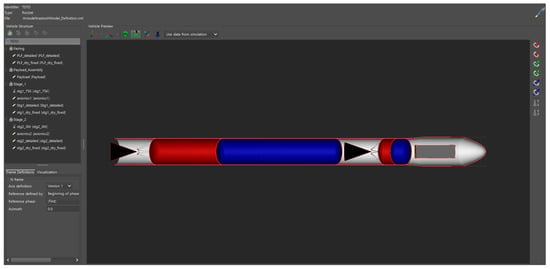
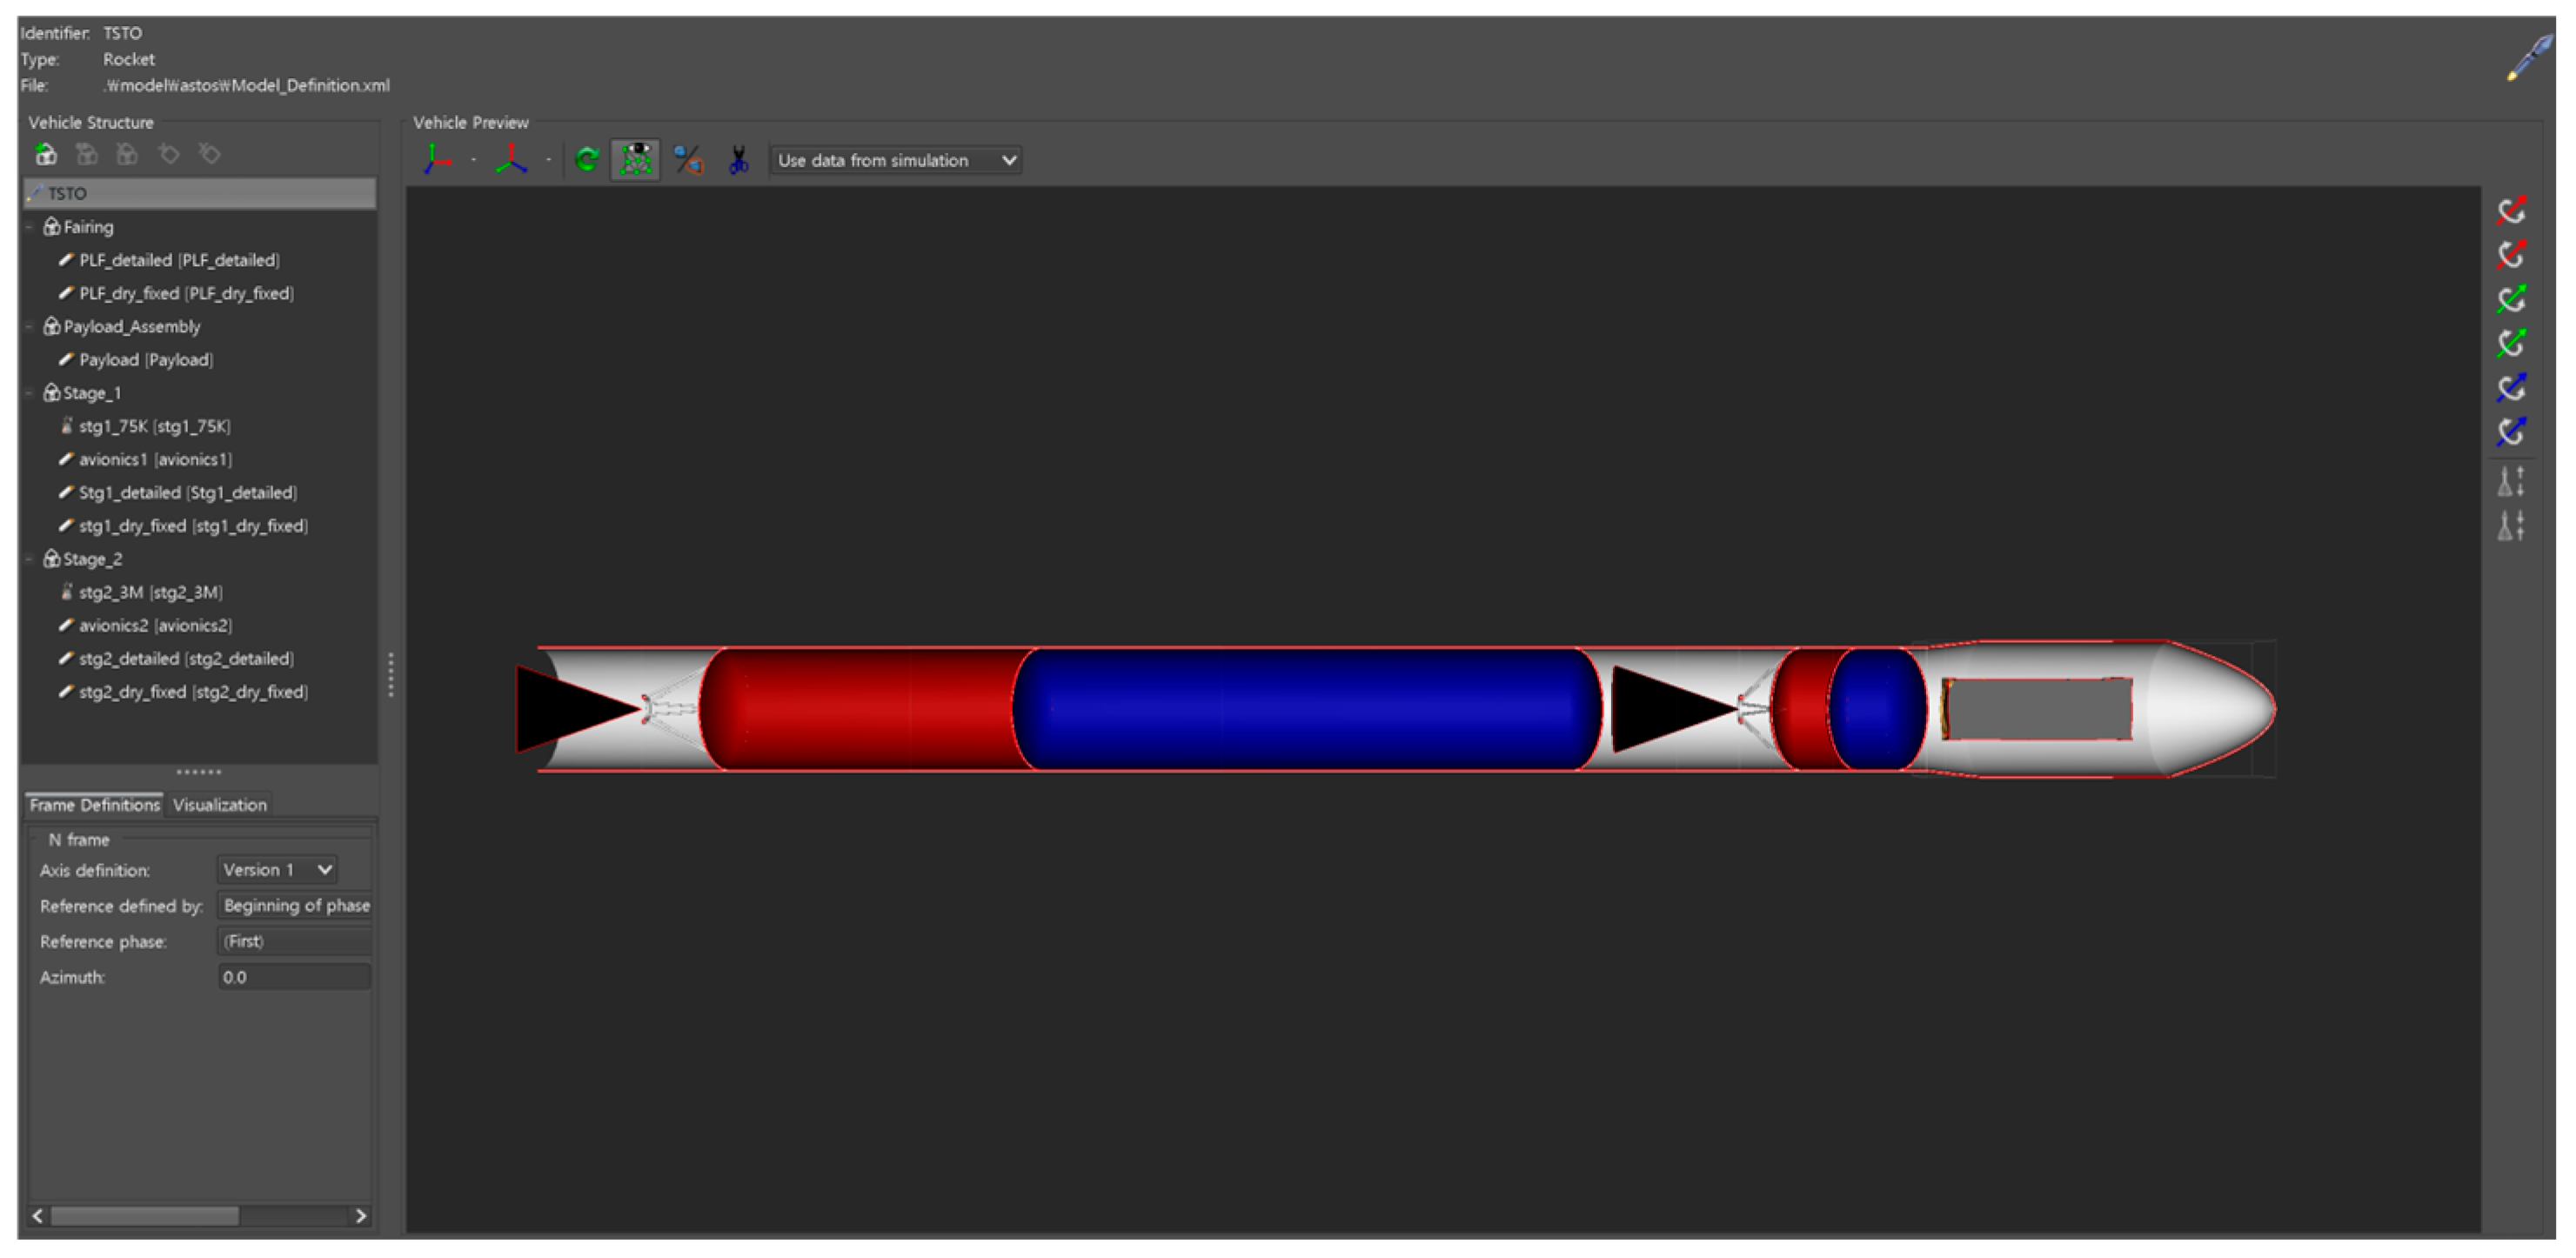
As the mass of the launch vehicle changed, the initial trajectory was updated to regenerate a trajectory that met the target performance. Because the flight load also changed owing to the trajectory variation, a load analysis was performed again to update the mass of the launch vehicle. This process was repeated one more time to determine the reference trajectory and launch vehicle mass for optimization. Figure 11 shows the shape of the launch vehicle in the ASTOS platform generated through the initial process. The sequence of the generated reference trajectory and the input maneuver information for each phase are described in Table 10 below.
Figure 11.
Shape of the launch vehicle generated through the initial process in ASTOS (Analysis, Simulation and Trajectory Optimization software for Space applications).
Table 10.
Design variables, initial guidance profiles, and bounds for trajectory optimization.
5.5. Design Optimization Results
The optimization process in ASTOS’s MDO can be summarized as the process of finding design parameters that satisfy the constraints using an optimization solver based on the initial trajectory and vehicle mass information generated through the initial process. This process was performed based on the GESOP and is represented conceptually in Figure 12 [25].
Figure 12.
Schematic of the Graphical Environment for Simulation and Optimization (GESOP) framework used in ASTOS.
The optimization method used was CAMTOS supported by ASTOS [26], and WORHP was used as the optimization solver [27]. With the velocity-increment distribution, propellant masses, vehicle geometry, aerodynamic database, propulsion performance, and nonload-bearing masses fixed from the preceding design steps, the MDO problem was formulated as a coupled trajectory-optimization and structural-mass update problem rather than a full vehicle-sizing optimization problem. During the iterative MDO process, the flight loads were recalculated for the updated ascent trajectory and used with the ODINMER-generated MER tables to update the masses of the load-bearing components. Accordingly, the design variables were limited to the payload mass, key flight event times, and pitch and yaw guidance parameters, whereas the objective function was defined to maximize the payload mass delivered to the target orbit. Table 10 presents the design variables used in the trajectory optimization.
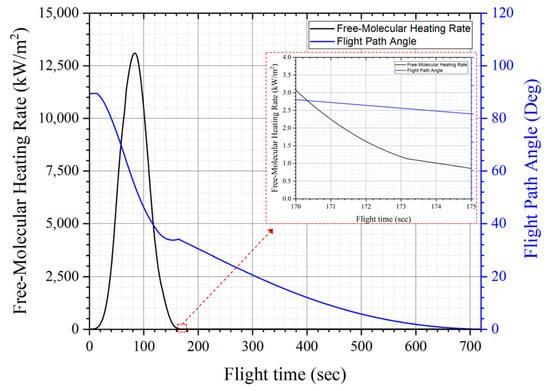
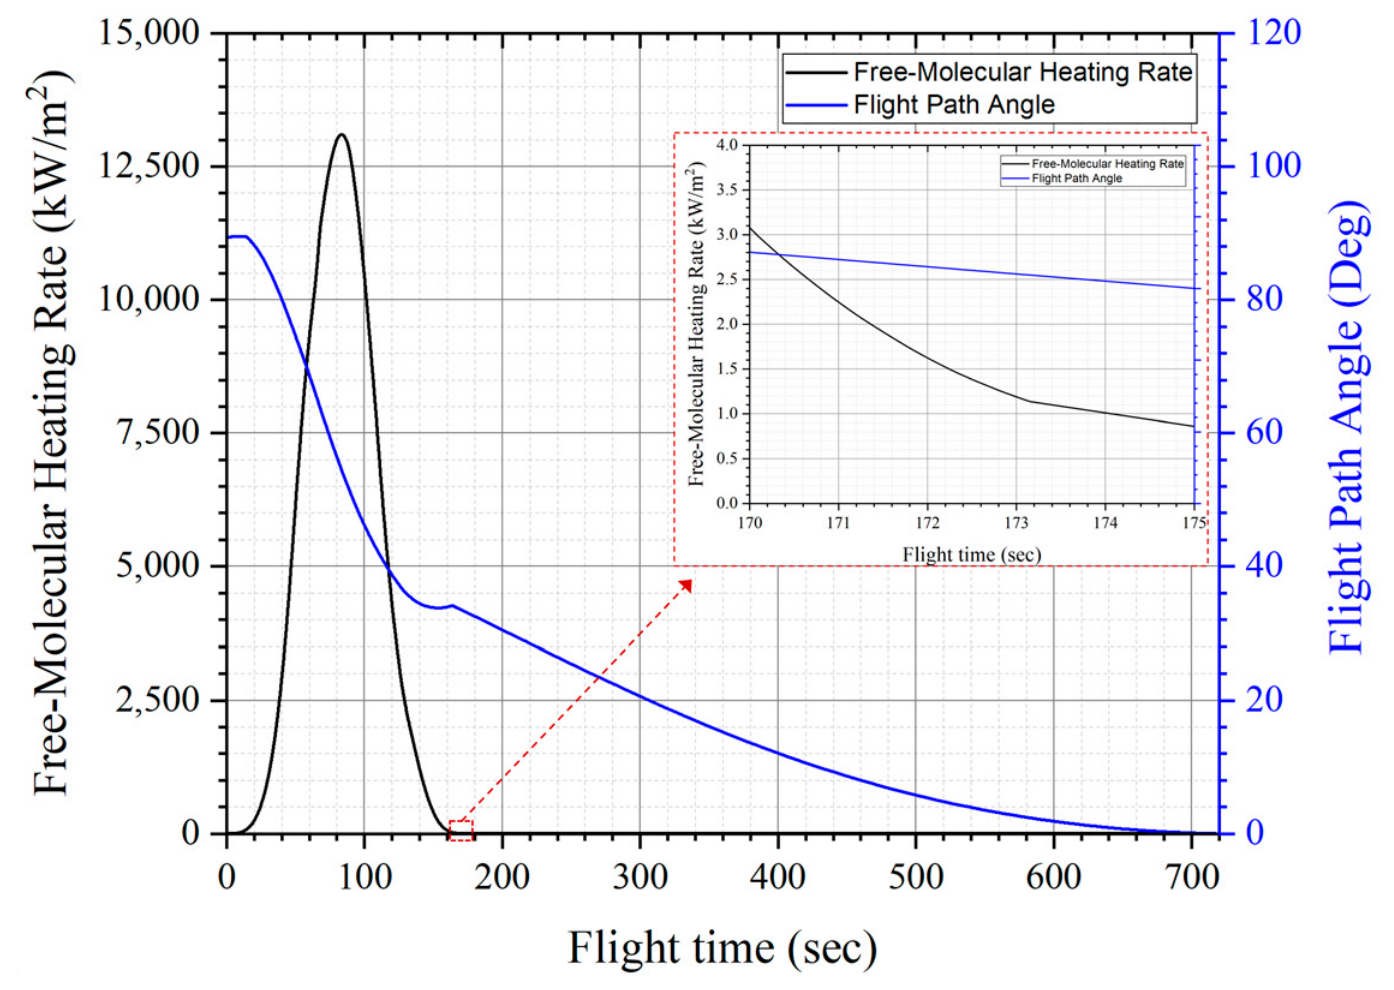
Optimization was performed under the mission, trajectory, thermal, and range-safety constraints listed in Table 11. Constraints 3 and 4 were imposed by the launch site and geopolitical conditions discussed in Section 2.1, whereas Constraint 6 defined the end of the gravity-turn phase based on a low dynamic pressure threshold of 2 kPa [32]. Constraint 7 required payload-fairing jettison to occur only after the predicted free-molecular heating rate (), decreased to or below 1.135 kW/m2. This quantity was evaluated using the Free Stream Enthalpy model implemented in ASTOS as
where denote the atmospheric density, air-relative velocity, and dynamic pressure, respectively. The calculated quantity represents the incident free-stream kinetic-energy flux and is used here as a free-molecular-heating indicator rather than as a detailed prediction of local convective wall heating or internal payload temperature. The threshold of 1.135 kW/m2 was adopted from the Alpha Payload User’s Guide as a preliminary fairing-separation criterion rather than as a vehicle-specific thermal qualification limit [21].
Table 11.
Constraints applied for trajectory optimization.
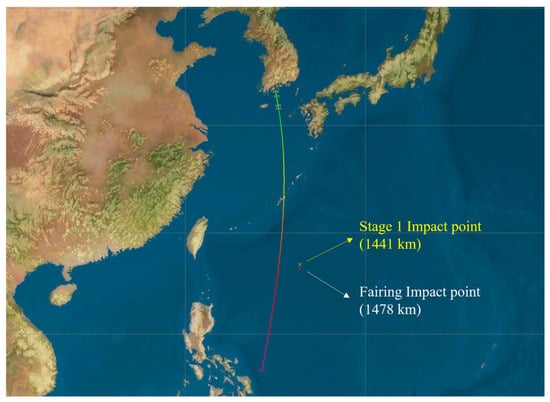
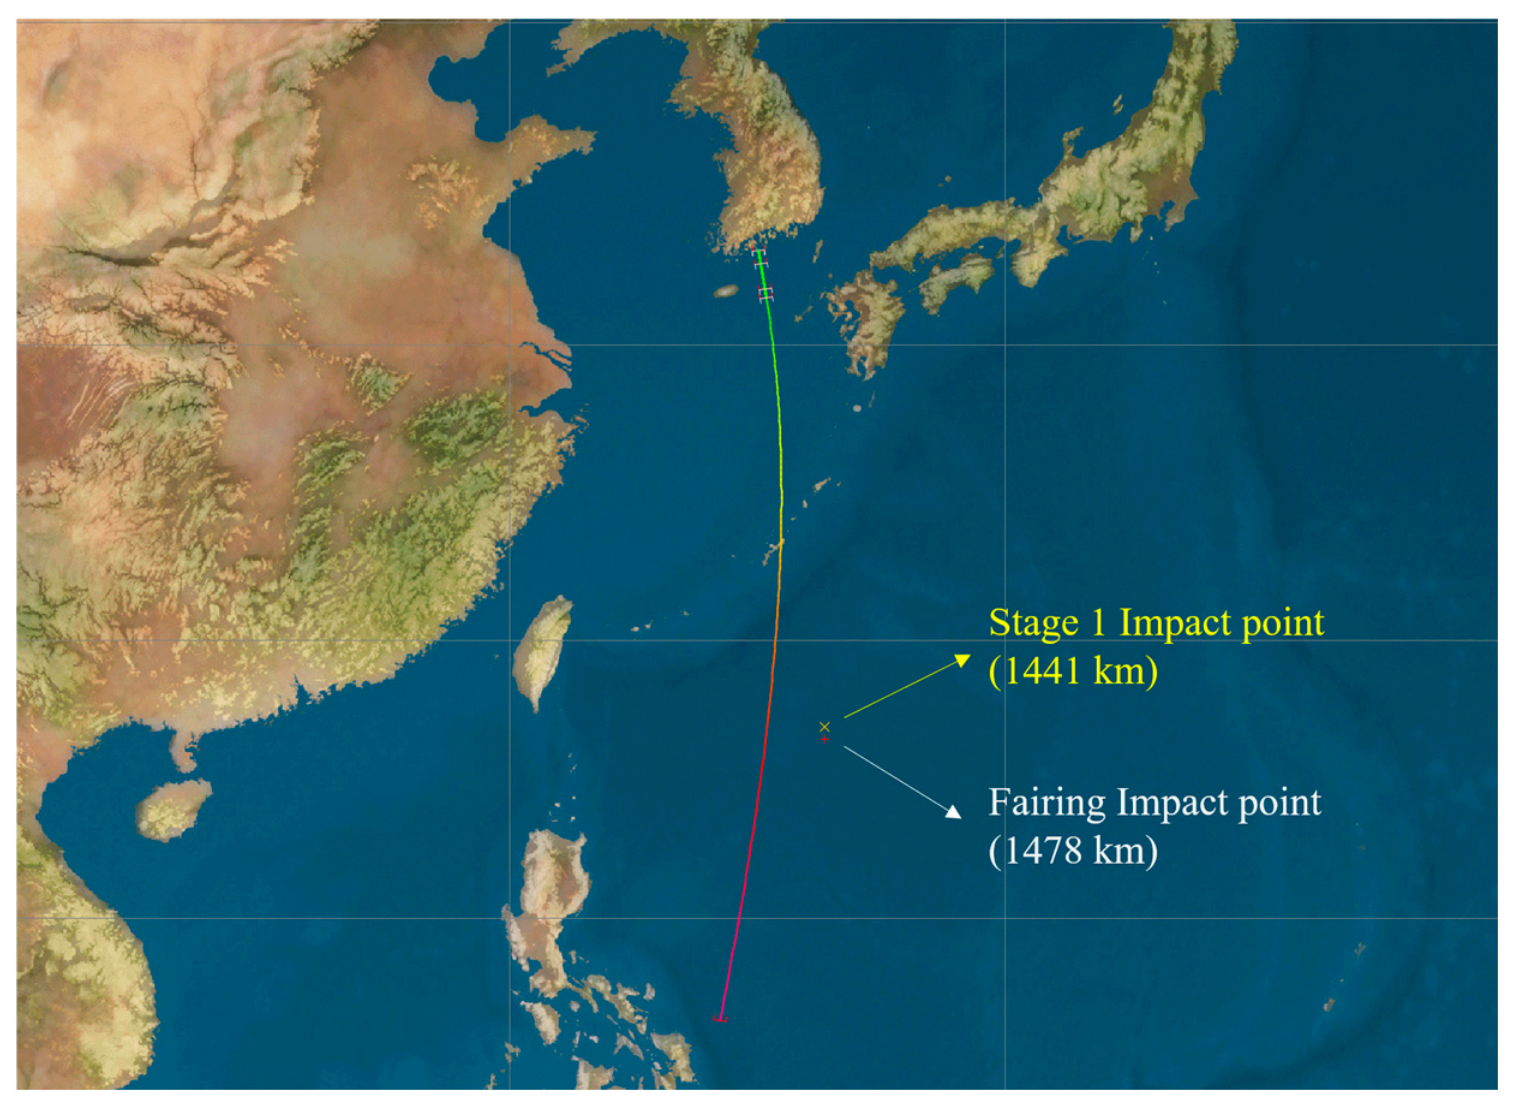
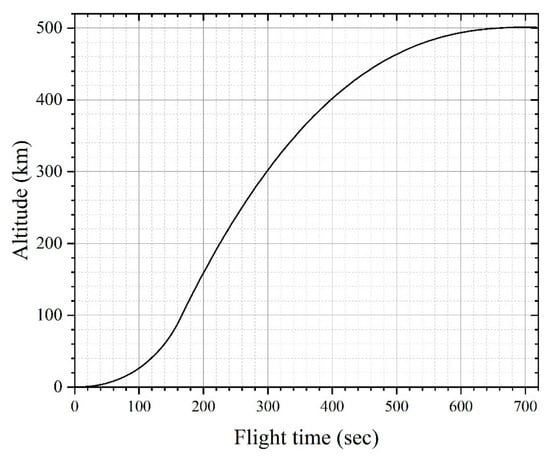
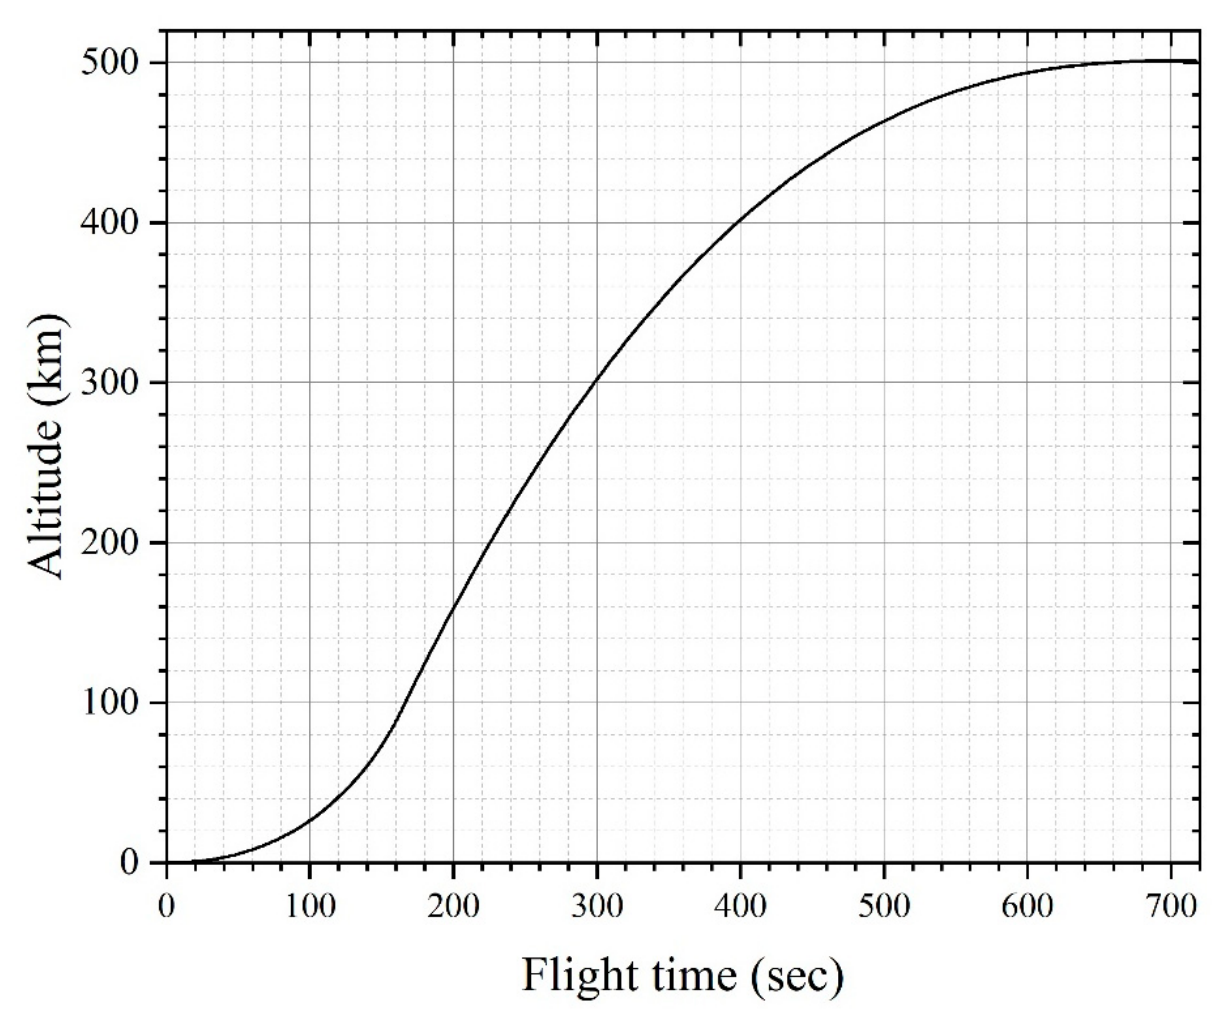
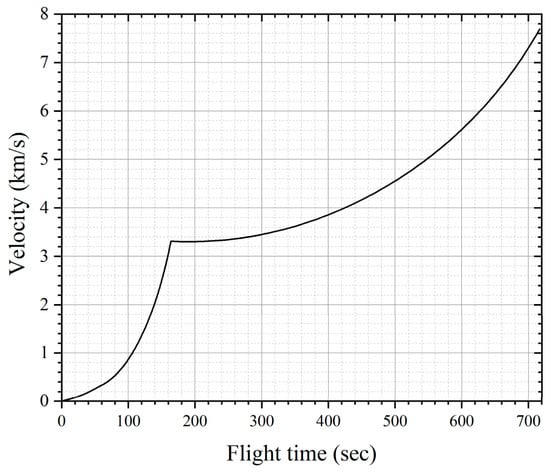
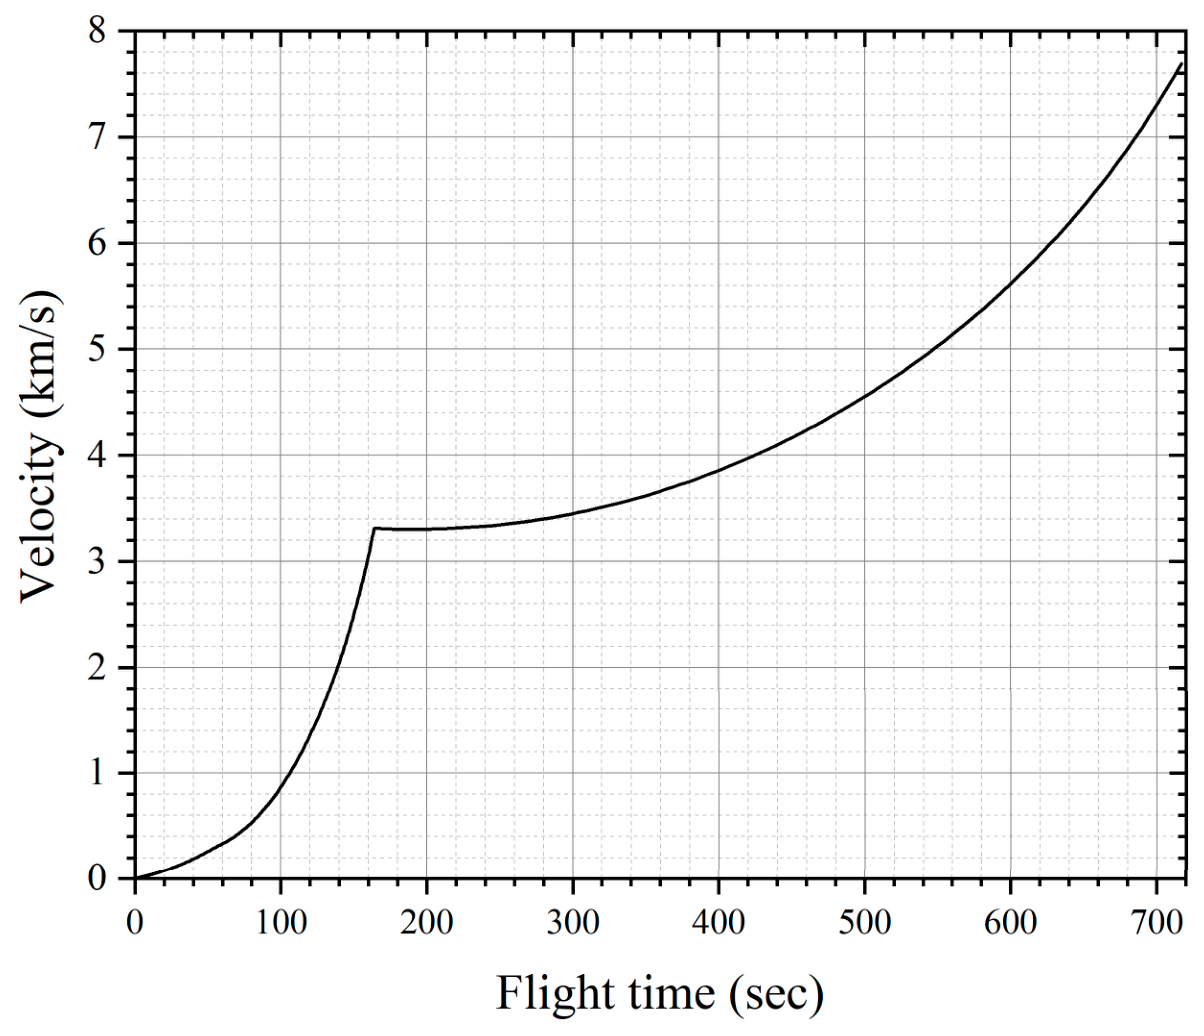
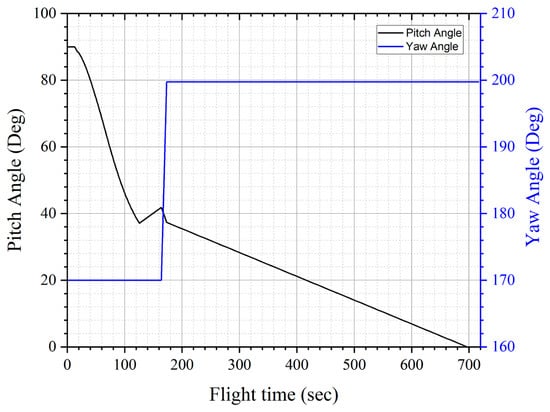
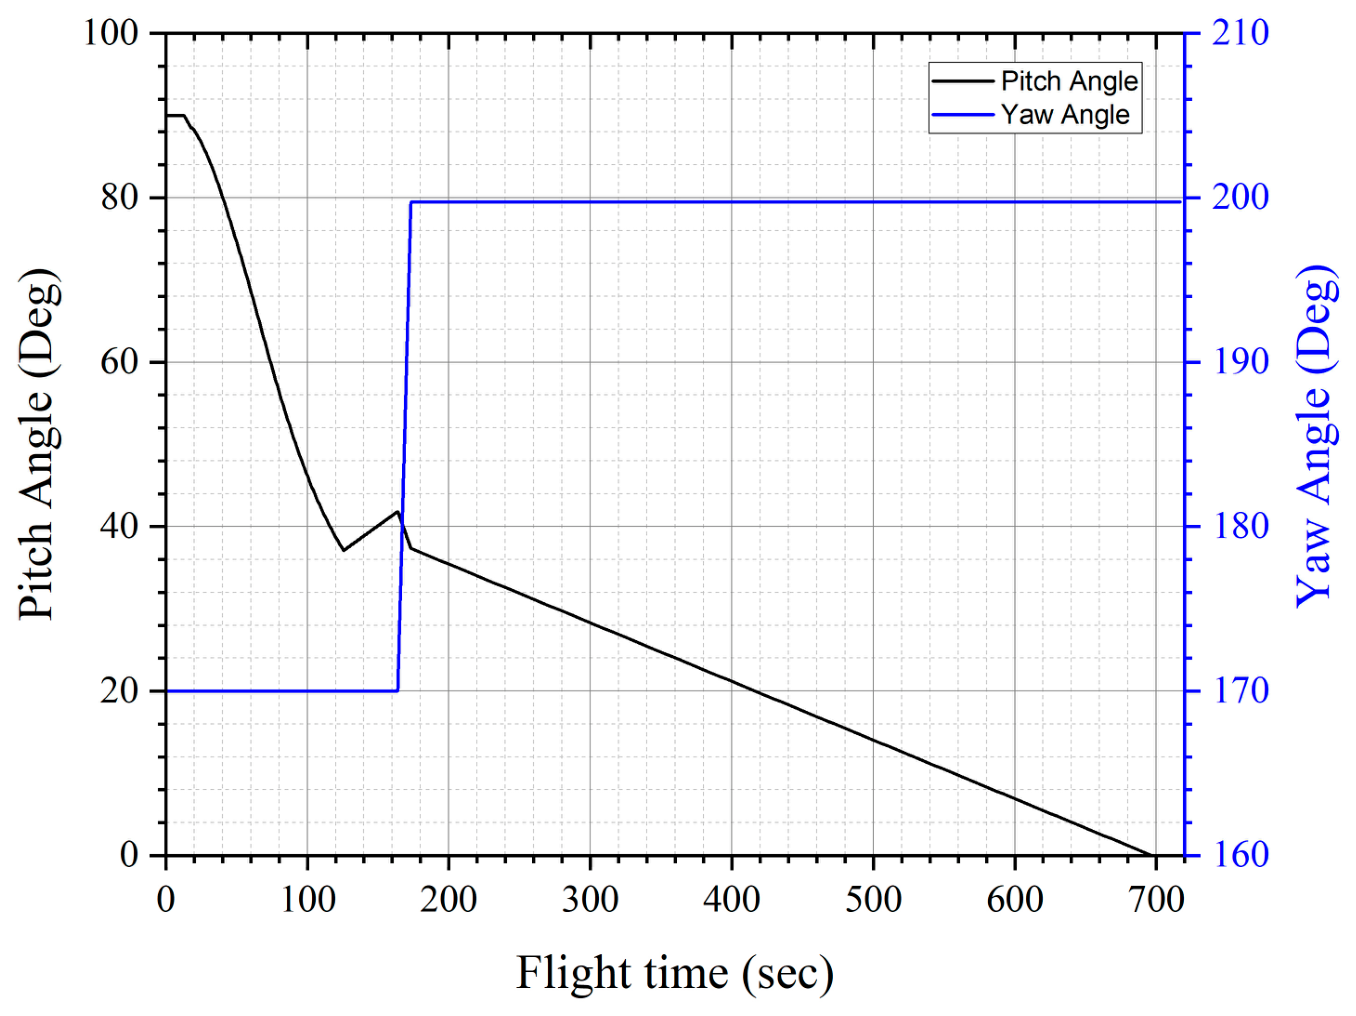
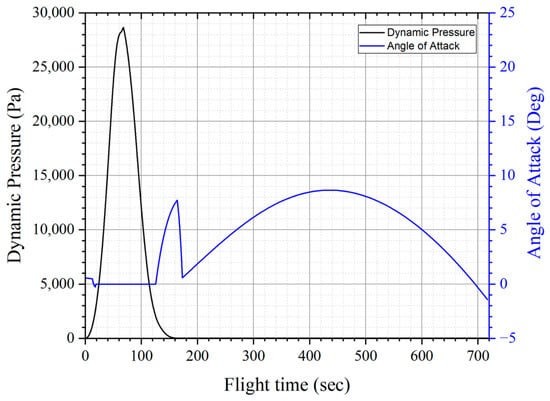
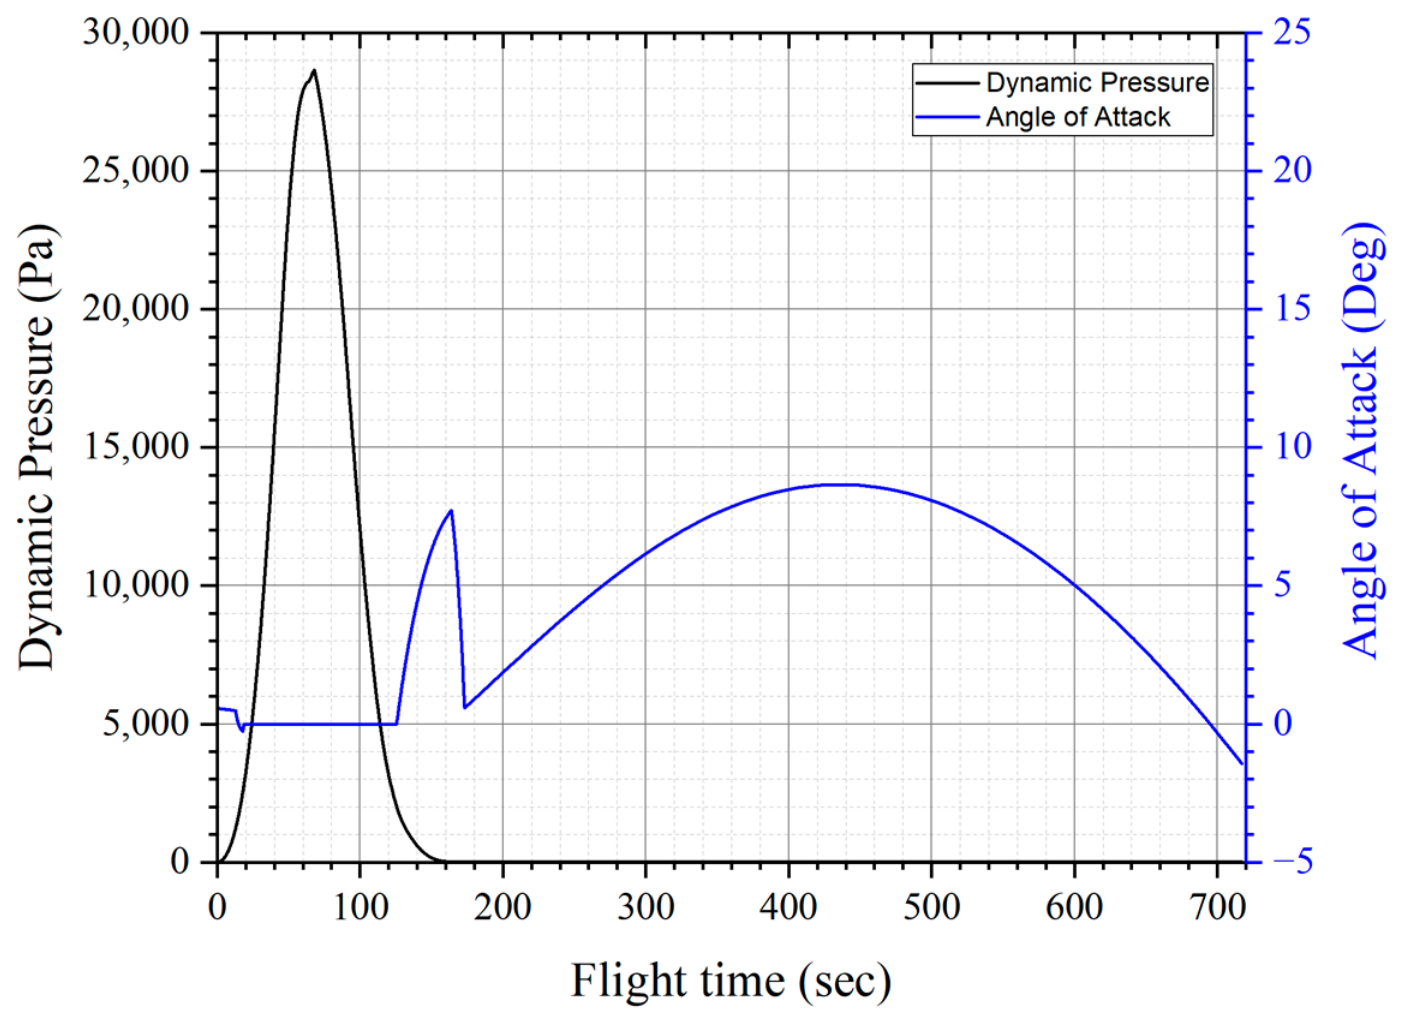
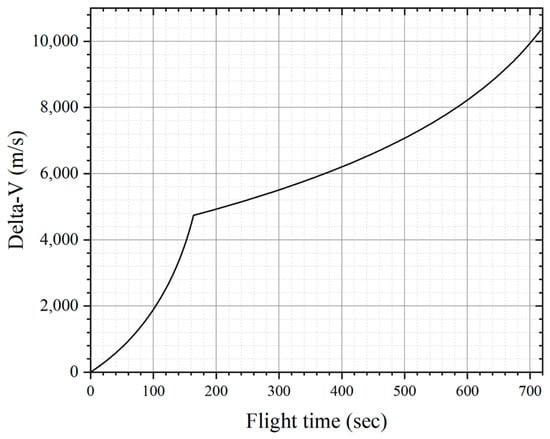
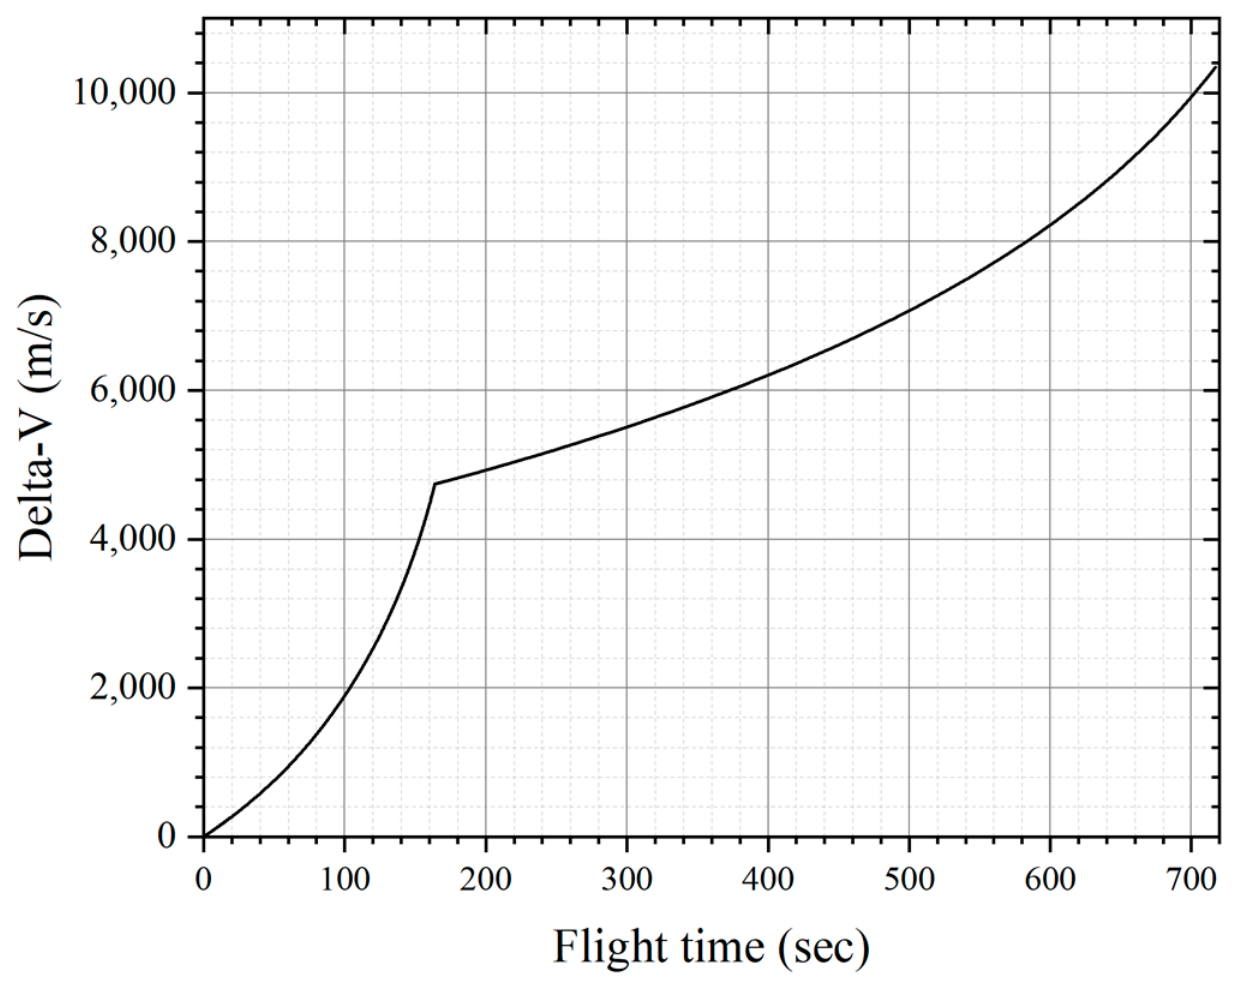
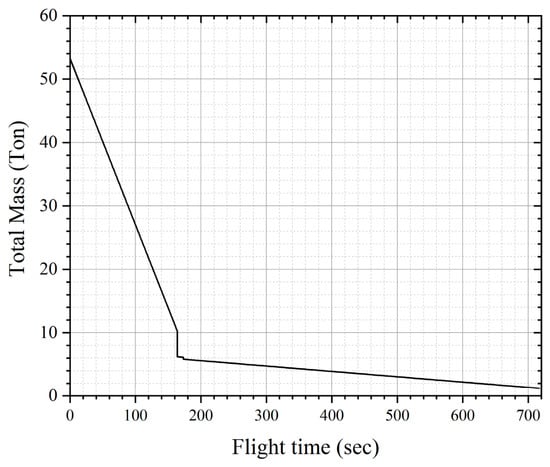
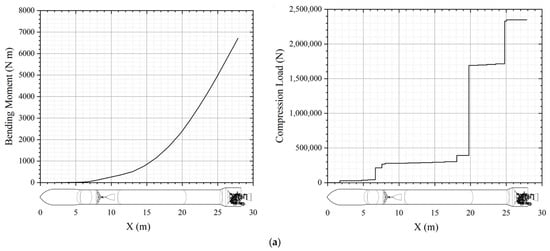
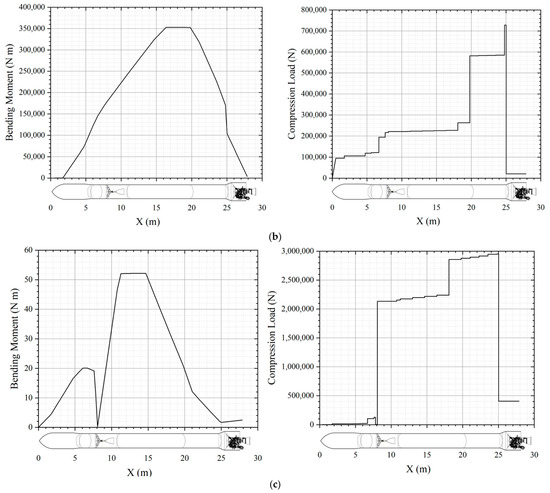
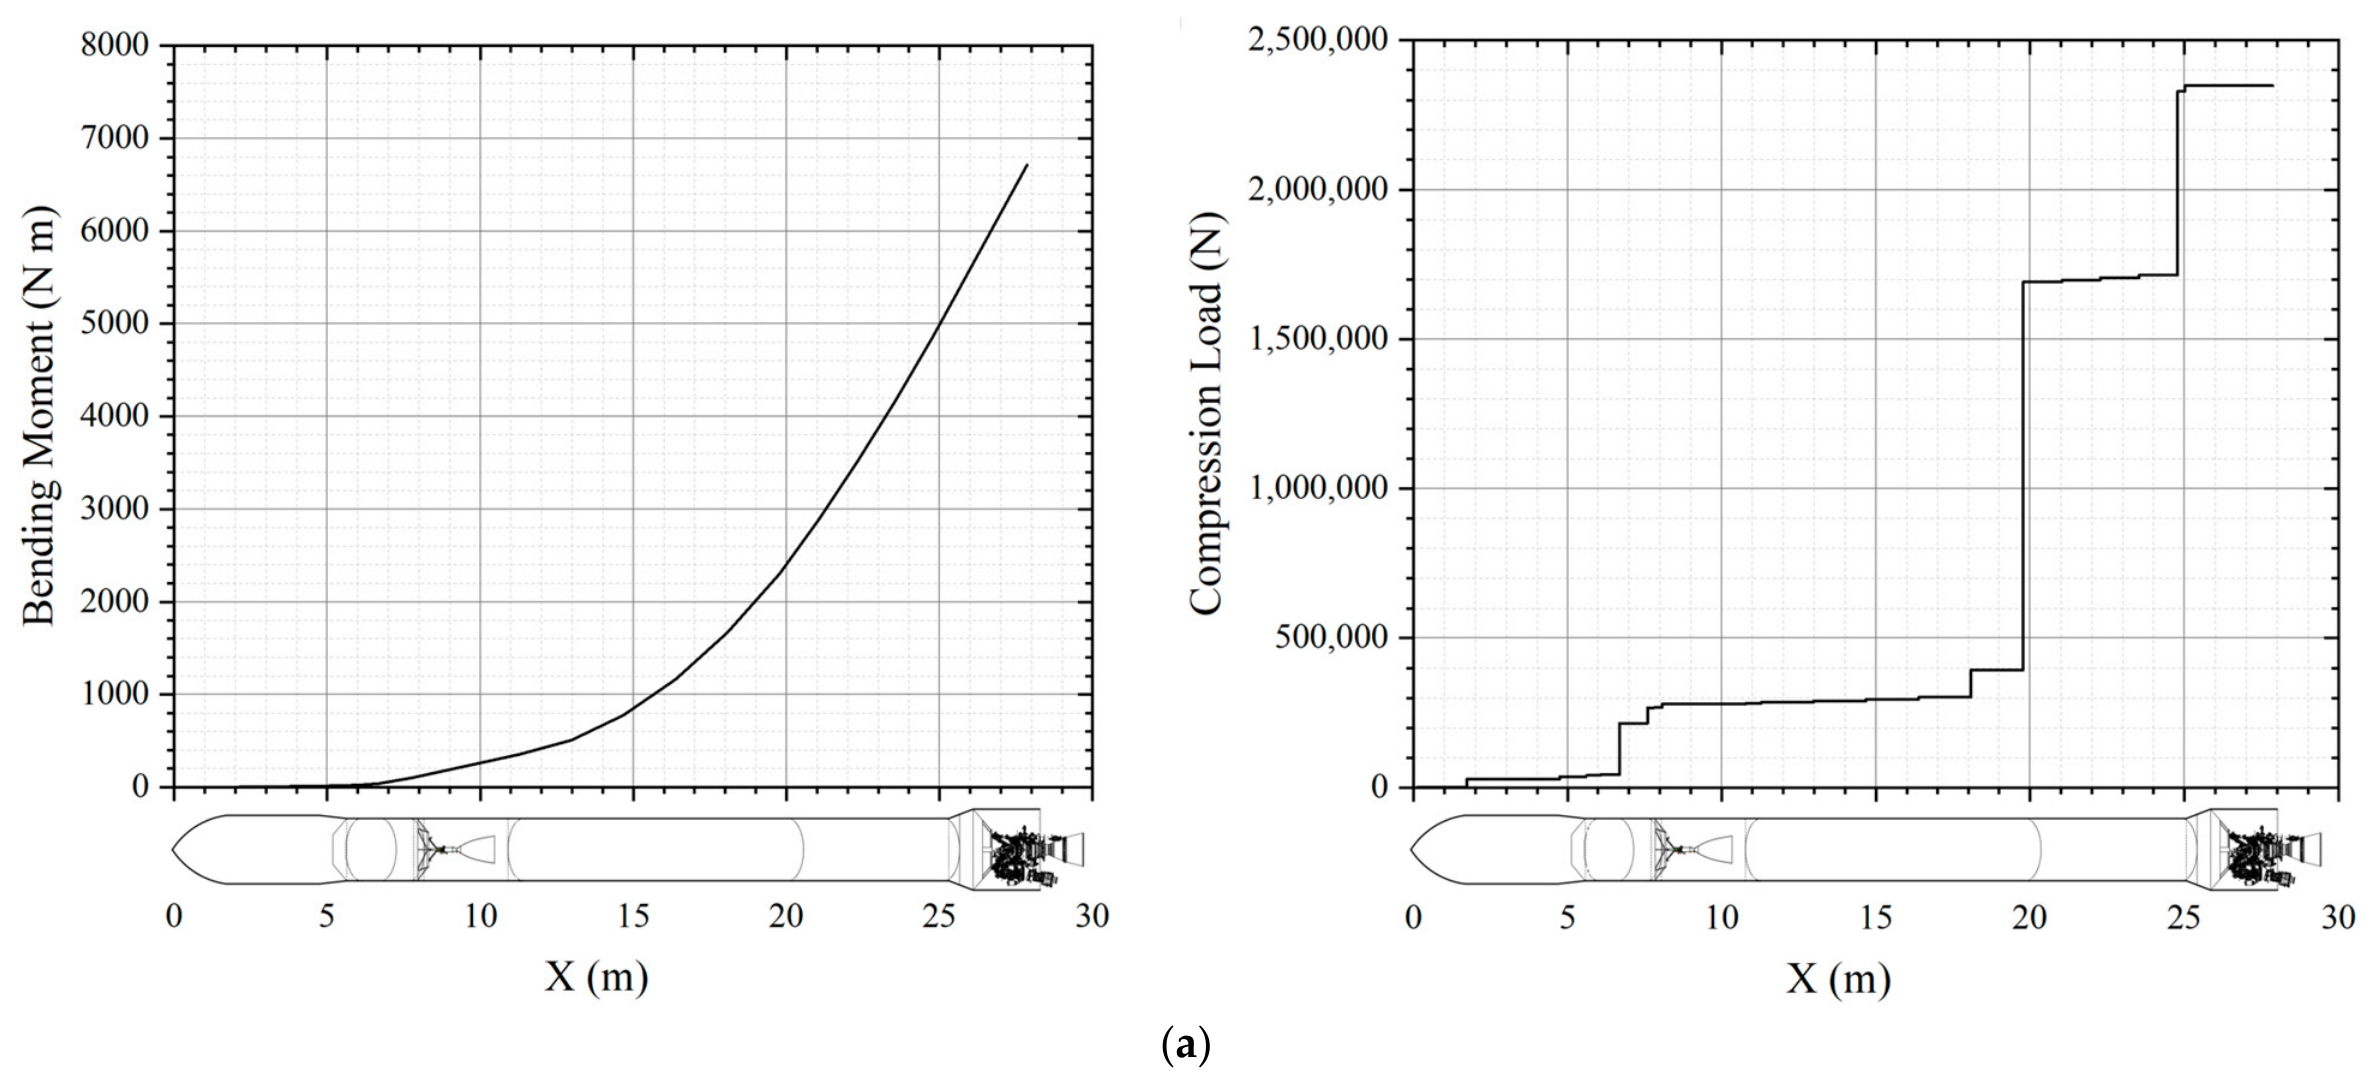
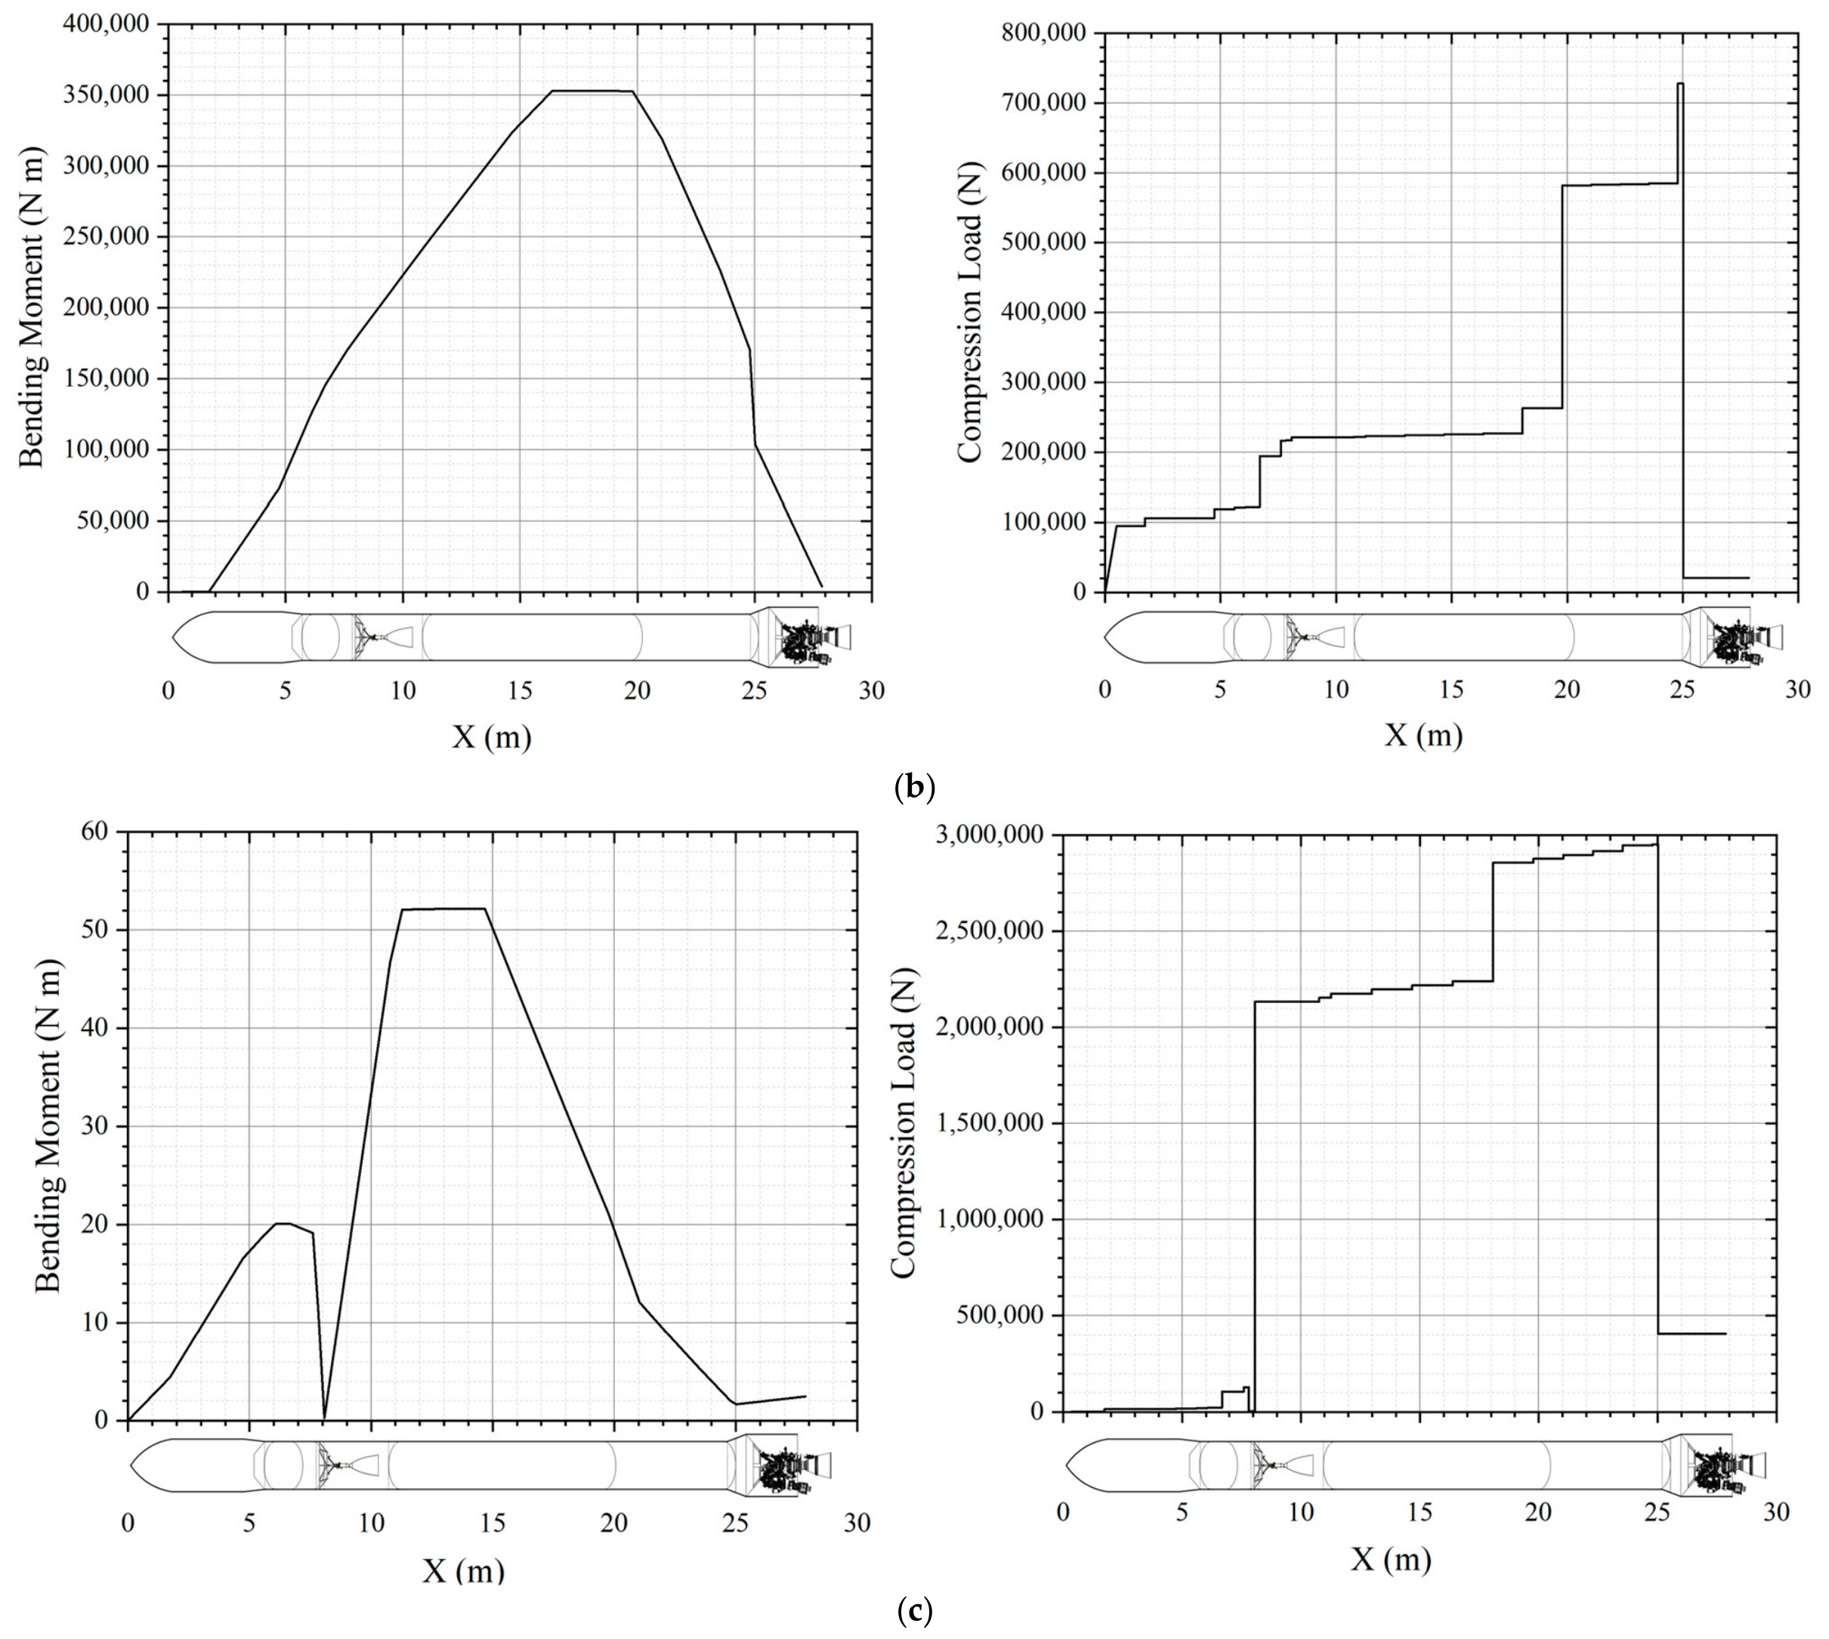
Figure 13 shows the optimized trajectory of the SmallSat-dedicated launch vehicle; Figure 14, Figure 15, Figure 16, Figure 17, Figure 18, Figure 19 and Figure 20 show the plots of altitude, velocity, pitch and yaw angles, dynamic pressure and angle of attack, free-molecular heating rate and flightpath angle, Delta-V, and vehicle mass versus time, respectively. Table 12 lists the optimized flight sequences of the launch vehicle and key values for each event. Figure 21 shows the calculated bending moment and axial force applied to the load-bearing structures at the launch pad before liftoff, at maximum dynamic pressure (MaxQ), and at main engine cutoff (MECO). Table 13 lists the final dry masses of the launch vehicle calculated during the optimization process.
Figure 13.
Optimized trajectory of the launch vehicle.
Figure 14.
Altitude versus flight time.
Figure 15.
Velocity versus flight time.
Figure 16.
Pitch and yaw angle versus flight time.
Figure 17.
Dynamic pressure and angle of attack versus flight time.
Figure 18.
Free-molecular heating rate and flight path angle versus flight time.
Figure 19.
Calculated Delta-V versus flight time.
Figure 20.
Vehicle mass versus flight time.
Table 12.
Optimized flight sequence and values.
Figure 21.
Load analysis results at (a) launch pad, (b) MaxQ, and (c) MECO.
Table 13.
Mass estimation results.
The optimized trajectory satisfied the target orbit insertion condition and the imposed trajectory, thermal, and range-safety constraints. The final payload capability was estimated to be 530 kg for a 500 km SSO mission. The corresponding dry masses of the first and second stages were estimated to be 4051 kg and 648 kg, respectively, as summarized in Table 13. The implications of these results for the feasibility of the proposed Nuri-derived SmallSat-dedicated launch vehicle are discussed in Section 6.
6. Discussion
The main contribution of this study is the translation of a planning-level concept for a Nuri-derived SmallSat-dedicated launch vehicle into a quantitative vehicle configuration through staging design and preliminary configuration sizing. The design was established by jointly considering the geopolitical constraints associated with launch operations from the Naro Space Center, the technologies accumulated through the Nuri development program, and emerging technologies such as a high-performance upper-stage engine and lightweight common-bulkhead tank structures. The staging design quantified the propulsion performance, velocity-increment distribution, stage masses, and structural indices, while the configuration sizing established the geometric baseline for aerodynamic analysis and MDO-based feasibility assessment.
The optimized trajectory satisfied the target 500 km SSO insertion condition and the imposed trajectory, thermal, and range-safety constraints. In particular, the first-stage impact point was located approximately 1441 km from the launch site, exceeding the required minimum distance of 1400 km. As shown in Figure 19, the cumulative ΔV values at first- and second-stage burnout were 4750 and 10,344 m/s, respectively, which were 80 m/s (1.7%) and 156 m/s (1.5%) lower than the corresponding staging-design estimates of 4830 and 10,500 m/s. The optimized cumulative velocity increment of 10,344 m/s was 147 m/s (1.4%) above the unmarginated value of 10,197 m/s from Equation (8), but 156 m/s (1.5%) below the staging requirement of 10,500 m/s. Thus, the approximately 3% allowance adequately covered the discrepancy under the adopted modeling assumptions, whereas margins of 5% or 10% would introduce greater conservatism than indicated by the optimized trajectory.
Table 14 shows the comparison between staging design assumptions and MDO results.The optimized payload capability was estimated to be 530 kg, approximately 6% higher than the target payload mass of 500 kg. The first-stage dry mass increased slightly from the staging-design value of 4000 kg to 4051 kg, whereas the second-stage dry mass decreased from 677 kg to 648 kg. The corresponding structural indices were 8.7% and 12.1%, respectively, compared with the initial values of 8.6% and 12.6%.
Table 14.
Comparison between staging design assumptions and MDO results.
The close agreement between the staging assumptions and MDO results indicates internal consistency within the initial design approach. In particular, the required first-stage structural index was maintained after the load-bearing structural masses were updated using trajectory-dependent flight loads. This suggests that the proposed combination of Nuri-derived propulsion and manufacturing heritage with emerging upper-stage and lightweight structural technologies may be feasible at the conceptual design level under the adopted modeling and mass-estimation assumptions.
To evaluate the robustness of the calculated payload margin against development-dependent uncertainties, a one-at-a-time sensitivity analysis was conducted for the non-load-bearing mass and upper-stage engine specific impulse. The non-load-bearing mass was estimated using Nuri heritage data and component-level information and may therefore change as the vehicle design and subsystem specifications mature. Accordingly, this mass was varied by ±3% and ±5%. Because the upper-stage engine is currently under development, its specific impulse was varied by ±3% to account for potential performance deviations during engine maturation. For each perturbation, the payload capability was recalculated under the same mission requirements and trajectory constraints. The load-bearing structural mass was not independently perturbed because it is calculated through the coupled flight-load and structural-mass-estimation procedure rather than prescribed as an external input. Therefore, the present analysis addresses uncertainty in development-dependent inputs but does not quantify model-form uncertainty in the structural sizing method.
As shown in Table 15, the baseline design provided a payload capability of 530 kg, corresponding to a 30 kg margin relative to the 500 kg target. A 3% increase in non-load-bearing mass reduced the payload capability to 507 kg, leaving a margin of only 7 kg, whereas a 5% increase reduced it to 492 kg, which did not satisfy the target. Conversely, reductions of 3% and 5% increased the payload capability to 552 and 567 kg, respectively. The payload capability exhibited greater sensitivity to upper-stage specific impulse: a 3% decrease reduced it to 470 kg, while a 3% increase raised it to 588 kg. These results indicate that the baseline configuration has limited robustness to adverse mass growth and upper-stage performance degradation. Consequently, the preliminary feasibility of the proposed configuration remains conditional on controlling non-load-bearing mass growth and achieving an upper-stage engine performance close to the nominal value. Because the parameters were varied independently, the results should not be interpreted as bounds for their combined uncertainties.
Table 15.
One-at-a-time sensitivity of payload capability to non-load-bearing mass and upper-stage specific impulse.
Nevertheless, the present sensitivity analysis was limited to independent variations in two development-dependent inputs and therefore does not bound their combined effects. In addition, uncertainty associated with the ODINMER-based load-bearing structural-mass estimates was not independently quantified. Accordingly, the results represent an initial feasibility assessment rather than detailed design verification. Further studies should incorporate detailed structural and propulsion-system design, integrated guidance and control analysis, aeroelastic stability, manufacturability, reliability, and cost and schedule assessment.
7. Conclusions
In this study, a Nuri-derived SmallSat-dedicated launch vehicle was conceptually designed and evaluated for delivering a 500 kg-class payload to a 500 km SSO. The delta-V requirement and its stage-wise distribution were determined by considering the launch azimuth, dog-leg maneuver, retrograde SSO insertion, and first-stage impact-point constraint. Based on the staging results, the preliminary vehicle configuration was sized, including the propellant tanks, fairing, interstage, aft fuselage, and overall vehicle length. The proposed configuration was then evaluated using an ASTOS-based MDO framework that coupled trajectory optimization, aerodynamic analysis, flight-load evaluation, and load-bearing structural mass estimation.
Within the adopted numerical framework, the optimized solution satisfied the target 500 km SSO insertion condition and the imposed trajectory, thermal, and range-safety constraints, including the first-stage impact-point requirement, and yielded a predicted payload capability of 530 kg. The close agreement between the staging-design assumptions and MDO results in terms of the ΔV distribution and structural-mass estimates indicates internal consistency within the proposed design approach. The sensitivity analysis showed that the 500 kg payload target remained satisfied with a 3% increase in non-load-bearing mass but was not satisfied with a 5% increase, while a 3% reduction in upper-stage specific impulse reduced the payload capability to 470 kg. These results support the preliminary conceptual feasibility of the proposed configuration, conditional on controlling subsystem mass growth and achieving the nominal upper-stage engine performance; however, they do not constitute detailed design verification.
Future work should include detailed structural design, propulsion system development, guidance and control analysis, aeroelastic stability assessment, manufacturability evaluation, reliability assessment, and cost and schedule analysis.
Author Contributions
Conceptualization, D.S. and H.K.; methodology, D.S.; software, D.S. and H.K.; validation, D.S. and H.K.; investigation, D.S. and H.K.; writing—original draft preparation, D.S.; writing—review and editing. All authors have read and agreed to the published version of the manuscript.
Funding
This research was supported by Changwon National University in 2025~2026 and by Korea Aerospace Research Institute (Project No. RS-2022-00164826).
Data Availability Statement
All data used during the study appear in the submitted article.
Conflicts of Interest
The authors declare no conflicts of interest.
Abbreviations
The following abbreviations are used in this manuscript:
| SSO | Sun-synchronous orbit |
| MDO | Multidisciplinary design optimization |
| EEZ | Exclusive economic zone |
| SECO | Second engine cutoff |
| ASTOS | Analysis, Simulation and Trajectory Optimization Software for Space |
| Applications | |
| GESOP | Graphical Environment for Simulation and Optimization |
| ODINMER | Optimal Design Investigation Mass Estimation Regression |
| MER | Mass estimation regression |
| MECO | Main engine cutoff |
| CFRP | Carbon-fiber-reinforced polymer |
| MaxQ | Maximum dynamic pressure |
References
- Barbaroux, P. The Metamorphosis of the World Space Economy: Investigating Global Trends and National Differences among Major Space Nations’ Market Structure. J. Innov. Econ. Manag. 2016, 20, 9–35. [Google Scholar] [CrossRef] [Scilit]
- Song, Y.; Gnyawali, D.R.; Qian, L. From Early Curiosity to Space Wide Web: The Emergence of the Small Satellite Innovation Ecosystem. Res. Policy 2024, 53, 104932. [Google Scholar] [CrossRef] [Scilit]
- Wekerle, T.; Pessoa Filho, J.B.; Costa, L.E.V.L.; Trabasso, L.G. Status and Trends of Smallsats and Their Launch Vehicles—An Up-to-Date Review. J. Aerosp. Technol. Manag. 2017, 9, 269–286. [Google Scholar] [CrossRef] [Scilit]
- Crisp, N.H.; Smith, K.L.; Hollingsworth, P.M. Small Satellite Launch to LEO: A Review of Current and Future Launch Systems. Trans. JSASS Aerosp. Technol. Jpn. 2014, 12, Tf_39–Tf_47. [Google Scholar] [CrossRef] [Scilit] [PubMed]
- Zhang, M.; Xu, Q.; Zhang, Q. Aggregated Preference Value Analysis of Small Satellite Launch Opportunities. Trans. Jpn. Soc. Aeronaut. Space Sci. 2018, 61, 69–78. [Google Scholar] [CrossRef] [Scilit]
- Barato, F.; Toson, E.; Milza, F.; Pavarin, D. Investigation of Different Strategies for Access to Space of Small Satellites on a Defined LEO Orbit. Acta Astronaut. 2024, 222, 11–28. [Google Scholar] [CrossRef] [Scilit]
- Drenthe, N.T.; Zandbergen, B.T.C.; Curran, R.; van Pelt, M.O. Cost Estimating of Commercial Smallsat Launch Vehicles. Acta Astronaut. 2019, 155, 160–169. [Google Scholar] [CrossRef] [Scilit]
- Oliveira, A.M.; Cerqueira, C.S. A Systematic Review of MDO Methods Applied to Launch Vehicle Design and Their Contributions to Concurrent Engineering. Discov. Mech. Eng. 2025, 4, 19. [Google Scholar] [CrossRef] [Scilit]
- Ko, J.; Kim, J.; Choi, J.; Ahn, J. Simultaneous Optimization of Launch Vehicle Stage and Trajectory Considering Flight-Requirement Constraints. Int. J. Aeronaut. Space Sci. 2024, 25, 1563–1573. [Google Scholar] [CrossRef] [Scilit]
- Malyuta, D.; Yu, Y.; Elango, P.; Açıkmeşe, B. Advances in Trajectory Optimization for Space Vehicle Control. Annu. Rev. Control 2021, 52, 282–315. [Google Scholar] [CrossRef] [Scilit]
- Zhao, M.; Pan, B.; Hou, X.; Huang, L. Smoothing-Homotopy-Based Sequential Convex Programming for Trajectory Optimization. Aerosp. Sci. Technol. 2025, 159, 109995. [Google Scholar] [CrossRef] [Scilit]
- An, H.J. South Korea’s Space Program: Activities and Ambitions. Asia Policy 2020, 15, 34–42. [Google Scholar] [CrossRef] [Scilit]
- Choi, Y.I.; Park, J.S.; Lee, K.J.; Ko, J.Y.; Jung, D.H.; Cho, H.S. Small Satellite Launch-Vehicle Public-International Cooperation Development Strategy Based on MBSE and Ensuring Methodology for Low-Cost Manufacturing Technology. In Proceedings of the 53rd Korean Society of Propulsion Engineers Fall Conference, Busan, Republic of Korea, 27–29 November 2019; pp. 404–406. (In Korean) [Google Scholar]
- Lee, K.J.; Park, J.S.; Park, S.Y.; Choi, Y.I.; Lim, S.H.; Park, J.H.; Ko, J.Y. SmallSat Launch Vehicle (SSaL) for the NewSpace Age. In Proceedings of the 53rd Korean Society of Propulsion Engineers Fall Conference, Busan, Republic of Korea, 27–29 November 2019; pp. 310–314. (In Korean) [Google Scholar]
- Edberg, D.L.; Costa, W.D. Design of Rockets and Space Launch Vehicles; AIAA Education Series; American Institute of Aeronautics and Astronautics: Reston, VA, USA, 2020. [Google Scholar]
- Humble, R.W.; Henry, G.N.; Larson, W.J. Space Propulsion Analysis and Design; McGraw-Hill: New York, NY, USA, 1995. [Google Scholar]
- Sutton, G.P.; Biblarz, O. Rocket Propulsion Elements, 9th ed.; Wiley: Hoboken, NJ, USA, 2017. [Google Scholar]
- Pisacane, V.L. Spacecraft Systems Design and Engineering. In Encyclopedia of Physical Science and Technology, 3rd ed.; Meyers, R.A., Ed.; Academic Press: San Diego, CA, USA, 2003. [Google Scholar]
- Sellers, J.J. Understanding Space: An Introduction to Astronautics, 3rd ed.; McGraw-Hill: New York, NY, USA, 2005. [Google Scholar]
- Lee, S.-I.; Cho, S.-B.; Sun, B.-C. Analysis of Flight Trajectory and Environment of Nuri-2 Launch Vehicle. In Proceedings of the Korean Society for Aeronautical and Space Sciences 2022 Fall Conference, Jeju, Republic of Korea, 16–18 November 2022; pp. 728–729. (In Korean) [Google Scholar]
- Firefly Aerospace, Inc. Alpha Payload User’s Guide, Version 5.2; Firefly Aerospace, Inc.: Cedar Park, TX, USA, 2025; Available online: https://fireflyspace.com/wp-content/uploads/2025/07/Alpha-PUG-5.2.pdf (accessed on 23 July 2026).
- Kim, C.; Lim, B.; Lee, J.; Seo, D.; Lim, S.; Lee, K.-O.; Lee, K.; Park, J. Conceptual Design of a LOX/Methane Rocket Engine for a Small Launcher Upper Stage. J. Korean Soc. Propuls. Eng. 2022, 26, 54–63. [Google Scholar] [CrossRef] [Scilit]
- Möllmann, C.; Wiegand, A.; Dalheimer, M.; Martinez Barrio, A.; Kauffmann, J. Multidisciplinary Design Optimisation of Expandable Launchers in ASTOS. In Proceedings of the 4th International Conference on Astrodynamics Tools and Techniques (ICATT), ESAC, Madrid, Spain, 3–6 May 2010. [Google Scholar]
- Lee, K.J.; Choi, J.Y.; Cho, S.B.; Sun, B.C. Rapid Feasibility Study on a Miniature-Class Launcher Using a Multidisciplinary Design Approach. In Proceedings of the Asia-Pacific International Symposium on Aerospace Technology, Seoul, Republic of Korea, 16–18 October 2017. [Google Scholar]
- Schäff, S.; Jürgens, M.; Wiegand, A. POINT—A Tool to Optimize Interplanetary Trajectories. In Proceedings of the 4th International Conference on Astrodynamics Tools and Techniques (ICATT), ESAC, Madrid, Spain, 3–6 May 2010. [Google Scholar]
- Gath, P.F. CAMTOS—A Software Suite Combining Direct and Indirect Trajectory Optimization Methods. Ph.D. Thesis, University of Stuttgart, Stuttgart, Germany, 2002. [Google Scholar]
- Büskens, C.; Wassel, D. The ESA NLP Solver WORHP. In Modeling and Optimization in Space Engineering; Springer: Berlin/Heidelberg, Germany, 2013; pp. 85–110. [Google Scholar] [CrossRef] [Scilit]
- Wiegand, A.; Cremaschi, F.; Winter, S.; Weikert, S.; Link, T.; Zell, D.; Albinger, J. Design Optimization and Performance Analysis of Launch Vehicles with ASTOS. In Proceedings of the 63rd Deutscher Luft-und Raumfahrtkongress (DLRK 2014), Augsburg, Germany, 16–18 September 2014. [Google Scholar]
- European Cooperation for Space Standardization. Space Engineering—Structural Factors of Safety for Spaceflight Hardware; ECSS-E-ST-32-10C Rev.1; ECSS Secretariat, ESA-ESTEC Requirements & Standards Division: Noordwijk, The Netherlands, 2009; Available online: https://ecss.nl/wp-content/uploads/standards/ecss-e/ECSS-E-ST-32-10C_Rev.16March2009.pdf (accessed on 23 July 2026).
- Lee, C.-M.; Sim, C.-H.; Kim, G.-S.; Park, J.-S.; Lee, J.-S. Derivation of Knockdown Factors for Common Bulkhead Structures of Launch Vehicle Propellant Tank Using Liquid Methane. J. Korean Soc. Propuls. Eng. 2024, 28, 23–36. (In Korean) [Google Scholar] [CrossRef] [Scilit]
- Kirchheck, D.; Marwege, A.; Klevanski, J.; Rlehmer, J.; Gülhan, A.; Karl, S.; Gloth, O. Validation of Wind Tunnel Test and CFD Techniques for Retro-Propulsion. FAR Conference, 2019. DLR Institutional Record. Available online: https://elib.dlr.de/137501/1/FAR2019_Kirchheck.pdf (accessed on 30 August 2026).
- Vidya, G.; Manokaran, K.; Ganesan, V.R.; Prasath, M.; Epuri, S.; Balasubramanian, P.; Babu, C.; Venkatasubrahmanyam, B.; Bandyopadhyay, P. Aerodynamic Design, Characterization and Flight Performance of RLV-TD. Curr. Sci. 2018, 114, 48–63. [Google Scholar] [CrossRef] [Scilit]



Disclaimer/Publisher’s Note: The statements, opinions and data contained in all publications are solely those of the individual author(s) and contributor(s) and not of MDPI and/or the editor(s). MDPI and/or the editor(s) disclaim responsibility for any injury to people or property resulting from any ideas, methods, instructions or products referred to in the content. |
© 2026 by the authors. Licensee MDPI, Basel, Switzerland. This article is an open access article distributed under the terms and conditions of the Creative Commons Attribution (CC BY) license.