


Abstract
To address the problems where the resistance coefficients of the two-stage brush seal porous medium model rely on experimental calibration and the resistance characteristics of each stage are difficult to distinguish, this paper proposes a method without experimental calibration for determining the porous medium resistance coefficients of two-stage brush seals. By combining the three-dimensional tube bundle model with porous medium theory and Hagen–Poiseuille flow theory, the viscous and inertial resistance coefficients of each stage were derived. Two-stage brush seal specimens with three backing plate protection heights were manufactured, and a leakage flow experimental setup was constructed to verify the proposed method. Differences in resistance coefficients between the two stages and the effect of backing plate protection height on resistance coefficients were investigated. Results show that the calculated leakage rates from the porous medium model agree well with experimental data, verifying the accuracy of the proposed solution method. In the two-stage brush seal, both the viscous and inertial resistance coefficients of the second stage are significantly higher than those of the first stage. This study provides an effective method for calculating the porous medium resistance coefficients for each stage of two-stage brush seals and for predicting their leakage characteristics.
1. Introduction
Seals are critical foundational components of turbomachinery, such as aeroengines, and their performance directly determines fuel economy and operational efficiency of aeroengines. As contact dynamic seals with excellent sealing performance, brush seals exhibit leakage rates only from 1/5 to 1/10 of those of labyrinth seals. Due to the limited pressure capacity and sealing performance of single-stage brush seals, two-stage brush seals are widely adopted in engineering practice to accommodate high-pressure differential conditions [1,2]. In practice, the porous medium model is commonly used to analyze leakage characteristics of brush seals. However, this model treats the bristle pack as a medium with specific permeability, and the resistance coefficients used in the simulation rely heavily on experimental calibration, which is both costly and time-consuming. Moreover, it is difficult to accurately distinguish the resistance characteristics of each stage in two-stage brush seals using this approach [3]. Therefore, developing a method to calculate porous medium resistance coefficients for two-stage brush seals holds significant academic importance and engineering applicative value.
The numerical simulation methods for investigating the leakage flow characteristics of brush seals are mainly divided into two categories: the porous medium model and the staggered tube bundle model [4,5]. Among these two methods, the porous medium model simplifies the detailed structure of the bristle pack by adding a resistance source term to the momentum equation to characterize the blocking effect of the bristles on the fluid. In contrast, the staggered tube bundle model can directly simulate the complex flow behavior between bristles but demands high computational resources. Due to its high computational efficiency and broad applicability, the porous medium model has become a widely used approach for studying the leakage characteristics of brush seals in engineering practice [6,7]. To address the issue that the calibration of resistance coefficients in the porous medium model for brush seals is highly dependent on structural parameters and experimental data, which consumes considerable time and cost, researchers have conducted studies on calculation methods for these resistance coefficients [8,9]. Dogu [10] derived formulas for calculating the axial viscous resistance coefficient of brush seals based on Darcy’s law and the Bernoulli equation but still relied on experimental calibration of the resistance coefficients. Thomas [11] employed the Darcy porous medium model to investigate the variation in the resistance coefficient of a single-stage brush seal with pressure ratio and found that at low pressure ratios, the resistance coefficient increases with pressure ratio. Kwon [12] proposed a calibration formula for the porous medium model that modifies the resistance coefficients based on the pressure ratio and brush seal geometry; within a pressure ratio ranging from 1.5 to 4, the relative error in the leakage rate was less than 5%. Ha [13] developed a combined numerical computation method that uses a two-dimensional tube bundle model to simulate the bristle geometry and fits the resistance coefficients of the single-stage brush seal porous medium model via the velocity–pressure gradient method. However, their model did not account for gas compressibility, resulting in underestimated resistance coefficients and deviations between the simulated results and the actual physical fields. Song [14,15] established a two-dimensional tube bundle model for a single-stage brush seal that considers gas compressibility and solved the axial resistance coefficients of the brush seal by fluid mechanics methods; the calculated results from the porous medium model were in good agreement with experimental data. In summary, current calibration of resistance coefficients for the porous medium model of single-stage brush seals mostly relies on experimental data correction for specific geometries. Therefore, there is an urgent need to develop a calculation method for brush seal resistance coefficients that have low experimental dependence and strong generality.
With the advancement of aeroengine technology toward higher thrust-to-weight ratios, higher loads, and higher reliability, the maximum pressure differential that a single-stage brush seal can withstand, 0.3–0.35 MPa, is insufficient to meet the operational requirements of future aeroengines. A two-stage brush seal consists of two bristle packs arranged in series, distributing the total pressure drop across two sealing units, thereby offering superior pressure capacity and sealing performance [16,17,18]. Hendricks R.C. [19] experimentally studied the pressure distribution across each stage of a two-stage brush seal on a YT-700 engine. Their study revealed that the pressure drop across the second-stage brush seal is 20% higher than that across the first stage and that for brush seals with identical geometries, the interstage pressure drop distribution is uneven, with the final stage sustaining a larger pressure drop. A.O. Pugachev [20] found that the resistance coefficients in the porous medium model are derived from empirical data and thus must be calculated with experimental data; otherwise, the model parameters must be selected based on experience gained from modeling similar brush seals. The modeling of two-stage brush seals is more complex than that of single-stage ones, and the interaction of pressure differential and vortex flow leads to significant differences in the resistance coefficients of each stage. Neff [21] proposed that to address the uneven interstage pressure drop distribution in two-stage brush seals, the pressure drop variation in each stage of the bristle pack should be corrected individually. However, this approach is difficult to apply effectively in engineering practice. Existing studies often treat each stage region of a two-stage brush seal as a homogeneous medium with identical resistance characteristics, overlooking the differences in stage-wise resistance coefficients caused by uneven pressure drop distribution, and thus they fail to accurately reflect the actual resistance characteristics of each stage [22,23]. In summary, to address the existing problems that the determination of porous medium resistance coefficients for two-stage brush seals relies on experimental data or empirical parameter calibration and that the actual flow resistance characteristics of each bristle pack are difficult to represent under uneven interstage pressure drop conditions, there is an urgent need to develop a generally applicable method for determining the porous medium resistance coefficients of two-stage brush seals with low experimental dependence and the capability to accurately characterize the resistance characteristics of each sealing stage.
This paper proposes a method for determining the stage-wise resistance coefficients of the porous medium model for two-stage brush seals based on a three-dimensional tube bundle model. Sector-shaped experimental specimens of two-stage brush seals with different backing plate protection heights were designed and manufactured, and a leakage characteristic experimental setup was constructed to validate the proposed method. This method combines the advantages of both the porous medium model and the three-dimensional tube bundle model, effectively reducing the time and cost associated with the calibration of resistance coefficients, accurately characterizing the actual flow resistance characteristics of the bristle pack in each stage of a two-stage brush seal, and providing a theoretical approach for predicting the leakage characteristics of two-stage brush seals.
2. Solution Method for Resistance Coefficients of the Two-Stage Brush Seal Porous Medium
2.1. Application Location and Working Principle of the Two-Stage Brush Seal
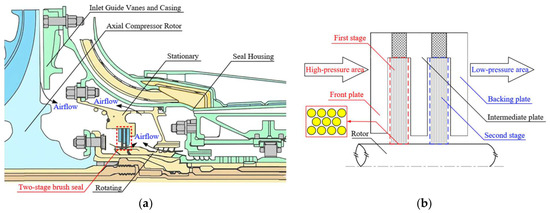
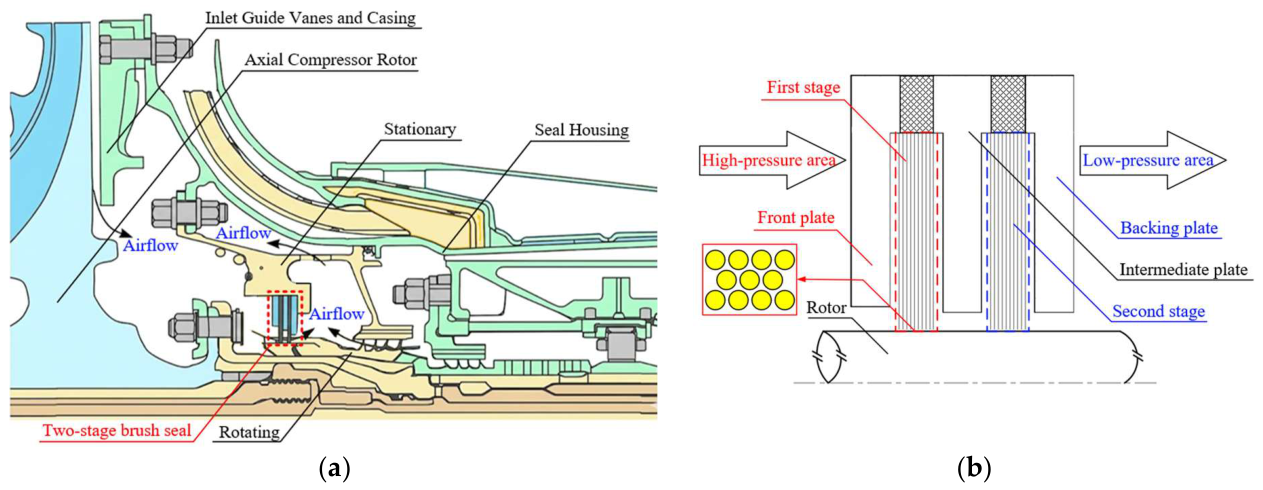
With the development of aeroengine technology towards high thrust-to-weight ratio, high load capacity, and high reliability, the pressure-bearing capacity of single-stage brush seals can no longer meet service requirements. Accordingly, two-stage brush seals have been widely applied in the compressor discharge and high-pressure turbine sections of aeroengines, such as the T700, PW4168, and RB199. Figure 1a shows the typical application position of the two-stage brush seal at the compressor discharge of the T700 aeroengine [24]. The structure of the two-stage brush seal is shown in Figure 1b. It consists of a front plate, a first-stage bristle pack, an intermediate plate, a second-stage bristle pack, and a backing plate. The bristle pack is composed of densely arranged and flexible bristles, which provide resistance to the flow. During manufacturing, the roots of the bristles are fixed between the plates by welding, while the free ends of the bristles contact the rotor surface. When the high-pressure side airflow passes through the first-stage bristles, it is blocked by the intermediate plate. The flow then exits at high speed beneath the protection height of the intermediate plate and moves toward the second-stage bristle pack, where the airflow energy is gradually dissipated, thereby achieving the sealing effect.
Figure 1.
Schematic diagram of the installation position of the two-stage brush seal. (a) Application location for the T-700 aeroengine. (b) Schematic structure of the two-stage brush seal.
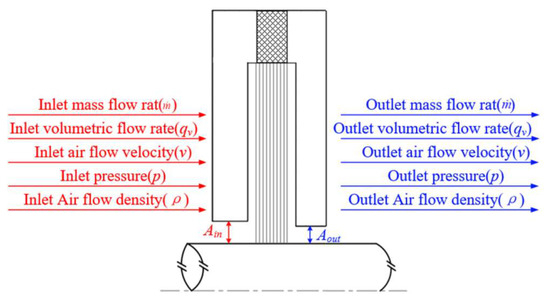
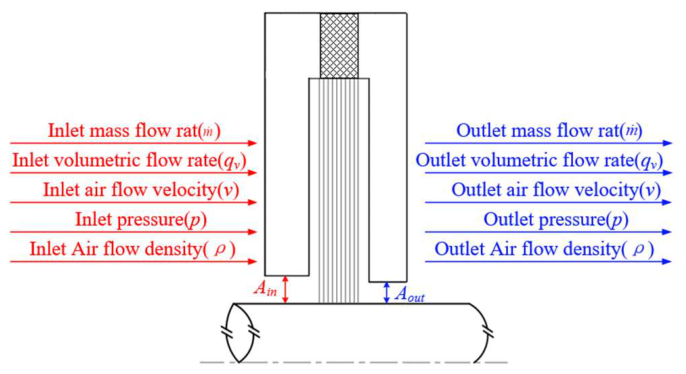
The schematic diagram of the leakage flow in a brush seal is shown in Figure 2. Neglecting the influence of gravity, the pressure drop across the first stage of a two-stage brush seal can be derived from the continuity equation and Bernoulli’s equation as follows:
where is the mass flow rate, qv is the volumetric flow rate, v is the gas velocity, ρ is the gas density, A is the flow cross-sectional area, and p is the gas pressure. At the downstream cross-section, the gas pressure decreases while the velocity increases. Similarly, the pressure drop across the second-stage bristle pack can be derived as
Figure 2.
Brush seal leakage flow diagram.
As leakage airflow passes through each stage of the bristle pack in a two-stage brush seal, its volumetric flow rate increases non-uniformly, resulting in different pressure drops across the stages and, consequently, distinct differences in resistance characteristics of each stage.
2.2. Theoretical Model of Brush Seal Porous Media
A porous medium is a multiphase material that occupies a shared spatial region in which the solid skeleton remains stable and unchanged, while the intervening space is filled with randomly distributed, interconnected pores that are occupied by fluid. The ratio of the pore volume to the total volume of the porous medium is defined as the porosity. Owing to the densely packed arrangement of the bristle pack in a brush seal, which exhibits typical porous medium characteristics, the bristle pack can be regarded as a porous medium region. The porous medium model ignores the detailed structure of the bristle pack and represents the blocking effect of the bristle pack on the fluid by adding a momentum source term to the momentum equation. This momentum source term consists of a viscous resistance term and an inertial resistance term and can effectively simulate the distribution of the solid structure within the bristle pack to the fluid. The expression is as follows:
where the subscript i = x, r, θ denotes the axial, radial, and circumferential coordinates, respectively. ui is the component of the velocity vector in the i-direction. τij is the viscous stress tensor of the fluid. Fi is the component of the resistance source term in the i-direction, which represents the blocking effect of the solid bristles on the fluid; 1/αi is the viscous resistance coefficient of the porous medium in the i-direction. Ci is the inertial resistance coefficient of the porous medium in the i-direction; μ is the dynamic viscosity of the fluid.
According to Equation (4), the viscous and inertial resistance coefficients are key parameters determining the accuracy of the porous medium model for brush seals. For a two-stage brush seal, the leakage gas flows successively through the first and second-stage bristle packs, with the total pressure drop shared by the two sealing stages. The resistance coefficients of each stage directly determine how the total pressure drop is distributed between the two sealing stages. Therefore, an accurate and reliable method for determining the resistance coefficients in the porous medium region is of great significance for improving the prediction accuracy of the leakage characteristics of two-stage brush seals.
2.3. Solution Method for Resistance Coefficients of the Two-Stage Brush Seal Porous Medium Model
2.3.1. The Existing Method for Determining the Resistance Coefficient of Brush Seal Porous Media
Table 1 presents methods for determining the resistance coefficients in the porous medium region of brush seals reported in the existing literature. Based on classical porous medium flow theory, Ergun [25] derived an empirical formula by fitting experimental data from many spherical particle packed beds, establishing the theoretical foundation for the calculation of the resistance coefficients of porous media. However, this method assumes that the resistance coefficients are identical in all directions, failing to consider the anisotropy of the bristle pack structure, which is inconsistent with actual working conditions. Chew [9] considered the anisotropy of the bristle pack by distinguishing between radial and axial resistance coefficients and ignored the inertial resistance coefficient in the radial direction, which better aligns with the structural characteristics of the bristle pack. Nevertheless, Chew proposed that the radial viscous resistance coefficient is 1/60 of the axial viscous resistance coefficient, still relying on experimental data for empirical calibration. Based on Hagen–Poiseuille flow theory, Pröstler [26] treated the radial flow between bristles as pipe flow and derived the radial viscous resistance coefficient using the geometric parameters of the bristle pack, thus providing a theoretical basis. However, the axial direction still relied on empirical formulas for calculation.
Table 1.
Summary table of the resistance coefficient calculation formula of porous media.
In summary, existing calculations of the porous medium resistance coefficients for brush seals all adopt the assumption that the axial and circumferential resistance coefficients are equal, while neglecting the radial inertial resistance coefficient [25,26]. The current research methods generally incorporate empirical coefficients, resulting in poor universality of the porous medium model, where parameter calibration heavily relies on experimental correction for specific geometries. Calculating resistance coefficients based solely on porosity fails to accurately reflect the differences in resistance characteristics between the two stages of a two-stage brush seal in actual flow, thereby impacting the accuracy of simulation results [27].
2.3.2. Calculation Method for Resistance Coefficients of the Two-Stage Brush Seal Porous Medium Based on the Three-Dimensional Tube Bundle Model
To address the above issues, this paper proposes a method for determining the resistance coefficients of the porous medium model for two-stage brush seals based on a three-dimensional tube bundle model. By establishing the actual geometric structure of the bristle pack and simulating fluid-flow behavior, combining porous medium theory with Hagen–Poiseuille flow theory, the stage-wise resistance coefficients are derived, avoiding reliance on experimental data. The porous medium model applied to brush seals typically includes the following assumptions [14]: the flow rate does not vary with time; the flow is considered isothermal, with constant fluid temperature T and viscosity of fluid μ; and the bristle pack is regarded as a rigid porous medium.
Solution Method for Resistance Coefficients of Single-Stage Brush Seal Porous Medium
The procedure for establishing the solution model for the resistance coefficients of a single-stage brush seal is as follows:
- (1)
- Solution model for the axial and circumferential resistance coefficients of a single-stage brush seal
Based on the structural distribution of the bristles in the selected axial direction, the axial flow in the porous medium of a single-stage brush seal is given by
where ∆p is the interstage pressure drop of the single-stage brush seal, v is the gas velocity at the inlet side, ρ is the fluid density, and ∆L is the axial thickness of the bristle pack. In addition, 1/αx and Cx are the viscous and inertial resistance coefficients in the axial direction of brush seals.
Equation (5) can be expressed as a quadratic polynomial in terms of the velocity and pressure drop:
where v is the inlet gas velocity, and ρ is the inlet gas density.
According to the law of conservation of mass: = ρvA, where A is the cross-sectional area of the fluid flowing through the porous medium region.
According to the ideal gas equation of state, when p = ρRT, then v can be expressed as
Substituting into Equation (6) and rearranging, the following is obtained:
Integrating Equation (8) yields
When x = 0, p(0) = pin, where pin is the inlet pressure. It can be known that
Substituting into Equation (9) yields
When the inlet pressure is pa1, let x = l, then the outlet side pressure p(x) = pa2, and it can be obtained that
When the inlet pressure is pb1, let x = l, then the outlet side pressure p(x) = pb2, and it can be obtained that
Combining Equations (12) and (13) yields
Solving Equation (14) yields
Equation (15) is the formula for calculating the axial and circumferential resistance coefficients of the porous medium for a single-stage brush seal.
- (2)
- Solution model for the radial resistance coefficient of a single-stage brush seal
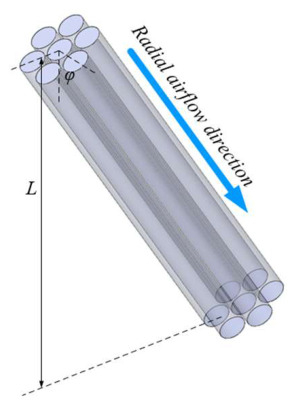
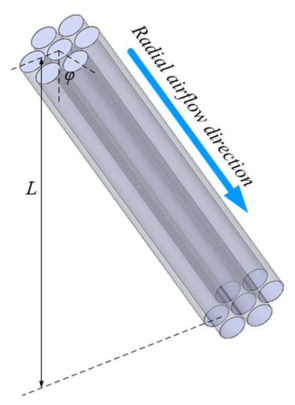
The formula for calculating the radial resistance coefficient of a brush seal is given as follows. As shown in Figure 3, assuming radial flow in the brush seal to be Hagen–Poiseuille flow along the bristle’s axial direction, Equation (16) is satisfied. Transforming the Hagen–Poiseuille equation into the Darcy–Weisbach form yields
where d0 is the diameter of the circular tube. It can be found that the magnitude of the radial viscous resistance coefficient depends on the pore size and the inclination angle of the bristles.
Figure 3.
Airflow along the radial direction of the bristles flow diagram.
Since the pores between the bristle pack in the radial direction resemble curved straight pipes rather than circular tubes, the circular tube diameter d0 in Equation (18) is replaced by the hydraulic diameter dh, and the calculation formula is as follows:
where Ar,t represents the cross-sectional area of the radial channel of the bristle pack, and Lr,w represents the wetted perimeter.
Combining Equations (18) and (19) yields
Thus, the formula for calculating the radial viscous resistance coefficient of the brush seal is obtained as follows:
Solution Method for the Resistance Coefficient of Two-Stage Brush Seal Porous Medium
The first- and second-stage bristle packs of the two-stage brush seal are regarded as two porous medium regions connected in series, and the interstage pressure drop distribution coefficient is defined as
where ∆Pf is the first-stage pressure drop, ∆Ptotal is the total pressure drop, Pmid is the interstage pressure of the two-stage brush seal, Pin is the inlet pressure of the two-stage brush seal, and Pout is the outlet pressure of the two-stage brush seal.
According to Equations (8) and (19), the formula for calculating the axial resistance coefficients of the porous medium for a two-stage brush seal can be listed as follows:
In the formula, 1/αx1 and Cx1 are the axial viscous and inertial resistance coefficients of the first stage of the two-stage brush seal, and 1/αx2 and Cx2 are those of the second stage. According to Equation (15), the axial and circumferential viscous and inertial resistance coefficients of the first stage of the two-stage brush seal can be expressed as
When the inlet pressure is pa1 and the interstage pressure is pc1, let x = l; then, the outlet side pressure is p(x) = pc2. When the inlet pressure is pb1 and the interstage pressure is pd1, let x = l; then, the outlet side pressure is p(x) = pd2. Similarly, the axial and circumferential viscous and inertial resistance coefficients of the second stage of the two-stage brush seal can be obtained as follows:
Since the first and second stages of the two-stage brush seal established in this paper have the same geometric structure, according to Equations (18) and (21), the theoretical radial viscous resistance coefficient of the two-stage brush seal is
3. Numerical Solution
3.1. Solution Process for Porous Medium Resistance Coefficients of a Two-Stage Brush Seal
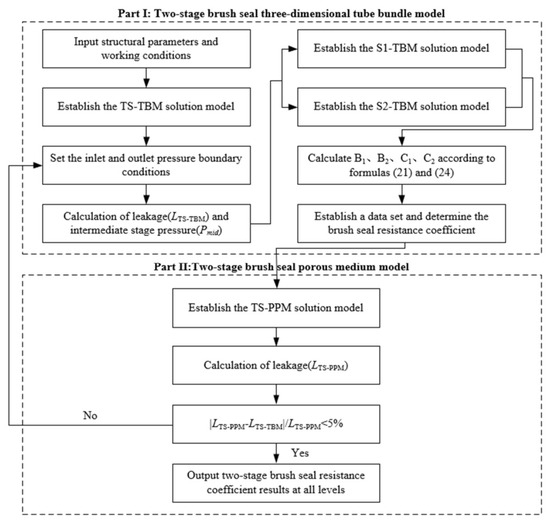
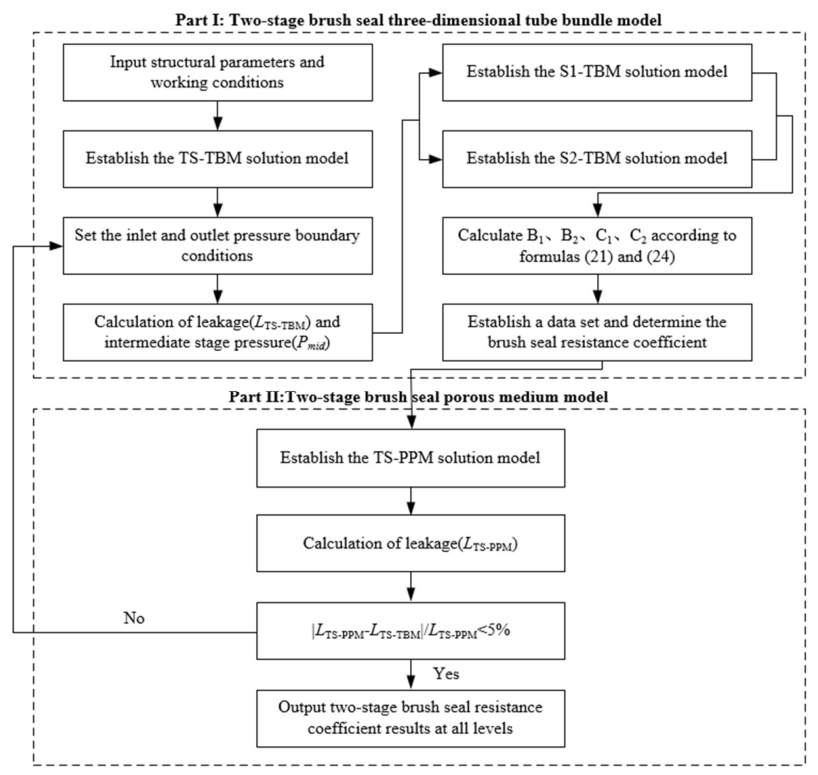
The solution procedure for the porous medium resistance coefficients of the two-stage brush seal is shown in Figure 4. Taking the structural parameters of the two-stage brush seal as initial conditions, a three-dimensional tube bundle solution model (TS-TBM) of the two-stage brush seal is established to solve the axial resistance coefficients. The circumferential resistance coefficients are taken to be identical to the axial ones, while the radial resistance coefficients are calculated according to Equation (26). Unless otherwise specified, the term “resistance coefficients” hereafter refers to the axial direction. By setting boundary conditions, the interstage pressure of the two-stage brush seal under different operating parameters is obtained through simulation. This interstage pressure is then used as the outlet pressure boundary condition for the first-stage brush seal three-dimensional tube bundle solution model (S1-TBM) and as the inlet pressure boundary condition for the second-stage brush seal three-dimensional tube bundle solution model (S2-TBM), and the leakage rates of S1-TBM and S2-TBM are subsequently solved. Substituting the obtained leakage rates into Equations (24) and (25) yields the stage-wise resistance coefficients of the two-stage brush seal under the given operating condition. Averaging the results across all data sets yields the main-flow-direction resistance coefficients of the bristle pack, with the model’s viscous and inertial resistance coefficients determined via arithmetic mean. The obtained resistance coefficients are then substituted into the two-stage brush seal porous medium solution model (TS-PMM) for solution. If the relative deviation between the leakage rate calculated by the TS-PMM model and that calculated by the TS-TBM model is less than 5%, the solved porous medium resistance coefficients are considered accurate. Otherwise, the number of operating conditions is increased to enrich the data set, and the resistance coefficients are iteratively corrected until the results converge.
Figure 4.
Solution process for porous medium resistance coefficients.
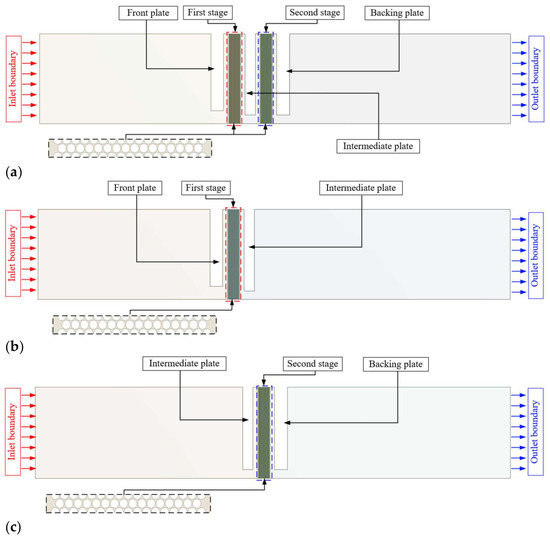
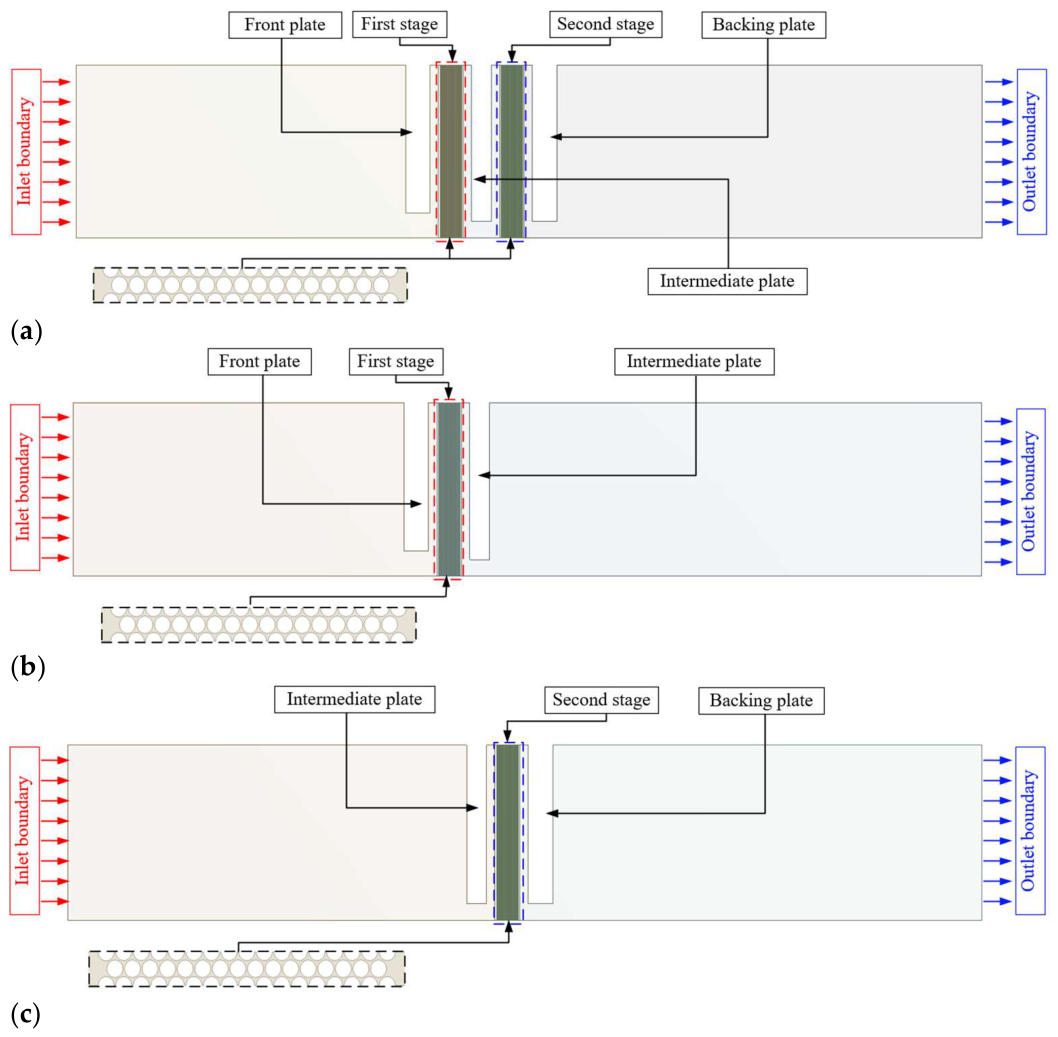
It should be noted that the four numerical models employed in this study serve different purposes. As shown in Figure 5, the TS-TBM, S1-TBM, and S2-TBM are all developed based on the three-dimensional tube-bundle approach. The TS-TBM represents the complete two-stage brush seal and is primarily used to calculate the interstage pressure, whereas the S1-TBM and S2-TBM separately represent the first and second-stage bristle pack regions and are used to calculate the leakage flow rate of each stage for the subsequent determination of the corresponding resistance coefficients. The TS-PMM is developed based on the porous medium approach, in which the determined stage-specific resistance coefficients are assigned to the corresponding porous regions to predict the overall leakage characteristics and the pressure drop distribution between the two sealing stages.
Figure 5.
Two-stage brush seal three-dimensional tube bundle model. (a) Two-stage brush seal three-dimensional tube bundle model. (b) The first-stage brush seal three-dimensional tube bundle model. (c) The second-stage brush seal three-dimensional tube bundle model.
3.2. Two-Stage Brush Seal Three-Dimensional Tube Bundle Model
3.2.1. Three-Dimensional Tube-Bundle Numerical Model
The specific structural parameters of the two-stage brush seal studied in this paper are listed in Table 2. The sector-shaped test specimen is one-sixth of the full annular test specimen. Based on the two-stage brush seal test specimen, the TS-TBM, S1-TBM, and S2-TBM models were established. The modeling region was selected as the area below the fixed end of the bristle pack that is in contact with the fluid. To improve computational efficiency, one full row of axially arranged bristles and two staggered bristles were taken as the modeling unit, and a slice model unit was established with periodic interfaces on both sides. This model represents the smallest slice of the complete brush seal structure. When calculating the overall leakage rate, the leakage rate obtained from the slice model was multiplied by the number of period repetitions to obtain the total leakage rate. The bristle material is GH4214, with a density of 8050 kg/m3 and an elastic modulus of 217 kN/mm2.
Table 2.
Structural parameters of a two-stage brush seal.
3.2.2. Three-Dimensional Tube-Bundle Mesh Independence Assessment
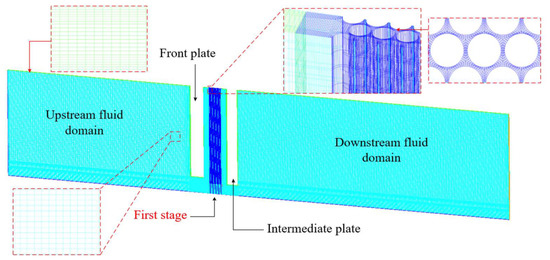
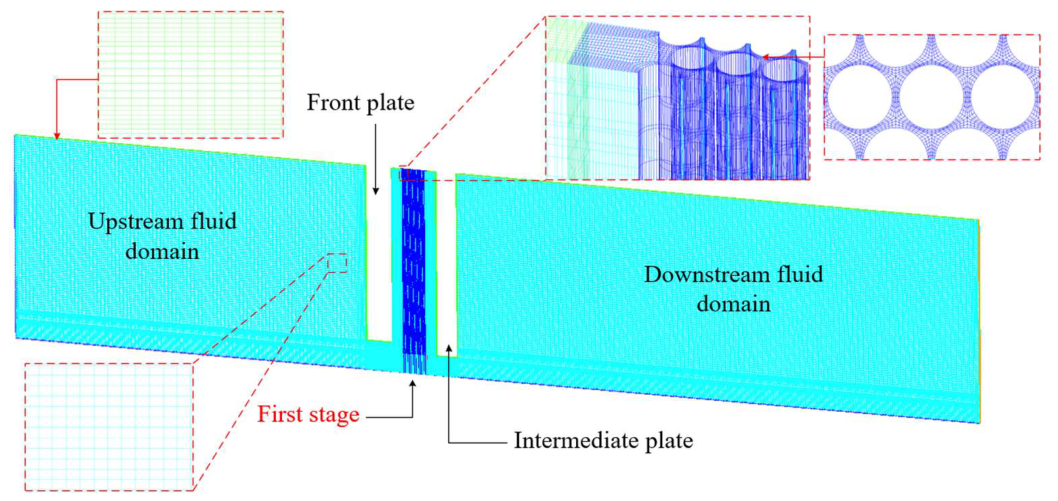
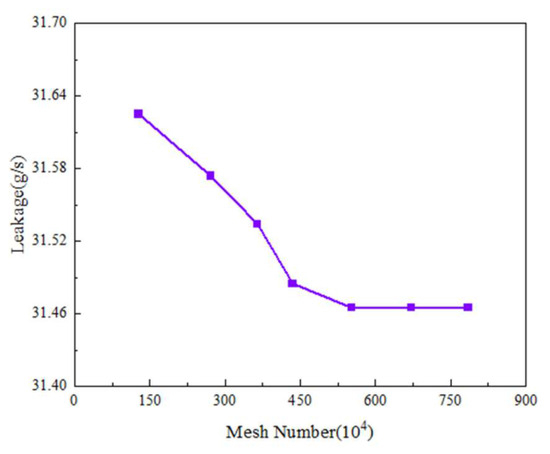
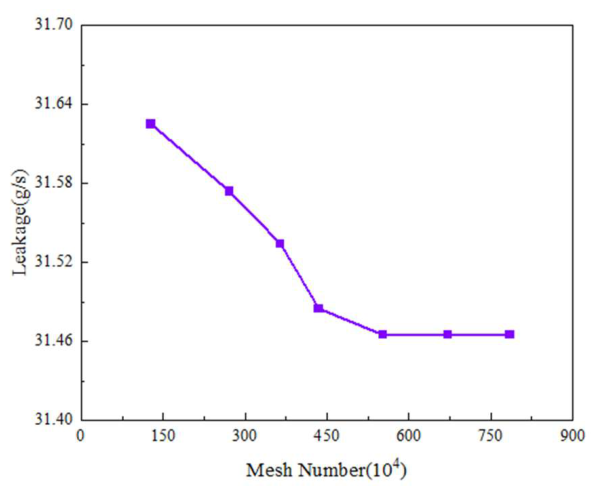
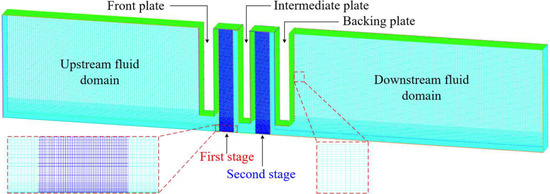
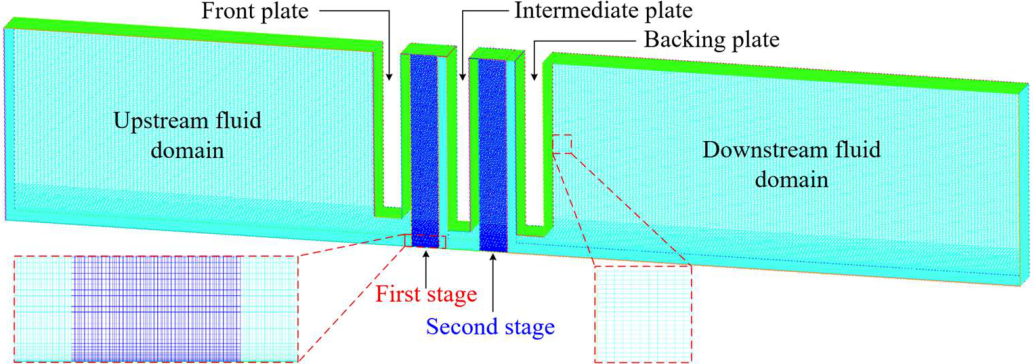
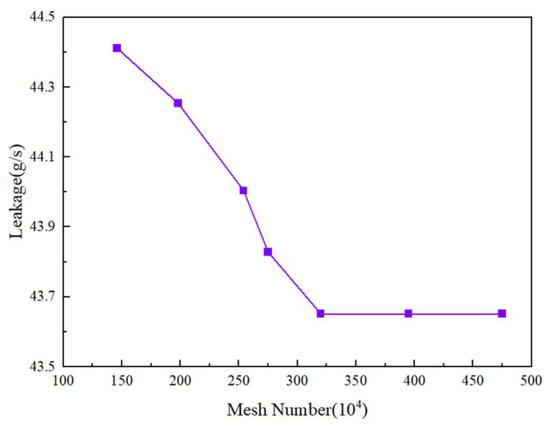
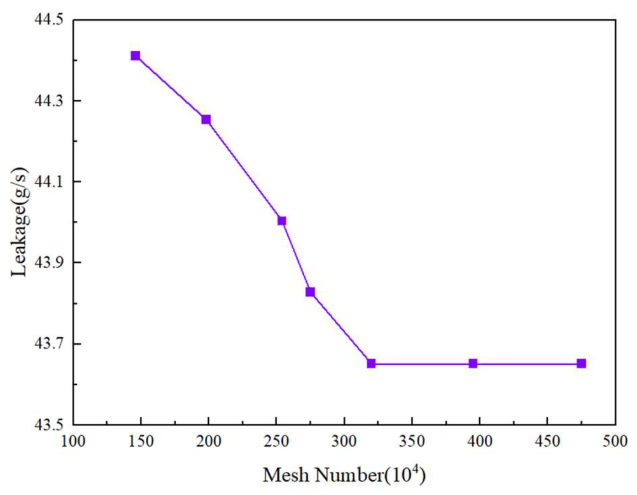
Taking the S1-TBM model as an example, the schematic diagram of mesh generation is shown in Figure 6. The entire model was meshed using a structured mesh, and the mesh in the inter-bristle pack gap regions was refined to improve solution accuracy. Figure 7 presents the mesh independence verification for the S1-TBM model. From that figure, it can be seen that, when the inlet pressure is 0.3 MPa, increasing the number of mesh elements improves the accuracy of the leakage rate solution. When the total number of mesh elements exceeded 4.5 million, the relative error in the brush seal leakage rate solution was controlled within 0.06%. Considering computational resources and solution accuracy, the final number of mesh elements was set to 5.53 million.
Figure 6.
Mesh of computational model (taking S1-TBM as an example).
Figure 7.
Mesh independence verification (taking S1-TBM as an example).
3.2.3. Three-Dimensional Tube-Bundle Boundary Condition
A three-dimensional staggered tube bundle solution model of the two-stage brush seal was established. The fluid medium was selected as an ideal gas, and the k-ε turbulence model was adopted. This model is known to provide accurate predictions for high-Reynolds-number flows under high-pressure and high-speed operating conditions, and it has also been reported to yield reliable results when pressure boundary conditions are applied at the inlet and outlet [12]. The inlet was set with a total pressure boundary condition ranging from 0.15 MPa to 0.5 MPa, the outlet with a static pressure boundary condition of 0.1 MPa, and the inlet and outlet temperatures were set to 300 K. Periodic boundary conditions were applied to the fluid domains on both sides of the numerical model. The plates were modeled using no-slip wall functions, and the lower boundary of the fluid domain was set as the rotor surface. The convergence criteria for the solution were set such that the residuals of both energy and momentum equations were less than 1 × 10⁻⁶.
3.3. Two-Stage Brush Seal Porous Medium Model
3.3.1. Porous Medium Numerical Model
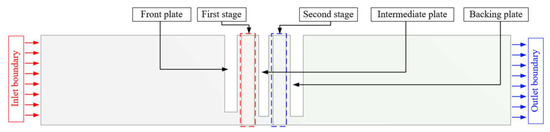
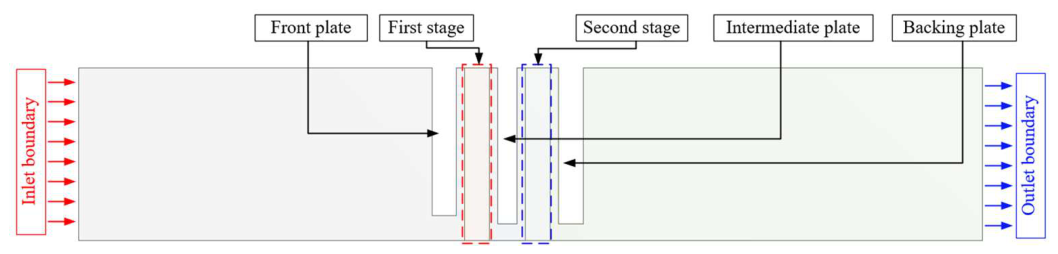
The porous medium model of the two-stage brush seal was established as shown in Figure 8. Since the internal flow of the brush seal was periodic, a 0.5° sector arc segment was selected as the research object in the numerical calculation. The specific structural parameters of the model are listed in Table 2.
Figure 8.
Schematic diagram of the two-stage brush seal porous-medium model.
3.3.2. Porous Medium Mesh Independence Assessment
The mesh generation of the model is shown in Figure 9. ANSYS ICEM CFD 2020R1 was used to generate the computational mesh, which was then imported into ANSYS Fluent 2020R1 for the numerical simulation of the leakage flow characteristics. To ensure solution accuracy, the interfaces between different regions and the flow boundary layer mesh were refined. The mesh independence verification results are shown in Figure 10. It can be seen from the figure that, when the inlet pressure is 0.4 MPa, increasing the number of mesh elements improved the accuracy of the leakage rate solution. When the total number of mesh elements exceeded 3 million, the relative error in the brush seal leakage rate solution was controlled within 1.97%. Considering computational resources and solution accuracy, the final number of mesh elements was set to 3.22 million.
Figure 9.
Mesh of computational model.
Figure 10.
Mesh independence verification.
3.3.3. Porous Medium Boundary Condition
For the porous medium model of the two-stage brush seal, the working fluid was selected as an ideal gas. The first- and second-stage bristle pack regions were defined as porous media zones and treated as laminar flow regions. The corresponding porosity, viscous resistance coefficients, and inertial resistance coefficients were specified separately for each porous region. For the fluid domains outside the bristle pack regions, the k-ε turbulence model was used. The inlet total pressure was set from 0.15 MPa to 0.5 MPa, the outlet static pressure was 0.1 MPa, and the inlet and outlet temperatures were 300 K. Periodic boundary conditions were applied to the symmetry planes of the model, a rotational speed was set on the rotor surface, and conditions were applied to the remaining walls. The solver employed the pressure–velocity coupled algorithm, with a first-order upwind scheme for the convective terms and a second-order upwind scheme for the diffusive terms. The convergence criteria for the solution were set such that the residuals of both energy and momentum equations were less than 1 × 10⁻⁶.
4. Analysis of the Calculation Results of the Resistance Coefficient of the Two-Stage Brush Seal Porous Medium
4.1. Analysis of Simulation Results of a Three-Dimensional Tube Bundle Model
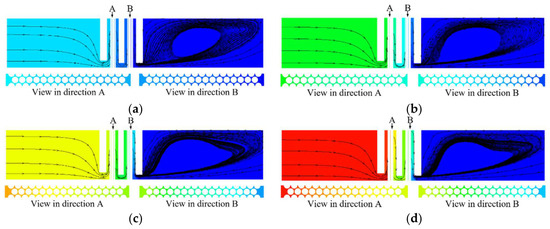
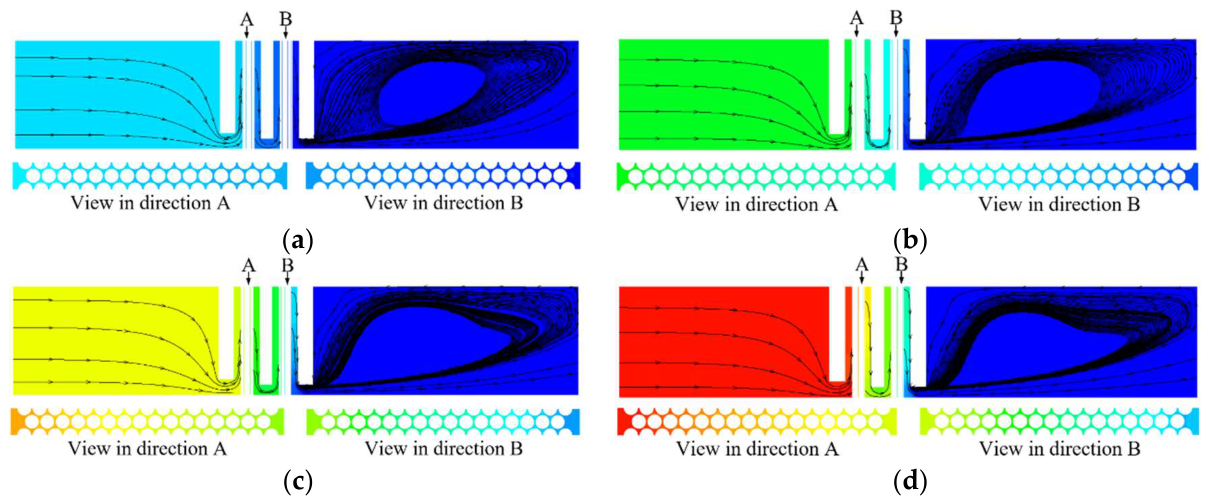
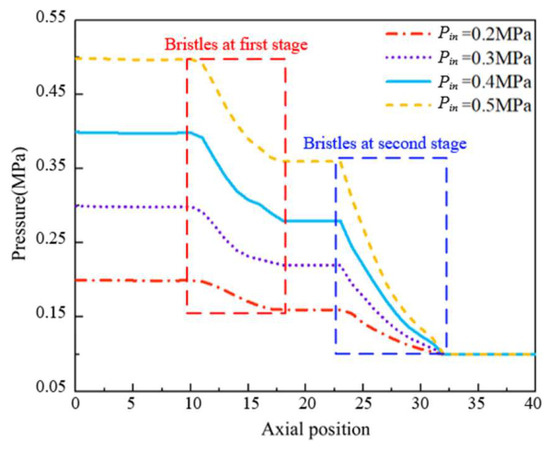
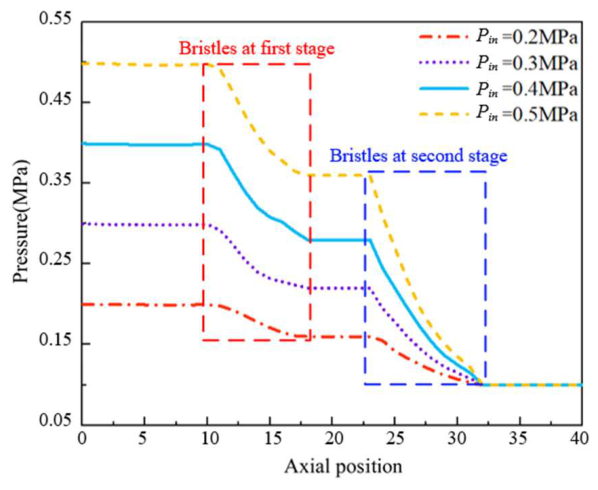
Pressure distribution contours of the two-stage brush seal, calculated based on the three-dimensional tube bundle model under different inlet pressures, are shown in Figure 11. It can be seen from the figure that the pressure drop of the two-stage brush seal is mainly concentrated in the bristle pack, and the pressure decreases gradually along the axial direction. Further extraction of the variation in gas pressure along the axial direction under different inlet pressures is presented in Figure 12. The pressure at the outlet of the first-stage bristle pack is approximately equal to the pressure at the inlet of the second-stage bristle pack, indicating that the two-stage brush seal exhibits series flow characteristics with continuous interstage pressure, which verifies the rationality of the model setup. As the inlet pressure increases, the pressure drop gradient in the bristle pack increases significantly, and the pressure drop variation in the second-stage bristle pack becomes more pronounced. This indicates that under high-pressure conditions, the second-stage bristle pack bears a larger share of the total pressure drop and experiences greater flow resistance in the actual flow.
Figure 11.
Two-stage brush seal pressure distribution cloud chart: (a) Pin = 0.2 MPa; (b) Pin = 0.3 MPa; (c) Pin = 0.4 MPa; and (d) Pin = 0.5 MPa.
Figure 12.
Axial pressure distribution of the two-stage brush seal under different inlet pressures.
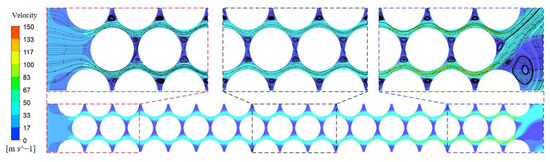
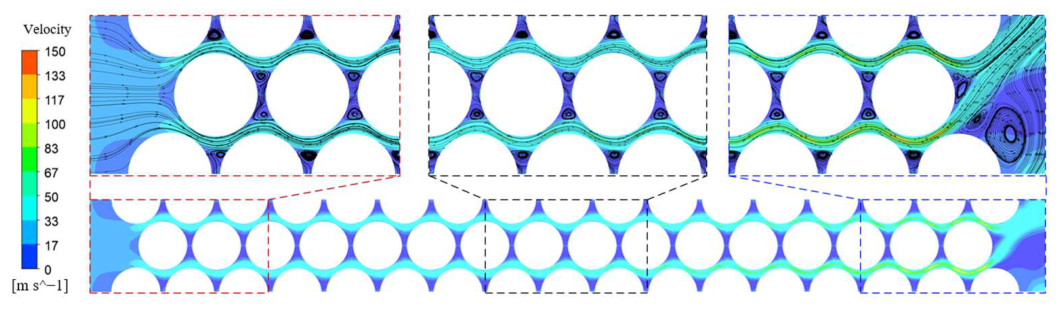
By extracting the interstage pressure of the two-stage brush seal as the outlet pressure of the S1-TBM model and the inlet pressure of the S2-TBM model, the leakage rates of the S1-TBM and S2-TBM models are calculated under the corresponding inlet and outlet pressures. The velocity distribution contours of the first- and second-stage brush seals at an inlet pressure of 0.3 MPa are shown in Figure 13. It can be seen from the figure that when the airflow enters the bristle pack, it flows around both sides of the bristles, effectively converting pressure energy into kinetic energy, and forms significantly high-velocity regions in the circumferential gaps between two adjacent rows of bristles, corresponding to the main leakage paths of the brush seal. Due to the blocking effect of the bristles, weak and small vortices exist between the axial rows of bristles, reducing airflow velocity. The gas accelerates in the gaps between bristles diagonally ahead, and the jet exits from the gap of the last row of bristles with deflection, then merges behind the bristle pack, forming an exit wake flow. This is because the adjacent bristles influence the gas due to the proximity effect, causing the wake to deflect. Moreover, as there is no constraint from bristles diagonally behind, the gas further accelerates after exiting the gap, resulting in a higher airflow velocity in the exit region.
Figure 13.
Brush seal velocity distribution cloud chart.
4.2. Analysis of Calculation Results of Porous Media Resistance Coefficient
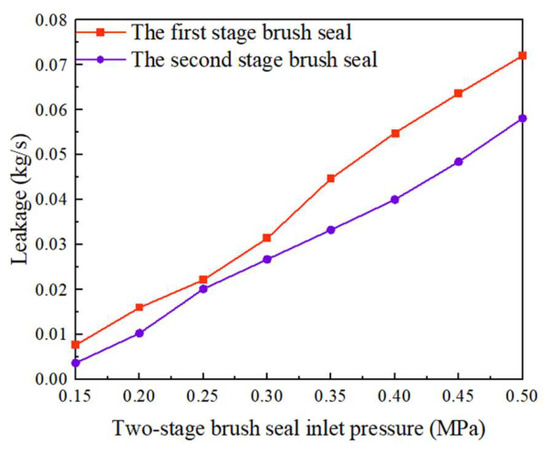
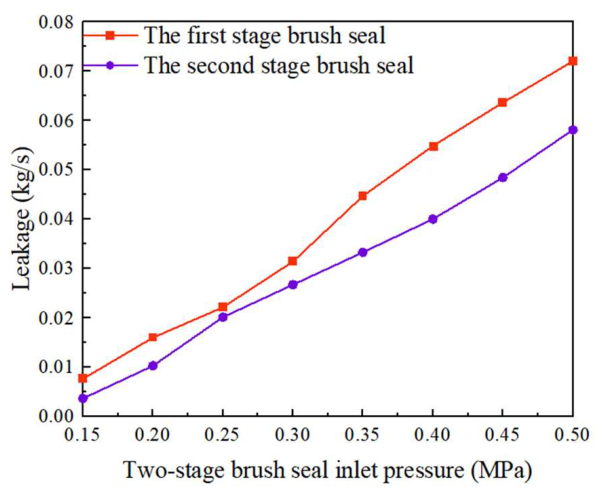
Figure 14 shows the leakage rates of the S1-TBM and S2-TBM models of the brush seal under different inlet and outlet pressures. According to Equations (24) and (25), the data sets of the viscous and inertial resistance coefficients of the two-stage brush seal are obtained, and the data sets are then processed according to Equation (27).
where Da represents the data groups obtained from the simulation.
Figure 14.
Leakage of a two-stage brush seal three-dimensional tube bundle model.
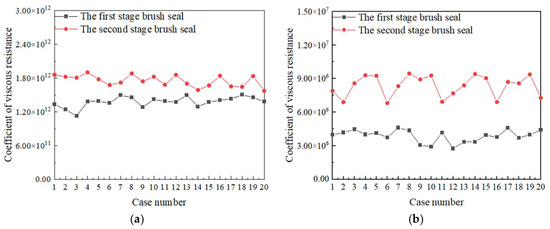
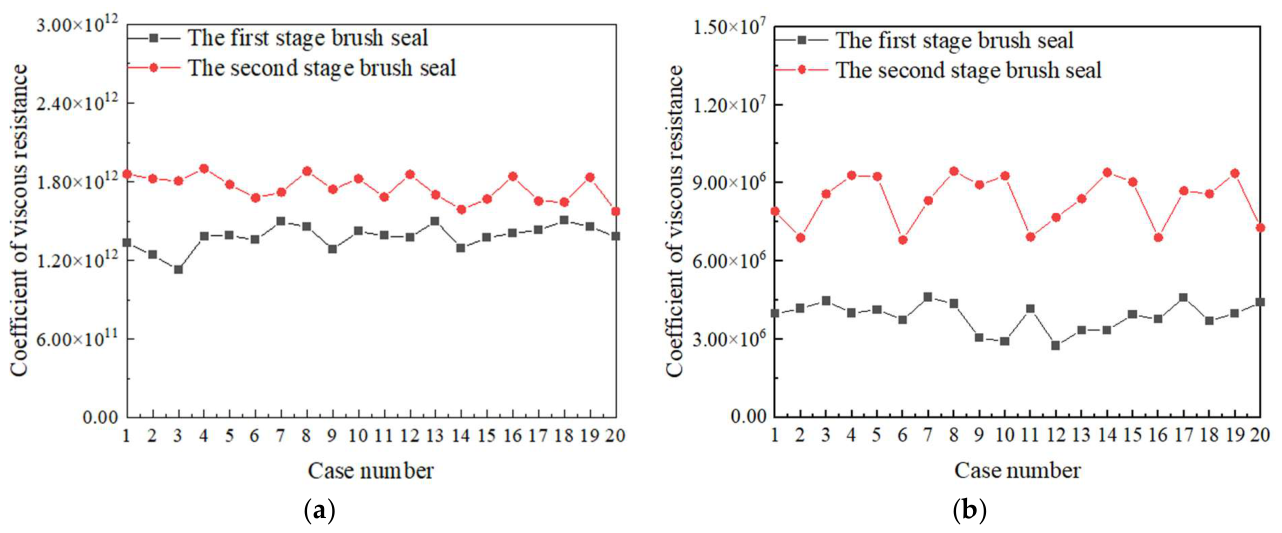
Figure 15 presents the calculated resistance coefficients of the first- and second-stage bristle pack of the two-stage brush seal. It can be seen from the figure that the calculated resistance coefficients are highly concentrated. The viscous resistance coefficient of the first stage mainly ranges from 1.13 × 10¹² to 1.50 × 10¹² m−2, and the inertial resistance coefficient of the first stage mainly ranges from 2.75 × 10⁶ to 4.6 × 10⁶ m−1. The viscous resistance coefficient of the second stage mainly ranges from 1.57 × 10¹² to 1.90 × 10¹² m−2, and the inertial resistance coefficient of the second stage mainly ranges from 6.81 × 10⁶ to 9.45 × 10⁶ m−1. By averaging the above calculated data to represent the resistance coefficients of the bristle pack, the axial and circumferential viscous and inertial resistance coefficients of the first and second stages of the porous medium model for the two-stage brush seal are obtained as 1/αx1 = 1.380117 × 10¹² m−2, Cx1 = 3,874,231 m−1; 1/αx2 = 1.752731 × 10¹² m−2, Cx2 = 8,348,192 m−1. Although the two stages have the same geometric structure, the axial resistance coefficients of the second stage are higher than those of the first stage: the viscous resistance coefficient of the second stage is 26.99% higher than that of the first stage, and the inertial resistance coefficient of the second stage is 53.59% higher. This is due to the different pressure drops and inlet flow conditions experienced by the two stages in the series configuration. After the gas flows through the first-stage bristle pack, its pressure and density decrease significantly. To maintain a constant mass flow rate, the gas velocity entering the second stage increases. The higher velocity results in a larger pressure drop across the second stage, thereby significantly increasing its resistance coefficients. According to Equation (26) and the structural parameters of the two-stage brush seal listed in Table 2, the radial viscous resistance coefficients of the first and second stages are calculated as 1/αr1 = 1/αr2 = 7.596488 × 10¹⁰ m−2. This is because the radial direction is not the primary flow direction in the brush seal structure, and any possible kinetic energy losses in actual flow are neglected.
Figure 15.
Two-stage brush seal porous medium resistance coefficient distribution map. (a) Viscous resistance coefficient distribution diagram. (b) Inertia resistance coefficient distribution diagram.
4.3. Analysis of Porous Media Model Simulation Results
4.3.1. Pressure Distribution Characteristics of Two-Stage Brush Seal
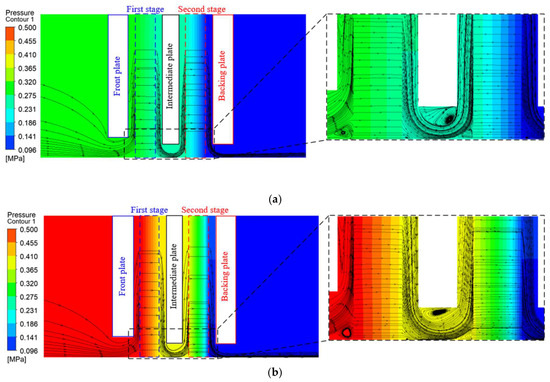
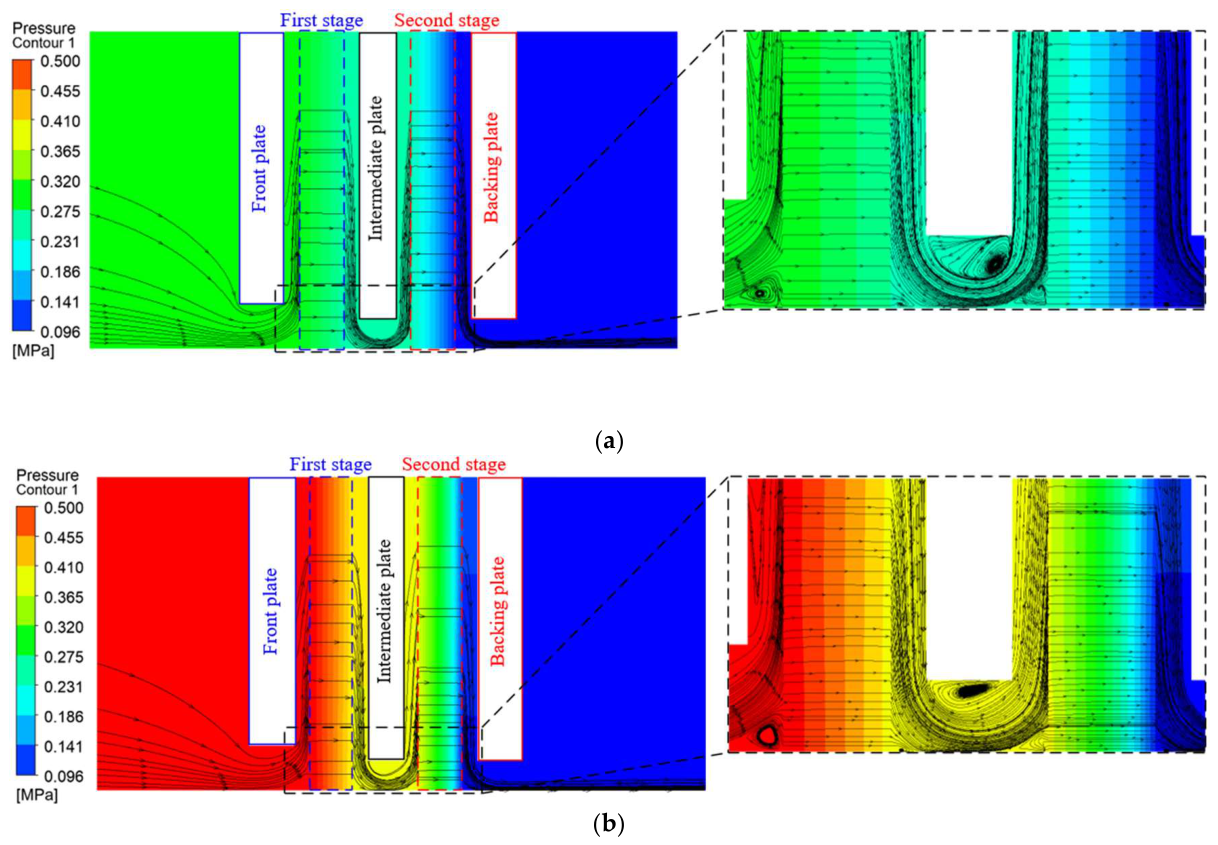
When the inlet pressures are 0.3 MPa and 0.5 MPa, the resistance coefficients obtained are substituted into the porous medium model to compute the pressure distribution contours of the two-stage brush seal, as shown in Figure 16. The region enclosed by the blue box represents the bristle pack of the first-stage brush seal, and the region enclosed by the red box represents the bristle pack of the second-stage brush seal. It can be seen from the figure that as the leakage gas flows through the bristle pack of the brush seal, the pressure decreases stepwise due to the internal system resistance of the bristle pack. Each sealing unit bears a portion of the total pressure drop, and the sealing unit near the low-pressure side experiences a larger pressure gradient. The pressure distribution within the interstage pressure cavity is uniform and stable. This is because the high-pressure gas accumulates in this region after passing through the gaps between the bristle pack and the plates, forming vortices that ensure sealing performance while providing a stable inlet condition for the second-stage brush seal unit. This verifies the rationality of using the interstage pressure as a boundary condition.
Figure 16.
Two-stage brush seal pressure distribution cloud chart: (a) Pin = 0.3 MPa and (b) Pin = 0.5 MPa.
4.3.2. Velocity Distribution Characteristics of Two-Stage Brush Seal
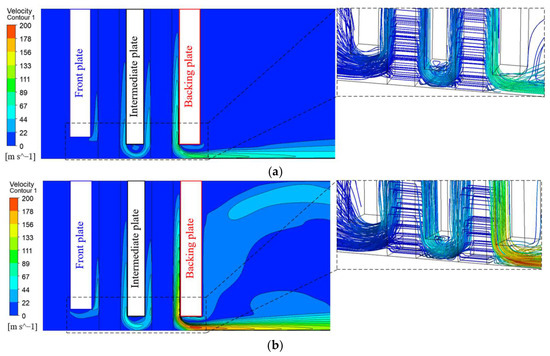
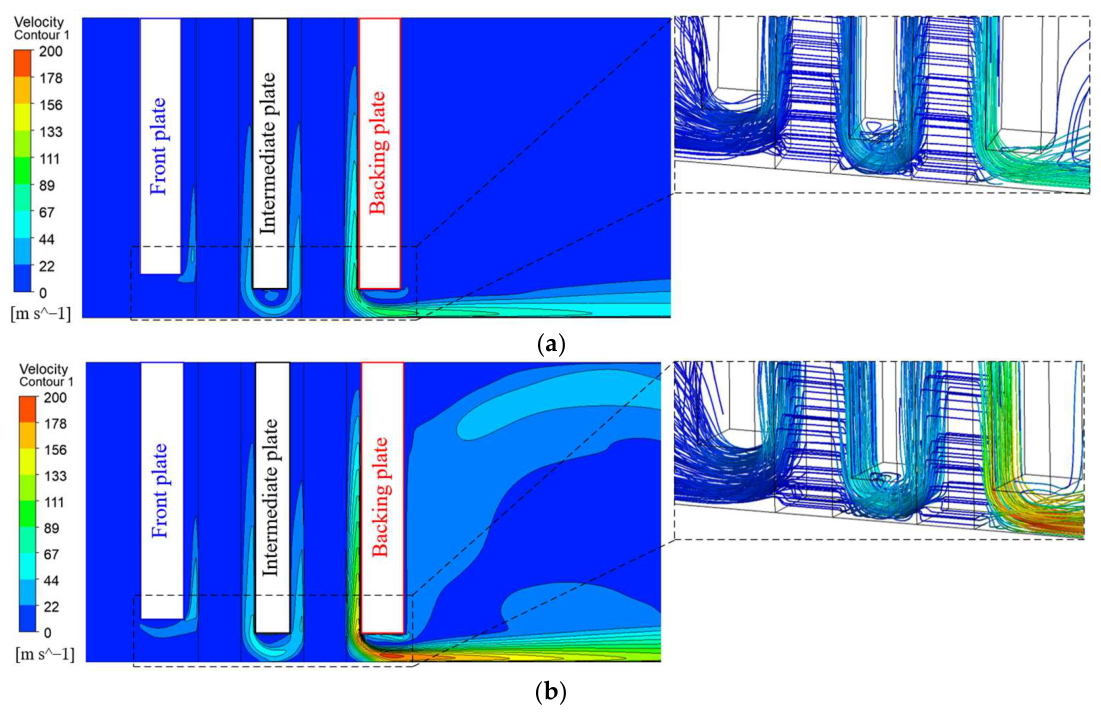
When the inlet pressures are 0.3 MPa and 0.5 MPa, the resistance coefficients obtained are substituted into the porous medium model to compute the velocity distribution contours of the two-stage brush seal, as shown in Figure 17. It can be seen from the figure that, due to the blocking effect of the porous medium region on the airflow, the leakage flow velocity decreases significantly as it passes through the bristle pack, where pressure energy is converted into kinetic energy and dissipated. After the airflow passes through the first-stage bristle pack and enters the interstage pressure cavity, the velocity increases again. Part of the airflow forms counterclockwise vortices within the cavity; these vortices enhance the mixing of the airflow, helping to maintain uniformity of the interstage pressure. At the same time, the dissipative effect of the vortices further improves the sealing performance of the seal. Another part of the airflow flows axially through the gap between the second-stage bristle pack and the intermediate plate into the second-stage bristle pack and then exits in a jet-like manner within the backing plate protection height region. This occurs because the second stage bears a larger pressure drop, and after the airflow passes through it, more pressure energy is converted into kinetic energy, resulting in a higher outlet velocity.
Figure 17.
Two-stage brush seal velocity distribution cloud chart: (a) Pin = 0.3 MPa and (b) Pin = 0.5 MPa.
5. Accuracy Verification of Calculation Method
5.1. Experimental Device
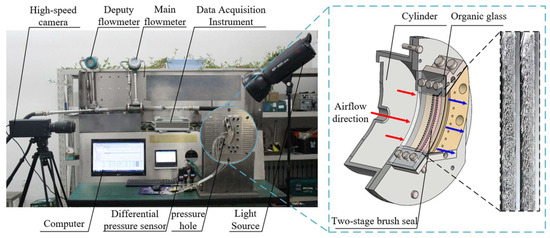
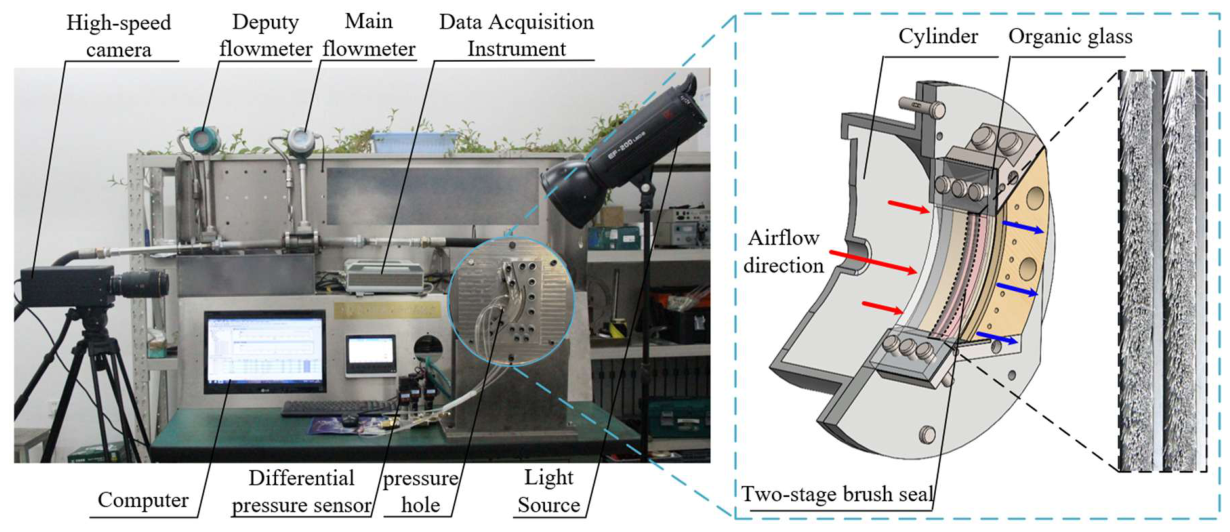
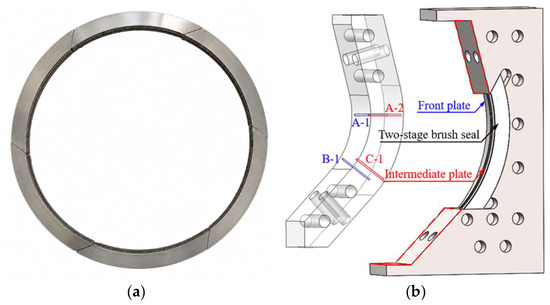
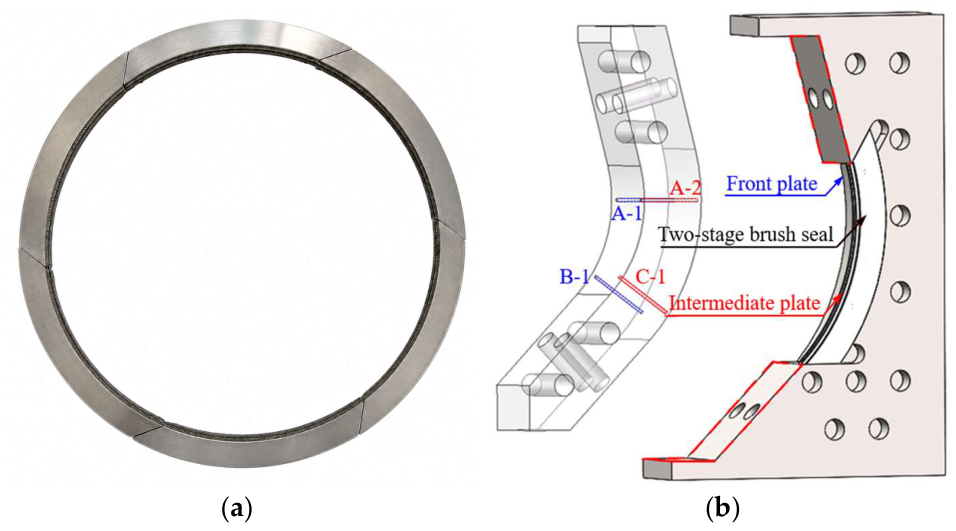
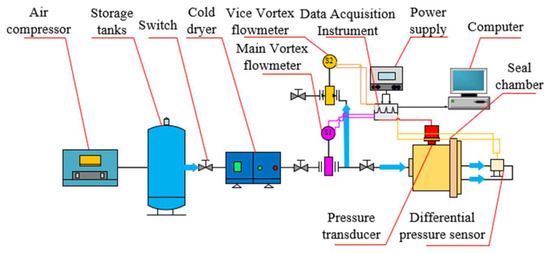
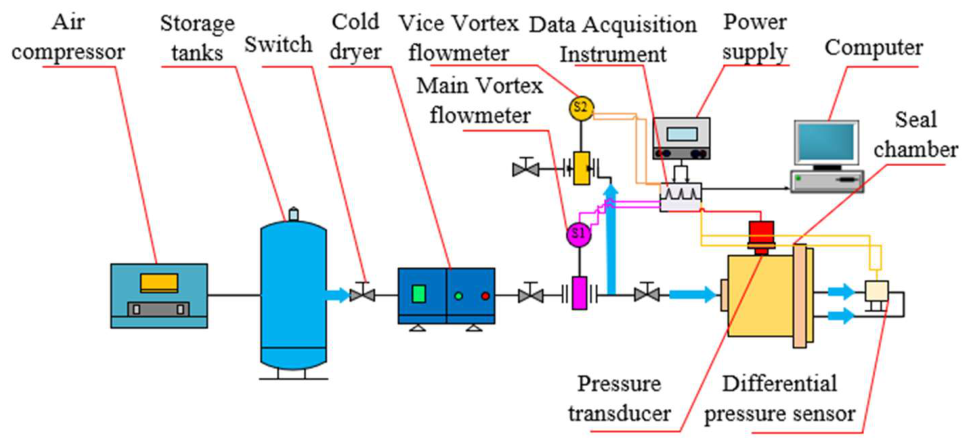
In this paper, an experimental setup for leakage flow characteristics of a two-stage brush seal was designed and constructed, as shown in Figure 18. Based on this setup, experimental studies on the leakage flow characteristics of a sector-shaped two-stage brush seal were carried out to validate the calculated resistance coefficients of the porous medium model for the two-stage brush seal. The experimental setup consists of three parts: an air intake system, a sealing system, and a measurement system. For the air intake system, during the experiment, high-pressure air was supplied by an air compressor into an air storage tank. The high-pressure air then flows through a refrigerated air dryer into the sealing chamber via pipelines, with a maximum pressure of 1.0 MPa, and the high-pressure air entering the sealing chamber is controlled by a pressure-regulating valve. For the sealing system, the sealing device comprises an experimental cylinder, a seal mounting seat, and the test specimen. The test specimen is shown in Figure 19a. During the experiment, the two-stage brush seal test specimen was installed and fixed in the experimental cylinder, with the free ends of the bristles in zero-clearance contact with the metal runway on the left side of the cylinder, thereby sealing the leaking gas. For the measurement system, a high-precision main flowmeter (measurement range: 110–870 Nm3/h) and an auxiliary flowmeter (measurement range: 20–275 Nm3/h) were installed in the upstream gas line and the downstream branch gas line, respectively. Both the main and auxiliary flowmeters were equipped with pressure and temperature compensation functions and have a measurement accuracy of Class 1. In the measurement system, four pressure measurement points were arranged on the runway, as shown in Figure 19b. Among them, points A-1 and B-1 were located at the front plate of the two-stage brush seal, and points A-2 and C-1 were located at the intermediate plate of the two-stage brush seal. The four pressure measurement points were connected to differential pressure sensors via flexible tubing. During the experiment, the measurement points were divided into three groups. The pressure drop data of the first stage of the two-stage brush seal could be calculated using points A-1 and A-2. The other end of point B-1 was connected to the atmosphere, allowing measurement of the inlet-side pressure of the two-stage brush seal. The other end of point C-1 was connected to the atmosphere, allowing measurement of the pressure drop data of the second stage of the two-stage brush seal. A data acquisition instrument was used to collect synchronized real-time data, which were displayed on a computer in real time. By calculating the average value of each group of pressure measurements, the interstage pressure between the two single-stage brush seal units was obtained.
Figure 18.
Two-stage brush seal leakage flow characteristic test bench.
Figure 19.
Two-stage brush seal experimental piece. (a) Physical diagram of the whole ring brush seal. (b) Pressure measurement point illustration.
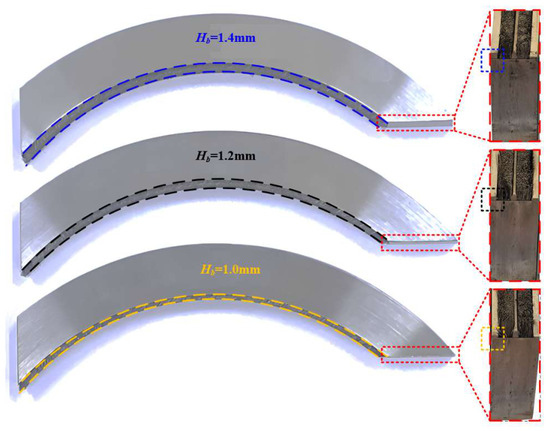
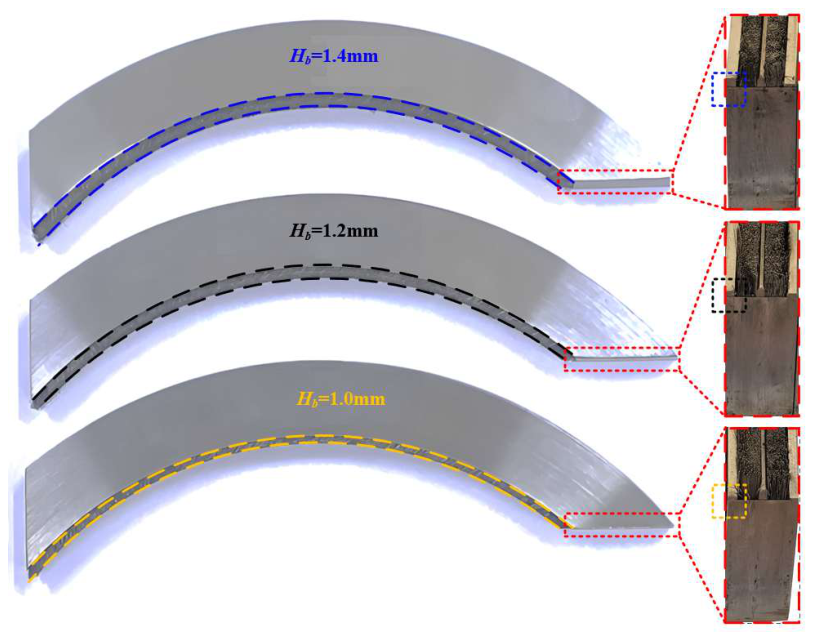
According to the literature [28], the backing plate protection height is an important factor affecting the pressure drop distribution across the two stages of a two-stage brush seal. Increasing the backing plate protection height enlarges the downstream flow area of the brush seal, thereby reducing the pressure drop ratio of the second-stage brush seal. To investigate the effect of backing plate protection height on the stage-wise resistance coefficients of the two-stage brush seal, three types of sector-shaped test specimens of two-stage brush seals with different backing plate protection heights, 1.0 mm, 1.2 mm, and 1.4 mm, were designed and manufactured. Except for the protection height, all other structural parameters were kept consistent. The test specimens are shown in Figure 20.
Figure 20.
Two-stage brush seal test pieces with different backing plate protection heights.
5.2. Experimental Principles
The schematic diagram of the gas circuit of the experimental setup for leakage flow characteristics of the two-stage brush seal is shown in Figure 21. As illustrated, external gas was compressed by an air compressor and then flowed into an air storage tank, serving as experimental gas. During the experiment, the gas was introduced via a valve into a refrigerated air dryer for drying treatment before entering the main flow path. A main flowmeter was installed on the main flow path. The gas passing through the main flowmeter flowed separately into the cylinder containing the two-stage brush seal test specimen and into a downstream branch circuit. When the experimental leakage rate was high, the upstream valve of the auxiliary flowmeter was closed, and the reading of the main flowmeter corresponds to the leakage rate of the brush seal under the corresponding pressure difference. When the leakage rate of the test specimen was low and the gas flow rate could not reach the lower limit of the main flowmeter’s measurement range at 110 Nm3/h, the upstream valve of the auxiliary flowmeter was opened, increasing the flow rate in the main path until it reached the lower limit of the main flowmeter’s range. Under this pressure difference, the leakage rate of the test specimen was the difference between the readings of the main flowmeter and the auxiliary flowmeter. Real-time experimental data were then acquired via data acquisition and a computer.
Figure 21.
Experimental schematic diagram.
5.3. Results and Analysis
5.3.1. Accuracy Verification of Porous Media Model
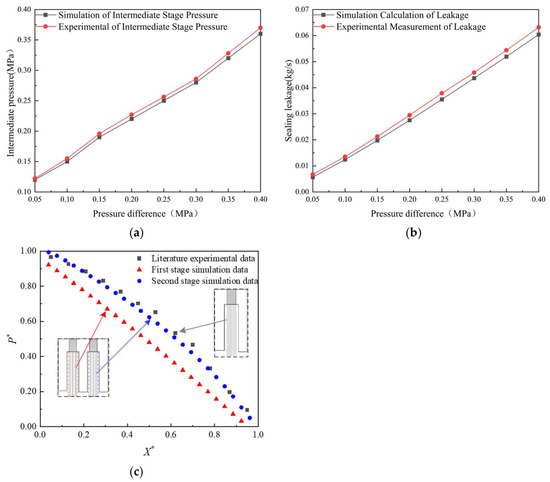
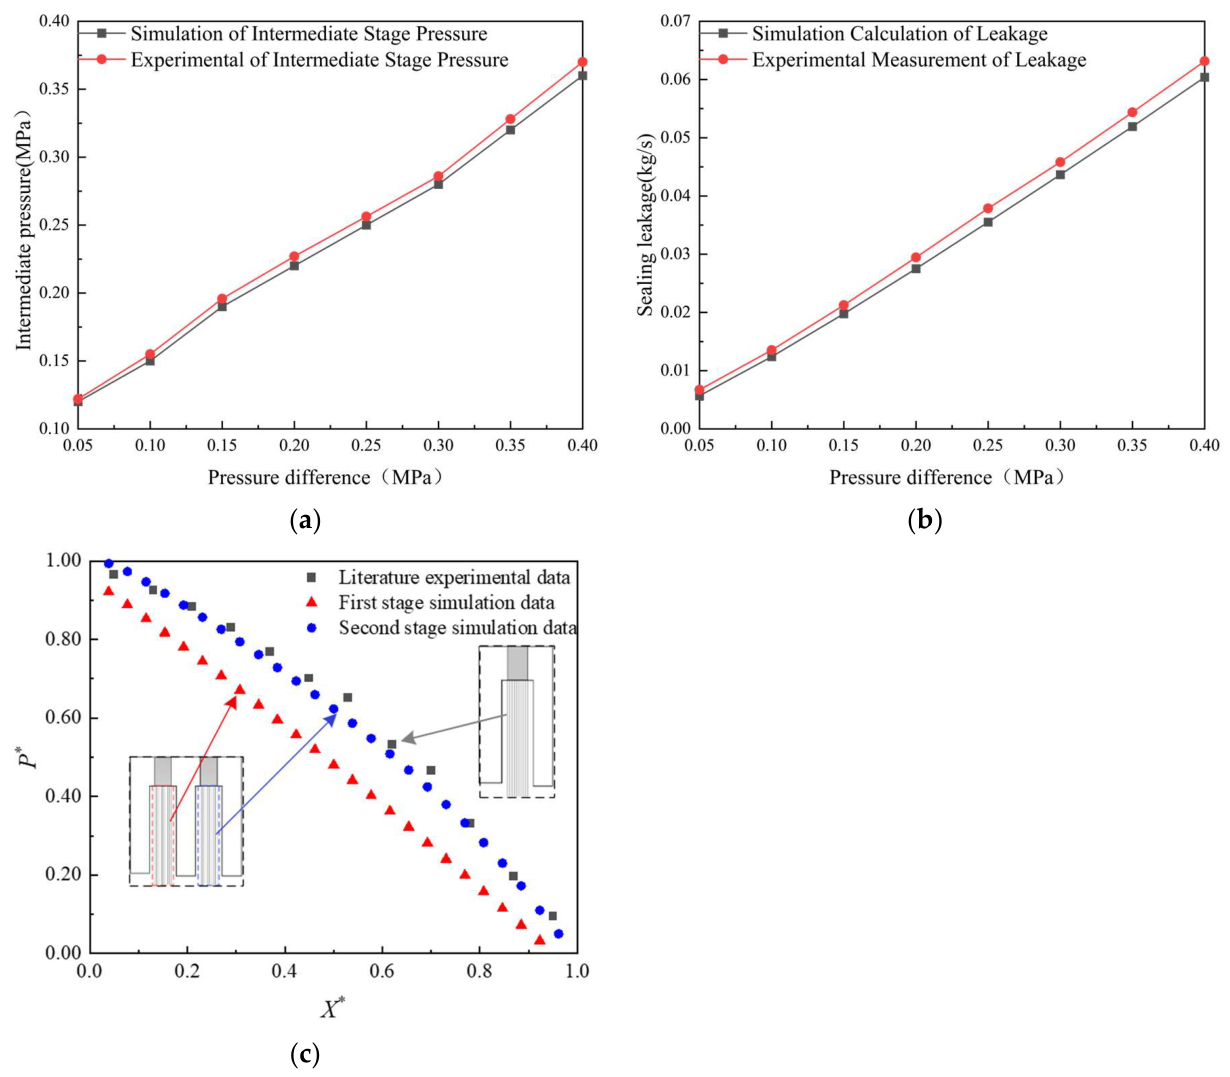
The simulation results are compared with the experimentally measured interstage pressure and leakage rate under inlet–outlet pressure differences ranging from 0.05 MPa to 0.4 MPa. Figure 22 presents the comparison curves. It can be seen from the figure that the calculated values of the leakage rate and interstage pressure agree well with the experimental measurements in terms of trend. The average relative error for the interstage pressure is 3.25%, and that for the leakage rate is 9.91%. The experimentally measured leakage rate and interstage pressure are slightly higher than the simulated values. This is mainly because there are leakage losses at the connection between the pressure guide tube and the cylinder, causing some fluctuation in the experimental inlet pressure. Additionally, the flowmeter used in the experiment introduces certain errors due to its own accuracy, leading to deviations between the calculated results and the experimental measurements. To further verify the rationality of the porous medium model, the axial pressure distributions within the first and second-stage bristle pack regions of the two-stage brush seal at an inlet pressure of 0.4 MPa were compared with the experimental results reported in the literature [6], as shown in Figure 22c. For ease of comparison, the pressure and axial position were normalized, as defined in Equation (28). Where pi and po are the inlet and outlet pressures of the corresponding bristle pack regions, and xi and xo are the corresponding axial inlet and outlet positions. As can be seen from the figure, both the present numerical results and the experimental data from the literature show an overall trend in which the normalized pressure continuously decreases with increasing axial position. In particular, the normalized pressure distribution in the second-stage bristle pack agrees well with the literature experimental data over most of the bristle pack region. Although the normalized pressure in the first-stage bristle pack is generally lower than the literature data, both exhibit a similar nonlinear pressure drop trend. These comparisons further demonstrate the accuracy of the obtained resistance coefficients and the rationality of the porous medium model.
Figure 22.
Comparison of test and simulation results. (a) Intermediate stage pressure comparison. (b) Sealing leakage comparison. (c) Comparison of normalized axial pressure distributions with literature data, where P* is the normalized pressure and X* is the normalized axial coordinate.
To further validate the effectiveness of the proposed method for determining the resistance coefficients, the bristles of each stage of the two-stage brush seal are regarded as a single overall porous medium region based on the experimentally measured leakage rate and inlet/outlet pressure data. The equivalent resistance coefficients of the two-stage brush seal are then calculated according to Equation (15). These equivalent coefficients represent the overall average resistance characteristics of the two-stage brush seal obtained from experimental measurements. The calculation results show that, within the operating range of inlet–outlet pressure differences from 0.05 MPa to 0.4 MPa, the equivalent viscous resistance coefficient 1/αexp and the equivalent inertial resistance coefficient Cexp back-calculated from the experimental data are 1.6 × 10¹² m−2 and 6.15 × 10⁶ m−1, respectively, which lie between the simulated resistance coefficients of the first and second stages. In this study, the arithmetic mean of the resistance coefficients under 20 operating conditions was taken as the overall resistance coefficient result. As the number of data points increases, the mean value will approach the true resistance coefficient. These results verify the reliability of the proposed method for determining the resistance coefficients of two-stage brush seals based on the three-dimensional tube bundle model in engineering applications.
5.3.2. Analysis of Leakage Characteristics of Two-Stage Brush Seal Under Different Back Baffle Protection Heights
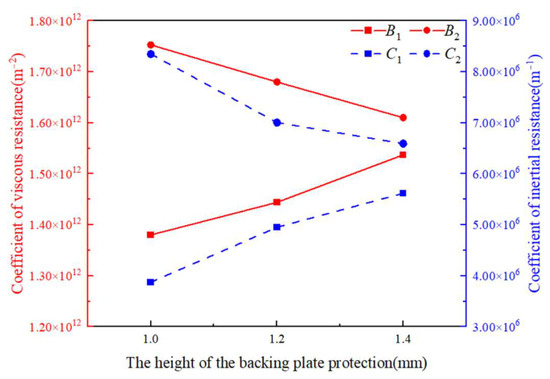
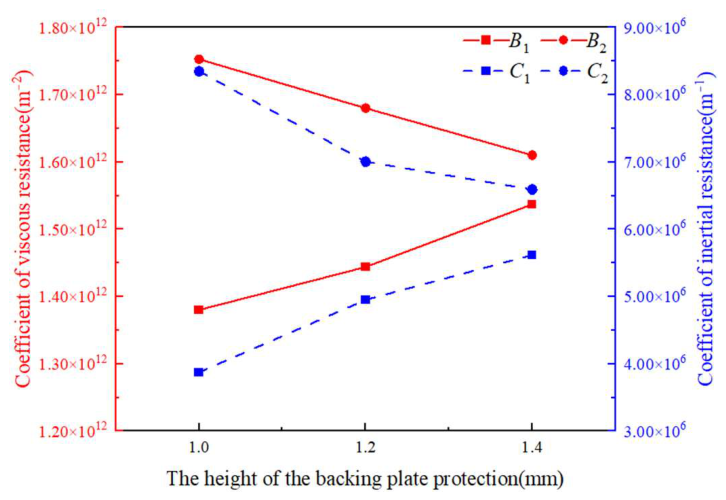
Figure 23 presents the viscous and inertial resistance coefficients of each stage of the two-stage brush seal solved under the same inlet–outlet pressure for backing plate protection heights of 1.0 mm, 1.2 mm, and 1.4 mm. It can be seen from the figure that the viscous resistance coefficient of the first-stage brush seal ranges from 1.38 × 10¹²~1.54 × 10¹² m−2, and the inertial resistance coefficient ranges from 3.8 × 10⁶~5.62 × 10⁶ m−1; for the second-stage brush seal, the viscous resistance coefficient ranges from 1.61 × 10¹²~1.75 × 10¹² m−2, and the inertial resistance coefficient ranges from 6.59 × 10⁶~8.35 × 10⁶ m−1. As the backing plate protection height increases, the resistance coefficients of the first-stage brush seal gradually increase, while those of the second-stage brush seal gradually decrease, and the resistance coefficients of the second stage are higher than those of the first stage. Comparing the increase in backing plate protection height from 1.0 mm to 1.4 mm, the viscous resistance coefficient of the first-stage brush seal increases by 10.39%, and the inertial resistance coefficient increases by 32.38%; the viscous resistance coefficient of the second-stage brush seal decreases by 8.69%, and the inertial resistance coefficient decreases by 21.07%. This is because an increase in the backing plate protection height enlarges the outlet flow area of the two-stage brush seal, reducing the degree of airflow compression on the second-stage bristle pack, decreasing local flow resistance, and thereby improving the interstage pressure distribution between the first and second stages of the two-stage brush seal.
Figure 23.
The variation in viscous and inertial resistance coefficients under different backing plate protection heights.
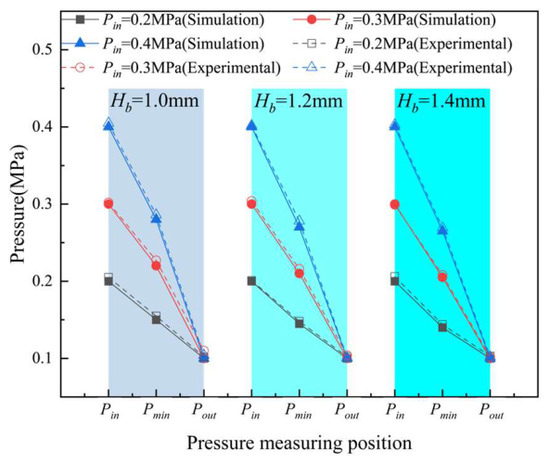
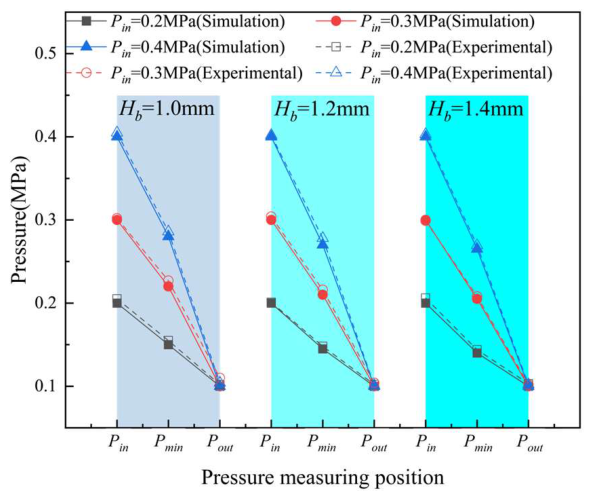
Figure 24 presents the numerical and experimental curves of pressure variation in the two-stage brush seal under different backing plate protection heights. It can be seen from the figure that as the backing plate protection height increases, the interstage pressure of the two-stage brush seal at the same inlet–outlet pressure gradually decreases, which is consistent with the analysis results shown in Figure 23. That is, a change in the backing plate protection height alters the pressure distribution between the first and second stages of the two-stage brush seal, thereby affecting the resistance coefficients in each stage region. When the inlet pressure is 0.4 MPa and the backing plate protection height is increased from 1.0 mm to 1.4 mm, the simulated interstage pressure decreases by 5.66%, with an average relative error of 3.34% compared with the experimental results. The experimentally measured interstage pressures are slightly higher than the simulated values.
Figure 24.
Numerical and experimental comparison of pressure change in a two-stage brush seal.
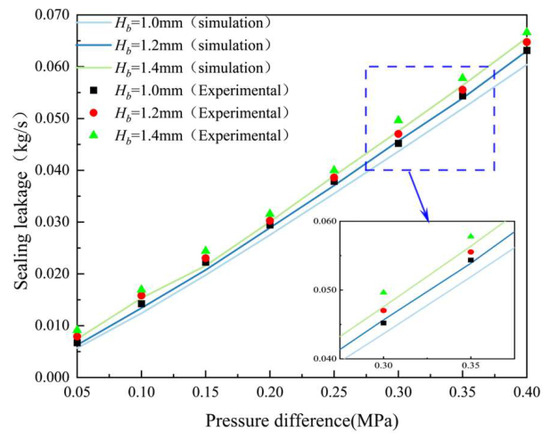
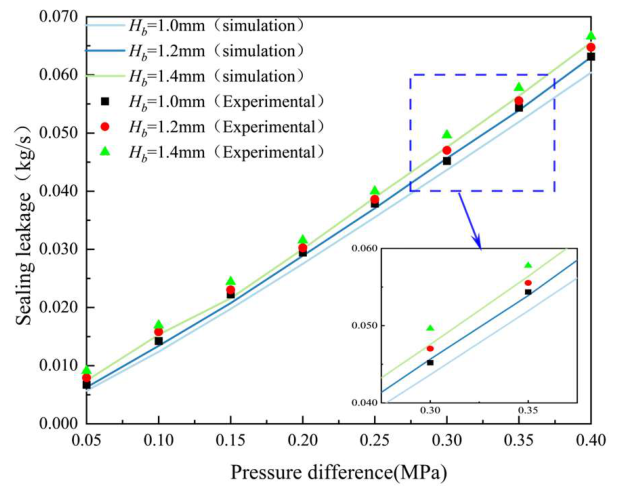
Figure 25 presents the numerical and experimental curves of leakage rate variation in the two-stage brush seal under different backing plate protection heights. It can be seen from the figure that as the backing plate protection height increases, the leakage rate of the two-stage brush seal gradually increases. When the inlet–outlet pressure difference is 0.3 MPa and the backing plate protection height is increased from 1.0 mm to 1.4 mm, the simulated leakage rate increases by 8.96%. This is because a higher protection height increases the outlet flow area, thereby reducing the flow resistance of the airflow in the second-stage bristle pack. The simulated leakage rates are in good agreement with the experimentally measured leakage rates in terms of trend, with an average relative error of 15.47% between them. This validates the effectiveness and accuracy of the method for determining the resistance coefficients of the porous medium model based on the three-dimensional tube bundle model, demonstrating that the proposed method can accurately predict the stage-wise resistance coefficients and the total leakage rate of two-stage brush seals with different configurations.
Figure 25.
Numerical and experimental comparison of leakage of a two-stage brush seal.
6. Conclusions
This paper addresses the reliance of the stage-wise resistance coefficients of the porous medium model for two-stage brush seals on experimental calibration and the difficulty in distinguishing the resistance characteristics of each stage. A three-dimensional tube bundle model-based method is proposed to determine the porous medium resistance coefficients of two-stage brush seals. By simulating fluid flow through the bristle pack and combining porous medium theory with Hagen–Poiseuille flow theory, the stage-wise resistance coefficients are derived to predict the leakage flow characteristics of two-stage brush seals. Test specimens with different backing plate protection heights are designed and manufactured to validate the accuracy of the proposed method. The main research conclusions are as follows:
1. This paper establishes a method for determining the porous medium resistance coefficients of two-stage brush seals based on a three-dimensional tube bundle model. Compared with the experimental results, the average relative error in leakage rate is 9.91%, showing good agreement, which verifies the accuracy and reliability of the proposed method in solving the porous medium resistance coefficients of two-stage brush seals and predicting the leakage flow characteristics.
2. The viscous and inertial resistance coefficients of the second-stage bristle pack in a two-stage brush seal are higher than those of the first stage. Under the structural parameters of the two-stage brush seal considered in this paper, the viscous resistance coefficient of the second stage is 26.99% higher than that of the first stage, and the inertial resistance coefficient of the second stage is 115.48% higher than that of the first stage.
3. As the backing plate protection height of the two-stage brush seal increases, the resistance coefficients of the first-stage bristle pack increase, while those of the second-stage bristle pack decrease, and the total leakage of the seal gradually increases. When the backing plate protection height is increased from 1.0 mm to 1.4 mm, the viscous resistance coefficient of the first-stage bristle pack increases by 10.39%, and the inertial resistance coefficient increases by 32.38%; the viscous resistance coefficient of the second-stage bristle pack decreases by 8.69%, and the inertial resistance coefficient decreases by 21.07%, while the total leakage of the seal increases by 8.96%.
Author Contributions
Conceptualization, J.S. and D.S.; methodology, J.S.; software, B.P.; validation, J.S., L.Z. and S.L.; formal analysis, D.S.; investigation, B.P.; resources, Y.J.; data curation, J.S.; writing—original draft preparation, J.S.; writing—review and editing, D.S. and Y.J.; visualization, J.S.; supervision, D.S. and Y.J.; project administration, D.S.; funding acquisition, D.S. All authors have read and agreed to the published version of the manuscript.
Funding
This research was funded by the National Natural Science Foundation of China under grant numbers 52475206 and 52375195.
Data Availability Statement
The original contributions presented in this study are included in the article.
Conflicts of Interest
Author Yongjuan Jing was employed by the company Beijing Institute of Aeronautical Materials, Aero Engine Corporation of China. The remaining authors declare that the research was conducted in the absence of any commercial or financial relationships that could be construed as a potential conflict of interest.
Abbreviations
The following abbreviations are used in this manuscript:
| Mass flow rate | |
| qv | Volumetric flow rate |
| v | Gas velocity |
| ρ | Gas density |
| A | Flow cross-sectional area |
| R | Specific gas constant |
| T | Gas temperature |
| p | Gas pressure |
| i | Direction index, i = x, r, θ |
| x | Axial direction |
| r | Radial direction |
| θ | Circumferential direction |
| ui | Component of the velocity vector in the i-direction |
| τij | Viscous stress tensor of the fluid |
| Fi | Component of the resistance source term in the i-direction |
| 1/αi | Viscous resistance coefficient in the i-direction |
| Ci | Inertial resistance coefficient in the i-direction |
| μ | Dynamic viscosity of the fluid |
| ∆L | Axial thickness of the bristle pack |
| d | Bristle diameter |
| d0 | Diameter of the circular tube |
| Ar,t | Cross-sectional area of the radial channel of the bristle pack |
| Lr,w | Wetted perimeter |
| ∆Pf | First-stage pressure drop |
| ∆Ptotal | Total pressure drop |
| Da | Data groups |
| P* | Normalized static pressure |
| X* | Normalized axial position |
| po | Outlet pressure of the corresponding bristle pack region |
| pi | Inlet pressure of the corresponding bristle pack region |
| xo | Axial outlet position of the corresponding bristle pack region |
| xi | Axial inlet position of the corresponding bristle pack region |
| TS-TBM | Two-stage brush seal three-dimensional tube bundle model |
| S1-TBM | The first-stage brush seal three-dimensional tube bundle model |
| S2-TBM | The second-stage brush seal three-dimensional tube bundle model |
| TS-PMM | Two-stage brush seal porous medium model |
References
- Yang, J.; Huang, S.; Suo, S.; Wang, A. Investigating the frictional force distributions and inter-stage imbalance of a two-stage brush seal. AIP Adv. 2020, 10, 035323. [Google Scholar] [CrossRef] [Scilit]
- Sun, D.; Liu, N.-N.; Fei, C.-W.; Hu, G.-Y.; Ai, Y.-T.; Choy, Y.-S. Theoretical and numerical investigation on the leakage characteristics of brush seals based on fluid–structure interaction. Aerosp. Sci. Technol. 2016, 58, 207–216. [Google Scholar] [CrossRef] [Scilit]
- Dogu, Y.; Bahar, A.S.; Sertçakan, M.C.; Piskin, A.; Arıcan, E.; Kocagül, M.; Arican, E. Computational fluid dynamics investigation of brush seal leakage performance depending on geometric dimensions and operating conditions. J. Eng. Gas. Turbines Power 2016, 138, 032506. [Google Scholar] [CrossRef] [Scilit]
- Ma, D.; Zhang, Y.; Li, Z.; Li, J.; Yan, X. Numerical investigations on the leakage flow characteristics of brush seal based on the three-dimensional staggered tube bundle model. J. Eng. Gas Turbines Power 2021, 143, 051023. [Google Scholar] [CrossRef] [Scilit]
- Souissi, A.; Arghir, M.; Lasseux, D.; Amami, L.; Burlot, P. Leak-Rate Through Carbon Brush Seals: Experimental Tests Versus Predictions From a Porous Medium Approach. J. Fluids Eng. 2025, 147, 041203. [Google Scholar] [CrossRef] [Scilit]
- Bowen, J.P.; Bird, J.J.; Cross, H.; Jenkins, M.R.; Bowsher, A.A.; Crudgington, P.F.; Sangan, C.M.; Scobie, J.A. Fluid Dynamic Behavior of Conventional and Pressure Relieving Brush Seals. ASME. J. Eng. Gas Turbines Power 2024, 146, 061001. [Google Scholar] [CrossRef] [Scilit]
- Ahmed, A.A.M.; Liu, M.; Kang, Y.; Wang, J.; Idriss, A.I.B.; Tin, N.T.T. Brush Seal Performance with Ideal Gas Working Fluid under Static Rotor Condition. Machines 2024, 12, 476. [Google Scholar] [CrossRef] [Scilit]
- Ahmed, A.A.M.; Wang, J.; Liu, M.; Idriss, A.I.B.; Abaker, A.O.I. Advanced Computational Investigation of Brush Seal Thermo-Fluid–Mechanical Performance Through Novel Porous Media Coefficient Derivation. Computation 2026, 14, 83. [Google Scholar] [CrossRef] [Scilit]
- Chew, J.; Lapworth, B.; Millener, P.J. Mathematical modeling of brush seals. Int. J. Heat Fluid Flow 1995, 16, 493–500. [Google Scholar] [CrossRef] [Scilit]
- Dogu, Y. Investigation of Brush Seal Flow Characteristics Using Bulk Porous Medium Approach. ASME J. Eng. Gas Turbines Power 2005, 127, 136–144. [Google Scholar] [CrossRef] [Scilit]
- Gresham, T.G.; Weaver, B.K.; Wood, H.G.; Untaroiu, A. Characterization of Brush Seal Permeability. In Proceedings of the ASME Turbine Technical Conference and Exposition, Seoul, Republic of Korea, 13–17 June 2016. [Google Scholar]
- Kwon, J.W.; Ahn, J. Prediction of Leakage Flow Rate and Blow-Down in Brush Seals via 2D CFD Simulation with Porosity Correction. Appl. Sci. 2024, 14, 8821. [Google Scholar] [CrossRef] [Scilit]
- Ha, Y.; Ha, T.; Byun, J.; Lee, Y. Leakage effects due to bristle deflection and wear in hybrid brush seal of high-pressure steam turbine. Tribol. Int. 2020, 150, 106325. [Google Scholar] [CrossRef] [Scilit]
- Song, X.; Liu, M.; Hu, X.; Wang, X.; Liao, T.; Sun, J. Numerical Analysis of Flow across Brush Elements Based on a 2-D Staggered Tube Banks Model. Aerospace 2021, 8, 19. [Google Scholar] [CrossRef] [Scilit]
- Song, X.; Liu, M.; Yang, J. Numerical Analysis of Leakage Performance of Brush Seal Based on a 2-D Tube Bank Model and Porous Medium Model Considering the Effect of Compressible Gas. Int. J. Fluid Mach. Syst. 2022, 15, 329–343. [Google Scholar] [CrossRef] [Scilit]
- Sun, D.; Yang, Y.; Zhao, H.; Zhang, J.; Wang, M.; Tian, S. Effects of inter-stage intake and exhaust on frictional heat at bristle tips in a dual-stage brush seal. Phys. Fluids 2025, 37, 075165. [Google Scholar] [CrossRef] [Scilit]
- Zhao, H.; Jiao, Z.Z.; Sun, D.; Liu, Y.Q.; Zhan, P.; Xin, Q. Numerical and experimental research on interstage pressure drop distribution affecting factors of multi-stage brush seals. Acta Aeronaut. Astronaut. Sin. 2020, 41, 123544. [Google Scholar]
- Zhao, H.; Li, Y.; Sun, D.; Li, Y.; Wen, S.; Sun, J. Inter-Stage Pressure Drop of Multi-Stage Brush Seal With Differentiated Structure. ASME. J. Eng. Gas Turbines Power 2023, 145, 071001. [Google Scholar] [CrossRef] [Scilit]
- Hendricks, R.C.; Griffin, T.A.; Kline, T.R.; Csavina, K.R.; Pancholi, A.; Sood, D. Relative Performance Comparison Between Baseline Labyrinth and Dual Brush Compressor Discharge Seals in a T-700 Engine Test. In Proceedings of the ASME 1994 International Gas Turbine and Aeroengine Congress and Exposition, The Hague, Netherlands, 13–16 June 1994. [Google Scholar]
- Pugachev, A.; Helm, P. Calibration of porous medium models for brush seals. Proc. Inst. Mech. Eng. Part A J. Power Energy 2009, 223, 83–91. [Google Scholar] [CrossRef] [Scilit]
- Neef, M.; Hepermann, F.; Sürken, N.; Schettel, J. Brush seal porosity modeling applicability and limitations. In Proceedings of the 7th European Conference on Turbomachinery, Athens, Greece, 5–9 March 2007. [Google Scholar]
- Gu, C.; Ma, Y.; Zhao, W.; Sui, X.; Hu, B.; Zhao, Q. A Numerical Study of the Sealing and Interstage Pressure Drop Characteristics of a Four-Tooth Three-Stage Brush Combination Seal. Appl. Sci. 2025, 15, 3899. [Google Scholar] [CrossRef] [Scilit]
- Li, Y.; Xu, H.; Zhang, J.; Sun, D.; Yang, Z. Leakage Flow Characteristics of Novel Two-Stage Brush Seal with Pressure-Equalizing Hole. Lubricants 2025, 13, 190. [Google Scholar] [CrossRef] [Scilit]
- Steinetz, B.M.; Hendricks, R.C. Engine seal technology requirements to meet NASA’s Advanced Subsonic Technology program goals. J. Propuls. Power 1996, 12, 786–793. [Google Scholar] [CrossRef] [Scilit]
- Ergun, S. Fluid Flow through Packed Columns. Chem. Eng. Prog. 1952, 48, 89–94. [Google Scholar]
- Proestler, S. Modellierung und Numerische Berechnungen von Wellenabdichtungen in Bürstenbauart. Ph.D. Thesis, University of Bochum, Bochum, Germany, 2005. [Google Scholar]
- Kang, Y.; Liu, M.; Kao-Walter, S.; Reheman, W.; Liu, J. Predicting aerodynamic resistance of brush seals using computational fluid dynamics and a 2-D tube banks model. Tribol. Int. 2018, 126, 9–15. [Google Scholar] [CrossRef] [Scilit]
- Zhang, J.; Sun, D.; Zhao, H.; Xu, W.; Mu, W.; Zhang, J. Numerical study on leakage flow characteristics of novel two-stage pressure equalizing brush seal. J. Aerosp. Power 2025, 40, 20230114. [Google Scholar]

Disclaimer/Publisher’s Note: The statements, opinions and data contained in all publications are solely those of the individual author(s) and contributor(s) and not of MDPI and/or the editor(s). MDPI and/or the editor(s) disclaim responsibility for any injury to people or property resulting from any ideas, methods, instructions or products referred to in the content. |
© 2026 by the authors. Licensee MDPI, Basel, Switzerland. This article is an open access article distributed under the terms and conditions of the Creative Commons Attribution (CC BY) license.