


Abstract
Experimental data at flight-relevant Reynolds numbers remain scarce for publicly available transport aircraft standard models. This study analyses Reynolds number effects on the CHN-T1 large-aspect-ratio configuration using measurements from the cryogenic European Transonic Wind Tunnel, covering Mach 0.20–0.90 and unit Reynolds numbers from 3.6 × 10⁶ to 37.8 × 10⁶. A split transition strategy (fixed at low Re, free at high Re) is employed; the resulting trends are smooth and physically consistent with boundary-layer stability behaviour across the configuration change. At the cruise condition (M = 0.78), the non-induced drag coefficient CDV follows a power law CDV ∝ Re−n with n = 0.141, corresponding to about 70% of the canonical turbulent flat-plate exponent n = 1/5. At off-design Mach numbers, the exponent reduces to n = 0.126 (M = 0.60) and n = 0.125 (M = 0.85), reflecting growing pressure and wave drag contributions that scale more weakly with Reynolds number. The longitudinal static stability margin also exhibits a measurable Re dependence at the cruise condition, with the neutral point shifting aft by approximately 1% of the mean aerodynamic chord over the tested range. These findings provide quantitative benchmarks for Re scaling methodologies and CFD validation at flight-relevant conditions.
1. Introduction
The aerodynamic design of modern transport aircraft depends heavily on computational fluid dynamics (CFD) for performance prediction and optimization [1,2]. A persistent challenge is the extrapolation of CFD-validated results from wind tunnel Reynolds numbers, typically Re = 3–10 × 106, to flight conditions approaching Re ~ 50 × 106 for full-scale configurations [3,4]. The Reynolds number governs boundary-layer state and thickness, which in turn affect shock-wave position, separation onset, and viscous drag in transonic flow [5,6]. At cruise conditions, even modest shifts in boundary-layer thickness can displace the shock location and alter the pressure recovery, producing measurable changes in both wave drag and profile drag. Reynolds number scaling methodologies therefore represent a critical source of uncertainty in the aircraft design cycle, particularly for large-aspect-ratio configurations where the interaction between wing shock systems and thick turbulent boundary layers is sensitive to the viscous state [7]. Resolving this uncertainty is essential for accurate fuel-burn prediction and for establishing credible performance guarantees prior to flight testing. A foundational prerequisite for any credible scaling methodology is the availability of high-quality, publicly accessible experimental data that span a wide Reynolds number range across consistent model geometries.
Considerable effort has been devoted to establishing open-access aerodynamic databases for standard models that support CFD validation and Reynolds number scaling studies. The NASA Common Research Model (CRM) has been the subject of extensive experimental campaigns across multiple facilities; the most recent datasets reach Reynolds numbers of approximately 20 × 106 [8]. The AIAA Drag Prediction Workshop series has similarly advanced validation for transport aircraft configurations, though publicly available experimental data remain concentrated at moderate Reynolds numbers [9,10]. In parallel, the CHN-T1 standard model, a large-aspect-ratio configuration developed by the China Aerodynamics Research and Development Center, has emerged as a complementary benchmark [11]. A comprehensive experimental campaign in the CARDC 2.4 m transonic wind tunnel documented its baseline aerodynamic characteristics across Mach 0.40–0.90 and Reynolds numbers 3.3–7.5 × 10⁶, encompassing force/moment measurements, repeatability assessments, Reynolds-number variation tests, transition comparisons, flow visualization, and model deformation measurements [12].
The ETW is uniquely able to bridge the Reynolds number gap between conventional wind tunnels and flight conditions [13]. By combining cryogenic temperatures down to 110 K with elevated pressures up to 450 kPa, the facility achieves unit Reynolds numbers exceeding 50 × 106 at transonic Mach numbers [14]. Several studies have used this capability to examine Reynolds number effects on transport aircraft configurations, demonstrating measurable shifts in shock position, drag divergence Mach number, and buffet onset characteristics as Reynolds number approaches flight values [15,16,17]. The underlying physics is well understood qualitatively: higher Reynolds numbers produce thinner turbulent boundary layers, which reduce the displacement effect on the inviscid pressure distribution and delay separation [18,19]. Systematic studies that isolate the Reynolds number dependence of individual aerodynamic coefficients, particularly the viscous drag component and longitudinal stability, remain scarce for publicly available configurations, however.
An additional source of uncertainty in wind tunnel testing concerns the treatment of boundary-layer transition. In conventional facilities, artificial tripping is routinely applied to fix transition at a prescribed location, ensuring a fully turbulent boundary layer over the wing [20,21]. At the high Reynolds numbers attainable in cryogenic tunnels, natural transition may occur sufficiently far forward that the difference between fixed and free transition configurations becomes negligible for engineering purposes [22]. This behaviour arises because boundary-layer instability mechanisms are amplified with increasing Reynolds number, shifting the natural transition location upstream [23]. Quantifying this convergence has direct implications for test planning: if a threshold Reynolds number can be identified beyond which artificial tripping is unnecessary, model preparation can be simplified and interference effects from tripping devices eliminated.
This study presents a focused analysis of Reynolds number effects on the transonic aerodynamic characteristics of the CHN-T1 standard model, drawing on the full ETW dataset spanning Mach numbers from 0.20 to 0.90 and unit Reynolds numbers from 3.6 × 10⁶ to 37.8 × 10⁶. The test matrix incorporated both artificially fixed and naturally transitional boundary layer configurations, enabling a qualitative assessment of transition sensitivity across the Reynolds number range. Three aspects are examined: (i) the basic longitudinal aerodynamic characteristics at the cruise Mach number, including lift, drag, lift-to-drag ratio, and static stability, and their evolution with Reynolds number, (ii) the Reynolds number scaling of the viscous drag coefficient in relation to classical turbulent flat-plate correlations, with quantitative evaluation of scaling exponents across subsonic and transonic Mach numbers, and (iii) the coverage and limitations of the transition configuration matrix for isolating viscous and transition effects at flight-relevant Reynolds numbers. The objective is to provide validated quantitative benchmarks that inform Reynolds number scaling methodologies and to delineate the conditions under which classical scaling laws are sufficient for engineering extrapolation from moderate-Reynolds-number wind tunnel data.
2. Experimental Methodology
2.1. Wind Tunnel Facility
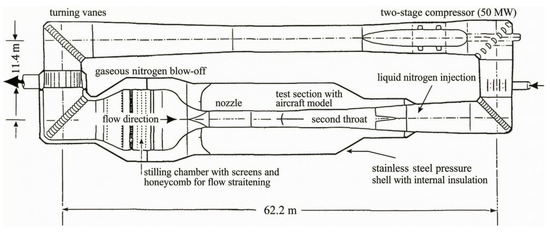
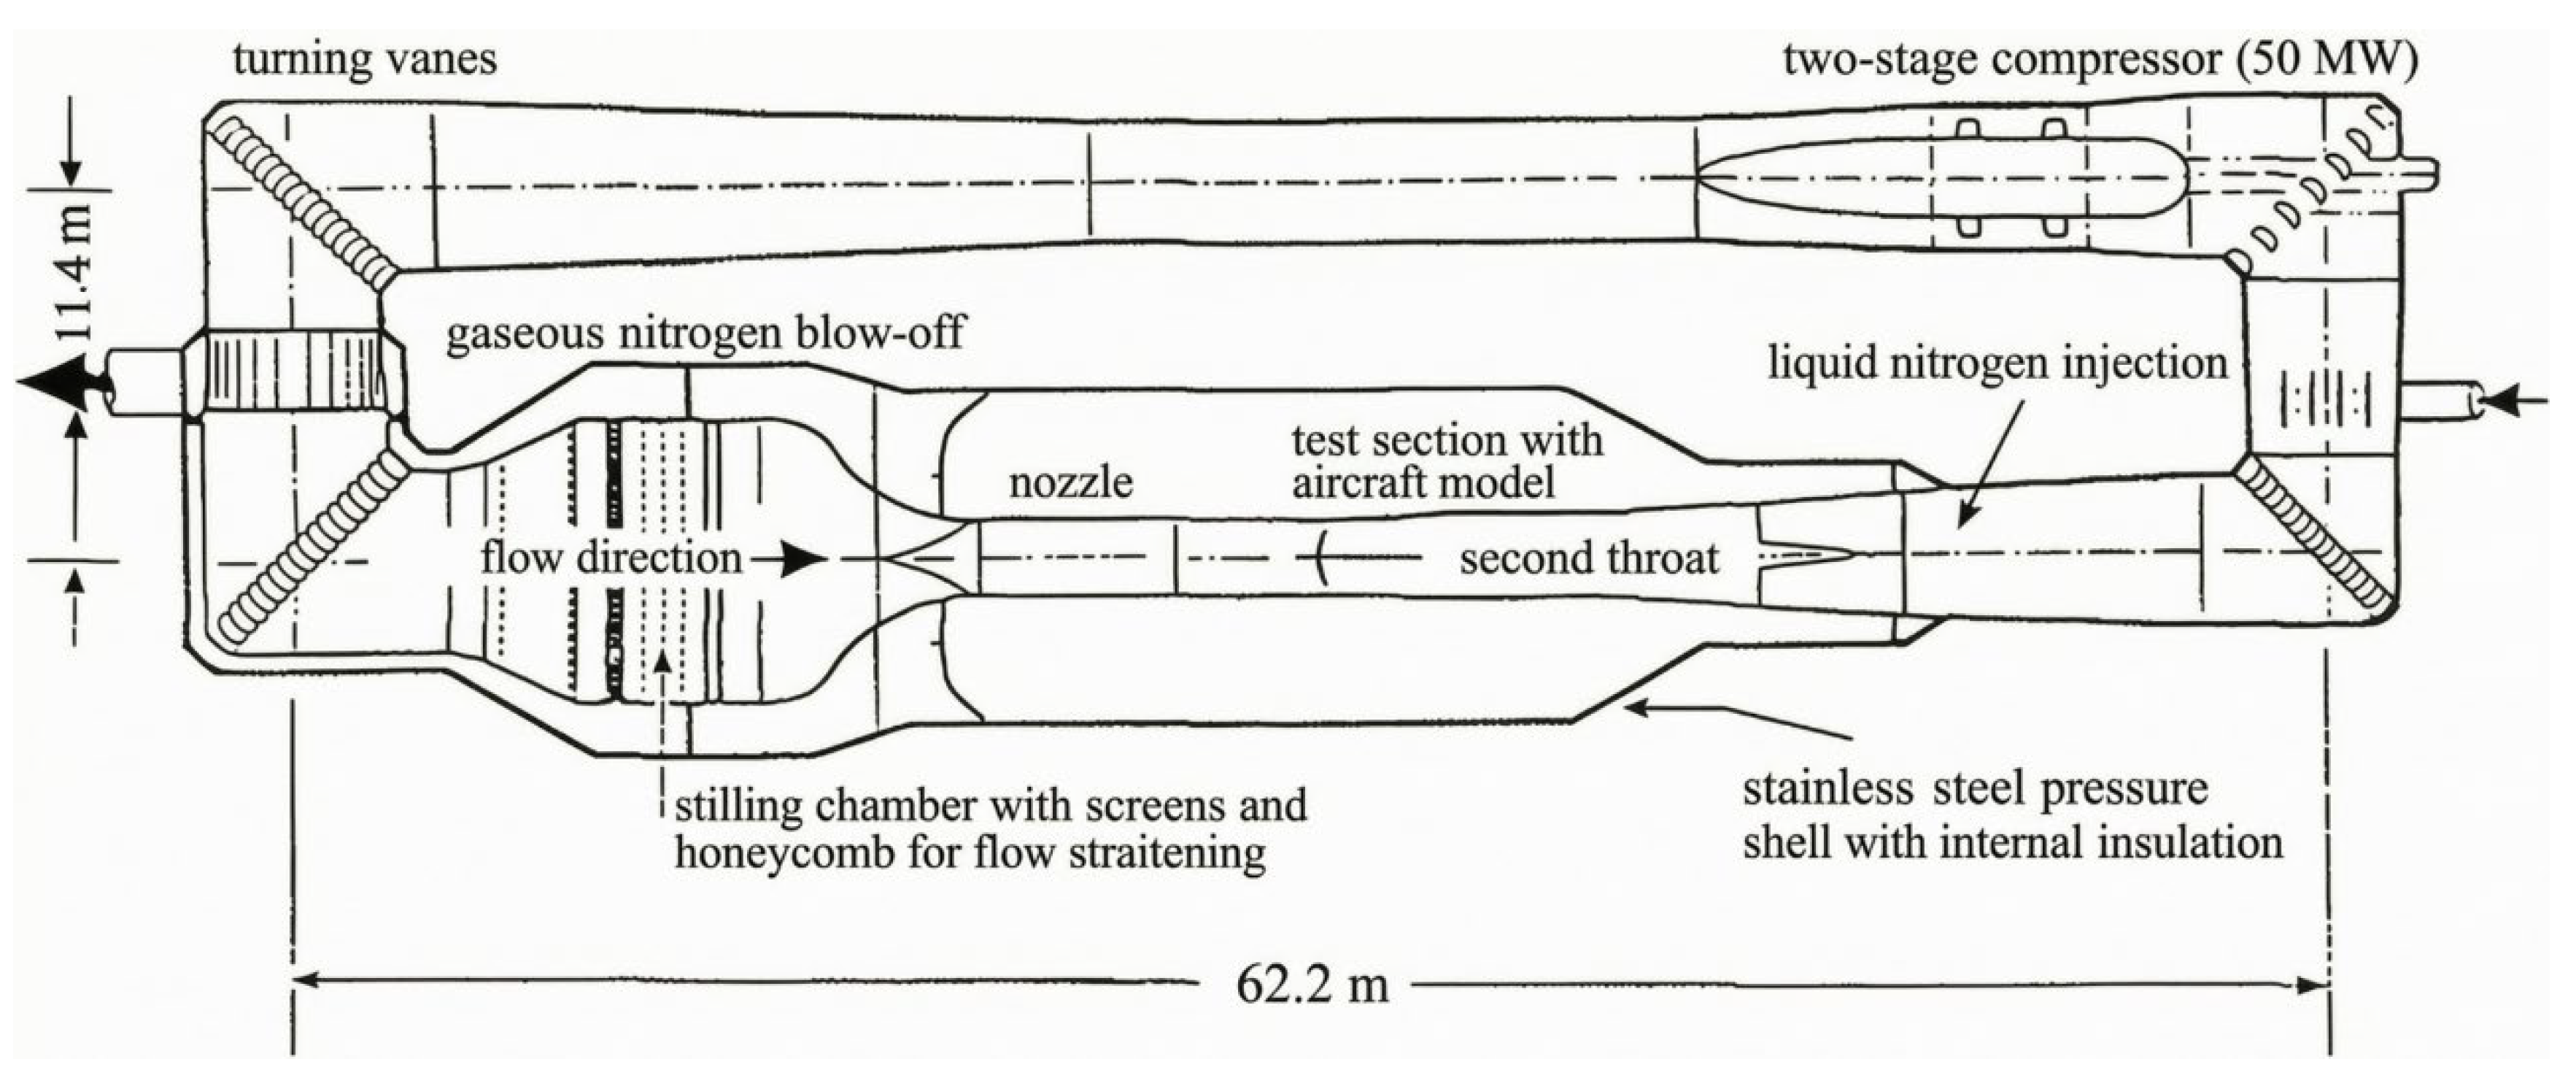
The experimental campaign was conducted in the European Transonic Wind Tunnel, a cryogenic high-Reynolds-number transonic facility that employs nitrogen as the test gas. High Reynolds numbers, reaching up to 50 × 106 for full-span aircraft models, are achieved through the combination of low temperatures, which can be lowered to 110 K via liquid nitrogen injection, and elevated pressures up to 450 kPa. Figure 1 depicts the ETW, a Göttingen-type wind tunnel featuring a closed aerodynamic circuit and operating across a Mach number range of 0.15–1.35. The test section measures 2.00 m in height, 2.40 m in width, and 8.73 m in length, providing sufficient volume for full-configuration aircraft models at high dynamic pressures without excessive blockage.
Figure 1.
Schematic of the ETW closed aerodynamic circuit [24].
2.2. CHN-T1 Test Model
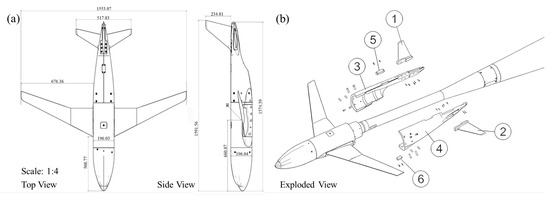
The CHN-T1 standard test model, designed by the China Aerodynamics Research and Development Center, features a geometric scale of 1:19.23, with key geometric characteristics detailed in Figure 2a. The physical configuration of the scaled model exhibits a wingspan of 1.553 m, a fuselage length of 1.574 m, and a moment reference center positioned 0.661 m aft of the fuselage nose, which coincides with the model’s center of gravity to ensure accurate pitching moment measurements. The primary structure was constructed from 200-grade Maraging Steel (ASTM A579 Grade 71), with fasteners selected according to load requirements. All internal cavities were sealed using a two-component polyester-based filler to ensure surface smoothness and prevent internal flow that could compromise force measurements. The model was mounted on the ETW B003 six-component strain-gauge balance via a 2.5° half-angle sting, as illustrated in Figure 2b.
Figure 2.
Wind tunnel model assembly: (a) layout of the standard model; (b) model mounted on the ETW B003 six-component strain-gauge balance via a 2.5° half-angle sting.
2.3. Instrumentation and Data Reduction
Aerodynamic loads were measured using the internally mounted six-component strain-gauge balance. The balance was calibrated to account for cross-talk and thermal drift, with temperature compensation applied using integrated sensors to maintain accuracy across the wide temperature range of the cryogenic environment. Model attitude, including angle of attack and sideslip, was determined by an on-board sensor system referenced to the wind tunnel coordinate frame, providing real-time measurements independent of the model’s roll orientation.
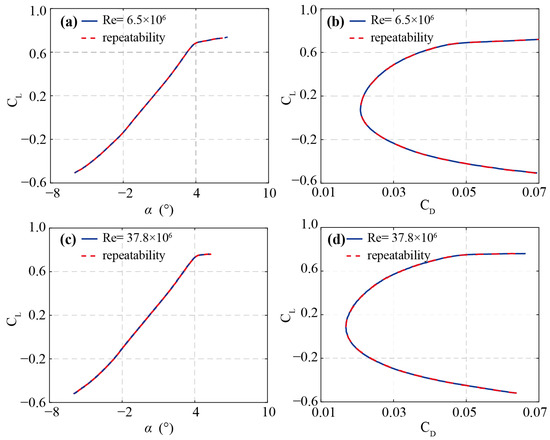
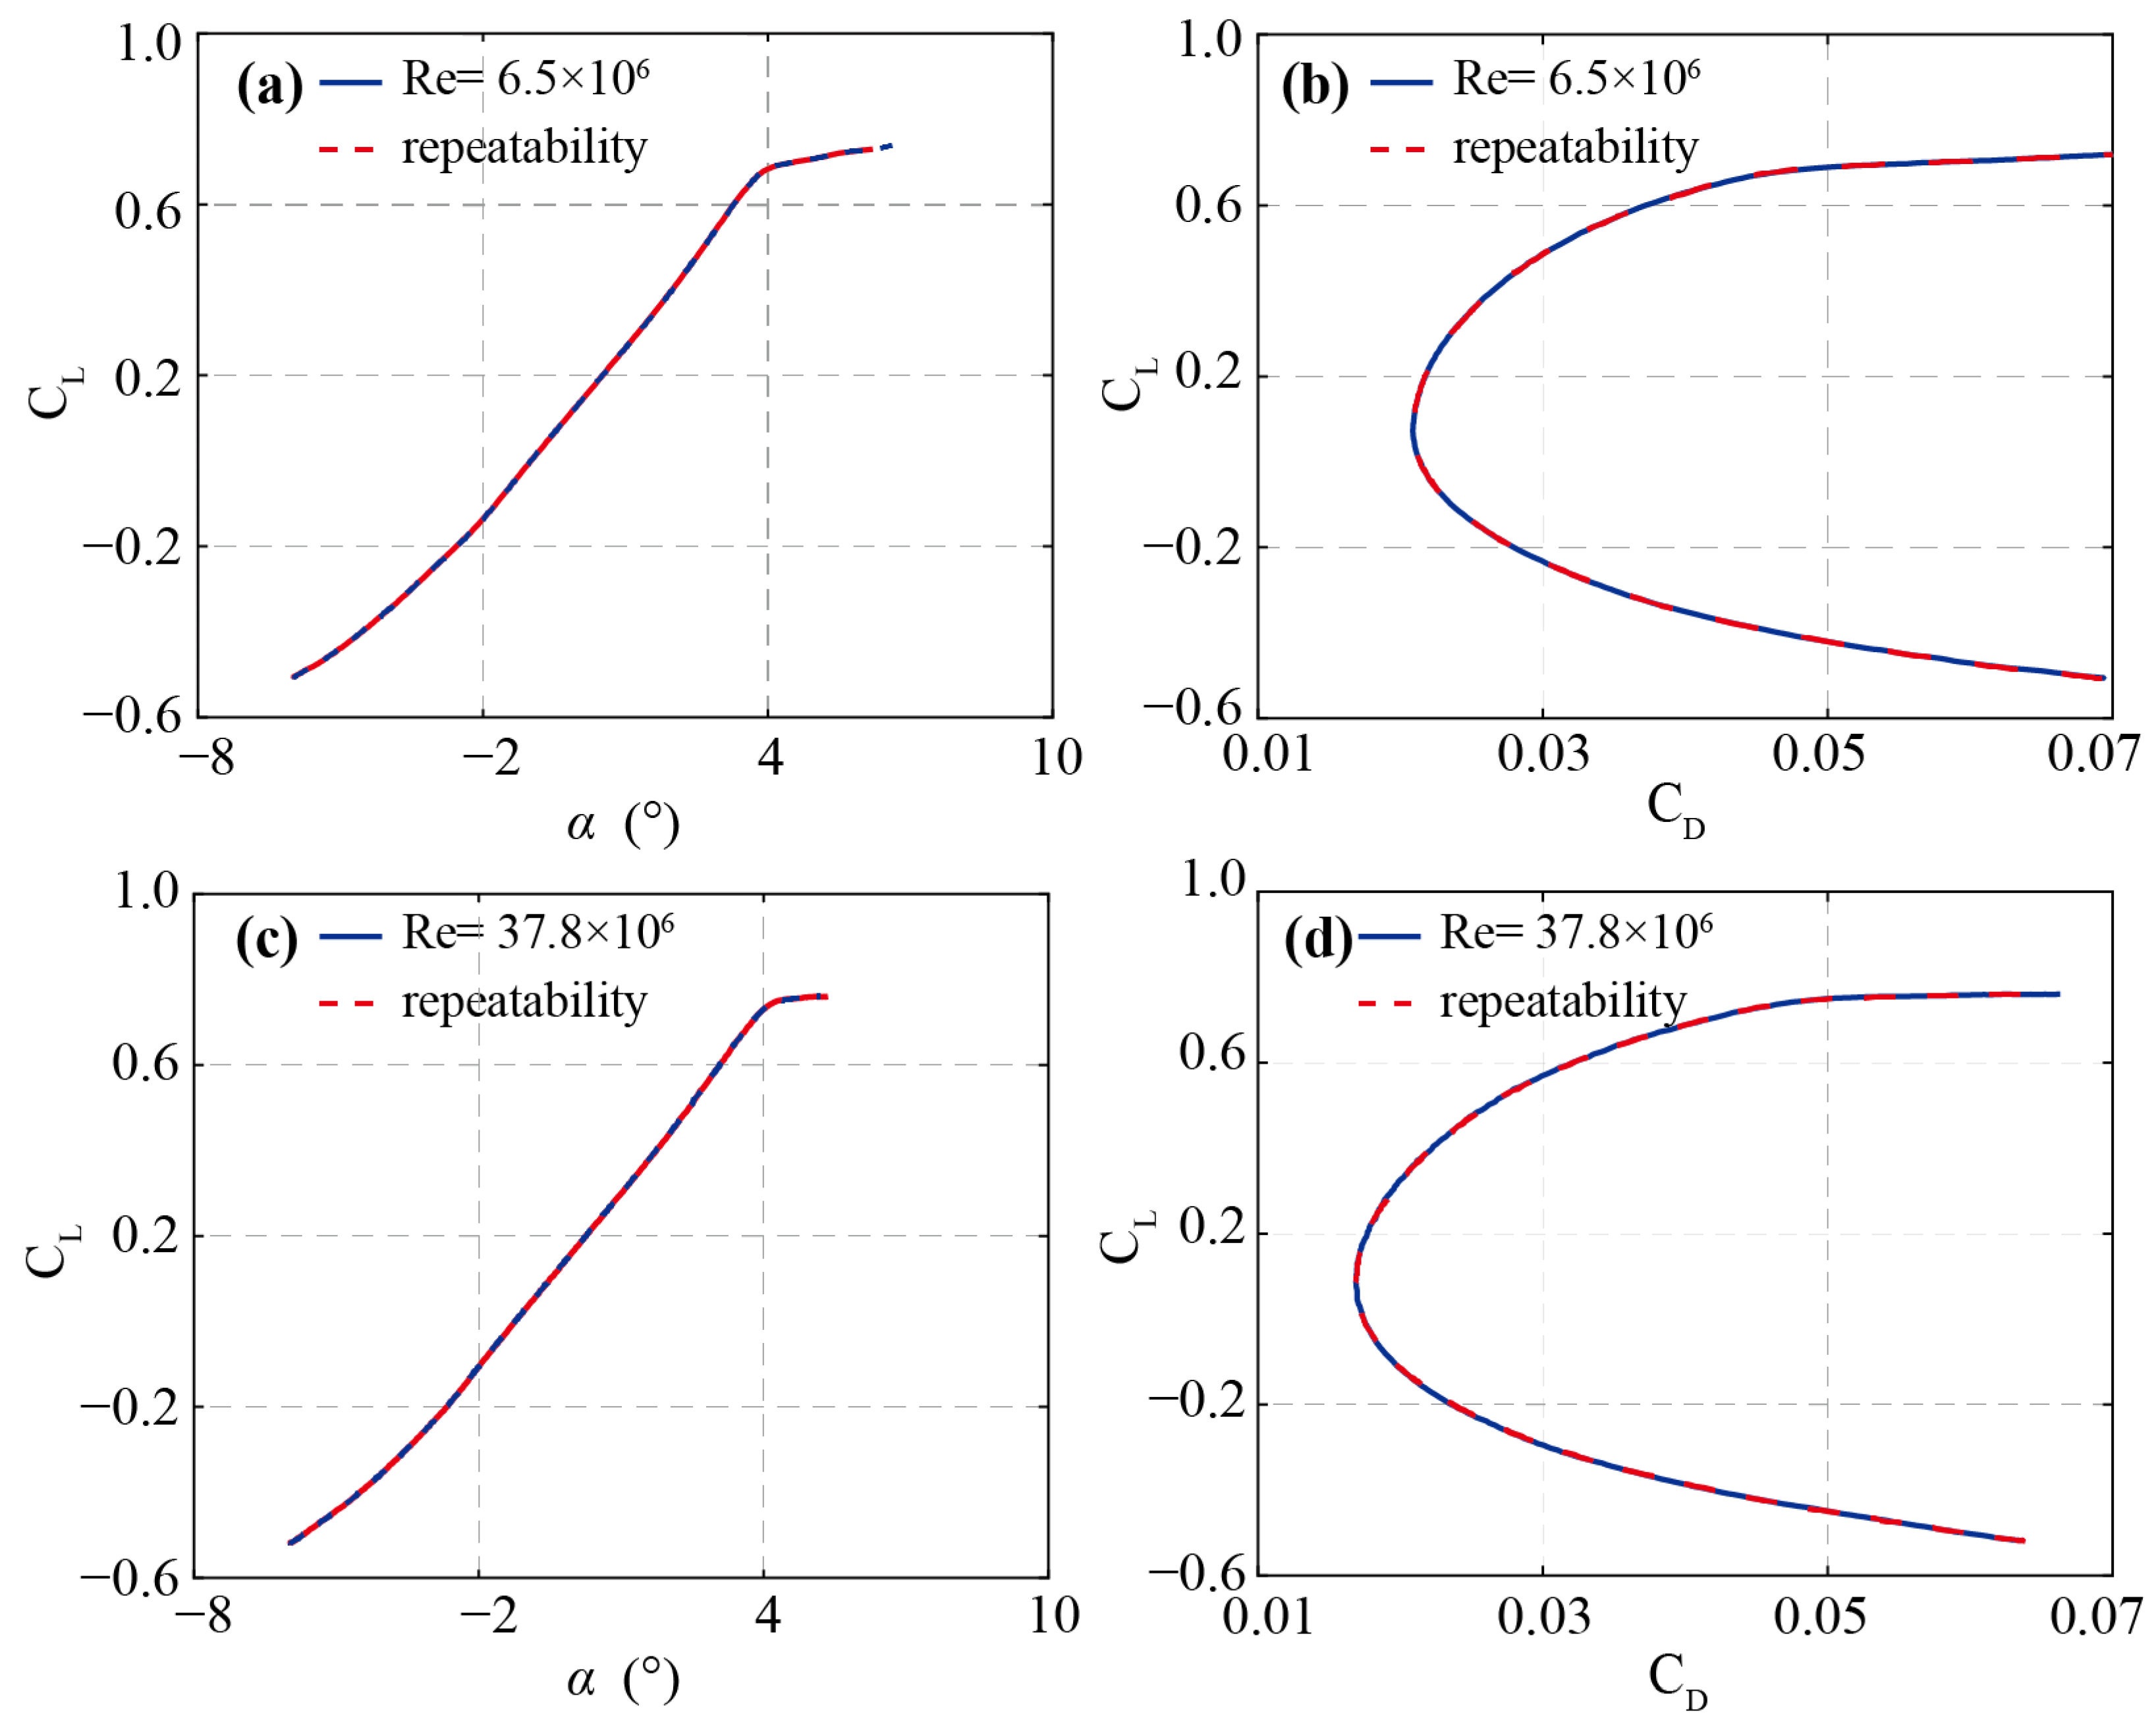
The model did not incorporate surface static pressure taps. Instead, cavity pressures at the sting–balance interface were measured by calibrated transducers to resolve base pressure corrections. For each test point, zero-wind baseline data were recorded prior to initiating aerodynamic measurements to isolate the aerodynamic signal from tare loads. Repeatability checks at selected Mach numbers (e.g., M = 0.78, Figure 3) confirmed measurement stability throughout the campaign.
Figure 3.
Validation of test repeatability and data reliability at Ma = 0.78 and β = 0°. (a,c) CL versus α; (b,d) Lift-drag polar curve.
2.4. Test Matrix and Boundary-Layer Transition Configurations
The test matrix was designed to enable systematic isolation of Reynolds number effects on the transonic aerodynamics of the CHN-T1 configuration. Measurements spanned a Mach number range of 0.20–0.90 and unit Reynolds numbers of 3.6–37.8 × 10⁶, achieved through controlled variations in tunnel total temperature (115–300 K) and total pressure (128–445 kPa). This parametric coverage permits the extraction of Reynolds number trends at constant Mach number—the primary analytical decomposition employed in the present study. Longitudinal force and moment data were acquired over angles of attack from −6° to 15°, while lateral-directional characteristics were evaluated at sideslip angles from −9° to 9°. Five datasets were acquired: the MaEffect and ReEffect datasets, which systematically vary Mach number at constant Reynolds number and Reynolds number at constant Mach number, respectively, and constitute the primary basis for the present analysis; and the Sideslip, FlowAngle, and Transition datasets, which support data correction, calibration verification, and supplementary transition sensitivity evaluation.
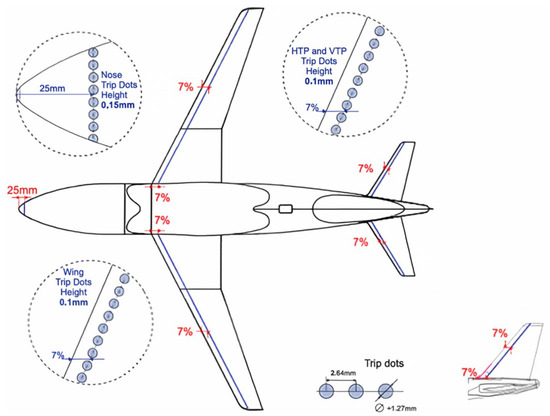
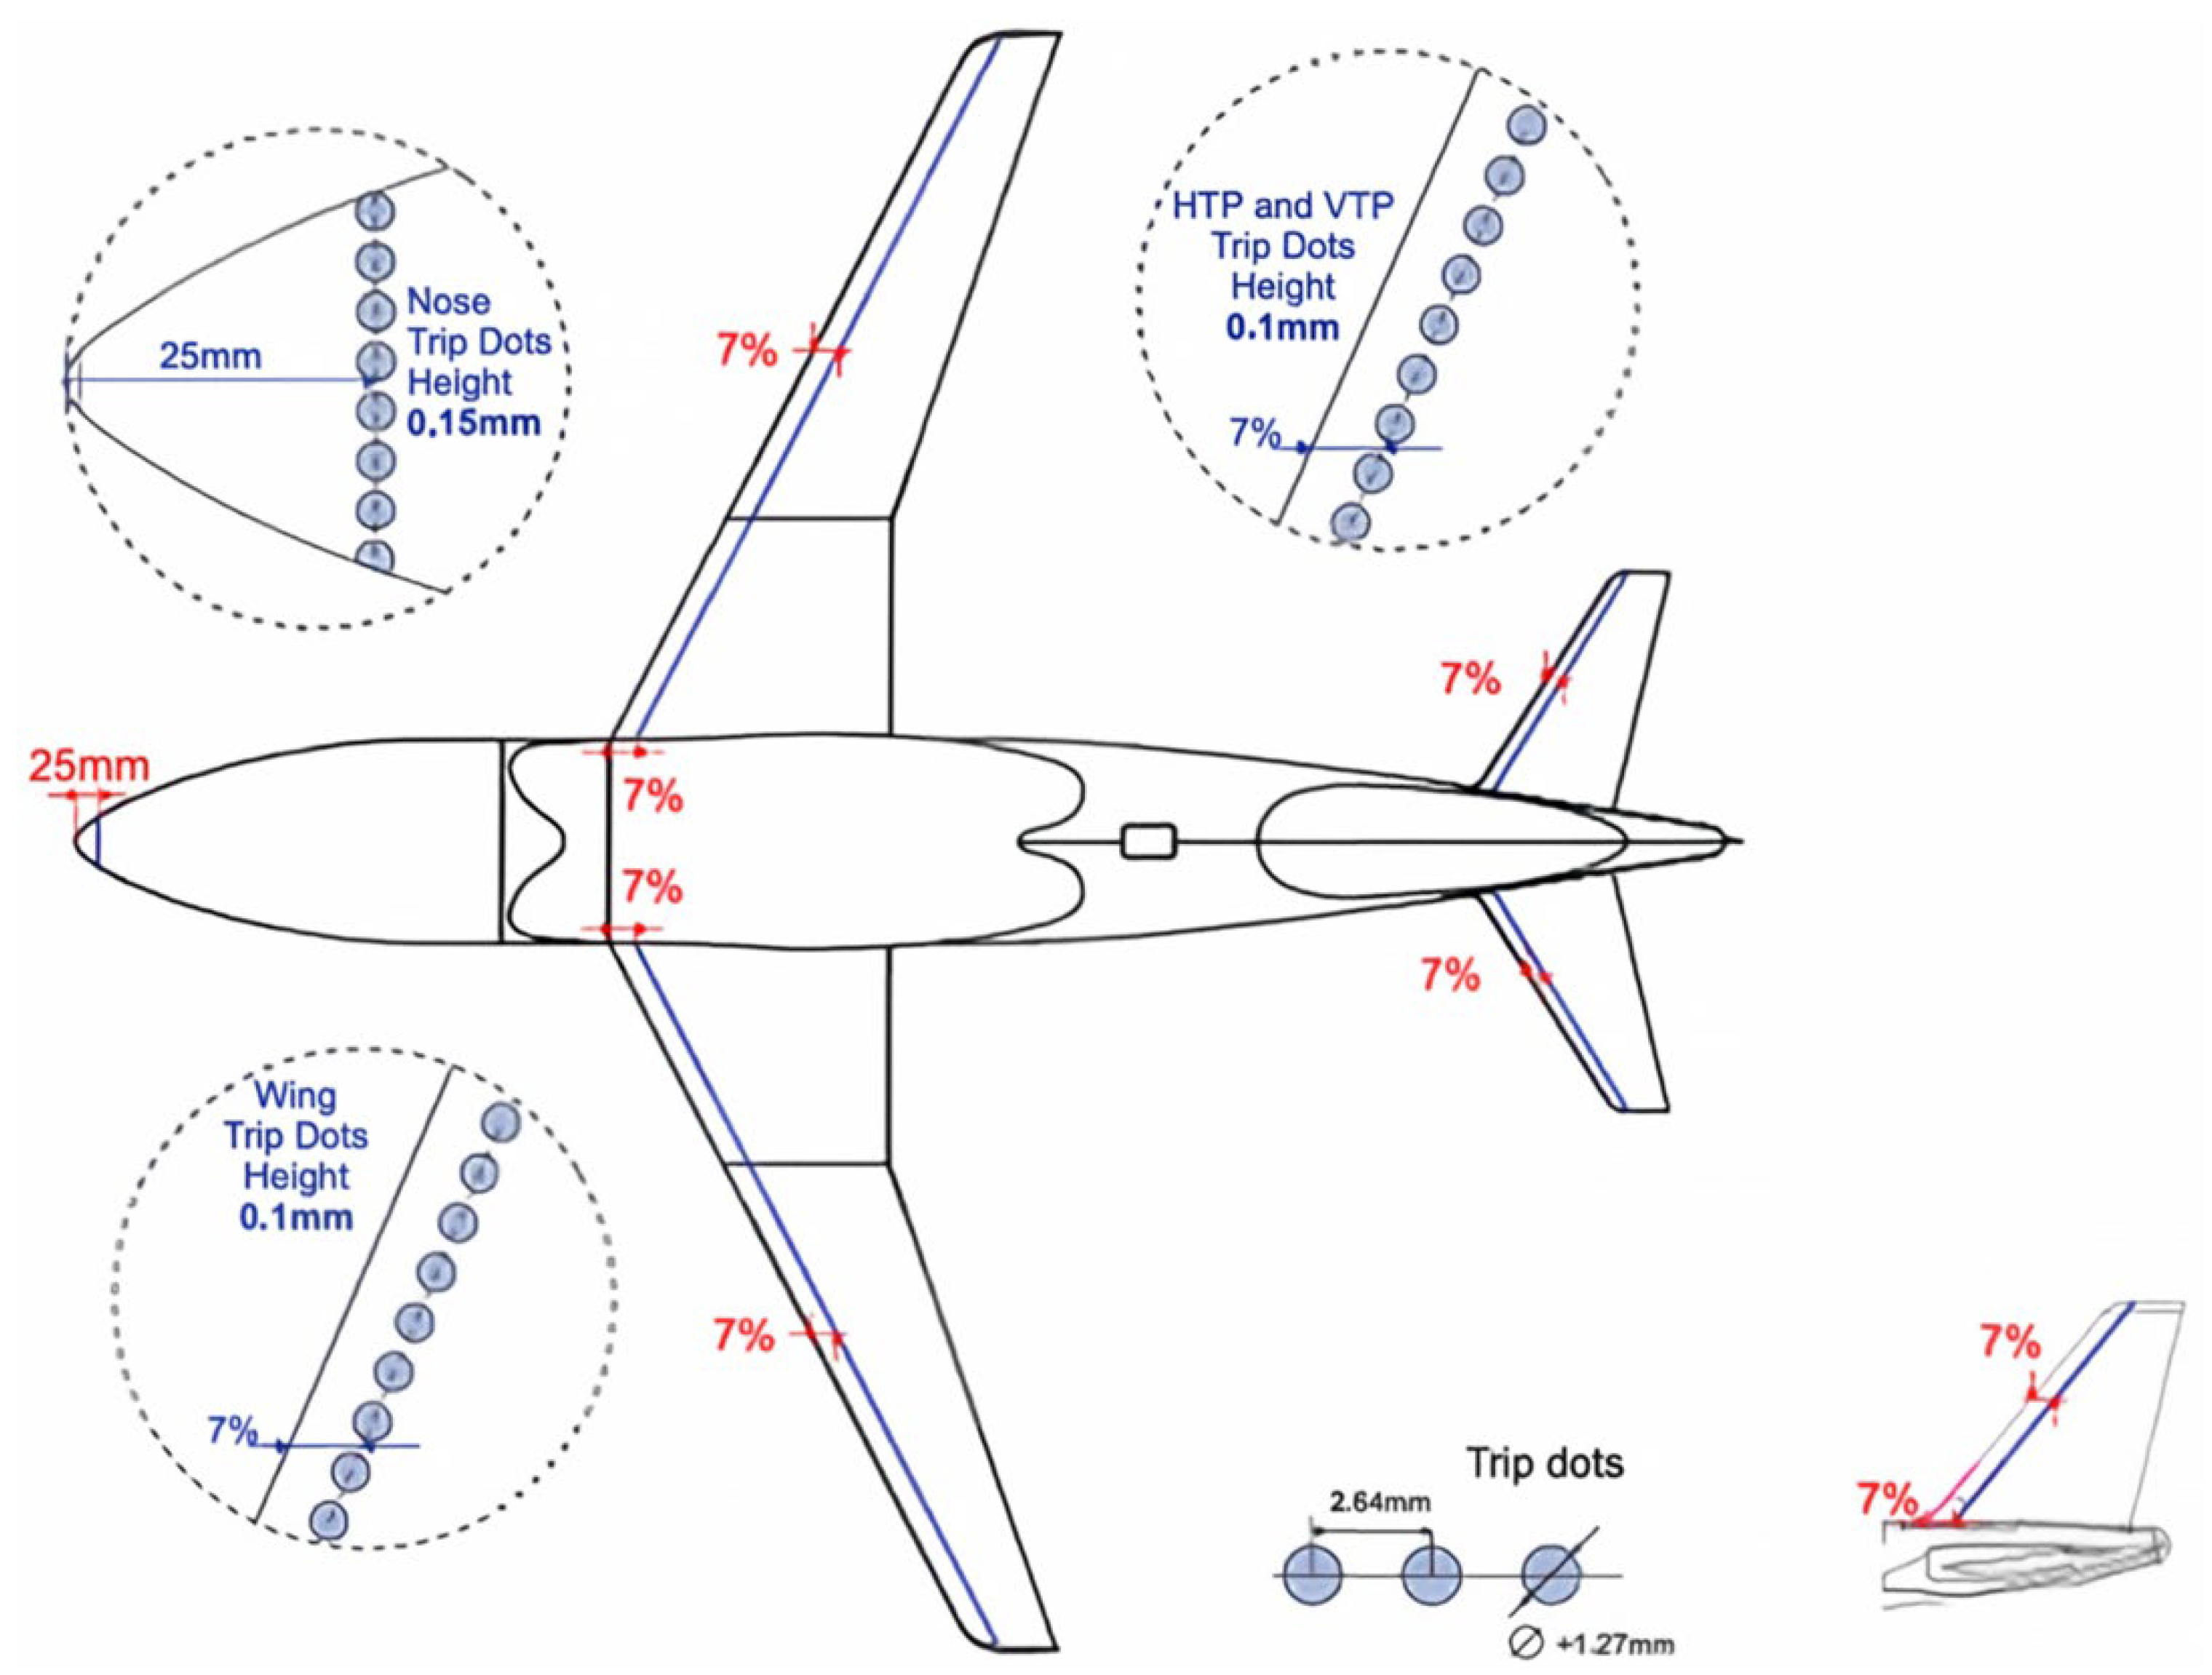
Two boundary-layer transition configurations were adopted to investigate the coupling between viscous state and global aerodynamic loads, and to assess the extent to which this coupling persists at elevated Reynolds numbers. The natural transition (free transition) case permitted boundary-layer development to follow the stability characteristics of the model surface. The artificially fixed transition case employed discrete trip dots installed on the model nose (25 mm from the tip) and on the upper and lower surfaces of the wing, horizontal tailplane, and vertical tailplane at 7% chord, as illustrated in Figure 4, inducing early transition. For both configurations, the fuselage nose trip was retained to maintain consistent flow development in the nose region, thereby isolating the transition effect to the lifting and stabilizing surfaces where its aerodynamic consequences are most pronounced. By comparing the two configurations across the full Reynolds number range, the systematic decay of the tripping penalty with increasing Reynolds number can be quantified.
Figure 4.
Trip dot locations on the CHN-T1 model. Trips were applied at the fuselage nose and at 7% chord on the wing, HTP, and VTP. The nose trip was retained for all configurations.
Prior to each run, the tunnel and model were conditioned to the target pressure and temperature, and wall pressure sensors were calibrated under stabilized low-speed conditions. This conditioning procedure was essential for the cryogenic operating mode, where thermal equilibrium of the model and balance directly affects measurement repeatability, particularly when resolving the small aerodynamic differences associated with Reynolds number variations.
3. Results and Discussion
3.1. Basic Aerodynamic Characteristics
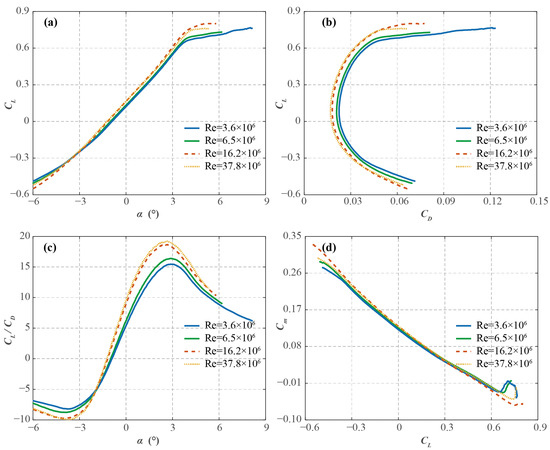
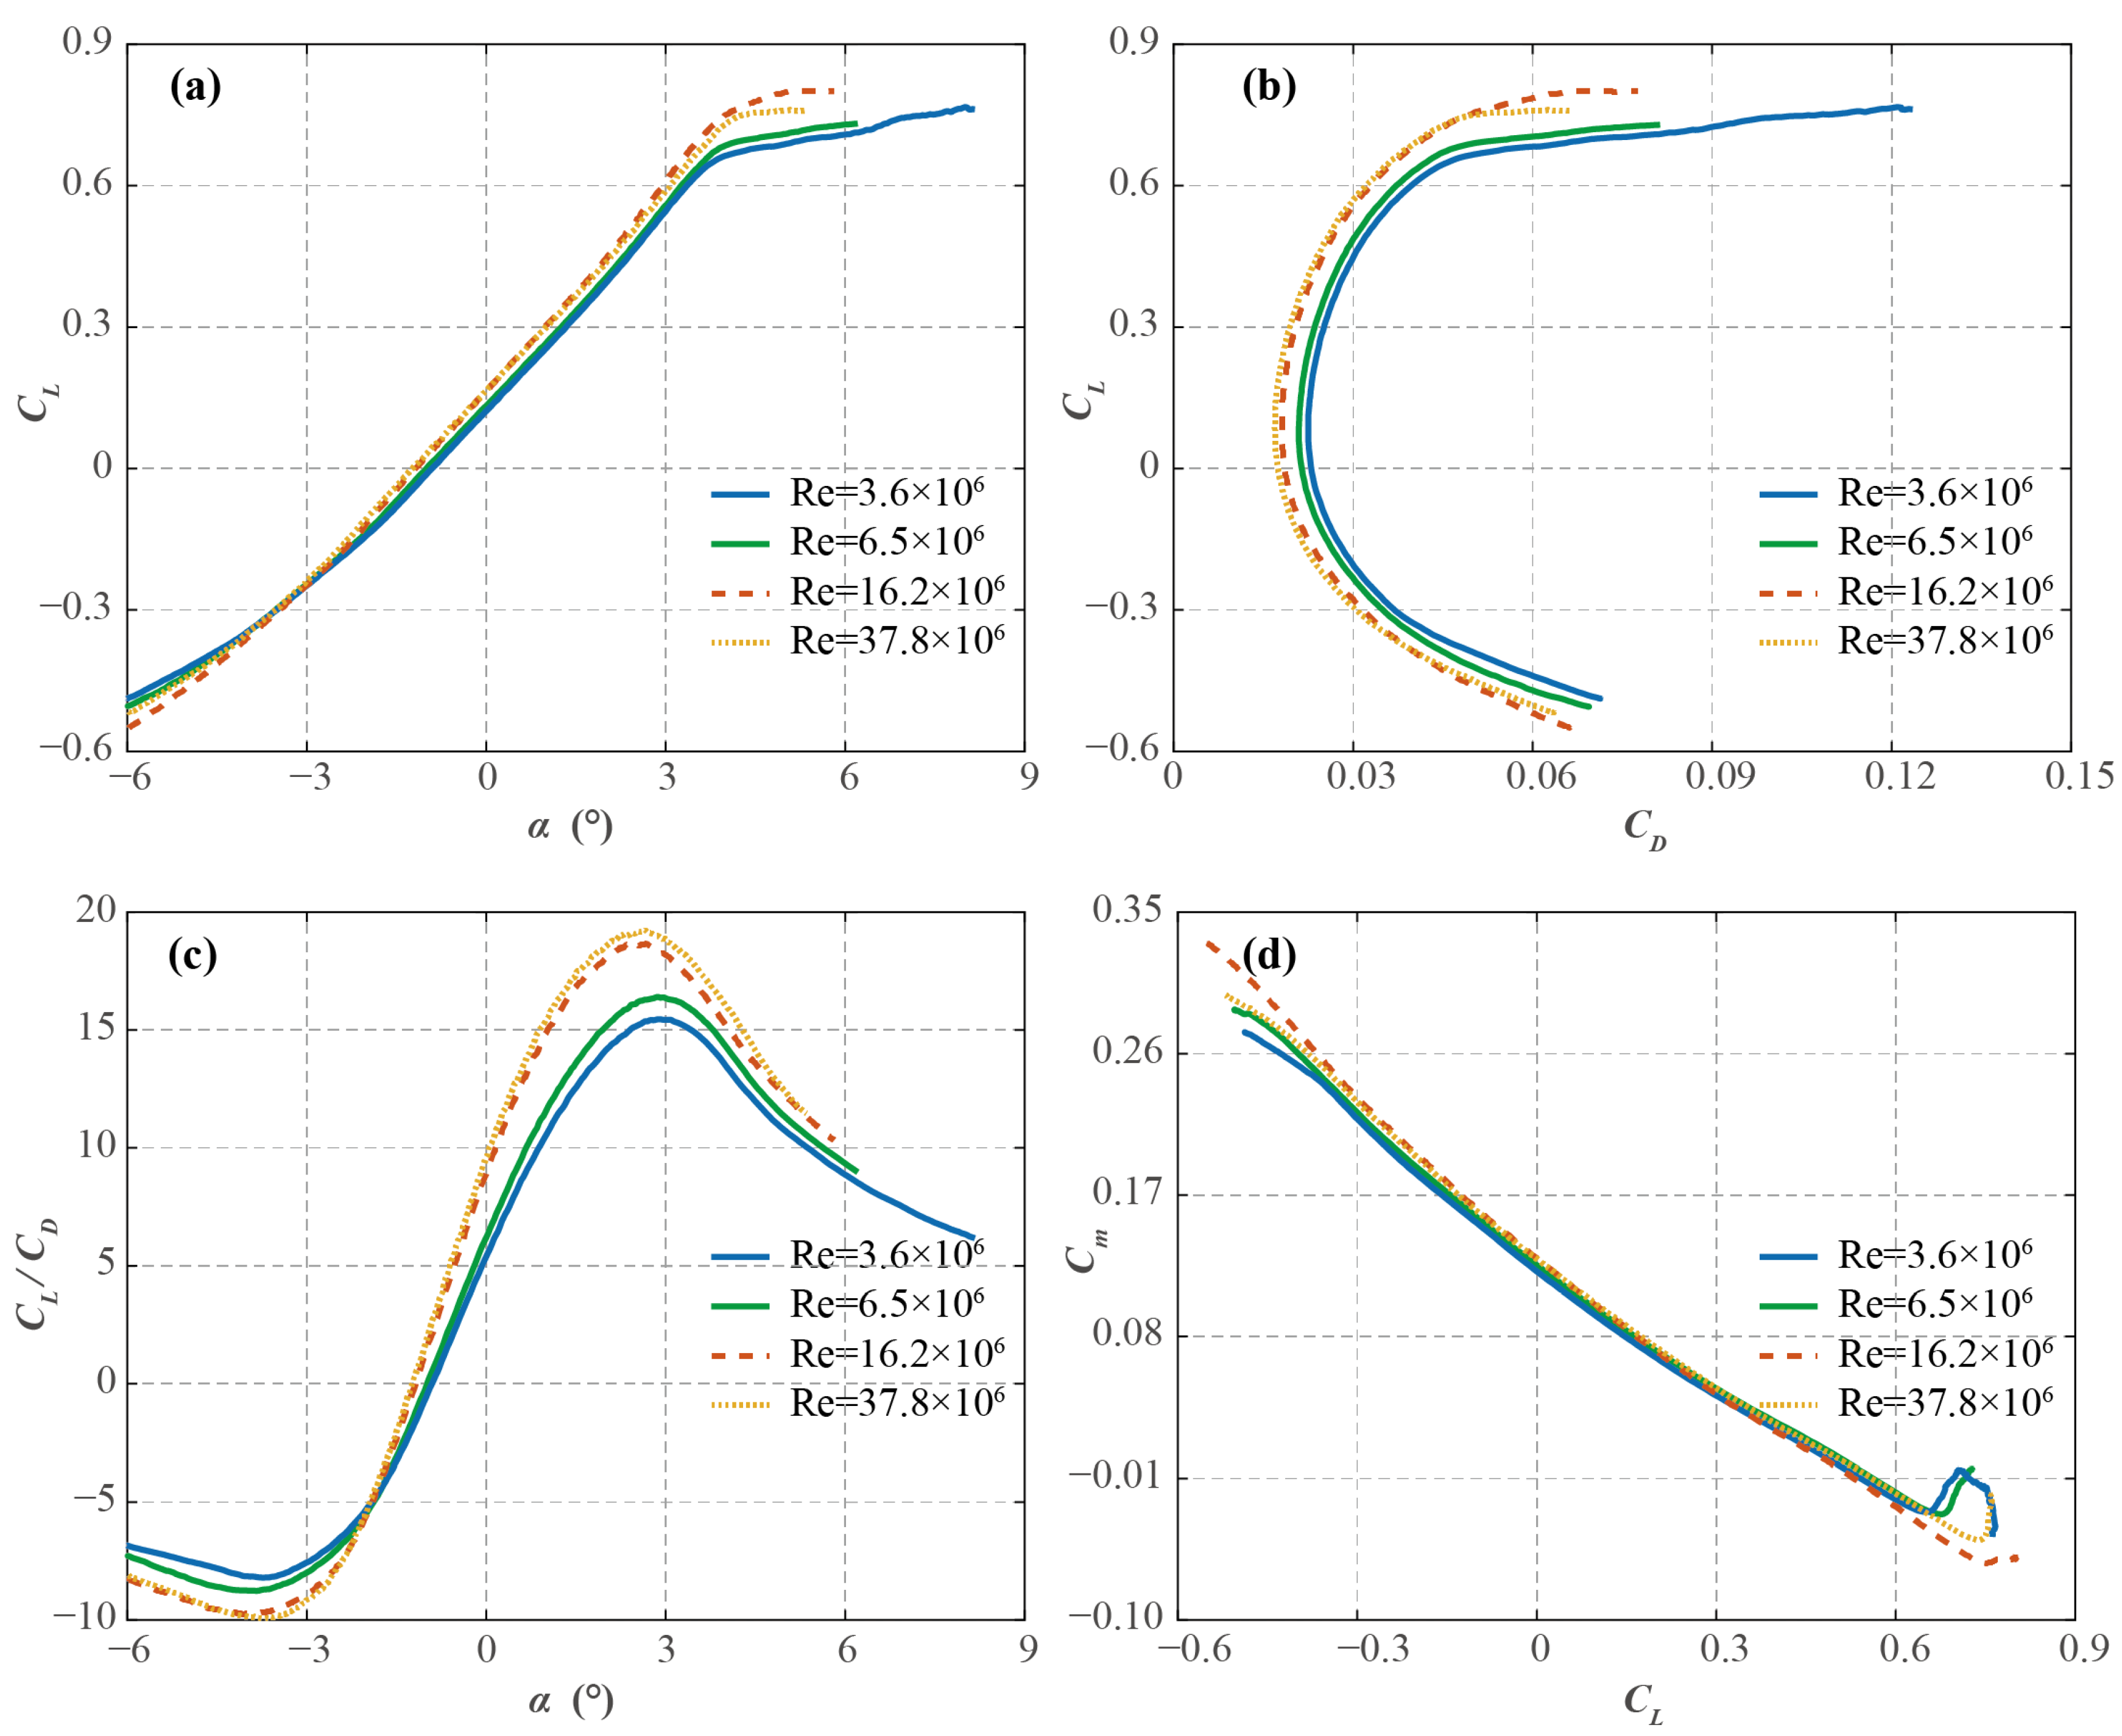
To establish the baseline aerodynamic performance of the CHN-T1 configuration and to motivate the Reynolds number analysis that follows, the longitudinal aerodynamic characteristics at the transonic cruise Mach number of M = 0.78 are examined. Four representative Reynolds numbers spanning the tested range are selected: Re = 3.6 × 10⁶ (low), Re = 6.5 × 10⁶ (low), 16.2 × 10⁶ (medium), and 37.8 × 10⁶ (high). Figure 5 presents the results in four panels covering the lift curve, drag polar, lift-to-drag ratio, and extended force and moment characteristics.
Figure 5.
Reynolds number effects on longitudinal aerodynamic characteristics at M = 0.78. (a) Lift coefficient (CL) versus angle of attack (α). (b) Drag polar (CL versus CD). (c) Lift-to-drag ratio (CL/CD) versus angle of attack. (d) Pitching moment coefficient (Cm) vs. CL at Re = 3.6 × 10⁶, 6.5 × 10⁶, 16.2 × 10⁶, and 37.8 × 10⁶.
Figure 5a shows the lift coefficient as a function of angle of attack. In the linear range at small incidence, the four curves closely cluster together, confirming that the inviscid pressure distribution is governed primarily by the Mach number and geometric shape, with negligible viscous influence in the attached flow regime. The Reynolds number effect emerges in the nonlinear range: at the lowest Reynolds number, the departure from linearity initiates at a lower angle of attack (α > 4°) and the maximum lift coefficient is marginally reduced relative to the two higher Re cases. This behavior reflects the thicker, less energetic boundary layer at low Re, which offers weaker resistance to the adverse pressure gradient on the wing upper surface, promoting earlier boundary-layer separation. The near coincidence of the medium and high Re curves indicates that the lift characteristics approach a Reynolds-number-independent asymptotic state as Re nears flight-relevant values. To quantify the attached-flow behavior, the lift-curve slope CLα was extracted from linear regression. The resulting values are collected in Table 1. CLα exhibits a modest Re dependence. It increases from 0.1333 deg−1 at Re = 3.6 × 10⁶ to 0.1415 deg−1 at Re = 6.5 × 10⁶, where it plateaus, remaining at this peak value at Re = 16.2 × 10⁶ before settling to 0.1367 deg−1 at the highest Re. The variation of approximately 6% across the full Re range, while not negligible, is substantially smaller than the Re-driven changes in CD and CL/CD reported below, consistent with the predominantly inviscid character of the attached-flow pressure distribution.
Table 1.
Longitudinal Aerodynamic Derivatives and Coefficients.
The drag polar in Figure 5b reveals a systematic Reynolds-number dependence. The low-Re curve is displaced to the right of the medium- and high-Re curves across the lift range, indicating a higher CD at a given CL for lower Re. At the cruise design point near CL = 0.6, CD at the lowest Re exceeds that at the highest Re by approximately 20%. The primary origin is the Re−1/5 scaling of the turbulent skin-friction coefficient Cf: at lower Re, Cf is larger, and its normalization by the dynamic pressure 1/2ρU2 yields a larger contribution to CD. With increasing Re, the thinning turbulent boundary layer reduces this skin-friction contribution, shifting the polar leftward toward the high-Re asymptotic state.
The lift-to-drag ratio, presented in Figure 5c, translates the drag polar trend into a direct measure of aerodynamic efficiency. All four curves reach their peak at approximately α = 3°. The maximum lift-to-drag ratio increases monotonically with Reynolds number, rising from approximately 15 at the lowest Re to approximately 19 at the highest Re, an improvement of over 25%. This gain reflects two concurrent mechanisms: the reduction in friction drag at high Re, which directly lowers CD; delayed boundary-layer separation contributes mainly at incidence beyond the peak, where it preserves CL and suppresses the drag rise.
Figure 5d presents the pitching moment coefficient about the 25% mean aerodynamic chord, Cm, as a function of CL. The slope ∂Cm/∂CL encodes the longitudinal static margin; a more negative slope indicates greater inherent pitch stability. Two Re dependent trends are evident. First, the slope magnitude increases toward the mid-range, reaching its largest value at Re = 16.2 × 10⁶ before moderating at the highest Re, consistent with the non-monotonic aftward shift of the neutral point. This trend is consistent with an aftward migration of the wing upper surface shock wave as the boundary layer thins at higher Re: a thinner boundary layer reduces the effective displacement effect experienced by the external inviscid flow, allowing the supersonic region to extend further aft before terminating in a shock located closer to the trailing edge. The resulting rearward shift in the wing center of pressure produces a more negative pitching moment increment at a given CL, steepening the ∂Cm/∂CL slope. This mechanism is consistent with the steepening observed from low to mid-Re; the subsequent moderation at the highest Re indicates an additional competing Reynolds-number effect not captured by this simple shock-migration picture. Second, the trim lift coefficient (Cm = 0) shifts to moderately higher values with increasing Re. This follows from CLtrim = −Cm0/CmCL: as Cm0 becomes slightly more positive (nose-up) and CmCL becomes more negative, the required trim CL increases from about 0.473 to 0.486 over the tested range. Beyond these systematic trends, the low Re curve develops pronounced oscillations at elevated CL (above approximately 0.6), consistent with the unsteady flow separation or vortex shedding behavior identified in the drag polar. By contrast, the medium and high Re curves remain smooth throughout the tested range, indicating that the higher Re boundary layer sustains a more nearly steady separation process and offers greater resistance to flow instability. The extracted stability derivative from the linear range (CL ≤ 0.5) confirms this picture: CmCL = −0.2671, −0.2667, −0.2874, and −0.2761 at Re = 3.6 × 10⁶, 6.5 × 10⁶, 16.2 × 10⁶, and 37.8 × 10⁶, respectively (Table 1). The magnitude of CmCL is nearly unchanged between 3.6 × 10⁶ and 6.5 × 10⁶, reaches its largest value at 16.2 × 10⁶ (7.6% greater than at 3.6 × 10⁶), and then moderates slightly at the highest Re; the net increase between Re = 3.6 × 10⁶ and 37.8 × 10⁶ is 3.4%, corresponding to a rearward neutral-point shift of 0.9% MAC. The zero-lift angle α0 becomes progressively more negative with increasing Re (from −0.9495° to −1.2179°), while the zero-lift pitching moment Cm0 increases from 0.1263 to 0.1341, indicating a slight nose-up bias in the baseline moment at higher Re.
Taken together, these observations suggest several trends. The attached-flow lift characteristics are predominantly inviscid: the lift-curve slope CLα varies by only 6% across the tested Re range (0.1333–0.1415 deg−1, Table 1), compared with the far larger Re-driven changes in drag and efficiency described above. The non-induced drag and lift-to-drag ratio exhibit a systematic Re dependence, with the largest incremental gains occurring between Re = 6.5 × 10⁶ and 16.2 × 10⁶. The lowest-Re case is qualitatively distinct, showing earlier stall onset and unsteady separation signatures in both the drag polar and pitching moment data. The longitudinal static stability also displays a measurable Re sensitivity: CmCL is nearly unchanged at the two lowest Re, reaches −0.2874 at Re = 16.2 × 10⁶, and then moderates to −0.2761 at the highest Re, suggesting that boundary-layer thinning and the fixed-to-free transition change jointly affect the static margin, although the moderation at the highest Re occurs within the free-transition regime and cannot be attributed to the transition change. It should be emphasized that these inferences regarding underlying flow mechanisms are deduced indirectly from the integrated force and moment measurements; direct confirmation via flow visualization or companion CFD would strengthen these interpretations. The quantitative analyses of non-induced drag scaling, transition effects, and stability margin scaling follow in subsequent sections.
3.2. Reynolds Number Scaling of Non-Induced Drag
The dominant contribution of this paper is the quantification of Reynolds number effects on non-induced drag across the transonic regime, enabled by the uniquely wide Re range (3.6 to 37.8 million per unit length) of the ETW dataset. Although classical flat-plate turbulent boundary layer theory provides a well-established reference for the Re dependence of skin friction, its applicability to a full aircraft configuration operating in transonic flow where shock-wave/boundary-layer interactions introduce additional, nonlinearly coupled Re sensitivities remains an open question. This section systematically isolates the non-induced drag component from the measured total drag, examines its scaling with Re across multiple Mach numbers, and quantifies the departure from classical scaling laws.
3.2.1. Non-Induced Drag Decomposition
The total drag coefficient of a finite-span wing-body-tail configuration can be decomposed as
where CD0 denotes the zero-lift (parasitic) drag and CDi the lift-induced drag. Equation (1) is an approximate decomposition; at transonic conditions a portion of the wave drag depends on CL. For a planar configuration, the induced drag is conventionally estimated as CDi = CL2/(π·λ), with λ the effective aspect ratio [25]. The residual
therefore captures the combined viscous and pressure-form drag components, including skin friction, base drag, and wave drag contributions, while approximately excluding the inviscid induced drag [26]. Here, CDV is interpreted as a non-induced drag coefficient and serves as the primary observable for the Reynolds number scaling analysis.
CD = CD0 + CDi
CDV = CD − CL2/(π·λ)
A fixed lift coefficient of CL = 0.5 was selected as the analysis slice for two reasons. First, CL = 0.5 lies within the typical cruise design range of advanced transport aircraft, ensuring that the flow is representative of the design operating condition. Second, at this moderate lift coefficient and transonic Mach numbers (M = 0.70 to 0.85), the shock wave on the upper wing surface is of intermediate strength, and the induced drag contribution is modest. This combination of factors makes the CL = 0.5 slice an optimal reference condition for isolating Reynolds-number-dependent non-induced effects while minimizing confounding influences from large-scale separation or strong shock-induced losses at higher incidences. All data points used in the following analysis were linearly interpolated from the measured polar data to the target CL = 0.5.
3.2.2. Classical Scaling Reference and Measured Deviations
For an incompressible, zero-pressure-gradient turbulent boundary layer over a smooth flat plate, the classical 1/7-power-law velocity profile gives Cf ∝ Re−1/5, which yields a logarithmic slope d(log Cf)/d(log Re) = −0.2 [27]. If the overall non-induced drag of the CHN-T1 configuration were dominated purely by attached turbulent skin friction without compressibility or pressure-gradient effects, CDV would be expected to follow this classical trend. Any systematic reduction of the measured exponent relative to this reference slope can therefore be attributed to Reynolds-number-dependent mechanisms beyond simple skin-friction scaling, most notably shock-wave/boundary-layer interaction, trailing-edge separation, base-pressure variations, and compressibility effects.
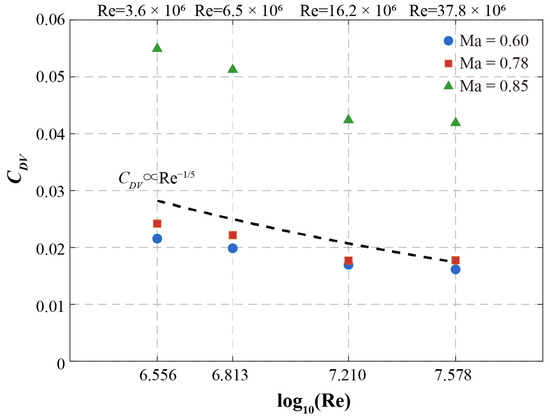
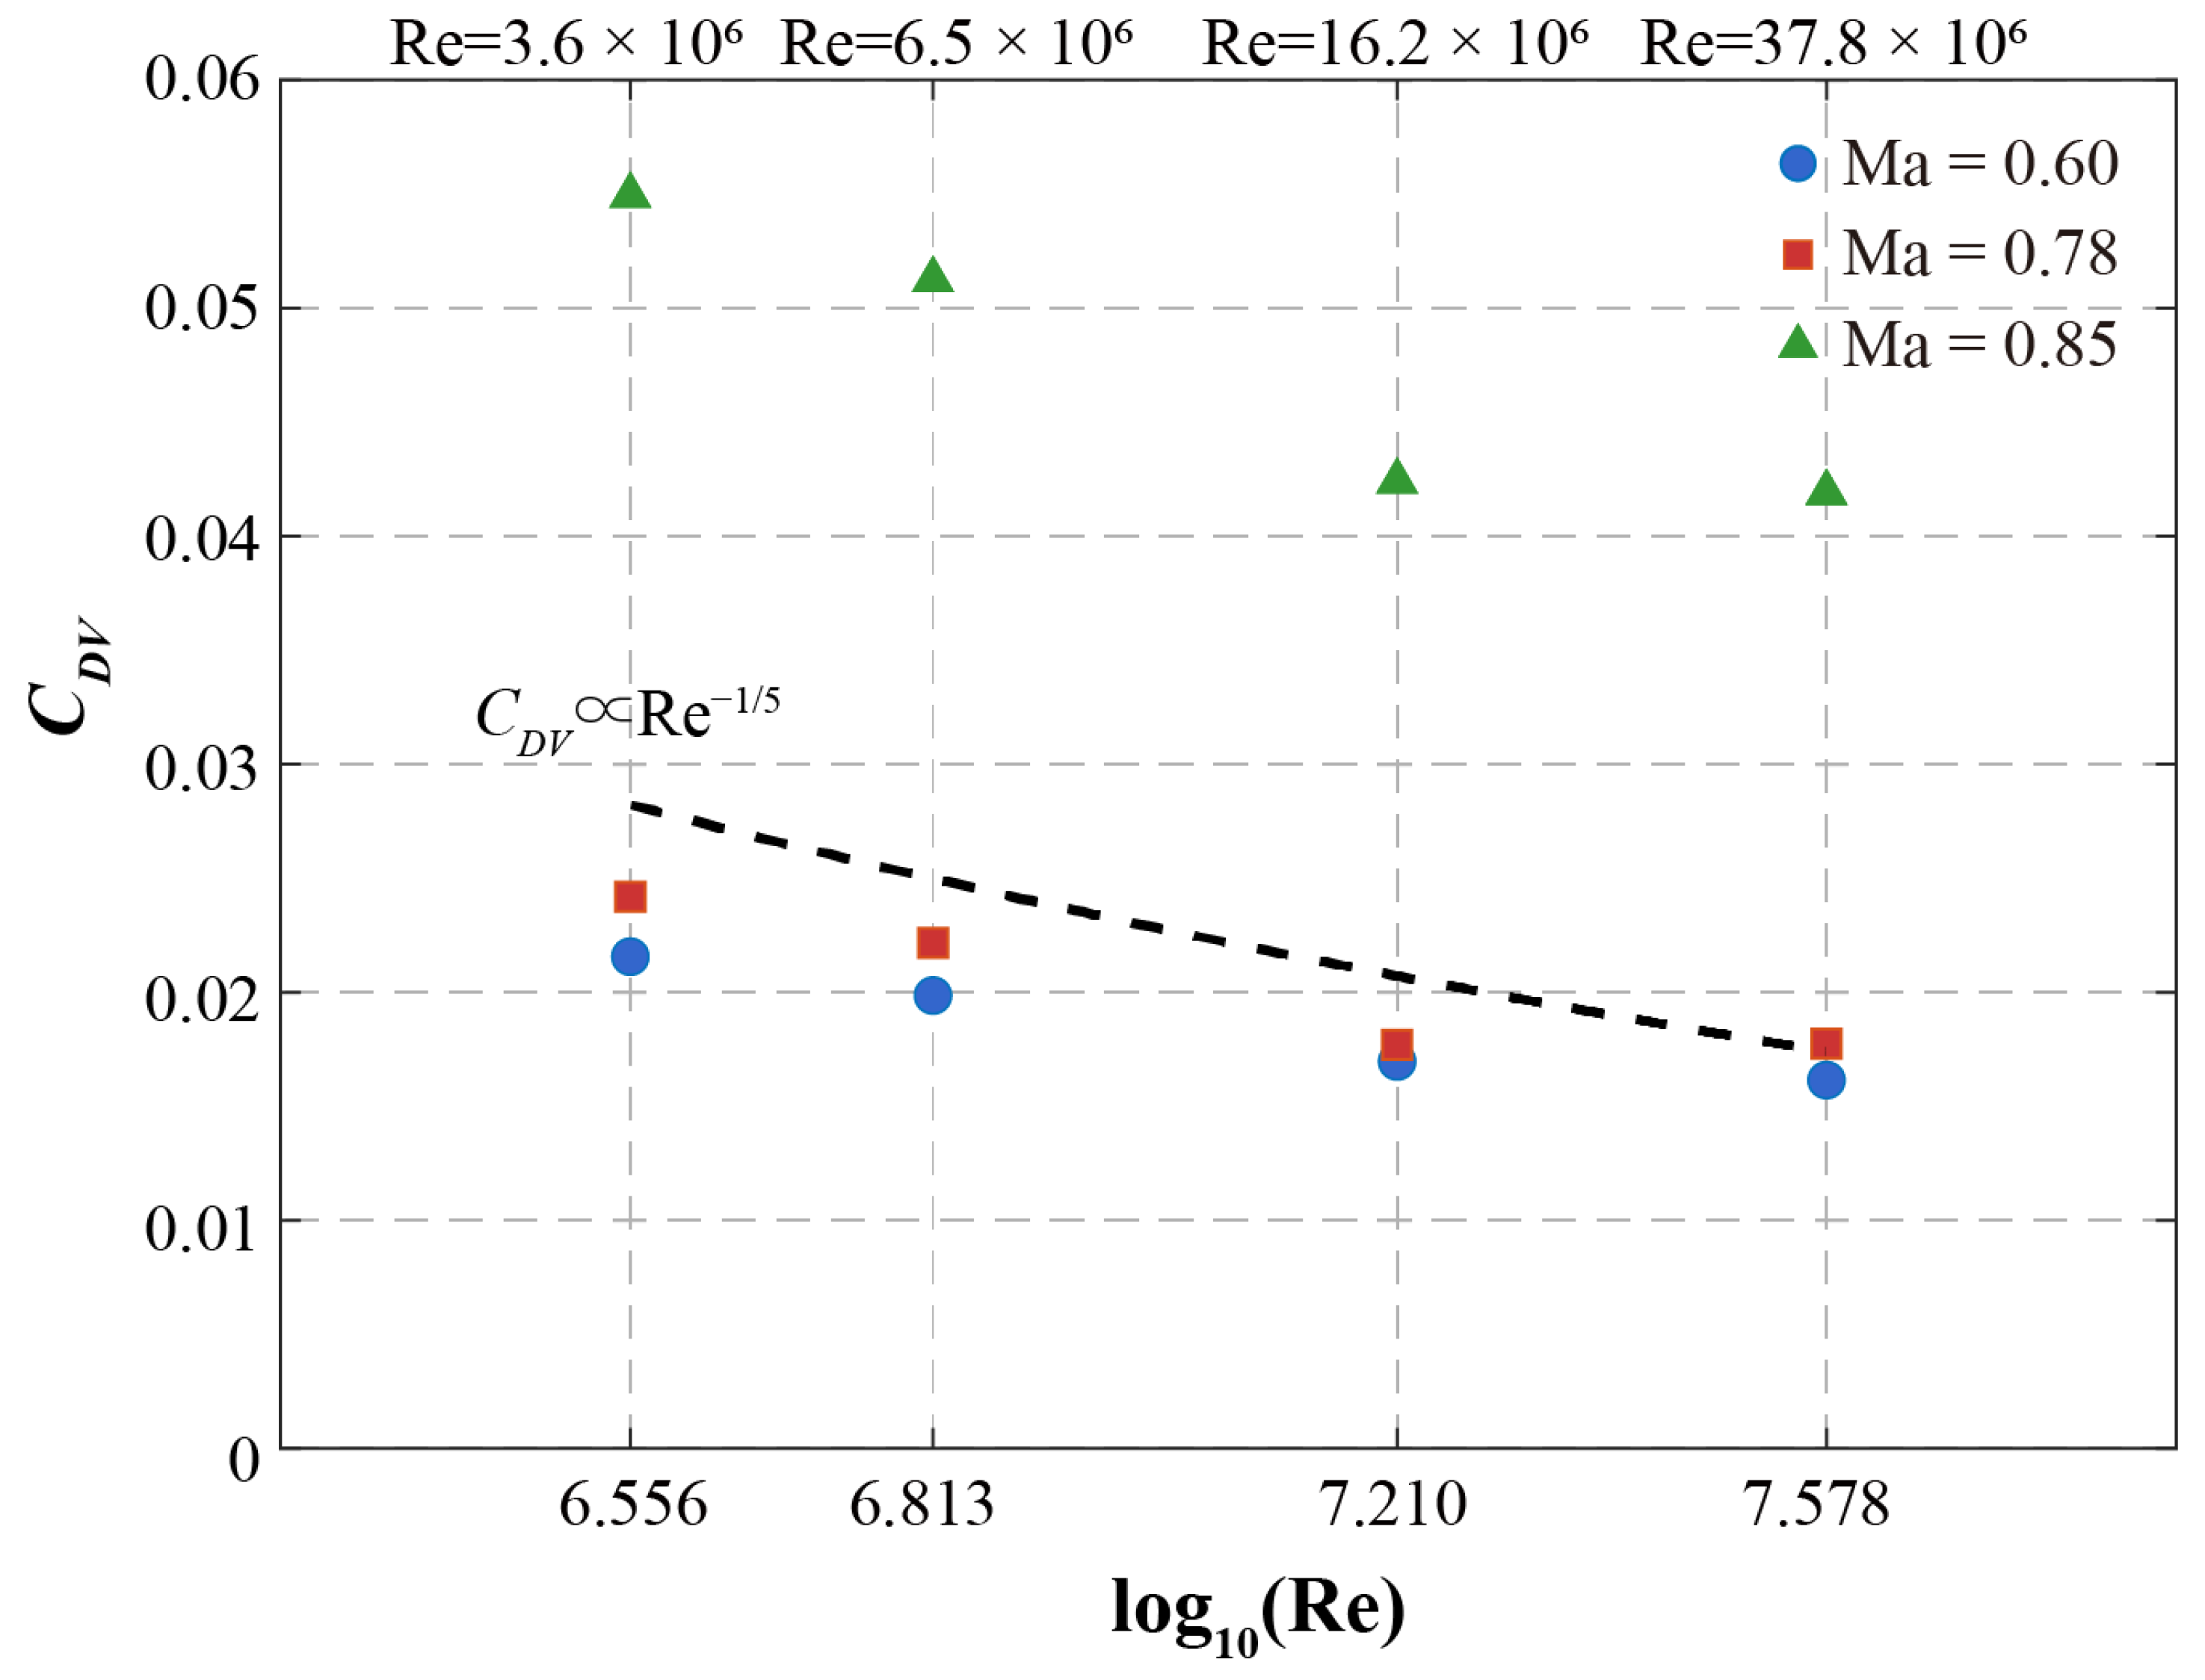
Figure 6 presents CDV as a function of log10(Re) for three representative Mach numbers (M = 0.60, 0.78, 0.85), with the Re−1/5 reference line superimposed. The data show distinct drag levels for the three Mach numbers. At the subsonic condition M = 0.60, where the flow is shock-free, the slope of the CDV curve is smaller than the ideal turbulent skin-friction exponent of 0.2, consistent with the weakly Reynolds-number-dependent pressure/form drag of the realistic wing-body-tail geometry. At the transonic cruise condition M = 0.78, the slope also lies below the ideal 0.2 exponent, while the absolute magnitude shifts upward owing to the emergence of weak wave drag and shock-boundary-layer interactions. This upward offset is quantitatively modest, consistent with the fact that wave drag and compressibility effects at this Mach number remain secondary to the underlying turbulent skin-friction scaling. At the high transonic condition M = 0.85, the entire CDV curve translates significantly upward, exceeding 0.04 even at the highest tested Reynolds numbers. This pronounced upward displacement reflects the dominant contribution of wave drag and strong shock-induced losses at this condition; the fitted exponent is 0.125, well below the ideal 0.2, underscoring that Mach number, rather than pure viscous scaling, governs the performance degradation at this condition.
Figure 6.
Variation of CDV with Reynolds number for three representative Mach numbers (0.60, 0.78, 0.85) at CL = 0.5. Dashed lines are classical reference curves, CDV ∝ Re−1/5, anchored to the highest-Re data point of the M = 0.78 case.
Notably, across all tested Mach numbers, CDV decreases monotonically with increasing Re, validating the physical expectation that higher Reynolds numbers thin the boundary layer and reduce CDV. Quantitative power-law fits of the form CDV ∝ Re−n yield exponents n from 0.125 to 0.141 about 30–37% below the classical turbulent skin-friction exponent of 0.2, consistent with pressure/form and wave drag contributions that scale more weakly with Reynolds number.
3.2.3. Implications for Lift-to-Drag Ratio
Section 3.1 examined the lift-to-drag ratio as a function of angle of attack at M = 0.78 to establish the overall lift-to-drag ratio envelope. The present subsection isolates the Reynolds-number scaling of CL/CD at the fixed design lift coefficient CL = 0.5. Under this condition, the induced drag term CL2/(π·λ) is invariant, and the total drag decomposes as CD = CDV + CL2/(π·λ). Consequently, the entire Reynolds-number dependence of CL/CD is dictated exclusively by the CDV scaling behavior quantified in Section 3.2.2.
To rigorously quantify this sensitivity, we introduce a dimensionless lift-to-drag ratio gain index m, defined formally as m = ∂ ln(CL/CD)/∂ ln(Re). Substituting the drag decomposition into this definition yields an exact analytical relationship between the lift-to-drag ratio gain and the viscous scaling exponent n (where CDV ∝ Re-n):
This formulation demonstrates that CL/CD scaling is fundamentally coupled to the classical Re−1/7 viscous trend but is mathematically attenuated by the presence of a constant induced-drag floor. Therefore, any observed deviation or asymptotic flattening of the CL/CD curves discussed subsequently must be interpreted jointly through variations in n and the evolving ratio of CDV to CDi, rather than ascribed purely to CDV scaling anomalies.
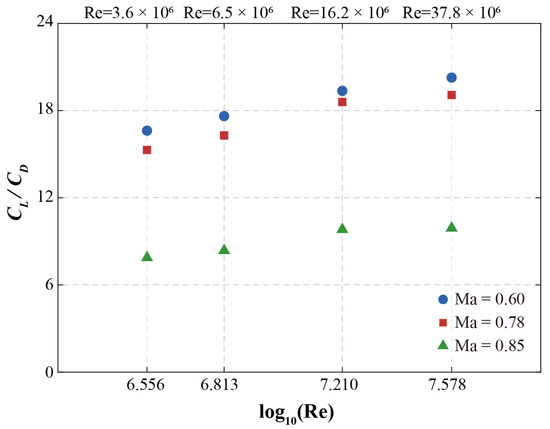
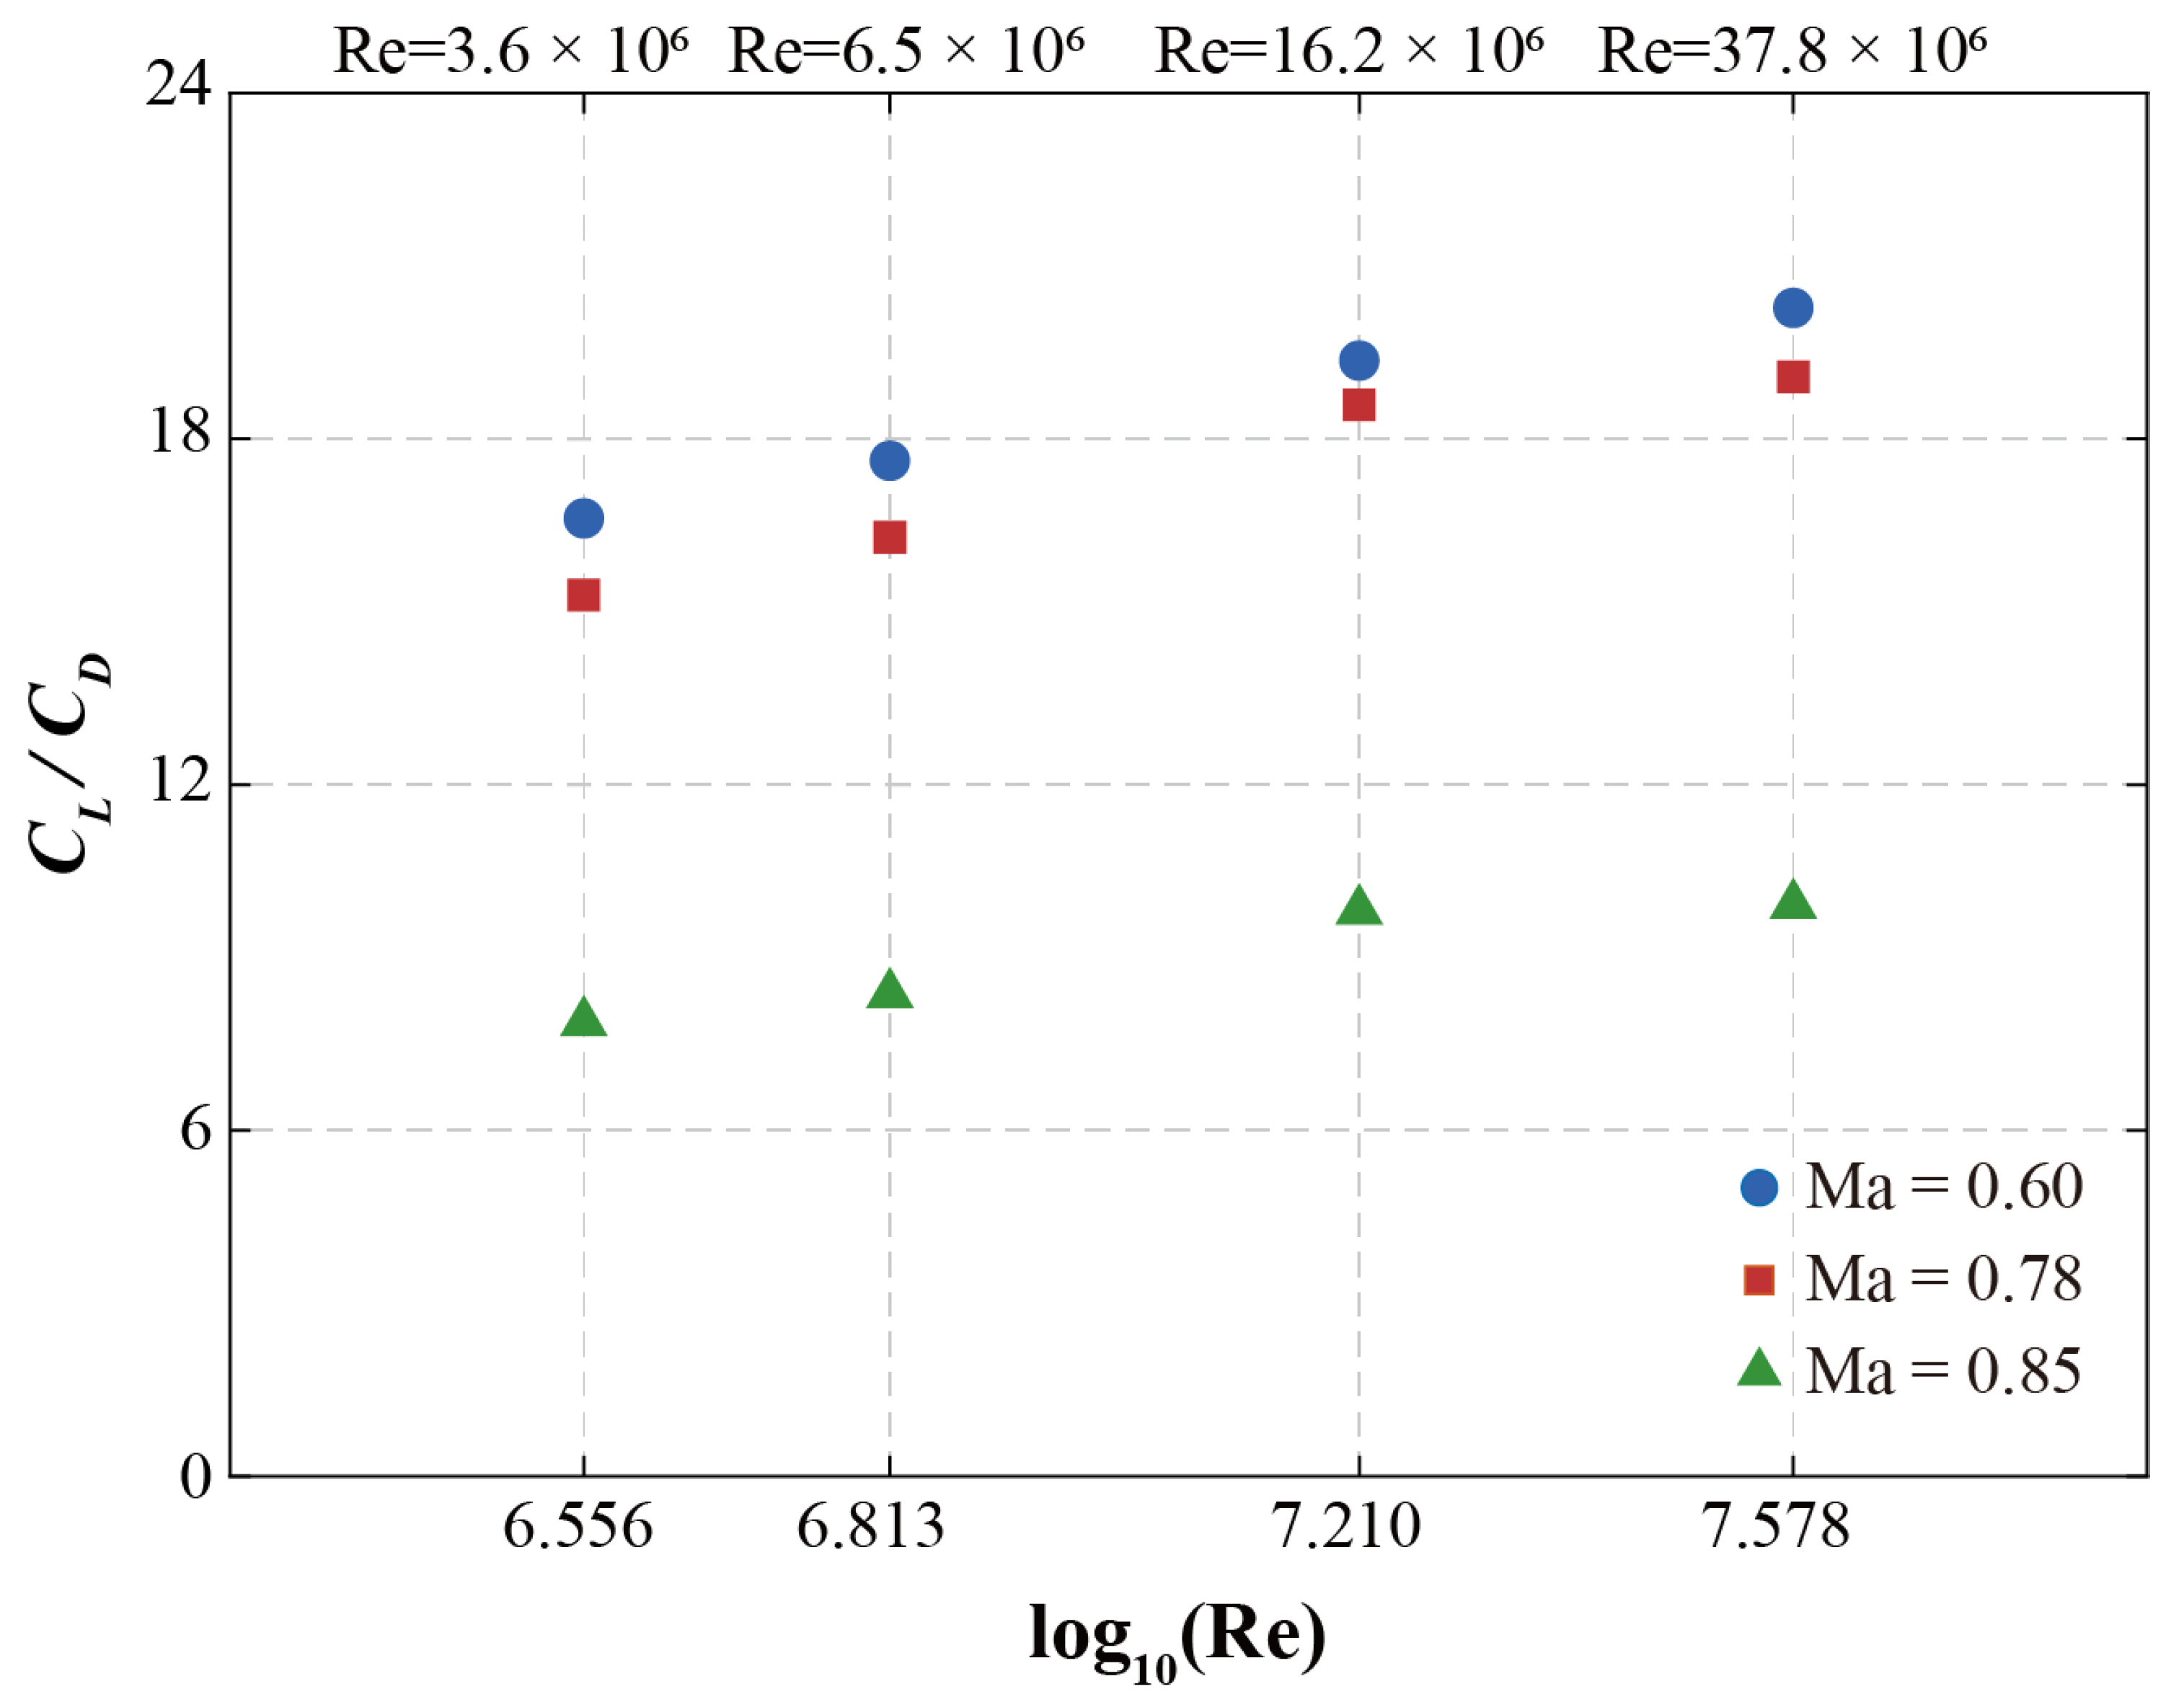
Figure 7 presents CL/CD at CL = 0.5 as a function of Re for M = 0.60, 0.78, and 0.85. At the subsonic condition M = 0.60, CL/CD increases monotonically with Re, governed by a CDV scaling exponent n = 0.126 that falls modestly below the classical turbulent flat-plate expectation. At the transonic cruise condition M = 0.78, the CDV scaling exponent n = 0.141 is about 30% below the classical exponent of 0.2, indicating that skin-friction-dominated scaling governs the Re sensitivity at the design point without material amplification from shock-wave/boundary-layer interaction. The corresponding CL/CD gain index m = 0.099 exceeds that at M = 0.60 (m = 0.086), reflecting the stronger skin-friction-driven Re dependence at the cruise condition relative to the pressure-drag-diluted subsonic case.
Figure 7.
Variation in lift-to-drag ratio with Reynolds number for three representative Mach numbers (0.60, 0.78, 0.85) at CL = 0.5.
At M = 0.85, the absolute CL/CD is substantially lower (approximately 8 to 10, compared with 15 to 20 at M = 0.78) owing to the wave drag penalty, yet the CL/CD gain index m = 0.106 is the largest of the three Mach numbers. This apparent paradox follows from m: at M = 0.85 the non-induced drag fraction CDV/CD is largest because induced drag accounts for a smaller fraction of the total, so even though the exponent n is the smallest of the three Mach numbers, their product m is the largest. The CL/CD curves for M = 0.78 and M = 0.85 exhibit progressively diminishing incremental gains at the highest Re tested (above approximately 30 million), while the absolute gap between them narrows only gradually, consistent with the interpretation that transonic wave drag becomes less Re-sensitive as boundary layers thin and the shock structure approaches an inviscid limit at flight-relevant conditions. Together with the CDV scaling exponents reported in Section 3.2.2, these results indicate that classical flat-plate scaling provides an adequate basis for Reynolds number corrections at the cruise design point, but overestimates the Re sensitivity of CDV at off-design Mach numbers where pressure drag and wave drag contributions are proportionally larger.
3.3. Transition Configuration Coverage and Implications
A complete quantitative assessment of boundary layer transition effects requires paired measurements under fixed and free transition configurations at identical Mach and Reynolds numbers. The present test matrix, designed to maximize the Reynolds number range within the available facility time, adopted a split-coverage strategy: fixed transition was applied at the two lower Reynolds numbers (3.6 × 10⁶ and 6.5 × 10⁶), while free transition was employed at the two higher Reynolds numbers (16.2 × 10⁶ and 37.8 × 10⁶) across all three Mach numbers (M = 0.60, 0.78, 0.85). This design prioritised the exploration of the widest possible Re range at the expense of direct paired comparisons at individual test points.
The data, however, permit a qualitative assessment of transition effects when interpreted in the context of established boundary layer stability behaviour. The aerodynamic coefficients presented in Section 3.1 and Section 3.2, which span all four Reynolds numbers at each Mach number, therefore reflect a transition configuration that changes between the low-Re and high-Re regimes. Despite this change, several observations indicate that the transition effect does not introduce a spurious discontinuity into the Reynolds number trends. First, the CDV versus Re curves in Figure 6 are smooth and monotonic across the full Re range, without visible kinks or offsets at the boundary between the fixed and free transition regimes. Second, the fitted CDV scaling exponents reported in Table 2 are derived from all four data points at each Mach number and exhibit physically consistent behaviour across Mach numbers, which would be unlikely if a systematic transition-induced bias were present. Third, the CL/CD curves in Figure 7 similarly show continuous trends, with the subsonic and transonic curves approaching their respective asymptotes without inflection at the transition configuration boundary.
Table 2.
Fitted CDV scaling exponents (CDV proportional to Re−n) at CL = 0.5.
These observations are consistent with the expectation, grounded in linear stability theory, that natural transition on the wing upper surface advances forward as Reynolds number increases. At the lower Reynolds numbers (3.6 × 10⁶ and 6.5 × 10⁶), where fixed transition was applied via discrete trip dots at 7% chord, natural transition under free conditions would have occurred further aft, and the fixed configuration therefore provides a conservative, fully turbulent estimate of the viscous drag. At the higher Reynolds numbers (16.2 × 10⁶ and 37.8 × 10⁶), natural transition is expected to occur sufficiently close to the leading edge, and possibly forward of the 7% chord trip location, that the difference between fixed and free configurations diminishes. The smooth continuation of the Re trends across the two regimes suggests that the transition configuration change does not materially disrupt the Reynolds number scaling of the global aerodynamic loads for this configuration at transonic conditions.
Notwithstanding these qualitative indicators, the absence of paired data constitutes a limitation of the present dataset for transition-specific studies. A dedicated transition test campaign, in which both configurations are evaluated at identical (Ma, Re) conditions, would be required to quantify the residual transition sensitivity of individual coefficients, particularly the pitching moment, which has been shown in previous studies to retain a weak dependence on the near-leading-edge boundary layer state even at flight-relevant Reynolds numbers [28].
4. Conclusions
An experimental investigation of Reynolds number effects on the transonic aerodynamic characteristics of the CHN-T1 large-aspect-ratio standard model has been conducted in the European Transonic Wind Tunnel, covering unit Reynolds numbers from 3.6 × 10⁶ to 37.8 × 10⁶ at Mach numbers from 0.20 to 0.90. The wide Re range, enabled by the cryogenic operating mode of the ETW facility, permitted a systematic analysis of Reynolds number and Mach number effects on the global aerodynamic loads. The principal findings are as follows.
At M = 0.78, inviscid and viscous behaviors are clearly decoupled. In the linear attached-flow regime, the lift-curve slope varies by only 6% across the tested Re range (0.1333–0.1415 deg−1), confirming that the pressure distribution is governed primarily by geometry and Mach number, with a small viscous influence. Beyond this range, viscous effects dominate: at Re = 3.6 × 10⁶, diminished turbulent mixing causes earlier stall and a modest maximum-lift reduction, with a nearly 20% drag penalty near the cruise design point (CL = 0.6). These penalties diminish at higher Re through the Re−1/5 scaling of turbulent skin friction and delayed separation, raising the maximum lift-to-drag ratio from ~15.5 to ~19.3, an improvement of over 24%.
The low-Re regime is qualitatively distinct: pronounced oscillations in the drag polar and pitching moment at CL > 0.6 signal unsteady vortex shedding, transitioning to smooth, nearly steady separation at medium and high Re. Viscous scale thus governs both load magnitude and transonic flow field stability. Longitudinal stability shows parallel Re dependence: boundary layer thinning at elevated Re reduces the effective displacement surface, allowing the upper-surface shock to extend aft; the resulting center-of-pressure shift moves the neutral point by approximately 1% MAC, with consequences for trim drag and elevator authority.
Quantitative scaling confirms these trends. The non-induced drag coefficient CDV at the cruise design condition (CL = 0.5) yields an exponent n = 0.141 at M = 0.78, about 30% below the classical turbulent flat-plate skin-friction exponent (n = 1/5), consistent with skin-friction-dominated scaling with no material amplification from shock-wave/boundary-layer interaction. At off-design conditions, the exponent moderates to n = 0.126 (M = 0.60) and n = 0.125 (M = 0.85), reflecting growing pressure and wave drag contributions with weaker Re scaling. To analytically decouple the Re sensitivity of CL/CD from the constant induced-drag contribution, we introduce a dimensionless lift-to-drag ratio gain index defined as m = ∂ ln(CL/CD)/∂ ln(Re). This index isolates the influence of viscous drag scaling on aerodynamic efficiency. Lift-to-drag ratio increases monotonically with Re, with m values of 0.086, 0.099, and 0.106 at M = 0.60, 0.78, and 0.85, respectively. The highest relative gain occurs at M = 0.85 despite the lowest absolute lift-to-drag ratio: this arises because induced drag accounts for a smaller fraction of CD at M = 0.85, so the Re-sensitive part of the drag constitutes a larger fraction of the total. At flight-scale Re (>3 × 10⁷), the absolute incremental gains diminish, while the logarithmic gain index m remains approximately constant, indicating that transonic wave drag stabilizes as the shock structure approaches an inviscid limit.
Methodologically, the test matrix used fixed transition at the two lower Re and free transition at the two higher Re, precluding direct paired quantification. The smooth, monotonic CDV and lift-to-drag ratio trends across the full Re range nevertheless support the robustness of the scaling results.
This dataset, spanning more than one order of magnitude in Reynolds number under consistent cryogenic conditions, provides a rare experimental benchmark for validating CFD-based Reynolds number scaling methodologies. The finding that classical flat-plate scaling holds at the cruise design point while requiring Mach-number-dependent correction at off-design conditions offers a practical framework for extrapolating conventional wind tunnel data to flight Reynolds numbers.
Author Contributions
Conceptualization, D.L.; methodology, D.L. and Y.C.; validation, X.P. and Y.C.; formal analysis, X.P. and J.M.; investigation, D.L., X.P. and Q.L.; data curation, Q.L.; writing—original draft preparation, J.M.; writing—review and editing, Q.L.; visualization, Y.C. and J.M.; supervision, D.L.; project administration, D.L. All authors have read and agreed to the published version of the manuscript.
Funding
This research received no external funding.
Data Availability Statement
The CHN-T1 dataset and test report are available at https://doi.org/10.5281/zenodo.21422698.
Acknowledgments
The authors sincerely thank the European Transonic Wind Tunnel for granting access to its state-of-the-art cryogenic pressurized wind tunnel facility and for the expert technical support provided during the CHN-T1 standard model test campaign.
Conflicts of Interest
The authors declare no conflicts of interest.
Abbreviations
The following abbreviations are used in this manuscript:
| CD | Wind-axis drag coefficient |
| CDV | Non-induced drag coefficient |
| CD0 | Zero-lift drag coefficient |
| CDi | Induced drag coefficient |
| Cf | Skin friction coefficient |
| CL | Wind-axis lift coefficient |
| Cm | Body-axis pitching moment coefficient |
| Cm0 | Zero-lift pitching moment coefficient |
| CL/CD | Lift-to-drag ratio |
| CLα | Lift-curve slope |
| CmCL | Pitching-moment slope |
| M | Mach number |
| n | CDV scaling exponent |
| m | Lift-to-drag ratio gain index |
| Re | Reynolds number (based on mean aerodynamic chord) |
| α | Angle of attack |
| α0 | Zero-lift angle of attack |
| U∞ | Freestream velocity |
| HTP | Horizontal tailplane |
| VTP | Vertical tailplane |
| MAC | Mean aerodynamic chord |
| SWBLI | Shock-wave/boundary-layer interaction |
References
- Tinoco, E. The Changing Role of Computational Fluid Dynamics in Aircraft Development. In Proceedings of the 16th AIAA Applied Aerodynamics Conference, Albuquerque, NM, USA, 15–18 June 1998; AIAA Paper 98-2512; AIAA: Reston, VA, USA, 1998. [Google Scholar]
- Slotnick, J.; Khodadoust, A.; Alonso, J.; Darmofal, D.; Gropp, W.; Lurie, E.; Mavriplis, D. CFD Vision 2030 Study: A Path to Revolutionary Computational Aerosciences; NASA/CR-2014-218178; NASA: Washington, DC, USA, 2014. [Google Scholar]
- Rivers, M.; Dittberner, A. Experimental Investigations of the NASA Common Research Model in the NASA Langley National Transonic Facility and NASA Ames 11-Ft Transonic Wind Tunnel. In Proceedings of the 49th AIAA Aerospace Sciences Meeting including the New Horizons Forum and Aerospace Exposition, Orlando, FL, USA, 4–7 January 2011; AIAA Paper 2011-1125; AIAA: Reston, VA, USA, 2011. [Google Scholar]
- Vassberg, J.C.; Dehaan, M.; Rivers, M.; Wahls, R.A. Development of a Common Research Model for Applied CFD Validation Studies. In Proceedings of the 26th AIAA Applied Aerodynamics Conference, Honolulu, HI, USA, 18–21 August 2008; AIAA Paper 2008-6919; AIAA: Reston, VA, USA, 2008. [Google Scholar]
- Blackwell, J.A. Preliminary Study of Effects of Reynolds Number and Boundary-Layer Transition Location on Shock-Induced Separation; NASA TN D-5020; NASA: Washington, DC, USA, 1969. [Google Scholar]
- Fukushima, Y.; Kawai, S. Wall-Modeled Large-Eddy Simulation of Transonic Airfoil Buffet at High Reynolds Number. AIAA J. 2018, 56, 2372–2388. [Google Scholar] [CrossRef] [Scilit]
- Wang, Y.; Liu, D.; Xu, X.; Li, G. Investigation of Reynolds Number Effects on Aerodynamic Characteristics of a Transport Aircraft. Aerospace 2021, 8, 177. [Google Scholar] [CrossRef] [Scilit]
- Rivers, M.; Quest, J.; Rudnik, R. Comparison of the NASA Common Research Model European Transonic Wind Tunnel Test Data to NASA National Transonic Facility Test Data. CEAS Aeronaut. J. 2018, 9, 307–317. [Google Scholar] [CrossRef] [Scilit]
- Vassberg, J.C.; Tinoco, E.N.; Mani, M.; Rider, B.; Zickuhr, T.; Levy, D.W.; Brodersen, O.; Eisfeld, B.; Crippa, S.; Wahls, R.A.; et al. Summary of the Fourth AIAA Computational Fluid Dynamics Drag Prediction Workshop. J. Aircr. 2014, 51, 1070–1089. [Google Scholar] [CrossRef] [Scilit]
- Tinoco, E.N.; Brodersen, O.P.; Hue, D.; Gariepy, M.; Roy, C.J.; Mavriplis, D.J.; Murayama, M.; Keye, S.; Laflin, K.R.; Feltrop, E. Summary of Data from the Sixth AIAA CFD Drag Prediction Workshop: CRM Cases 2 to 5. In Proceedings of the AIAA SciTech 2017 Forum, Grapevine, TX, USA, 9–13 January 2017; AIAA Paper 2017-1203; AIAA: Reston, VA, USA, 2017. [Google Scholar]
- Yu, Y.; Zhou, Z.; Huang, J.; Mou, B.; Huang, Y.; Wang, Y. Aerodynamic Design of a Standard Model CHN-T1 for Single-Aisle Passenger Aircraft. Acta Aerodyn. Sin. 2018, 36, 505–513. [Google Scholar] [CrossRef]
- Li, Q.; Liu, D.; Xu, X.; Chen, D. Experimental Study of Aerodynamic Characteristic of CHN-T1 Standard Model in 2.4 m Transonic Wind Tunnel. Acta Aerodyn. Sin. 2019, 37, 337–344. [Google Scholar] [CrossRef]
- Quest, J. ETW—High Quality Test Performance in Cryogenic Environment. In Proceedings of the 21st AIAA Aerodynamic Measurement Technology and Ground Testing Conference, Denver, CO, USA, 19–22 June 2000; AIAA Paper 2000-2508; AIAA: Reston, VA, USA, 2000. [Google Scholar]
- Schimanski, D.; Jawaid, B.; Russell, A. ETW—The European Transonic Windtunnel. In Proceedings of the Twelfth International Cryogenic Engineering Conference, Southampton, UK, 12–15 July 1988; Scurlock, R.G., Bailey, C.A., Eds.; Butterworth-Heinemann: Southampton, UK, 1988; pp. 43–52. [Google Scholar]
- White, P.; Gibson, T. Exploitation by Airbus of High Reynolds Number Test Capabilities in the European Transonic Wind Tunnel. In Proceedings of the 42nd AIAA Aerospace Sciences Meeting and Exhibit, Reno, NV, USA, 5–8 January 2004; AIAA Paper 2004-0768; AIAA: Reston, VA, USA, 2004. [Google Scholar]
- Konrath, R.; Otter, D.; Geisler, R.; Agocs, J.; Mattner, H.; Roosenboom, E.W.M.; Fey, U.; Kompenhans, J.; Quest, J.; Kühn, C. Adaptation of PIV for Application in Cryogenic Pressurized Wind Tunnel Facilities at High Reynolds Numbers. In Proceedings of the 15th International Symposium on Applications of Laser Techniques to Fluid Mechanics, Lisbon, Portugal, 5–8 July 2010. [Google Scholar]
- Konrath, R. Tracking the Nacelle Vortex above Aircraft Wing in the ETW at Real Mach- and Reynolds Numbers by Means of PIV. In Proceedings of the 53rd AIAA Aerospace Sciences Meeting, Kissimmee, FL, USA, 5–9 January 2015; AIAA Paper 2015-1560; American Institute of Aeronautics and Astronautics: Reston, VA, USA, 2015. [Google Scholar] [CrossRef] [Scilit]
- Crook, A. Skin-Friction Estimation at High Reynolds Numbers and Reynolds-Number Effects for Transport Aircraft. Stanford CTR Res. Briefs; Stanford University: Stanford, CA, USA, 2002; Available online: https://web.stanford.edu/group/ctr/ResBriefs02/crook1.pdf (accessed on 27 August 2026).
- Wang, H.; Wu, J.; Peng, X.; Liu, D.; Xiong, N.; Wu, J.; Zhang, C.; Wang, H.; Wang, X.; Zhang, Y.; et al. Research on Reynolds Number Effects and Influencing Factors of the Wide-Body Transport Aircraft Standard Model CHN-T2. Aerosp. Sci. Technol. 2025, 167, 110649. [Google Scholar] [CrossRef] [Scilit]
- Balakumar, P.; Iyer, P.S. Laminar to Turbulence Transition in Boundary Layers due to Tripping Devices. In Proceedings of the AIAA SciTech 2021 Forum; AIAA Paper 2021-1948; American Institute of Aeronautics and Astronautics: Reston, VA, USA, 2021. [Google Scholar] [CrossRef] [Scilit]
- Dos Santos, F.L.; Sanders, M.P.; Dantas de Santana, L.; Venner, C.H. Influence of Tripping Devices in Hastening Transition in a Flat Plate Submitted to Zero and Favorable Pressure Gradients. In Proceedings of the AIAA Scitech 2020 Forum, Orlando, FL, USA, 6–10 January 2020; p. 46. [Google Scholar]
- Braslow, A.L.; Knox, E.C. Simplified Method for Determination of Critical Height of Distributed Roughness Particles for Boundary-Layer Transition at Mach Numbers from 0 to 5; NACA TN 4363; National Advisory Committee for Aeronautics: Washington, DC, USA, 1958. [Google Scholar]
- Zauner, M.; De Tullio, N.; Sandham, N.D. Direct Numerical Simulations of Transonic Flow around an Airfoil at Moderate Reynolds Numbers. AIAA J. 2019, 57, 597–607. [Google Scholar] [CrossRef] [Scilit]
- Gobert, J. ETW Control System—Design and First Results. In Proceedings of the 25th Plasmadynamics and Lasers Conference, Colorado Springs, CO, USA, 20–23 June 1994; AIAA Paper 1994-2514; AIAA: Reston, VA, USA, 1994. [Google Scholar] [CrossRef] [Scilit]
- Prandtl, L.; Tietjens, O.K.G. Applied Hydro-and Aeromechanics; Dover Publications: Garden City, NY, USA, 1957. [Google Scholar]
- van Dam, C.P. Recent Experience with Different Methods of Drag Prediction. Prog. Aerosp. Sci. 1999, 35, 751–798. [Google Scholar] [CrossRef] [Scilit]
- Schlichting, H.; Gersten, K. Boundary-Layer Theory; Springer: Berlin/Heidelberg, Germany, 2016. [Google Scholar]
- Arnal, D.; Casalis, G. Laminar-Turbulent Transition Prediction in Three-Dimensional Flows. Prog. Aerosp. Sci. 2000, 36, 173–191. [Google Scholar] [CrossRef] [Scilit]

Disclaimer/Publisher’s Note: The statements, opinions and data contained in all publications are solely those of the individual author(s) and contributor(s) and not of MDPI and/or the editor(s). MDPI and/or the editor(s) disclaim responsibility for any injury to people or property resulting from any ideas, methods, instructions or products referred to in the content. |
© 2026 by the authors. Licensee MDPI, Basel, Switzerland. This article is an open access article distributed under the terms and conditions of the Creative Commons Attribution (CC BY) license.