


Abstract
Frigatebirds achieve exceptional long-endurance flight by efficiently utilizing marine atmospheric updrafts, offering a valuable biological prototype for low-energy bionic aircraft. Most existing studies focus on uniform inflow and single-axis attitudes, lacking systematic analysis of coupled-attitude aerodynamics and flow-field mechanisms in updraft environments. This work numerically investigates both clean-wing and fuselage-equipped frigatebird-inspired configurations under pitch-alone, pitch–yaw coupled, and yaw–roll coupled attitudes using the RANS/k- SST method. Results show that updraft effects exhibit strong pitch-angle dependence: significant drag reduction (maximum 0.0984) and lift augmentation occur within , while above updrafts suppress full-span deep stall and extend the stall angle by more than , with a maximum lift increment of 220% near the wingtip. Under pitch–yaw coupling, a high-efficiency aerodynamic window emerges with a physically meaningful peak lift-to-drag ratio of 9.55. For yaw–roll coupling, the rolling moment is fundamentally driven by sideslip-induced asymmetric separation bubbles rather than by roll angle itself, as confirmed by surface limiting streamlines, skin friction distributions, and velocity vector plots. The bionic wing also achieves a near-elliptical spanwise lift distribution with an Oswald efficiency of approximately 0.994. This study provides key support for aerodynamic design, attitude control, and updraft energy harvesting of bird-like aerial vehicles.
1. Introduction
Among the numerous seabird species capable of long-distance migration, frigatebirds have evolved the unparalleled capacity for uninterrupted ultra-long-range flight in the natural world, making them the optimal biological prototype for low-energy long-endurance bionic aerodynamic research. Unlike pelagic seabirds such as albatrosses that can rest on the sea surface, frigatebirds have underdeveloped uropygial glands and extremely poor hydrophobicity of their body feathers. Once exposed to seawater, their aerodynamic performance will plummet due to feather wetting directly lead to their death. This physiological constraint dictates that they have no access to any sea or land rest windows throughout the entire transoceanic foraging and migration cycle, and must maintain completely uninterrupted flight for tens of days to several months.
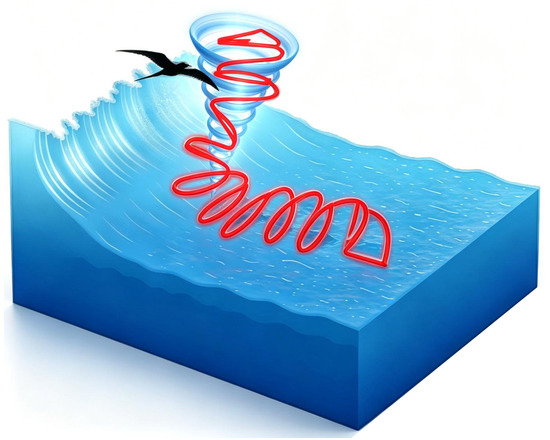
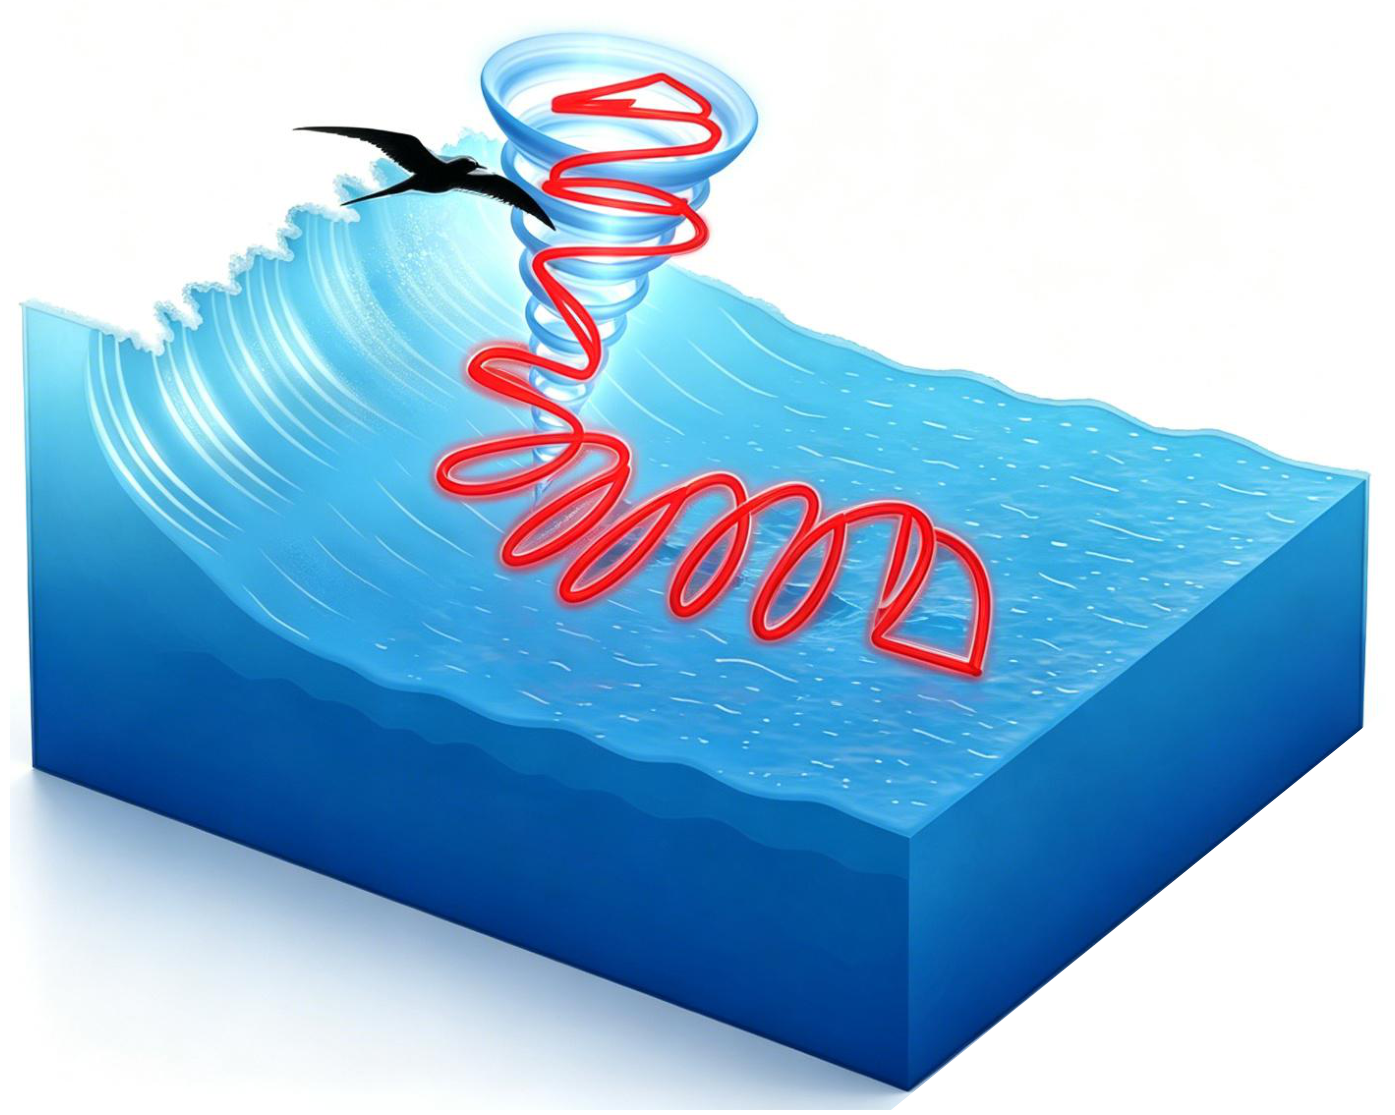
Authoritative studies based on satellite tracking and field observations have confirmed that the great frigatebird can achieve a single continuous flight duration of over 2 months, a cumulative cruising range of more than 15,000 km, and an annual cumulative flight mileage of up to km during transoceanic migrations in the Indo-Pacific Ocean [1] (Figure 1). Most critically, this extreme ultra-long-range uninterrupted flight does not rely on high-energy continuous flapping propulsion. Instead, it is achieved by precisely sensing and efficiently capturing vertical updrafts in the marine atmosphere (including thermal convective updrafts, orographic and frontal dynamic lifting flows [2,3,4,5]), and then utilizing these updrafts to realize potential energy accumulation and long-distance cruising through a flight mode dominated absolutely by unpowered gliding [6].
Figure 1.
Schematic illustration of the frigatebird’s thermal–gliding flight cycle (Ref. [1]).
Measured metabolic data show that frigatebirds spend more than 90% of their flight time in unpowered gliding, and their flight metabolic energy consumption is only approximately 3% of that of birds of equivalent body mass during continuous flapping flight. Thus, the extreme adaptation of the frigatebird flight system to the marine updraft environment is the key to its ultra-long-range flight capability. As the core lift and aerodynamic control component, the wing’s unique configuration and aerodynamic characteristics constitute the biological basis for efficient utilization of updrafts and ultra-low-energy long-endurance flight [7,8], and also serve as the core bionic prototype of this study.
Extensive multi-dimensional fundamental research has been conducted worldwide on the ultra-long-range flight characteristics of frigatebirds. In the field of flight biology and kinematics, researchers have identified the transoceanic migration routes, the periodic climb-glide flight paradigm, and the updraft utilization strategies under different marine atmospheric environments through satellite tracking, onboard microsensing systems, and long-term field observations [9]. These studies have confirmed that the core logic of their ultra-long-range flight is to maximize updraft energy capture while minimizing self-energy consumption. However, existing biological studies mostly focus on the macroscopic statistical laws of flight strategies, and have not established a quantitative correlation between their updraft utilization strategies and the aerodynamic performance of the wings, thus failing to reveal the intrinsic influence mechanism of wing configuration on updraft adaptability.
In the field of aerodynamic research on bionic wings under updraft conditions, existing achievements are mostly concentrated on the bionic mechanism and layout optimization of the albatross dynamic gliding mode. Systematic research on frigatebird wings, which rely on updraft thermal gliding to achieve ultra-long-range flight, is extremely scarce. Research on marine updrafts is also limited: the only available measurement of updraft characteristics was conducted by Joanne in 1954 by flying an aircraft through the airflow, and the results inferred the presence of high-speed ascending air with velocities of approximately 2–6 m/s in updrafts [2]. Research on the formation and evolution of updrafts is relatively weak, which further leads to the lack of systematic quantitative research and mechanistic explanations for issues such as the pitch static stability, energy harvesting efficiency, stall boundary, and flow control characteristics of frigatebird wings under updraft conditions.
To address the aforementioned scientific gaps, this study takes the wing of frigatebirds capable of ultra-long-range uninterrupted flight as the bionic prototype, and systematically investigates the aerodynamic performance of the bionic wing under updraft conditions. Using the Computational Fluid Dynamics (CFD) numerical simulation method, this study systematically analyzes the evolution laws of core aerodynamic parameters of the bionic frigatebird wing, including lift coefficient, lift-to-drag ratio, and pitching moment coefficient, under key parameters such as different vertical ascent velocities, freestream angles of attack, and turbulence intensities. The nonlinear transition mechanism of yaw static stability with pitch angle is revealed, and the critical attitude intervals between stability and instability are identified. This study provides data support and theoretical reference for the aerodynamic layout optimization, lateral-directional stability design, and airflow adaptive control of bionic aircraft in complex atmospheric environments, and also offers a new perspective for in-depth interpretation of the biomechanical mechanism by which birds achieve efficient and stable gliding using updrafts.
2. Model
2.1. Bionic Wing Modeling
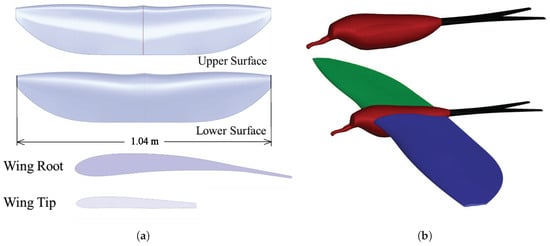
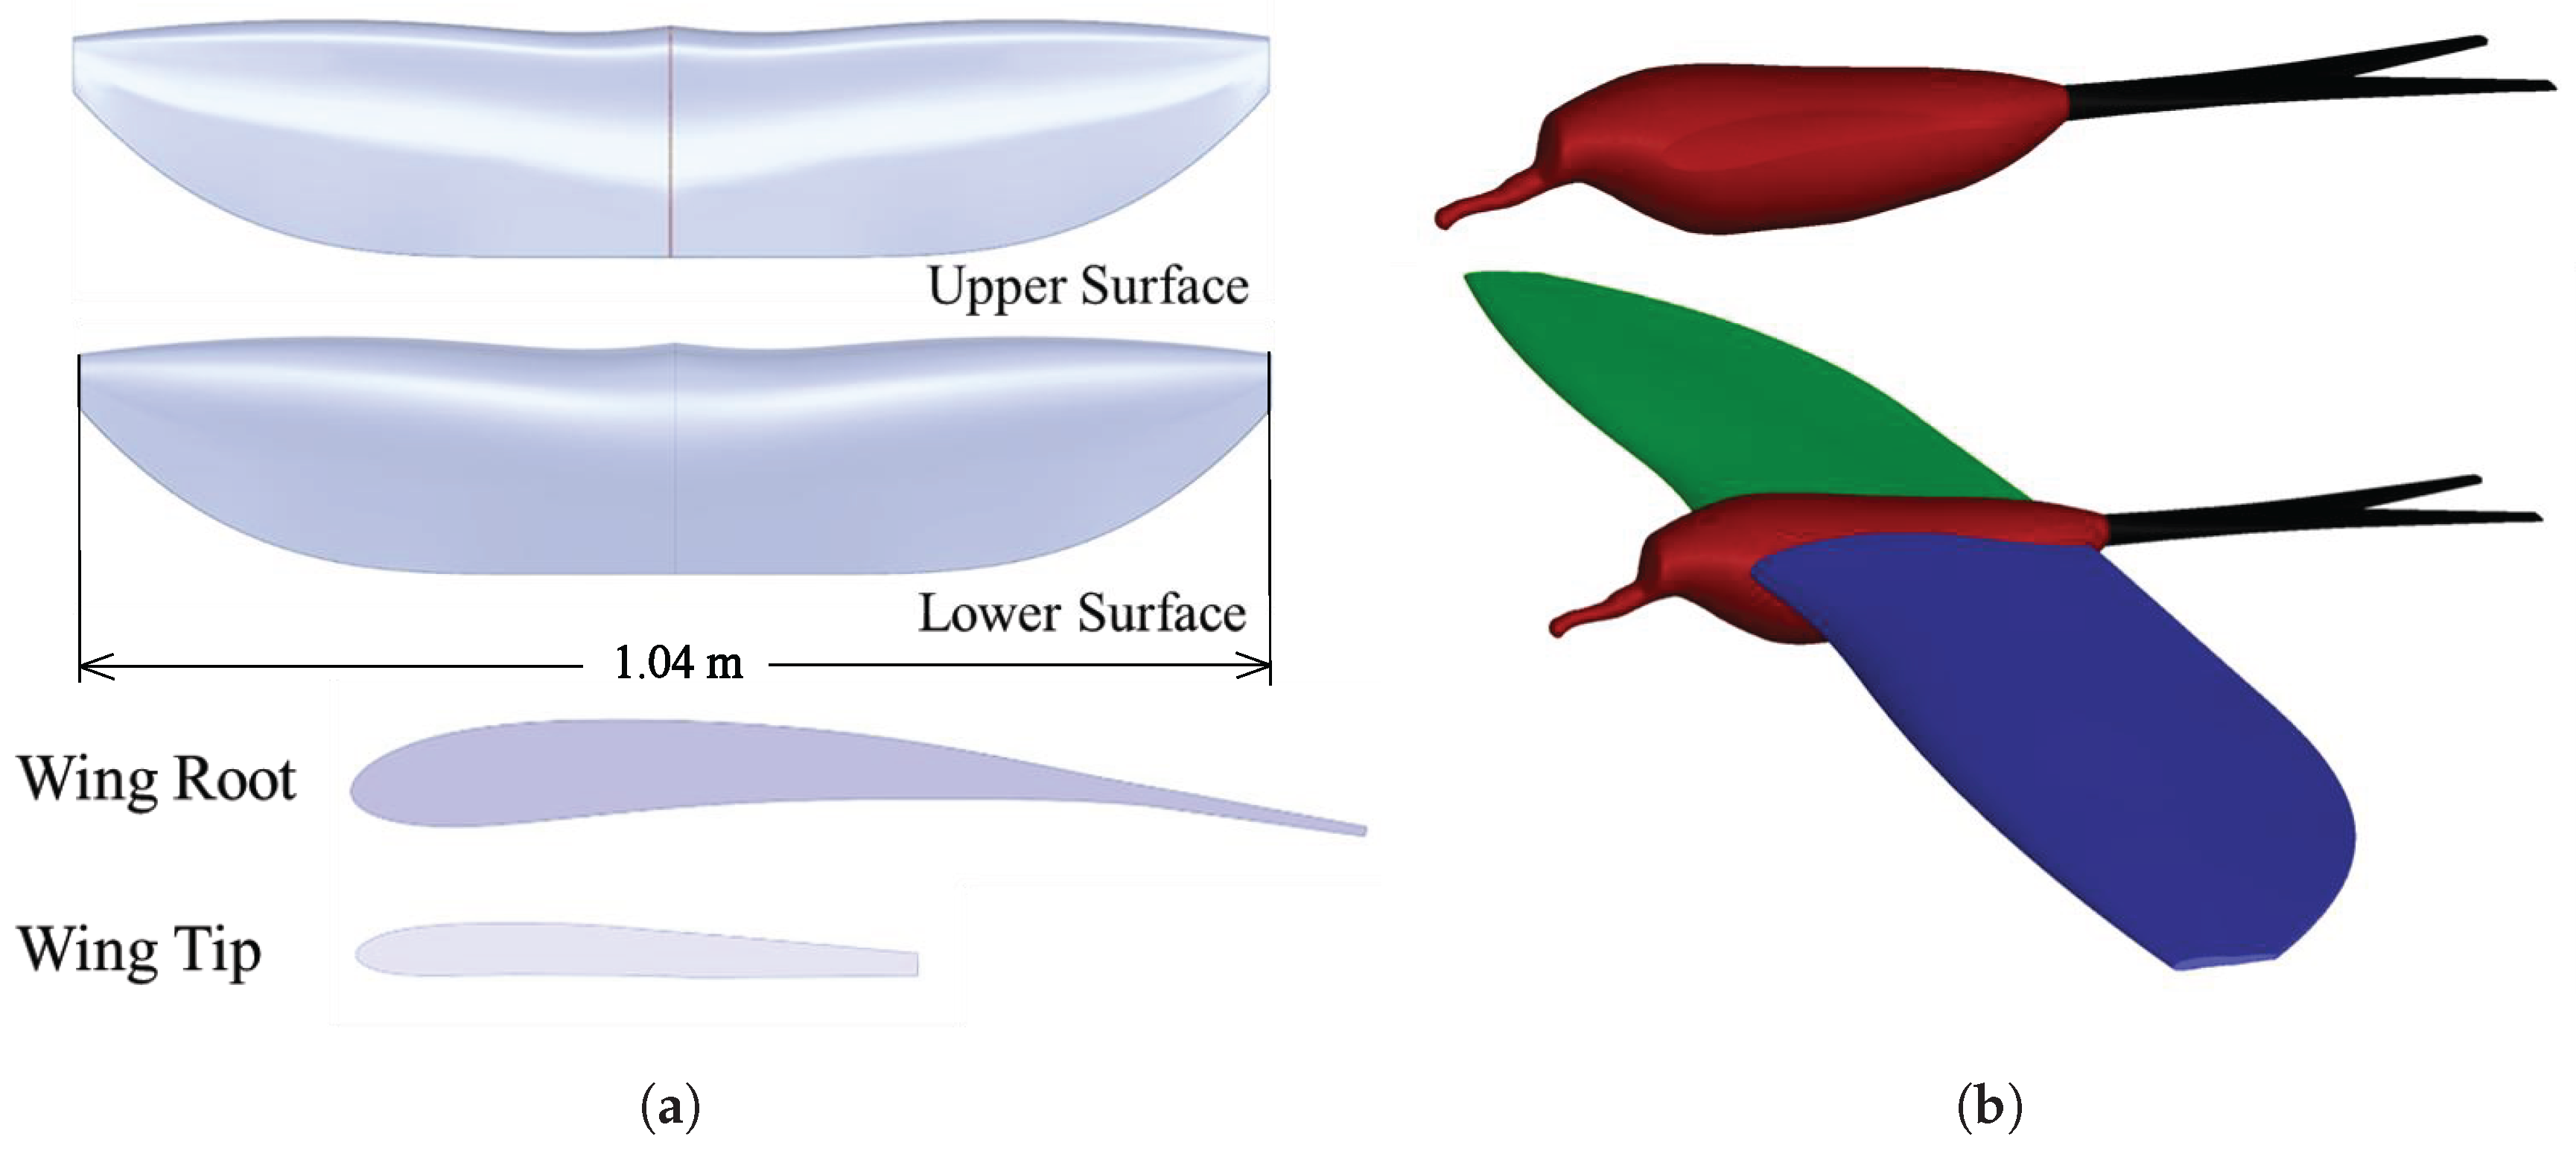
In this study, simplified bionic geometries of the frigatebird, including both the wing and the fuselage–tail assembly, are employed for the numerical simulations. The geometric abstractions retain the essential aerodynamic features of the frigatebird while omitting fine-scale anatomical details such as individual feather slots, skin texture, and anatomical surface irregularities, thereby ensuring a clean and reproducible computational model.
The frigatebird wing is composed of muscular tissues and feathers. For the bionic modeling, a simplified airfoil was adopted to simulate the muscular region of the frigatebird wing, while a trailing edge extension was constructed to replicate its feather structure. The wing geometry was reconstructed based on video footage, and the resulting clean frigatebird wing model is shown in Figure 2a.
Figure 2.
Bionic frigatebird models: (a) clean wing configuration; (b) fuselage-equipped configuration.
To investigate the fuselage and tail interference effects, a simplified frigatebird-inspired configuration with a bionic fuselage and tail is additionally constructed, as shown in Figure 2b. The fuselage and tail are both reconstructed from frigatebird reference imagery with simplified geometric contours, with a total length m (including the tail feathers) and a maximum width m.
2.2. Governing Equations
The Reynolds-Averaged Navier–Stokes (RANS) method based on the k- Shear Stress Transport (SST) turbulence model is adopted in this study. This method combines the dual advantages of the high near-wall simulation accuracy of the standard k- model and the good far-field numerical stability of the k- model. It automatically switches to the k- mode in the near-wall boundary layer region, which can accurately resolve the flow variations in the viscous sublayer, and smoothly transitions to the k- formulation in the far-field free shear flow region, effectively mitigating the limitations of the traditional k- model, such as excessive sensitivity to free-stream boundary conditions and poor numerical robustness. The model incorporates a shear stress transport correction and an eddy viscosity limiter mechanism, which can effectively suppress the overprediction of eddy viscosity under strong adverse pressure gradient conditions. It is capable of accurately capturing complex flow features including boundary layer pressurization and deceleration, flow separation, and reattachment. Compared with the traditional k- family of models, it exhibits higher prediction accuracy for separated flows, adverse pressure gradient flows, and shock-boundary layer interactions, meeting the requirements of this numerical simulation for flow detail resolution and computational reliability. The RANS equations are given as follows:
where denotes the velocity component, denotes the Cartesian orthogonal coordinate component, p denotes the pressure, denotes the density, and the overbar indicates that the quantity has been subjected to Reynolds averaging. Based on the Boussines hypothesis, the Reynolds stress term is correlated with the mean rate-of-strain tensor:
where k is the turbulent kinetic energy, is the turbulent viscosity, and is the Kronecker delta. A fully implicit coupled solution approach is employed. The convective and dissipative terms are discretized using the second-order upwind scheme, and the pressure term is discretized using the second-order central difference scheme.
2.3. Computational Domain Setup
The bionic frigatebird wing has a reference chord length m. The rectangular computational domain extends upstream, downstream, above and below the wing, and along each spanwise direction, yielding overall dimensions of ().
The four lateral boundaries are specified as pressure far-field boundaries with static pressure Pa, static temperature K, turbulence intensity , and turbulent viscosity ratio . The wing surface is treated as a no-slip adiabatic wall.
The marine atmospheric updraft is modeled by superimposing a vertical velocity component m/s onto the baseline horizontal freestream m/s. The resultant velocity vector is m/s, and the effective angle of attack is modified accordingly through vector rotation. This approach treats the updraft as a steady, uniform vertical perturbation, consistent with the large-scale thermal convective updrafts encountered by frigatebirds during long-endurance gliding.
2.4. Mesh Generation
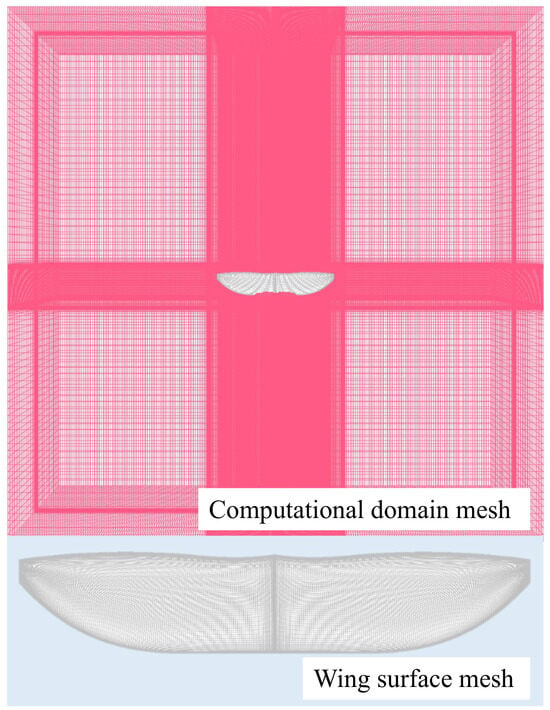
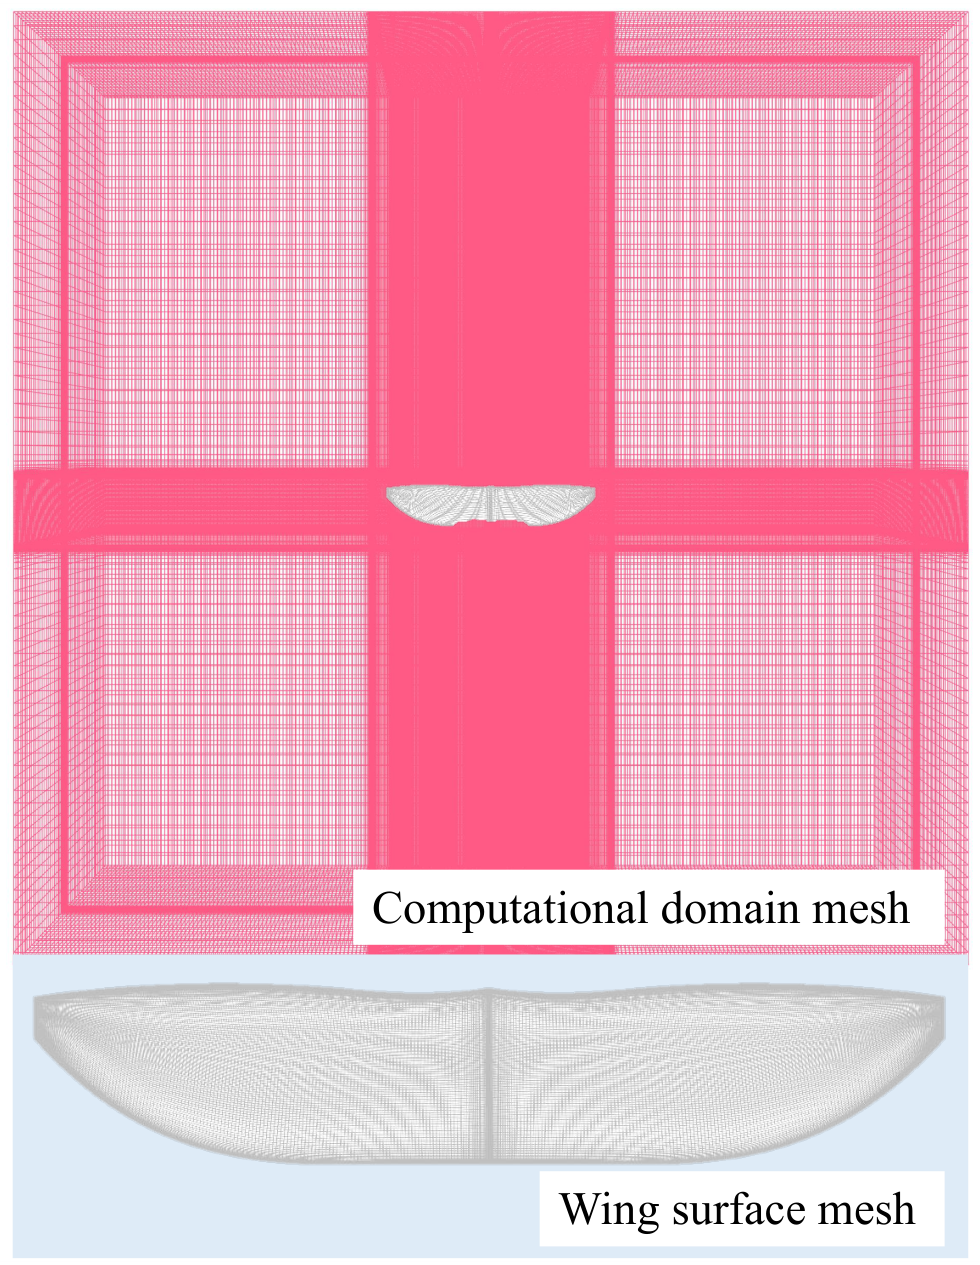
A C-H structured grid is employed, with a C-type grid wrapping the airfoil in the chordwise plane and an H-type grid extending to the far field, as shown in Figure 3. The boundary layer is resolved with 15 prism layers and a geometric growth ratio of 1.1, yielding a wall-normal that satisfies the low-Reynolds-number requirement of the k- SST model.
Figure 3.
Computational grid for wing.
Localized mesh refinement is applied in two critical regions: the leading edge, to capture the intense suction peak and adverse pressure gradient, and the trailing edge, to enforce the Kutta condition. The grid clustering ratios are 1.1 for the leading edge and 1.05 for the trailing edge.
To ensure the grid independence of the numerical simulation results, three sets of C-H structured grids with the same topology are constructed by adjusting the three-dimensional node count, with the mesh sizes ranging from 13.7 million to 22.7 million elements, as listed in Table 1. The baseline case with a freestream velocity of 15 m/s, an updraft velocity of 3 m/s, and an angle of attack of is adopted as the test condition. The numerical results show that the discrepancy among the three meshes is less than 1%, indicating consistent results. Considering the reasonable computational cost of the first mesh, the mesh with dimensions of is selected for all subsequent calculations.
Table 1.
Grid independence verification.
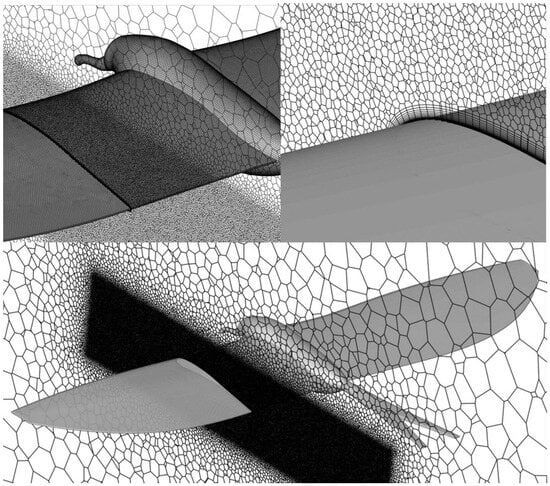
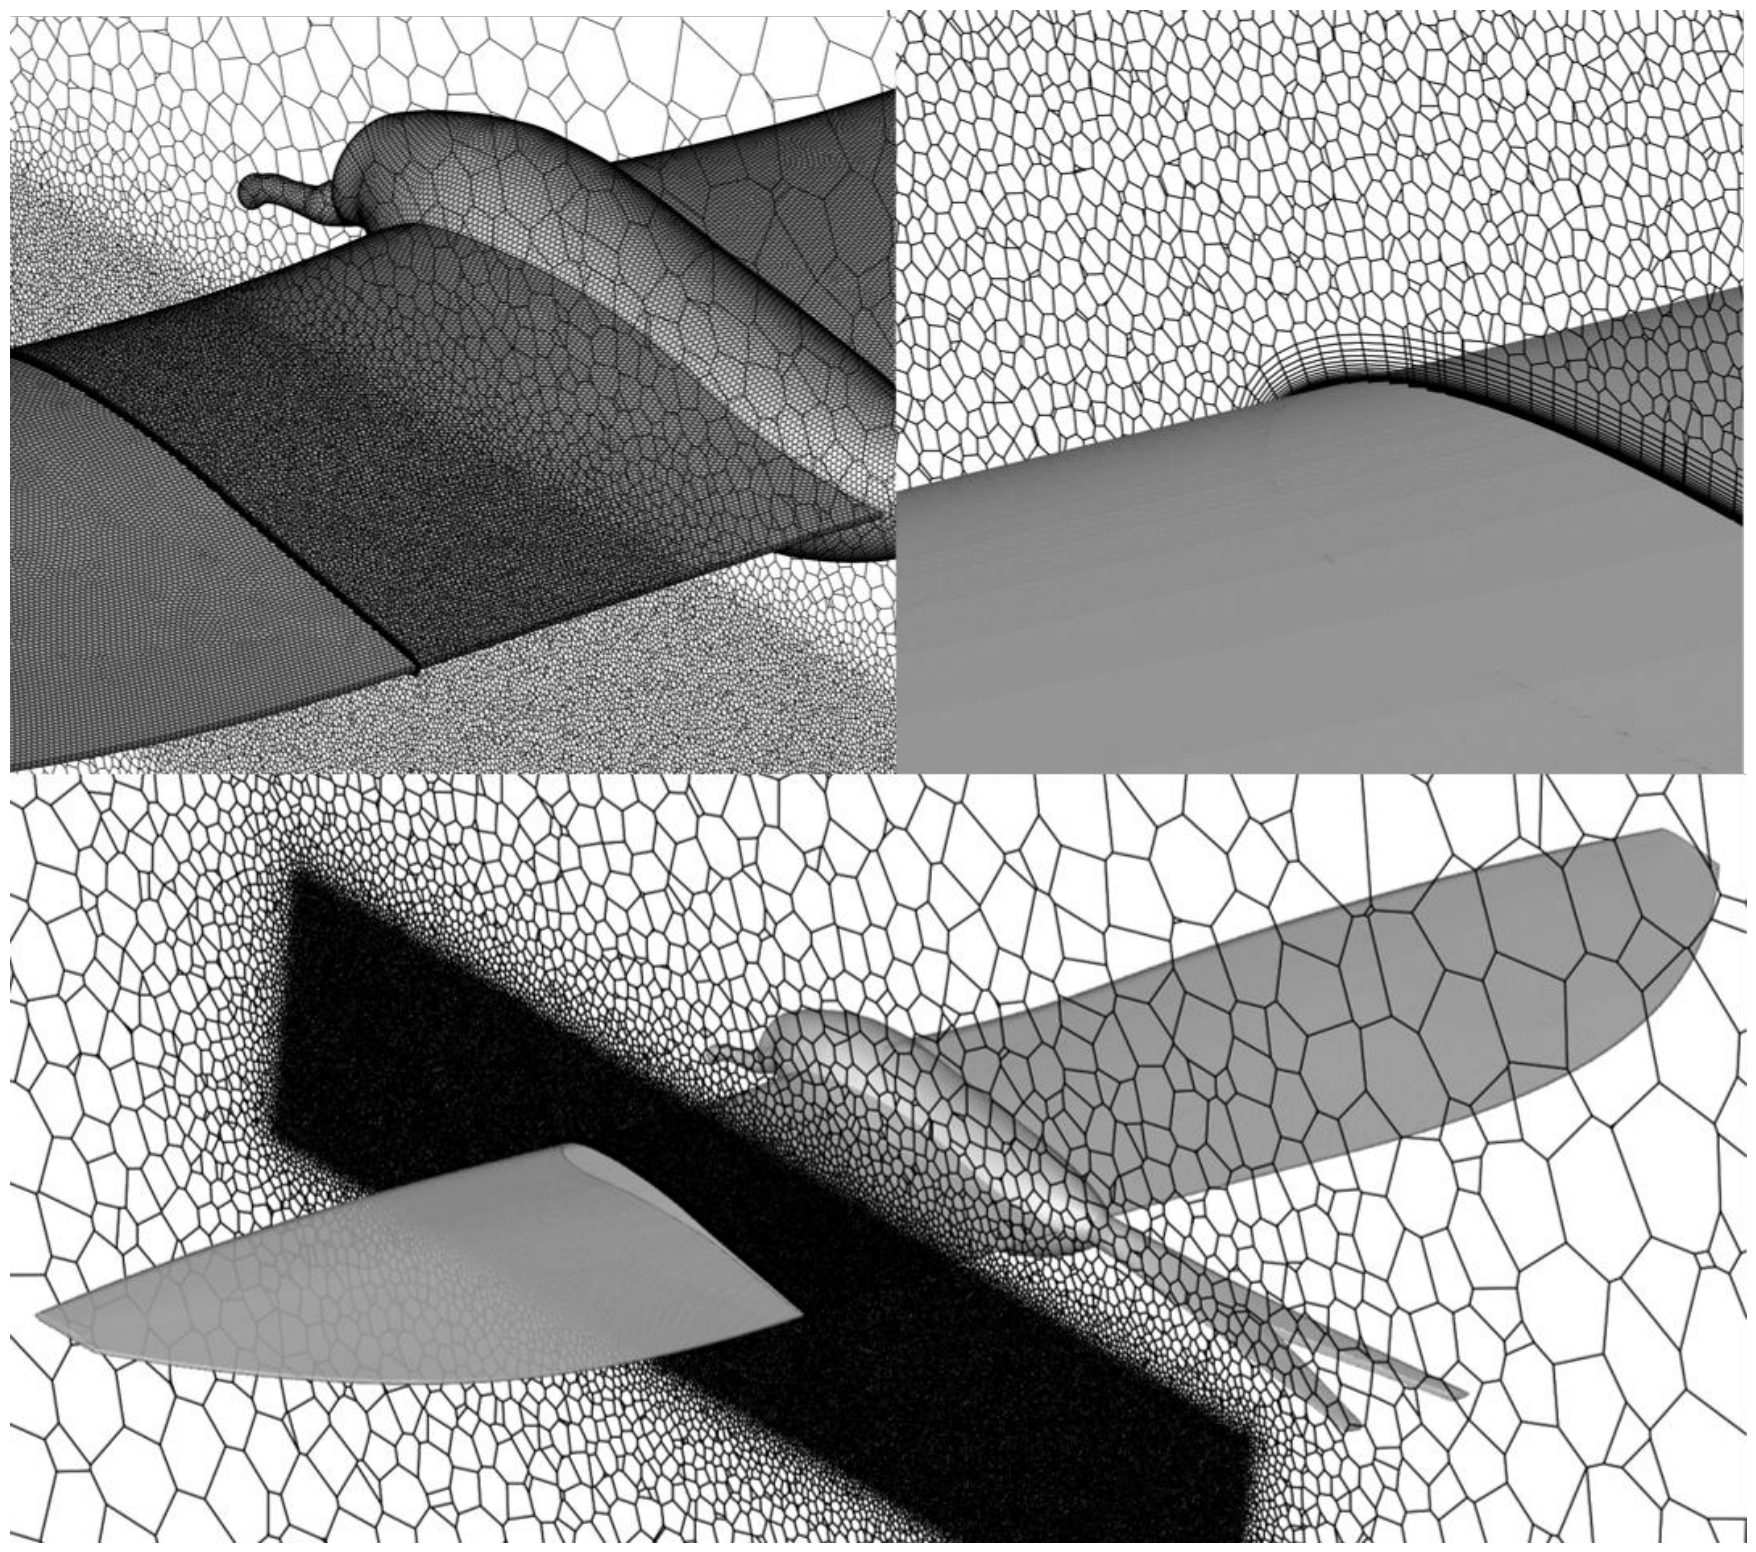
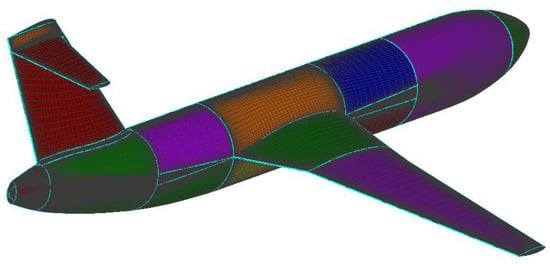
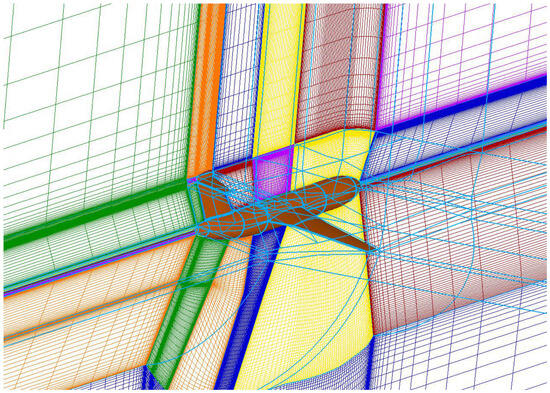
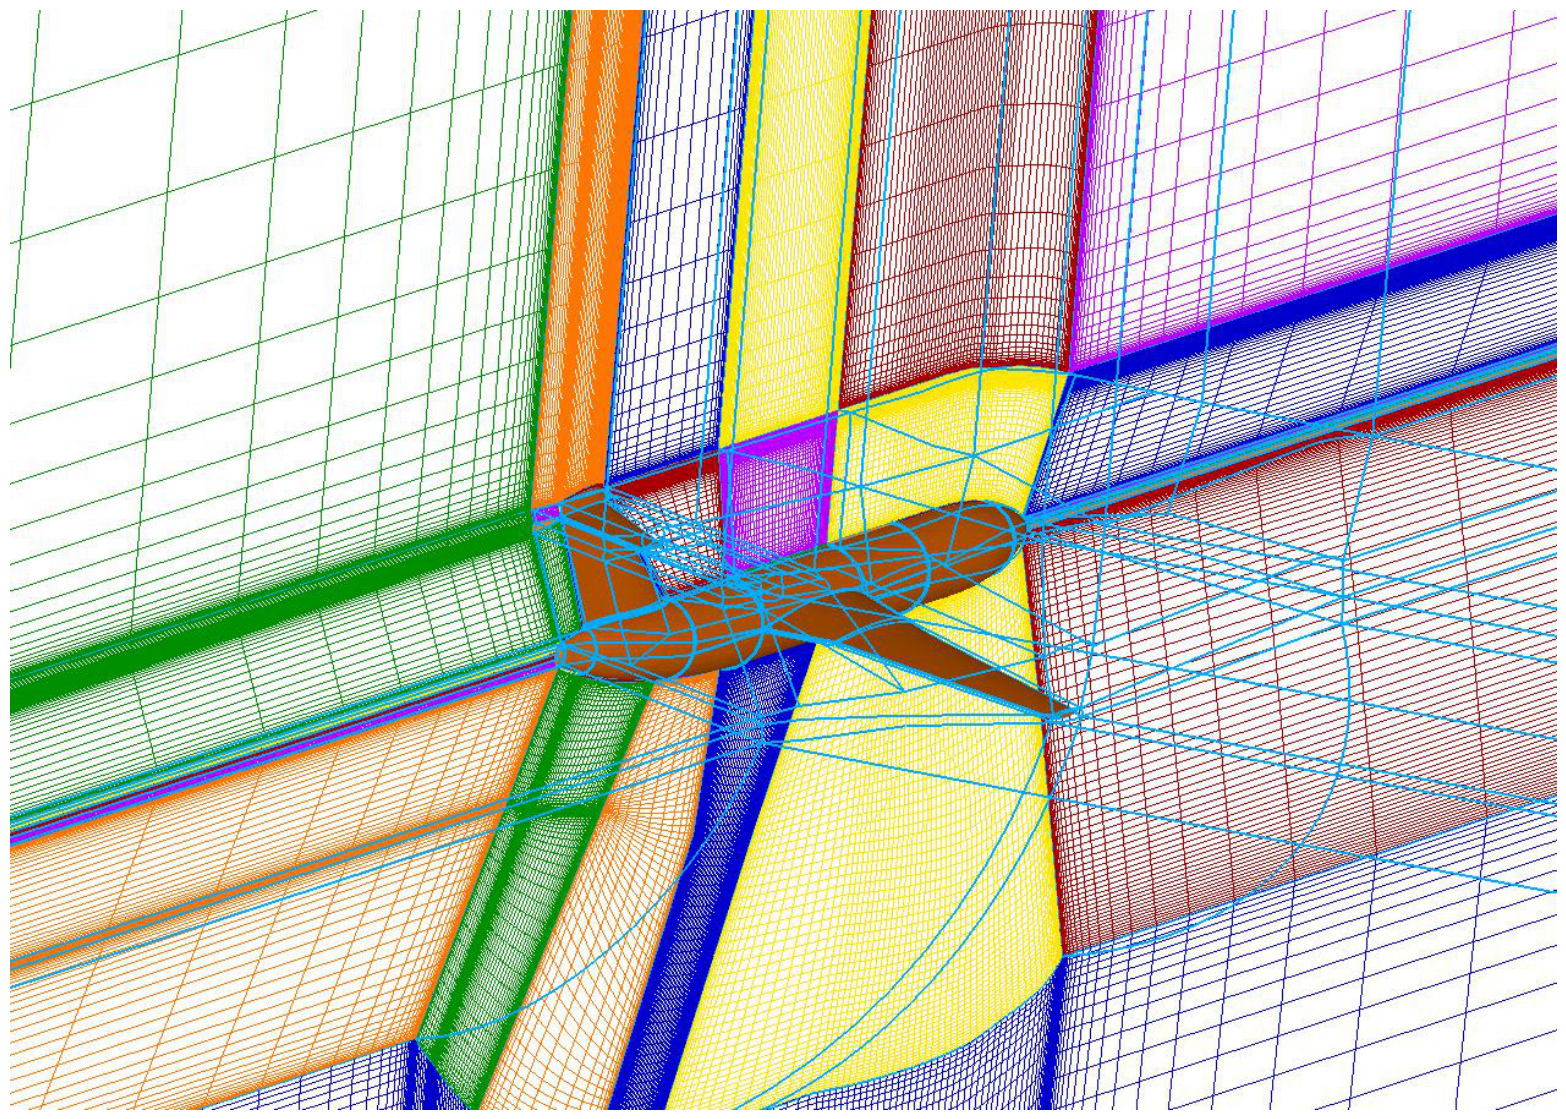
For the fuselage-equipped configuration, an unstructured polyhedral mesh is employed to accommodate the complex geometric features of the bionic fuselage, wing–fuselage junction, and empennage. The polyhedral core is generated using a Cartesian-based volume meshing approach with local refinement, and ten layers of prismatic cells are extruded normal to all wall boundaries to resolve the boundary layer, yielding a wall-normal that satisfies the low-Reynolds-number requirement of the k- SST model. The surface mesh and boundary layer topology of the fuselage-equipped configuration are presented in Figure 4.
Figure 4.
Unstructured polyhedral mesh for the fuselage-equipped configuration.
A grid independence study is also performed for the fuselage-equipped configuration using three unstructured meshes of increasing density, as listed in Table 2. The baseline condition ( m/s, m/s, ) is adopted. The discrepancy in among the three meshes is less than 1%, confirming grid convergence. The medium mesh with approximately 15.16 million cells is selected for all subsequent fuselage-equipped calculations.
Table 2.
Grid independence verification for the fuselage-equipped configuration.
2.5. Validation of the Numerical Method
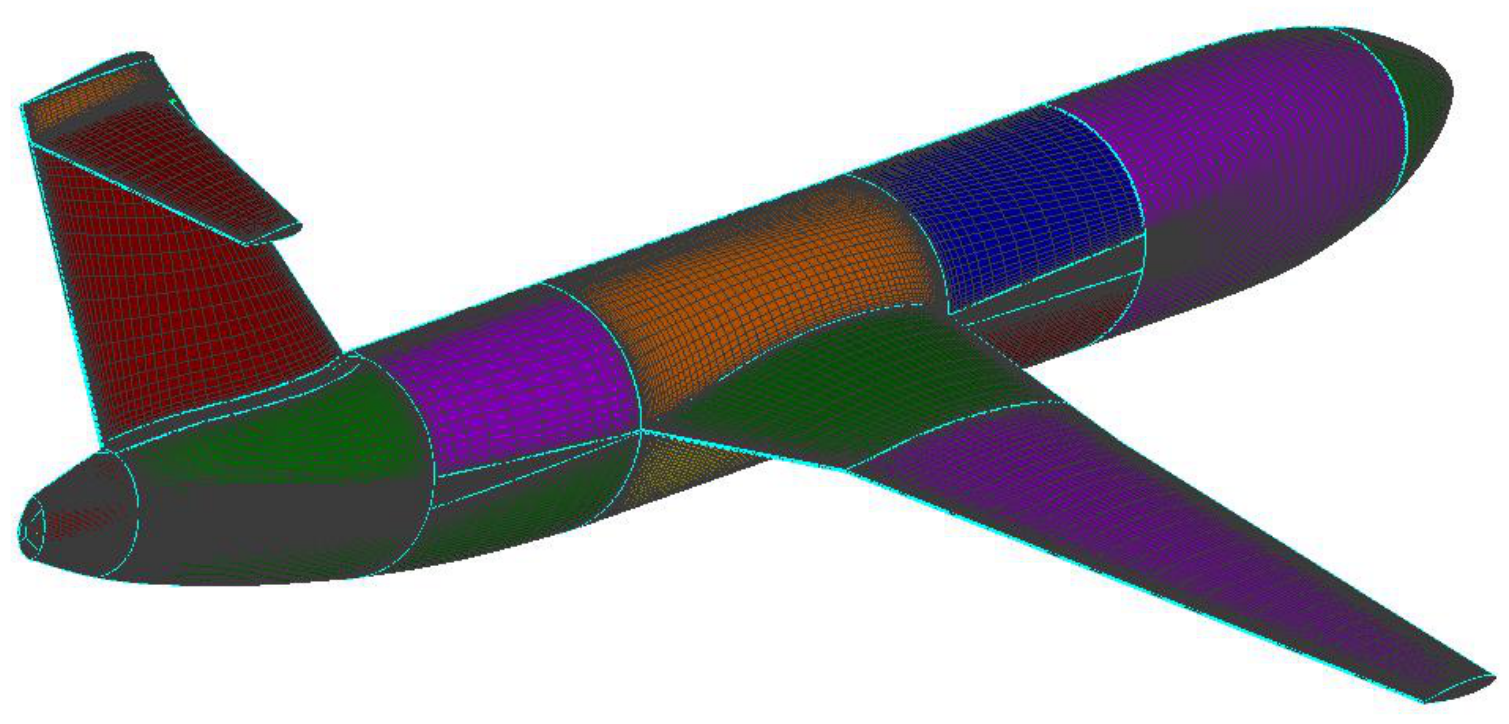
To verify the reliability and accuracy of the numerical methodology employed in this study, a validation case is conducted using the standard Ty154 transport aircraft model. A half-model configuration with a multi-block patched grid is adopted, yielding a total grid count of approximately 7.8 million cells. The surface mesh distribution and the block topology of the computational grid are presented in Figure 5 and Figure 6, respectively.
Figure 5.
Surface mesh distribution of the Ty154 standard model.
Figure 6.
Multi -block grid topology of the Ty154 computational domain.
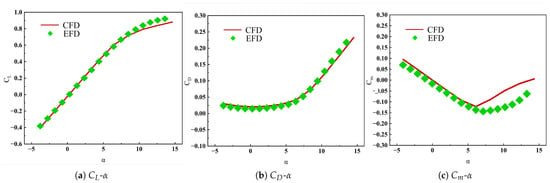
The numerical simulations are performed using the RANS-based k- SST fully turbulent model, identical to that applied to the frigatebird-inspired wing. The computational model dimensions are kept consistent with the experimental wind-tunnel model, and the Reynolds number is matched to the experimental value. The validation is carried out at a freestream Mach number of over an angle-of-attack range of to .
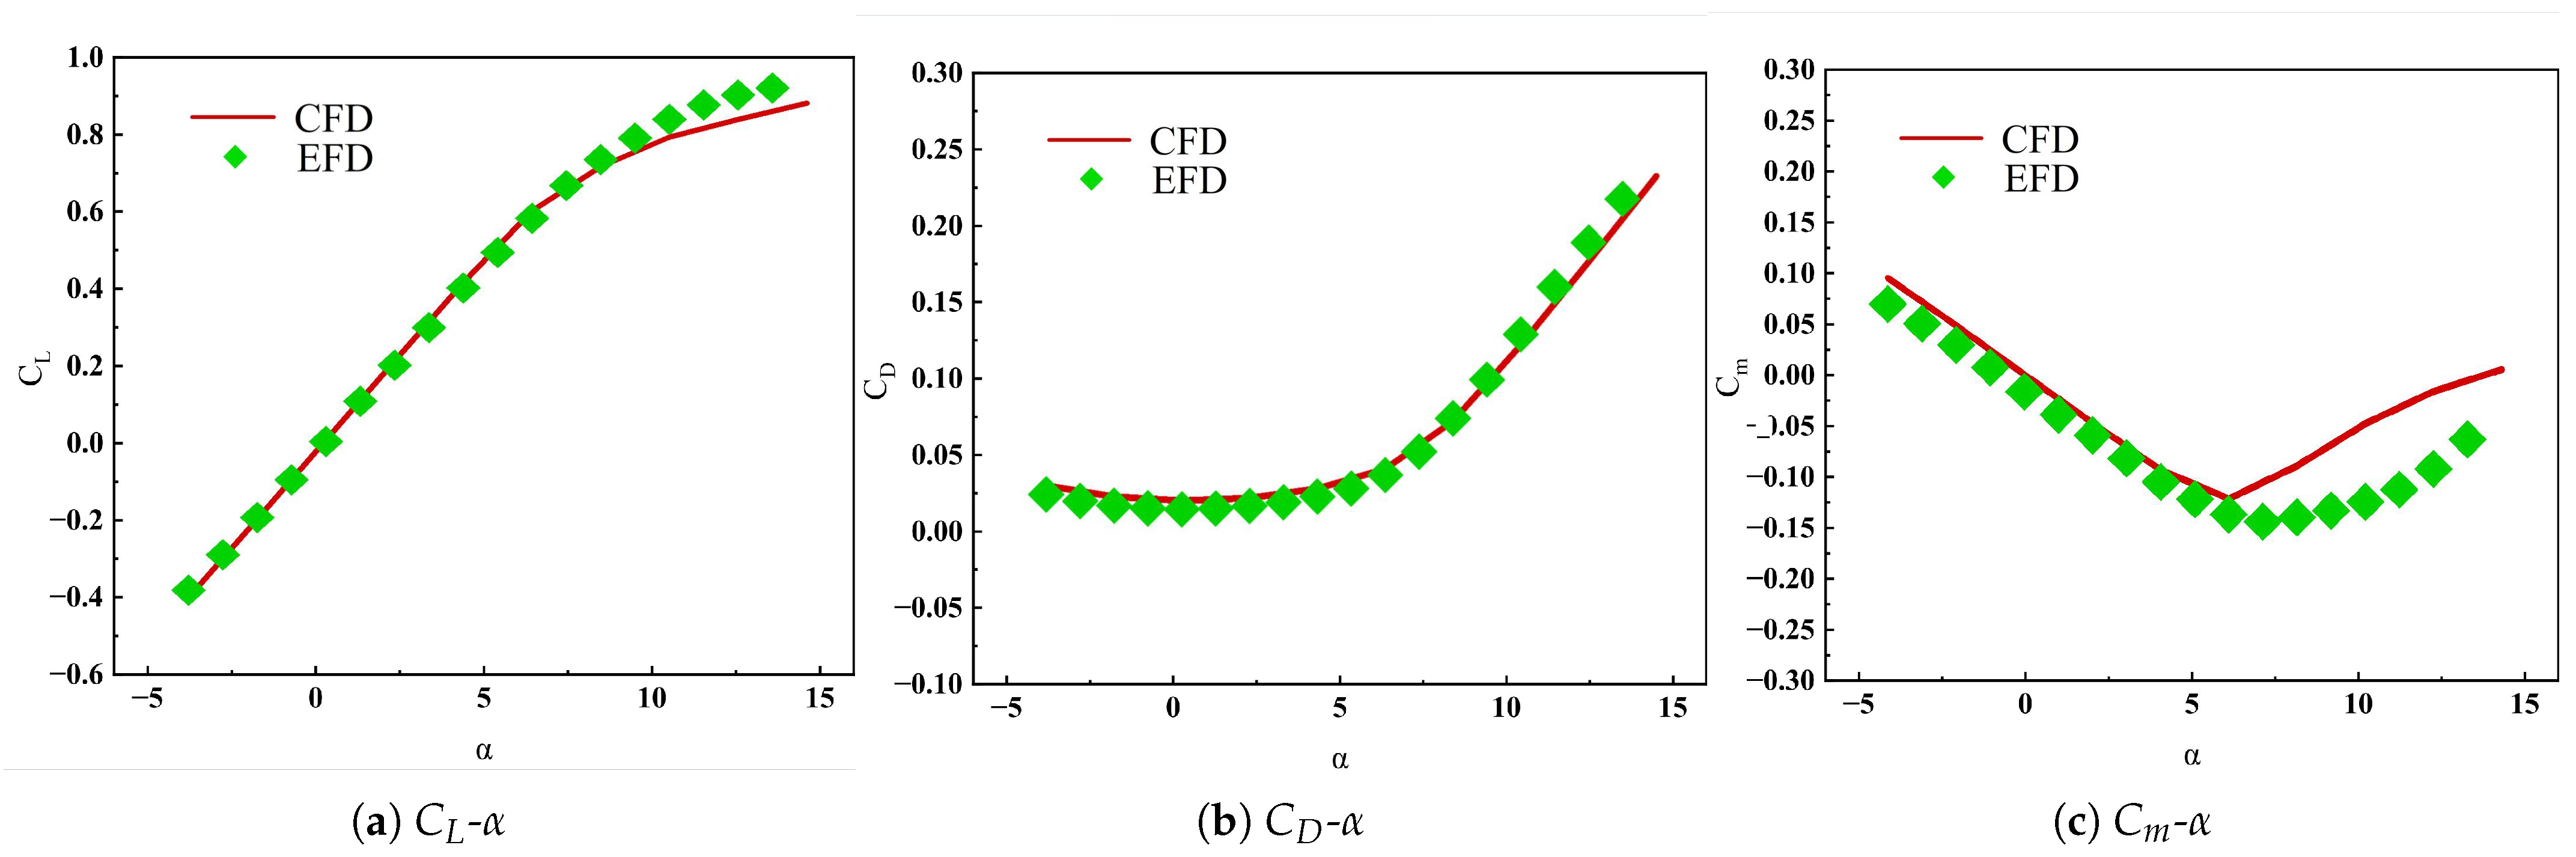
A comparison between the experimental flight data (EFD) and the computational fluid dynamics (CFD) results at is presented in Figure 7. The drag coefficient curves show consistent trends between EFD and CFD across the investigated angle-of-attack range, with the CFD predictions slightly overpredicting the drag magnitude. The overall agreement demonstrates that the present numerical methodology is capable of accurately capturing the aerodynamic characteristics of three-dimensional lifting configurations, thereby providing a credible basis for the subsequent aerodynamic analysis of the frigatebird-inspired wing.
Figure 7.
Comparison of the drag coefficient between EFD and CFD for the Ty154 model at .
3. Results and Analysis
3.1. The Impact of Updraft on the Aerodynamic Properties of Biomimetic Wings
3.1.1. Influence of Pitch Angle on Aerodynamic Characteristics
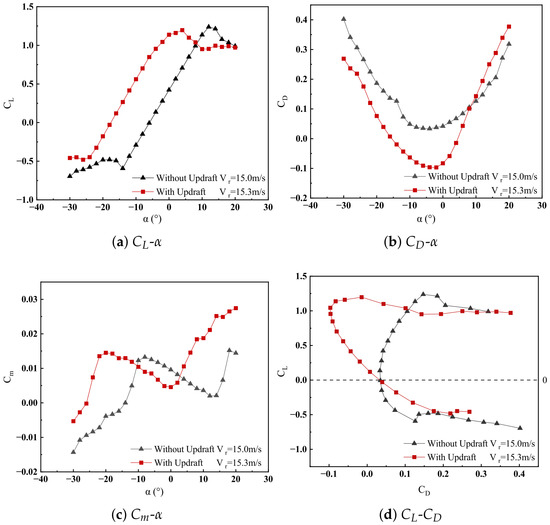
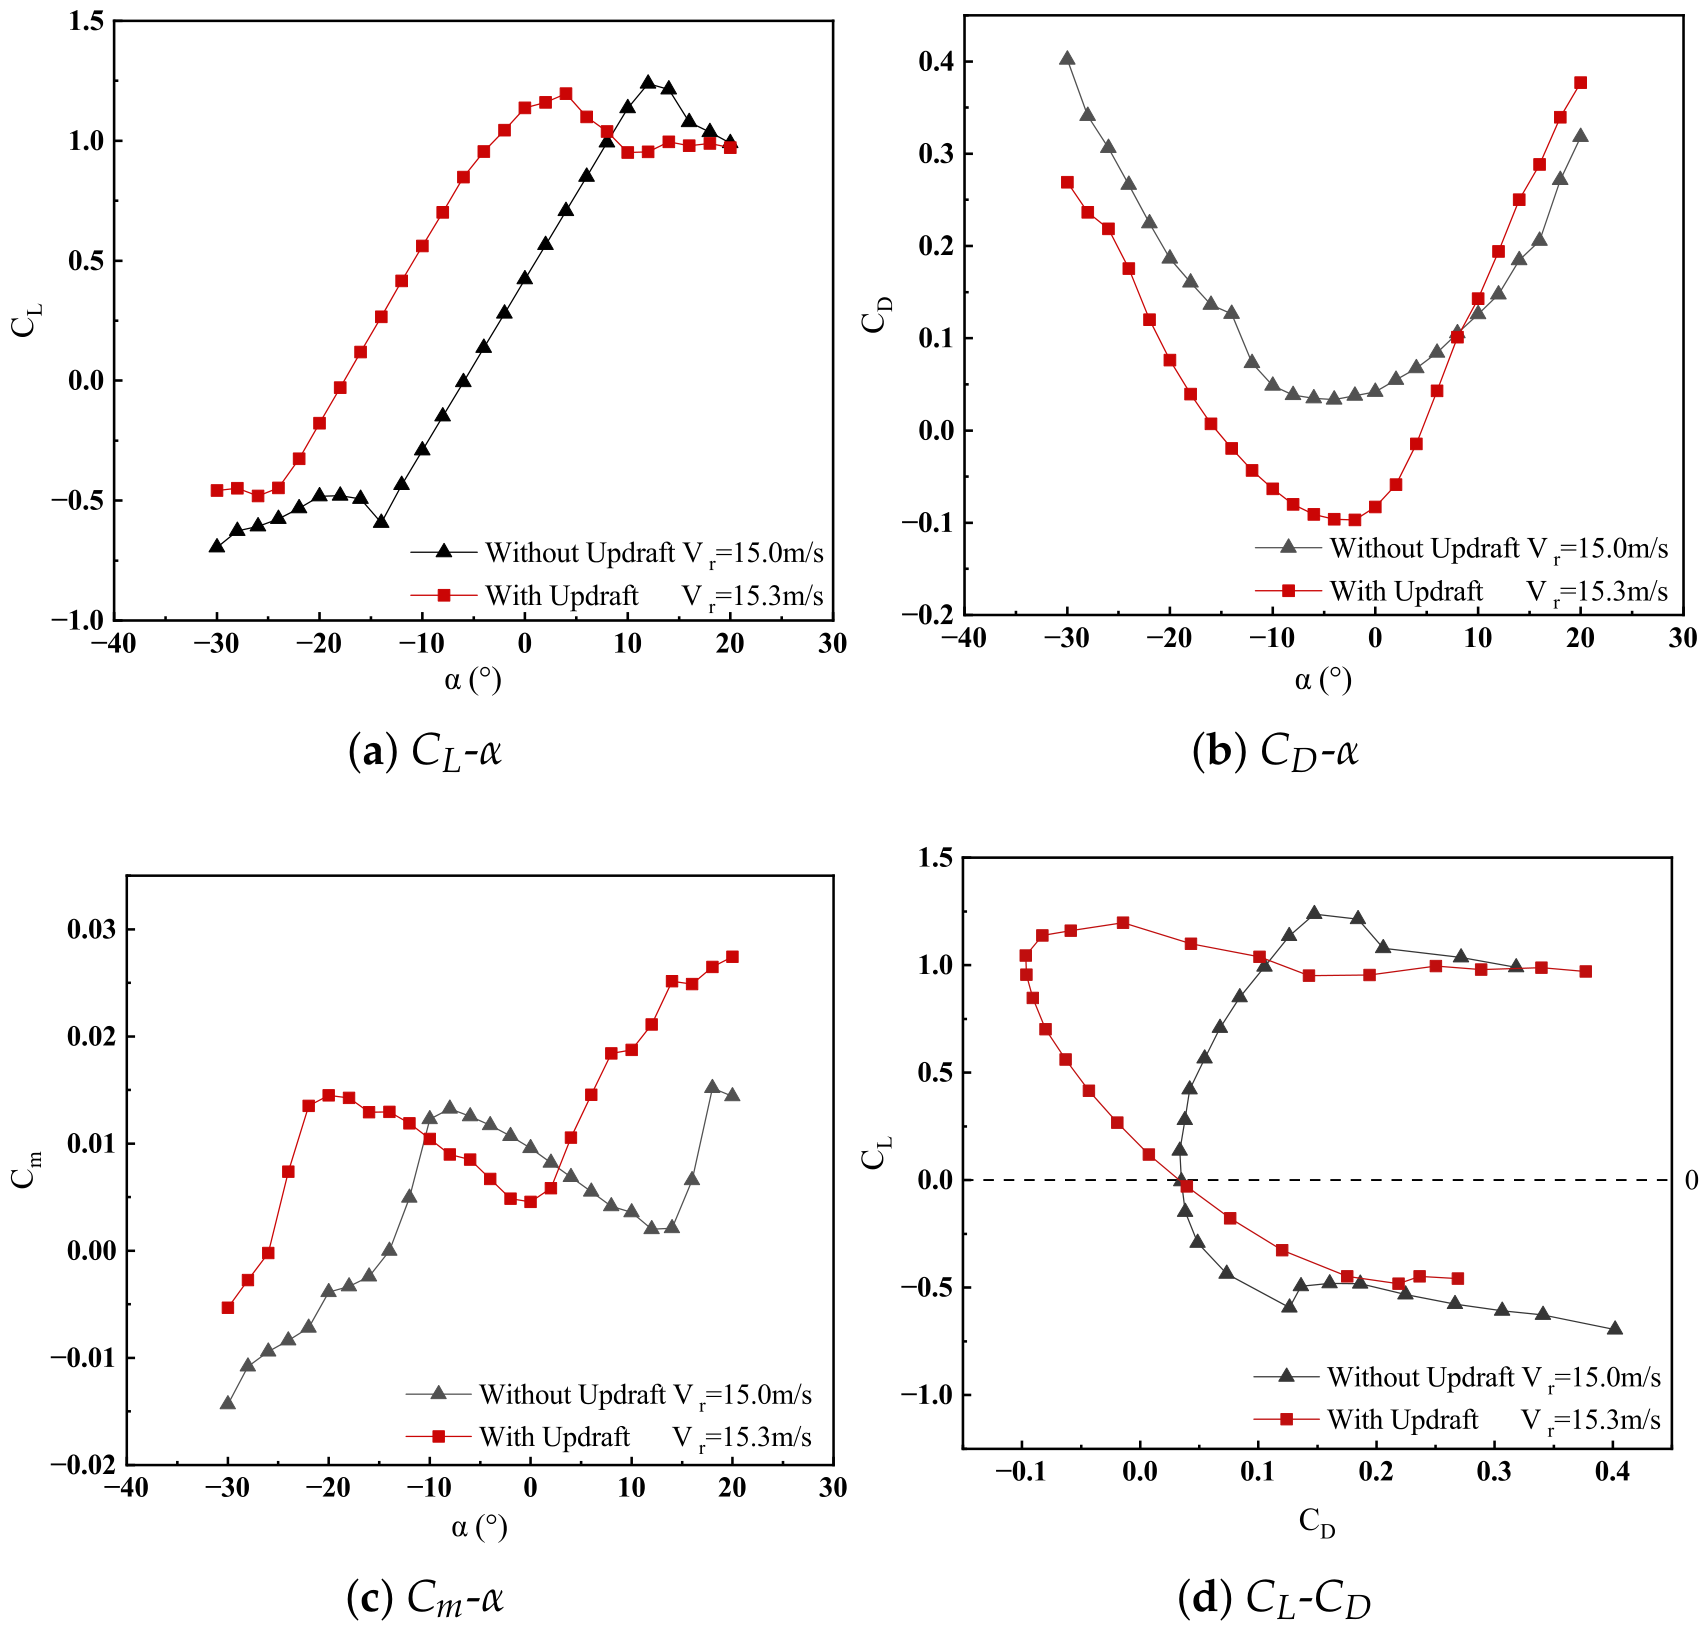
Figure 8 presents the distribution characteristics of lift coefficient, drag coefficient, and pitching moment of the bio-inspired seabird wing at pitch angles ranging from to with and without updrafts, where denotes the resultant velocity acting on the wing. The results indicate that the influence of updrafts on the aerodynamic characteristics of the wing exhibits significant pitch angle dependence, and distinct patterns are observed in different attitude intervals.
Figure 8.
Variation in Aerodynamic Coefficients of Bionic Wings with Respect to Pitch Angle.
The findings indicate that updrafts exert a relatively minor impact on the profiles of the lift curve – and pitching moment curve –, yet they significantly influence the drag curve – and polar curve –. In the absence of updrafts, the lift coefficient exhibits a linear increase with the angle of attack within the range of , and stall occurs when exceeds , with a lift curve slope of 0.0714. In the presence of updrafts, the lift coefficient increases linearly within the range of , rises nonlinearly between , and stall is observed when surpasses . The slope of the linear segment of the lift curve is 0.0838, representing a 17.4% increase compared to the scenario without updrafts. The updraft shifts the linear increase range of the lift coefficient from to , expanding the interval from to , an increment of . It is evident that within the large negative angle of attack range, updrafts substantially diminish the negative lift of the wing and enhance flight stability during diving maneuvers.
Furthermore, updrafts effectively broaden the stable high-lift range of the wing, delay the stall angle of attack, mitigate lift degradation post-stall, and significantly enhance the aerodynamic performance of the wing during low-speed circling and gliding. Meanwhile, under the influence of updrafts, the drag coefficient of the same wing is notably reduced within the low-to-moderate angle of attack range of . At , the drag reduction reaches 0.1346, corresponding to a reduction amplitude of 309% relative to the drag coefficient without updrafts at the same angle of attack. The minimum drag range is approximately to in the absence of updrafts. Although the minimum drag range narrows when updrafts are considered, it is noteworthy that the drag coefficients within this range are all lower than those in the no-updraft scenario, and a thrust effect occurs at certain angles of attack. This suggests that updrafts can significantly optimize the incoming flow angle of attack and broaden the optimal gliding angle of attack range of the wing. The two drag curves intersect at . Beyond this intersection, the drag coefficient under updraft conditions is consistently higher than that under no-updraft conditions. However, when combined with the lift curve, it can be determined that the wing has already stalled under updraft conditions at this point. Therefore, it can be concluded that updrafts contribute to comprehensive drag reduction within the typical cruising and circling angles of attack, thereby enhancing gliding efficiency.
The variation characteristics of the pitching moment are more pronounced. Within the large negative angle of attack range of to , the wing exhibits a significant nose-down negative moment in the absence of updrafts, indicating a pronounced diving and descending tendency. After introducing updrafts, the pitching moment is elevated overall, significantly attenuating the excessive nose-down effect and effectively improving flight stability during diving gliding. The two pitching-moment curves intersect at , where the moment difference vanishes and the moment changes gently. The zero-pitching-moment trim angle of attack shifts to the left, enabling the wing to achieve attitude balance at a smaller negative angle of attack. The flow attachment state is favorable, and the longitudinal stability characteristics are smooth. Under the conventional circling and cruising angles of attack of to , the difference in pitching moment between the two working conditions is minimal, the attitude trim law is stable, and no obvious attitude oscillation occurs. When exceeds and enters the high angle of attack range, the moment changes moderately under the no-updraft condition, and the wing maintains longitudinal static stability throughout. In contrast, under the updraft condition, the pitching moment rises continuously and rapidly, and the slope of the curve changes from negative to positive. The longitudinal static stability of the wing decreases significantly, the nose-up divergence tendency is enhanced, which easily exacerbates flow separation over the wing surface and accelerates the wing stall process. Overall, updrafts optimize the aerodynamic characteristics of low-altitude diving but deteriorate the pitching stability at high angles of attack, which aligns with the aerodynamic variation law observed in birds circling and gliding with the aid of thermal updrafts.
3.1.2. Aerodynamic Characteristics Under Coupled Pitch–Yaw Attitudes
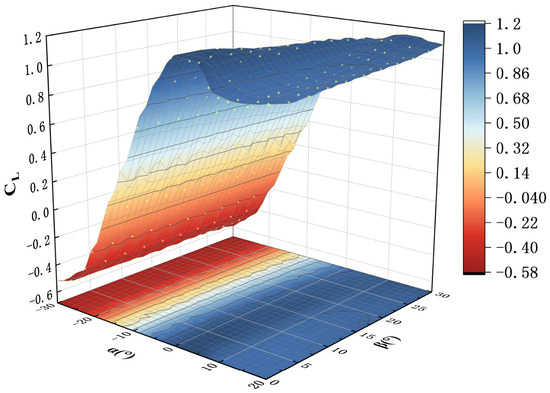
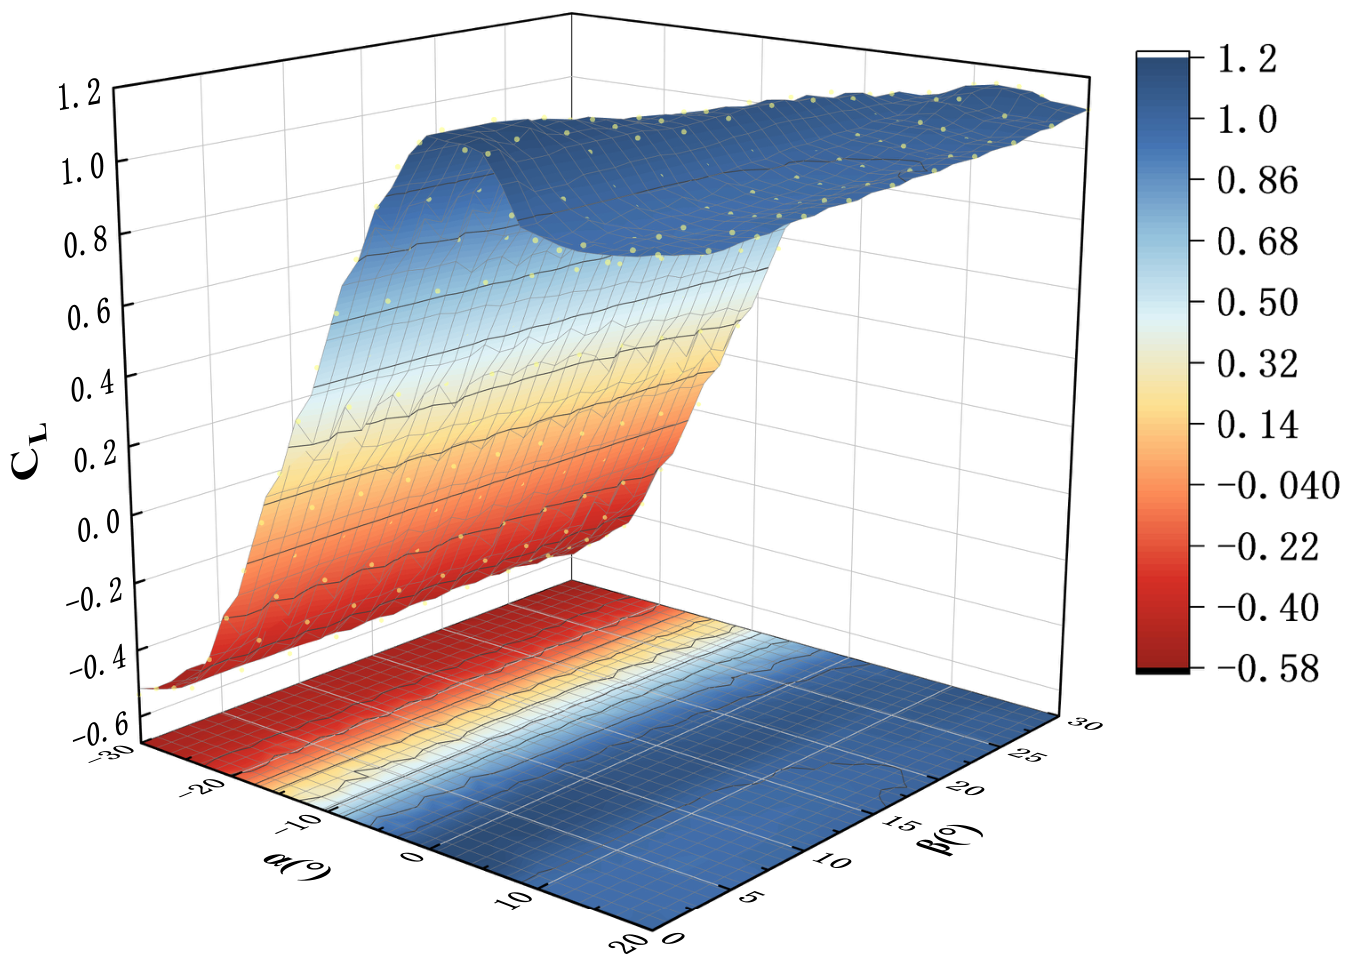
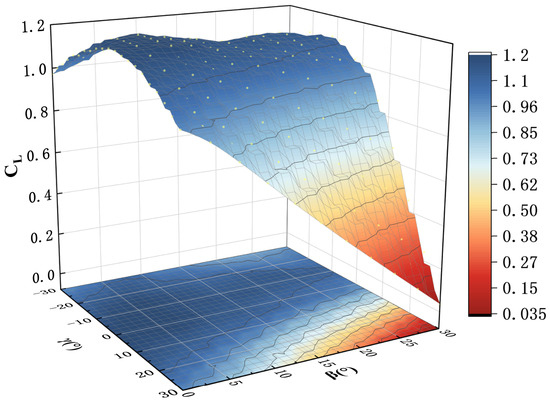
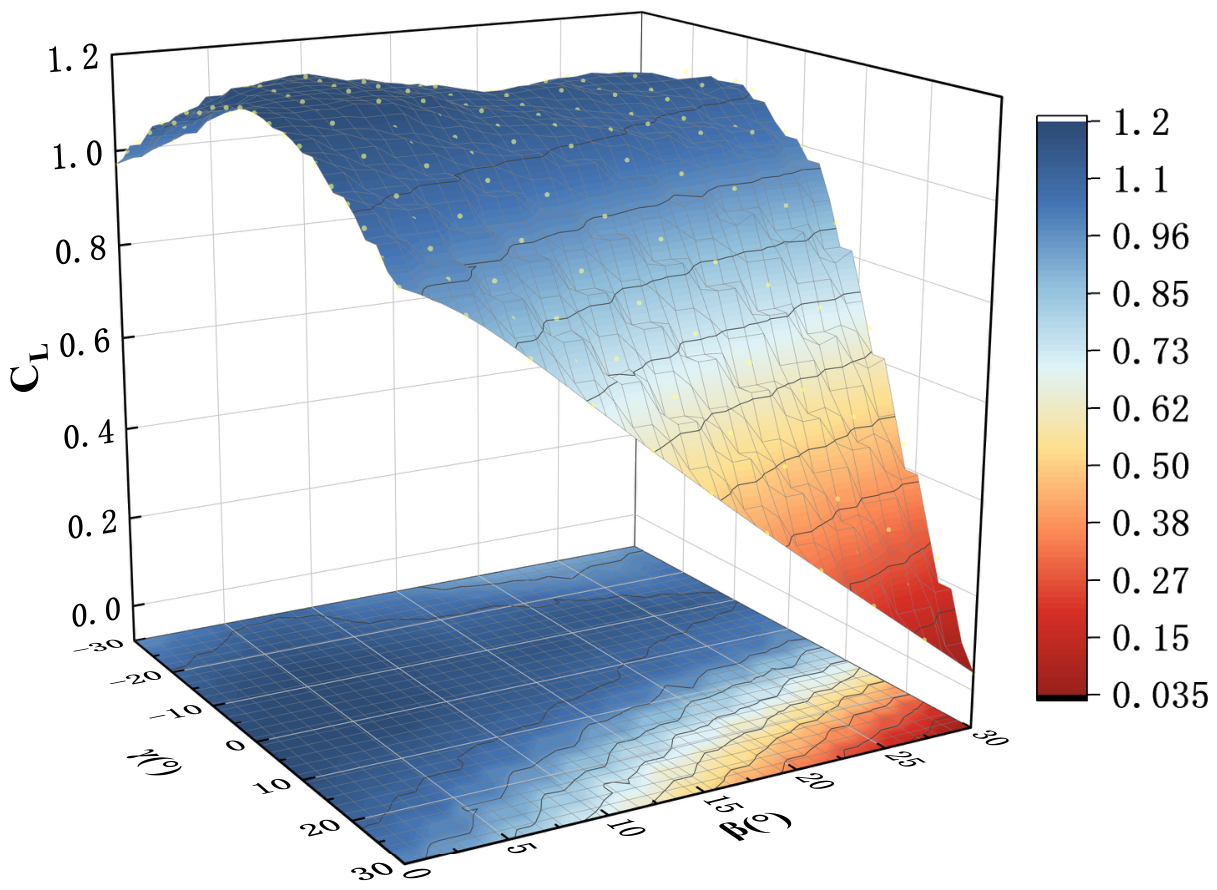
The coupled variation in the lift coefficient with pitch angle and sideslip angle is presented as a three-dimensional response surface in Figure 9, covering the full attitude space and . The overall topography of the surface exhibits a strongly nonlinear, monotonically increasing trend along the pitch axis, with a comparatively mild variation along the sideslip axis.
Figure 9.
Variation in the lift coefficients of bionic airfoils under updraft conditions with respect to pitch angle and yaw angle .
The global minimum lift coefficient is , attained at the extreme coupled attitude and , whereas the global maximum occurs at and . At zero sideslip, the lift coefficient at is . As increases from toward , rises steeply and nearly linearly, crossing the zero-lift threshold at approximately and entering the positive-lift regime. Within this linear ascent region ( to ), the lift curve slope is per degree ( per radian) at , and this slope decreases monotonically with increasing sideslip—reaching per degree ( per radian) at —representing a reduction across the full sideslip range. The zero-lift angle itself shifts modestly from at to at , a migration of approximately toward positive pitch.
Beyond , the surface transitions into a pronounced nonlinear plateau region. At , the peak lift coefficient is attained at . As increases, the peak lift coefficient decreases moderately and the pitch angle at which it is attained shifts progressively downstream: at for –, and – at for –. This downstream migration of the peak-lift locus with increasing sideslip is visible as the ridge line of the high- region tilting toward larger along the axis. Following the peak, the lift coefficient maintains a broad high plateau across , without exhibiting an abrupt collapse. The post-stall plateau elevation increases monotonically with sideslip: the mean over – rises from at to at , an enhancement of approximately .
The sideslip-axis cross-sections of the response surface reveal an AoA-dependent sign reversal in the lift–sideslip coupling. In the negative and moderately positive pitch regime (), increasing reduces , with the perturbation reaching per degree at (from at to at ). In contrast, within the high-lift post-stall plateau (), the sideslip perturbation becomes positive: per degree at (from to ) and per degree at (from to ). The crossover between these two coupling regimes occurs within , where transitions from per degree at to per degree at , coinciding with the transition from the near-peak lift region to the fully developed post-stall plateau.
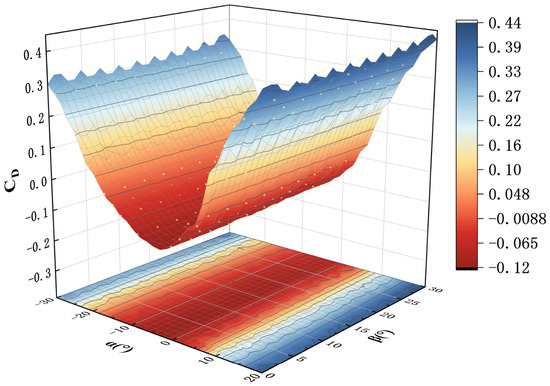
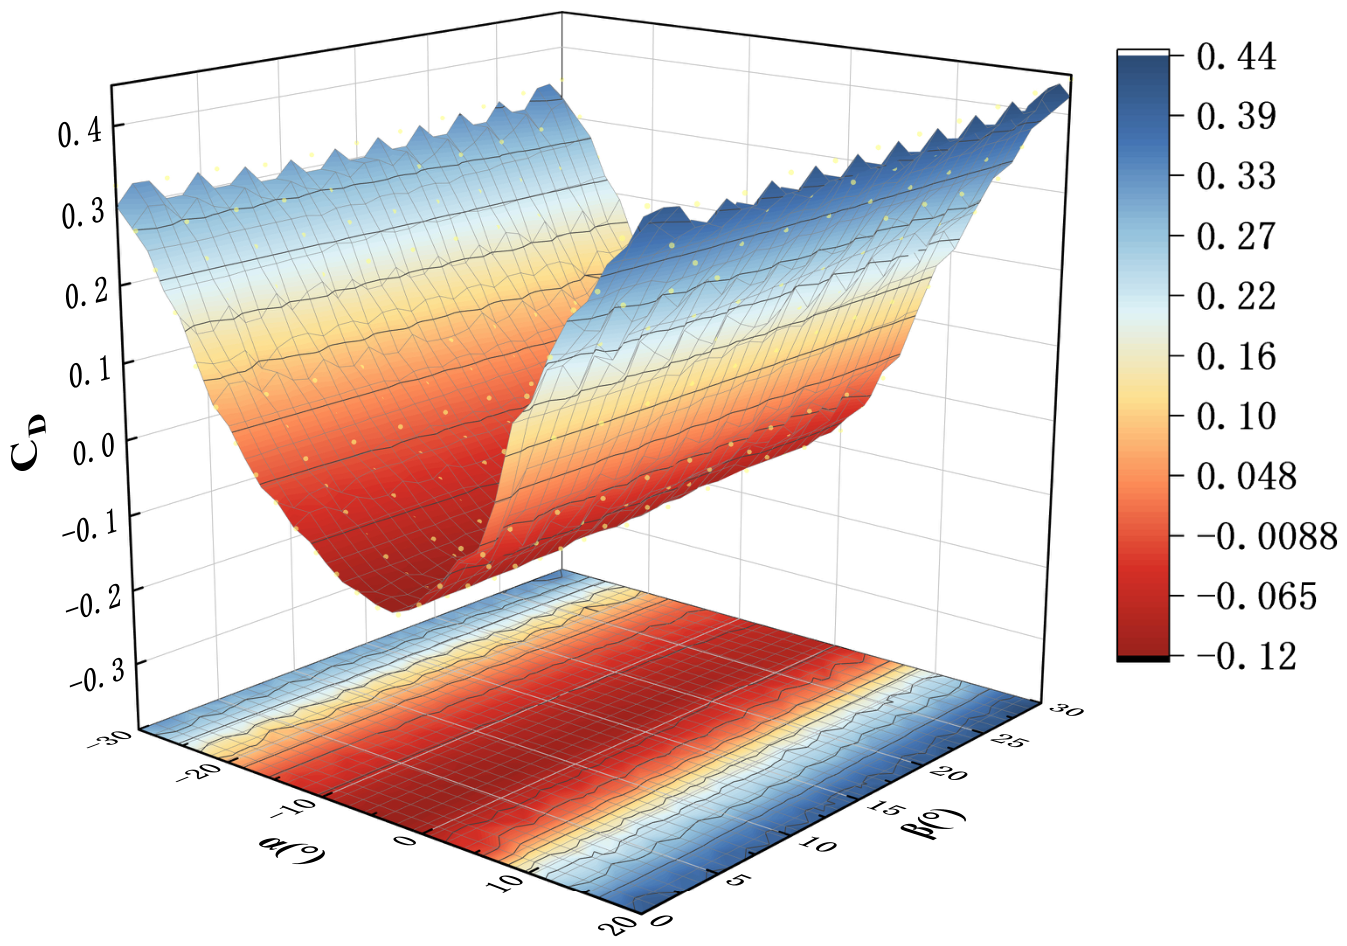
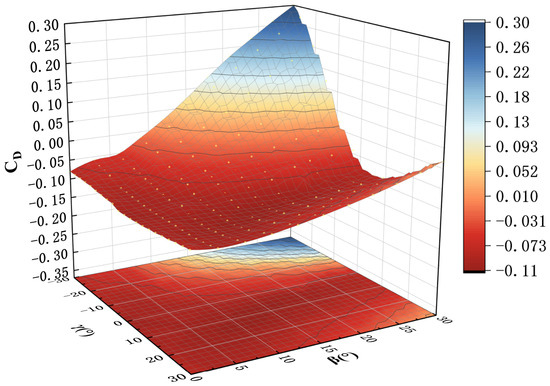
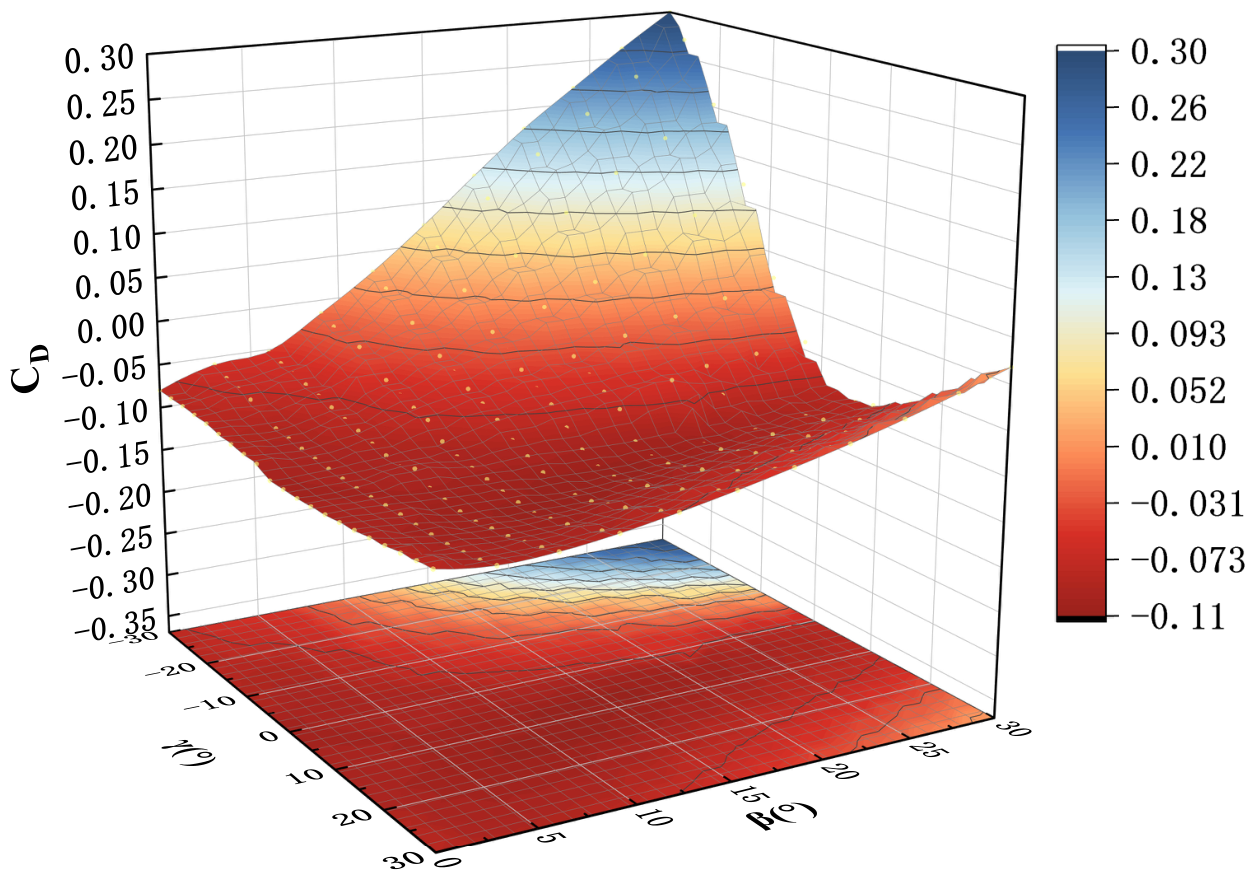
A particularly notable feature of the drag polar is the emergence of negative drag coefficients across a wide range of angles of attack. As shown in Figure 10, the drag coefficient remains negative for to , reaching a minimum value of at . In this study, the wing maintains a rigid, non-flapping configuration, mimicking the gliding–soaring state of frigatebirds; the coupled pitch and yaw angles represent the static wing attitude of a frigatebird during unpowered climbing in an external updraft. The negative drag therefore arises from the incoming updraft flow rather than from any wing kinematic motion. Physically, the updraft introduces an additional vertical velocity component to the oncoming free-stream. When this updraft velocity is treated as a flow perturbation superimposed on the baseline horizontal flight velocity, the effective local inflow angle is significantly altered. Under specific coupled pitch and yaw attitudes, the streamwise projection of the aerodynamic force reverses direction, yielding a negative drag value—an apparent thrust-like signature. Outside this regime, the drag coefficient follows a conventional growth pattern, increasing from at to at .
Figure 10.
Variation in the drag coefficients of bionic airfoils under updraft conditions with respect to pitch angle and yaw angle .
Within the positive-drag regime ( or ), the aerodynamic efficiency peaks at approximately , where with a corresponding lift coefficient of . Beyond , the lift-to-drag ratio decreases monotonically, falling to at and at . Exceptionally high values appearing in the vicinity of zero-drag conditions (e.g., at , ) are numerical singularities arising from division by near-zero drag coefficients and carry no practical engineering significance.
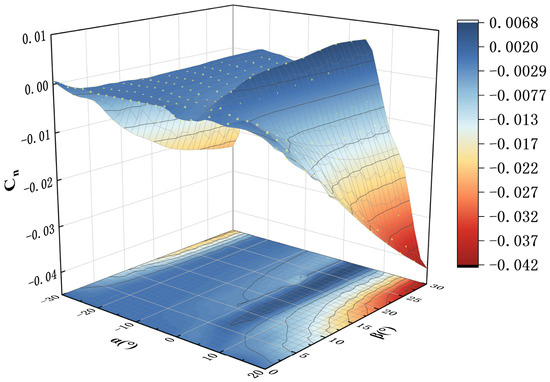
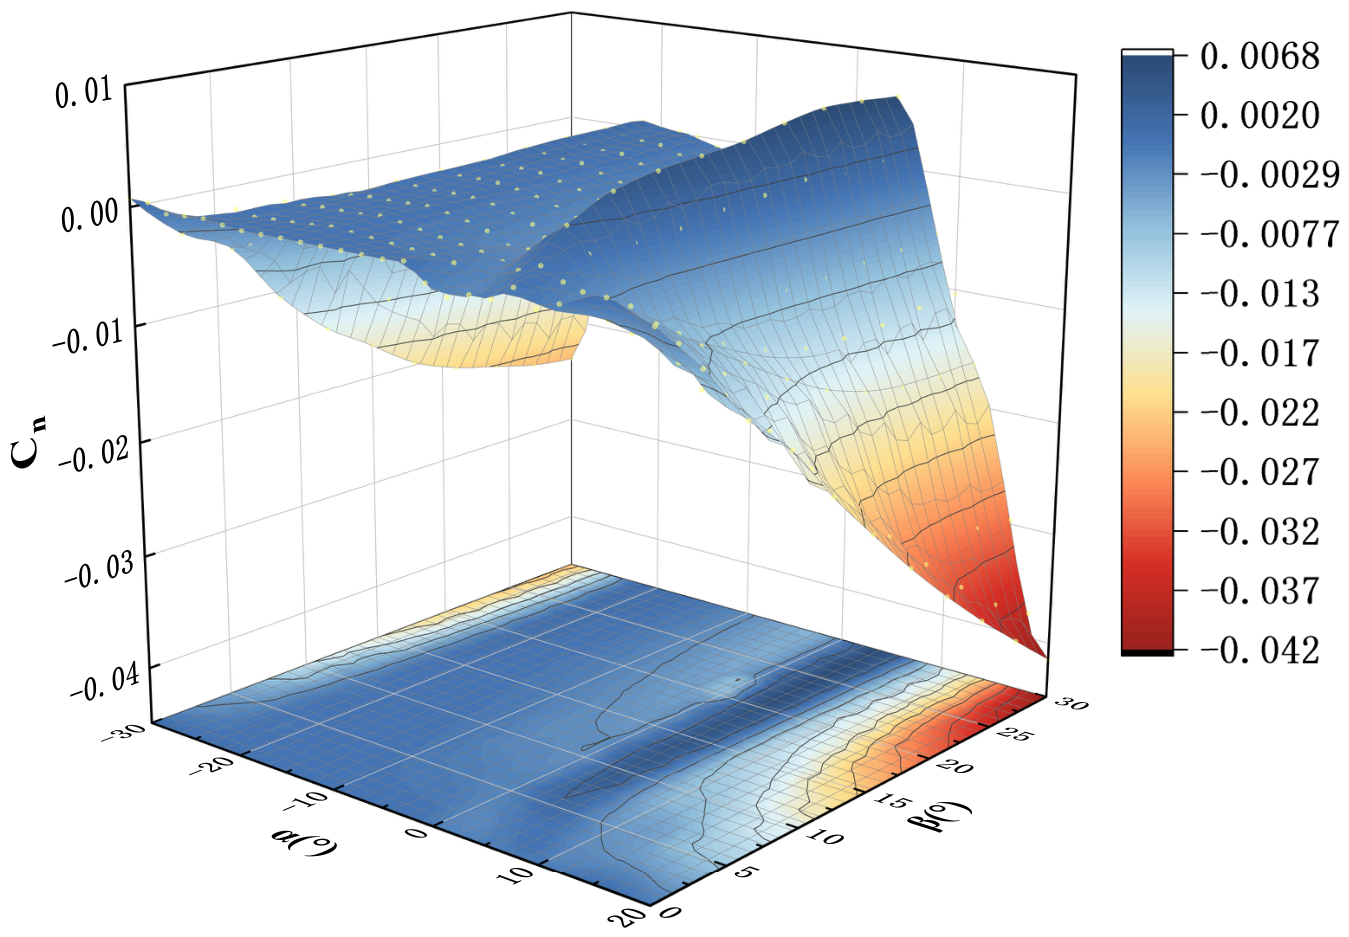
The directional static stability derivative is presented in Figure 11. is negative over most of the flight envelope, indicating stable directional (weathercock) behavior. Two distinct intervals of directional instability are identified: (i) the deep negative-lift regime ( to ), and (ii) the initial post-stall regime ( to ). The latter interval coincides with the onset of stall, where the lift coefficient begins to descend from its peak value of at . It is noteworthy that directional stability is recovered beyond , despite the wing remaining in the fully developed post-stall regime ( plateauing at – for –). At positive angles of attack beyond , the magnitude of increases substantially with AoA, from per degree at to per degree at , which represents an approximately fourfold enhancement in directional restoring capability within the post-stall regime.
Figure 11.
Yaw moment coefficient versus pitch angle and yaw angle under updraft conditions.
The influence of sideslip angle on the drag and yawing moment coefficients exhibits clear AoA-dependent coupling behavior. At positive angles of attack ( and ), increasing sideslip from to produces a modest increase in lift coefficient—from to at , and from to at . Conversely, at negative AoA (), the lift coefficient decreases from to with increasing sideslip. The drag coefficient shows relatively mild sensitivity to sideslip: in the positive-drag regime, a sideslip increases drag by approximately at (from to ). At certain angles of attack, the drag coefficient of the windward wing is lower than that of the leeward wing; driven by this differential drag, the yawing moment coefficient grows monotonically in the negative (restoring) direction with increasing sideslip angle across all representative AoAs, reaching a maximum magnitude of at and .
3.1.3. Influence Laws of Aerodynamic Characteristics Under Coupled Yaw and Roll Angles
The three-dimensional response surface of the lift coefficient as a function of sideslip angle and roll angle is presented in Figure 12. At zero sideslip (), reaches its maximum of 1.190 at and decreases symmetrically toward both roll extremes, attaining 0.972 at and 0.983 at . The global minimum is at , , indicating near-complete lift annihilation under the combined extreme condition. Within the linear roll range , the gradient is per degree at and transitions to negative values for , reaching per degree at . The most striking feature is the progressive breakdown of roll symmetry with increasing sideslip: at , the windward panel at maintains while the leeward panel at collapses to 0.408, yielding an inter-wing differential ; this widens to 0.769 at . At , by contrast, the same roll-angle pair yields a merely , confirming that the lift asymmetry is essentially sideslip-induced rather than an intrinsic consequence of roll attitude.
Figure 12.
Lift coefficient versus yaw angle and roll angle under updraft conditions.
The drag coefficient response surface (Figure 13) exhibits a similarly strong asymmetry. At , remains negative across the entire roll range, varying from at to near and returning to at ; the global extrema are at , and at , . Increasing sideslip drives a sharply asymmetric drag rise along the roll axis: per degree at and at , versus only at and at . Consequently, the positive-drag region is confined to the negative-roll, high-sideslip quadrant. At , the windward panel at exhibits whereas the leeward panel at retains , giving . This inter-wing drag differential, acting through the half-span moment arm, contributes materially to the rolling moment alongside the lift differential.
Figure 13.
Drag coefficient versus yaw angle and roll angle under updraft conditions.
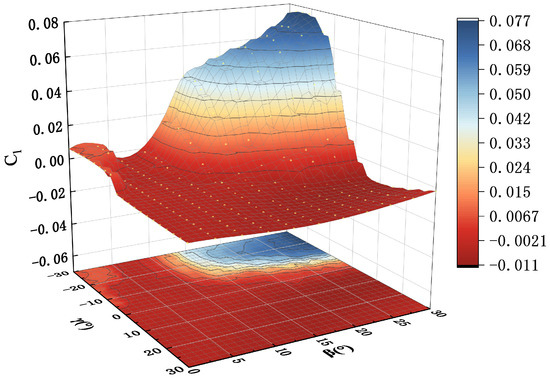
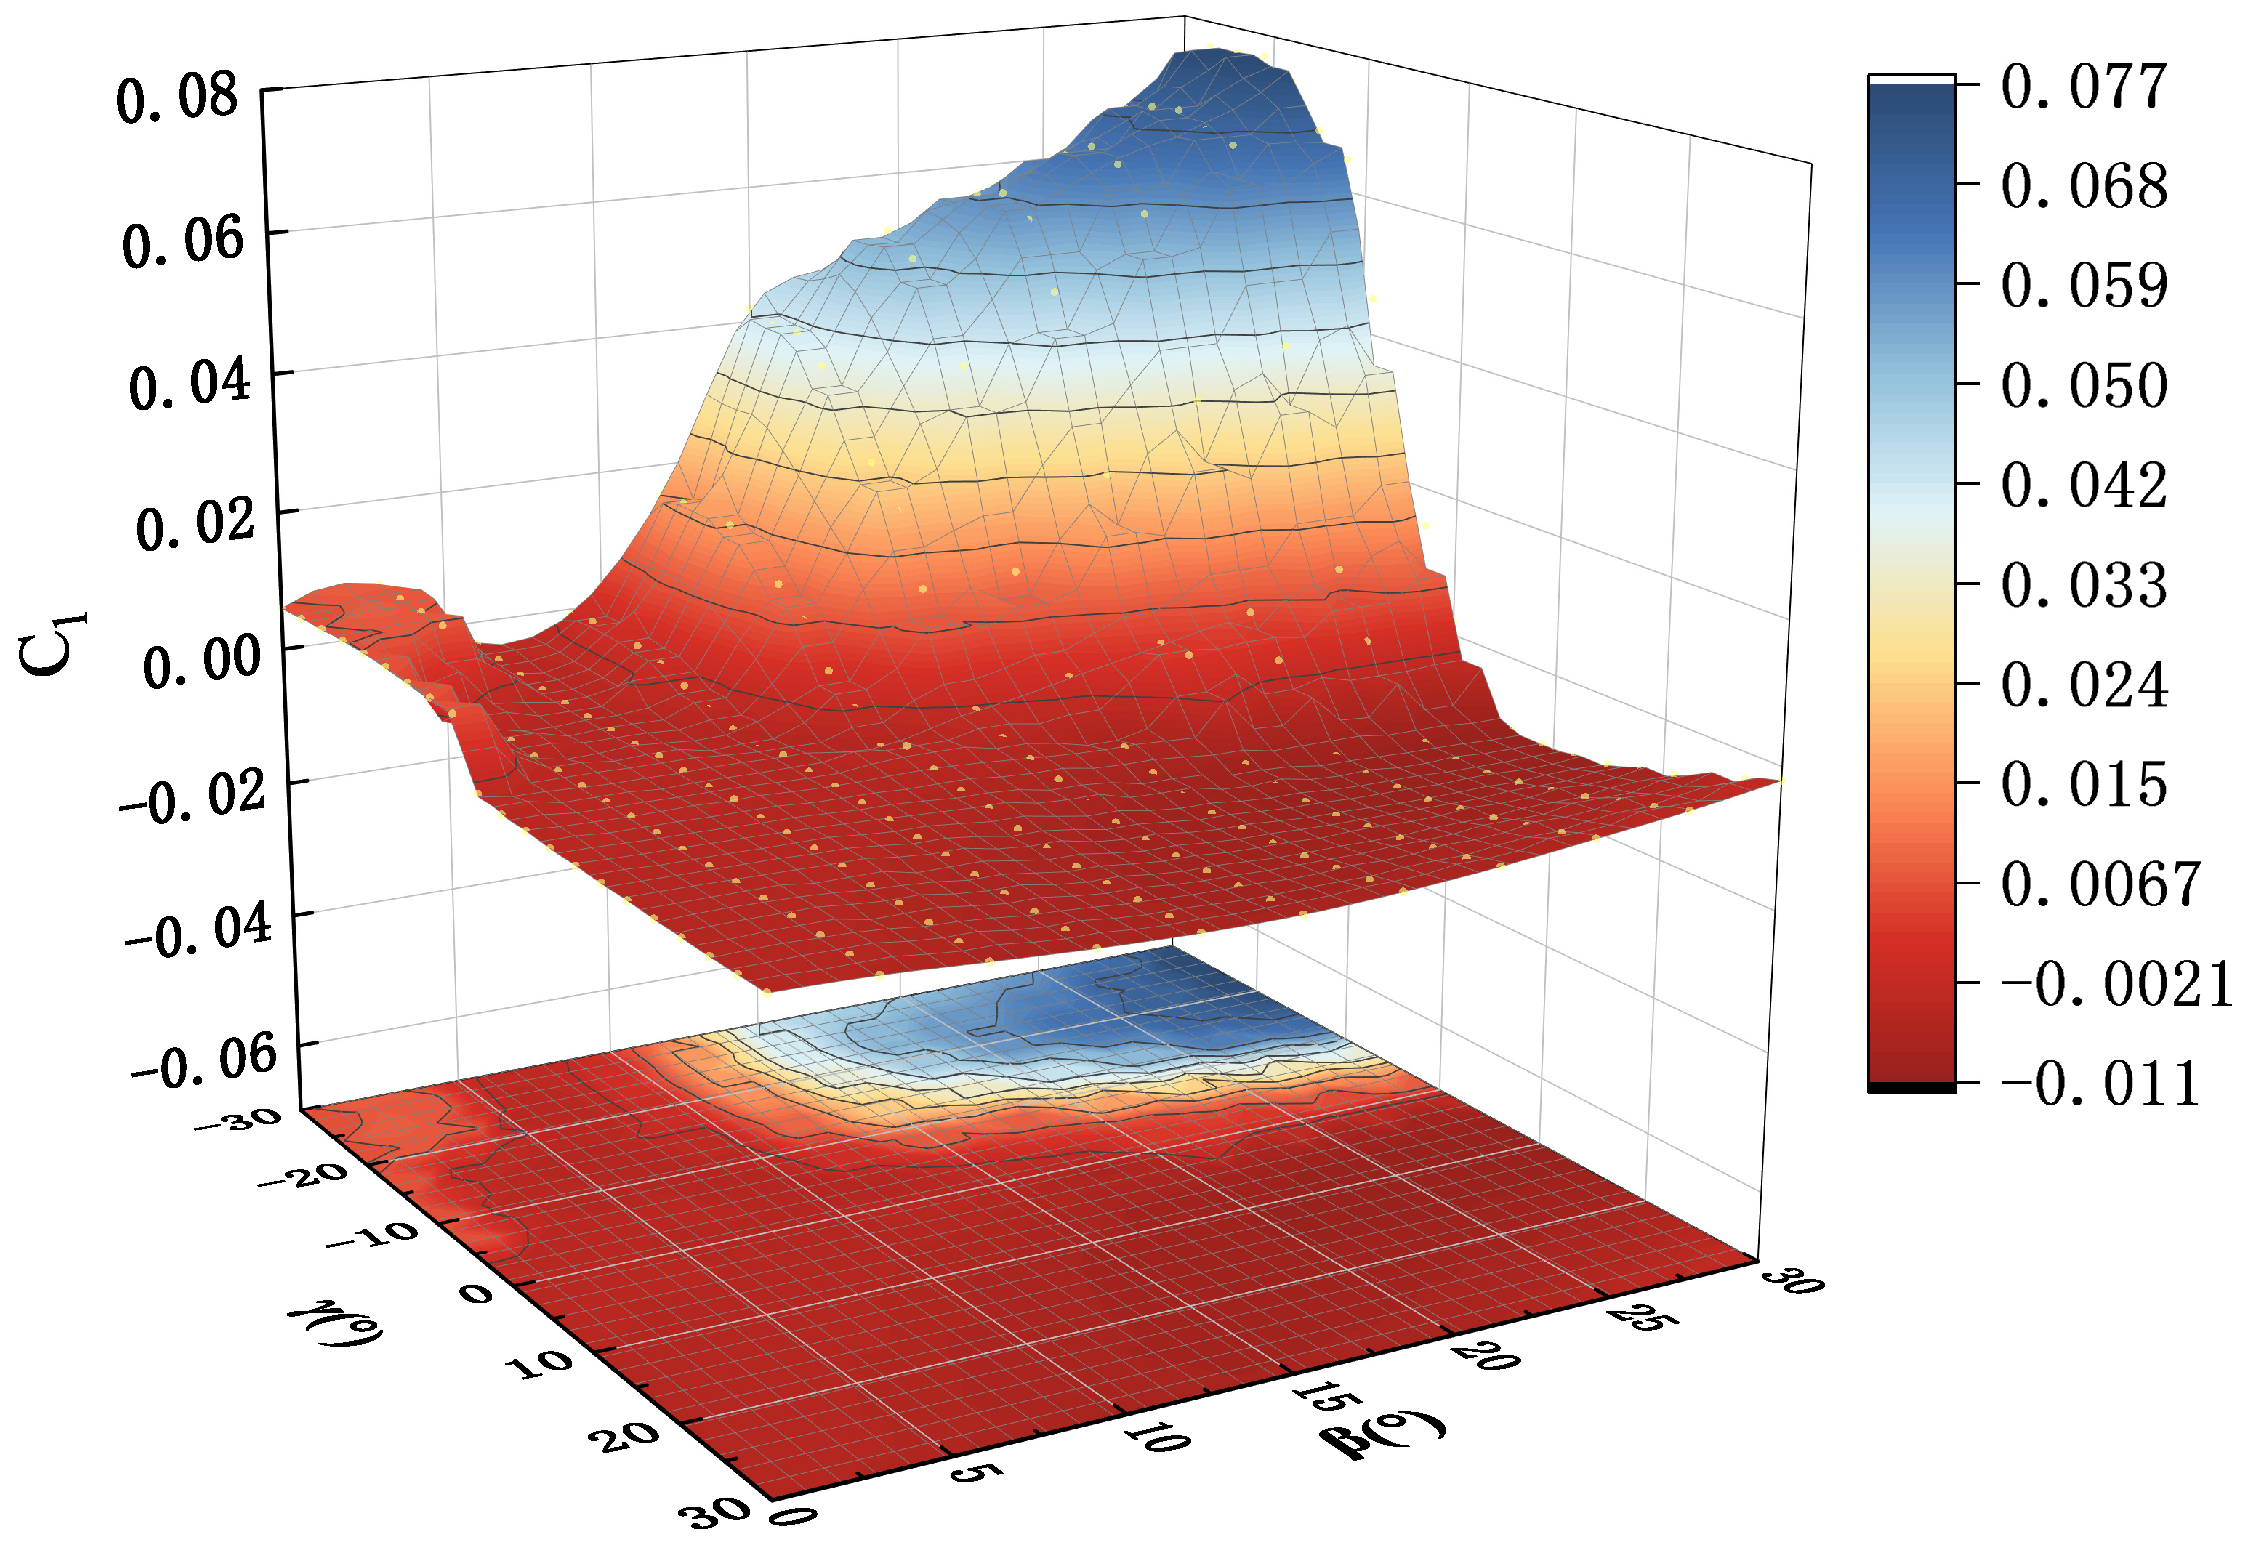
The rolling moment coefficient response surface (Figure 14) reveals the central finding of this section: the rolling moment is governed predominantly by sideslip-induced windward–leeward aerodynamic asymmetry rather than by roll angle itself. Three lines of evidence support this conclusion. First, single-axis excitation produces only marginal variation: at , spans merely across the full range (peak-to-peak 0.0120); at , it spans across –. The full coupled space, however, yields with a peak-to-peak amplitude of 0.0876—seven to eight times larger than either single-axis variation. Second, the roll-angle dependence of is itself a strong function of sideslip: the peak-to-peak amplitude remains below 0.013 for , then grows explosively to 0.0249 at , 0.0509 at , 0.0763 at , and 0.0876 at . Third, a direct comparison at identical roll angles shows that increasing from to amplifies by 9.6-fold at (from 0.00657 to 0.06330) but leaves it nearly unchanged at (from to ) and at ( vs. ). Significant rolling moments thus arise exclusively under combined sideslip plus negative roll, where the descending wing becomes the windward panel. The global maximum is at , , and the global minimum is at , .
Figure 14.
Rolling moment coefficient versus yaw angle and roll angle under updraft conditions.
The static stability derivatives corroborate the coupling mechanism. The roll derivative , evaluated over , is negative for all sideslip angles (stable roll behavior), and its magnitude increases monotonically from per degree at to per degree at —a 6.1-fold enhancement. The sideslip derivative is strongly roll-angle-dependent: it is positive and substantial at negative roll ( per degree at , at ), near zero at (), and weakly negative or positive at positive roll ( at , at ). A multivariate regression including the interaction term yields
with , raising the fit from for the purely linear model and confirming that the – coupling dominates the rolling moment variance.
The surface pressure coefficient distributions at representative coupled attitudes, presented in Figure 15, provide direct flow-field corroboration. At with , the pressure contours on the two wing panels are nearly indistinguishable, consistent with the negligible rolling moments (0.00657 and , respectively) and confirming that geometric roll alone cannot generate a meaningful inter-wing pressure differential.
Figure 15.
Pressure coefficient distributions at typical spanwise sections under zero sideslip: (a) , ; (b) , .
At , as illustrated in Figure 16, the windward panel at develops a markedly intensified suction peak and expanded high-pressure region relative to the leeward panel, directly visualizing the aerodynamic asymmetry that produces ; at the pressures are balanced and (0.000253), while at incipient leeward dominance yields a small negative .
Figure 16.
Pressure coefficient distributions at typical spanwise sections: (a) , ; (b) , .
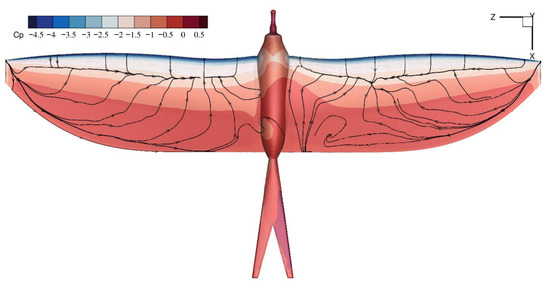
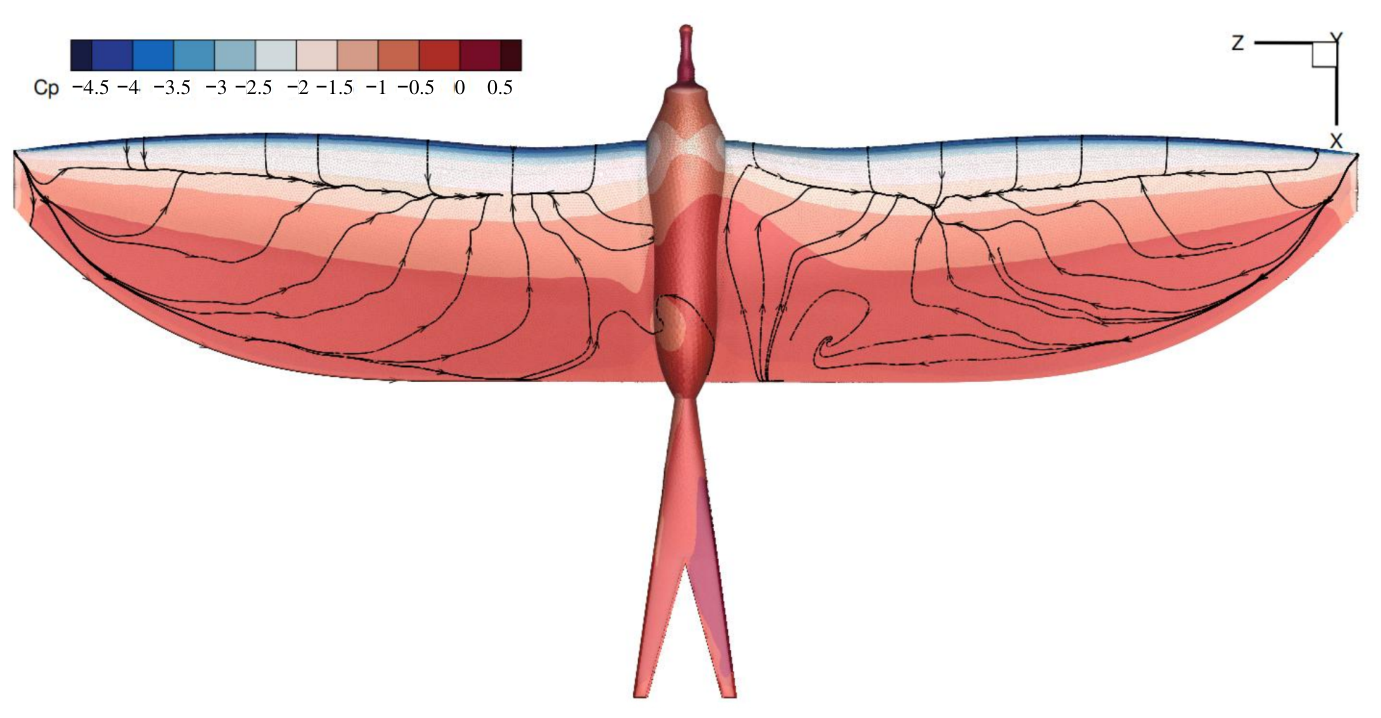
The surface limiting streamlines overlaid with pressure coefficient contours at representative sideslip angles provide direct flow-field evidence for the separation-driven asymmetry. At (Figure 17), the separation patterns and pressure distributions on both wing panels are nearly symmetric: comparable recirculation zones develop near the wing root and mid-span, and the surface streamlines exhibit mirror-symmetric topology, confirming that geometric roll alone cannot induce inter-wing aerodynamic asymmetry.
Figure 17.
Surface limiting streamlines and pressure coefficient contours on the wing planform at .
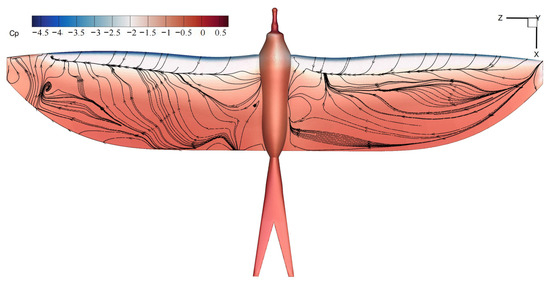
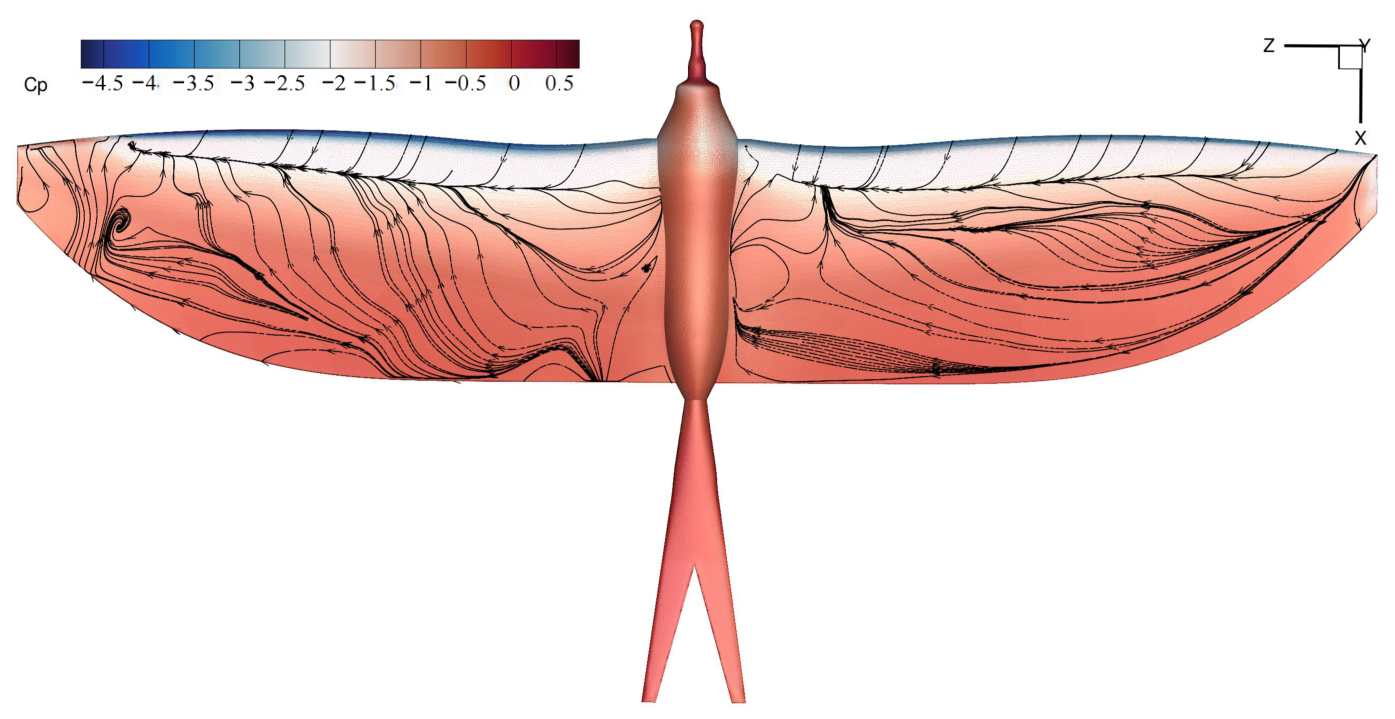
At (Figure 18), the flow field becomes markedly asymmetric. The windward wing develops a concentrated separation focus near the wingtip with localized reverse flow, whereas the leeward wing exhibits a large-scale recirculation zone extending over the mid-to-outboard panel, where the surface streamlines form closed recirculation loops indicative of extensive boundary layer separation. This disparity in separation bubble evolution directly disrupts the symmetric pressure distribution: the leeward wing suffers enlarged low-pressure regions and flattened pressure recovery due to the large recirculation zone, while the windward wing maintains a more organized pressure field. The resulting inter-wing pressure differential constitutes the primary source of the rolling moment under high-sideslip conditions.
Figure 18.
Surface limiting streamlines and pressure coefficient contours on the wing planform at .
Physically, under pure roll without sideslip the two wings experience nominally identical effective incidences and the rolling moment vanishes; when sideslip is introduced, the spanwise freestream component orients the descending (negative-) wing into the lateral flow as the windward panel—with pressure stagnation, elevated drag (), and maintained lift ()—while the ascending leeward wing suffers reduced incidence, flow separation, and lift collapse (). The resulting differential normal force across the half-span generates the substantial positive rolling moment. In summary, the roll angle determines which wing becomes the windward panel, but the sideslip angle sets the magnitude of the inter-wing force differential; the rolling moment is therefore fundamentally a sideslip-driven rather than roll-driven phenomenon, with implications for lateral-directional control design in high-sideslip bio-inspired flight regimes.
3.2. Spanwise Pressure Distribution and Aerodynamic Regulation Mechanism of Updrafts
To further elucidate the influence mechanism of updrafts on aerodynamic characteristics, we quantify the characteristics of the three-dimensional pressure field disturbances induced by updrafts through pressure coefficient curves. A series of spanwise sections are extracted along the wingspan direction, and the regulatory mechanism of updrafts on the local pressure distribution and global aerodynamic loads is clarified by comparing the pressure coefficient curves.
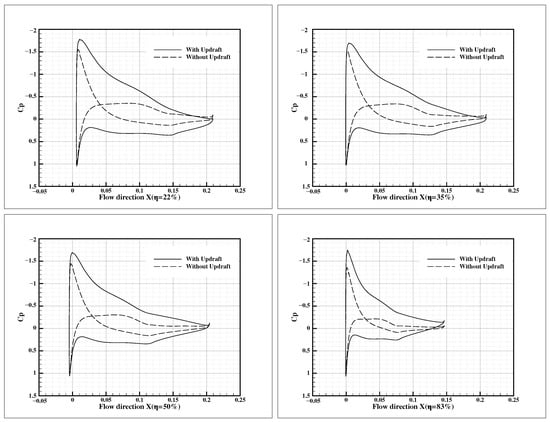
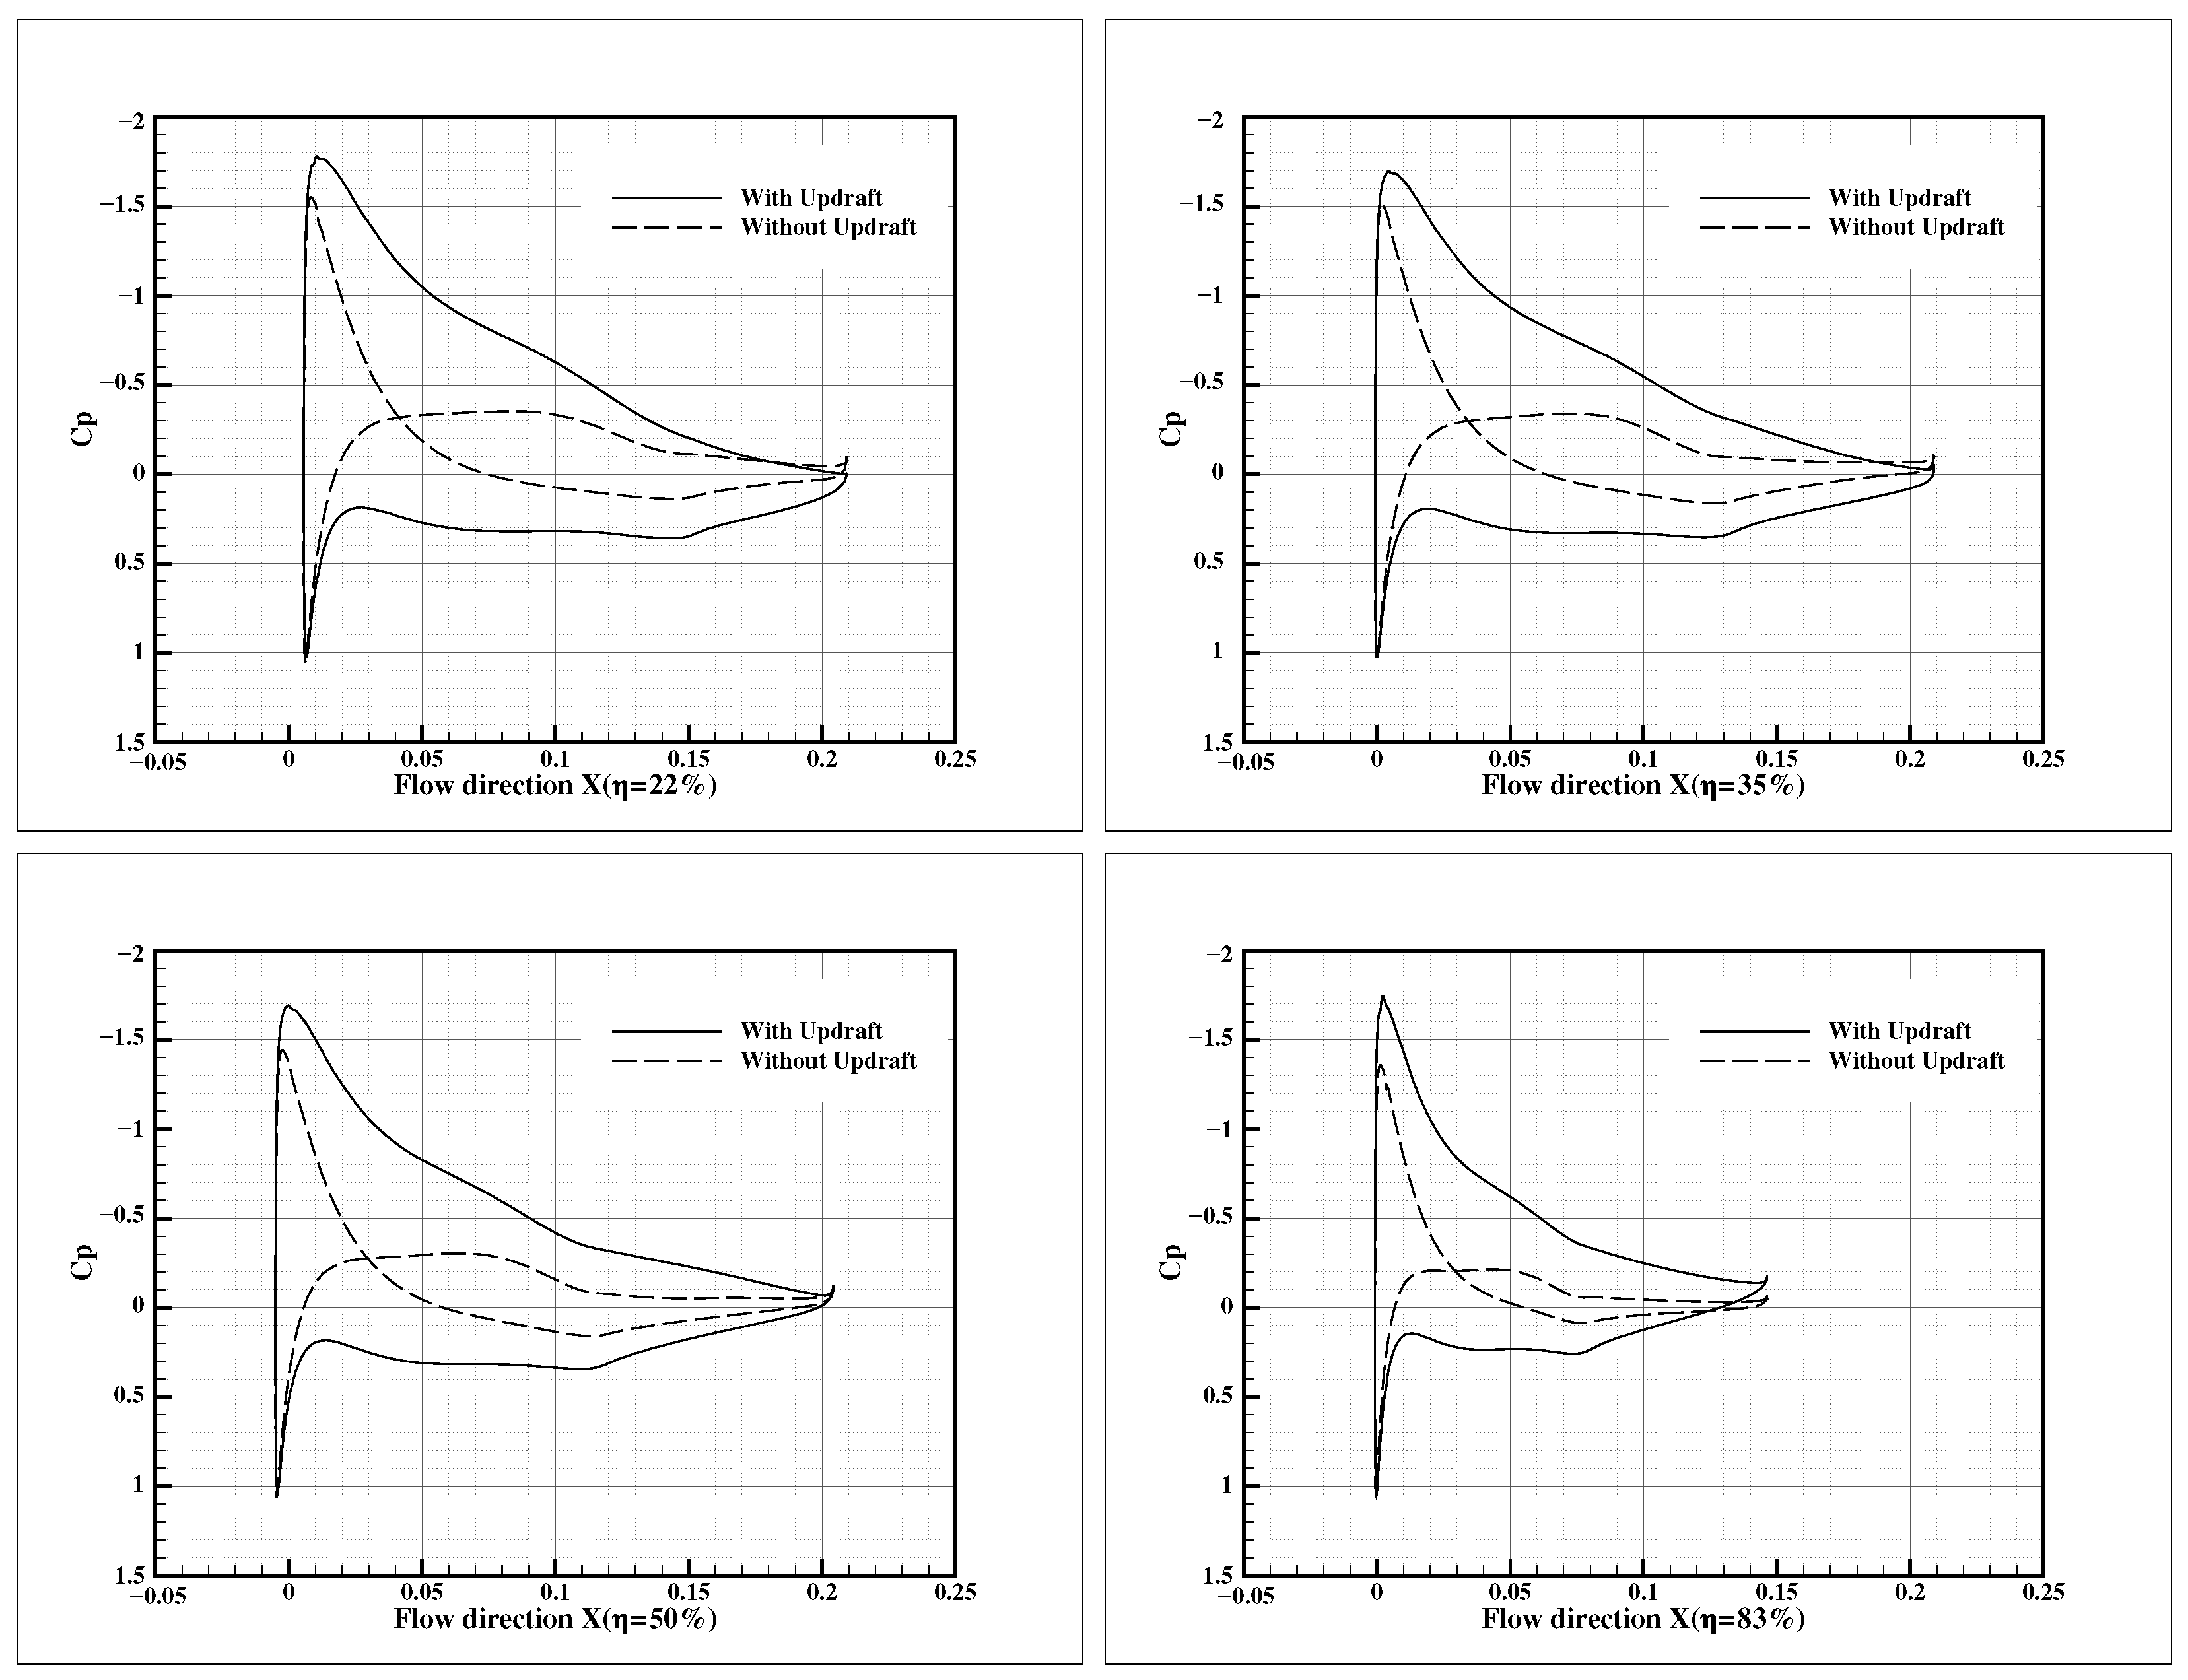
Figure 19 displays the curves at typical spanwise sections (, , , ) at an angle of attack of . As shown in Figure 19, attached flow is maintained over the airfoil surface at all spanwise positions near the wing root at . The pressure recovers smoothly toward zero at the trailing edge and satisfies the Kutta condition, which demonstrates that the frigatebird-inspired wing maintains stable aerodynamic performance under negative angles of attack.In the no-updraft case at , the upper- and lower-surface curves intersect at due to the negative effective angle of attack: upstream of the intersection, the geometric upper surface carries positive pressure while the lower surface is in suction, representing a transient pressure-side/suction-side role reversal; downstream of the intersection, the conventional loading pattern is gradually restored as the flow turns around the airfoil. Under the updraft condition, by contrast, the vertically superimposed velocity raises the local effective angle of attack toward zero, eliminating this curve crossing and re-establishing the upper-surface suction peak throughout the chord.
Figure 19.
Pressure distribution at typical spanwise sections at .
Obvious suction peaks are formed at the leading edge under both flow conditions at the inboard wing section of . Under the updraft condition, the peak suction pressure coefficient () at the leading edge is greatly intensified, decreasing from approximately without updrafts to around . Meanwhile, the chordwise coverage of negative pressure distribution on the suction surface becomes wider, and the peak pressure coefficient () on the pressure surface is higher under updrafts, leading to a remarkable increase in the pressure difference between the upper and lower surfaces. This indicates that a higher local lift coefficient is achieved at the wing root section.
From to , the magnitude of the leading-edge suction peak gradually declines with outward spanwise position, and the chordwise coverage of the suction plateau decreases accordingly. This trend stems from the decreasing chord length toward the wingtip and the intensified three-dimensional wingtip effect. Updrafts exert a lift augmentation effect across all spanwise sections, with more prominent enhancement at the wing root and mid-span regions, whereas the pressure difference increment is relatively limited near the wingtip at . The results demonstrate that updrafts render the spanwise lift distribution closer to the ideal elliptical pattern, which is beneficial to reduce induced drag and improve gliding aerodynamic efficiency.
It is evident that updrafts introduce an upward velocity component into the incoming flow, effectively increasing the local angle of attack of each wing section and amplifying the flow acceleration effect near the leading edge. In addition, the extended suction plateau mitigates the adverse pressure gradient on the suction surface, restrains flow separation, and expands the stable operational range of angle of attack. The above aerodynamic characteristics reveal the physical mechanism that enables frigatebirds to realize efficient and long-duration gliding at negative geometric angles of attack by taking advantage of updrafts.
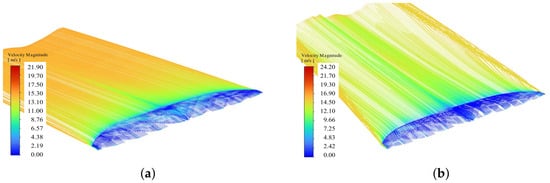
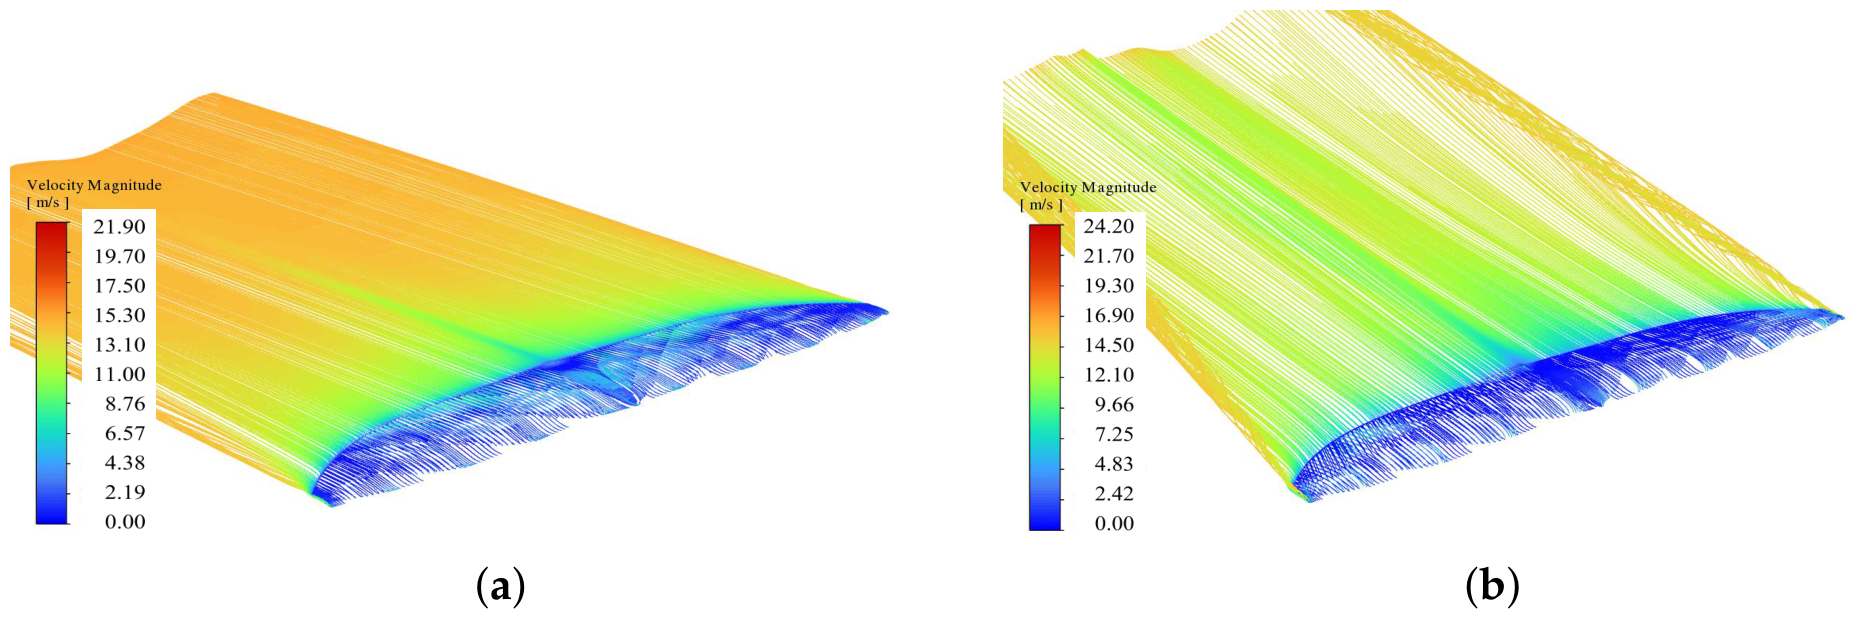
Corresponding velocity pathlines in Figure 20 further visualize the updraft-induced flow modification. In the absence of updrafts, incoming streamlines distribute uniformly along the wing surface with moderate flow speed. After introducing vertical updraft velocity, the airflow approaching the leading edge is accelerated obviously, and high-speed pathlines cluster around the leading-edge suction zone. All streamlines remain tightly attached across the entire chordwise direction without observable flow deflection or separation, which is consistent with the smooth pressure recovery reflected by curves and further confirms the full-attached flow feature at negative incidence.
Figure 20.
Velocity pathline distribution at typical spanwise sections at . (a) Without Updraft. (b) With Updraft.
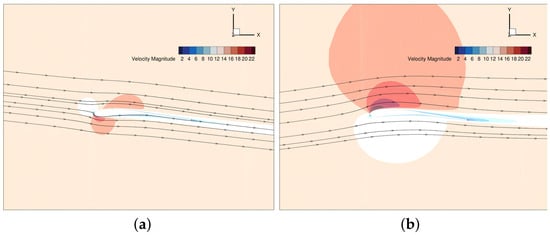
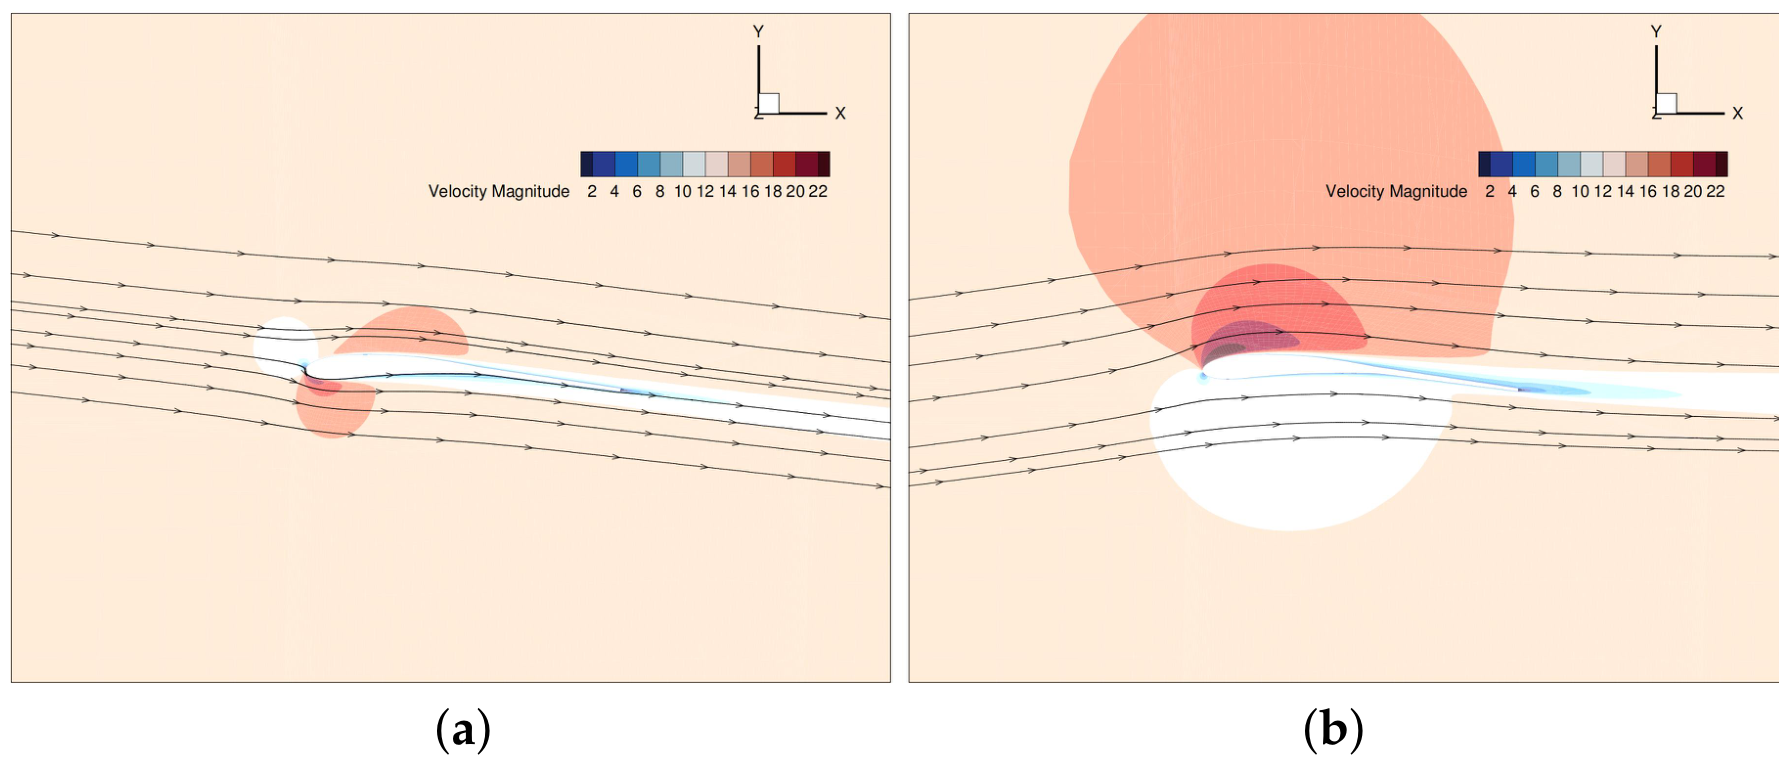
Velocity vector distributions overlaid with velocity magnitude contours at the mid-span section () further corroborate the fully attached flow regime at , as shown in Figure 21. Under both inflow conditions, the velocity vectors remain tangent to the airfoil surface throughout the chord, with no reverse-flow region observed in the boundary layer, confirming the absence of flow separation at this negative incidence. In the no-updraft case, the freestream velocity remains nearly uniform at approximately 10–12 m/s, with a localized acceleration zone near the leading edge. Under updraft conditions, the superimposed vertical velocity generates a markedly enlarged high-velocity region above the wing (reaching approximately 22 m/s), accompanied by a low-velocity wake beneath the airfoil; nevertheless, the near-wall streamlines maintain smooth attachment without any separation bubble. These vector distributions are consistent with the smooth recovery (Figure 19) and the positive skin friction coefficient across the full chord (Figure 22), providing independent flow-field verification of the attached-flow conclusion.
Figure 21.
Velocity vector distributions overlaid with velocity magnitude contours at the mid-span section () for : (a) without updraft; (b) with updraft.
Figure 22.
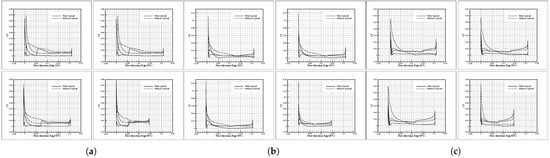
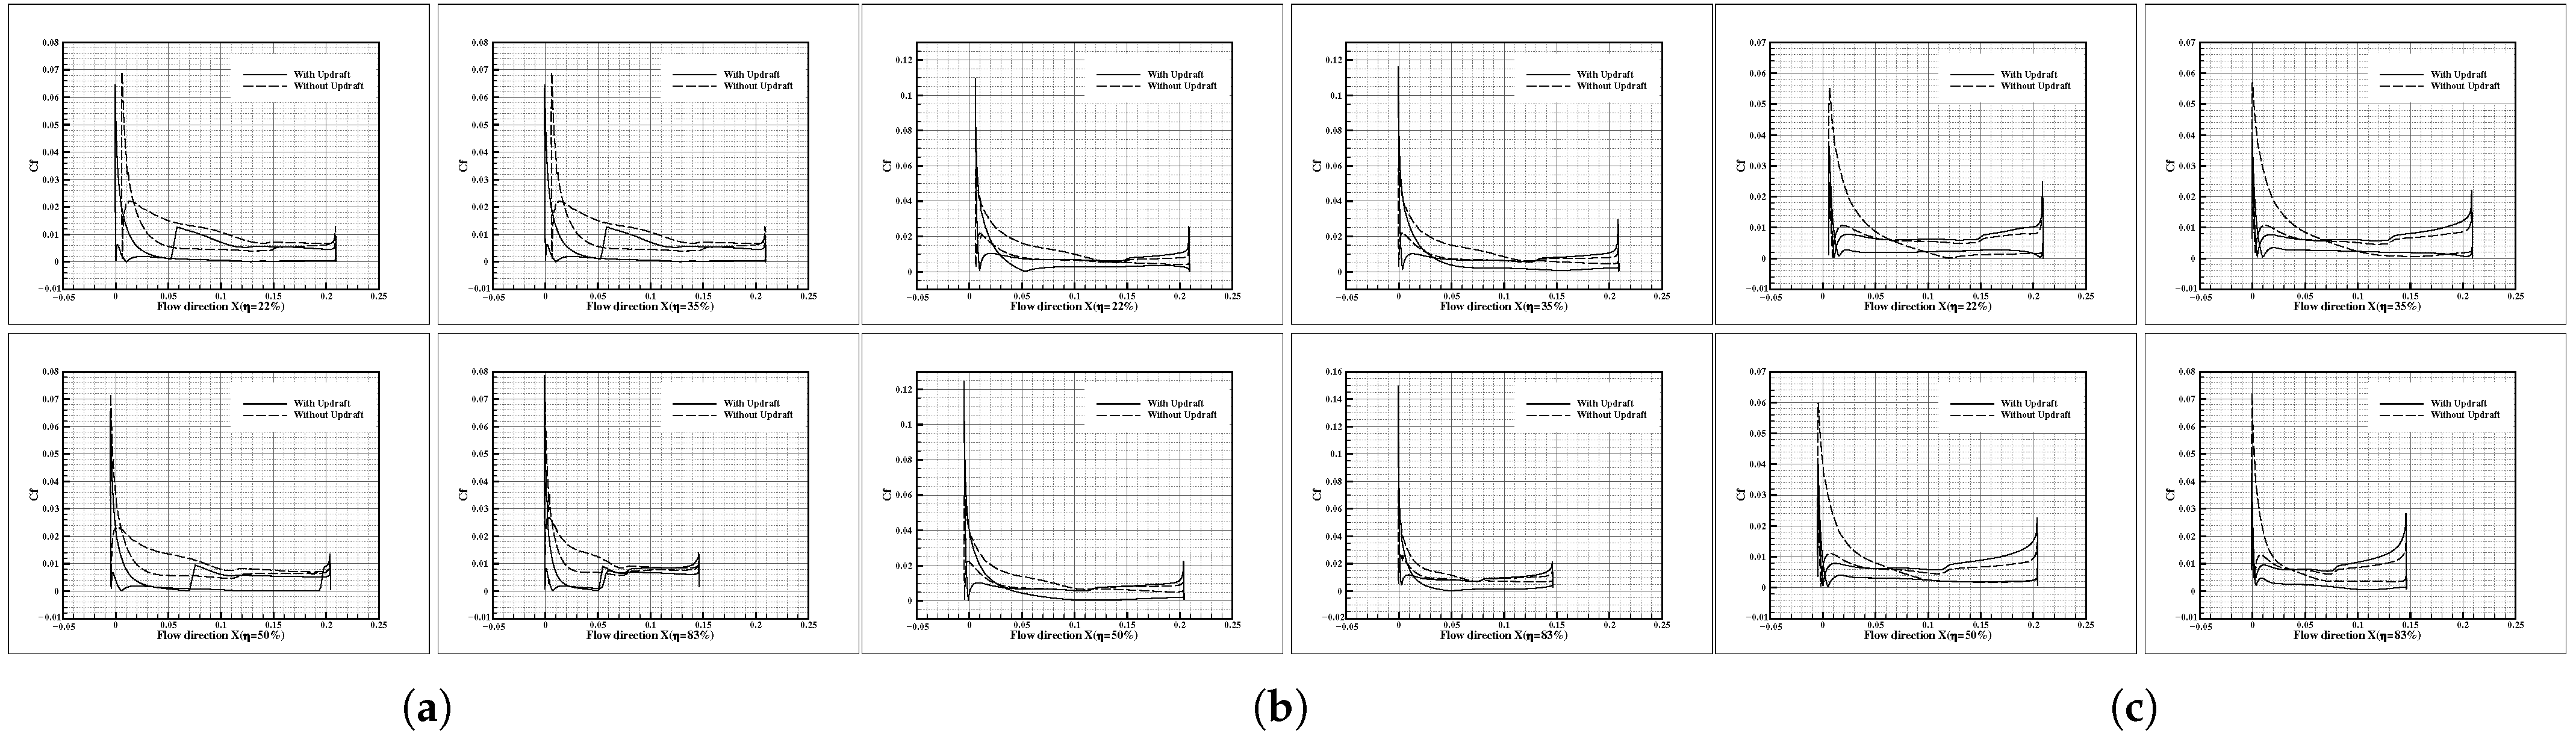
Skin friction coefficient distributions along the chord at four spanwise stations () under updraft and no-updraft conditions: (a) ; (b) ; (c) .
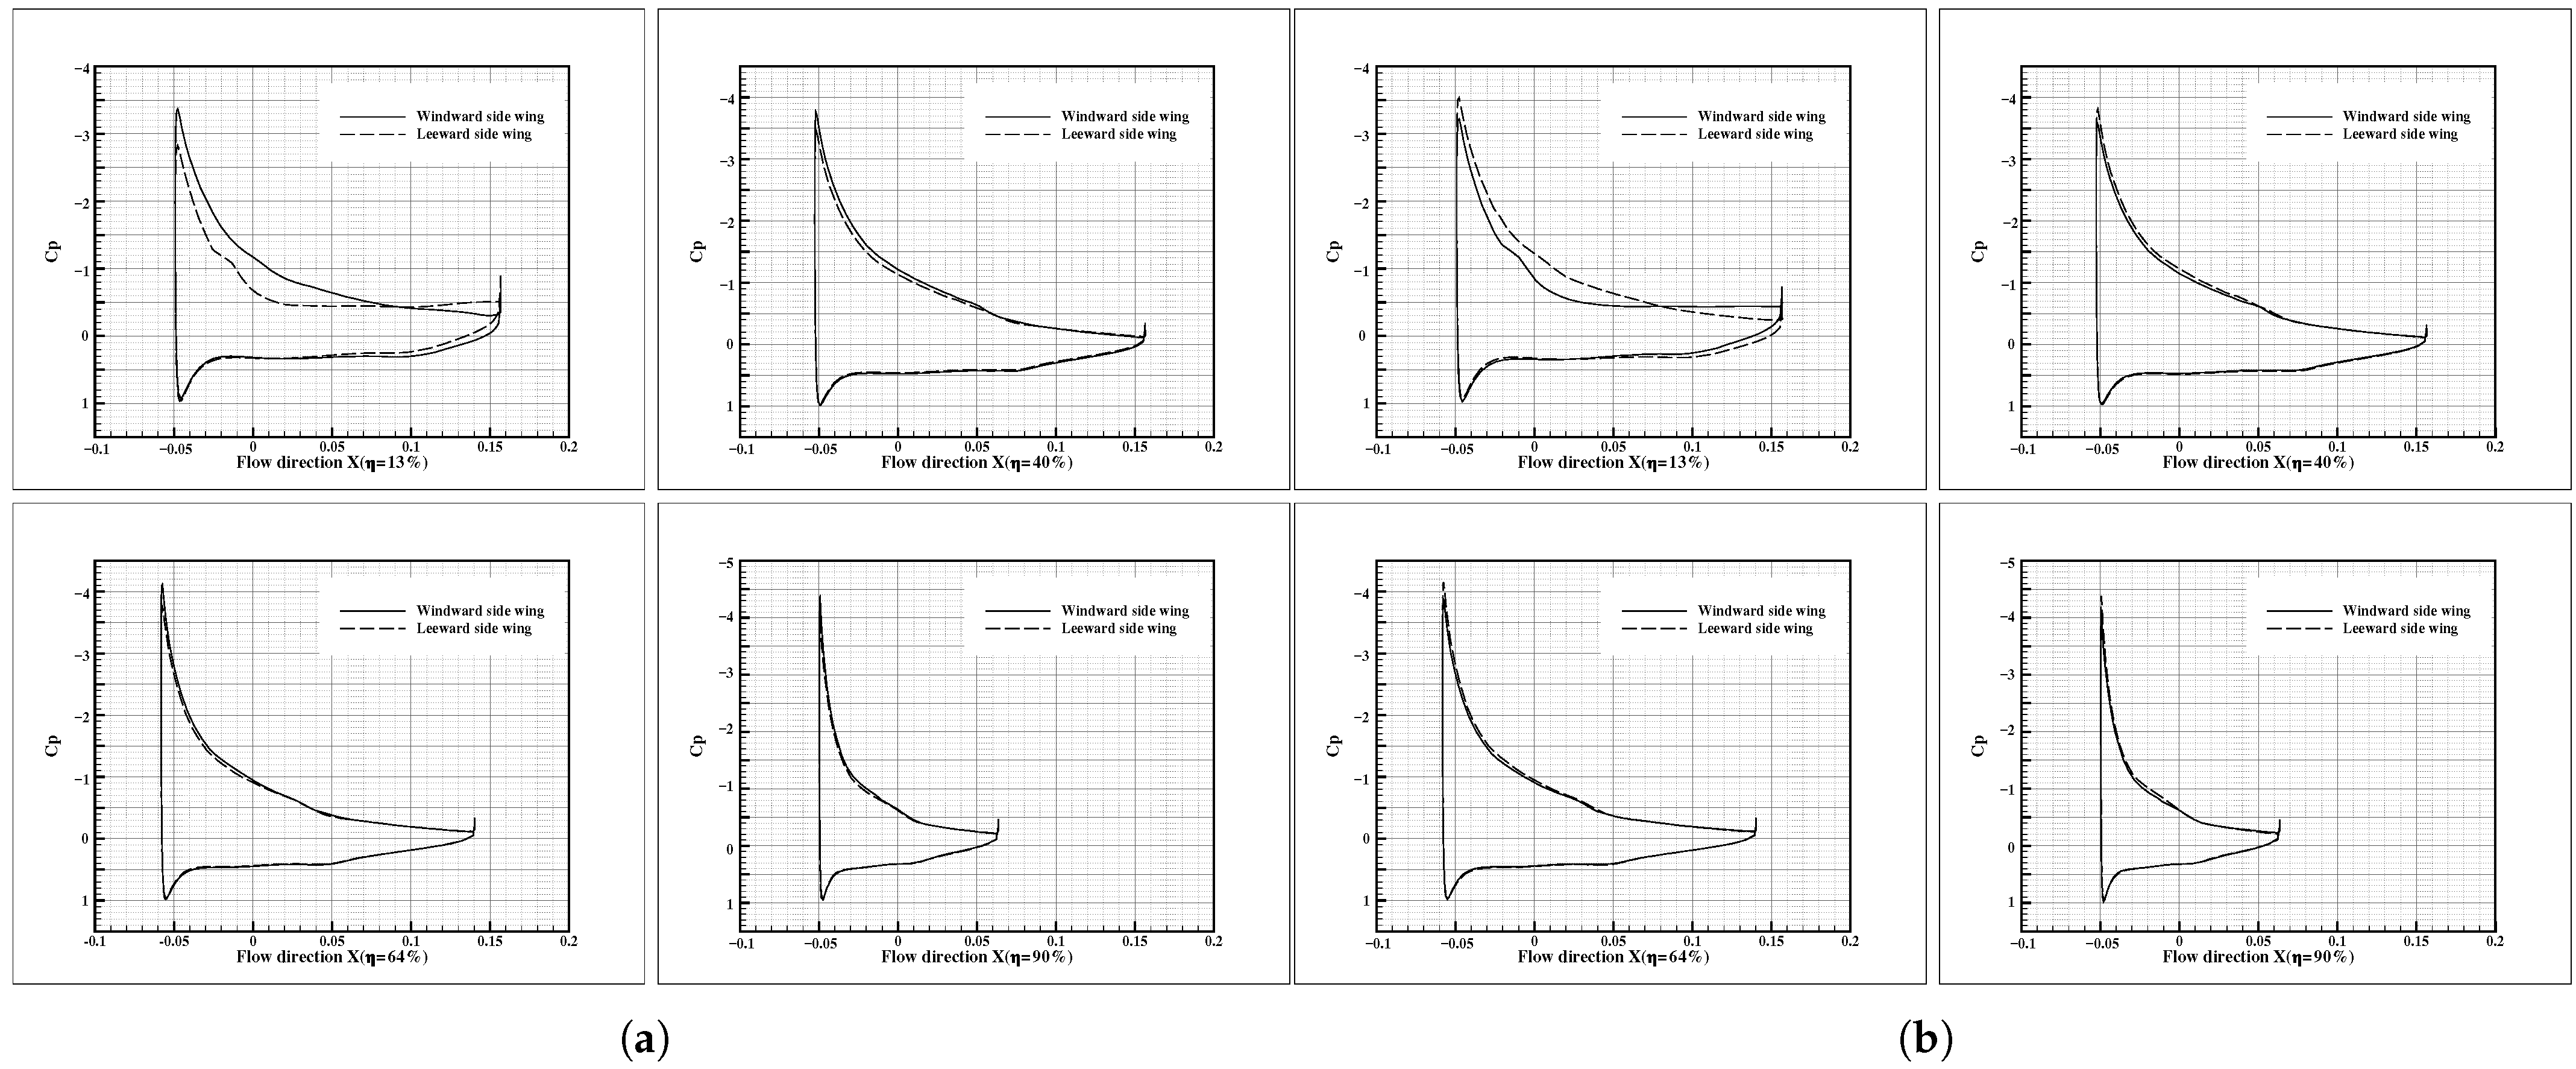
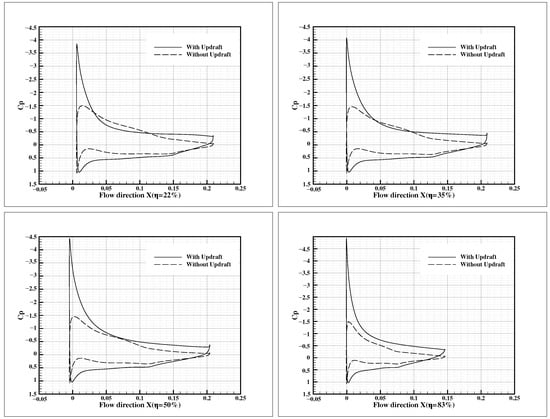
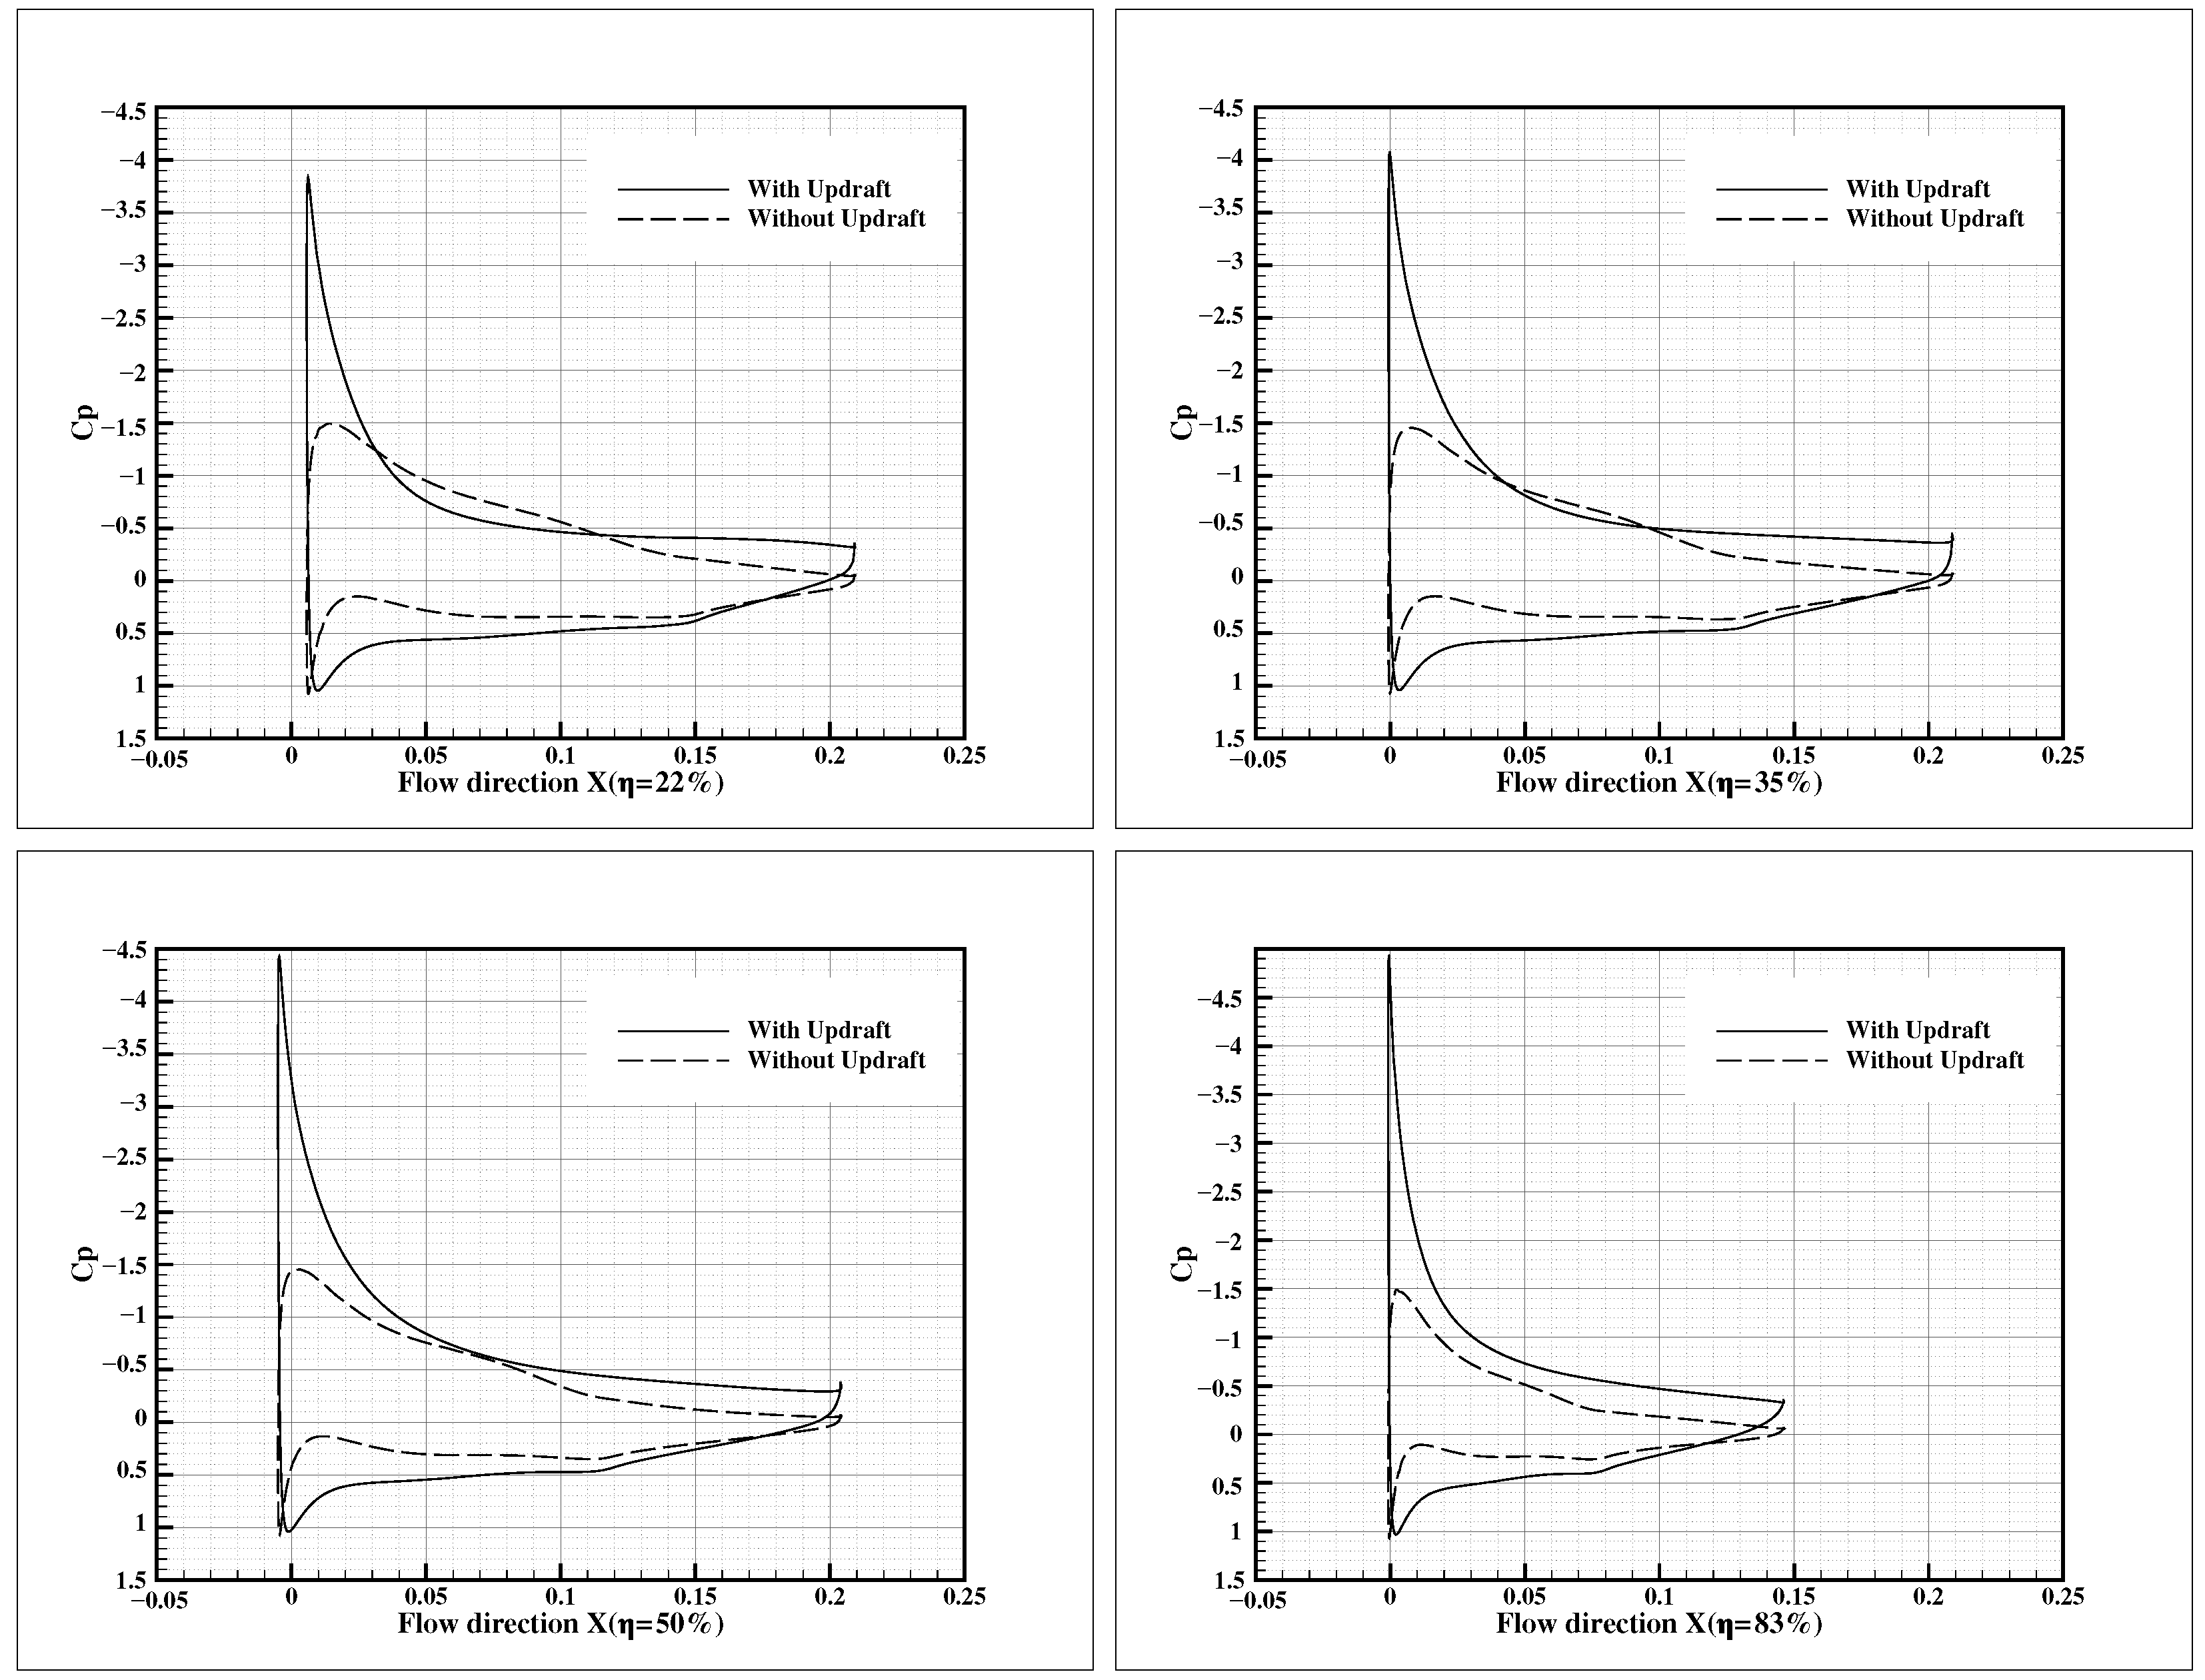
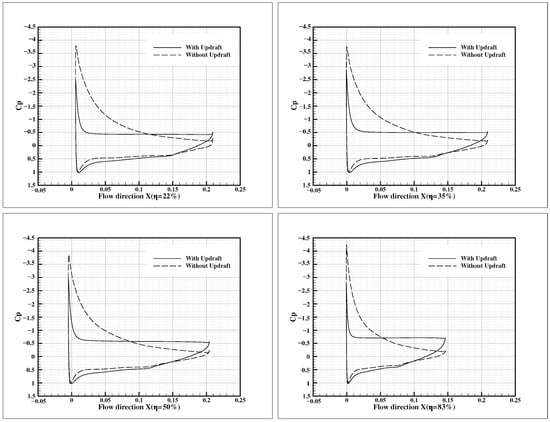
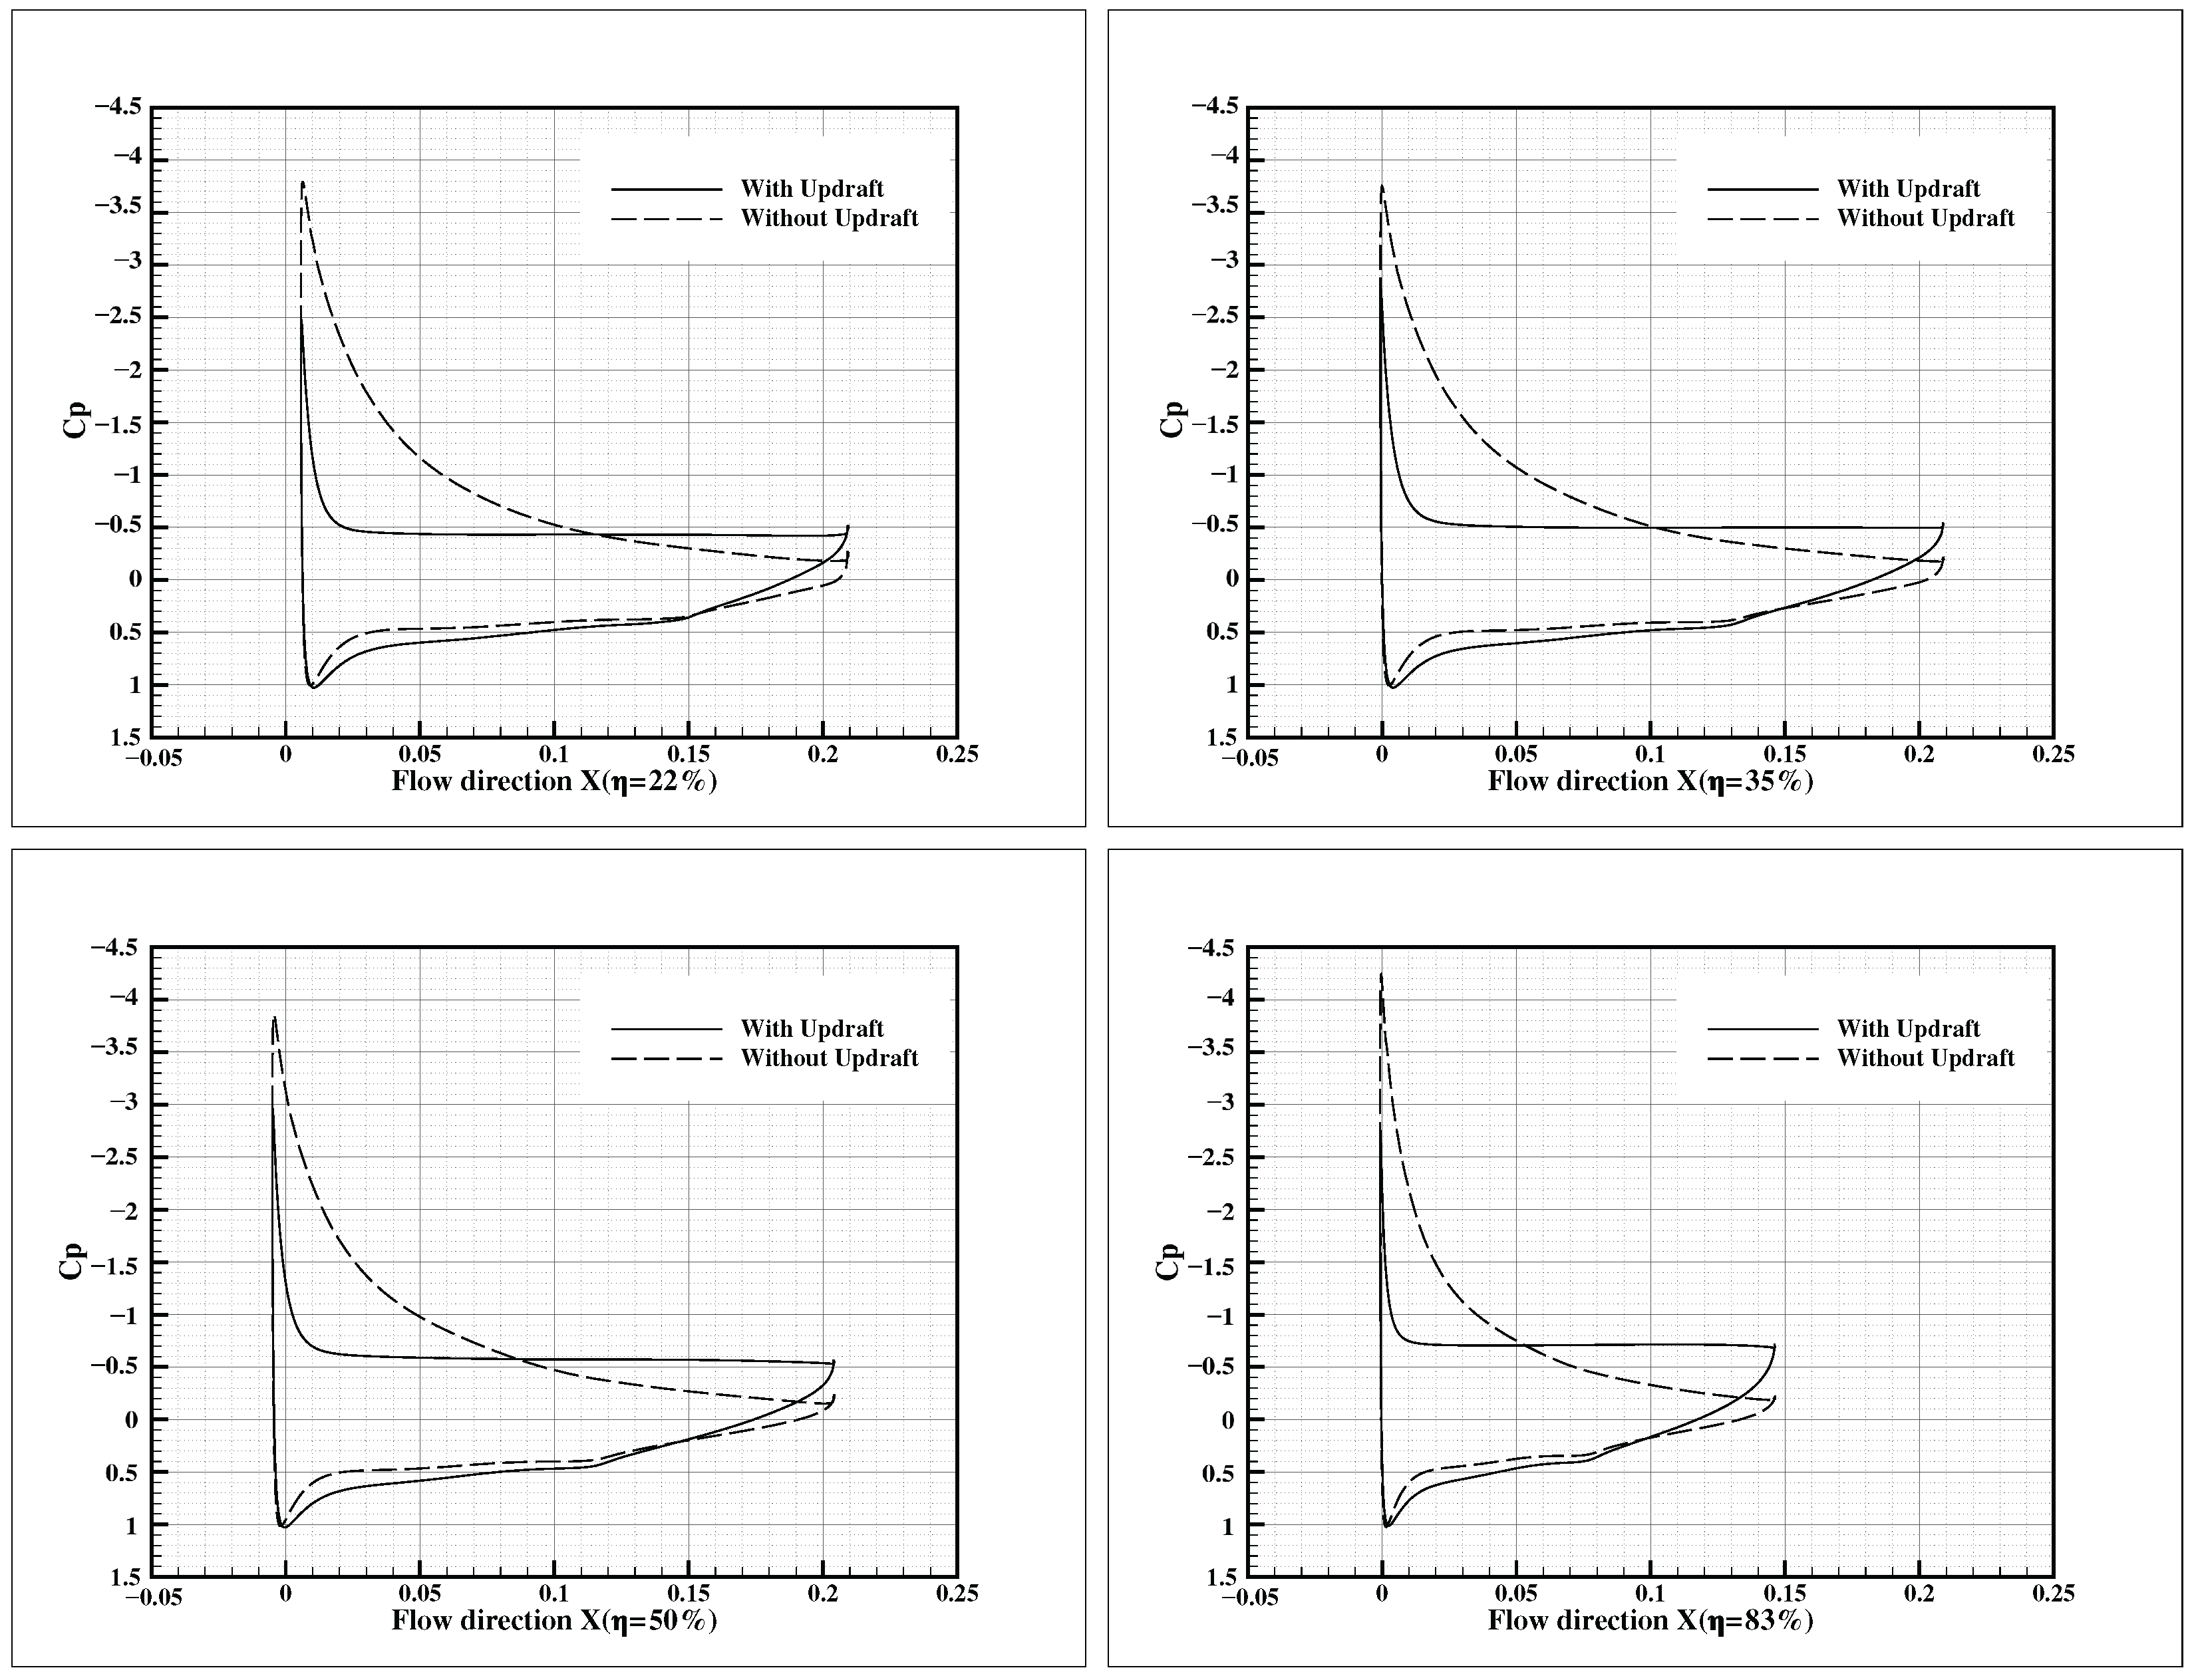
Figure 23 presents the pressure coefficient distribution curves at three typical spanwise sections (, , , ) of the frigatebird-mimicking wing at a geometric angle of attack of under conditions with and without updrafts.
Figure 23.
Pressure distribution at typical spanwise sections at .
It can be observed that the flow remains basically attached on the airfoil surface of each section without large-scale stall and separation. Compared with the condition at negative angle of attack, the intensity of the leading-edge suction peak increases obviously at , and the adverse pressure gradient on the suction surface rises remarkably, bringing the flow close to the critical separation state. At the inboard wing section of , intense leading-edge suction peaks are formed under both working conditions. In the presence of updrafts, the peak suction pressure coefficient () at the leading edge is further intensified, decreasing from approximately without updrafts to around , with a lift increment exceeding . Meanwhile, the chordwise coverage of negative pressure on the suction surface is wider and the peak pressure Cp () on the pressure surface is higher under updraft conditions, which greatly enlarges the pressure difference between upper and lower surfaces and endows the wing root section with an extremely high local lift coefficient.
From to , the distribution presents a characteristic of outward migration and enhancement of suction peaks, which is distinctly different from that at low angles of attack. The peak suction pressure coefficient () at the leading edge decreases gradually along the spanwise direction (i.e., the suction magnitude increases), reaching approximately at the inboard section, at the mid-span section, and near the wingtip. This phenomenon is attributed to the fact that the three-dimensional flow effect in the wingtip region further accelerates the leading-edge flow and generates stronger local suction at moderate angles of attack. Meanwhile, the peak pressure coefficient () on the pressure surface follows the distribution rule of being maximum at the wing root and minimum at the wingtip, with values of about , and at the inboard, mid-span and near-wingtip sections respectively. The integrated pressure difference between the upper and lower surfaces reveals that the maximum lift load is still borne by the wing root section, and the overall spanwise lift distribution remains close to the ideal elliptical distribution, ensuring low induced drag. In addition, the pressure recovery rate on the suction surface increases progressively from the wing root to the wingtip. Owing to the shorter chord length and stronger three-dimensional overflow effect near the wingtip, the chordwise coverage of the negative pressure region is obviously narrowed, and pressure recovery is completed within a shorter chordwise distance.
Updrafts deliver remarkable lift enhancement and flow control effects at all spanwise sections, and such effects are far more prominent than those at negative angle of attack. Notably, an obvious pressure plateau emerges in the rear region where on the suction surface without updrafts, which serves as a typical sign of slight boundary layer separation. In contrast, the pressure recovery curve remains smooth throughout the chord under updraft conditions without any separation plateau. This indicates that updrafts effectively delay flow separation and broaden the stall angle range by extending the suction plateau and reducing adverse pressure gradients. The lift gain induced by updrafts is slightly higher at the wing root and mid-span regions than at the wingtip, which further optimizes the spanwise lift distribution to approach the ideal elliptical pattern. Consequently, the total lift is greatly improved while favorable gliding aerodynamic efficiency is maintained.
The underlying physical mechanism is summarized as follows: at an angle of attack of , the increment of local effective angle of attack introduced by the vertical velocity component of updrafts exerts a much stronger amplification effect on leading-edge suction compared with low-angle-of-attack conditions, making the intense leading-edge suction peak the dominant contributor to lift. The above aerodynamic characteristics demonstrate that is the high-efficiency lift operating condition for the frigatebird-inspired wing. The prominent lift augmentation and separation suppression effects of updrafts at moderate angles of attack constitute the core aerodynamic mechanism enabling frigatebirds to achieve heavy-load and long-distance gliding at moderate angles of attack within updraft environments.
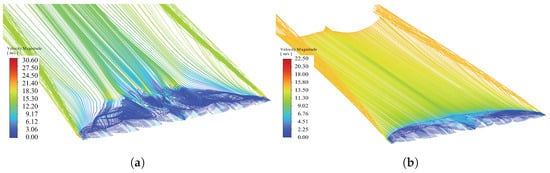
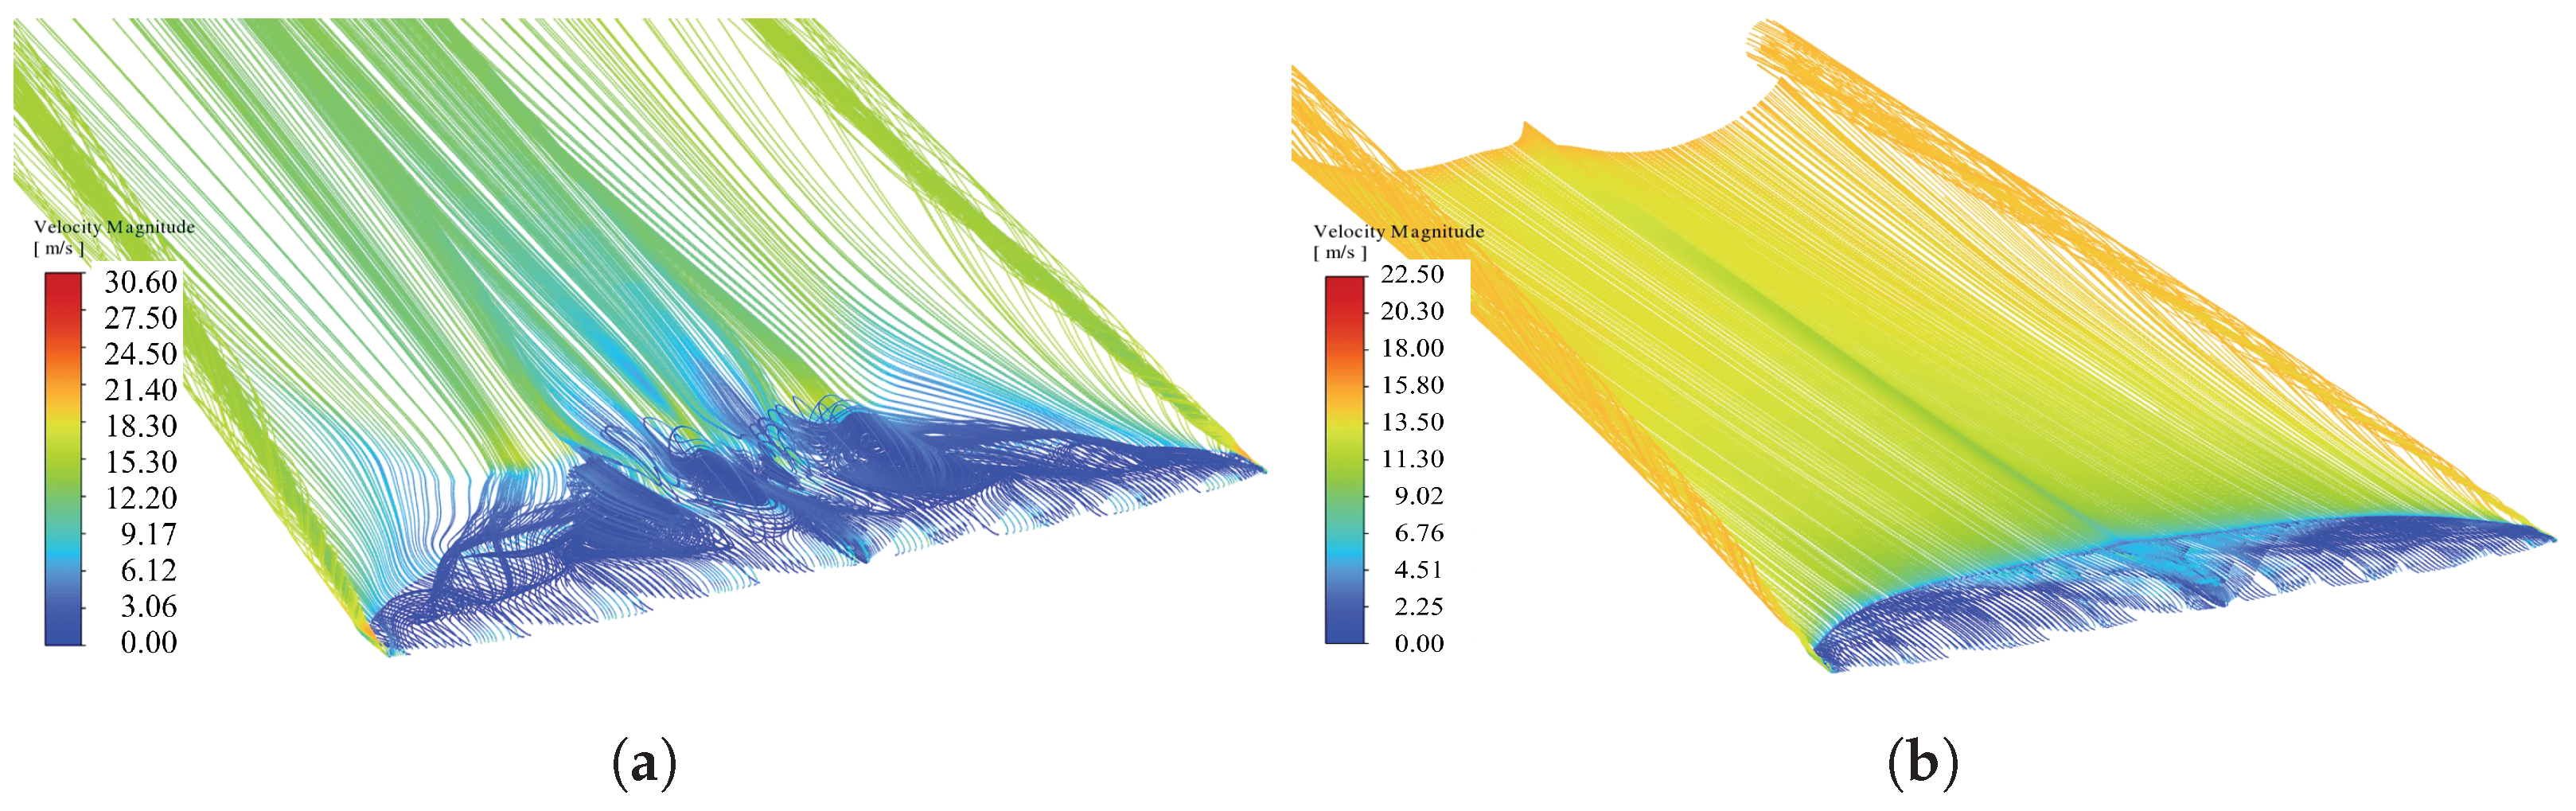
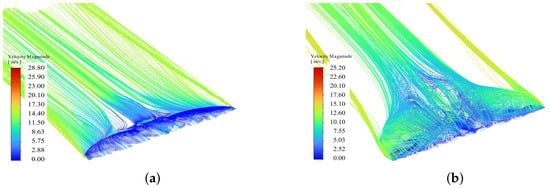
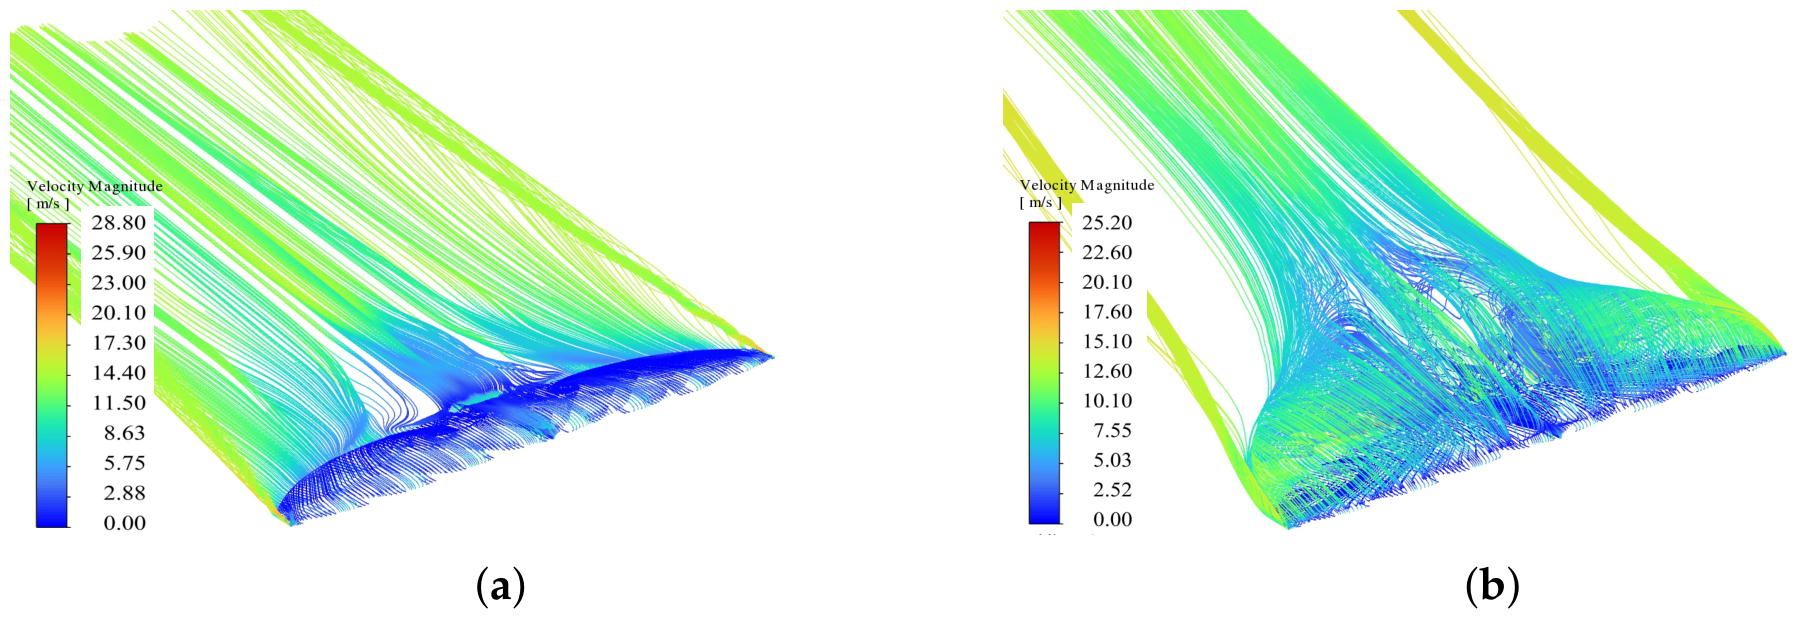
As illustrated by the pathline contours of Figure 24, slight streamline divergence emerges near the trailing edge under no-updraft condition, indicating incipient boundary layer separation matching the flat separation plateau on suction-side distribution. Benefiting from updraft injection, incoming flow obtains extra vertical momentum; the overall flow velocity rises remarkably, and streamlines adhere closely to the wing surface from leading edge to trailing edge. The concentrated high-speed pathlines around the front airfoil strengthen leading-edge suction, suppressing early separation and maintaining the optimal attached-flow state for high lift generation.
Figure 24.
Velocity pathline distribution at typical spanwise sections at . (a) Without Updraft. (b) With Updraft.
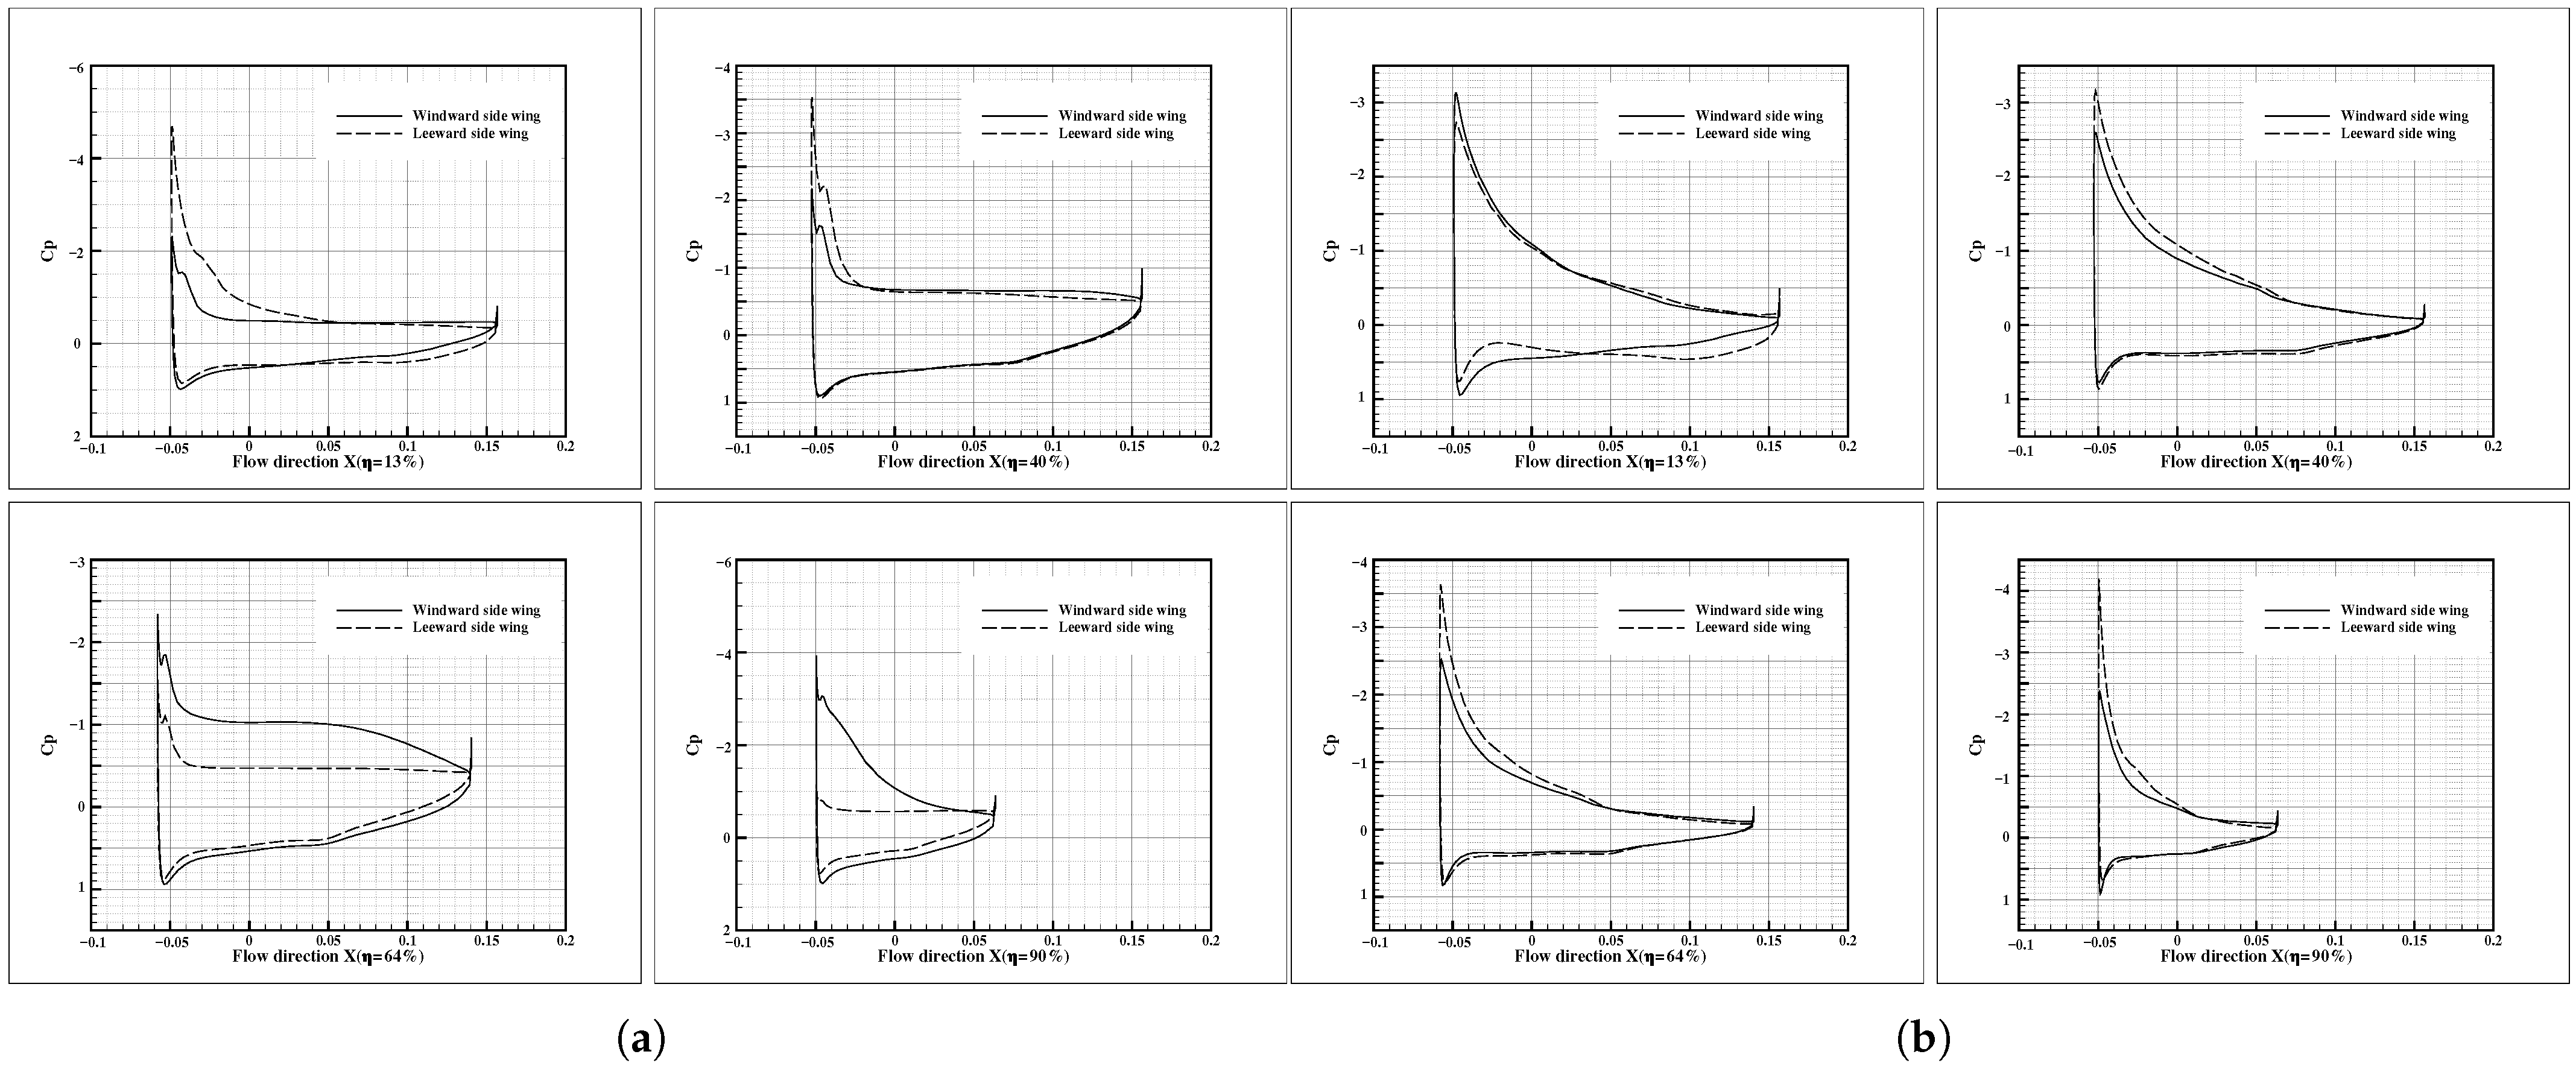
Figure 25 shows the pressure coefficient distribution curves at three typical spanwise sections (, , , ) of the frigatebird-inspired wing at a geometric angle of attack of under conditions with and without updrafts.
Figure 25.
Pressure distribution at typical spanwise sections at .
Distinctly different from the flow characteristics at low and moderate angles of attack, the flow states under the two conditions show essential differences at . Without updrafts, the entire wingspan falls into a deep stall state, and large-scale separation plateaus appear on the suction surface. By contrast, the airflow over the wing surface remains fully attached under updraft conditions. The curves of upper and lower surfaces converge smoothly to zero at the trailing edge and satisfy the Kutta condition, with no flow separation occurring.
At the inboard section of , only a weak leading-edge suction peak with the minimum of approximately is formed without updrafts. Complete flow separation takes place after the chordwise position, and a flat separation plateau around is maintained on the suction surface. In the presence of updrafts, the peak suction pressure coefficient () at the leading edge decreases sharply to about (i.e., the suction peak intensifies).The negative pressure on the suction surface extends smoothly chordwise to the trailing edge, and the peak pressure coefficient () on the pressure surface simultaneously increases to around . The significantly enlarged pressure difference between upper and lower surfaces allows the wing root section to still obtain an extremely high local lift coefficient.
From to , the distribution exhibits an obvious spanwise evolution rule. In the absence of updrafts, typical stall characteristics appear over the whole wingspan: the leading-edge suction peaks are generally weak, with values of at the wing root, at the mid-span and near the wingtip. Flow separation plateaus form on the suction surface at – chordwise position, and the peak pressure coefficient () on the pressure surface gradually declines spanwise outward, with values of at the wing root, at the mid-span and near the wingtip.
Under updraft conditions, by contrast, the intensity of leading-edge suction peaks continuously rises toward the wingtip, with values of approximately at the wing root, at the mid-span and near the wingtip, maintaining the spanwise feature of stronger suction peaks at the wingtip as observed at moderate angles of attack. The peak pressure Cp () the distribution trend of being maximum at the wing root and minimum at the wingtip, recorded as , and in sequence. The integrated pressure difference between upper and lower surfaces proves that the spanwise lift distribution remains close to the ideal elliptical distribution even at the high angle of attack of , ensuring low induced drag. In addition, the pressure recovery rate on the suction surface increases progressively from the wing root to the wingtip, resulting in a relatively narrowed chordwise range of the negative pressure zone near the wingtip.
At the angle of attack of , the function of updrafts transforms from simple lift enhancement into decisive flow control and stall suppression, and its regulation effect is far stronger than that under low and moderate angle-of-attack conditions. The most crucial conclusion is that the full-span deep stall occurs without updrafts, leading to a sharp drop in lift and a substantial rise in drag. Nevertheless, by significantly strengthening the leading-edge suction peak and extending the chordwise coverage of negative pressure regions on the suction surface, updrafts effectively relieve the intense adverse pressure gradient at high angles of attack and completely restrain boundary layer separation, expanding the stall angle of attack of the wing by more than .
The lift enhancement effect of updrafts shows obvious spanwise discrepancy, with the maximum increment of approximately appearing near the wingtip, which is higher than at the wing root and at the mid-span. This feature compensates for the serious insufficient load at the wingtip under no-updraft conditions and optimizes the spanwise lift distribution closer to the ideal elliptical distribution. Accordingly, considerable lift improvement is achieved while excellent gliding aerodynamic efficiency is well maintained.
The internal physical mechanism is as follows. Even though the vertical velocity component brought by updrafts further increases the local effective angle of attack, the distinctive leading-edge geometry and inherent flow characteristics of the frigatebird-mimicking airfoil enable continuous intensification of leading-edge suction peaks with increasing effective angle of attack. The enhanced leading-edge flow acceleration supplies additional momentum to the boundary layer, allowing it to overcome severe adverse pressure gradients at high angles of attack and avoid flow separation. The above aerodynamic laws reveal the core mechanism that enables frigatebirds to obtain ultra-high lift by utilizing updrafts at high angles of attack and accomplish heavy-load gliding and flight maneuvering, which provides an innovative design idea for bionic gliding wings with extended stall angles of attack.
Pathline distributions in Figure 26 intuitively reveal the outstanding stall-suppression capability of updrafts. Without updrafts, massive streamlines deviate upward far away from the suction surface starting at the front chord, forming large-scale separated wake flow and triggering full-span deep stall, coinciding with the flat separation plateau on curves. By contrast, updrafts accelerate the leading-edge incoming flow and inject additional momentum into boundary layers; all pathlines fit closely to the wing profile throughout the chord, high-velocity streamlines concentrate at the leading edge, and large-scale flow separation is completely eliminated. Such flow-field variation directly accounts for the remarkable lift augmentation and delayed stall of over under updraft environments.
Figure 26.
Velocity pathline distribution at typical spanwise sections at . (a) Without Updraft. (b) With Updraft.
The skin friction coefficient distributions at the same four spanwise stations () provide independent verification of the separation patterns inferred from the curves, as shown in Figure 22. At , remains positive across the entire chord at all stations under both conditions, consistent with the fully attached flow indicated by the smooth recovery. The updraft condition yields a slightly lower mid-chord ( versus – without updraft), reflecting a fuller boundary-layer velocity profile and reduced near-wall velocity gradient under the modified effective incidence.
At , the no-updraft condition exhibits a localized reduction in toward zero at the outboard station over –, coinciding spatially with the incipient separation plateau identified in the distribution. Under updraft conditions, remains positive throughout the chord at all stations, with no zero-crossing, confirming that the updraft suppresses incipient separation by sustaining near-wall momentum.
At , the most pronounced contrast emerges. Without updraft, drops to near zero () over the mid-chord region – at outboard stations and , with a slight negative excursion at , indicating vanishing wall shear stress consistent with the large separation plateau. The inboard station retains a small positive , suggesting that separation initiates from the wingtip and propagates inboard. Under updraft conditions, remains small but positive across the full chord at all spanwise stations, with no zero-crossing, corroborating the complete elimination of separation observed in the curves and pathline visualizations.
Notably, the separated regions are characterized by approaching zero rather than large negative values, which is attributable to the low Reynolds number of the present flow (): in the recirculation zone the near-wall velocity gradient becomes vanishingly small, yielding rather than substantial reverse shear. The spatial coincidence between the near-zero region and the separation plateau onset, with a deviation of less than chord, provides independent confirmation that the plateaus are indeed separation-induced rather than artifacts of compressibility or three-dimensional relief effects.
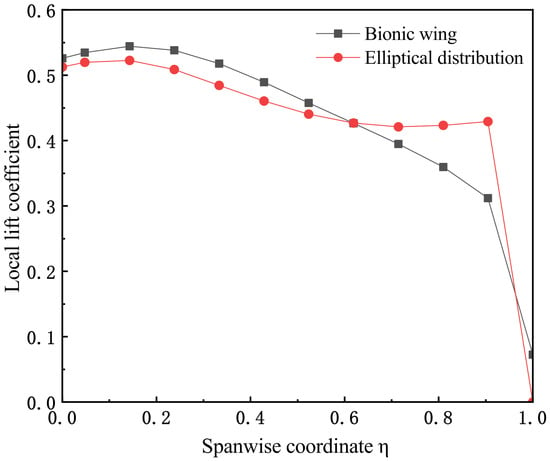
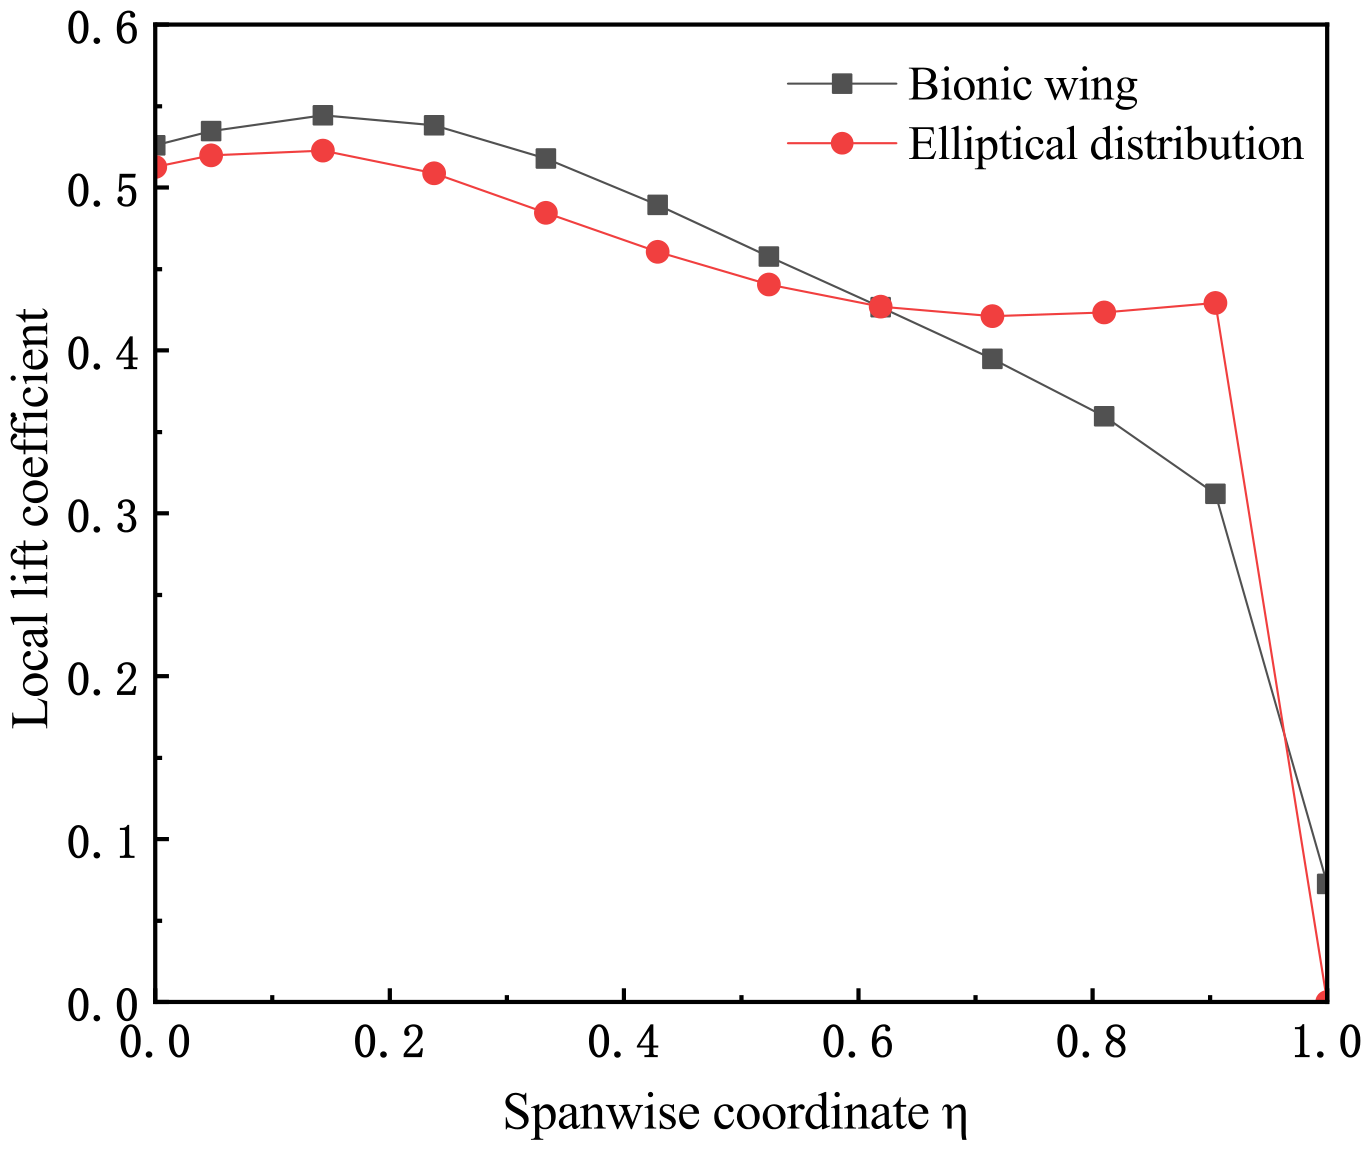
To quantitatively assess the aerodynamic efficiency of the frigatebird-inspired wing planform, the spanwise lift distribution is compared against the theoretical elliptical reference in Figure 27. The local lift coefficient is plotted as a function of the nondimensional spanwise coordinate , where corresponds to the wing root and to the wingtip.
Figure 27.
Spanwise lift distribution of the frigatebird-inspired wing compared with the theoretical elliptical distribution.
The bionic distribution closely tracks the elliptical reference over the inboard and mid-span regions (), with the local lift coefficient consistently – higher: the mean is 0.536 for (versus 0.516 for the ellipse) and 0.473 for (versus 0.453). The two curves intersect at approximately , beyond which the bionic wing exhibits pronounced tip unloading. In the outboard region (), the mean drops to 0.285, which is 10.6% below the elliptical value of 0.318; the disparity widens toward the wingtip, reaching at and at . Consequently, the outboard panel () accounts for only 38.1% of the total lift, compared with 41.4% for the elliptical wing, while the inboard region () carries 17.5% (versus 16.8%). Notably, the bionic wing retains a finite lift coefficient of at the wingtip (), in contrast to the zero value prescribed by the ideal elliptical distribution, suggesting that the slotted primary-feather configuration of the frigatebird wingtip sustains a residual load rather than fully unloading the tip.
Despite the visible deviation from the ideal ellipse, the induced-drag penalty is negligibly small. After normalizing both distributions to equal total lift, the integrated quantity for the bionic wing exceeds the elliptical reference by merely 0.65%, corresponding to an Oswald efficiency factor of . This near-unity value confirms that the frigatebird-inspired planform achieves aerodynamic performance essentially indistinguishable from the theoretical minimum-induced-drag configuration. The physical implication is that the bionic wing realizes a favorable trade-off between aerodynamic efficiency and structural load alleviation: by shifting approximately 3.3% of the lift from the outboard panel to the inboard region, it reduces the wing-root bending moment and structural weight while incurring virtually no induced-drag cost. This aerodynamic–structural coupling, enabled by the distinctive feathered wingtip geometry, constitutes a key design principle underlying the ultra-long-endurance gliding capability of frigatebirds and offers a quantitative benchmark for the layout optimization of low-energy bionic aircraft.
This chapter systematically investigates the aerodynamic regulation mechanism of marine updrafts on frigatebird-inspired wings through quantitative analysis of spanwise pressure coefficient distributions and velocity pathline characteristics at three typical angles of attack (, , and ). The results demonstrate that updrafts exert angle-dependent flow control effects, which fundamentally determine the ultra-long-endurance gliding performance of bionic wings.
At negative incidence (), fully attached flow is maintained across the entire wingspan under both inflow conditions. Updrafts intensify the leading-edge suction peak and extend the chordwise coverage of the negative pressure region, optimizing the spanwise lift distribution to approach the ideal elliptical pattern. This achieves simultaneous drag reduction and lift augmentation, constituting the optimal cruise regime for low-energy gliding. At moderate angle of attack (), incipient boundary layer separation occurs on the suction surface without updrafts, while updrafts completely suppress early separation and amplify the leading-edge suction effect, resulting in a lift increment exceeding . This confirms that is the high-efficiency lift operating point for the bionic wing in updraft environments. Most notably, at high angle of attack (), updrafts transform from simple lift enhancement to decisive stall suppression: while full-span deep stall occurs under uniform inflow, updrafts eliminate large-scale flow separation entirely by injecting additional momentum into the boundary layer, extending the stall angle by more than . The maximum lift increment of appears near the wingtip, which compensates for the insufficient tip load and further improves the spanwise load distribution.
The unified physical mechanism is revealed as follows: the vertical velocity component of updrafts increases the local effective angle of attack of each wing section, strengthens leading-edge flow acceleration, and supplies extra momentum to the boundary layer, enabling it to overcome severe adverse pressure gradients and avoid separation. These findings elucidate the core aerodynamic principle by which frigatebirds utilize marine updrafts to achieve uninterrupted ultra-long-range flight, and provide fundamental theoretical support for the design of low-energy long-endurance bionic gliding aircraft.
4. Conclusions
This study conducts a systematic numerical investigation into the coupled-attitude aerodynamic characteristics of frigatebird-inspired configurations (both clean wing and fuselage-equipped) within marine atmospheric updrafts, employing the RANS/k- SST turbulence model. The primary conclusions are outlined as follows.
The aerodynamic effects of marine updrafts demonstrate a pronounced dependence on pitch angle. Within , updrafts induce significant drag reduction (maximum 0.0984) and lift augmentation, even generating net thrust at specific negative angles. The gain originates from enhanced leading-edge suction, expanded suction-surface negative pressure, and elevated pressure-surface positive plateaus. Updrafts also optimize the spanwise lift distribution toward the ideal elliptical pattern (Oswald efficiency ), reducing induced drag. Above , updrafts suppress full-span deep stall and extend the stall angle by more than , with a maximum lift increment of 220% near the wingtip.
Pitch–yaw coupled attitudes create a high-efficiency aerodynamic window. Negative pitch angles yield superior drag reduction with stable lift (average ), while moderate positive pitch () combined with appropriate yaw yields a peak physically meaningful of 9.55. Apparent values exceeding this range arise from near-zero-drag numerical singularities. Yaw regulation exhibits strong attitude selectivity: it weakens gains at negative pitch, enhances lift at moderate positive pitch, and becomes negligible at large pitch.
Yaw static stability follows a nonlinear “stable–unstable–restabilized” transition. Local flow separation induces instability in , while progressive stabilization of separation bubbles beyond restores directional stability and delays the critical instability yaw angle from to .
Yaw–roll coupling reveals that the rolling moment is fundamentally sideslip-driven rather than roll-driven. At , separation patterns and pressure distributions remain symmetric on both wings; at , asymmetric separation bubbles—with a concentrated focus on the windward wingtip and a large recirculation zone on the leeward mid-span—directly break the pressure symmetry and generate the rolling moment. This mechanism is corroborated by surface limiting streamlines, skin friction coefficient distributions, and velocity vector plots, which collectively confirm the attached-flow state at and the separation-suppression effect of updrafts at high angles of attack.
These findings elucidate the core aerodynamic principle enabling frigatebirds to achieve ultra-long-endurance flight through efficient updraft utilization, and provide theoretical guidance for the design of low-energy bionic aerial vehicles. Future work will extend to non-stationary turbulent updrafts, flexible wing deformation, and multi-body aerodynamic interactions.
Author Contributions
Methodology, Y.C. and D.L.; resources, Y.C. and G.L.; formal analysis, Y.M.; investigation, Y.C.; writing—original draft, Y.C. and R.L.; writing—review and editing, Y.C., R.L., Y.M., G.L., D.L. and Y.T.; supervision, Y.C., R.L., Y.M. and D.L.; project administration, Y.C. and R.L. All authors have read and agreed to the published version of the manuscript.
Funding
This research received no external funding.
Data Availability Statement
All data supporting this research are included in the article.
Conflicts of Interest
The authors declare no conflicts of interest.
References
- Weimerskirch, H.; Bishop, C.; Jeanniard-du-Dot, T.; Prudor, A.; Sachs, G. Frigate birds track atmospheric conditions over months-long transoceanic flights. Science 2016, 353, 74–78. [Google Scholar] [CrossRef] [Scilit] [PubMed]
- Malkus, J.S. Some results of a trade-cumulus cloud investigation. J. Atmos. Sci. 1954, 11, 220–237. [Google Scholar] [CrossRef] [Scilit]
- Chen, L.; Yin, Y.; Xiang, Y.; Qin, S.; Liu, H. Optimal dynamic soaring trades off energy harvest and directional flight. iScience 2025, 28, 112540. [Google Scholar] [CrossRef] [Scilit] [PubMed]
- Upasena, K.; Weerathunga, U.; Abeygoonewardena, J.; Bandara, R. Design of a New Aircraft Wing Inspired by the Magnificent Frigate Bird. In Proceedings of the International Research Conference (KDU IRC); KDU: Ratmalana, Sri Lanka, 2019. [Google Scholar]
- Chu, L.; Gu, F.; Du, X.; He, Y. Design and Analysis of Morphing Wing UAV Adopted to Harsh Environment Based on “Frigate Bird”. In 2022 IEEE International Conference on Robotics and Biomimetics (ROBIO); IEEE: New York, NY, USA, 2022; pp. 1295–1300. [Google Scholar]
- Ropert-Coudert, Y.; Wilson, R.P. Trends and perspectives in animal-attached remote sensing. Front. Ecol. Environ. 2005, 3, 437–444. [Google Scholar] [CrossRef] [Scilit]
- Rattenborg, N.C.; Voirin, B.; Cruz, S.M.; Tisdale, R.; Dell’Omo, G.; Lipp, H.-P.; Wikelski, M.; Vyssotski, A.L. Evidence that birds sleep in mid-flight. Nat. Commun. 2016, 7, 12468. [Google Scholar] [CrossRef] [Scilit] [PubMed]
- Zheng, Y.; Rosenfeld, D.; Li, Z. Quantifying cloud base updraft speeds of marine stratocumulus from cloud top radiative cooling. Geophys. Res. Lett. 2016, 43, 11407–11413. [Google Scholar] [CrossRef] [Scilit]
- Wei, C.; Lin, G.; Huang, J.; Song, L.; Smith, H. Flight testing verification of lateral-directional dynamic stability of gliding birds due to wing dihedral. Aircr. Eng. Aerosp. Technol. 2022, 94, 29–44. [Google Scholar] [CrossRef] [Scilit]

Disclaimer/Publisher’s Note: The statements, opinions and data contained in all publications are solely those of the individual author(s) and contributor(s) and not of MDPI and/or the editor(s). MDPI and/or the editor(s) disclaim responsibility for any injury to people or property resulting from any ideas, methods, instructions or products referred to in the content. |
© 2026 by the authors. Licensee MDPI, Basel, Switzerland. This article is an open access article distributed under the terms and conditions of the Creative Commons Attribution (CC BY) license.