


Abstract
The safety-critical nature of aircraft landing gear has led to interest in Structural Health Monitoring (SHM) and Remaining Useful Life (RUL) methodologies for the fatigue substantiation of landing gear assemblies. Due to the engineering effort that can be required to implement such approaches, it is prudent to target SHM and RUL activities at specific aircraft fleets. This paper employs air traffic data in the form of Automatic Dependent Surveillance-Broadcast (ADS-B) data to characterise the occurrence and severity of ground turns performed across fleets of differing aircraft type, location and operator characteristics. From the evaluation of 3250 flights, it was observed at the fleet level that ground turn characteristics show limited sensitivity to the aircraft’s geographical location and operator characteristics, excluding cargo aircraft and those operated by Ultra-Low-Cost Carriers. However, assessment of individual aircraft highlighted that the occurrence rate of fatigue-critical pivot turns can exceed twice that of the remaining aircraft fleet, suggesting that SHM and RUL activities should be focused on aircraft that deviate significantly from the expected fleet-wide behaviour. Finally, this paper presents an initial investigation into inferring the Nose Wheel Steering angle provided from Quick Access Recorder flight data directly from ADS-B trajectories.
1. Introduction
During aircraft taxi, landing gear assemblies are required to sustain a large number of cyclic loads resulting from ground manoeuvres such as turning [1,2,3]. Due to the large variety in operator characteristics, route networks, airports served and operational conditions, significant per-flight variability exists in the occurrence and severity of such loads in-service [4]. Within aerospace structural design, landing gear components and assemblies are often deemed as fatigue critical, as a result of the applied cyclic loading, typically single-load path structures, material choices and safe-life design methodology [5,6]. Consequently, characterisation of the variability in ground manoeuvres performed by aircraft in service has been studied in prior work to support investigations into the development of more efficient landing gear structural designs with respect to system mass and design life [7].
Alongside prior studies into fleet-wide variability of landing gear loads [7,8] and the observed ground loads of individual aircraft [2,9,10], there have been recent research efforts regarding the development of Remaining Useful Life (RUL) and Structural Health Monitoring (SHM) methodologies, which provide an indication of the accumulation of fatigue damage whilst individual landing gear components are in-service [5]. Historic approaches to SHM and RUL focused on the application of additional sensors onto landing gear components for monitoring of strains [5,11,12] and such approaches have recently been supported by machine learning methods [13]. In parallel to instrumentation-reliant SHM approaches, there have also been investigations in exploiting data sources already available within commercial aircraft, such as the inference of landing gear loads and RUL from Flight Data Recorder time histories [14,15] along with RUL methodologies for light aircraft landing gear based on available operational records [16,17].
However, the development of SHM and RUL methodologies for aircraft landing gear can require significant engineering effort to realise [11,14]. Consequently, there are advantages to identifying specific aircraft or fleets to deploy such technologies on, in order to yield the greatest impact of SHM and RUL along with providing an indication of the transferability of observations of monitored assemblies across entire fleets. Consequently, there is also the need to develop lower-fidelity approaches to assessing the ground manoeuvres that landing gear are exposed to, to support the timely and efficient application of complete SHM and RUL methodologies. In addition to the large loads during landing that are typically considered in previous studies [15,18], landing gear loads occurring during ground turns compose a significant proportion of the loads to be considered in landing gear loading spectra for fatigue design [1,2,3]. Consequently, this paper will focus on characterising the variability present in ground turning manoeuvres.
In recent work, air traffic data in the form of Automatic Dependent Surveillance-Broadcast (ADS-B) ground trajectories has also been employed to characterise landing gear ground manoeuvres, including turns [4], deceleration cases [7] and loads related to surface roughness [19]. ADS-B position reports are also routinely synthesised with airport surface movement radar within Airport Surface Detection Equipment, Model X (ASDE-X) and Advanced-Surface Movement Guidance and Control System (A-SMGCS) systems, and prior studies have extracted trajectories and conducted initial investigations into aircraft ground manoeuvres based on these trajectories [20,21,22,23].
To further this prior work, along with facilitating a demonstration of the utility of air traffic data sources in the guidance of future SHM and RUL activities, an investigation into the sensitivity of ground turn manoeuvre statistics to aircraft size, geographical location and characteristics of the aircraft operator is required. Due to the wide global coverage of ADS-B data repositories, solely ADS-B trajectories will be used in the current study. Finally, this paper will also aim to explore routes to building statistical links between ADS-B trajectories and Flight Data Recorder parameter time histories to further support the leveraging of air traffic data to guide future SHM and RUL investigations.
2. Materials and Methods
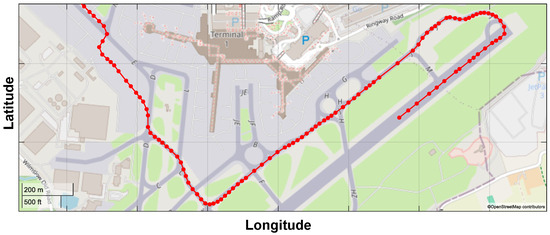
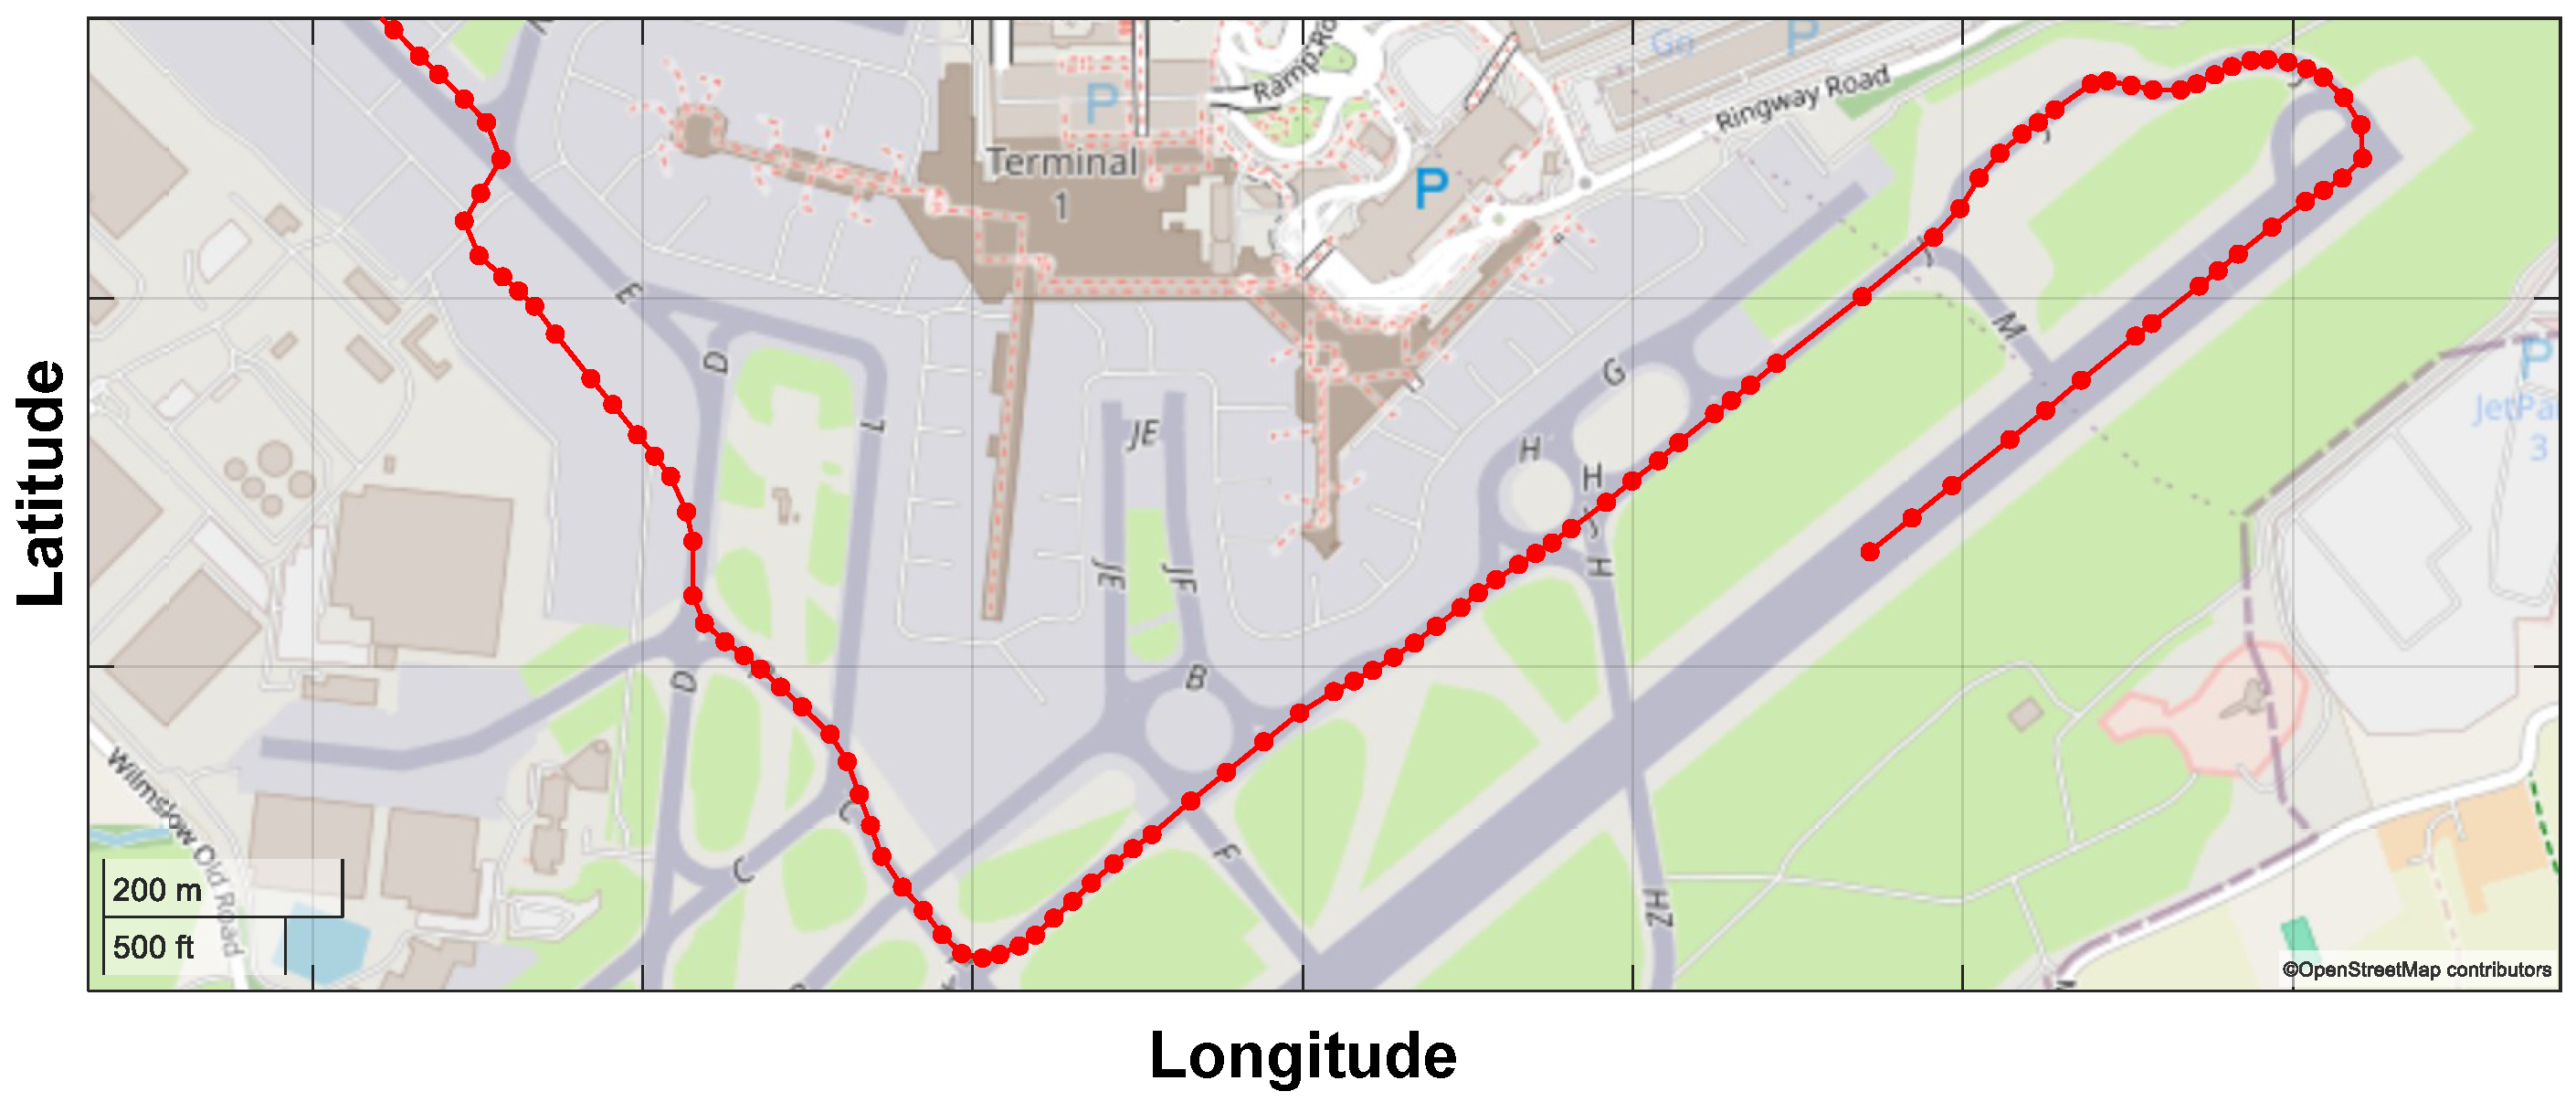
ADS-B ground trajectories of aircraft during taxi have been employed in prior work [4,8] and Figure 1 shows an example ADS-B trajectory for a pre-takeoff taxi phase. It can be observed in Figure 1 that the trajectories consist of latitude and longitude position reports and that turns on the taxiways and for the runway entry are clearly visible.
Figure 1.
An ADS-B ground trajectory of the pre-takeoff taxi phase of an aircraft. ADS-B data from Flightradar24 [24]. Map data from OpenStreetMap (https://www.openstreetmap.org/copyright (accessed on 4 March 2026)).
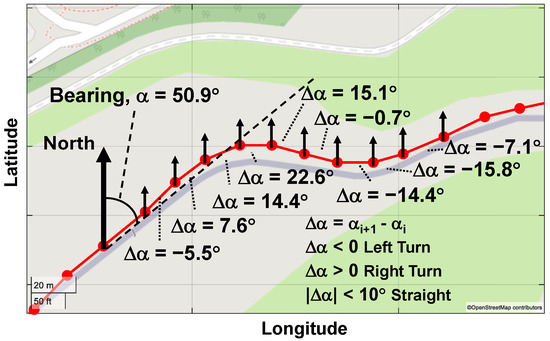
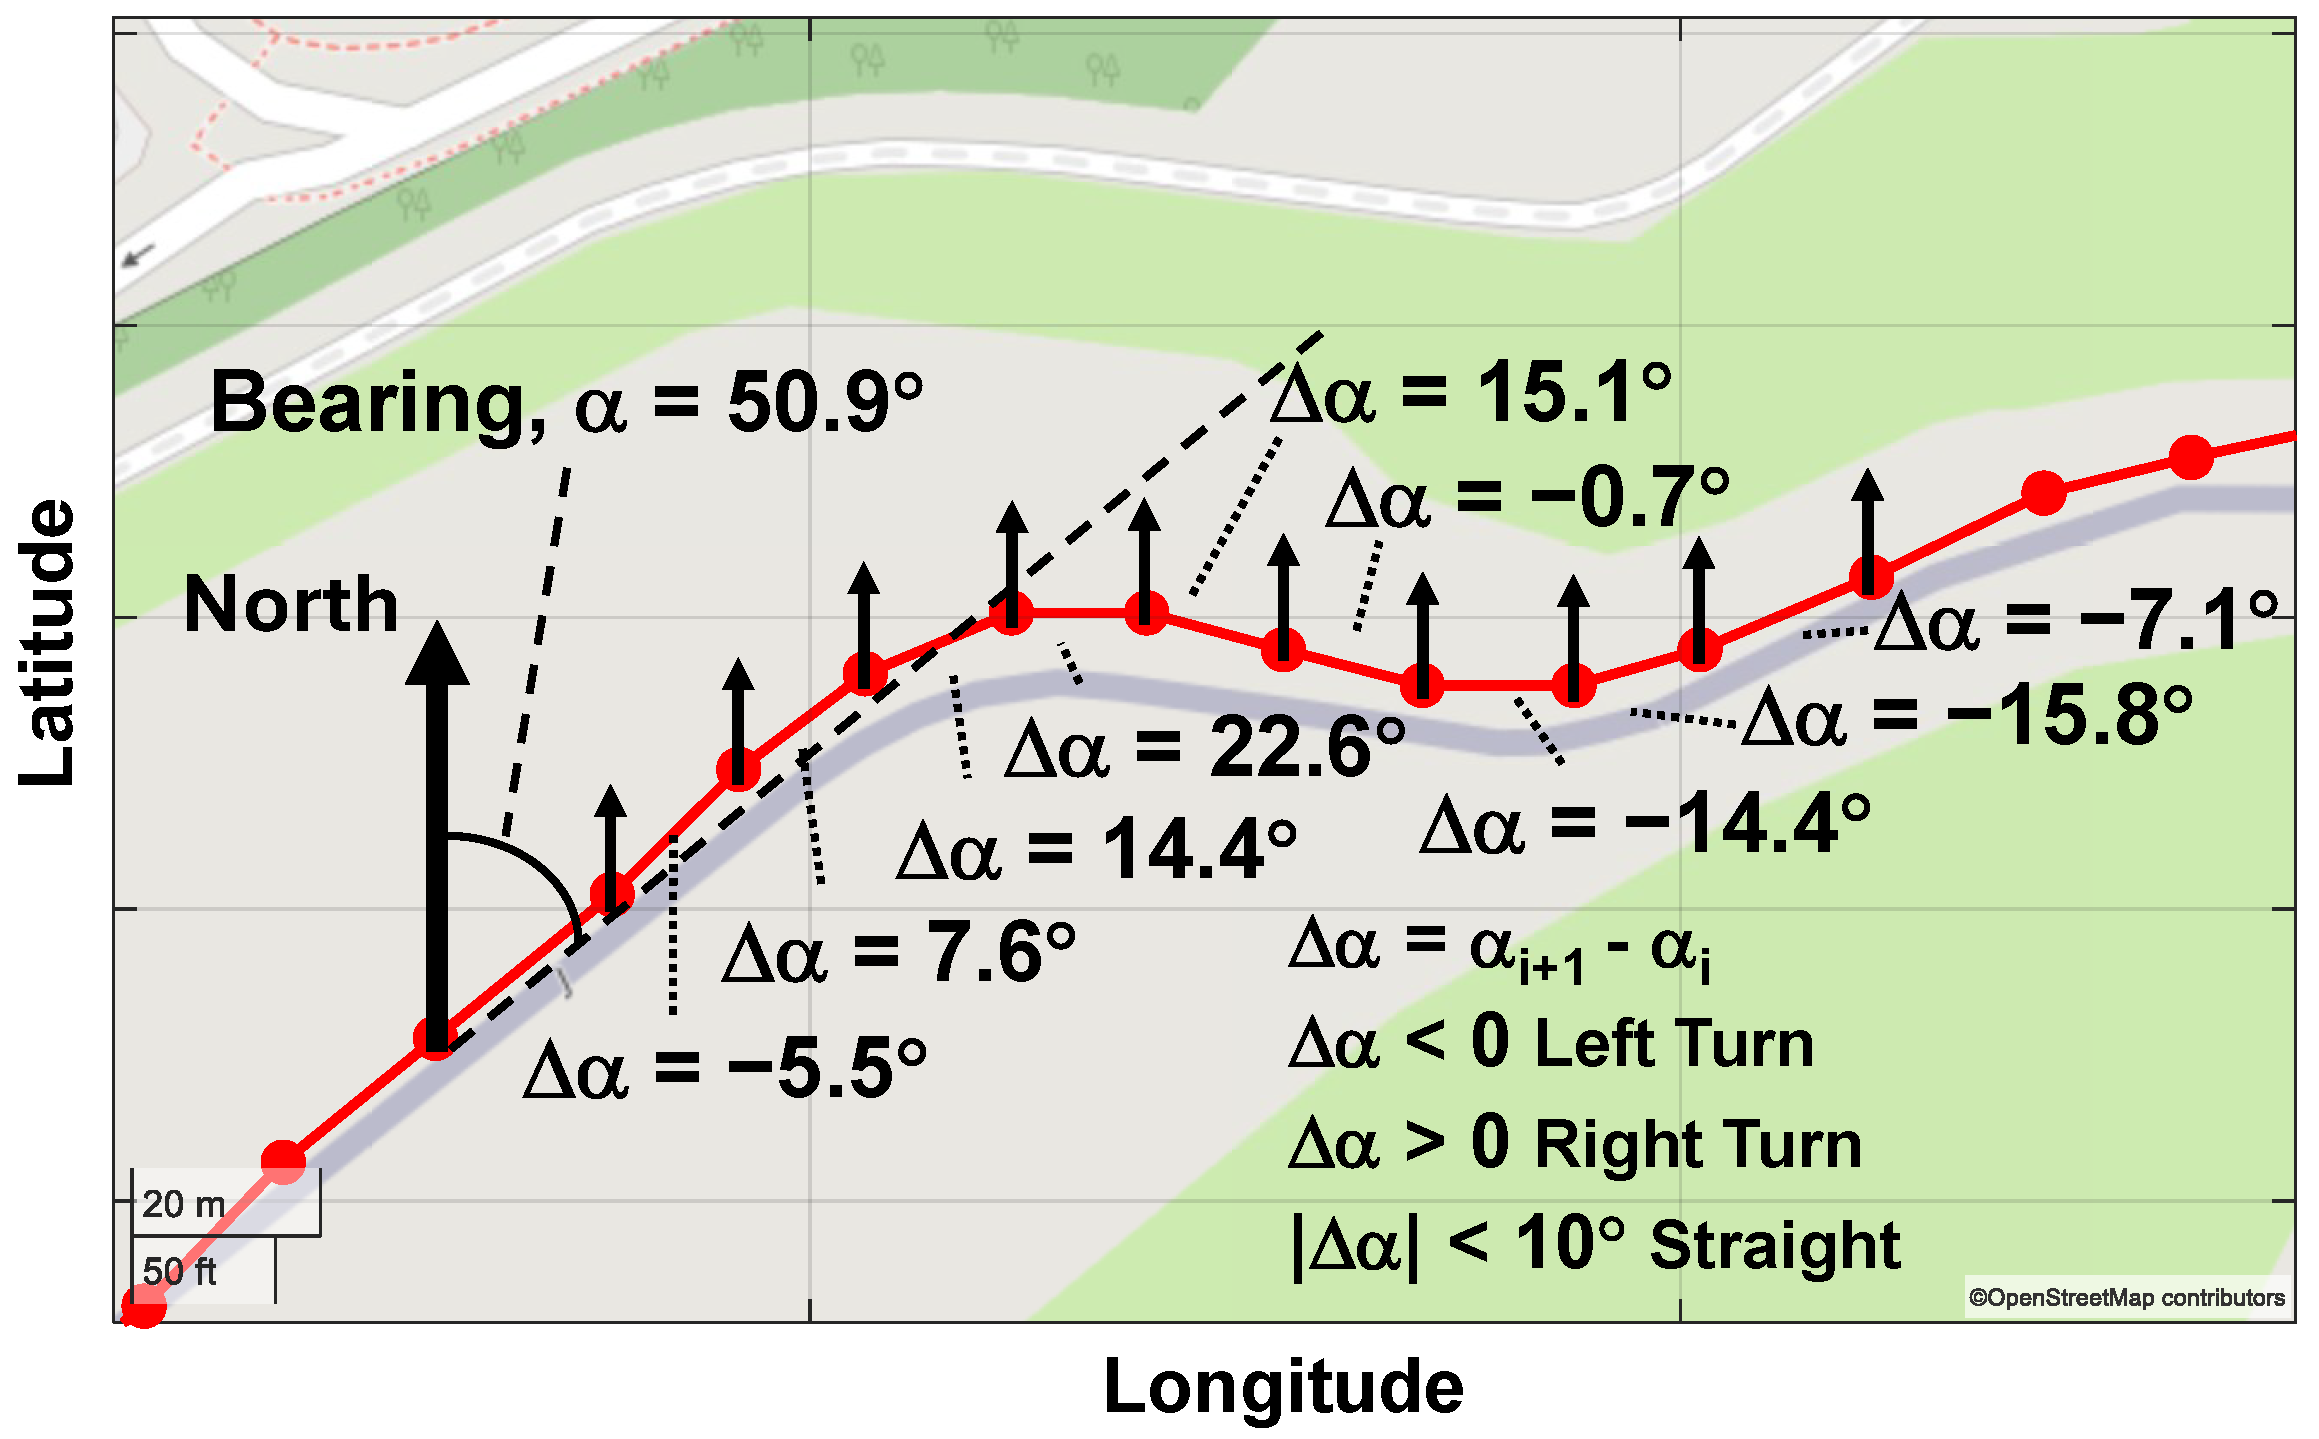
As described in prior work [4], identification of ground-turning manoeuvres within ADS-B trajectories can be automated through evaluating the changes in bearing between consecutive ADS-B position reports. The bearing between two latitude and longitude positions is referenced to North, as visualised in Figure 2.
Figure 2.
Bearing-derived identification of turns within ADS-B trajectories. ADS-B data from Flightradar24 [24]. Map data from OpenStreetMap (https://www.openstreetmap.org/copyright (accessed on 4 March 2026)).
The value of can be computed for each taxi segment between consecutive latitude and longitude positions, and 0 identifies a right turn, whilst 0 a left turn. Taxi elements consisting of the same sign are then grouped together to identify turn segments, and a turning manoeuvre is retained if it shows a bearing change and hence aircraft heading change in excess of 10°. This threshold is justified by prior work showing that straight taxi elements within ADS-B trajectories can demonstrate heading deviations of up to 2° during straight taxi and that standard airport geometries employ turns in excess of 30° [25].
2.1. Turn Characterisation from ADS-B Trajectories
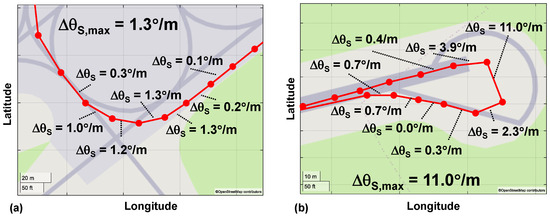
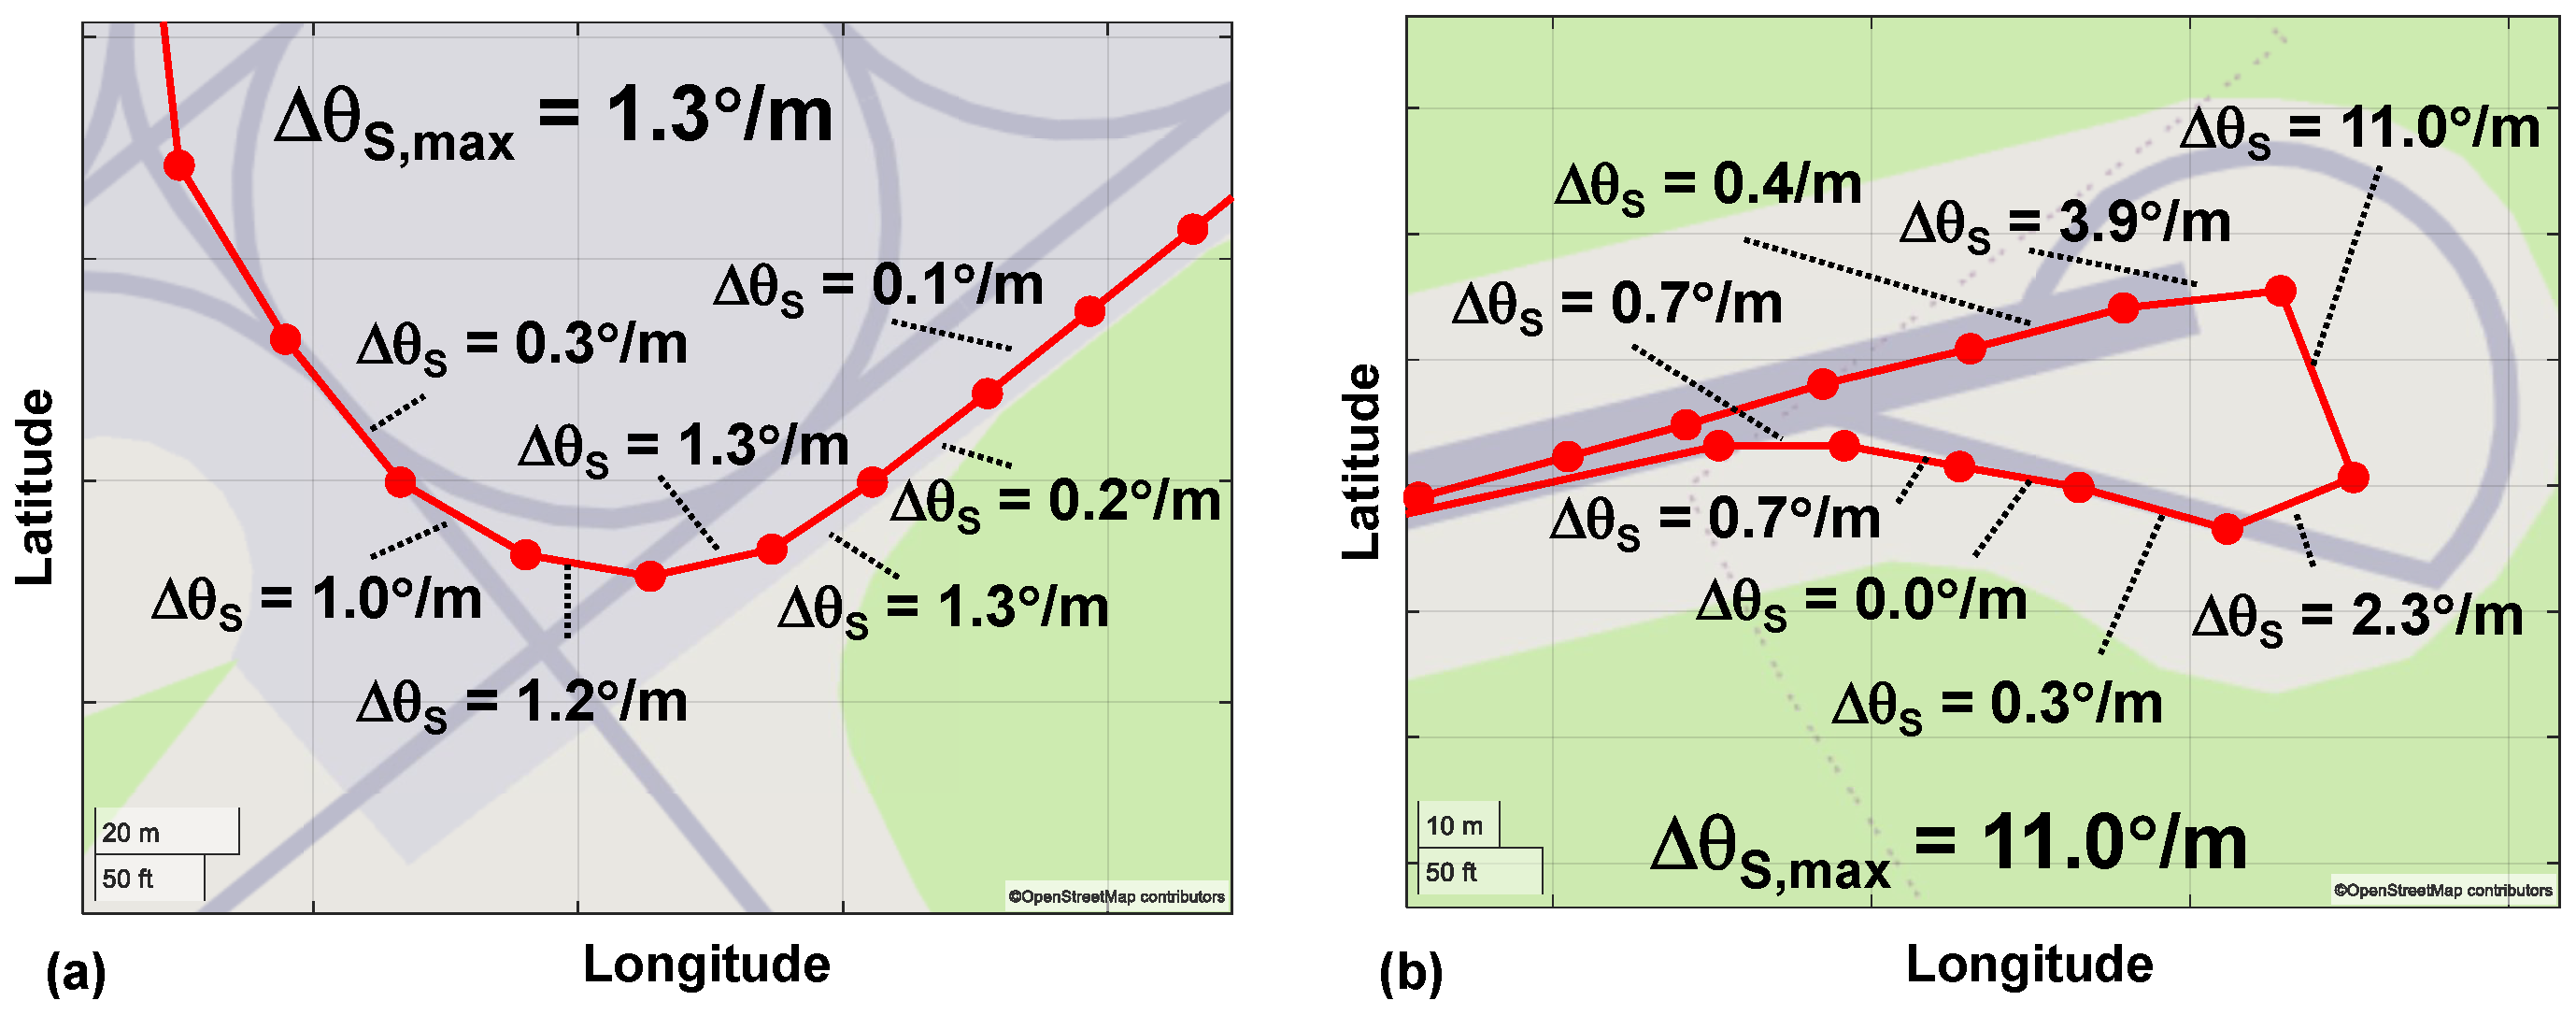
Beyond identifying the per-flight variability in turn occurrence, SHM, RUL and fatigue design approaches for aircraft landing gear can also be enhanced through identifying the variability in ground manoeuvre characteristics, especially the radii or ‘tightness’ of turns, where pivots or ‘u-turns’ can lead to large torsional loads within the landing gear assembly [2,4,26]. ADS-B trajectories can also be employed to characterise the severity or ‘tightness’ of a turn based on spatial statistics of the ADS-B positions observed within the turning manoeuvre. Previous work has highlighted that the maximum spatial turn rate , which represents how much the aircraft heading has changed for every metre travelled around the turn, can be used as a measure of turn severity [4].
Figure 3a shows the spatial turn rate for each segment of an ADS-B trajectory around a typical taxiway turn () and it can be observed that the maximum value observed across the trajectory segments is = 1.3°/m. However, when compared to a known pivot turn in Figure 3b, a maximum value of = 11.0°/m is observed at the apex of the turn, highlighting the severity and small turn radii of such a manoeuvre. Consequently, the value of identified for a turn can also be used to automatically characterise the severity of the taxiway turn and this is detailed further in Section 3.2.
Figure 3.
Examples of the spatial turn rate values for (a) standard taxiway turn and (b) a pivot turn. ADS-B data from Flightradar24 [24]. Map data from OpenStreetMap (https://www.openstreetmap.org/copyright (accessed on 4 March 2026)).
Impact of Sample Size
One of the challenges of employing ADS-B trajectories to characterise aircraft and aerospace system operational profiles is the need to source complete trajectories. As ADS-B data repositories currently require ground-based receivers to be able to collect ADS-B transmissions, this can limit the availability and quality of aircraft ground trajectories during taxi at certain locations [27]. Consequently, two approaches to ensuring complete and consistent ADS-B ground trajectories have emerged: either through the manual checking of trajectories prior to their inclusion into a study [8], or the use of map matching and smoothing approaches to transform sparse and noisy ADS-B trajectories into feasible taxi routes [28,29].
The study presented in this paper has employed the former route of manually reviewing ADS-B trajectories hosted by Flightradar24 [24] to ensure they are complete from the first forward motion of the aircraft after pushback until arrival on stand. However, such an approach represents a trade-off in sample size (i.e., the number of trajectories to include within a study) and the time required to collect the sample. The challenge of this trade-off is further amplified when studies intend to compare results across different aircraft fleets.
To date, there has been limited prior work to generate guidance on appropriate sample sizes when working with ADS-B data. This section aims to identify the impact on aircraft ground turn statistics when employing reduced sample sizes.
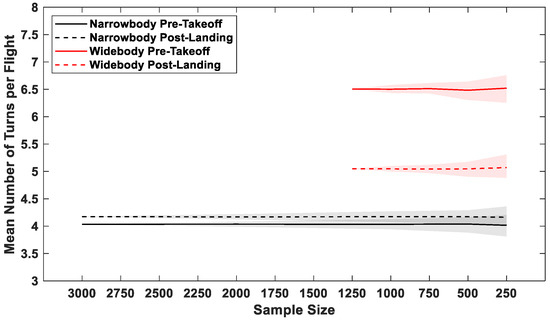
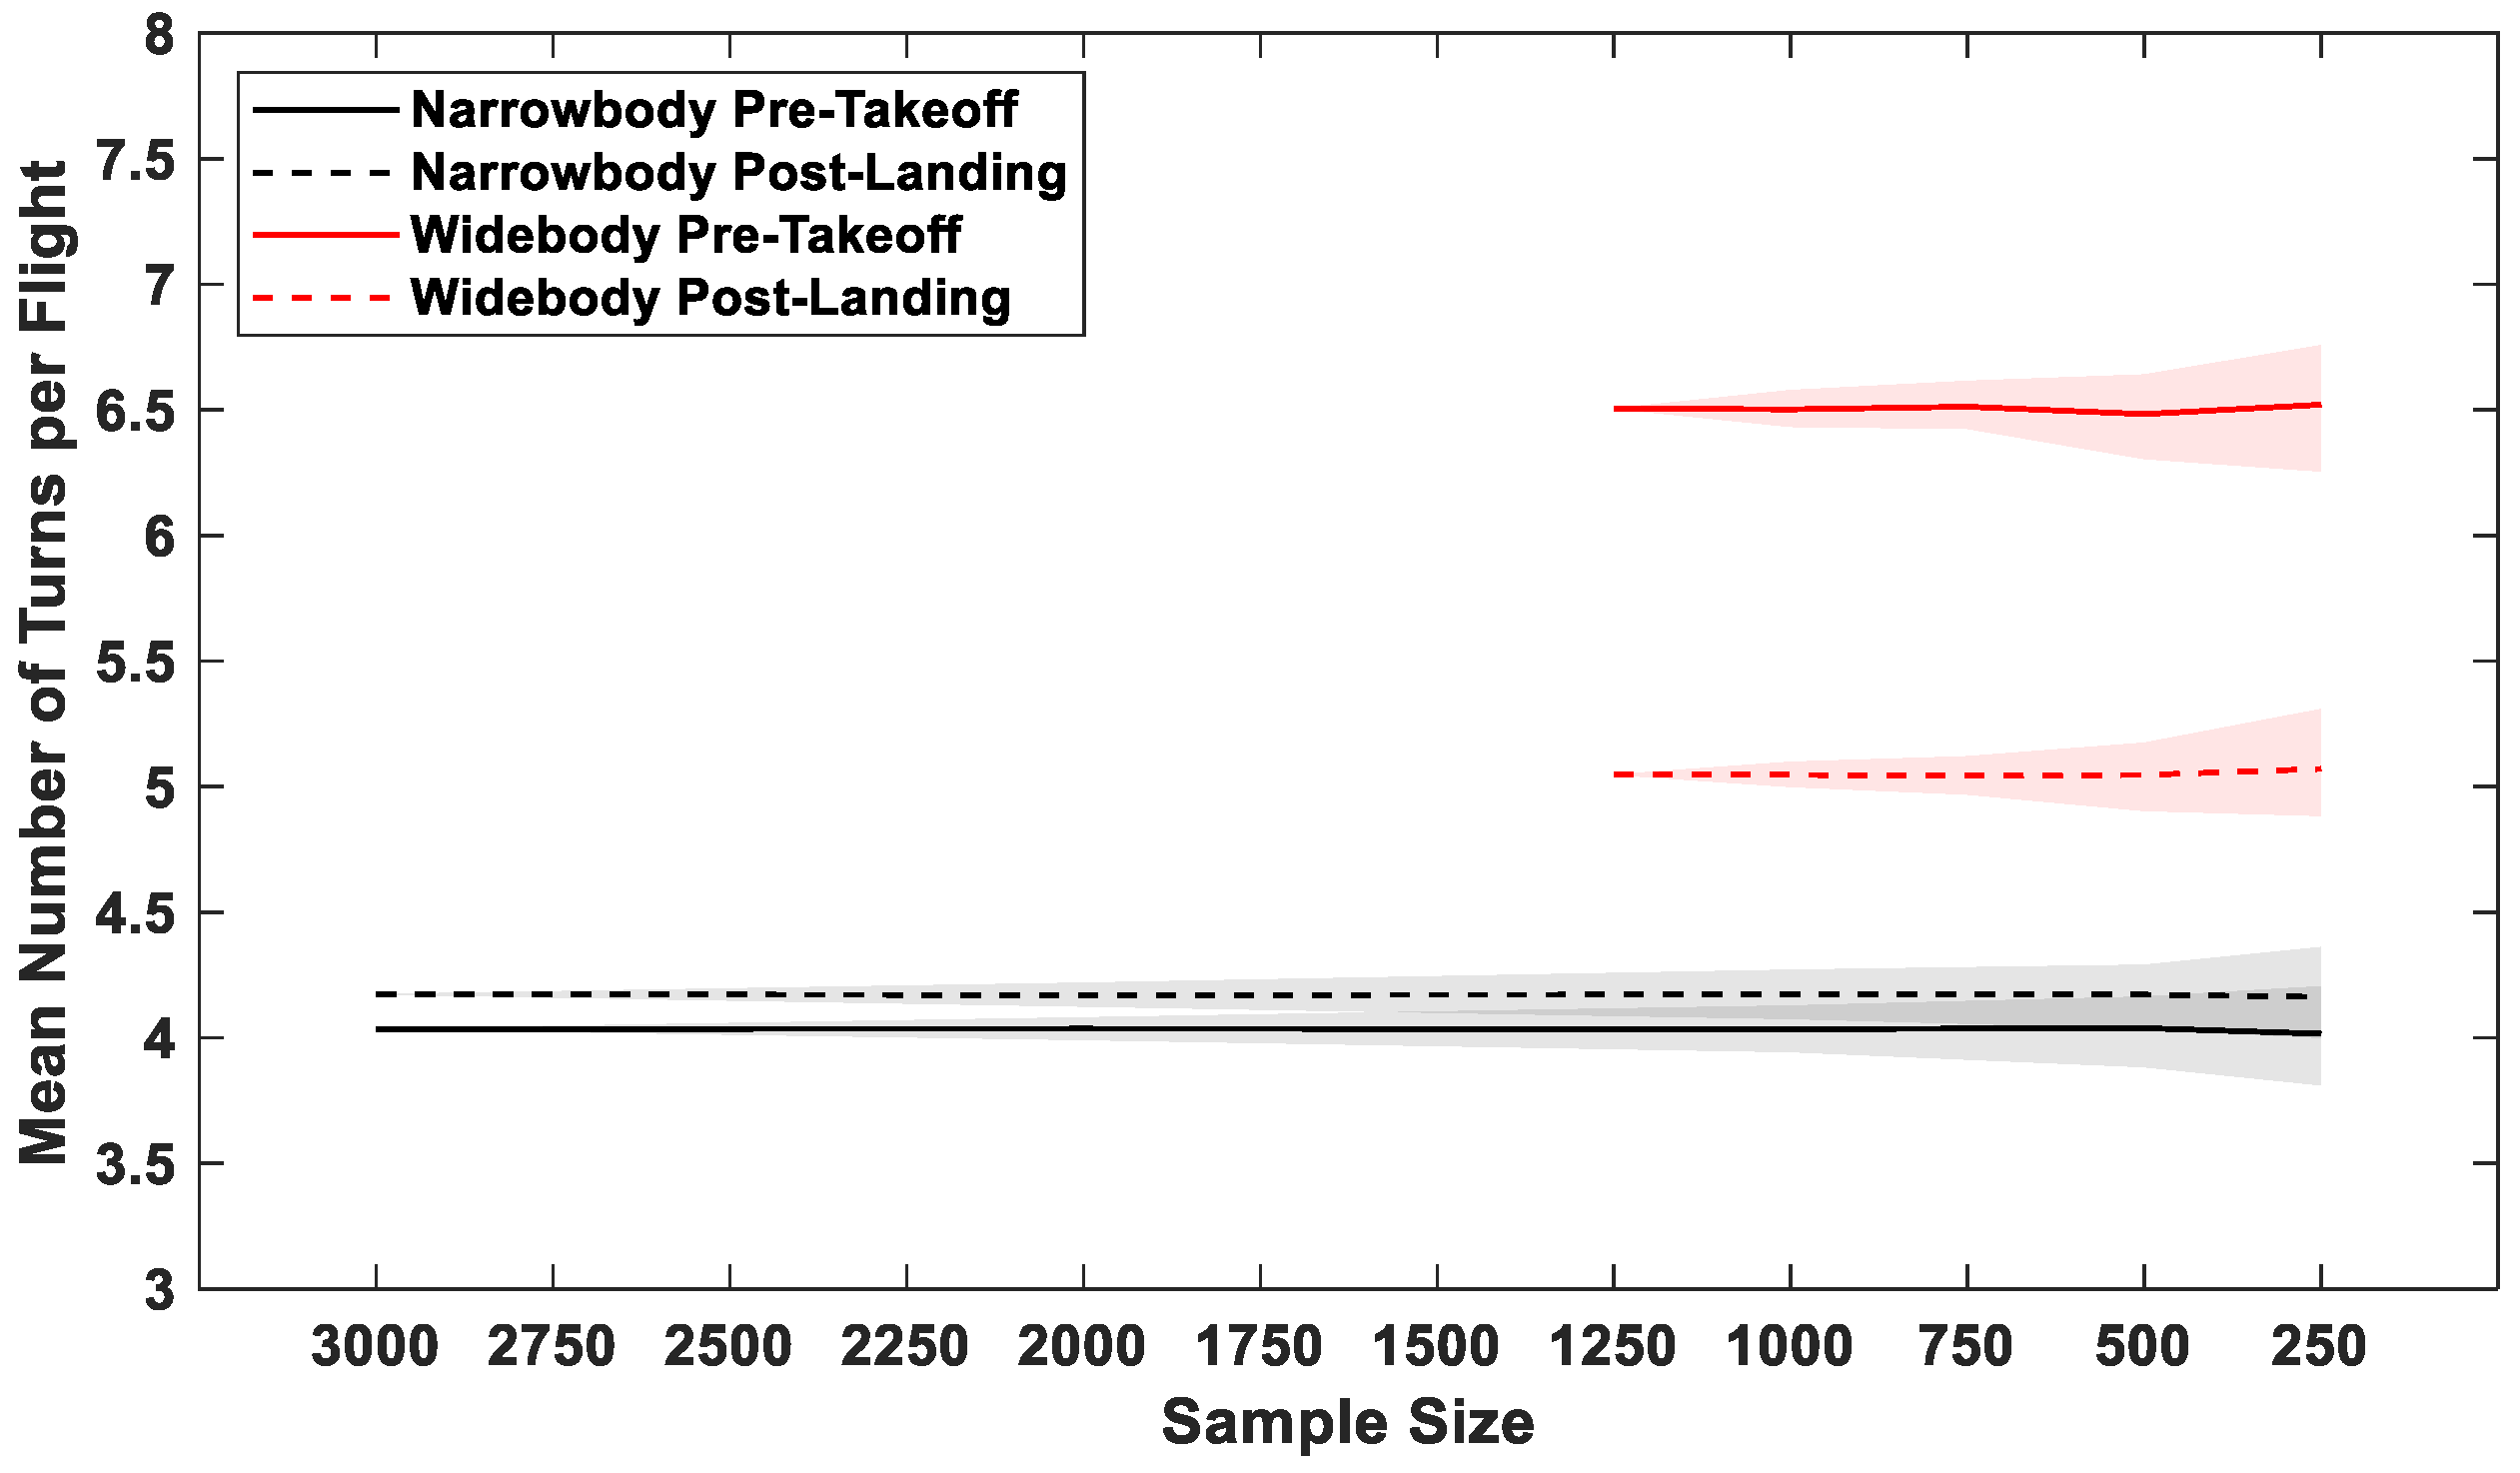
Prior work by the authors has considered datasets with a sample size of 1250 flights for a global fleet of widebody aircraft [7] and 3000 flights across six narrowbody aircraft [8]. In order to investigate the impact of reducing the sample size of these previous studies, random samples from the full populations were taken of differing sample sizes, and typical ground turn manoeuvre statistics were computed for each random sample. This was repeated 100 times for each sample size considered.
Figure 4 shows how the mean number of turns per flight varied for the narrowbody and widebody aircraft as the sample size was reduced. It can be observed from Figure 4 that the variability in the mean number of turns estimated by the 100 repeats for each sample size increased with reducing sample size, with the shaded regions of Figure 4 representing the 5/95% confidence interval. It can be observed from Figure 4 that even at a reduced sample size of 250, the mean number of turns at the 5/95% confidence interval did not decrease or increase to a lower or higher mean number of turns per flight.
Figure 4.
Variation in estimated mean number of turns per-flight with reducing sample size. Shaded region represents 5/95% confidence interval.
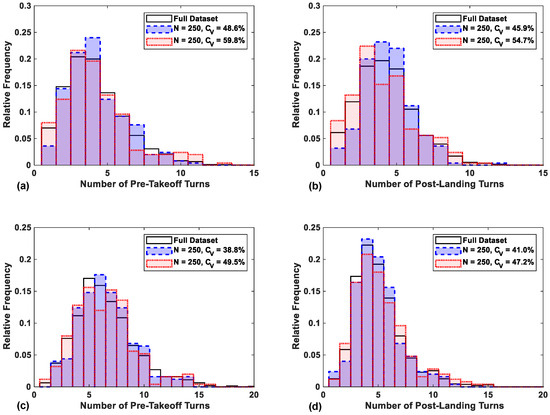
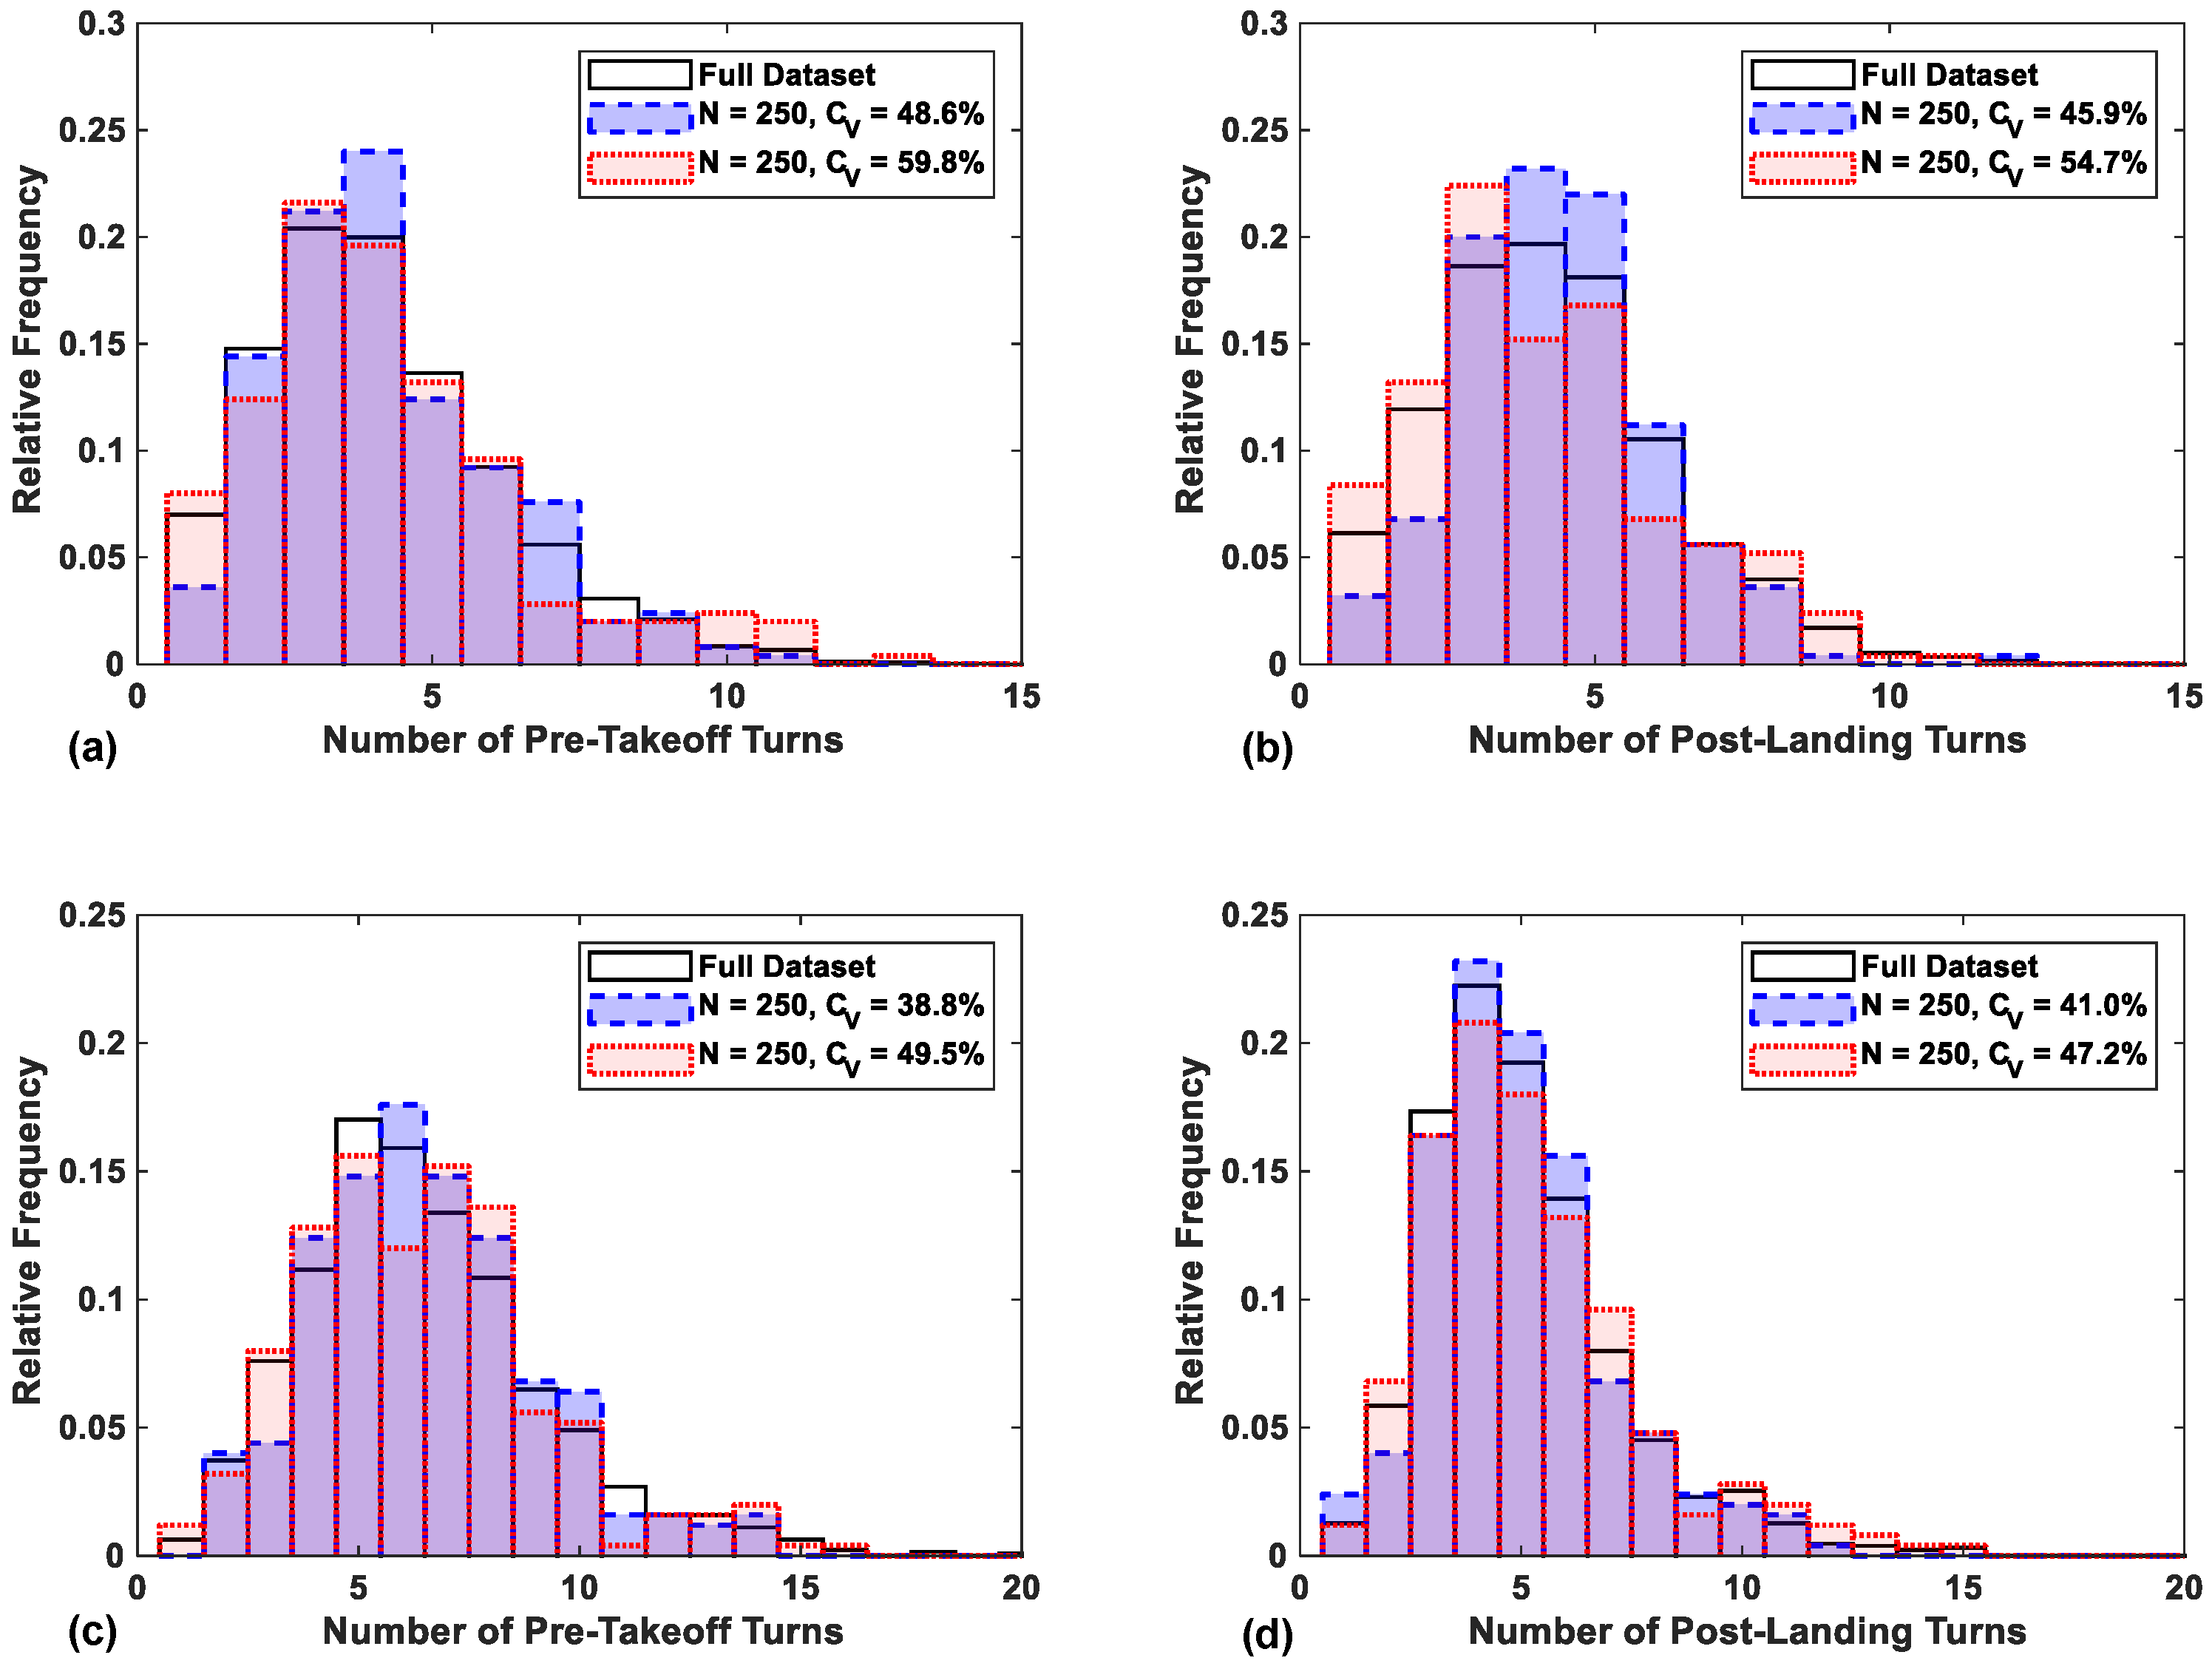
Beyond the mean number of turns per flight, the variation in the per-flight variability of turns with reducing sample size was also investigated. Figure 5 shows the per-flight turn occurrence histograms which demonstrated the minimum and maximum variability, as defined by the coefficient of variation, , for pre-takeoff and post-landing taxi phases for the narrowbody and widebody aircraft at the minimum investigated sample size of 250. It can be observed across Figure 5 that the range of , defined as the sample standard deviation divided by the mean, was ≈10% in all instances.
Figure 5.
Histograms of minimum and maximum estimated variability in turn occurrence at 250 for narrowbody (a) pre-takeoff and (b) post-landing taxi phases and widebody (c) pre-takeoff and (d) post-landing taxi phases.
Despite the range, the right-tailed histogram shapes were observed to be consistent, albeit with slight differences in the mode number of turns per flight when compared to the original dataset for the narrowbody pre-takeoff and post-landing turn occurrences at maximum value (Figure 5a and Figure 5b, respectively) and the widebody pre-takeoff turn occurrences in Figure 5c. It is important to note that the histograms shown in Figure 5 represent the extreme cases of minimum and maximum variability and that the majority of the 100 repeats at 250 would have more closely represented the distribution shape of the original datasets.
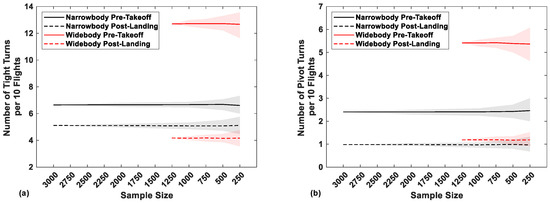
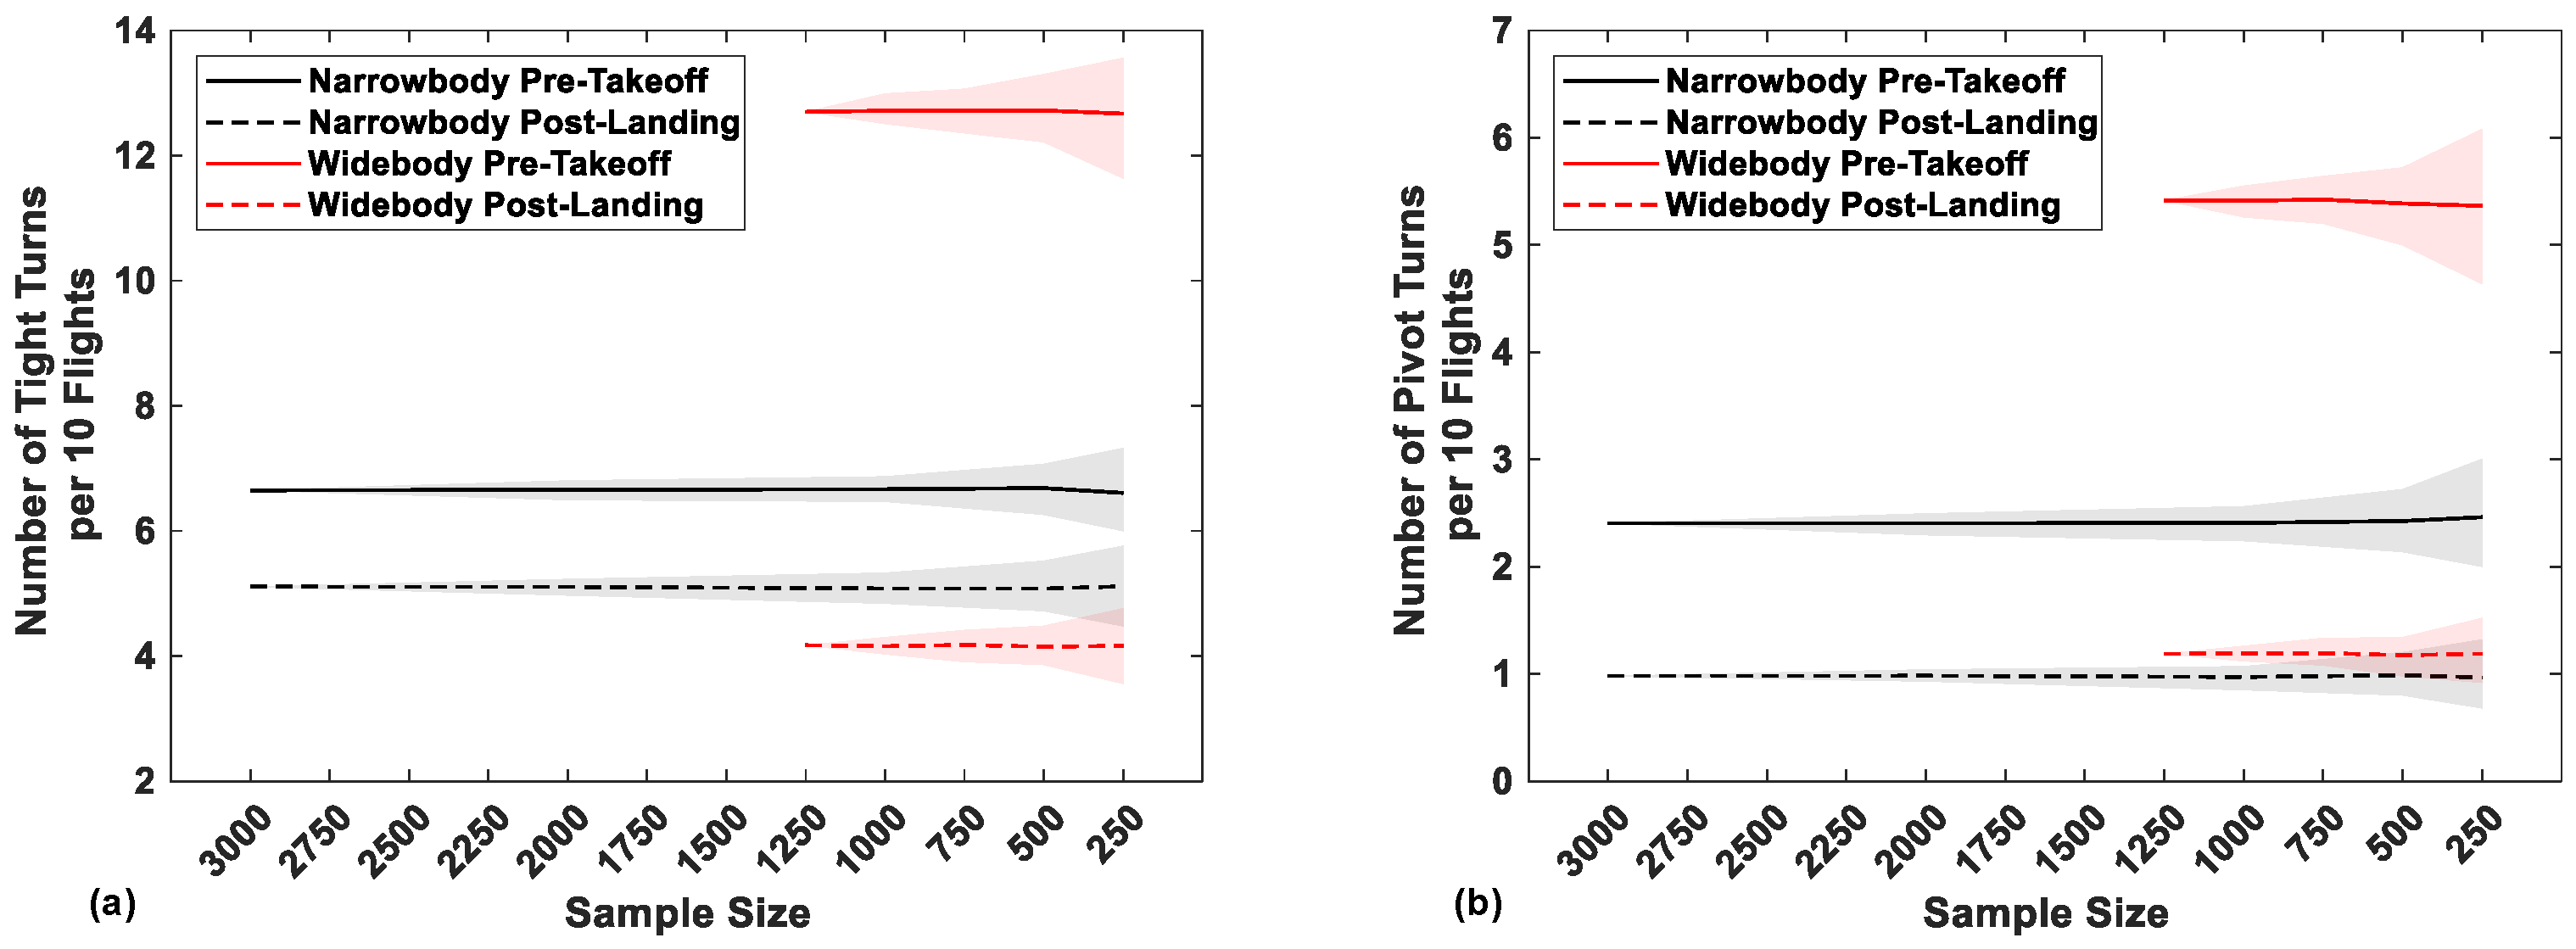
As highlighted in Section 2.1, the occurrence rates of fatigue-critical turns such as tight and pivot turns can also be extracted from ADS-B trajectories. Therefore, the variability in tight and pivot turn occurrence rate estimates for reducing sample size was also evaluated as shown in Figure 6a and Figure 6b, respectively. Similar to Figure 4, the variability in tight and pivot turn occurrence rates can be seen to increase with reducing sample size, with the shaded regions of Figure 6 representing the 5/95% confidence interval.
Figure 6.
Variation in estimated (a) tight and (b) pivot turn occurrence rates per 10 flights with reducing sample size. Shaded region represents 5/95% confidence interval.
At the smallest sample size of 250, it can be observed that this is the first sample size where the 5/95% confidence interval exceeds for the occurrence rate of pre-takeoff tight and pivot turns per 10 flights for the widebody aircraft in Figure 6a and Figure 6b, respectively. Consequently, 250 was selected as the smallest permissible sample size for the current study. In addition, as the sample size of 250 could lead to an error of in the per 10 flight occurrence rate of pivot turns, this threshold will also be applied as the definition of a difference in tight and pivot turn occurrence rates observed in Section 3.2. The selection of a sample size of 250 for each fleet included within this study is also consistent with a sample size adopted in prior work by Taltaud et al. [30].
2.2. Compiled ADS-B Trajectories Accounting for Geographical and Operator Characteristics
In order to compare ground turn manoeuvre statistics across fleets of differing aircraft type, geographical location and operator characteristic, the aircraft fleet lists available from Flightradar24 [24] were first compiled into global narrowbody (typically up to 200 passenger seats) and global widebody (in excess of 200 passenger seats) categories. It is important to note that regional aircraft (typically up to 100 passenger seats) were not included within this study and are considered in prior work [8].
As the capture of ADS-B trajectories is reliant on line-of-sight, there are specific global locations and airports that do not currently have sufficient ground coverage to capture aircraft taxi routes via ADS-B. Consequently, narrowbody and widebody aircraft from North America and Europe were retained within the fleet lists, due to the increased ADS-B ground coverage observed in these locations. Assignment of individual aircraft to the North American and European narrowbody and widebody fleet lists was achieved through reviewing aircraft registrations and the geographical location of the aircraft operator.
The North American and European aircraft lists for both narrowbody and widebody fleets were then further decomposed into aircraft operator characteristics. The definition of such operators evolved from those employed in prior work [4]:
- Full Service Carrier (FSC)—typically based at larger primary airports;
- Low-Cost Carrier (LCC)—typically focused on secondary airports and point-to-point routes. For this study, this included operators detailed as ‘charter’ or ‘leisure’ operators;
- Ultra-Low-Cost Carrier (ULCC)—extensive use of secondary airports;
- Cargo operator;
The operator of each individual aircraft was reviewed against the criteria above and assigned to a fleet list for the relevant operator characteristic. Table 1 shows a summary of the resulting fleet lists.
Table 1.
Geographical and operator fleets included within the study.
From Table 1, it can be observed that available aircraft were consistent across North America and Europe, and narrowbody cargo aircraft were not included due to the limited number of aircraft present in the fleet list for these categories. It is also interesting to note from Table 1 that LCC widebody operators were only identified in Europe, and this is expected to be as a result of the presence of a large number of identified charter and leisure operators in Europe.
For each of the 11 fleet lists shown in Table 1, 250 flights were sampled across 2024 and 2025, by randomly sampling an aircraft registration from a fleet list, and then randomly sampling a month, day and sector leg flown by the aircraft in order to identify a trajectory to download from Flightradar24 [24]. When sampling a flight, the ground trajectory was visually inspected to ensure it was complete (from at least the moment of first aircraft movement after pushback to arrival on stand) and in the event the ground trajectory was not complete, the chronologically nearest flight was selected. This process resulted in 250 pre-takeoff and 250 post-landing trajectories being available across each of the fleets identified in Table 1. The trajectories were each processed using the methodology described within this section, and statistics relating to the number of turns per taxi phase and the characteristic of each identified turn were generated. It is important to note that the term “fleet” within this paper refers to the aggregation and classification of individual registered airframes into the categories shown in Table 1 and does not constitute the fleet of a single operator or aircraft type.
Verification of Methodology
Following assembly of the ADS-B trajectories, verification of the methodology was performed through comparing the turns identified by the methodology to those manually identified from the ADS-B trajectory. Consistent with prior studies by the authors [4,7,8], 10% of the flights for each fleet shown in Table 1 were manually reviewed, leading to the manual verification of 550 ground trajectories evenly distributed between pre-takeoff and post-landing taxi phases.
Across all inspected flights, the methodology is able to correctly identify the turns present in 78.2% of all pre-takeoff taxi phases and 86.4% of post-landing taxi phases, and these rates are consistent with prior studies [4,8]. Sources of error when employing the methodology and their impact on the presented results will be discussed further in Section Limitations and Future Work. It is of interest to note that a single fleet from Table 1, European widebody cargo aircraft, presented both the lowest and highest verification rates at 72.0% for the pre-takeoff phase and 96.0% for the post-landing phase.
2.3. Linking of ADS-B Trajectories to Flight Recorder Data
The growing interest in Structural Health Monitoring (SHM) of aircraft landing gear has led to prior work investigating the utility of aircraft Flight Recorder Data in identifying and characterising aircraft ground manoeuvres along with the estimation of loads carried by landing gear assemblies in service [15,31].
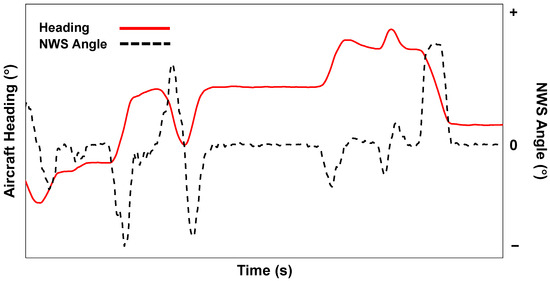
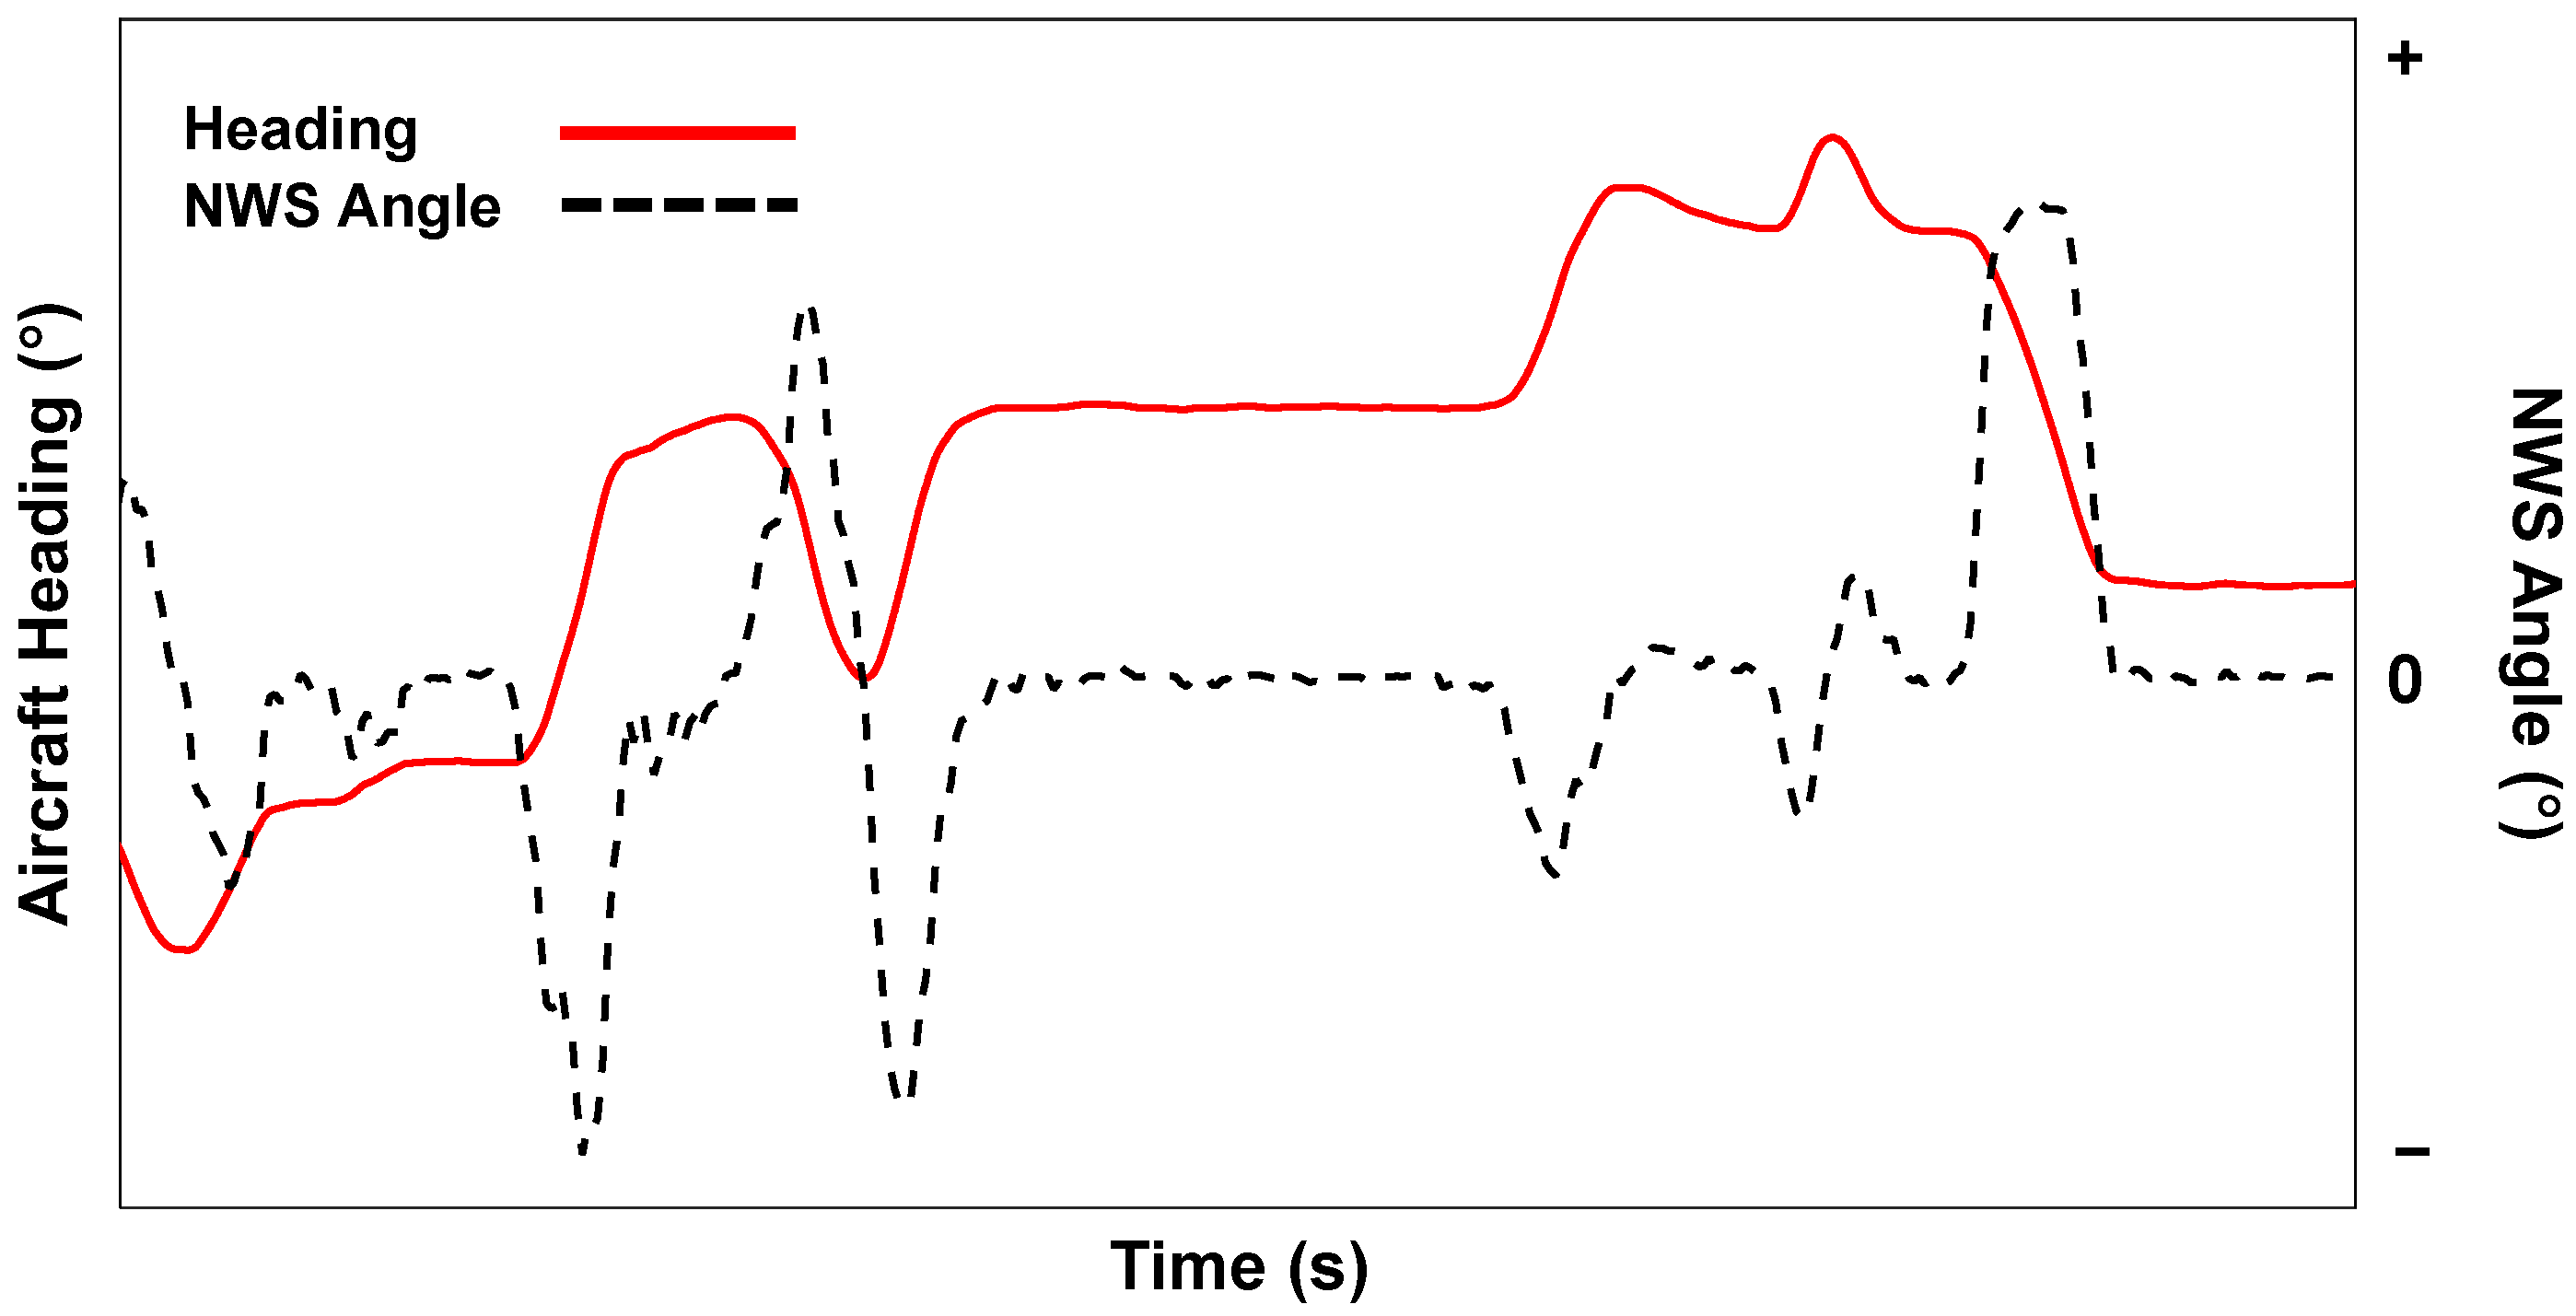
Quick Access Recorder (QAR) data is a subset of Flight Data Recorder outputs, and provides time histories for recorded aircraft performance and system parameters for a given flight [31] and an example of how an aircraft’s heading changes during ground turns in response to Nose Wheel Steering (NWS) commands is shown in Figure 7.
Figure 7.
Example of anonymised and de-sensitised QAR parameter time histories showing aircraft heading changes during ground turns in response to NWS input.
The NWS values observed during a turn can give an indication of the turn severity [3,32], with larger NWS values resulting in tighter turns. Within the Optimised Life for Landing Gear Assemblies (OLLGA) project [31], QAR parameter time histories for a large number of flights of a given aircraft type have been available for inclusion within this study. Consequently, this study also aimed to explore the feasibility of inferring QAR parameters associated with ground turns from ADS-B trajectories. Such an approach would permit detailed aircraft system parameters, which can often be challenging and time-consuming to obtain, to be estimated from more readily available yet lower fidelity ADS-B trajectories. Prior studies have investigated the inference of QAR-identified single-engine taxiing events [33], helicopter gearbox torque profiles [34], aircraft performance parameters [35] and fuel flow data from ADS-B trajectories [36].
The development of statistical models to link ADS-B trajectory parameters and QAR parameters required the identification of flights within the available QAR dataset that had both QAR time histories and ADS-B trajectories available. Once this pairing had been completed, individual turning manoeuvres were identified in both the QAR NWS parameter time history and the ADS-B trajectory for a flight, with verification of temporal and positional consistency to ensure the correct matching of turns was performed.
For each identified turn, the maximum NWS angle occurring within the turn was recorded, along with the various ADS-B-derived turn parameter statistics detailed in prior work [4], including the maximum spatial turn rate . The available QAR and ADS-B data resulted in the assembly of approximately 500 turns available with paired maximum NWS values and ADS-B-derived parameters across both pre-takeoff and post-landing phases.
The resulting relationship between the maximum NWS values and ADS-B-derived parameters is discussed fully in Section 3.4. Within this paper, it is important to note that usage restrictions on the QAR data have resulted in anonymised and de-sensitised results being reported and shown.
3. Results
This section will present and discuss the results from characterising the ground turns observed in the 250 flights associated with each fleet to establish the differences in the manoeuvre characteristics between each fleet.
3.1. Variability in Turn Occurrence Rates
The first selection of statistics generated from processing the ADS-B ground trajectories concerns the number of turns performed by aircraft within the pre-takeoff and post-landing phases. The variability in the number of pre-takeoff and post-landing turns per flight can be visualised using histograms and further decomposed from the top-level narrowbody and widebody fleets, into the variability observed for each of the 11 fleets identified previously in Table 1.
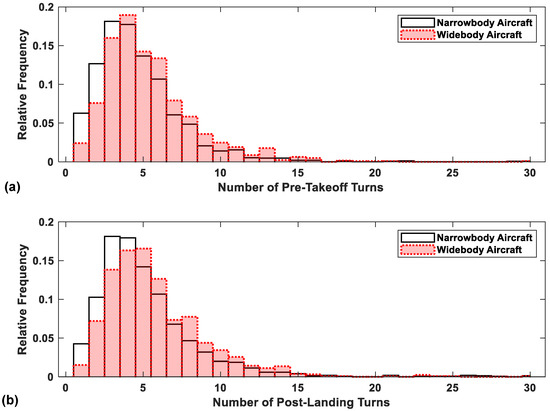
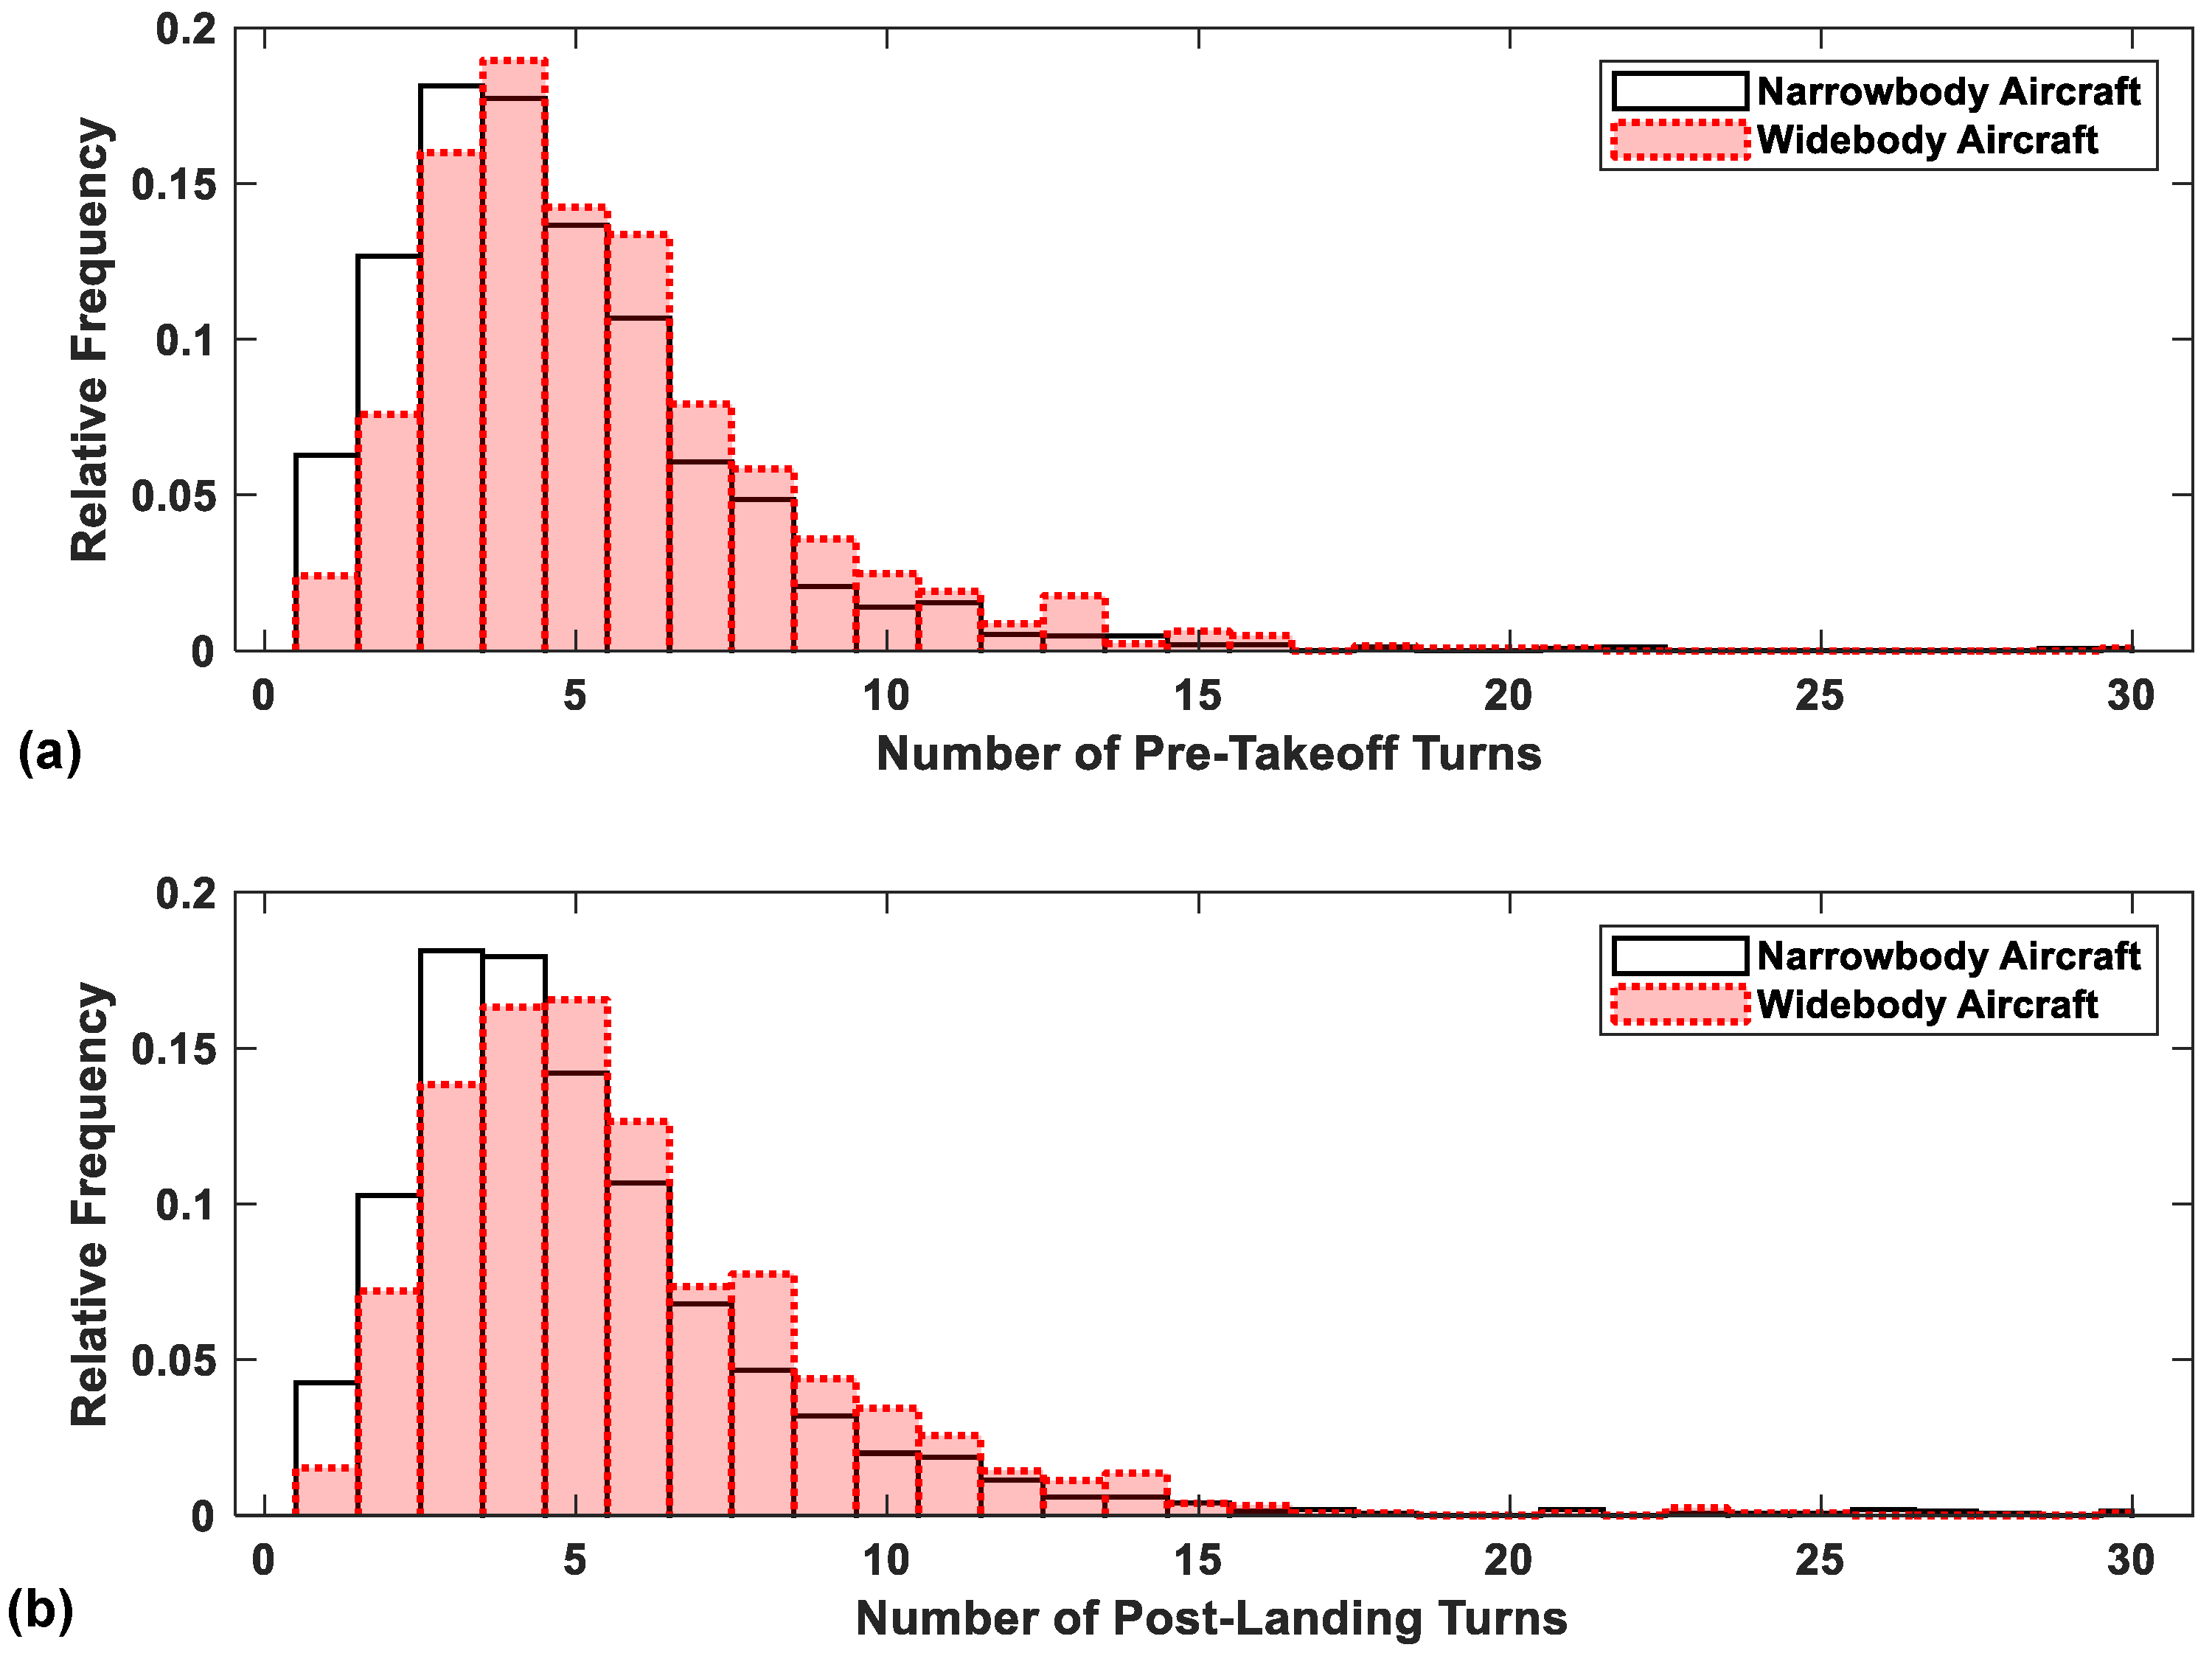
The histograms shown in Figure 8a and Figure 8b show the variability in the number of pre-takeoff turns and post-landing turns, respectively, for both the narrowbody and widebody fleets.
Figure 8.
Histograms of per-flight (a) pre-takeoff turn occurrences and (b) post-landing turn occurrences for narrowbody and widebody aircraft.
From Figure 8a, it can be observed that the narrowbody fleet has a mode number of pre-takeoff turns of three, compared to the mode of four for widebody aircraft. These values are consistent with prior studies into regional turboprop and jet aircraft, which showed a mode pre-takeoff number of turns of four [8]. Concerning the per-flight variability in the number of pre-takeoff turns performed, it was identified that 60% of narrowbody flights demonstrated a greater number of turns than the mode value, compared to 54% of flights for the widebody fleet. Whilst the spread in the number of pre-takeoff turns per flight is similar across the narrowbody and widebody fleets, when combined with the higher mode number of turns for the widebody pre-takeoff turn occurrences, it is suggested that the landing gear assemblies of widebody aircraft will be exposed to a higher number of loads associated with ground turns when compared to narrowbody aircraft on a per-flight basis.
Figure 8b demonstrates that the mode numbers of post-landing turns per flight were identified as three and five for the narrowbody and widebody aircraft, respectively. This suggests that widebody aircraft perform an increased number of turns in the post-landing phase compared to pre-takeoff. The reduced consistency between aircraft types also mirrors the difference in mode turn occurrences observed for regional turboprop and jet aircraft [8]. Also of interest is that the narrowbody fleet demonstrated an increase in the variability in the number of post-landing turns per-flight, with 65% of flights having a greater number of turns than the mode, compared to only 44% for the widebody fleet in the post-landing taxi phase.
Geographical Impacts
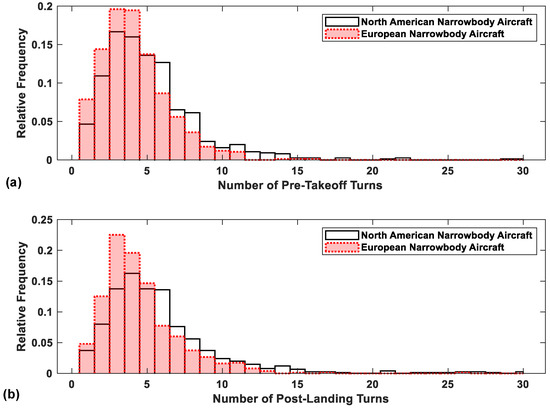
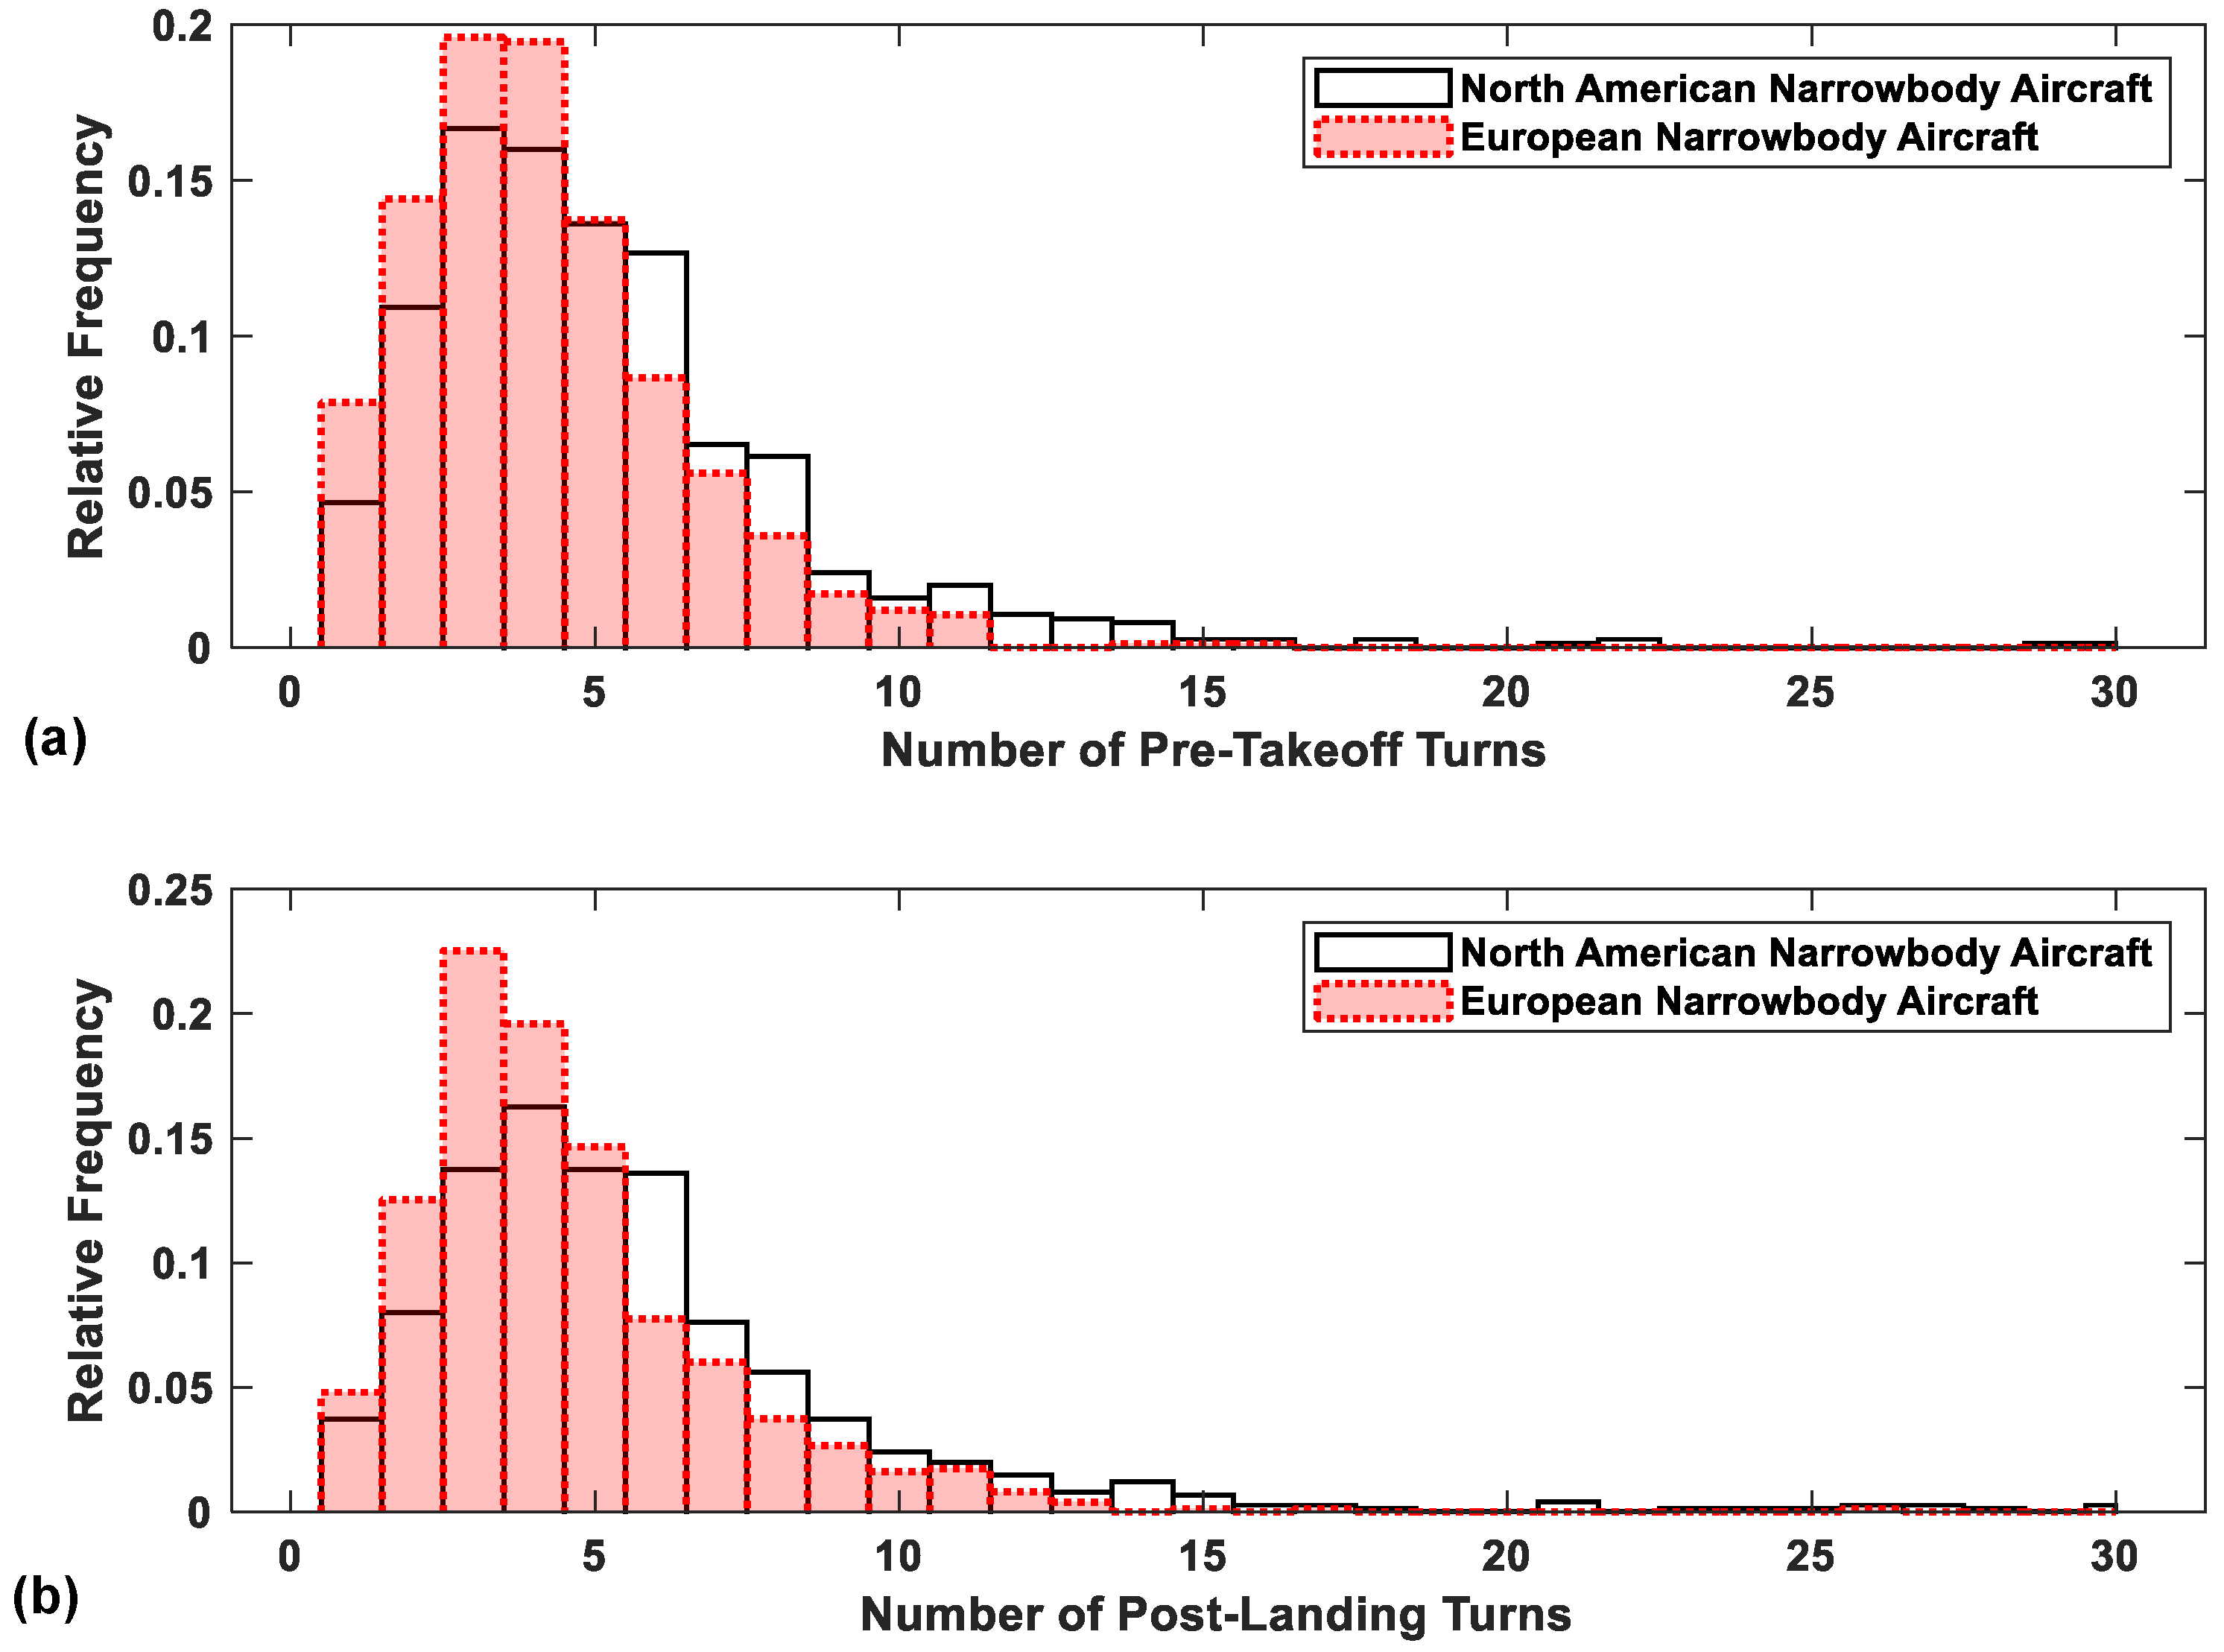
The impact of a narrowbody aircraft’s geographical location could be identified through isolating the available trajectories into flights relating to narrowbody aircraft, and then segregating these into North American and European fleets. Figure 9a demonstrates that whilst the North American and European fleets demonstrate a mode of three pre-takeoff turns per flight, there is increased right-tail spread in the number of turns for the North American fleet.
Figure 9.
Geographical impact on (a) pre-takeoff turn occurrences and (b) post-landing turn occurrences for narrowbody aircraft.
A similar trend is observed for the per-flight variability of post-landing turns in Figure 9b and it is important to note that the North American narrowbody fleet shows a higher mode number of post-landing turns of four compared to the European narrowbody fleet of three. This is expected to be a result of North American airports typically having larger and more complicated geometries compared to European airports [37].
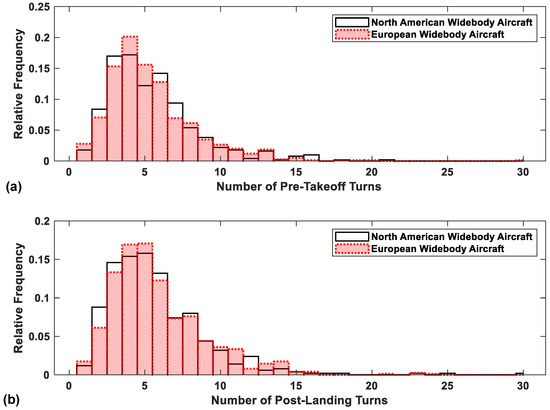
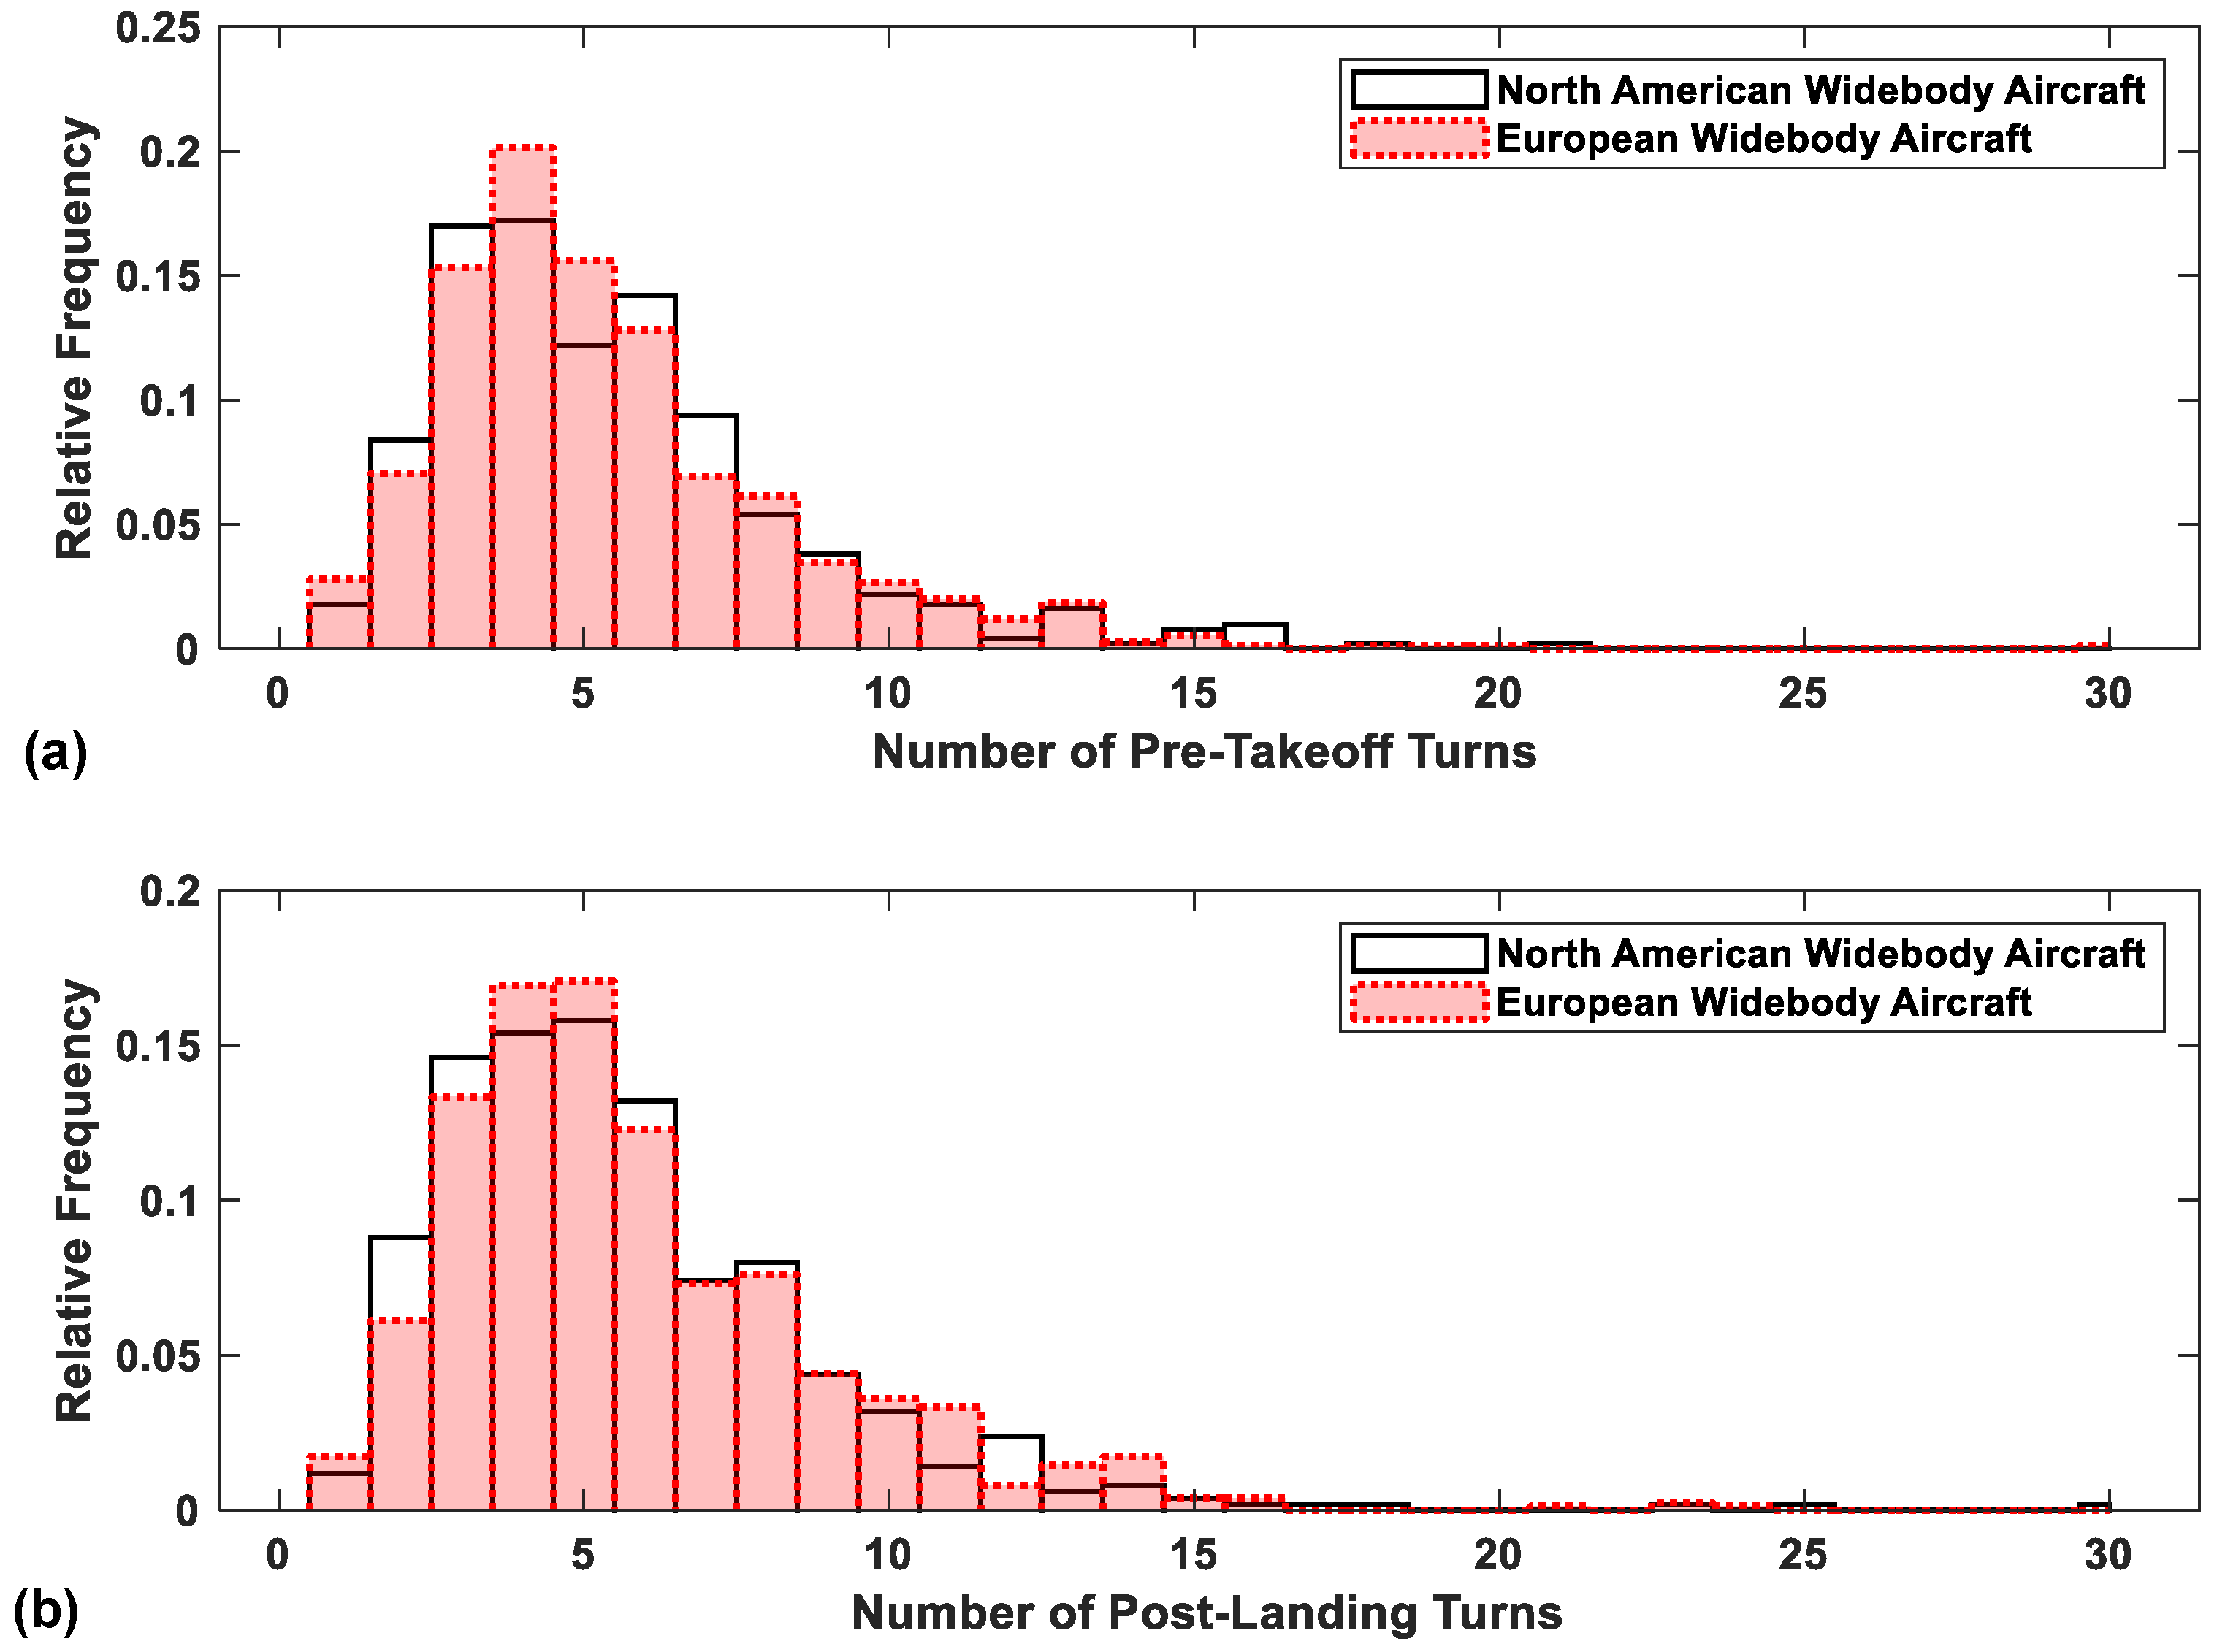
When considering the widebody fleet, the histograms shown in Figure 10 demonstrate that the variability in the ground turn occurrences is consistent across North American and European fleets, coupled with both geographically defined fleets showing a mode number of turns of four and five for pre-takeoff and post-landing taxi phases, respectively.
Figure 10.
Geographical impact on (a) pre-takeoff turn occurrences and (b) post-landing turn occurrences for widebody aircraft.
When comparing the variability in turn occurrences across Figure 9 and Figure 10, it is suggested that narrowbody aircraft show greater variability within the global fleet and that this is coupled to their geographical location. This is to be expected as widebody aircraft are typically employed on long-haul routes, leading to aircraft being exposed to a wider variety of airport geometries. Narrowbody aircraft, however, will have their route networks limited to short-haul operations and therefore constrained to specific regions of the globe. This constraint will lead to greater variability when comparing narrowbody fleets from different geographical locations. This proposed causation is further justified when considering that prior studies into smaller regional airliners highlight significant differences in per-flight turn variability for North American and European regional jet fleets [8].
Operator Impacts
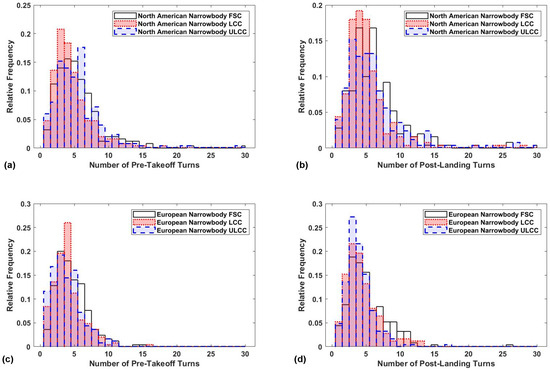
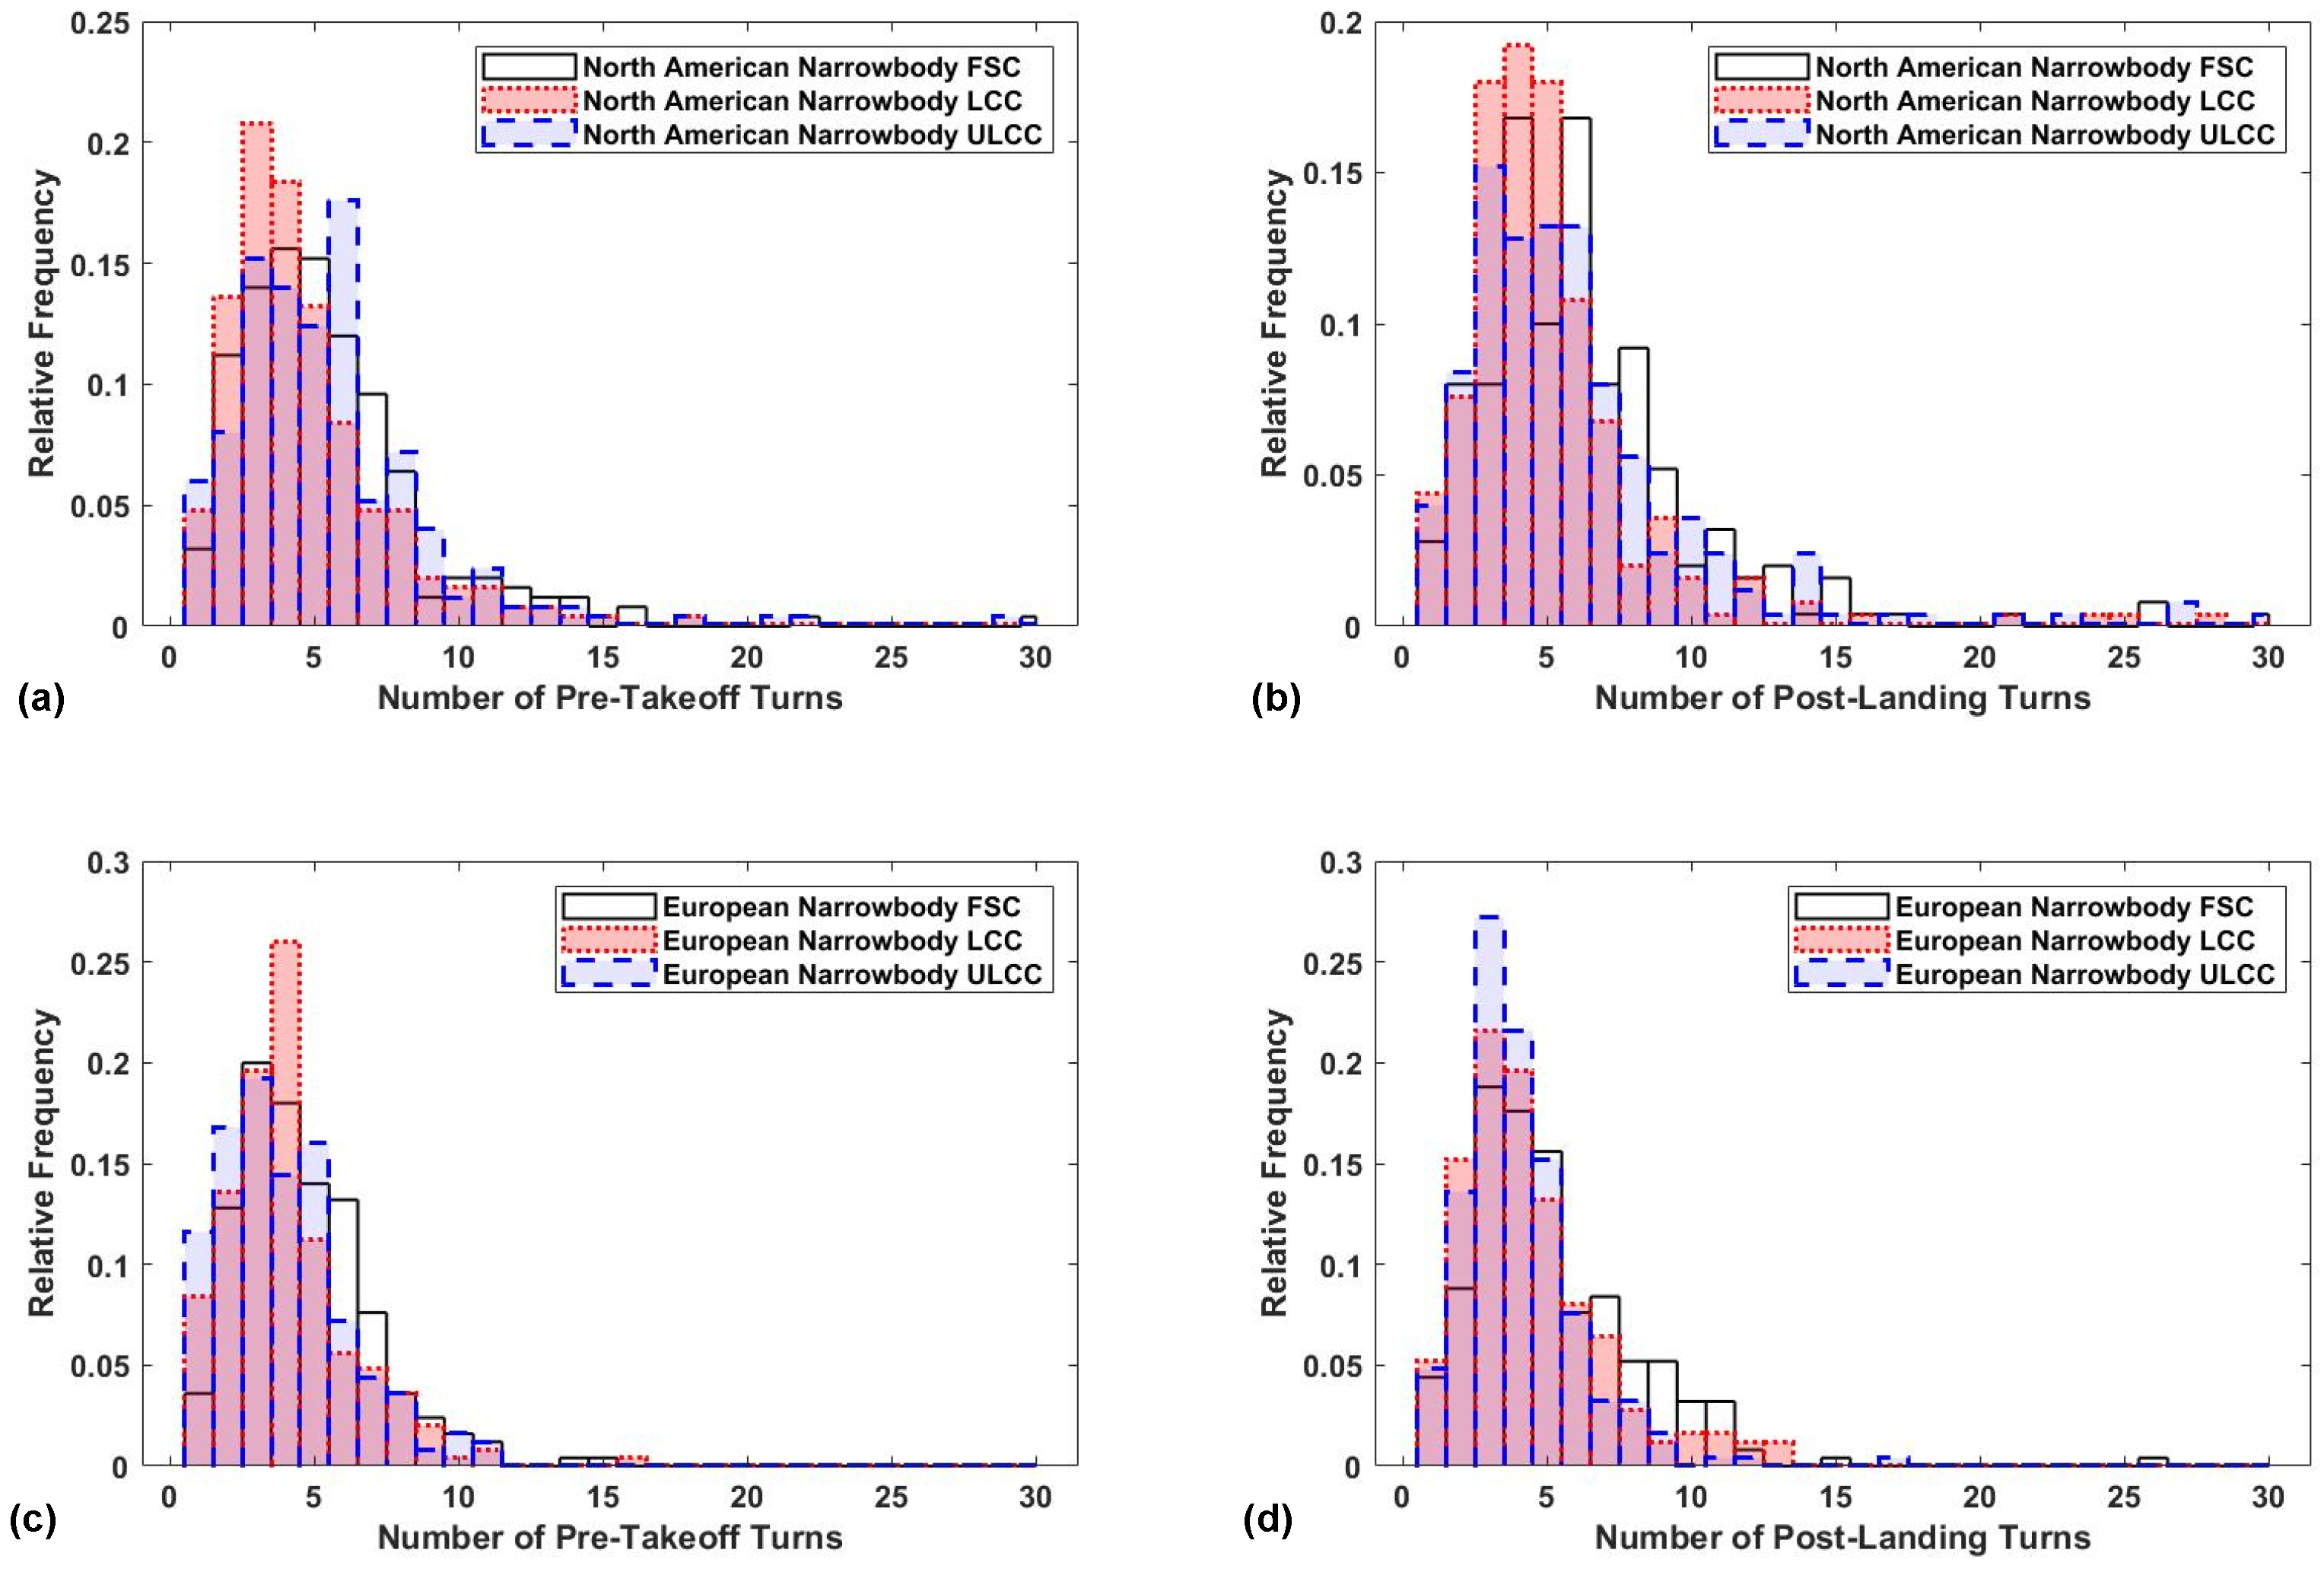
The final level of granularity defined by the 11 fleet types from Table 1 is to consider the turning occurrence statistics related to each individual fleet type, therefore accounting for operator characteristics. Figure 11 shows the histograms relating to variability in the pre-takeoff and post-landing turns per flight across different narrowbody aircraft operator types.
Figure 11.
Impact of operator characteristics on (a) pre-takeoff turn occurrences and (b) post-landing turn occurrences for North American narrowbody aircraft and (c) pre-takeoff turn occurrences and (d) post-landing turn occurrences for European narrowbody aircraft.
From Figure 11a, it can be observed that the North American LCC fleet has the lowest mode number of pre-takeoff turns with a value of three, whilst the ULCC fleet has the largest value of six, albeit with another peak in occurrence at three pre-takeoff turns per flight. The North American ULCC fleet also shows an increased spread in the per-flight number of pre-takeoff turns. The post-landing occurrence of turns in Figure 11b highlights a different trend, with the mode number of turns increasing from four up to six for the FSC fleet and the ULCC fleet reducing to three turns per flight in the post-landing phase.
The variability in pre-takeoff turns for the European narrowbody fleet shows a different trend to the North American fleet, with the LCC fleet demonstrating the highest mode number of pre-takeoff turns, as shown in Figure 11c. Regarding the post-landing number of turns for the European narrowbody fleet, it can be observed in Figure 11d that all operator fleets demonstrated a mode of three turns in the post-landing taxi phase.
In order to quantify the variability shown in the histograms across Figure 11, the proportion of flights showing a number of turns greater than the mode value observed for the entire narrowbody fleet (e.g., three turns for both pre-takeoff and post-landing) was computed and is shown in Table 2. From Table 2, it can be observed that the variability in the pre-takeoff and post-landing number of turns per flight reduces in the European operator fleets, from FSC, through LCC to ULCC. This observation is supported by prior work, which suggests such a trend is a result of ULCC operators operating from smaller secondary airports which typically have simpler airport geometries [4]. However, it is interesting to note that such a trend is not observed for the North American operator fleets.
Table 2.
Percentage of flights demonstrating a greater number of turns than the mode for the overall narrowbody fleet (three turns for both pre-takeoff and post-landing).
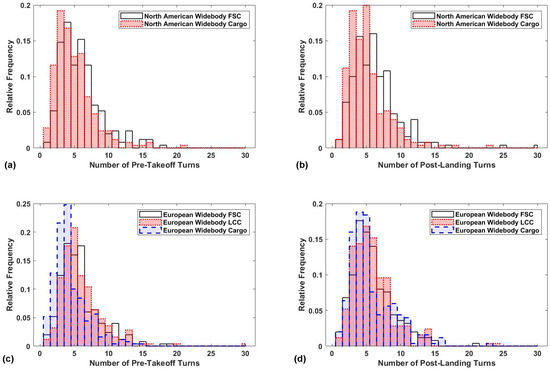
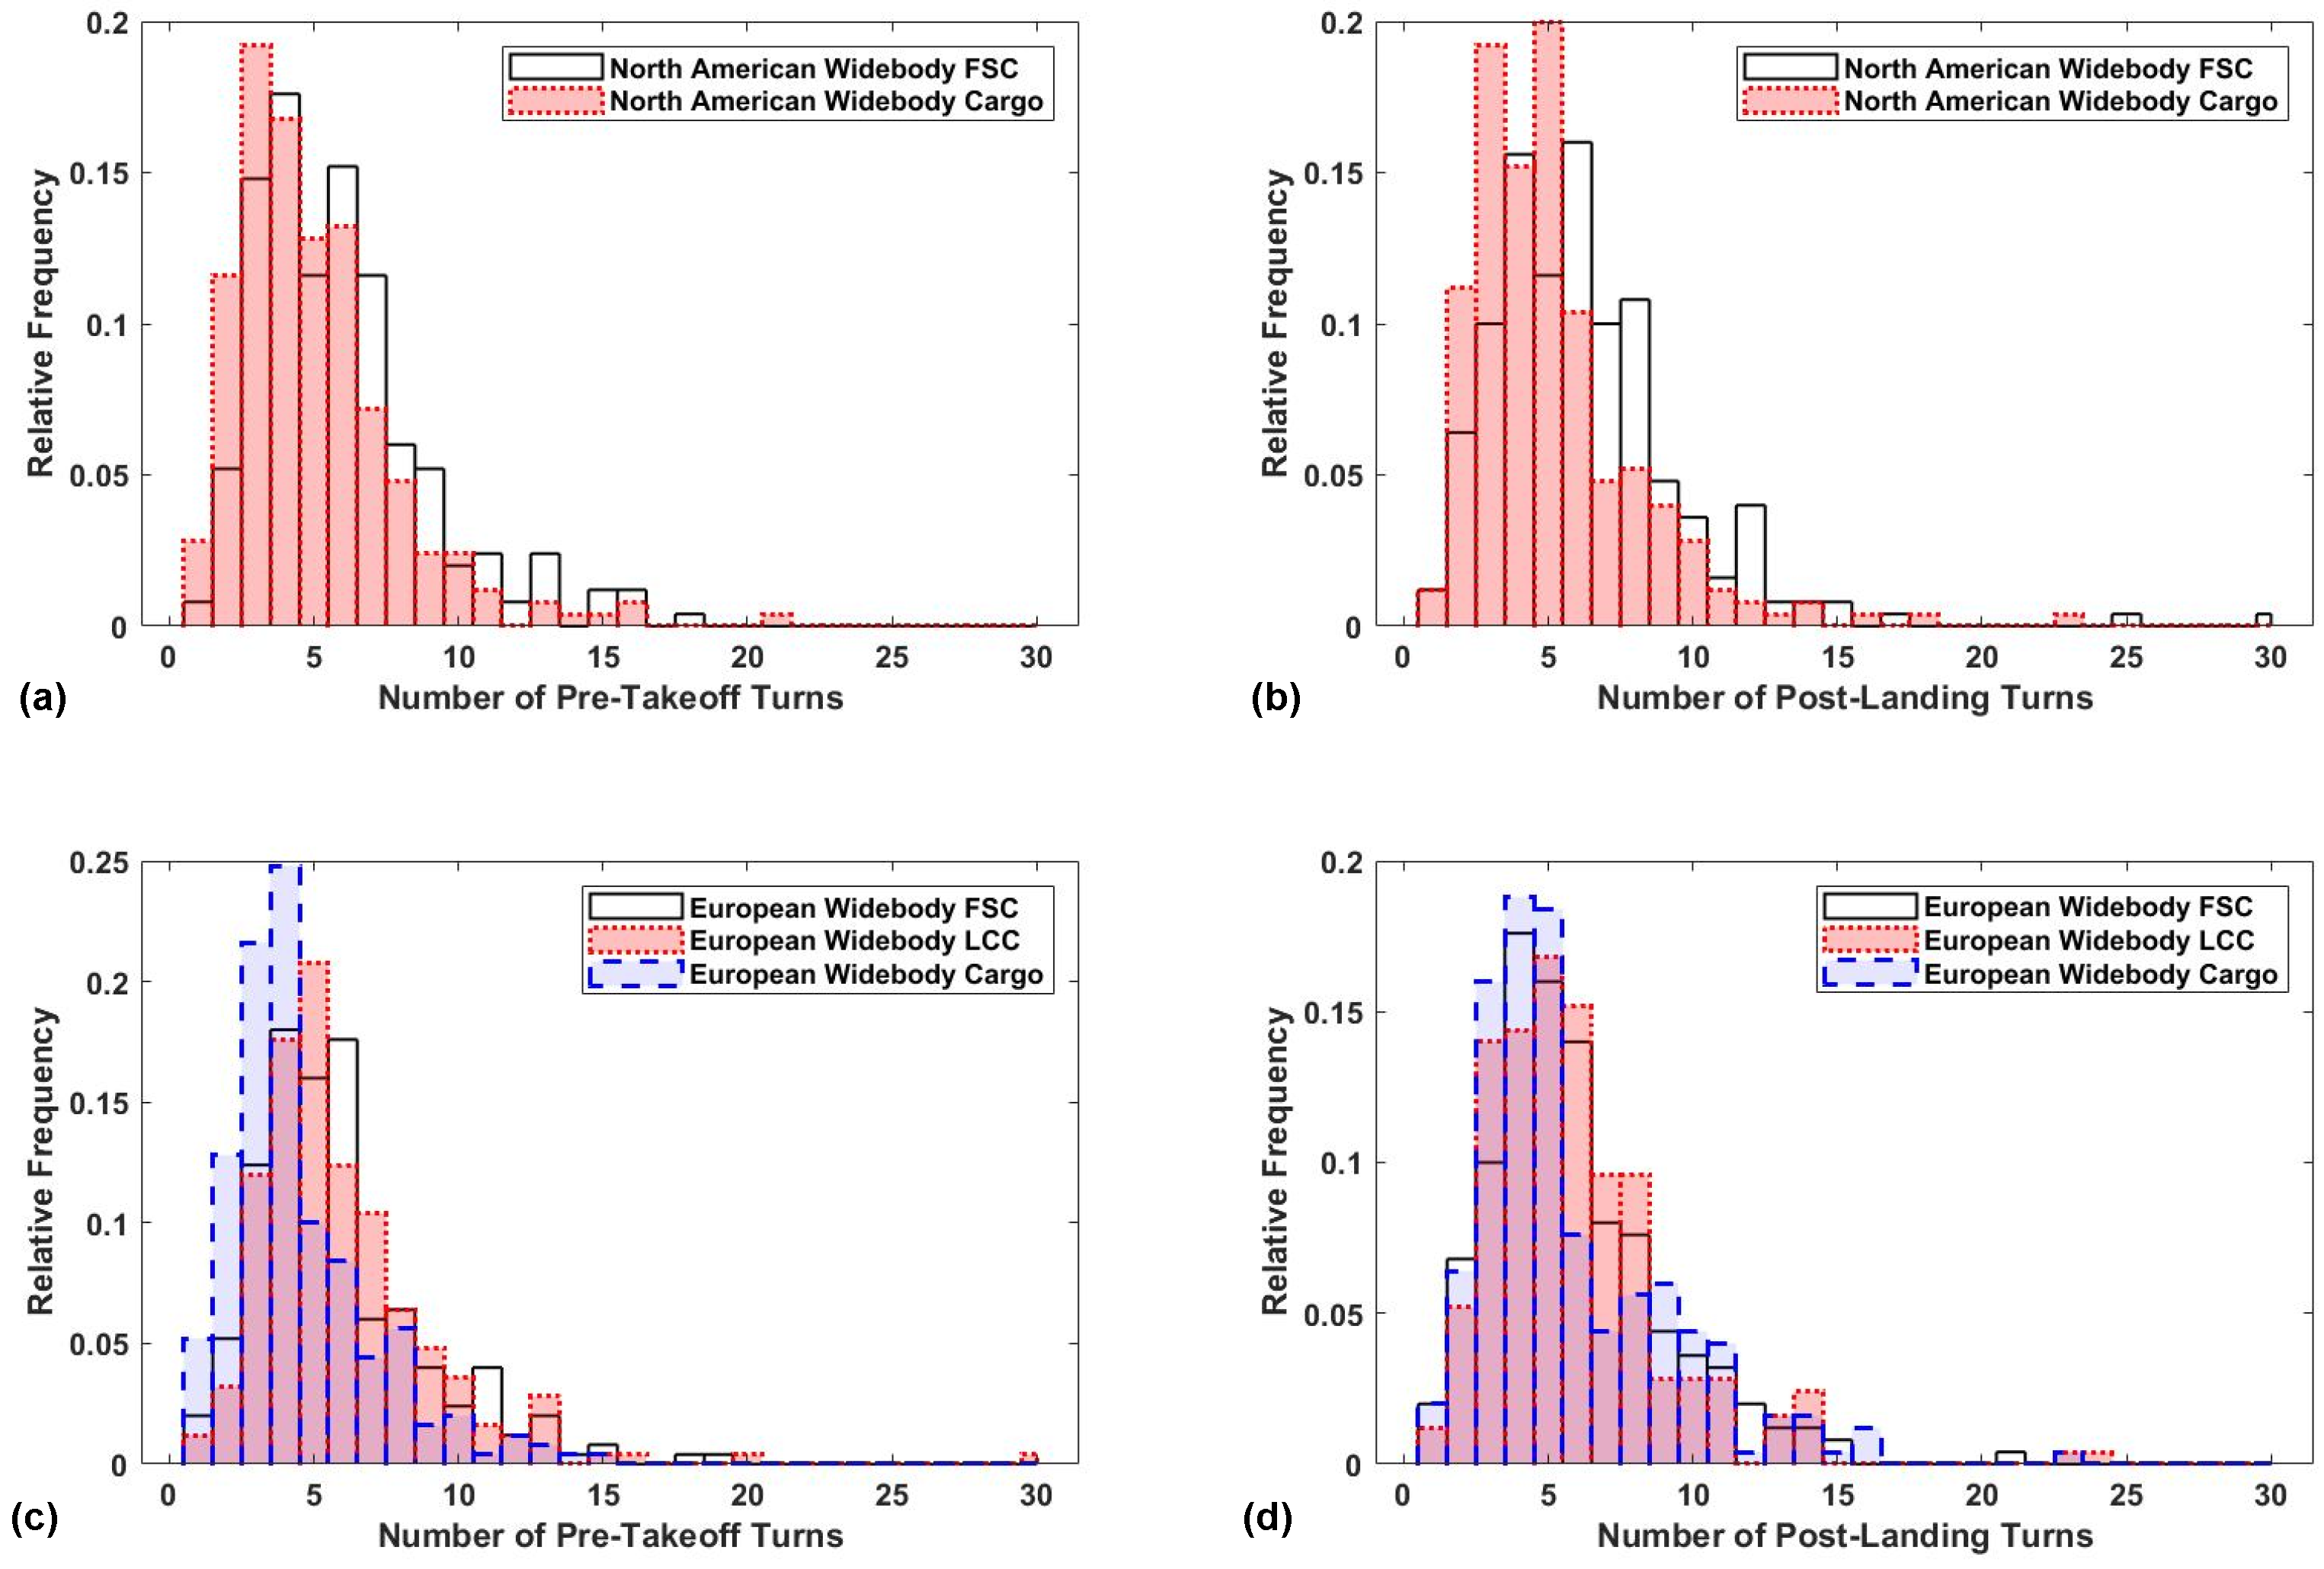
The North American and European widebody fleets were also segregated into the fleets defined previously in Table 1. The histograms related to the turn occurrences for these fleets are shown in Figure 12. From Figure 12a,b, it can be observed that the North American cargo fleet demonstrates a lower mode and reduced variability in the number of pre-takeoff and post-landing turns. A similar observation can be made for the European widebody operator fleets in Figure 12c,d. Also of note is that the European widebody LCC fleet shows a higher mode number of pre-takeoff turns compared to the European FSC and cargo operator fleets, which is the same trend that was observed for the European narrowbody operator fleets. It is proposed that this could be a result of the routine use of remote (e.g., non-airbridge) stands typically employed by LCC operators [38].
Figure 12.
Impact of operator characteristics on (a) pre-takeoff turn occurrences and (b) post-landing turn occurrences for North American widebody aircraft and (c) pre-takeoff turn occurrences and (d) post-landing turn occurrences for European widebody aircraft.
The variability in the ground-turning manoeuvre occurrence for the widebody fleet was also quantified based on the number of flights demonstrating a higher value than the overall widebody fleet mode (e.g., four pre-takeoff turns and five post-landing turns), as shown in Table 3.
Table 3.
Percentage of flights demonstrating a greater number of turns than the mode for the overall widebody fleet.
It can be observed across Table 3 that it is only the widebody cargo operators that demonstrate a significantly different level of variability in the number of pre-takeoff and post-landing turns. This is expected to be as a result of cargo aircraft often being remote from passenger airport terminals and may be served by their own dedicated taxiways [39]. In addition, it is possible that cargo operators may also operate ad-hoc flights into smaller airport geometries, leading to a lower number of ground turns per flight.
3.2. Variability in Tight and Pivot Turn Occurrence Rates
As highlighted in Section 2.1, fatigue-critical tight or pivot turns can also be identified within ADS-B ground trajectories based on the maximum spatial turn rate observed within a turn. Based on the procedure defined in prior work [4], 20 examples of tight and pivot turns were identified for both narrowbody and widebody aircraft, and the maximum spatial turn rate was computed for each turn. The lower bound, defined as the 5th percentile of the related to a tight turn, was found to be = 2.4°/m and = 2.0°/m for narrowbody and widebody aircraft, respectively. The discrepancy between the threshold for the narrowbody and widebody aircraft is expected to be a result of different aircraft sizes and hence landing gear track widths of narrowbody and widebody aircraft. The above trend of reducing for an increasing aircraft size is supported by prior work, which highlighted that for regional turboprops and jets, the tight turn threshold for such aircraft was 2.6°/m [8].
A subset of tight taxiway turns are pivot turns, which are turns often in excess of 180° that are performed as a turn within the runway width, either following or preceding a runway backtrack [40]. Such manoeuvres are considered fatigue critical due to the significant torsional loads experienced on the main landing gear on the ‘inside’ of the turn, which is typically braked and stationary in order to achieve the small-radius turn [31]. To capture pivot turns, the tight turns extracted via the thresholds were inspected further, and those resulting in an aircraft heading change exceeding 135° were assumed to be pivot turns. Consistent with prior work by the authors [8], the threshold of 135° was selected as the midpoint between the typical runway entry/exit turn of 90° and the expected heading change in a pivot turn of 180°.
When combining the percentage of all turns observed to be tight and pivot turns with the mode number of observed turns for each fleet, the average tight and pivot turn occurrence per 10 flights could be estimated. Tight and pivot turn occurrence rates were rounded to the nearest integer in accordance with the typical sample uncertainty observed in Section Impact of Sample Size. In the pre-takeoff phase, the overall narrowbody fleet was observed to perform five tight turns per 10 flights compared to nine tight turns per 10 flights for the widebody fleet.
The observation that widebody aircraft experience a greater rate of tight turns is expected to be due to the fact that narrowbody and widebody aircraft will often operate from the same airports [41]. Consequently, some turns that would be classified as tight for a widebody aircraft would not be considered a tight turn for a narrowbody aircraft, and this could include the runway entry turn at large airports. This is also expected to occur for the final aircraft turn onto stand, and this is reflected in the overall narrowbody fleet demonstrating, on average, four tight post-landing turns per 10 flights and the widebody fleet demonstrating, on average, seven tight post-landing turns per 10 flights. By comparison, regional turboprop aircraft have been found to perform six tight turns per 10 flights in both pre-takeoff and post-landing taxi phases, whilst regional jets have been observed to perform between four and five tight turns per 10 flights pre-takeoff and three tight turns per 10 flights post-landing [8].
Regarding pivot turn occurrence, the overall narrowbody and widebody fleets showed increased consistency, with both fleets showing two pre-takeoff pivot turns per 10 flights, along with one and two post-landing pivot turns per 10 flights, respectively. The increased consistency between overall fleets compared to the tight turn occurrence rates is expected to be as a result of pivot turns typically only being required at a limited number of smaller airports [40]. These results are consistent with the pivot turn rates observed for regional airliners in prior work [8].
Table 4 shows the tight- and pivot-turn occurrence rates per 10 flights when decomposing the narrowbody and widebody fleets into North American and European fleets. From Table 4 it can be observed that the pre-takeoff tight and pivot turn rates are insensitive to the geographic location of the aircraft, regardless of its size.
Table 4.
Geographical impact on occurrence rate of tight and pivot turns in taxi phases for narrowbody and widebody aircraft.
However, Table 4 also demonstrates that the post-landing tight turn occurrence rate is marginally sensitive to the geographical location of the aircraft. This observation is once again expected to be a result of the smaller airport geometries typical of European airports. Across Table 4, it can be observed that pivot turn rates are mostly insensitive to geographical location.
Concerning the impact of operator characteristics on pre-takeoff tight and pivot turn rates of narrowbody aircraft, it can be observed from Table 5 that operator type has limited consistent impact on the occurrence of such turns during the pre-takeoff taxi phase and post-landing taxi phases. It is interesting to note, however, that for ULCC operators, geographic sensitivity does occur for post-landing tight turns, with double the occurrence rate observed in Europe when compared to North America.
Table 5.
Operator impact on occurrence rate of tight and pivot turns in taxi phases for narrowbody aircraft.
When considering operator impacts on widebody aircraft tight and pivot turn occurrence rates, increased consistency across the fleets of differing operator characteristics can be seen in Table 6. The consistency across the widebody operator type fleets is expected to be a result of widebody route networks exposing aircraft to wider variation in global airport geometries, when compared to narrowbody route networks.
Table 6.
Operator impact on occurrence rate of tight and pivot turns in taxi phases for widebody aircraft.
3.3. Influence of Specific Operator Characteristics on Turn Occurrence Rates
The results in this section have demonstrated that whilst there is a clear difference in the tight and pivot turn occurrence rates between narrowbody and widebody aircraft, it is challenging to identify a clear relationship related to the aircraft’s geographical location and operator characteristics. However, as there are specific elements that do differ between fleets, such as the geographical sensitivity in the post-landing tight turn rates in Table 4, or the slight variations in pivot turn rates observed across Table 4, Table 5 and Table 6, further investigation at the individual airframe level was required. This need for further investigation is also supported by the observation in prior work that individual aircraft within fleets of aircraft type or operator characteristic can demonstrate significantly different turn occurrence statistics compared to the overall fleet [4,8].
Consequently, two further aircraft were identified to be included in the study, and 250 flights consisting of pre-takeoff and post-landing ADS-B trajectories were collected for each of the aircraft. The individual aircraft were identified as follows:
- A narrowbody aircraft that routinely operates at airports that require a tight turn-off from the departure stand rather than using a pushback tug.
- A widebody aircraft that routinely operates into airports that require a runway backtrack and pivot turn prior to takeoff and after landing.
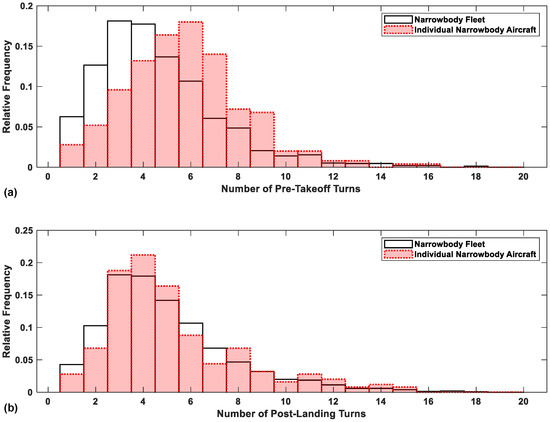
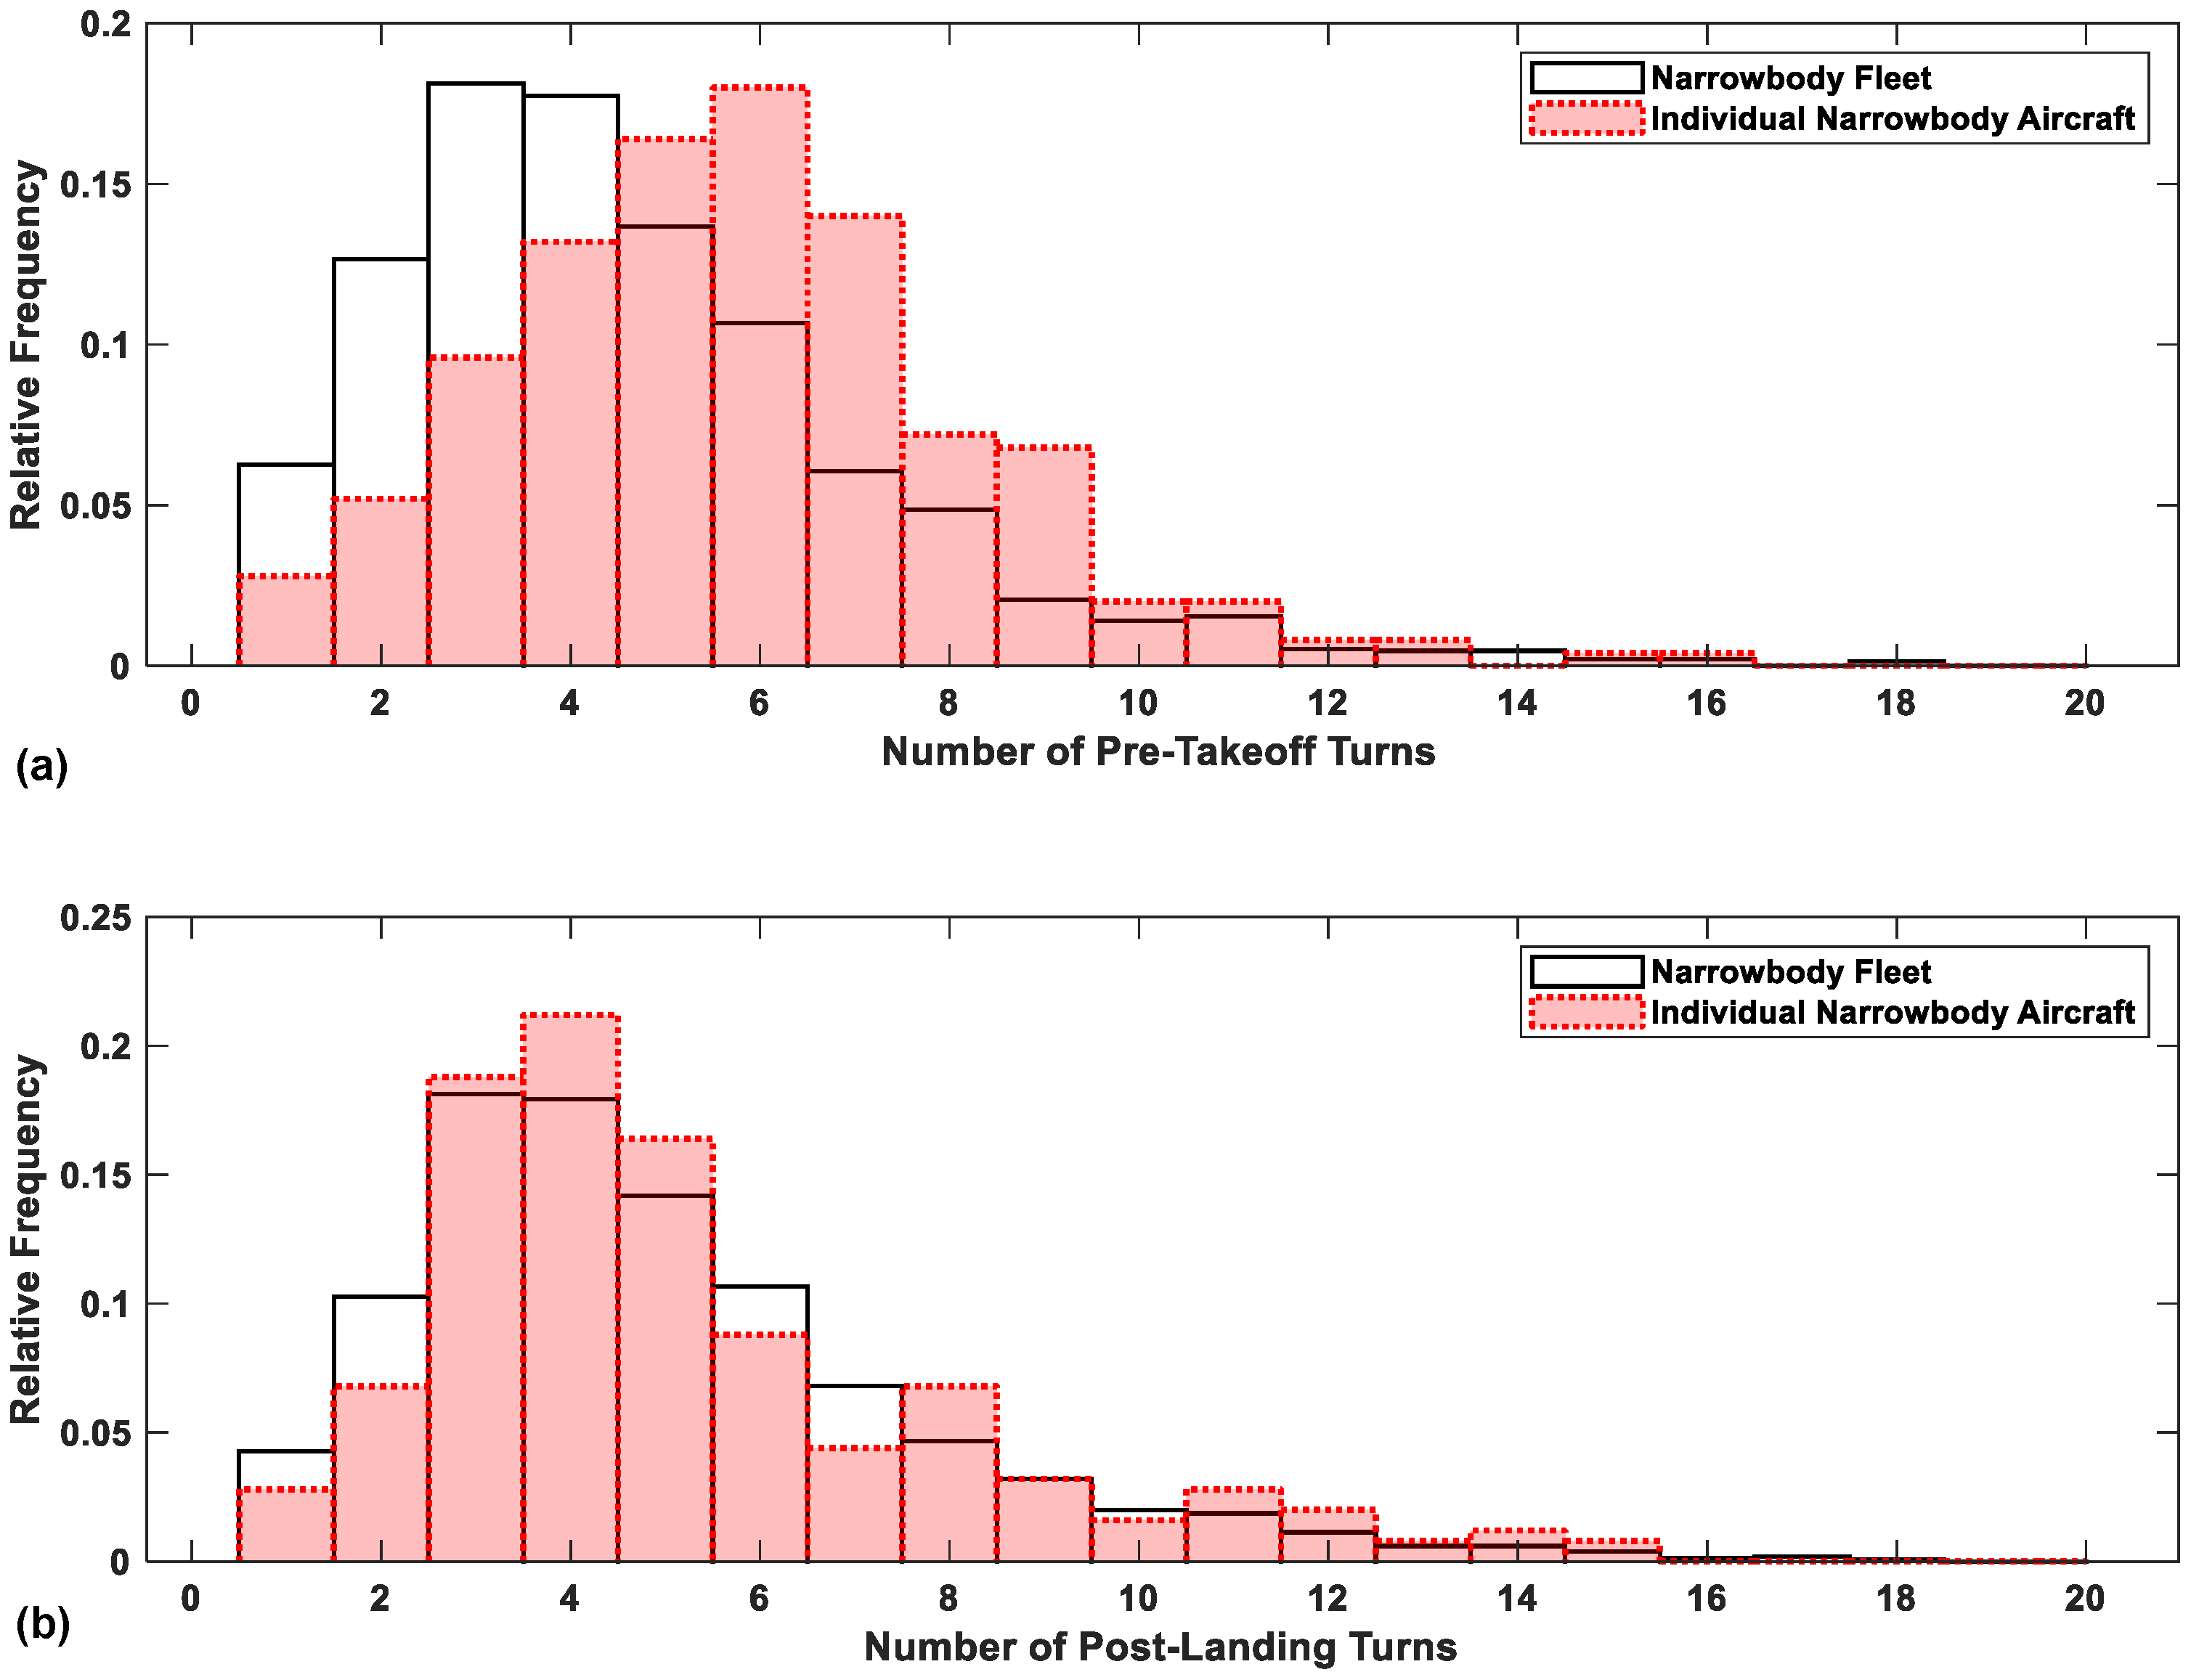
The ADS-B trajectories for these two aircraft were also evaluated using the methodology defined in Section 2 in order to evaluate the variability in turn manoeuvre occurrence. Figure 13 shows the pre-takeoff and post-landing per-flight occurrences of turns for the individual narrowbody aircraft. It can be observed from Figure 13a that there is a significant difference in the turn occurrence variability during the pre-takeoff phase, with the individual aircraft demonstrating a mode number of pre-takeoff turns of six, compared to the mode of three for the overall narrowbody fleet. With the narrowbody aircraft demonstrating double the mode number of pre-takeoff turns compared to the overall fleet, this highlights the sensitivity of turn occurrence rates to the individual aircraft, operator and the route network flown.
Figure 13.
Histograms of per-flight (a) pre-takeoff turn occurrences and (b) post-landing turn occurrences of the overall narrowbody fleet and an individual narrowbody aircraft.
On the other hand, Figure 13 shows increased consistency between the individual narrowbody aircraft and overall fleet for the number of post-landing turns per flight. This observation highlights the complexity of identifying consistent differences between individual aircraft and the overall aircraft type fleet.
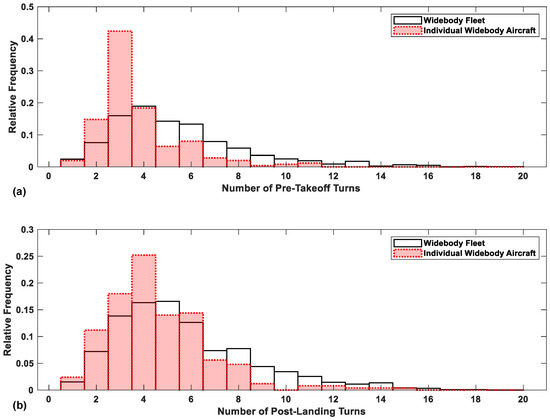
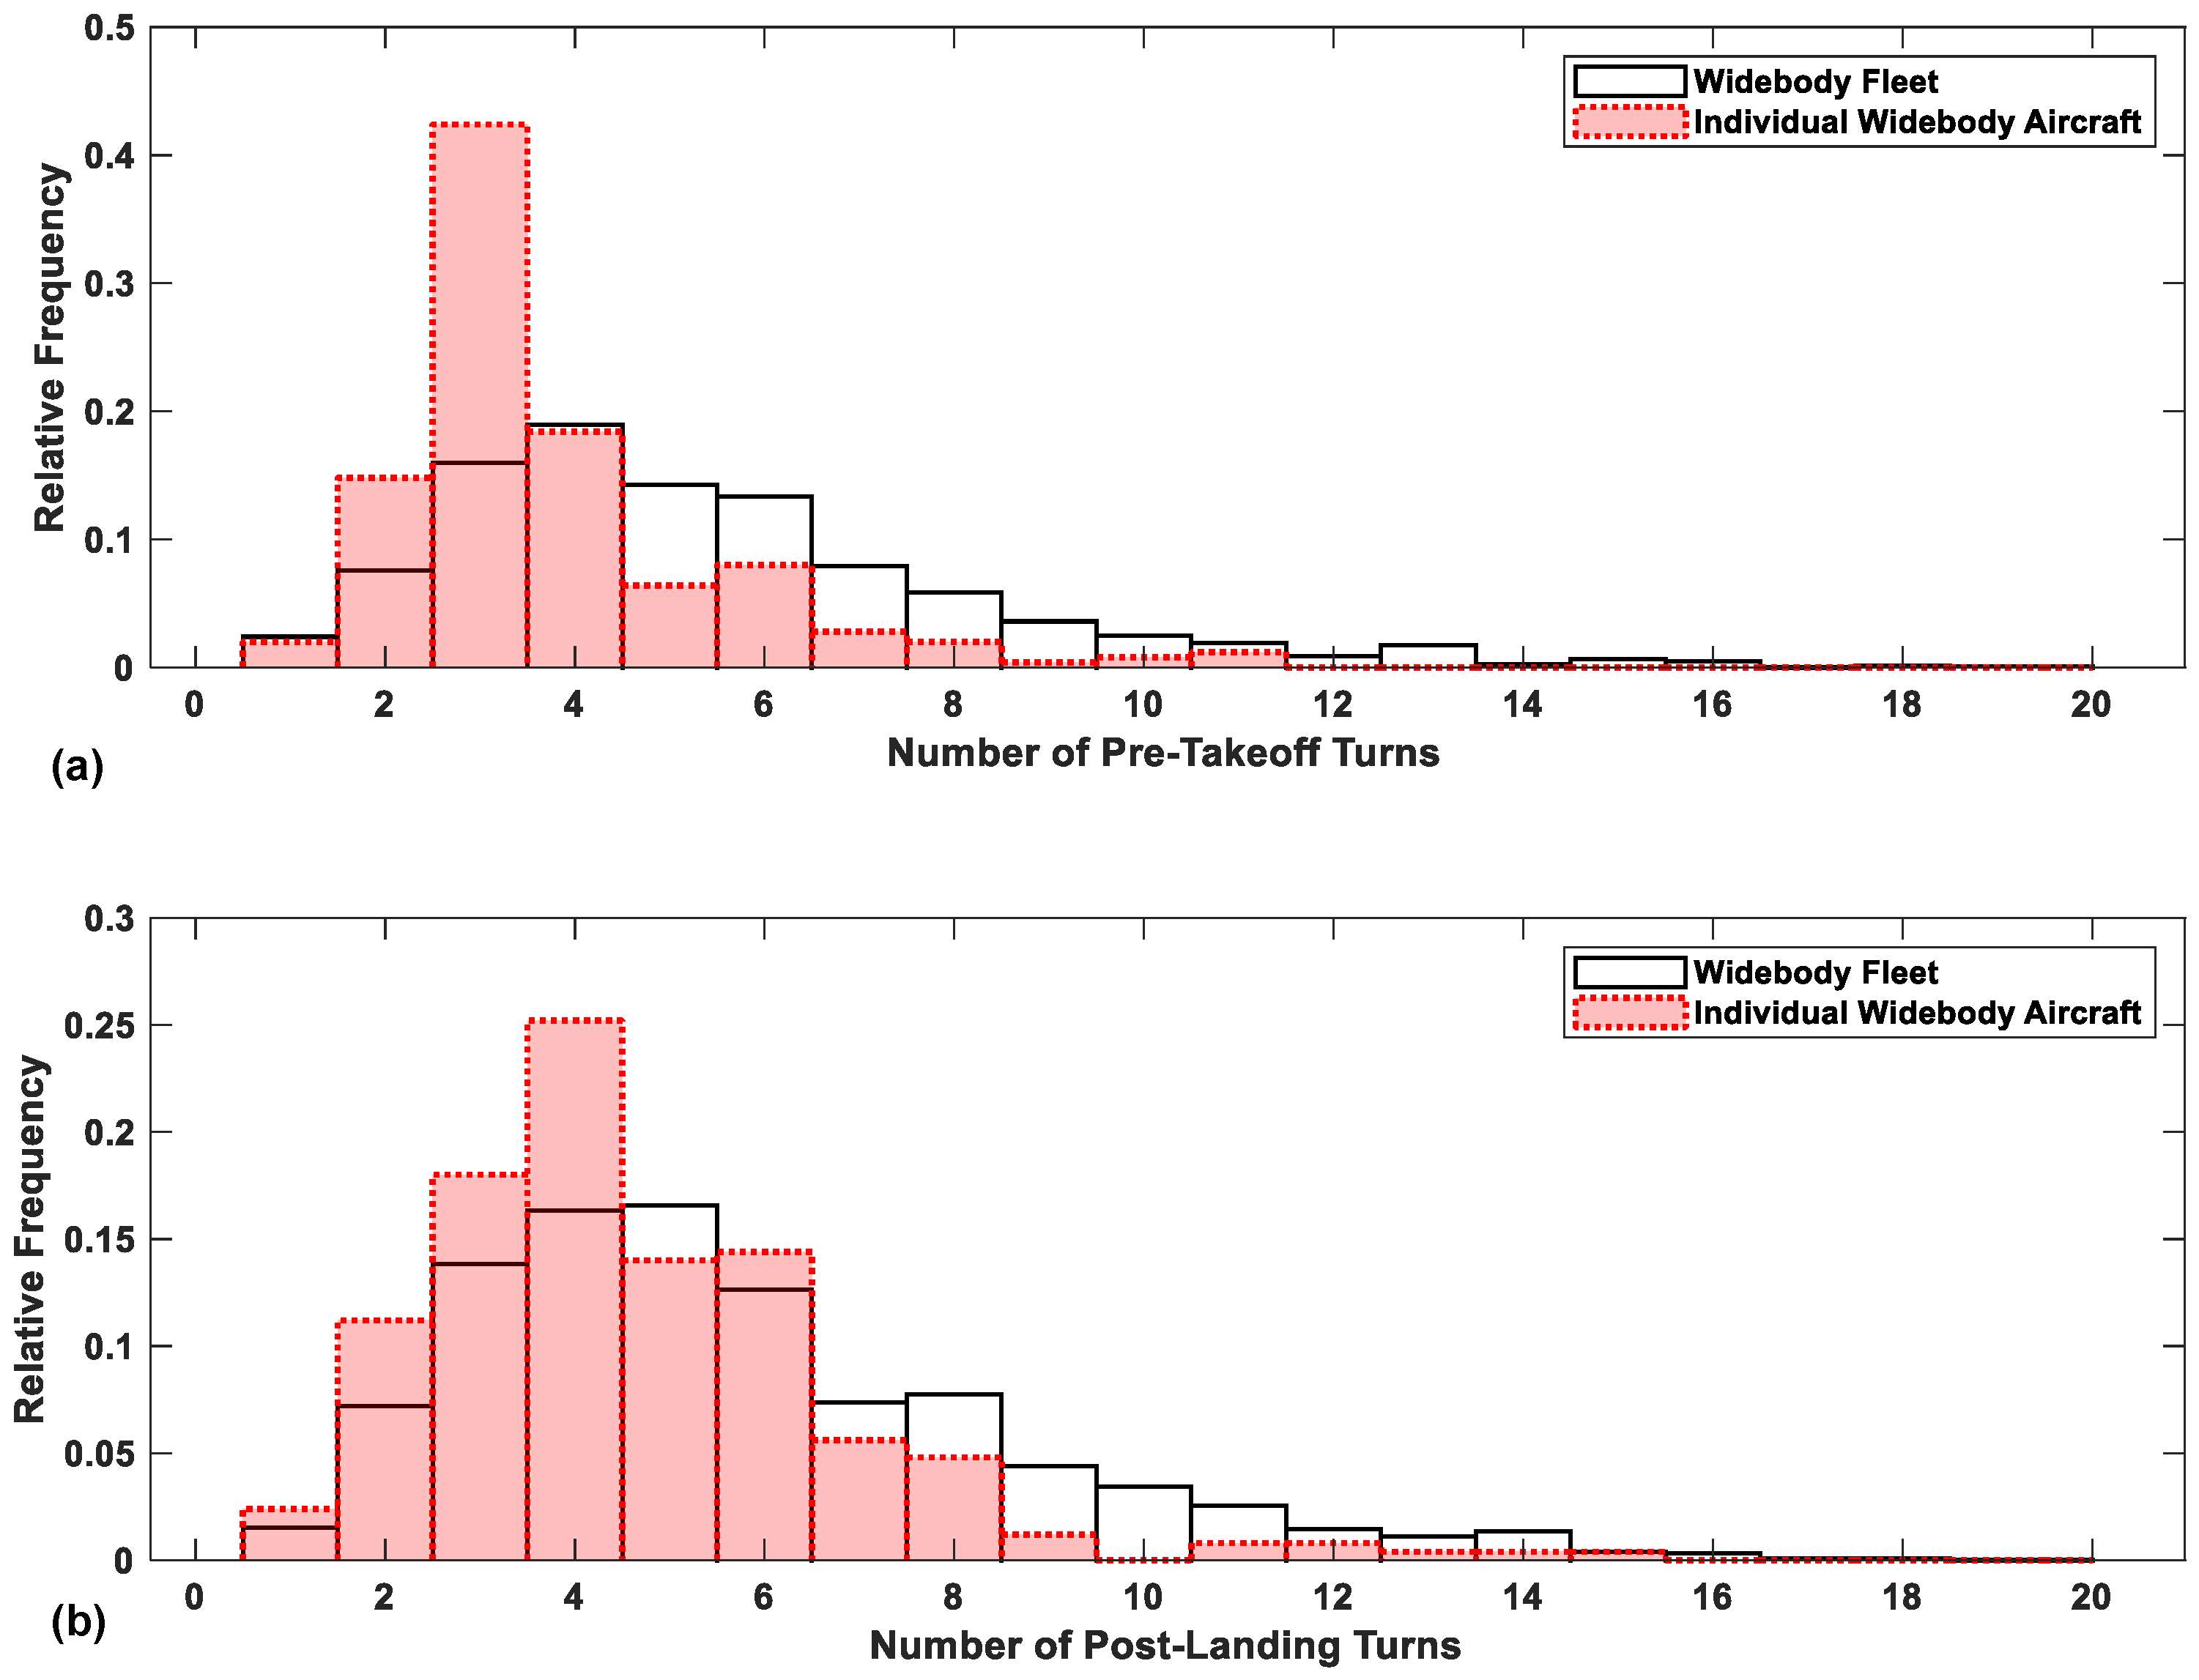
Regarding the widebody aircraft, Figure 14a shows that the individual widebody aircraft has significantly less variability in the number of pre-takeoff turns when compared to the overall fleet, highlighted by the large peak at the mode of three pre-takeoff turns per flight. This reduction in variability is expected to be a result of the route network flown by the aircraft, which consists of a large number of smaller airports. The reduction in turn occurrence variability is also observed to a lesser extent for the post-landing phase as shown in Figure 14b.
Figure 14.
Histograms of per-flight (a) pre-takeoff turn occurrences and (b) post-landing turn occurrences of the overall widebody fleet and an individual widebody aircraft.
The occurrence rates for tight and pivot turns were also identified for the individual narrowbody and widebody aircraft. The tight and pivot turn rates are shown for the individual narrowbody aircraft in Table 7, where over double the rate of pivot turns is observed for the individual aircraft due to the airports within its route network, when compared to the overall fleet. The individual narrowbody aircraft also demonstrate increased rates of pre-takeoff tight turns.
Table 7.
Occurrence rate of tight and pivot turns for the overall narrowbody fleet and an individual narrowbody aircraft.
Due to the individual widebody aircraft operating at multiple small airport geometries that may require pivot turns before takeoff and after landing, the individual widebody aircraft was observed to have a pre-takeoff pivot turn rate three times that of the overall fleet, as shown in Table 8. When coupled with the reduced pre-takeoff turn occurrence variability shown in Figure 14a, this indicates that 12.7% of pre-takeoff turns are pivot turns for the individual widebody aircraft, compared to the overall widebody fleet value of 3.4%. In addition, Table 8 shows that the post-landing pivot turn rate for the individual aircraft is over double that of the overall widebody fleet. Consequently, Table 8 shows the individual widebody aircraft would be exposed to an increased severity of taxiway turns in-service compared to the overall fleet.
Table 8.
Occurrence rate of tight and pivot turns for the overall widebody fleet and an individual widebody aircraft.
In summary, the consideration of individual narrowbody and widebody aircraft has shown the sensitivity of turn occurrence rates to the specific operator characteristics, route networks and airport geometries served. When coupled with the limited sensitivity observed across geographical and operator characteristic fleets, the results presented in this section support the growing interest in landing gear Structural Health Monitoring systems [5], consistent with observations from prior studies concerning regional airliners [8].
3.4. Inferred Nose Wheel Steering Angle from ADS-B Trajectories
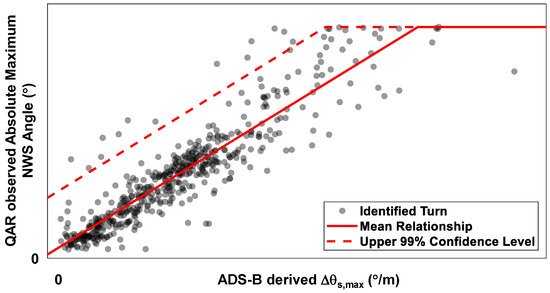
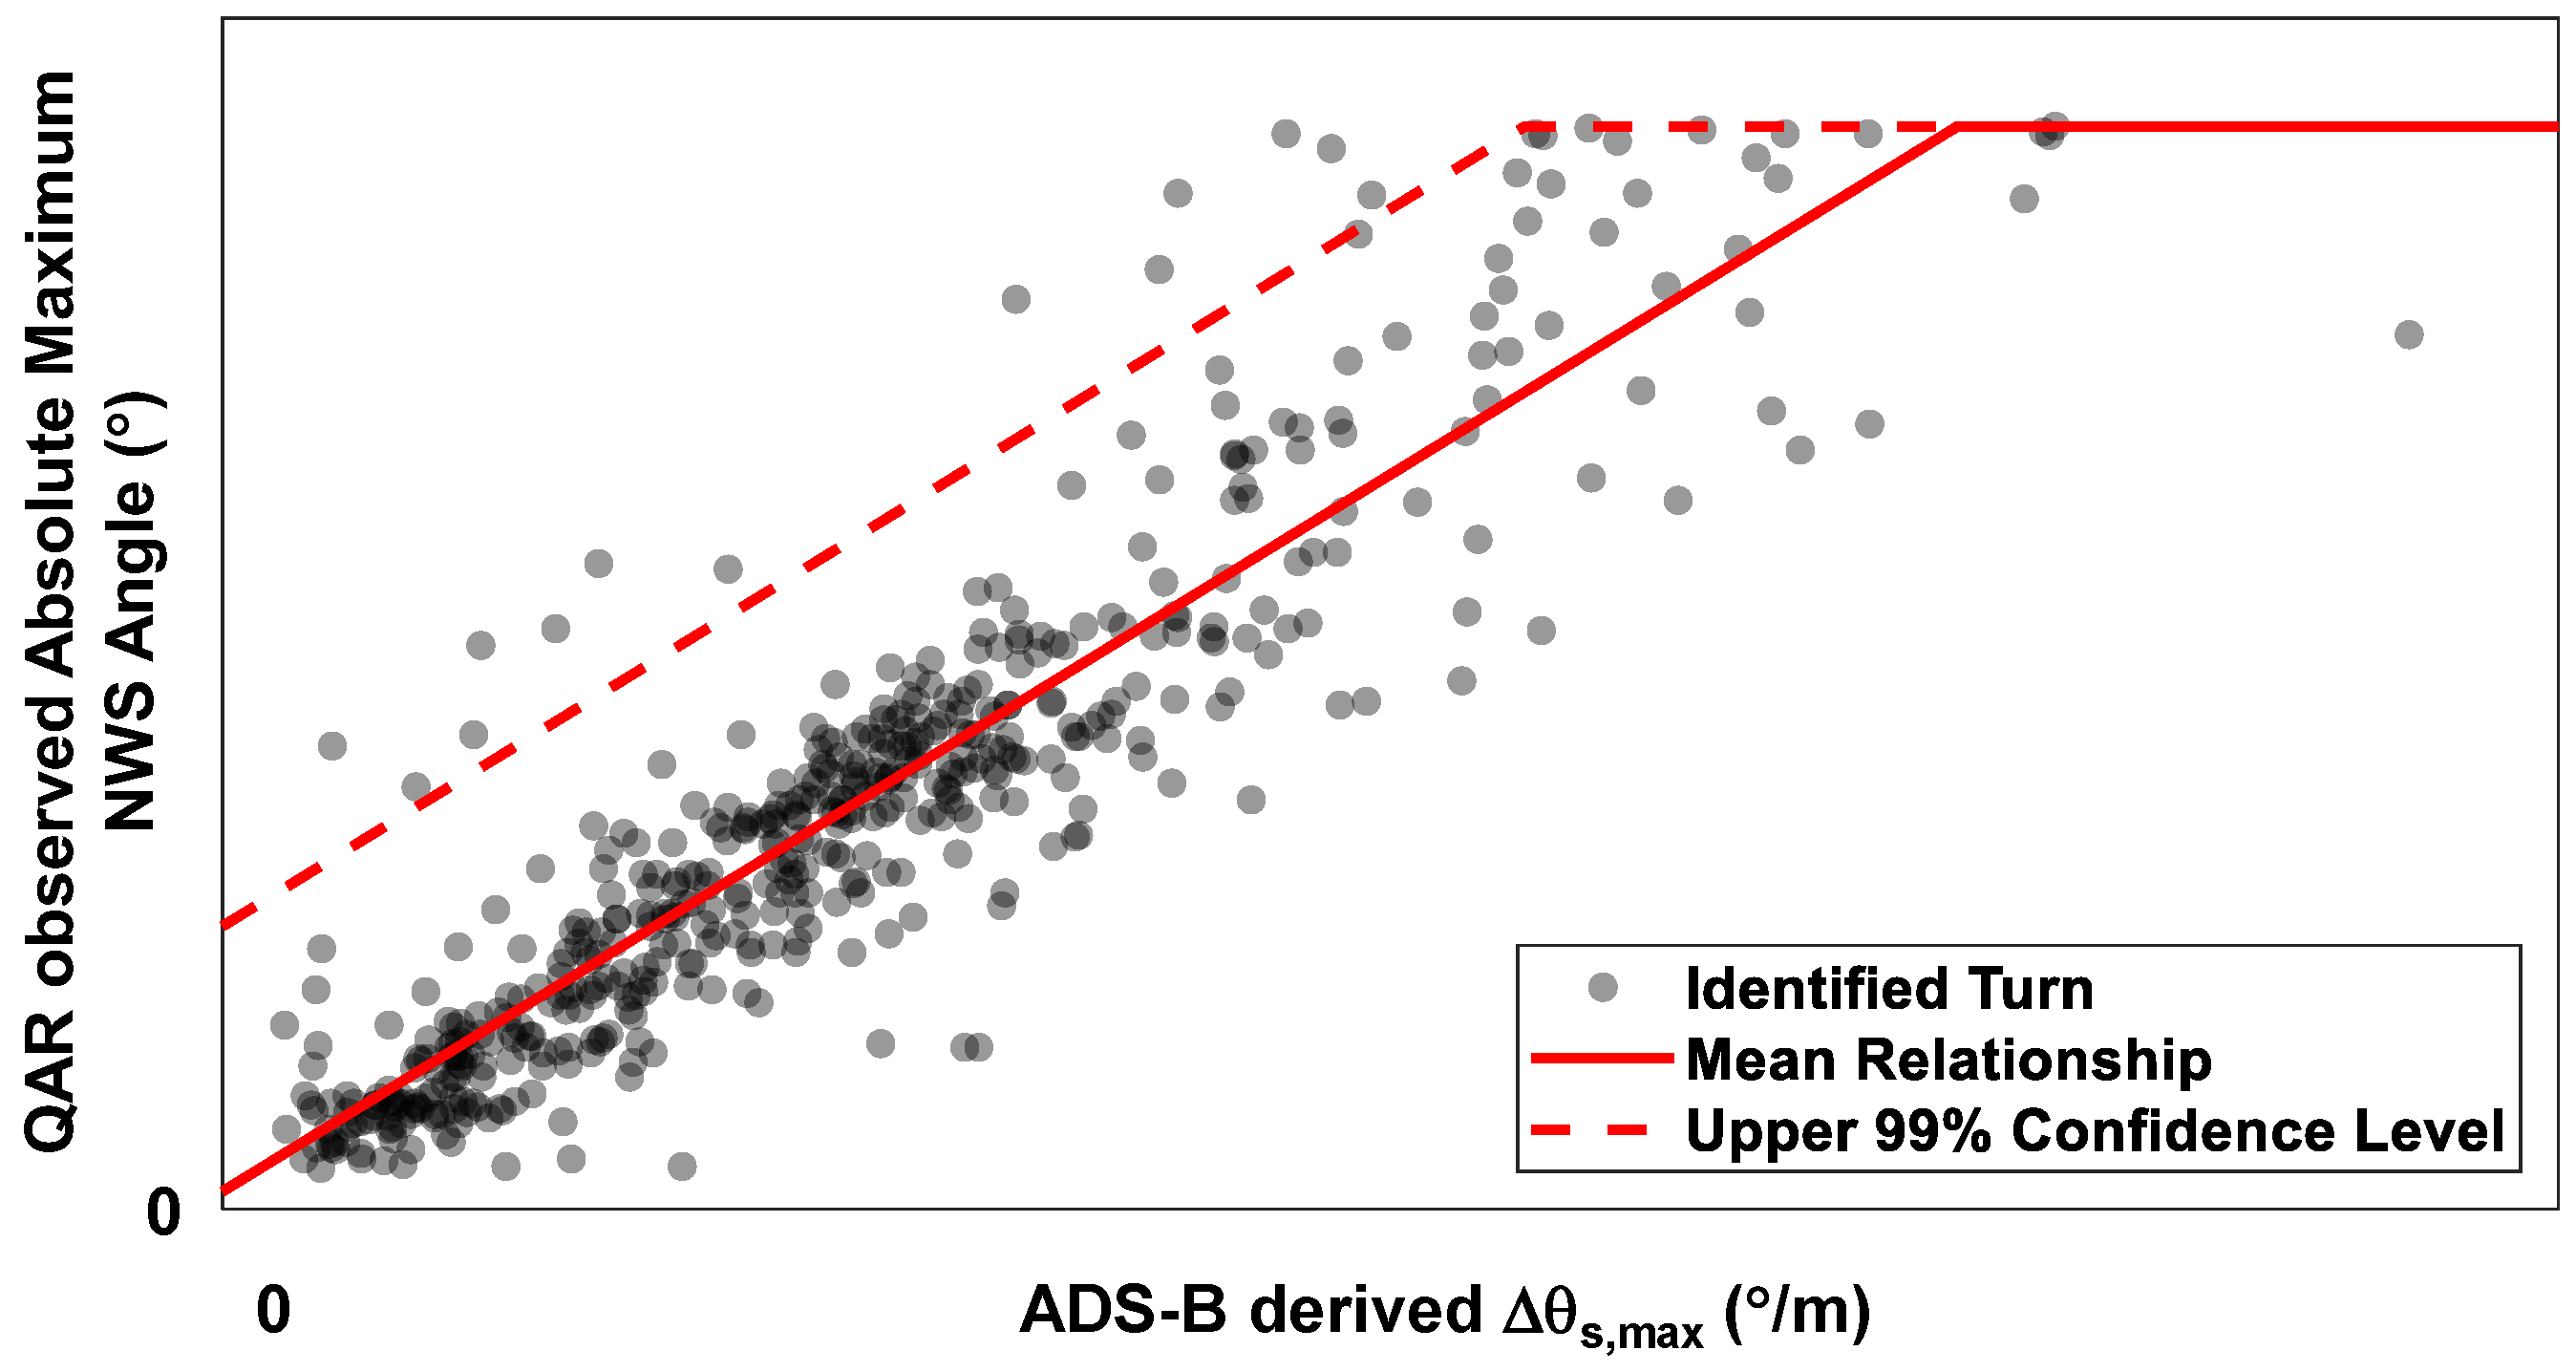
As described in Section 2.3, approximately 500 turns identified within Quick Access Recorder (QAR) parameter histories were mapped to matching turns identified in the ADS-B trajectories of the same flights. The observed maximum Nose Wheel Steering (NWS) angle identified during the turn is shown against the corresponding value of maximum spatial turn rate, , derived from the ADS-B trajectories in Figure 15. In accordance with data permissions, desensitised values are shown in Figure 15.
Figure 15.
Relationship between maximum NWS angle observed from QAR data during turn and corresponding maximum spatial turn rate from ADS-B.
From Figure 15 it can be observed that there is good agreement to a linear relationship with a goodness of fit of 0.83 between the maximum NWS angle observed within a turn and the value of derived from the ADS-B trajectory, supported by a Pearson correlation coefficient of 0.91, suggesting a strong correlation within the raw data [42].
The good agreement between the ADS-B-derived value of and the maximum NWS angle observed in QAR data shown in Figure 15 validates the use of as a proxy for the severity of turns captured within ADS-B trajectories, along with providing a means of inferring the NWS applied to achieve a turn during taxi from ADS-B data, without requiring the processing of QAR time histories.
In order to demonstrate the utility of the relationship shown in Figure 15, three aircraft of the same type as the aircraft providing the QAR time histories were identified. For each of these three aircraft, the pre-takeoff and post-landing ADS-B trajectories for 250 flights were sourced from Flightradar24 [24] and processed using the methodology described in Section 2. For each taxiway turn identified within the flights, the derived value of was applied to the linear relationship shown in Figure 15, with NWS estimates capped at the maximum known NWS value to achieve physical consistency as demonstrated by the horizontal section of the relationship shown in Figure 15.
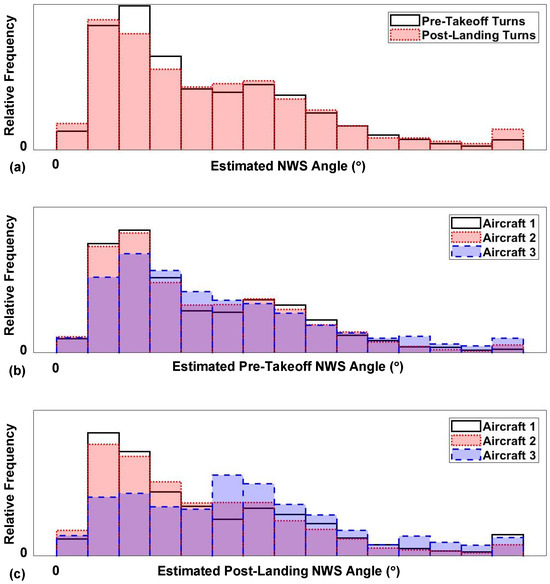
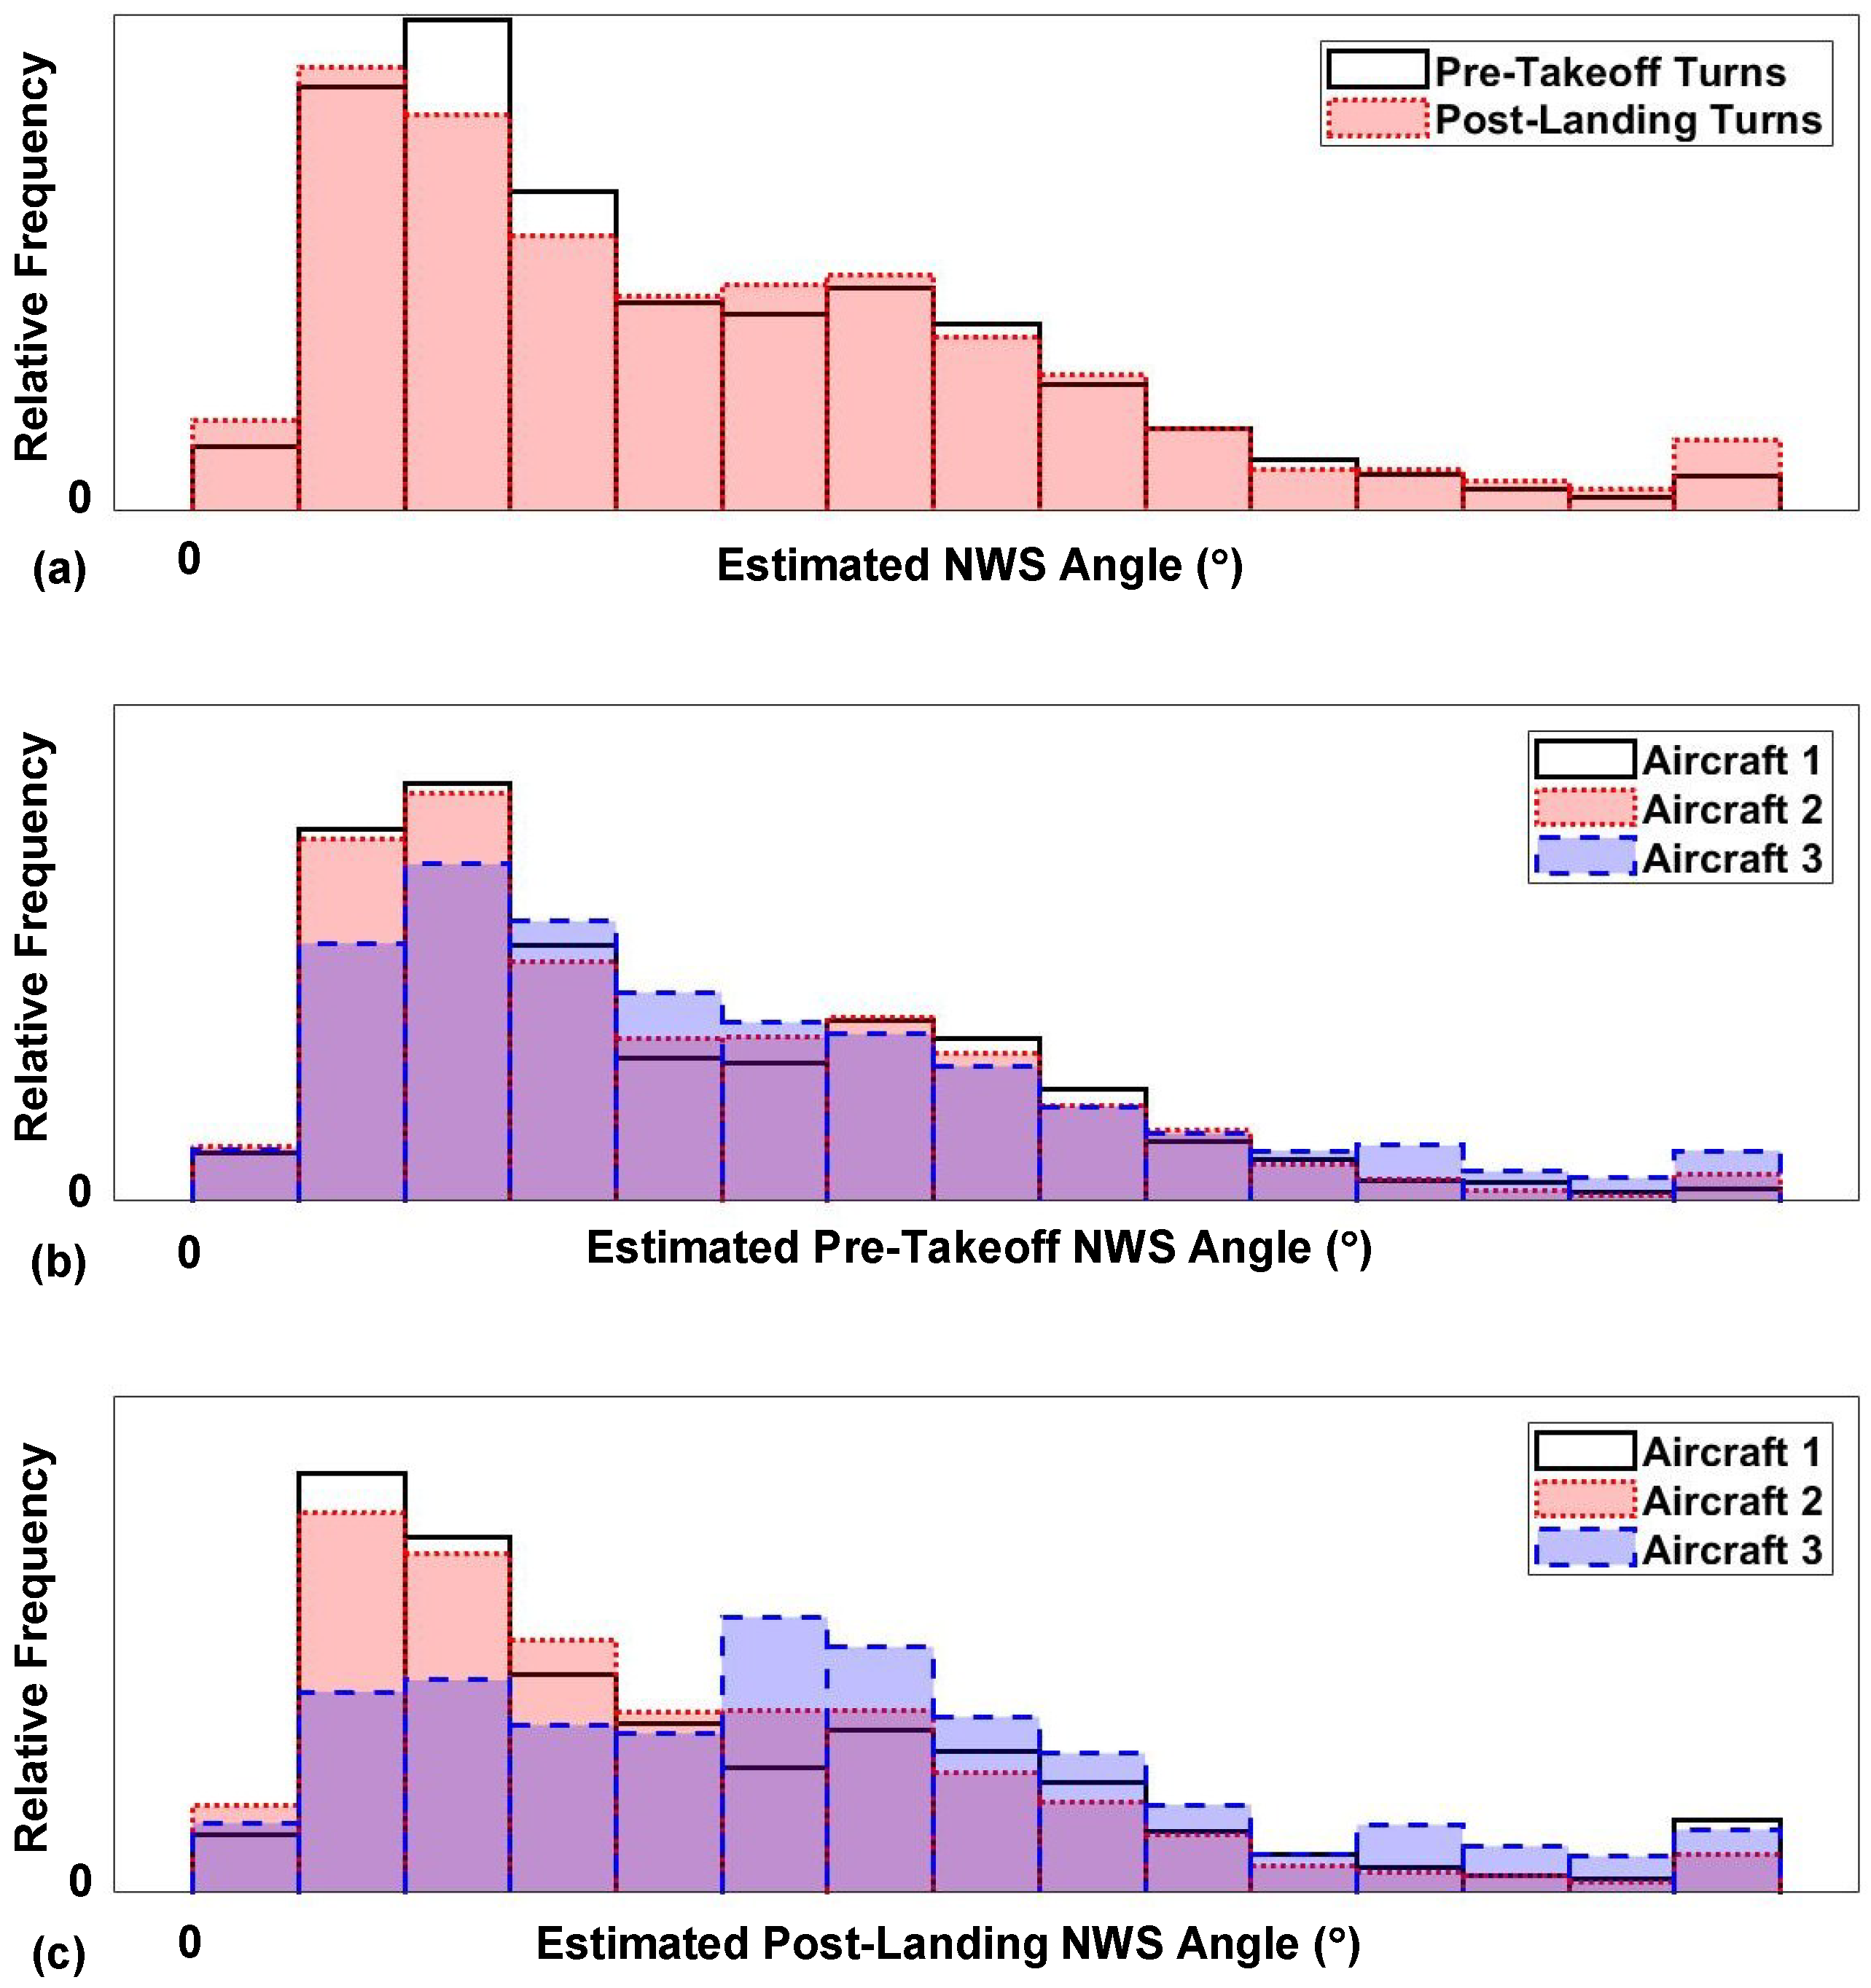
The inferred NWS values could then be assembled into histograms for pre-takeoff and post-landing phases for each of the three aircraft as shown across Figure 16. Figure 16a shows the histogram of estimated NWS angles when combining the turns across all three aircraft for both the pre-takeoff and post-landing phases. It can be observed from Figure 16a that a subtle bimodal distribution is present, centred on low- and mid-magnitude NWS values prior to tailing off, and this histogram shape is consistent with histograms generated from prior in-service monitoring of NWS angles from a transport aircraft [3]. Also of note from Figure 16a is that both pre-takeoff and post-landing taxi phases show an increased proportion of turns approaching the maximum NWS angle.
Figure 16.
Inferred NWS angle distributions from ADS-B trajectories for (a) all three aircraft, (b) pre-takeoff phase for each individual aircraft and (c) post-landing phase for each aircraft.
When comparing the pre-takeoff and post-landing phases in Figure 16a, it can be observed that the post-landing taxi phase has a higher proportion of lower NWS angle turns along with a higher proportion of turns approaching the maximum value of NWS. This is expected to be a result of shallower Rapid Exit Taxiways (RETs) being employed during runway exit and the often tight turns required during arrival on stand respectively.
The distribution in the inferred NWS angle was also generated for each of the three aircraft for the pre-takeoff and post-landing phases as shown in Figure 16b and Figure 16c, respectively. It can be observed from Figure 16b,c that Aircraft 1 and Aircraft 2 present consistent NWS angle histograms in both taxi phases, whilst Aircraft 3 shows increased proportions of mid- and large-NWS angles, especially for the post-landing phase in Figure 16c. When reviewing the route network performed by Aircraft 3, it was observed that this aircraft operated from multiple airports with small airport geometries that also required a pivot turn either prior to takeoff or after landing, and this is reflected by the larger proportion of higher NWS magnitudes for Aircraft 3 in Figure 16.
Consequently, Figure 16 has also demonstrated the utility of the relationship shown in Figure 15 for identifying differences in the NWS, and, hence, turn severity distribution without requiring the QAR data for each aircraft within a given fleet. However, as can be observed in Figure 15, there is significant scatter in the relationship between maximum NWS value and . A review of other ADS-B-derived turn parameters, such as those considered in prior work [4] failed to identify other relationships between QAR and ADS-B-derived turn parameters. In addition, attempts to account for the aircraft ground speed sourced from ADS-B also failed to reduce the scatter and improve the estimation of NWS values during a turn from ADS-B trajectories.
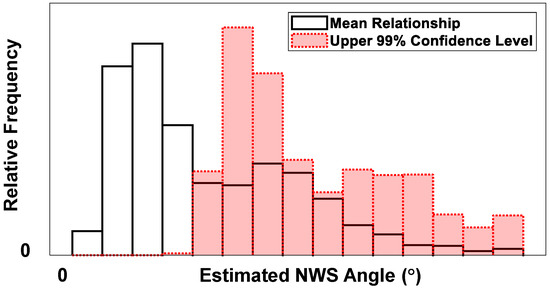
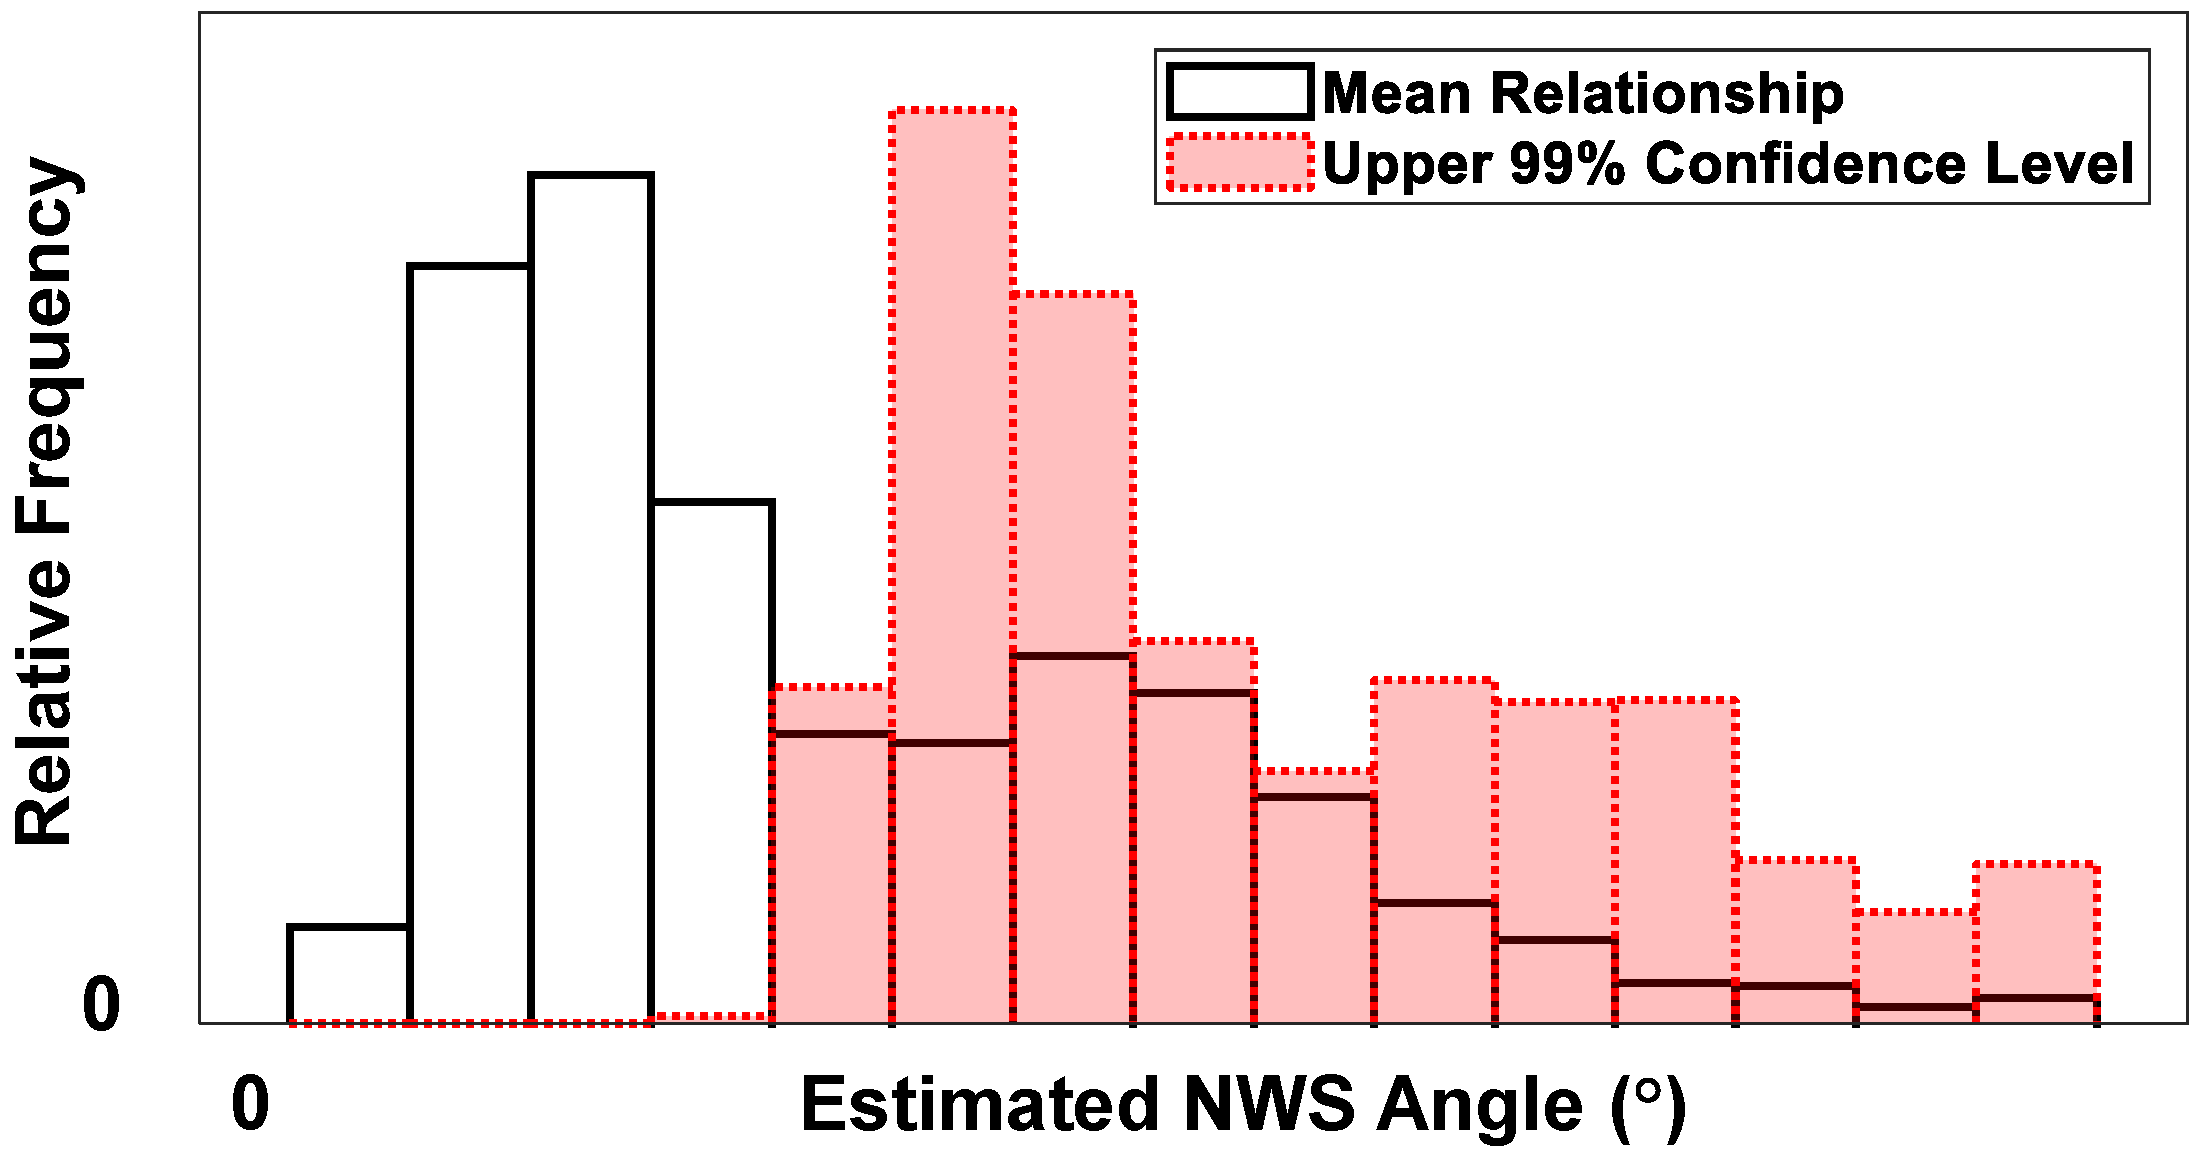
As a result, the scatter was captured through identifying the upper 99% confidence level of the linear relationship as shown in Figure 15, enabling a more conservative estimation of the maximum NWS angle occurring during a turn. It is important to note that the 99% confidence level relates to the uncertainty within the linear fit and is derived from the confidence interval on the fit parameters, rather than an estimate of the probability of an NWS value occurring for a given value of . Figure 17 shows the impact on the inferred NWS distribution when using the 99% confidence level relationship, leading to increased proportions of higher magnitude NWS values. Future work to improve the inference of NWS angles from ADS-B trajectories is presented in Section Limitations and Future Work.
Figure 17.
Impact on inferred NWS angle distribution when using 99% confidence level linear relationship.
Whilst the specific relationship shown in Figure 15 may not hold for aircraft types other than the type from which the QAR data was sourced, the relationship does suggest that the values derived from ADS-B trajectories can be used as a proxy for the severity of turn performed. Consequently, the distributions of were identified for each of the fleets given in Table 1. It is important to note that histograms only show the proportion of turns for a given fleet with specific values, rather than the rates of turns of a given severity occurring as previously detailed in Section 3.2.
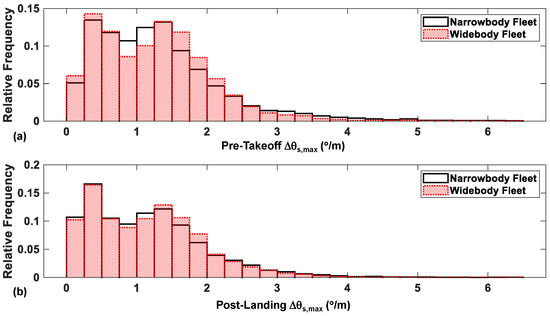
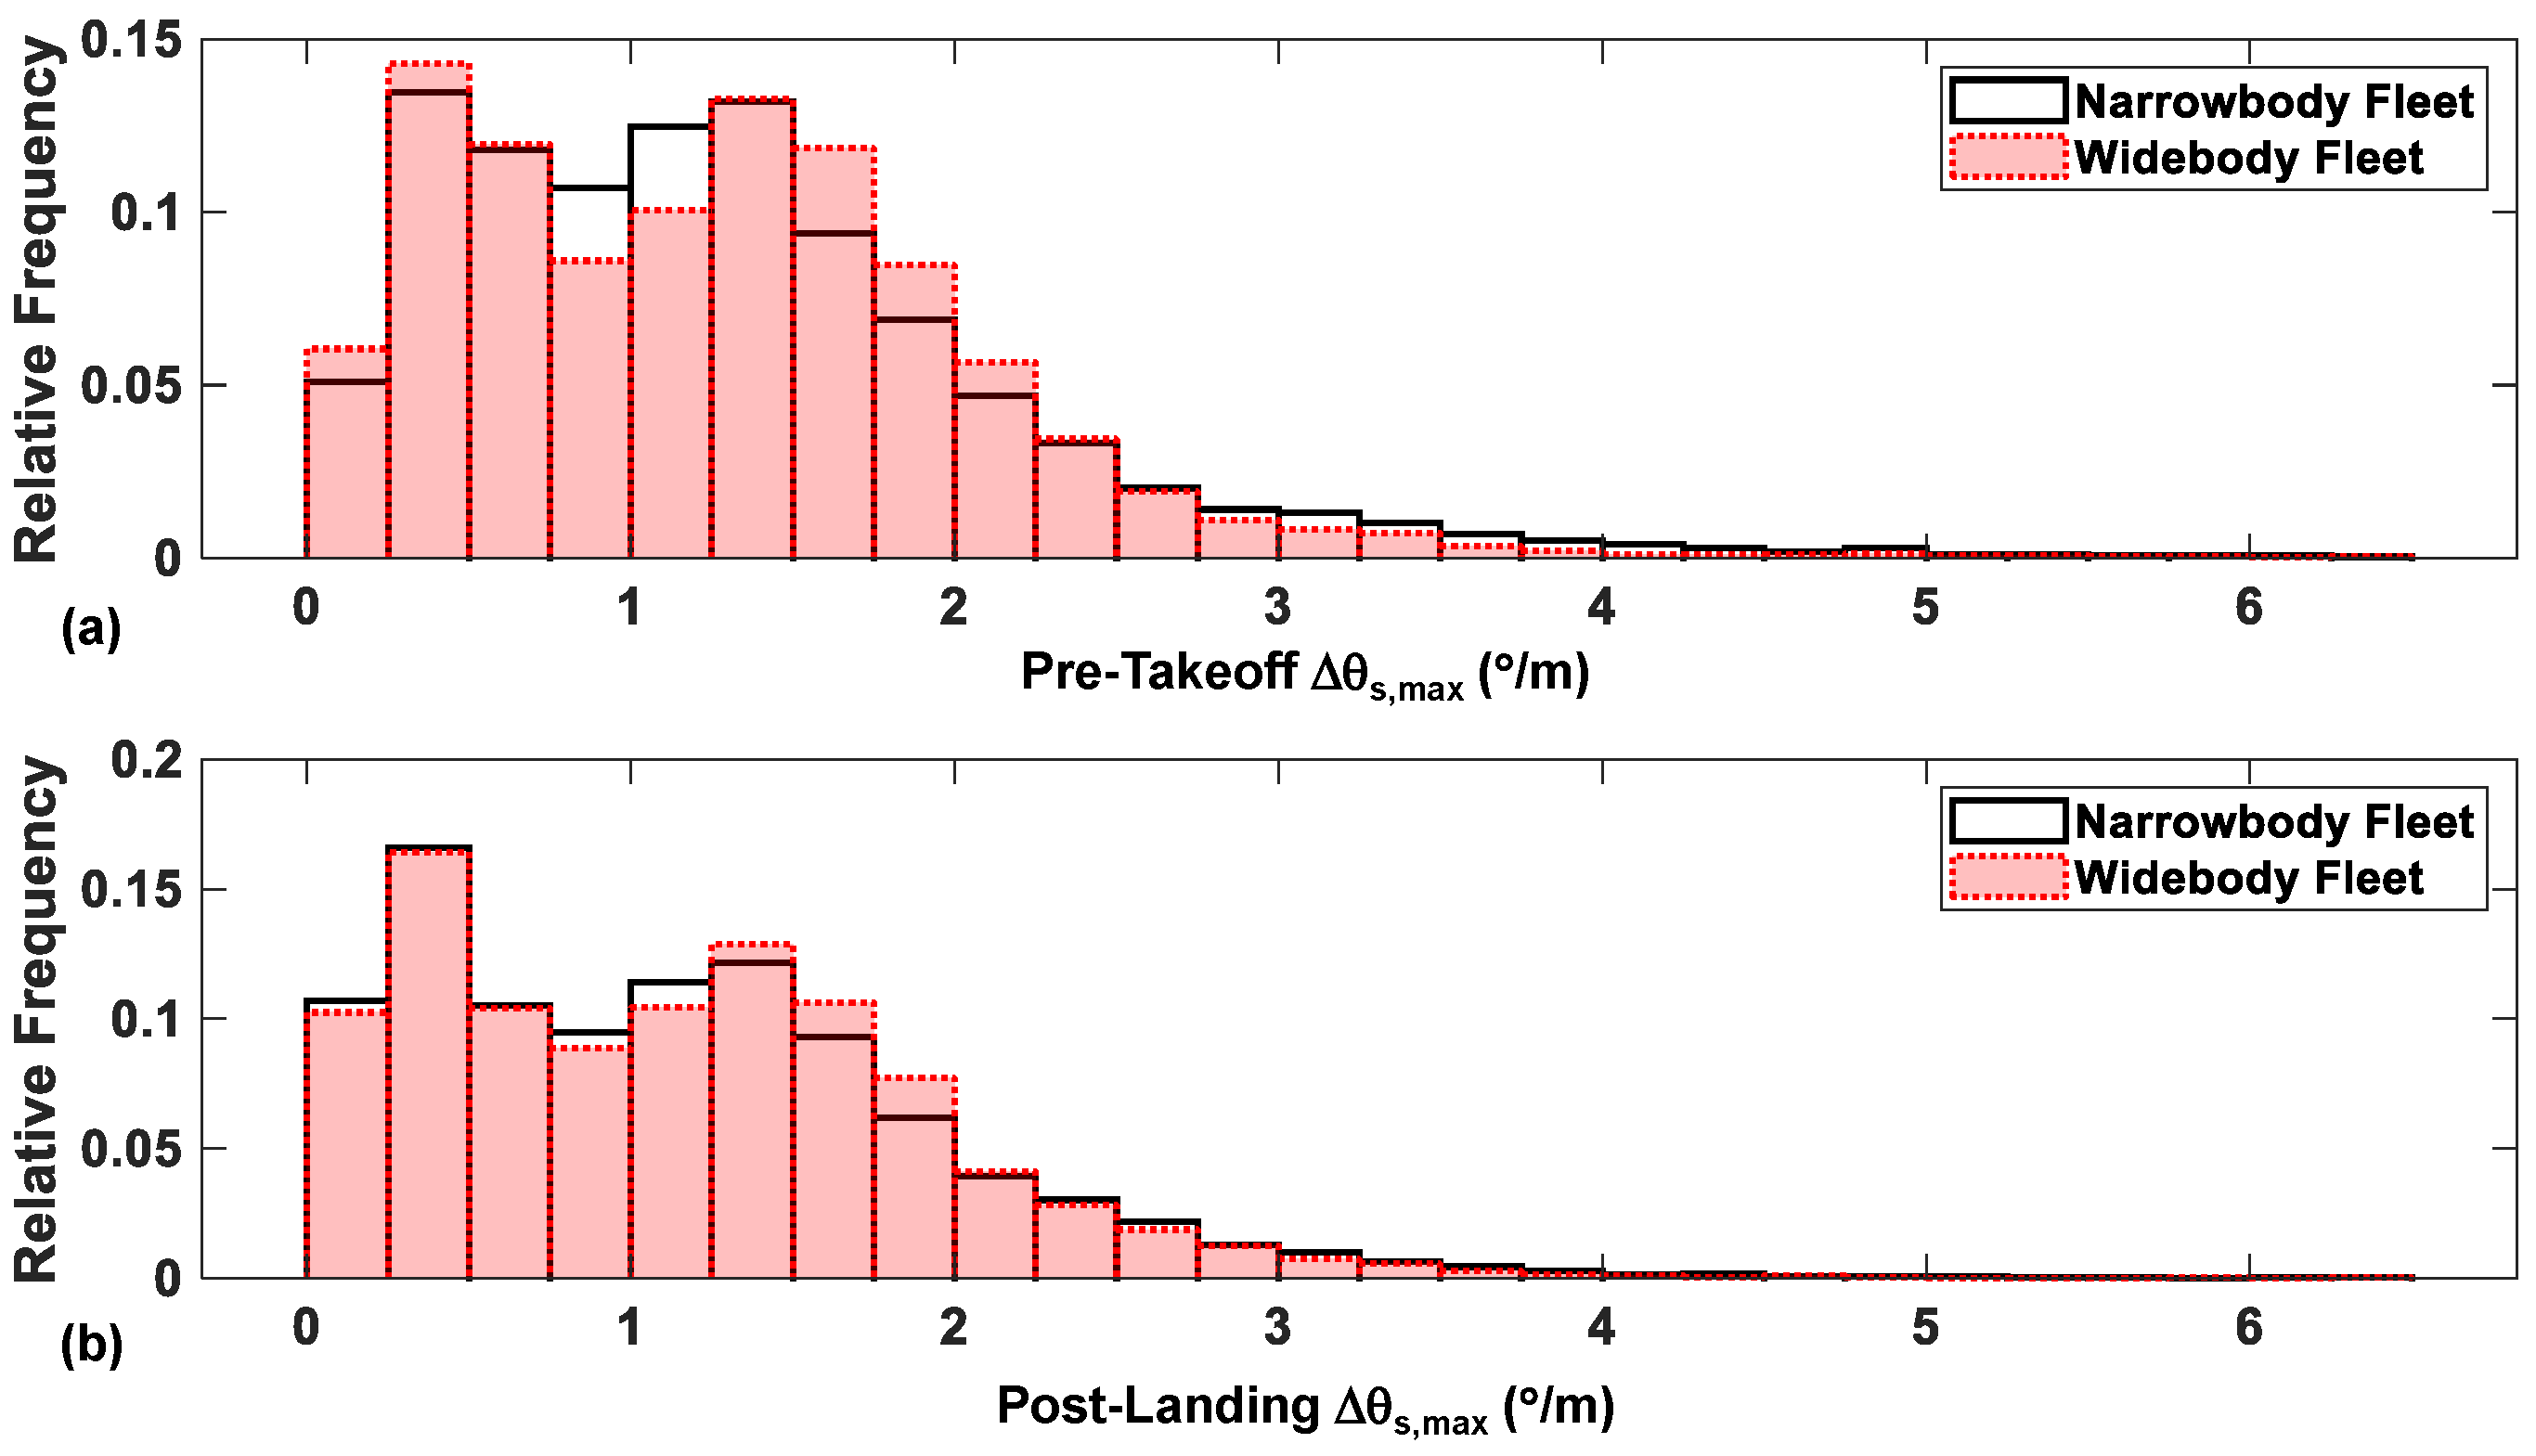
Figure 18 shows variability in values for all turns for both the narrowbody and widebody aircraft. It can be observed that the distribution shapes are all of a bimodal nature, with very strong agreement between narrowbody and widebody turns in Figure 18b. The bimodal behaviour shown in Figure 18 is likely to be a result of airport geometries using standardised turn radii and angles [25].
Figure 18.
Variability in maximum spatial turn rate for narrowbody and widebody aircraft during (a) pre-takeoff and (b) post-landing taxi phases.
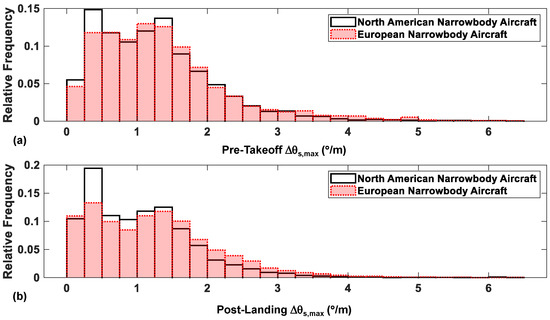
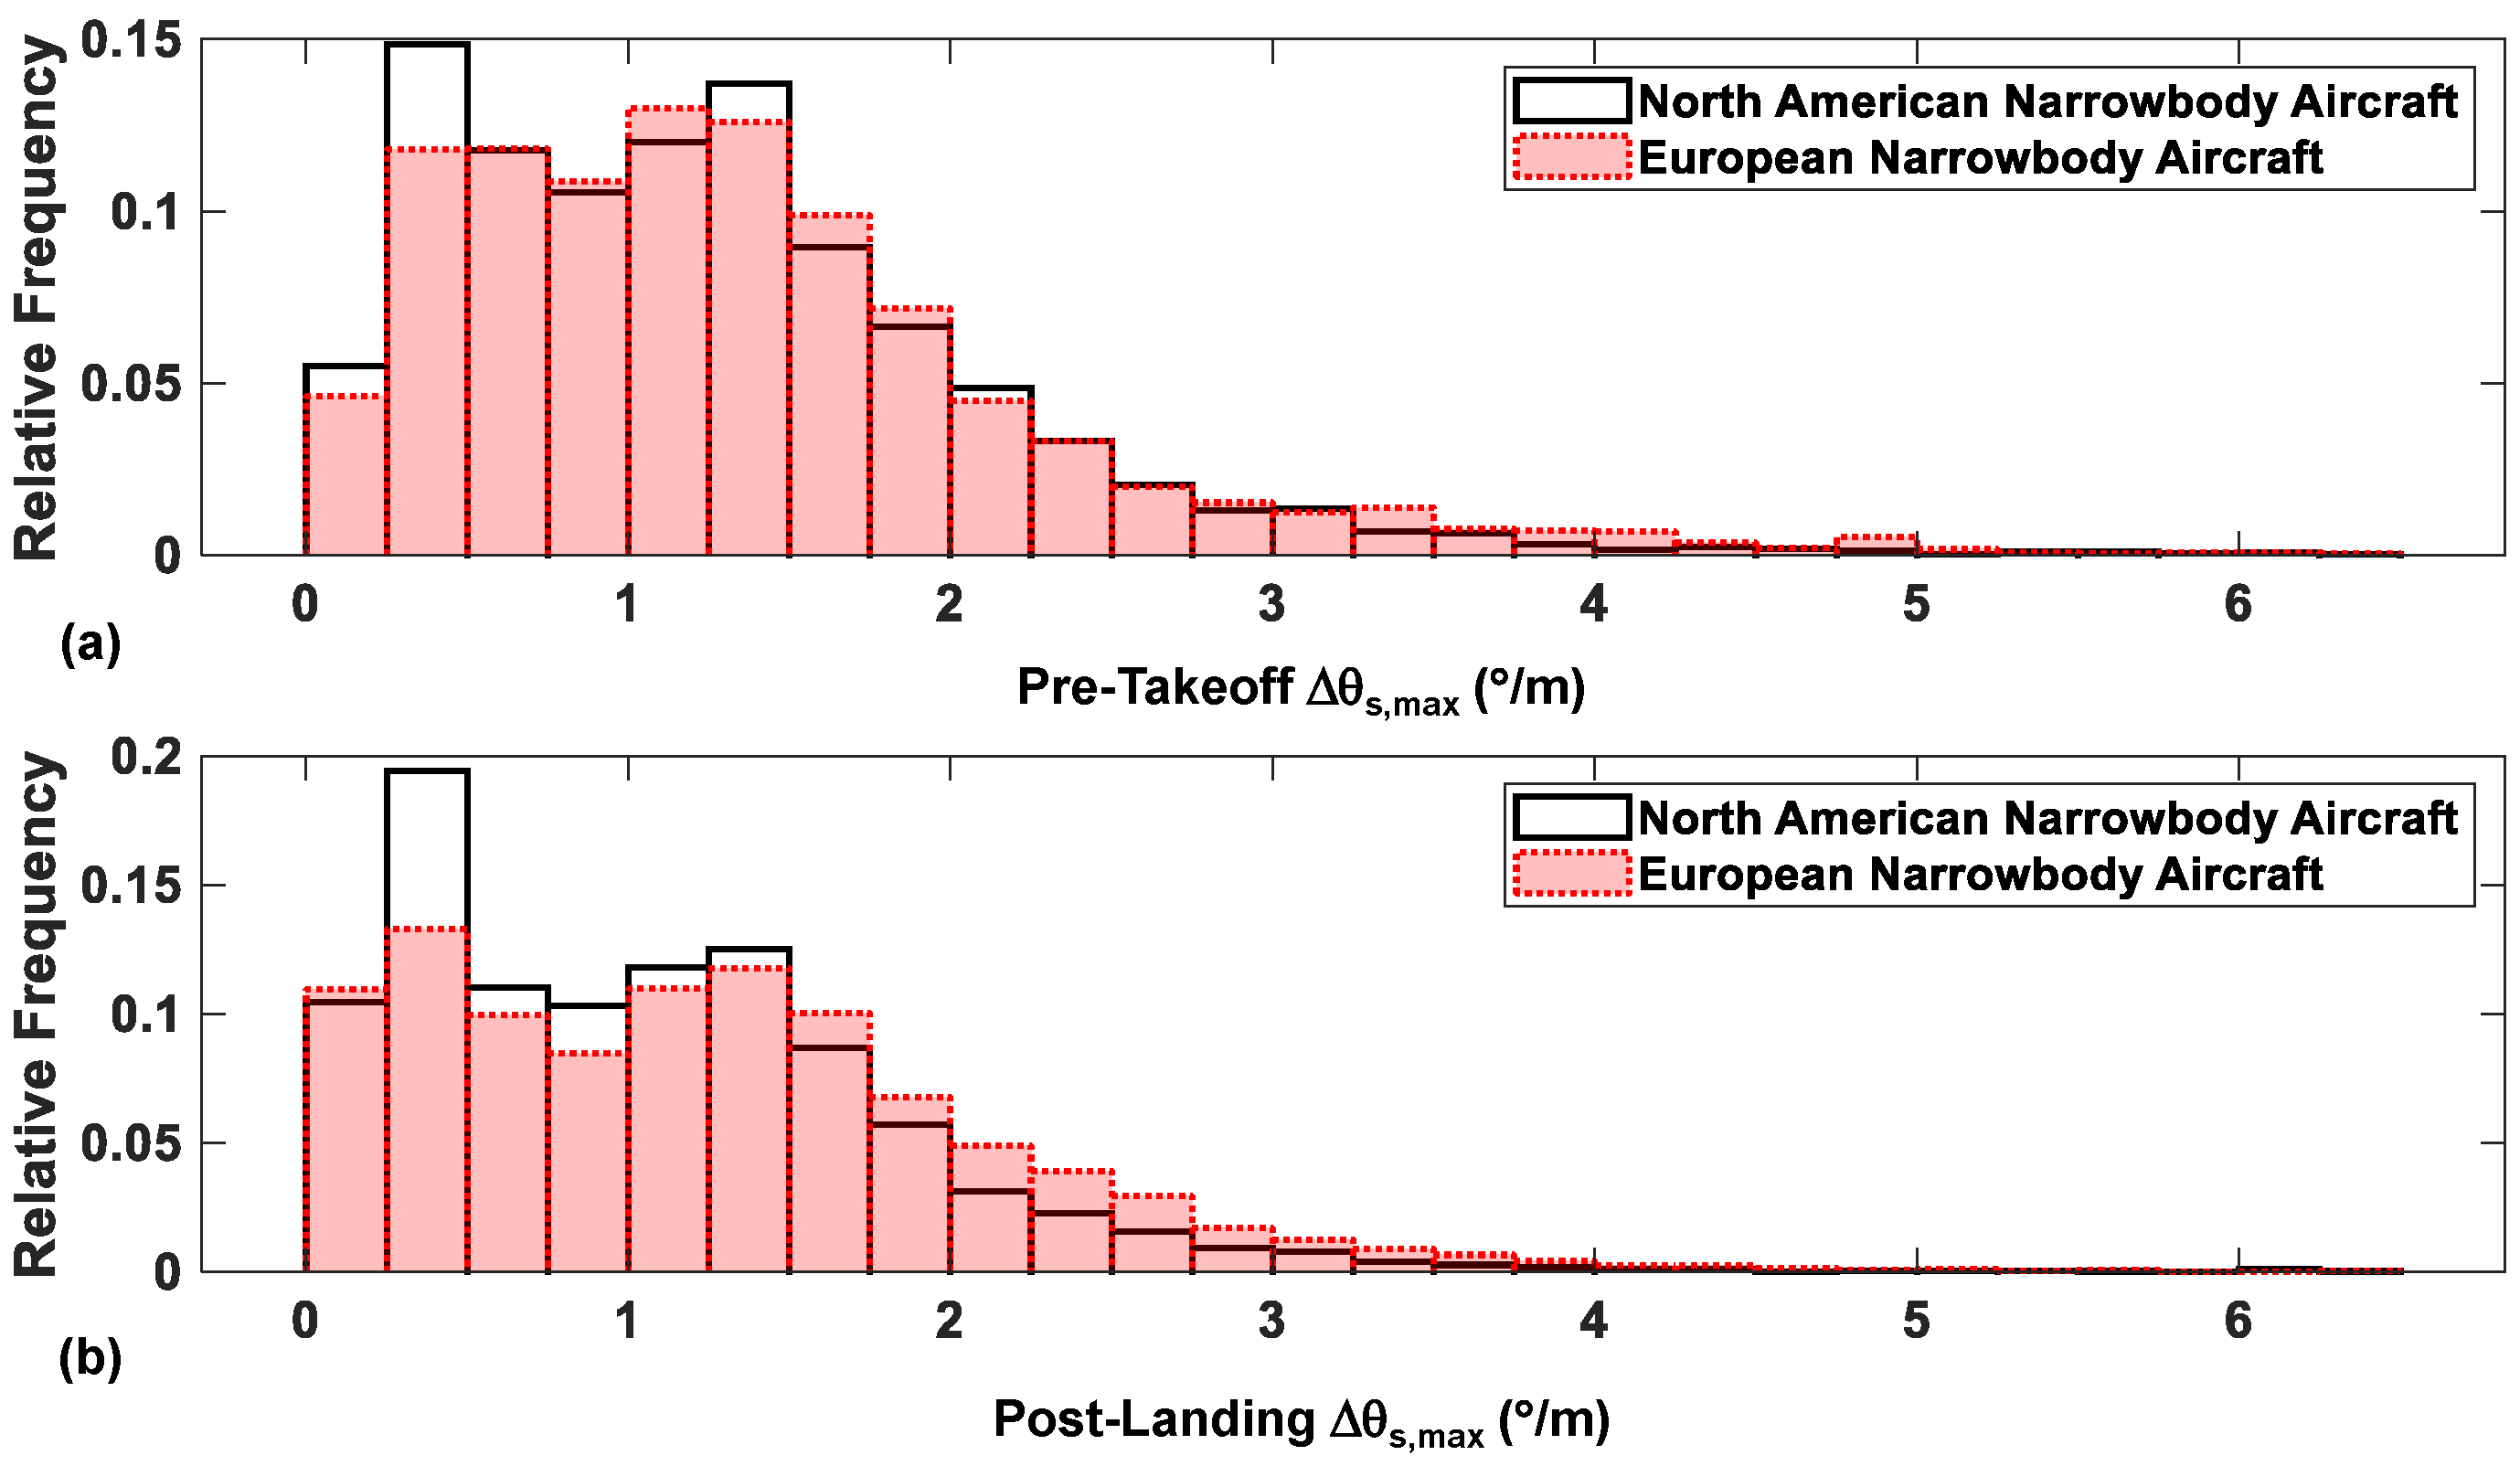
The limited sensitivity of the distribution of for taxiway turns to narrowbody aircraft geographical location is shown in Figure 19, in which the bimodal behaviour is once again visible. In both Figure 19a and Figure 19b it can be seen that North American aircraft have increased proportions of smaller turn severity for pre-takeoff and post-landing phases, respectively. Within Figure 19b it can be observed that European narrowbody aircraft have an increased proportion of turns exceeding the tight turn threshold, and this is expected to be as a result of the smaller geometries of European airports [37].
Figure 19.
Geographical impact on the variability in maximum spatial turn rate for narrowbody aircraft during (a) pre-takeoff and (b) post-landing taxi phases.
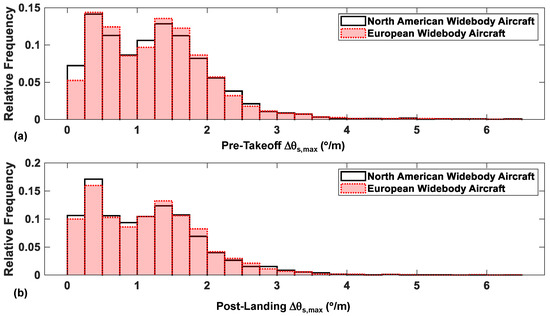
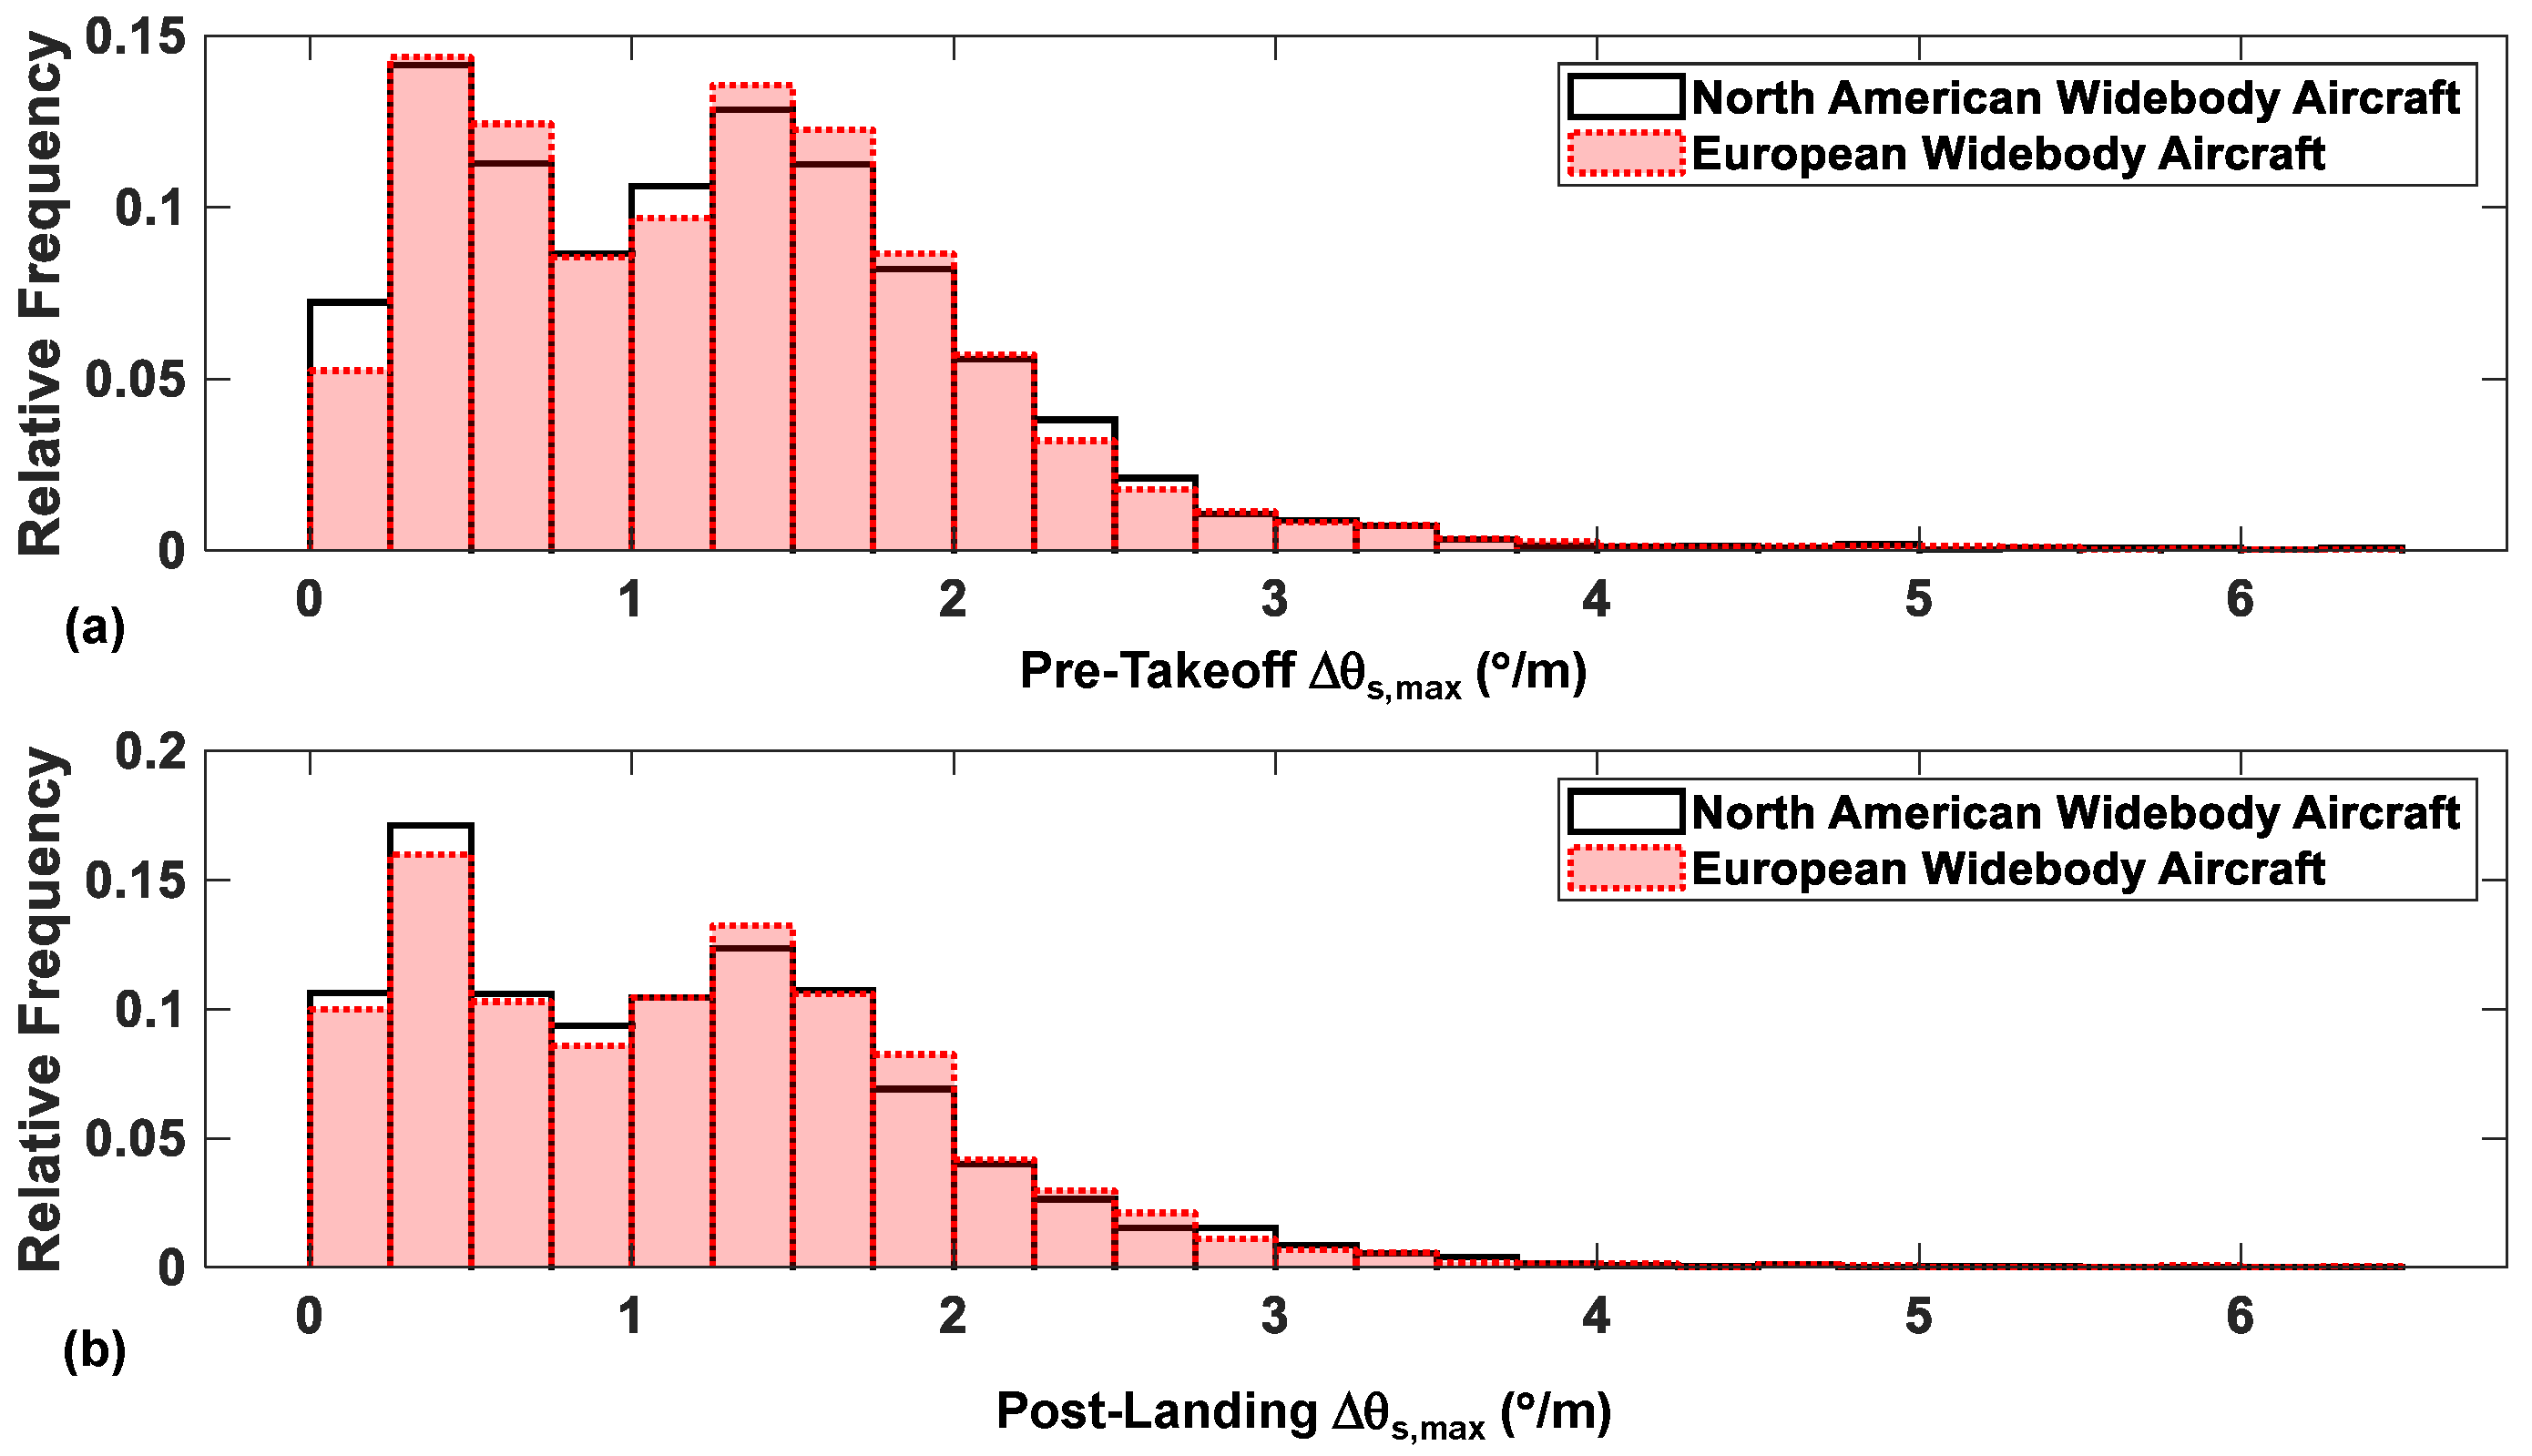
However, when considering the variability in turn severity for widebody aircraft, it can be observed that there is minimal impact of the aircraft’s geographical location on the distribution of as shown in Figure 20, where a bimodal distribution shape is present for both pre-takeoff and post-landing phases.
Figure 20.
Geographical impact on the variability in maximum spatial turn rate for widebody aircraft during (a) pre-takeoff and (b) post-landing taxi phases.
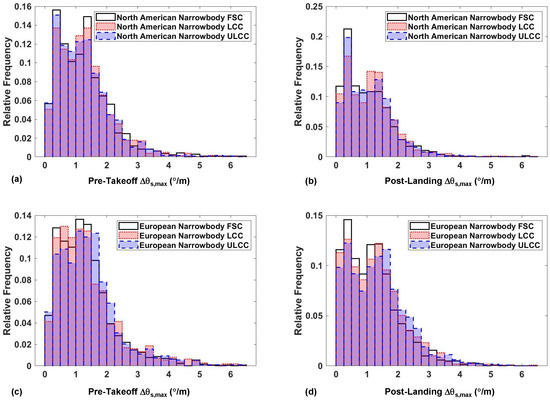
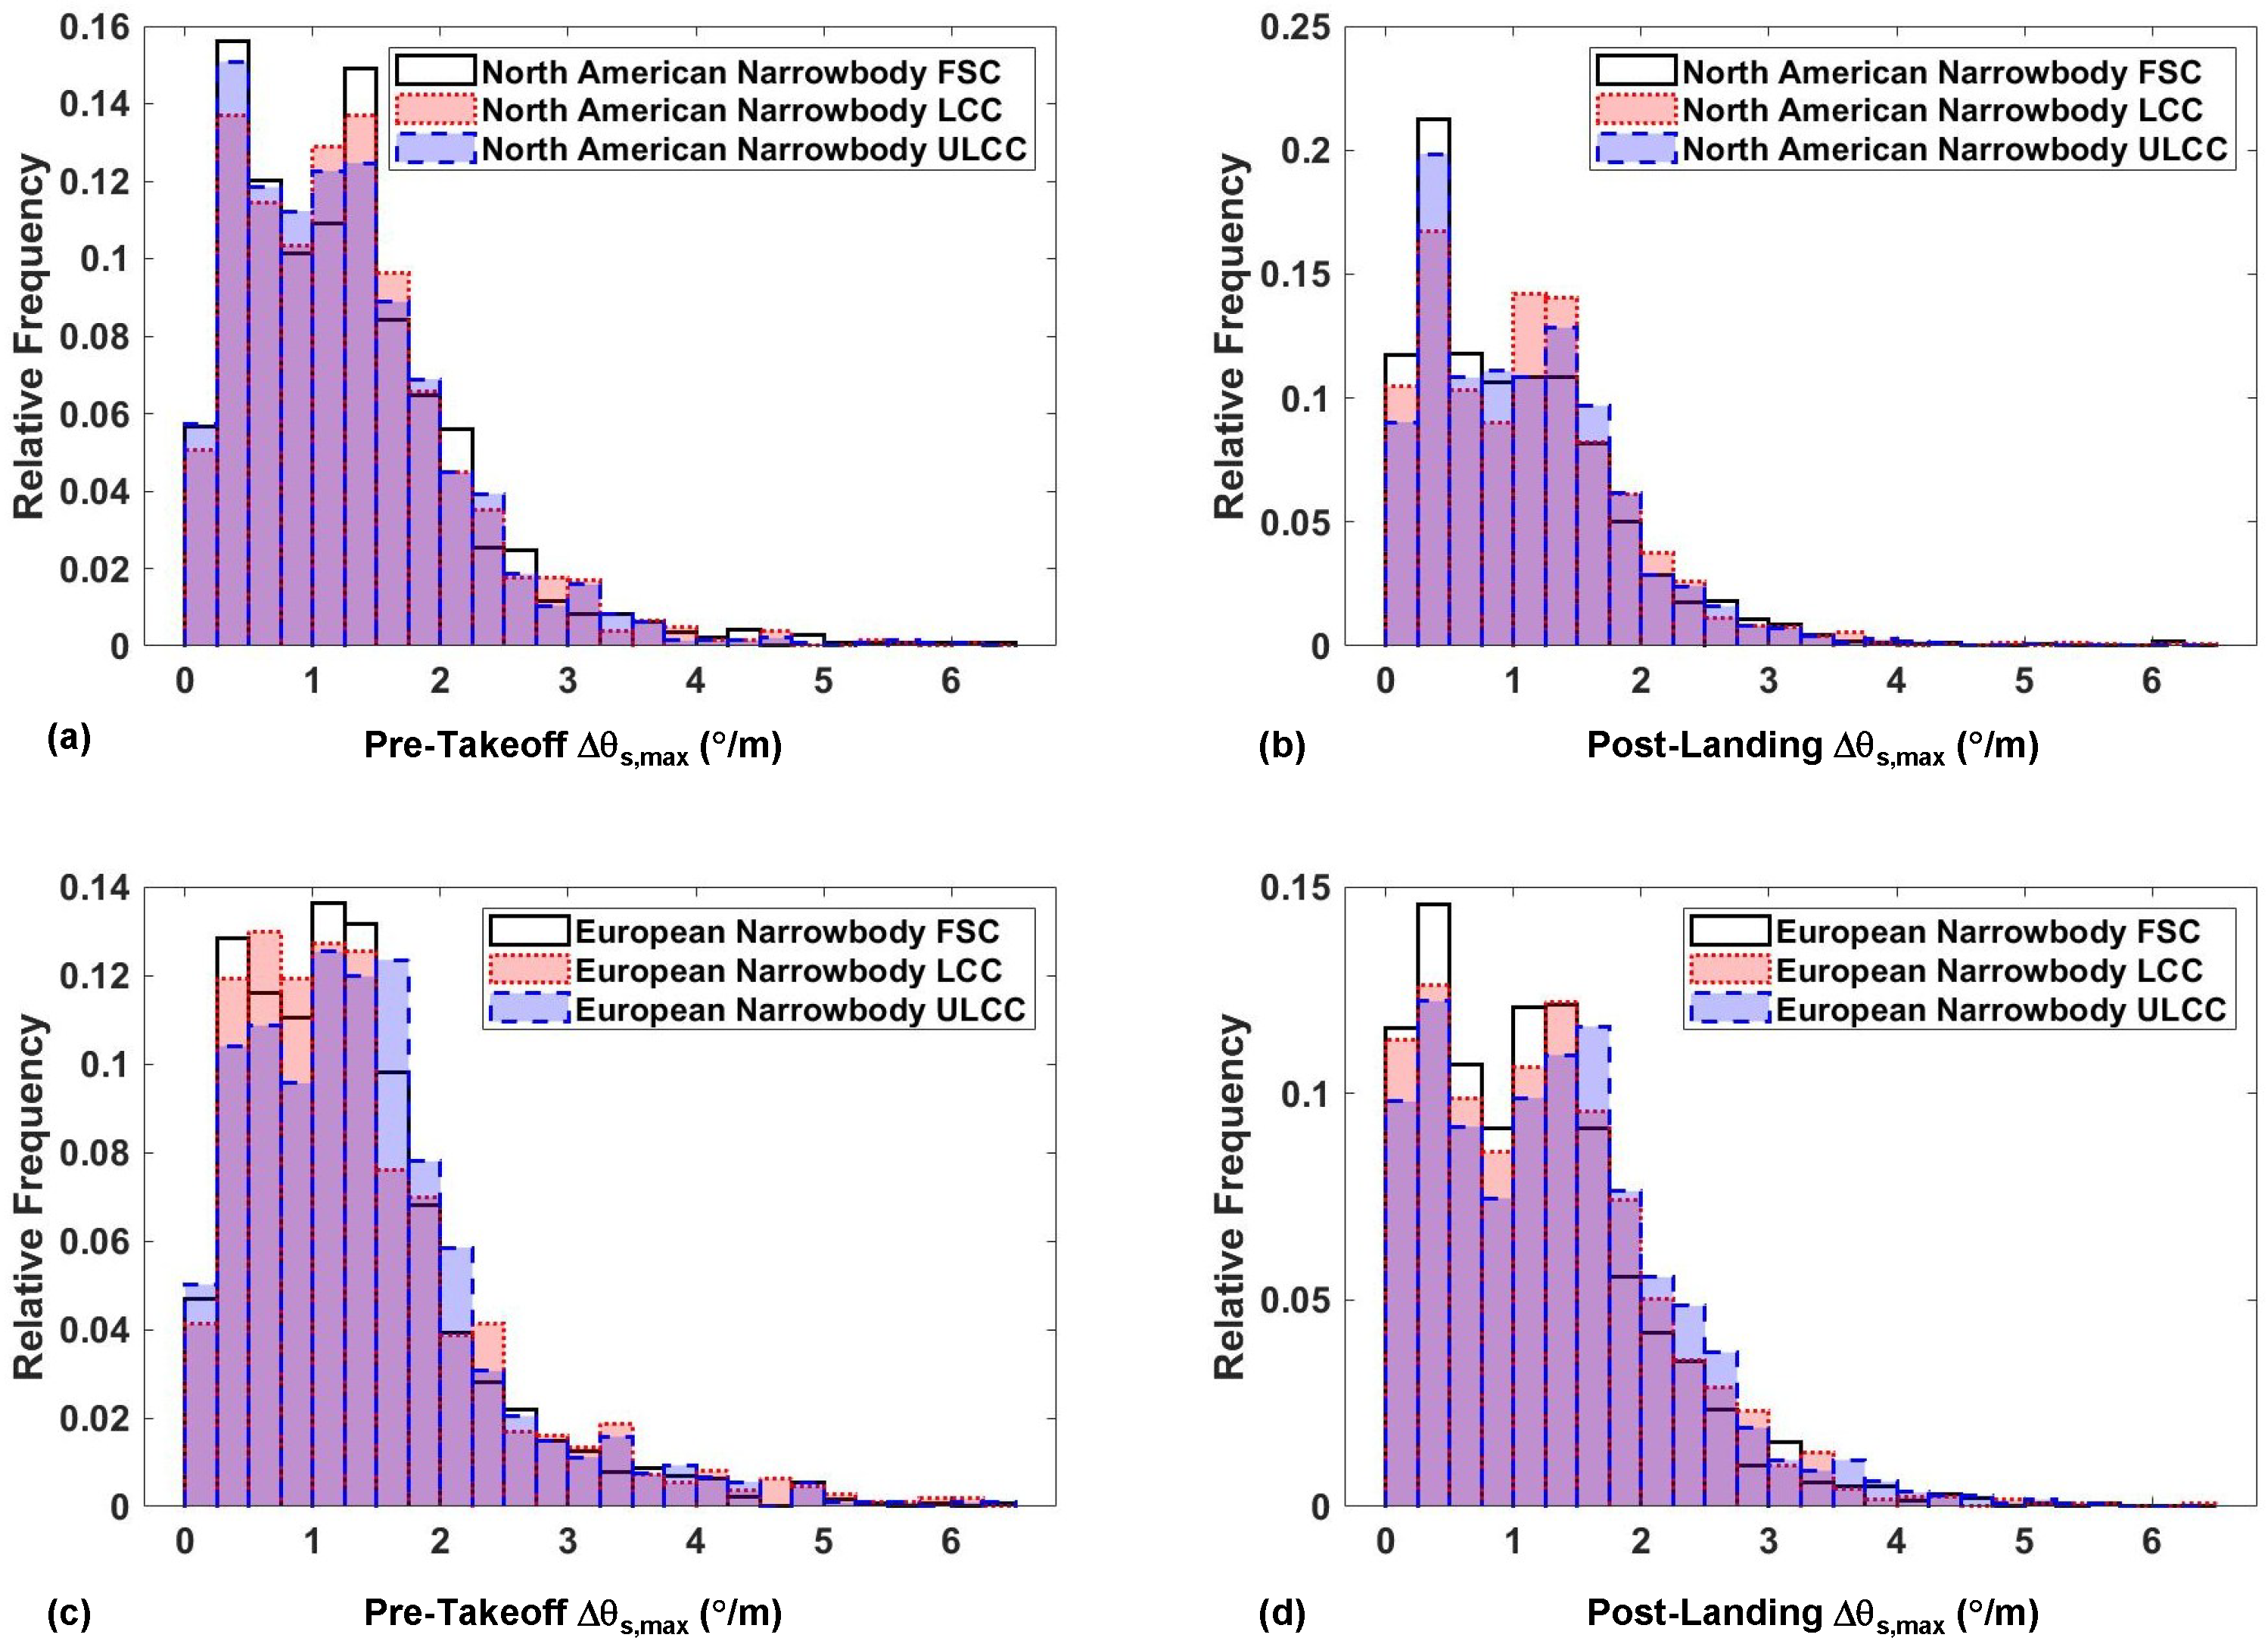
Concerning the impact of operator characteristics on the distribution of taxiway turn severity, it can be observed from Figure 21 that operator characteristics have a minimal impact on the distribution of for narrowbody aircraft, with only European ULCC aircraft showing increased proportions of mid- and high-severity turns in Figure 21c and Figure 21d for pre-takeoff and post-landing phases, respectively.
Figure 21.
Impact of operator characteristics on (a) pre-takeoff turn severity and (b) post-landing turn severity for North American narrowbody aircraft and (c) pre-takeoff turn severity and (d) post-landing turn severity for European narrowbody aircraft.
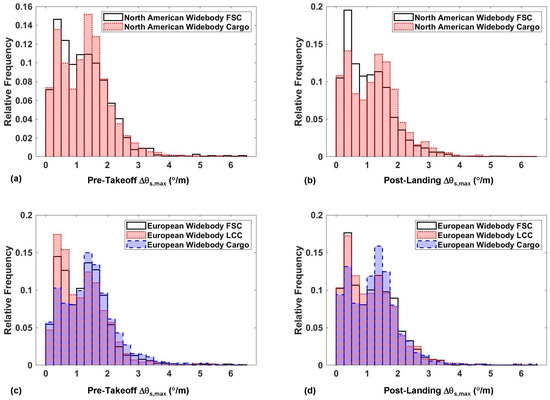
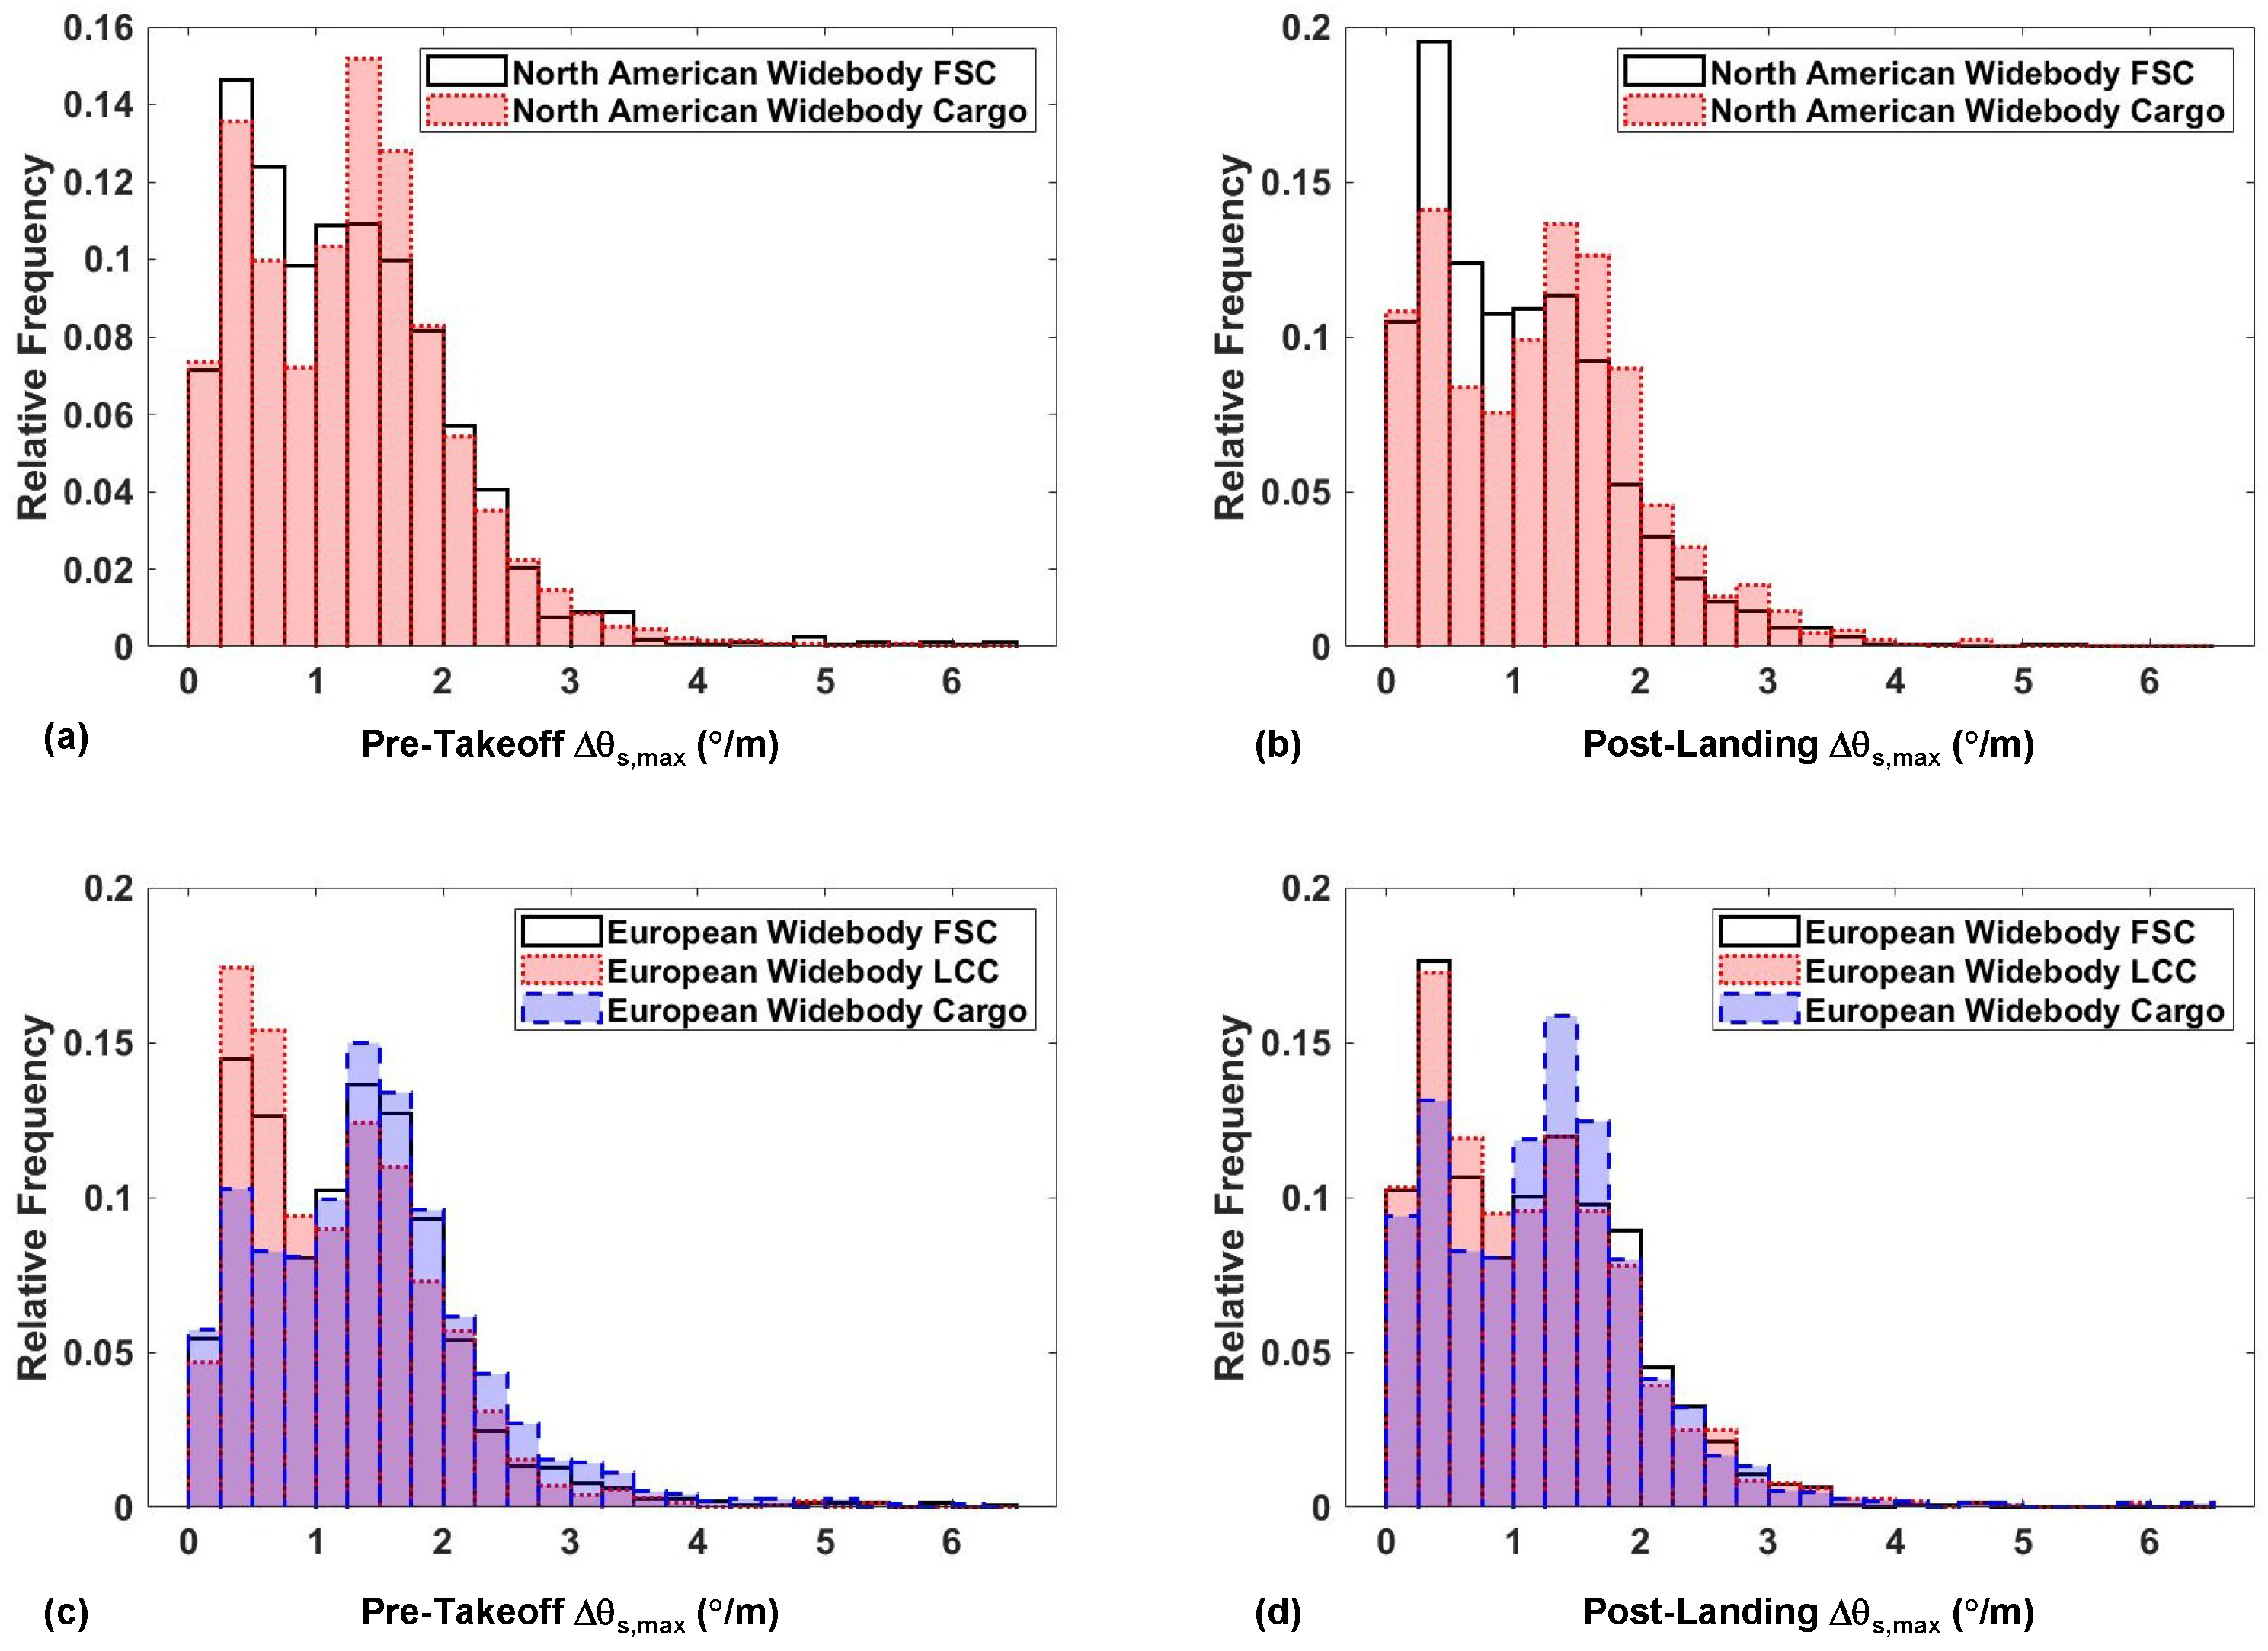
The distributions of for the taxiway turns of the widebody aircraft for different operator characteristics are shown in Figure 22. Across Figure 22, cargo widebody operators are observed to have turn severity distributions that tend towards higher values, potentially as a result of operating into different airport geometries, remote stands, or dedicated cargo locations at larger airports when compared to other operator types.
Figure 22.
Impact of operator characteristics on (a) pre-takeoff turn severity and (b) post-landing turn severity for North American widebody aircraft and (c) pre-takeoff turn severity and (d) post-landing turn severity for European widebody aircraft.
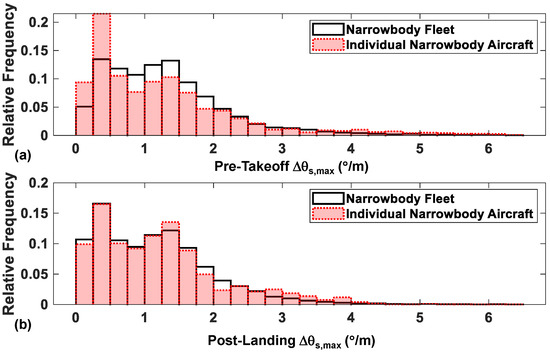
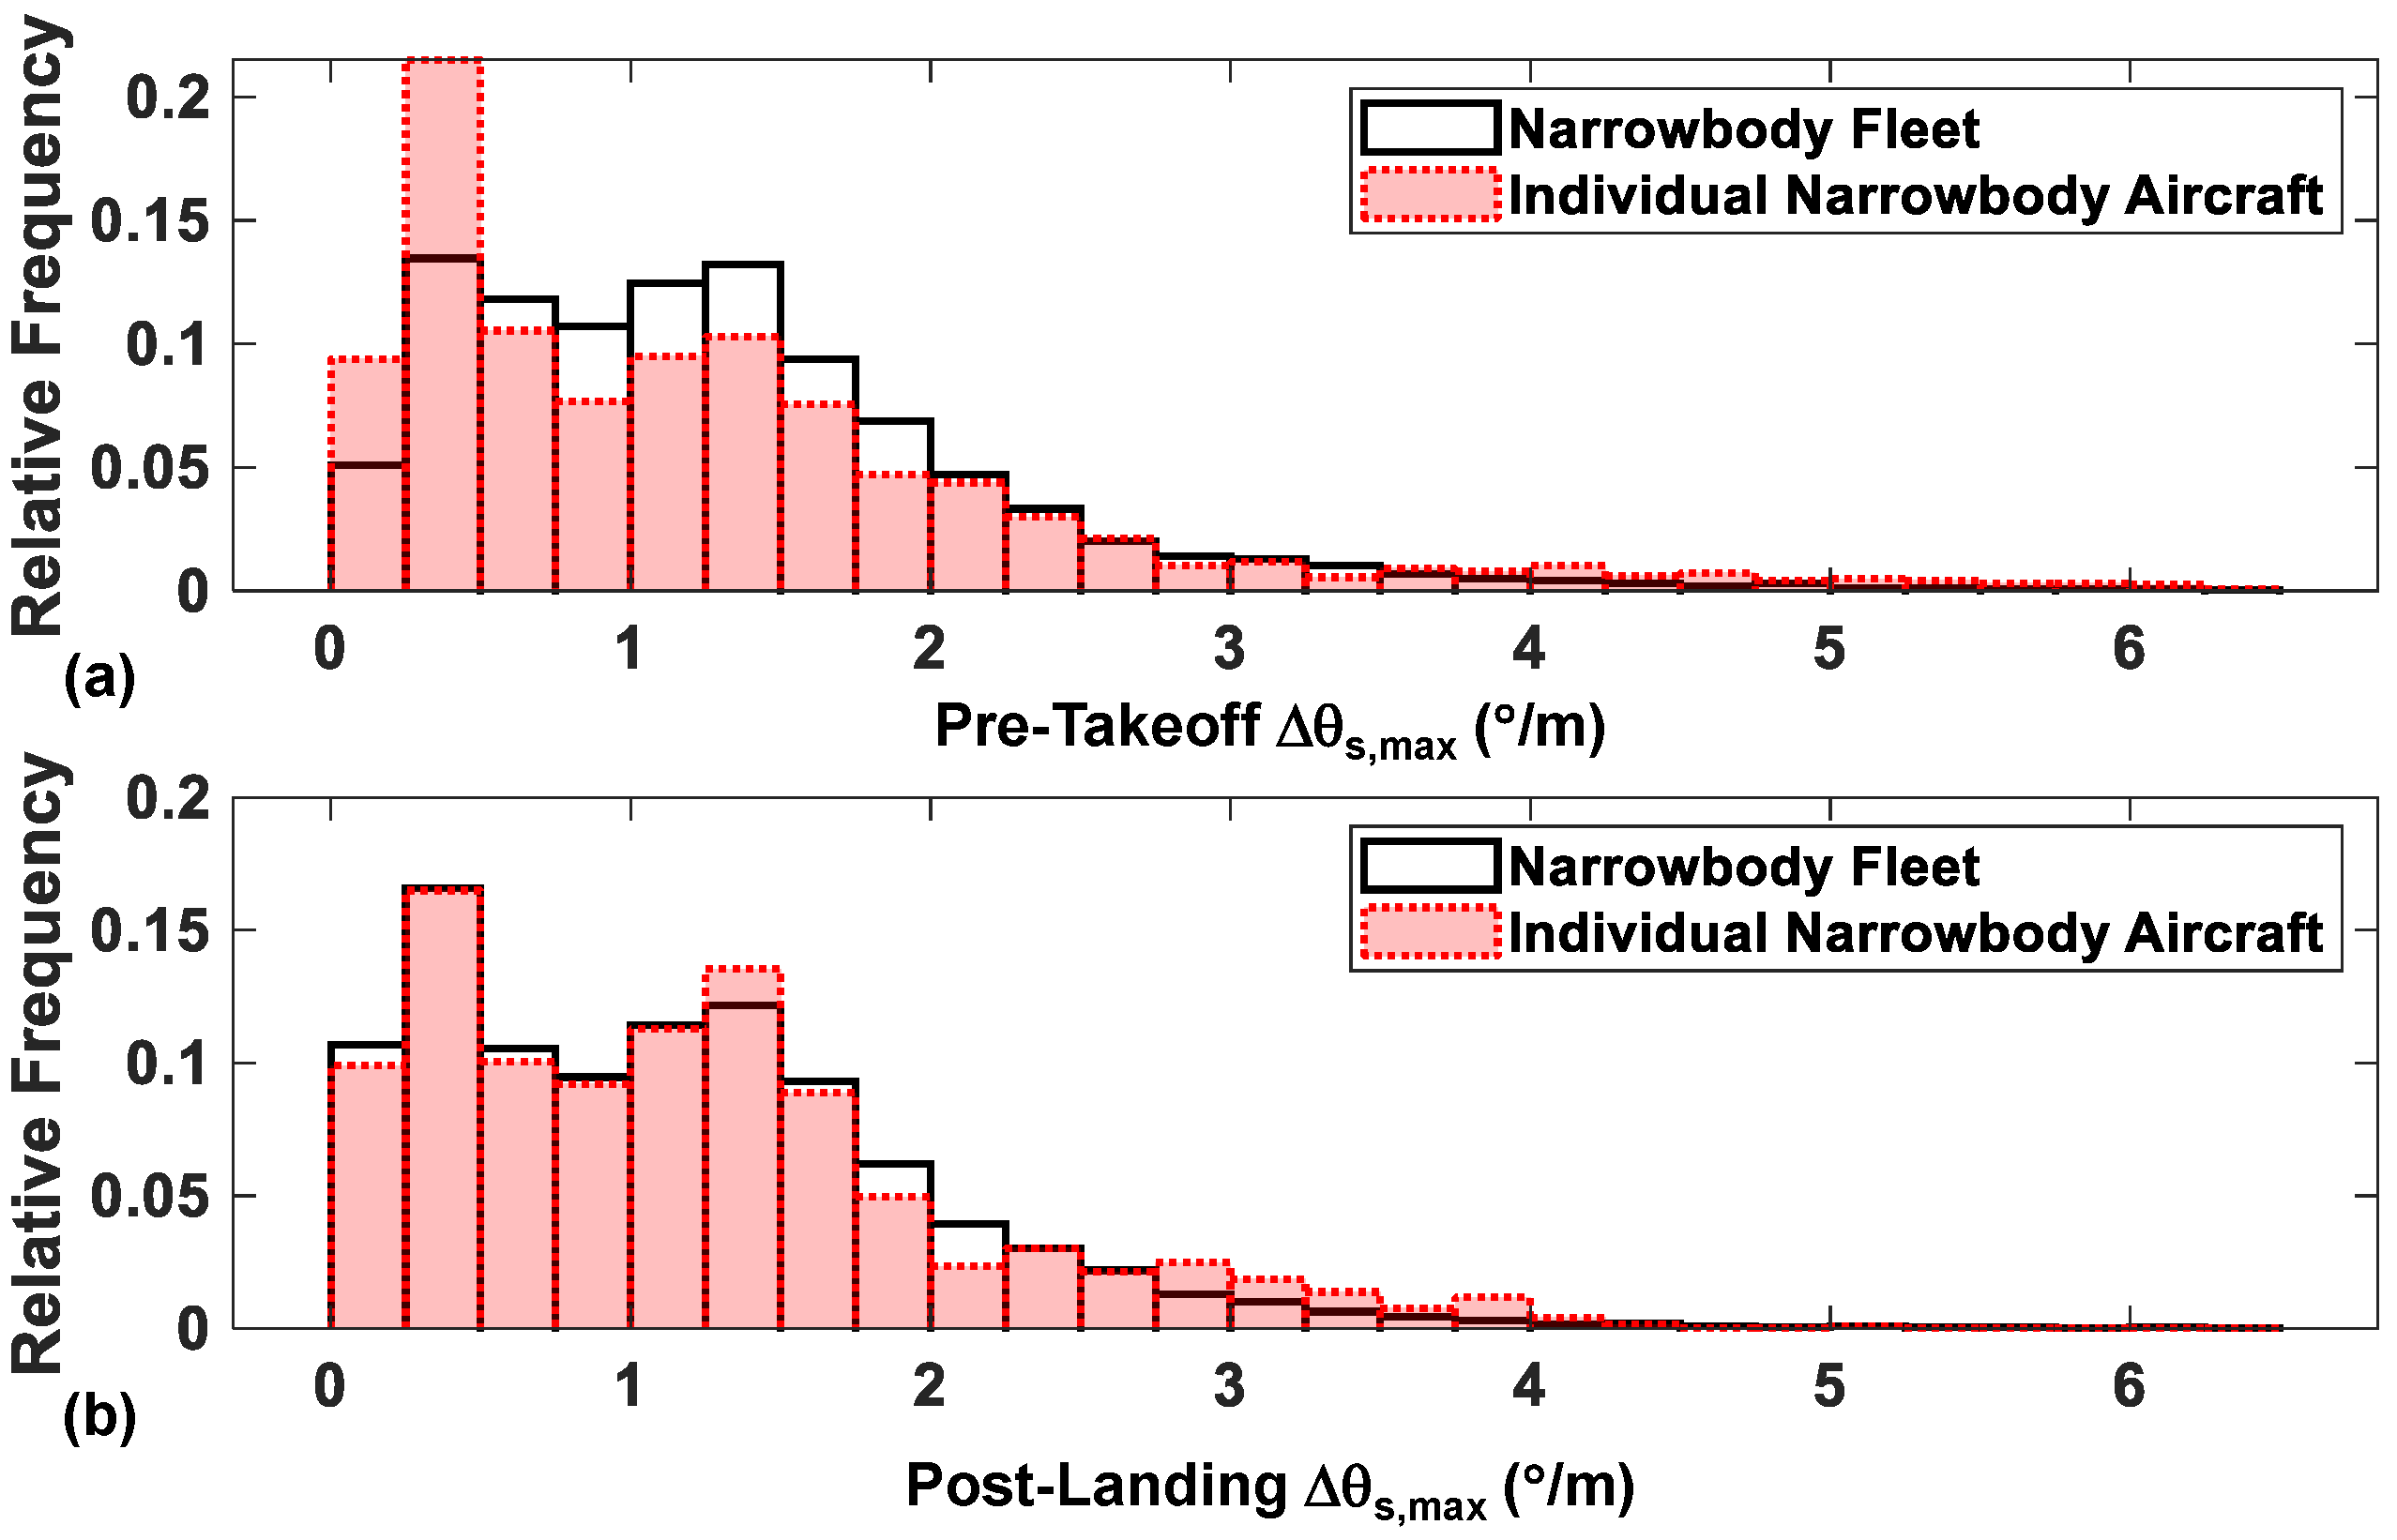
Finally, as a continuation of the studies presented in Section 3.3, the distributions for the individual narrowbody aircraft and individual widebody aircraft were compared to the overall fleets. Within Figure 23a it can be observed that the individual narrowbody aircraft has an increased proportion of low-severity turns coupled with a slight increase in the proportion of high-severity turns at 3.5°/m. In a similar fashion, Figure 23b shows an increase in the proportion of turns above the tight turn threshold compared to the overall narrowbody fleet, whilst at lower values of the distribution shape is consistent.
Figure 23.
Histograms of per-flight (a) pre-takeoff turn severity and (b) post-landing turn severity of the overall narrowbody fleet and an individual narrowbody aircraft.
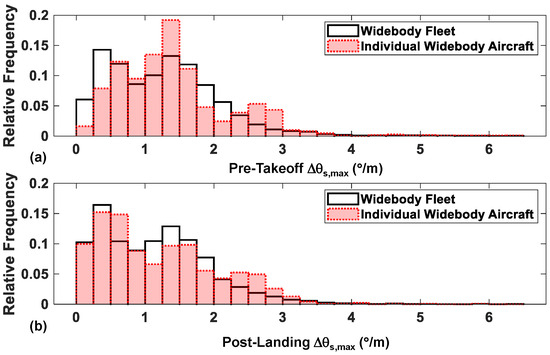
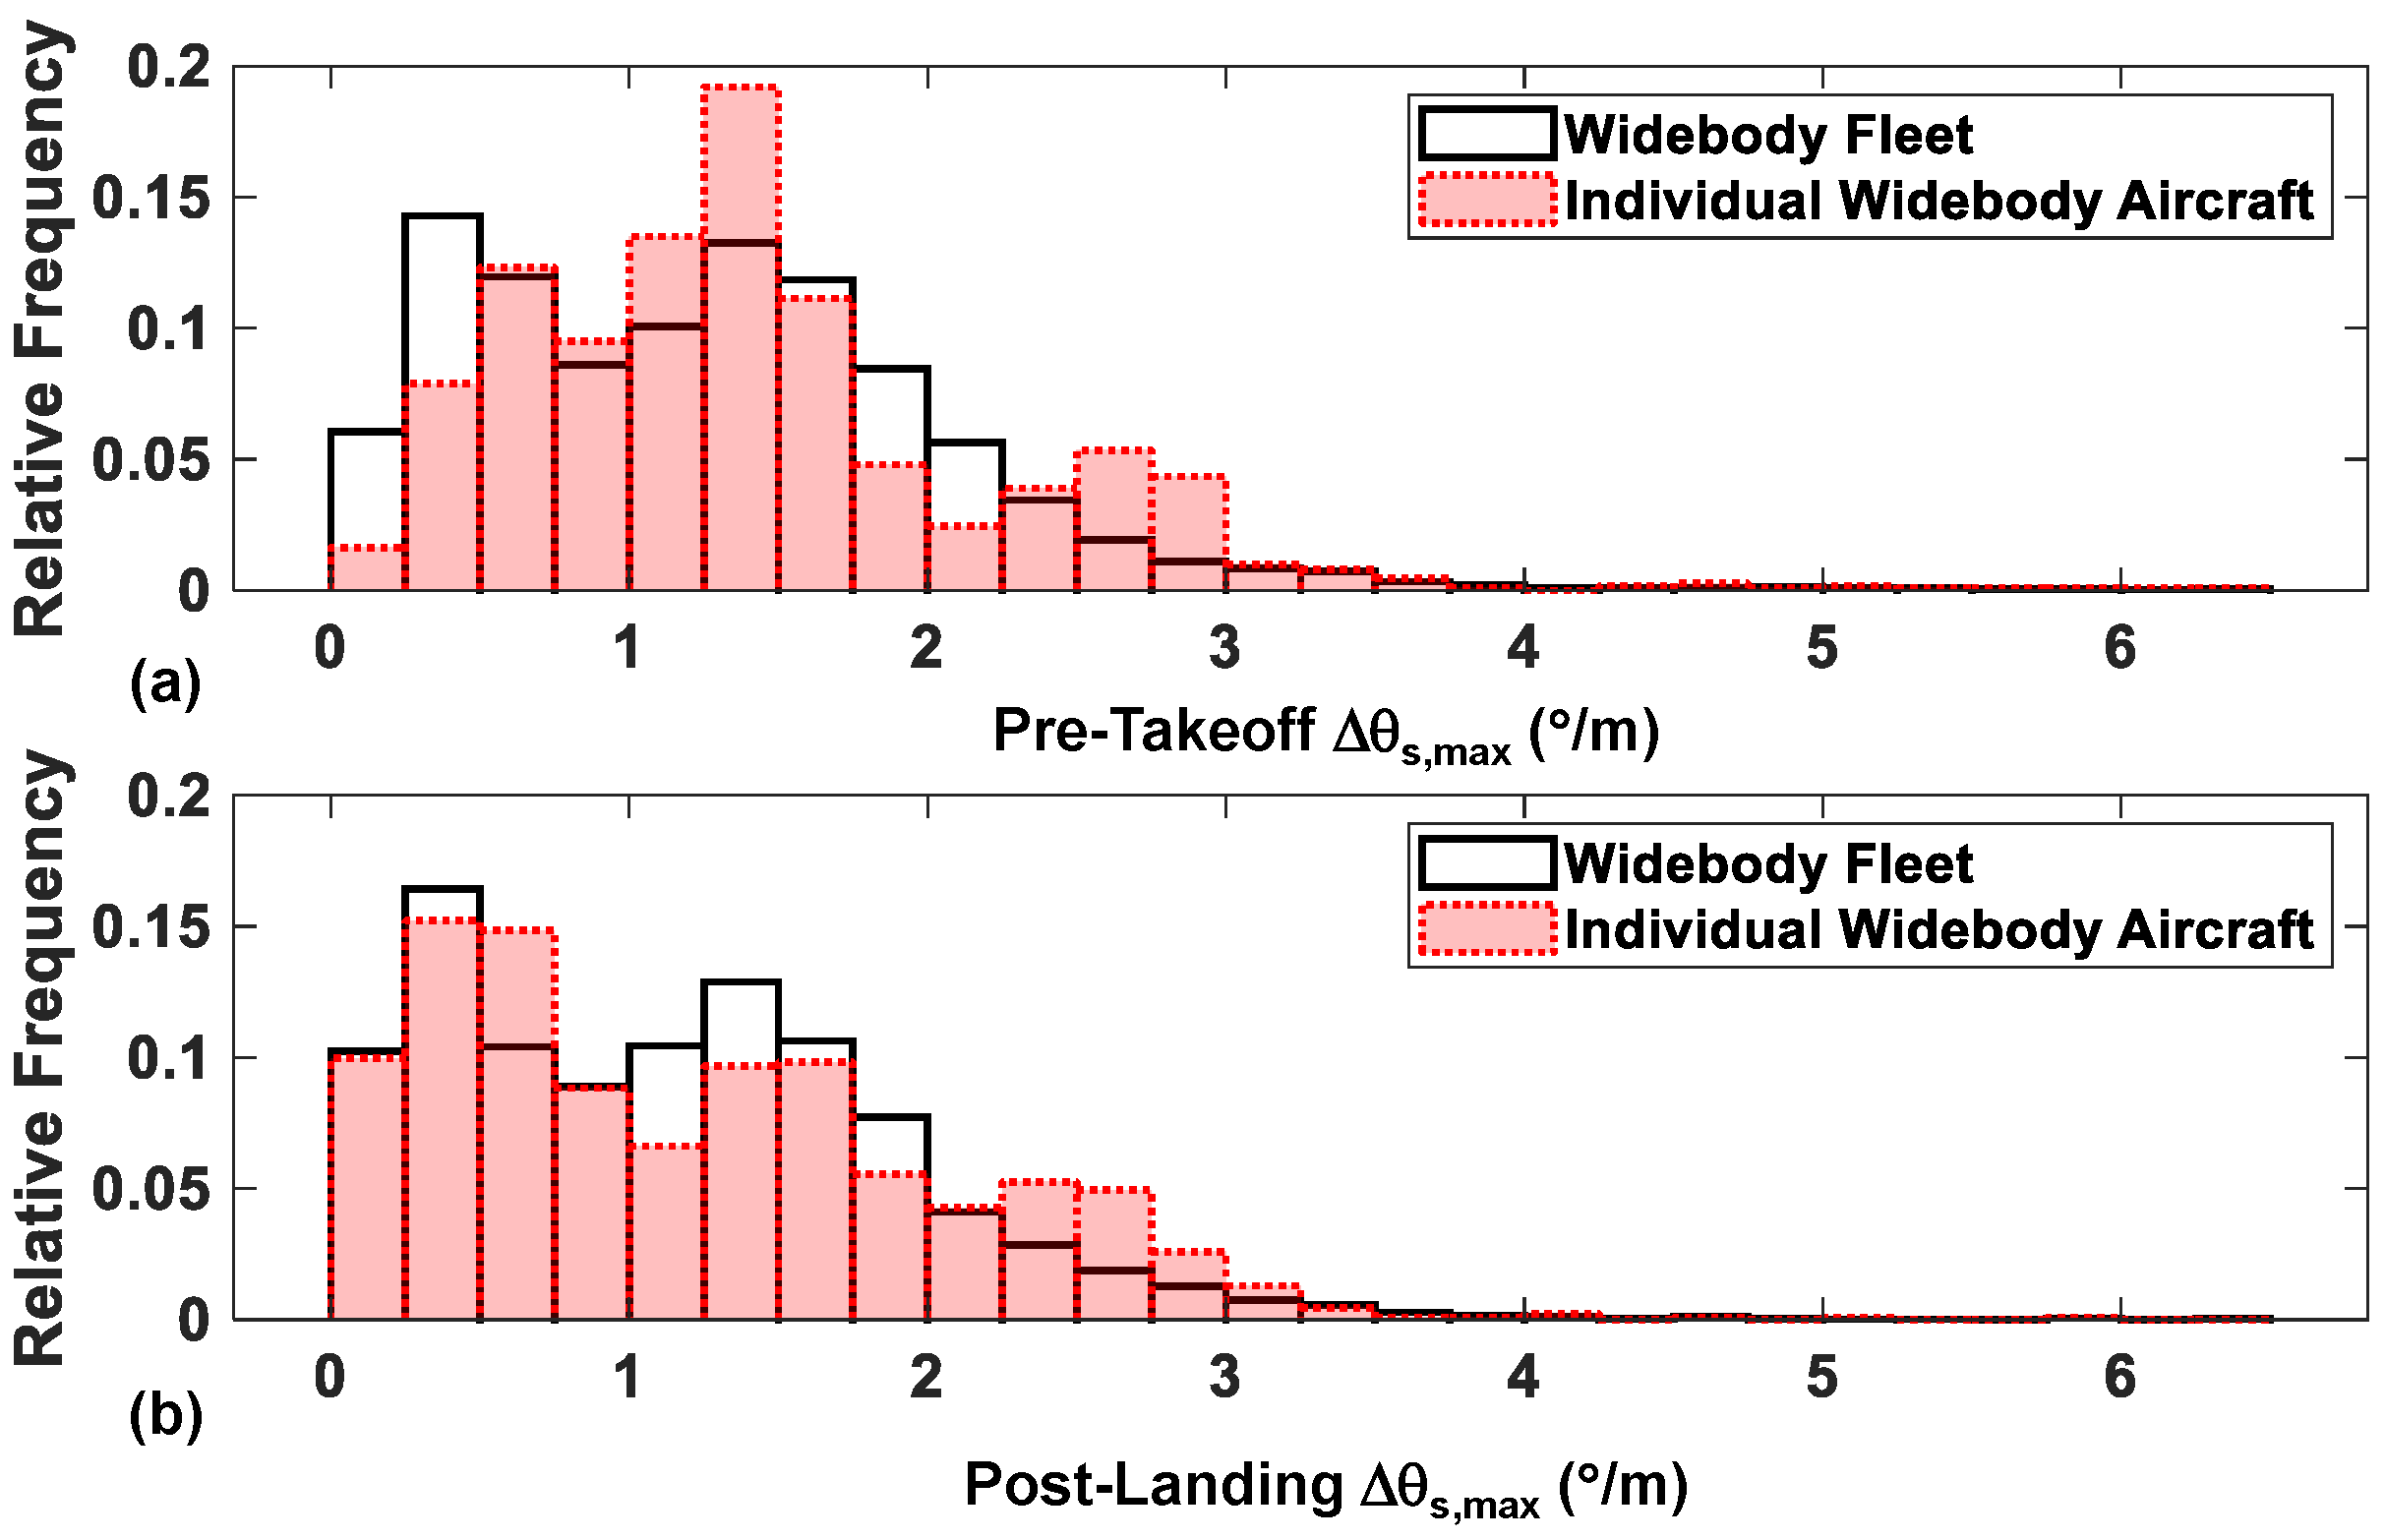
The distribution in turn severity for individual widebody aircraft shows even greater disparity when compared to the overall widebody fleet, as shown in Figure 24. Within the pre-takeoff taxi phase shown in Figure 24a, a significant increase in the proportion of high-severity turns can be observed for values 2°/m, with a significant reduction in the proportion of turns with low values of . In addition, Figure 24b shows a trimodal distribution of turn severity, clearly highlighting the impact of the specific route network of the individual aircraft compared to the overall fleet.
Figure 24.
Histograms of per-flight (a) pre-takeoff turn severity and (b) post-landing turn severity of the overall widebody fleet and an individual widebody aircraft.
Therefore, Figure 18, Figure 19, Figure 20, Figure 21, Figure 22, Figure 23 and Figure 24 have demonstrated the utility of investigating the distribution in turn severity using values from ADS-B to identify aircraft that deviate significantly from the expected bimodal distribution and proportions of the overall fleet.
4. Discussion
Whilst the previous section has provided a detailed comparison of the ground turn occurrences and characteristics between the different fleets, the results need to be placed within the context of guiding future Structural Health Monitoring (SHM) and Remaining Useful Life (RUL) activities for aircraft landing gear.
Firstly, it has been observed that there are differences in the ground turn characteristics between narrowbody and widebody aircraft, with widebody aircraft tending to perform a higher number of turns on a per-flight basis and presenting a higher occurrence rate of tight turns in-service. Whilst this could suggest that widebody aircraft would be a preferred route for deploying SHM activities, previous work within the FAA statistical loads monitoring states that narrowbody aircraft are exposed to a higher magnitude of side loading during ground manoeuvres [9]. In addition, widebody aircraft ground turn statistics were shown to have a reduced sensitivity to the aircraft’s geographical operating location when compared to narrowbody aircraft. It is interesting to note that prior work concerning regional airliners also demonstrated sensitivity of turn characteristics to geographical location, and this would consequently suggest that smaller aircraft may be exposed to increased operational variability and would therefore represent the most suitable platform for SHM and RUL activities.
However, specific operator characteristics, most notably cargo and Ultra-Low-Cost Carrier (ULCC) operators were observed to lead to deviations in the per-flight occurrence of turns. For widebody aircraft, cargo fleets, were observed to have significantly different per-flight variability in turn occurrences to the remainder of the fleet and the ULCC narrowbody aircraft demonstrated increased rates of tight turns. Consequently, such an observation would position SHM and RUL activities at specific operator types, regardless of aircraft type. Such a suggestion is further strengthened by the ground turn statistics of the individual narrowbody and widebody aircraft, which both showed significantly different characteristics to the overall fleet, with occurrence rates for fatigue-critical pivot turns at least double that of the remainder of fleet.
As a result, the findings of this paper have highlighted that SHM and RUL activities may be better targeted at airframes known to have ground manoeuvre statistics that deviate from the overall fleet. In addition, the ADS-B trajectories and the methodology presented in this paper provide the route to identifying such airframes, especially considering the occurrence rate of fatigue-critical tight and pivot turns. Prior work has also discussed the wider impact of exploiting ADS-B trajectories for landing gear design [4].
Such an approach can be further strengthened through the inference of aircraft system parameters, such as Nose Wheel Steering (NWS) angle from ADS-B trajectories, and further development of such techniques should be explored as a priority. It is interesting to note that the estimated NWS histograms derived from ADS-B data shown previously in Figure 16 are consistent with prior studies, in which the NWS angle was recorded for a transport aircraft during taxi [3]. The histograms presented in prior work also exhibit the mild bimodal response and small peak at large NWS angles [3], as captured in Figure 16a, providing increased confidence in the use of the linear relationship identified in Section 3.4.
Limitations and Future Work
The limitations of the presented study can be partitioned into those relating to available ADS-B data and the reliability of the employed methodology.
Firstly, the presented study has only considered the geographical locations of North America and Europe, in response to the increased levels of ADS-B ground coverage observed within these regions. Future studies should aim to explore other geographical regions to verify that the observations in Section 3 hold when considering the entire worldwide fleet. This consideration is especially true for widebody aircraft, where it is expected that comparing North American and European aircraft will lead to a large number of routes being duplicated across the datasets due to a large amount of transatlantic travel. Similarly, the results presented in this study will be biased towards the specific airports, and, hence, operators, for which there is adequate ground coverage to provide usable ADS-B trajectories. Recent work has explored the use of map-matching algorithms [28,29], and it is expected that these will be vital in increasing the geographical coverage of future studies.
In addition, as described in Section Verification of Methodology, the current methodology is only able to correctly identify the turning manoeuvres in approximately 80% of trajectories, consistent with prior studies that have employed the methodology [4,8]. As discussed in previous work [4,8], errors in identification of manoeuvres tend to originate at an incorrect segmentation of the pushback phase, which leads to incorrect turn definitions throughout the takeoff phase. In addition, the presence of shallow turns within a taxi phase can lead to the incorrect definition of turns, and when coupled with the noise typically present within ADS-B trajectories, this can lead to turns failing to be identified. Consequently, future work must continue to explore robust approaches for identifying pushback taxi phases and turns with small heading changes. Again, the map matching algorithms presented in the recent literature could significantly support this future work [28,29]. In addition, prior studies of ADS-B ground trajectories have highlighted specific noise characteristics that lead to erroneous manoeuvre characterisation [4], and recent work has characterised the typical positional errors experienced in ADS-B trajectories [43]. Consequently, future investigations should explore the sensitivity of ground manoeuvre characterisation methodologies to these sources of positional error.
Also of interest concerning the improvement of the presented methodology is the characterisation of turns which show varying radii throughout the turn, such as a taxiway turn that is tightened during the runway entry. It is possible that such manoeuvres could be considered discrete turns due to the differing turn radii, and this should be explored in future work.
Finally, this paper has only presented an initial investigation into the inference of QAR system parameters related to landing gear loads from ADS-B trajectories. The scatter shown in the relationship between maximum NWS angle and for turns suggests that other parameters, such as ground speed, may need to be accounted for, along with consideration of generating specific relationships for different turn types. In addition, future work could consider non-linear regression or data-driven techniques to represent such relationships. Future work should also aim to explore other QAR system parameters related to taxiing, such as measured aircraft accelerations and braking demands, that could be inferred from ADS-B trajectories.
5. Conclusions
The complexity and variability of the loads sustained by aircraft landing gear in-service have led to growing interest in Structural Health Monitoring (SHM) and Remaining Useful Life (RUL) methodologies to support the fatigue substantiation of landing gear assemblies. The successful implementation of such approaches can be reliant on significant engineering effort and consequently, it is desirable to employ approaches to help identify airframes or aircraft fleets that would benefit from the application of SHM and RUL approaches. To support this effort, this paper has employed air traffic data in the form of Automatic Dependent Surveillance-Broadcast (ADS-B) ground trajectories to assess the occurrence and severity of ground turns across narrowbody and widebody fleets of differing geographic location and operator characteristics.
The characterisation of ground turns across different aircraft fleets has led to the following conclusions:
- A sample size of 250 flights for each aircraft fleet led to limited uncertainty in the estimated occurrence variability of turns per flight and a deviation of ±1 turn per 10 flights for fatigue-critical tight and pivot turns when compared to datasets with a larger sample size.
- The occurrence rate and severity of ground-turning manoeuvres showed lower-than-expected sensitivity to geographical location and operator type, with only cargo and Ultra-Low-Cost Carriers deviating significantly from the remainder of the narrowbody and widebody fleets.
- Individual narrowbody and widebody aircraft were observed to demonstrate significantly different turn occurrence variability when compared to overall fleets, in some specific instances demonstrating a pivot turn occurrence two to three times larger than that of the fleet.
- A simple linear relationship can be employed to estimate the Nose Wheel Steering (NWS) angle required to perform a turn directly from ADS-B trajectories, validating the use of the ADS-B-derived maximum spatial turn rate as an indicator of turn severity.
- At the fleet level, a characteristic bimodal distribution is consistently observed for maximum spatial turn rates regardless of aircraft type, location and operator characteristic.
The findings of this paper show that SHM and RUL may be required to capture aircraft fleets that deviate from the expected total fleet behaviour and that such approaches may be more efficiently targeted at airframes known to deviate from the remainder of the fleet. The methodology based on ADS-B trajectories presented in this paper provides an effective route to identifying such airframes to support the future adoption and demonstration of SHM and RUL approaches for aircraft landing gear.
Author Contributions
Conceptualization, J.H., S.R., J.B. and J.C.; methodology, J.H. and S.R.; software, J.H. and S.R.; validation, J.H.; formal analysis, J.H.; investigation, J.H. and S.R.; data curation, J.H. and S.R.; writing—original draft preparation, J.H.; writing—review and editing, S.R., J.B. and J.C.; visualization, J.H. and S.R.; supervision, J.B. and J.C.; project administration, J.B. and J.C.; funding acquisition, J.H., J.B. and J.C. All authors have read and agreed to the published version of the manuscript.
Funding
This research was funded by the Aerospace Technology Institute (ATI) grant number 10040817 under the Optimised Life for Landing Gear Assemblies (OLLGA) project in collaboration with Safran Landing Systems. The APC was funded by the University of Bristol Open Access block grant.
Institutional Review Board Statement
The storage, processing and presentation of ADS-B data is covered by University of Bristol Ethics Application 2023-14985-16561.
Data Availability Statement
The ADS-B data and QAR data employed within this study are from sources detailed in the Acknowledgments section. Data generated from the processing of these sources to support the findings and conclusions are presented within this paper.
Acknowledgments
The authors extend their thanks to Flightradar24 for providing permission to reproduce ADS-B data in this paper. Figure 1, Figure 2 and Figure 3 are generated from Map data from OpenStreetMap (https://www.openstreetmap.org/copyright (accessed on 4 March 2026)). The authors extend their thanks to Safran Landing Systems for providing access to QAR data to support this study.
Conflicts of Interest
The authors declare no conflicts of interest. The funders had no role in the design of the study; in the collection, analyses, or interpretation of data; in the writing of the manuscript; or in the decision to publish the results.
References
- Tang, H.; Liu, P.; Ding, J.; Cheng, J.; Jiang, Y.; Jiang, B. Numerical Prediction of Fatigue Life for Landing Gear Considering the Shock Absorber Travel. Aerospace 2025, 12, 42. [Google Scholar] [CrossRef] [Scilit]
- Buxbaum, O. Landing Gear Loads of Civil Transport Aircraft. In Proceedings of the ICAF-Symposium—Aircraft Fatigue in the Eighties, Noordwijkerhout, The Netherlands, 20–22 May 1981. [Google Scholar]
- Hall, A.W. Some Loading Conditions Imposed by Ground Turning Maneuvers with Three Jet Transport Airplanes; NASA-TN-D-7132; National Aeronautics and Space Administration: Washington, DC, USA, 1972.
- Hoole, J.; Booker, J.D.; Cooper, J.E. Impact of operator characteristics on landing gear ground manoeuvre occurrences. Aeronaut. J. 2024, 128, 2604–2633. [Google Scholar] [CrossRef] [Scilit]
- Deng, K.; Ompusunggu, A.P.; Xu, Y.; Skote, M.; Zhao, Y. A Review of Material-Related Mechanical Failures and Load Monitoring-Based Structural Health Monitoring (SHM) Technologies in Aircraft Landing Gear. Aerospace 2025, 12, 266. [Google Scholar] [CrossRef] [Scilit]
- El Mir, H.; Perinpanayagam, S. Certification of machine learning algorithms for safe-life assessment of landing gear. Front. Astron. Space Sci. 2022, 9, 896877. [Google Scholar] [CrossRef] [Scilit]
- Hoole, J.; Sartor, P.; Booker, J.D.; Cooper, J.E.; Gogouvitis, X.V.; Schmidt, R.K. Landing gear ground manoeuvre statistics from automatic dependent surveillance-broadcast transponder data. Aeronaut. J. 2021, 125, 1942–1976. [Google Scholar] [CrossRef] [Scilit]
- Hoole, J.; Ramachandra, S.; Booker, J.D.; Cooper, J.E. Characterising the Variability in Taxiway Turns of Regional Airliners using Air Traffic Data. In Proceedings of the 11th European Conference for Aeronautics and Aerospace Sciences (EUCASS), Rome, Italy, 30 June–4 July 2025. [Google Scholar] [CrossRef]
- Tipps, D.O.; Rustenburg, J.; Skinn, D.; DeFiore, T. Side Load Factor Statistics from Commercial Aircraft Ground Operations; DOT/FAA/AR-02/129; Federal Aviation Administration: Washington, DC, USA, 2003.
- Ladda, V.; Struck, H. Operational loads on landing gear. In Proceedings of the AGARD Conference CP484—Landing Gear Design Loads, Povoa de Varzim, Portugal, 8–12 October 1990. [Google Scholar]
- Schmidt, R.K. Monitoring of aircraft landing gear structure. Aeronaut. J. 2008, 112, 275–278. [Google Scholar] [CrossRef] [Scilit]
- Dziendzikowski, M.; Kurnyta, A.; Reymer, P.; Kurdelski, M.; Klysz, S.; Leski, A.; Dragan, K. Application of Operational Load Monitoring Systems for Fatigue Estimation of Main Landing Gear Attachment Frame of an Aircraft. Materials 2021, 14, 6564. [Google Scholar] [CrossRef] [Scilit]
- Wang, D.; Dong, M.; Lou, X.; Zhu, L.; Yu, M.; Xia, J.; Zhang, Y.; Deng, C.; Zhu, Y.; Wang, L. Enhanced Load Prediction for Aircraft Landing Gear Utilizing Graph Convolutional Neural Network. IEEE Sensors J. 2025, 25, 4570–4580. [Google Scholar] [CrossRef] [Scilit]
- El Mir, H.; King, S.; Skote, M.; Alam, M.; Place, S. Landing Gear Health Assessment: Synergising Flight Data Analysis with Theoretical Prognostics in a Hybrid Assessment Approach. In Proceedings of the 8th European Conference of the Prognostics and Health Management Society, Prague, Czech Republic, 3–5 July 2024. [Google Scholar] [CrossRef] [Scilit]
- Jobmann, J.; Thielecke, F. Model-Based Loads Observer Approach for Landing Gear Remaining Useful Life Prediction. In Proceedings of the 8th European Conference of the Prognostics and Health Management Society, Prague, Czech Republic, 3–5 July 2024. [Google Scholar] [CrossRef] [Scilit]
- Gerhardinger, D.; Domitrović, A.; Krajček Nikolić, K.; Ivančević, D. Predicting the Remaining Useful Life of Light Aircraft Structural Parts: An Expert System Approach. Aerospace 2023, 10, 967. [Google Scholar] [CrossRef] [Scilit]
- Gerhardinger, D.; Krajček Nikolić, K.; Domitrović, A. Quantifying Operational Uncertainty in Landing Gear Fatigue: A Hybrid Physics–Data Framework for Probabilistic Remaining Useful Life Estimation of the Cessna 172 Main Gear. Appl. Sci. 2025, 15, 11049. [Google Scholar] [CrossRef] [Scilit]
- Sartor, P.; Becker, W.; Worden, K.; Schmidt, R.K.; Bond, D. Bayesian Sensitivity Analysis of Flight Parameters in a Hard Landing Analysis Process. J. Aircr. 2016, 53, 1317–1331. [Google Scholar] [CrossRef] [Scilit]
- Schlosser, M.; Braßel, H.; Fricke, H. Enhancing Aircraft Ground Trajectories through Map-Matching and Stochastic Pavement Roughness Modeling. J. Open Aviat. Sci. 2025, 2. [Google Scholar] [CrossRef] [Scilit]
- Waldron, T.P. Detecting airport surface movement events using ground surveillance. In Proceedings of the IEEE/AIAA 28th Digital Avionics Systems Conference, Orlando, FL, USA, 23–29 October 2009. [Google Scholar] [CrossRef] [Scilit]
- El Mahrsi, M.K.; Andrieu, C.; Côme, E.; Bezza, Z.; Oukhellou, L.; Rossi, F. Traffic Characterization on Airport Surface Using Aircraft Ground Trajectories. In Proceedings of the 21st International Conference on Intelligent Transportation Systems (ITSC), Maui, HI, USA, 4–7 November 2018. [Google Scholar] [CrossRef] [Scilit]
- Tran, T.N.; Pham, D.T.; Alam, S. A Map-Matching Algorithm for Ground Movement Trajectory Representation using A-SMGCS Data. In Proceedings of the 2020 International Conference on Artificial Intelligence and Data Analytics for Air Transportation (AIDA-AT), Singapore, 3–4 February 2020. [Google Scholar] [CrossRef] [Scilit]
- Churchill, A.M.; Bloem, M. Hierarchical Clustering of Aircraft Surface Trajectories. In Proceedings of the AIAA AVIATION 2020 Forum, Virtual Event, 15–19 June 2020. [Google Scholar] [CrossRef] [Scilit]
- Flightradar24. Available online: https://www.flightradar24.com (accessed on 4 March 2026).
- AC150/5300-13B; Airport Design. Federal Aviation Administration: Washington, DC, USA, 2022.
- Coetzee, E.; Krauskopf, B.; Lowenberg, M. Application of Bifurcation Methods to the Prediction of Low-Speed Aircraft Ground Performance. J. Aircr. 2010, 47, 1248–1255. [Google Scholar] [CrossRef] [Scilit]
- Rahman, M.F.; Ellerbroek, J.; Hoekstra, J. Modelling ADS-B Reception Probability Using OpenSky Data. J. Open Aviat. Sci. 2025, 2. [Google Scholar] [CrossRef] [Scilit]
- Schlosser, M.; Braßel, H.; Fricke, H. Analysis of Aircraft Ground Trajectories: Map-Matching with Open Source Data for Modeling Safety-Driven Applications. In Proceedings of the 11th International Conference on Research in Air Transportation, Singapore, 1–4 July 2024. [Google Scholar]
- Olive, O.; Waltert, M.; Mori, R.; Mouyon, P. Filtering Aircraft Surface Trajectories Using Information on the Taxiway Structure of Airports. In Proceedings of the 11th International Conference on Research in Air Transportation, Singapore, 1–4 July 2024. [Google Scholar]
- Taltaud, A.; Carbonneau-Côté, J.; Bouchard, M.; Rancourt, D. Statistical Approach for Electric Taxiing Requirements for Regional Turboprop Aircraft. J. Aircr. 2023, 60, 1811–1818. [Google Scholar] [CrossRef] [Scilit]
- Ramachandra, S.; Hoole, J.; Booker, J.D.; Cooper, J.E. Utility and Challenges of Exploiting Flight Recorder Data for Ground Manoeuvre Characterisation During Landing Gear Fatigue Assessment. In Proceedings of the 11th European Conference for Aeronautics and Aerospace Sciences (EUCASS), Rome, Italy, 30 June–4 July 2025. [Google Scholar] [CrossRef]
- You, Q.; Ma, J.; Zhao, Z. Evaluation of the lateral loading caused by aircraft with complex gear configurations turning during taxiing. Int. J. Pavement Eng. 2019, 20, 911–919. [Google Scholar] [CrossRef] [Scilit]
- Jarry, G.; Very, P.; Dalmau, R.; Delahaye, D.; Houdant, A. On the Detection of Aircraft Single Engine Taxi using Deep Learning Models. In Proceedings of the SESAR Innovation Days 2024, Rome, Italy, 12–15 November 2024. [Google Scholar]
- Hünemohr, D.; Litzba, J.; Rahimi, F. Usage Monitoring of Helicopter Gearboxes with ADS-B Flight Data. Aerospace 2022, 9, 647. [Google Scholar] [CrossRef] [Scilit]
- Askari, K.; Cremaschi, M. Simulation-Based Predication of Departure Aircraft Performance from Surveillance-like Data Using Neural Networks. Aerospace 2023, 10, 513. [Google Scholar] [CrossRef] [Scilit]
- Jarry, G.; Delahaye, D.; Hurter, C. Towards aircraft generic Quick Access Recorder fuel flow regression models for ADS-B data. In Proceedings of the International Conference on Research in Air Transportation, Singapore, 1–4 July 2024. [Google Scholar]
- Ravizza, S.; Chen, J.; Atkin, J.A.D.; Stewart, P.; Burke, E.K. Aircraft taxi time prediction: Comparisons and insights. Appl. Soft Comput. 2014, 14, 397–406. [Google Scholar] [CrossRef] [Scilit]
- Barrett, S.D. How do the demands for airport services differ between full-service carries and low-cost carriers? J. Air Transp. Manag. 2004, 10, 33–39. [Google Scholar] [CrossRef] [Scilit]
- Ballis, A. Overview of Air Cargo Terminal Design Aspects. Transp. Res. Rec. J. Transp. Res. Board 2007, 2007, 117–125. [Google Scholar] [CrossRef] [Scilit]
- Dönmez, K. Aircraft sequencing under the uncertainty of the runway occupancy times of arrivals during the backtrack procedure. Aeronaut. J. 2023, 127, 562–580. [Google Scholar] [CrossRef] [Scilit]
- Givoni, M.; Rietveld, P. Airline’s choice of aircraft size—Explanations and implications. Transp. Res. Part A Policy Pract. 2009, 43, 500–510. [Google Scholar] [CrossRef] [Scilit]
- Montgomery, D.C.; Runger, G.C. Applied Statistics and Probability for Engineers, 6th ed.; International Student Edition; Wiley: Singapore, 2014. [Google Scholar]
- Schäfer, M.; Jonáš, P. ADS-B Positional Accuracy and Anomalies: A comprehensive Analysis Using High-Resolution MLAT Data. In Proceedings of the 2025 Integrated Communications, Navigation and Surveillance Conference (ICNS), Brussels, Belgium, 8–10 April 2025. [Google Scholar] [CrossRef] [Scilit]

Disclaimer/Publisher’s Note: The statements, opinions and data contained in all publications are solely those of the individual author(s) and contributor(s) and not of MDPI and/or the editor(s). MDPI and/or the editor(s) disclaim responsibility for any injury to people or property resulting from any ideas, methods, instructions or products referred to in the content. |
© 2026 by the authors. Licensee MDPI, Basel, Switzerland. This article is an open access article distributed under the terms and conditions of the Creative Commons Attribution (CC BY) license.