


Abstract
Full-cycle, online combustion-state monitoring is essential for the safe operation and reusability of liquid oxygen/kerosene (LOX/kerosene) rocket engines, yet current practice faces two gaps: contact sensors measure macroscopic secondary parameters and reveal the chemical identity of the combustion species only indirectly, and published spectral studies have been confined to laboratory-scale combustors with no validated markers for a full-scale engine. This work acquired ultraviolet (UV) emission spectra spanning 311–431 nm from the exhaust plume of a hundred-tonne-class full-scale LOX/kerosene engine across its complete operating cycle, from ignition through steady combustion to shutdown. Three principal results were obtained. First, a set of spectral markers was established: the 315.8 nm OH band marks steady-state combustion, with a within-run coefficient of variation as low as 2.25%; the 422.7 nm Ca I line marks both ignition and shutdown boundaries; and the Al I doublet (394.5/396.2 nm), present only at ignition and absent at shutdown, enables unambiguous discrimination of ignition from shutdown. Second, a mirror-inverse spectral evolution between the ignition and shutdown transients was revealed, yielding a presence/absence-based criterion that distinguishes the two processes. Third, transient spectral overexposure, conventionally discarded as invalid data, was reinterpreted as a diagnostic marker of the throttle-up and throttle-down transitions. These results provide validated experimental support for engineering-grade, non-contact combustion monitoring of reusable rocket engines and can be extended to other high-thrust liquid-propellant engines through analogous tests.
1. Introduction
Reusable liquid oxygen/kerosene (LOX/kerosene) rocket engines are the primary propulsion system for next-generation launch vehicles, and the reliability of their ignition and shutdown sequences determines both launch safety and reusability. Full-cycle, online combustion-state monitoring during these transients has therefore become essential for operational deployment of reusable engines.
Current practice still relies mainly on contact sensors, including combustion-chamber pressure transducers, wall-mounted thermocouples, and vibration accelerometers. These sensors have clear limitations during ignition and shutdown. They measure macroscopic secondary parameters, so the combustion state is inferred indirectly [1,2,3]. Optical emission spectroscopy probes the plume itself and returns the chemical identity and electronic state of the species that constitute combustion. A pressure or temperature reading carries this information only indirectly [4]. When an anomaly occurs, fault isolation still depends on post-test disassembly and inspection, which is slow and provides no real-time condition information [5,6]. Finally, contact sensors degrade quickly under gas temperatures exceeding 3000 K, intense acoustic loading, and the chemically aggressive oxidizing environment of a full-scale exhaust.
Optical monitoring is non-intrusive and chemically selective [7], and thus offers a fundamentally different pathway for engine health assessment. Among optical methods, exhaust-plume emission spectroscopy is the most practical for engineering deployment: as an emission technique it requires no external excitation source, and as a plume-based measurement it demands minimal modification to the engine while capturing line-of-sight integrated chemical information across the entire plume cross-section [8,9]. The ultraviolet (UV)–visible emission spectrum of a hydrocarbon-fueled plume encodes a rich set of condition indicators. The OH A2Σ+ → X2Π chemiluminescence bands mark flame heat release and combustion stability [10,11], and atomic emission lines of metallic species (Ca, Al, Cu, Ni, Fe) indicate component erosion or foreign-metal ingress. The origin of a given line is not always self-evident: Al can be unambiguously attributed to the pyrotechnic ignition system, whereas the spectrum alone cannot resolve whether the observed Ca originates from the ignition system or from erosion.
Despite these capabilities, several obstacles prevent plume emission spectroscopy from becoming a practical, full-cycle monitoring tool. The vast majority of published investigations have been conducted on subscale combustors or single-injector rigs at chamber pressures below 6–8 MPa, whereas full-scale LOX/kerosene engines operate above 10 MPa under conditions that are not spectroscopically equivalent to laboratory flames. The literature has also focused almost exclusively on steady-state combustion and largely neglected the ignition and shutdown transients, where a disproportionate share of engine failures originate; even variable-thrust LOX/kerosene studies have remained at the level of modular simulation rather than transient spectral measurement [12]. High-frequency combustion instability, driven by the coupled interactions among propellant injection, atomization, vaporization, turbulent mixing, chemical kinetics, and chamber acoustics, is especially difficult to resolve during these transients [13]. A further gap is conceptual: although earlier work has proposed qualitative links between spectral signatures and engine health, no published study has established preferred spectral bands that indicate whether a full-scale engine is operating normally, nor a systematic framework of quantitative, condition-specific markers suited to automated real-time use. The present work establishes such markers for the normal operating states of a full-scale LOX/kerosene engine, laying the foundation for an engineering-applicable monitoring method that can be extended to other propellants through analogous tests. In addition to these three core gaps, the propellant mixture ratio (O/F) is a first-order parameter that reshapes both the combustion state and its optical signature [14]; because the present work focuses on establishing a full-cycle marker framework at the nominal operating condition, the mixture-ratio dependence is treated as an important direction for future extension rather than as a core objective addressed here.
Prior full-scale studies further underline this gap. The most systematic full-scale plume-spectroscopy program to date was run for the Space Shuttle Main Engine (SSME), where atomic emission lines of metallic species (Ni, Cr, Fe, Co, Al, Mn, Cu, Ag, Pd) detected abnormal wear of high-pressure turbopump bearings and other critical parts [6]. These studies built spectral databases of SSME critical elements and materials over 300–426 nm and traced observed metal lines to specific components. However, the SSME program targeted gradual erosion during steady operation, and its metal lines arise from material loss, not from the ignition process. Among recent full-scale programs, the ArianeGroup LOX/methane reusable-engine demonstrators (full-scale 400 kN class thrust chamber, gas generator, and turbopump hot-fired at DLR P3.2/P8 and IHI facilities) established the operating envelopes and transient sequences (ignition, throttling, shutdown) of large cryogenic engines, but reported no full-cycle spectroscopic characterization of the plume [15]. No comparable full-cycle spectral characterization, covering ignition onset, steady operation, and shutdown extinction, has been reported for a full-scale LOX/kerosene engine. This distinction is central here: whereas prior full-scale studies used metal lines as erosion indicators, we show that in a LOX/kerosene engine the transient metal lines (Ca I, Al I) come from the pyrophoric igniter and mark combustion onset and extinction.
Table 1 consolidates the relevant literature by engine scale, propellant, and operating conditions. It shows a sharp skew toward subscale, steady-state, chemically homogeneous systems: no prior study combines full scale with full-cycle transient coverage. Almost all published work uses subscale combustors or single-element rigs, including high-pressure LOX/compressed natural gas (LOX/CNG) combustion [11], the laser-ignition transient of a LOX/gaseous hydrogen (LOX/GH2) micro-combustor at 0.15 MPa [16], and high-pressure monomethylhydrazine/nitrogen tetroxide (MMH/NTO) impinging-jet flames up to 5.1 MPa [17], all far below the >10 MPa pressures of full-scale engines, where collisional quenching, self-absorption, and broadband continuum radiation qualitatively change the spectra [18,19,20]. The only systematic full-scale program is the hydrogen-fueled SSME [6], whose metal-line signatures reflect bearing wear during steady operation, not the ignition process. The same skew appears in operating condition: published work concentrates on steady combustion at a fixed point, while the ignition and shutdown transients remain largely unexplored. A further dimension worth noting is the mixture ratio. Reported O/F ranges are broad and disjoint across studies: fuel-rich hypergolic flames at O/F = 1.65–2.47 [17], a hypergolic model engine swept from 0.93 to 1.79 through stable, mildly unstable, and first- and second-order transverse-instability regimes [21], and a high-pressure gaseous oxygen/kerosene combustor spanning 2.9–20 [1]. These results confirm that mixture ratio is an independent parameter that reshapes both the combustion state and its optical signature, yet no study has mapped how it modulates the OH and metal-line markers of a full-scale LOX/kerosene engine. Mapping this dependence is therefore identified here as an important direction for future work. Beyond these coverage gaps, the physical premise that optical emission encodes the local combustion state is well established across many systems. Chemiluminescence imaging from multiple views has resolved flame dynamics inside a hybrid-rocket chamber [22], and fiber probes inserted into the exhaust have recovered in situ flame temperatures of solid and hybrid plumes [23,24]; the same principle underlies emission-spectroscopic quantification of metallic element concentrations in liquid propellant plumes as a wear indicator [25] and high-performance UV sensing of rotating detonation [26]. None of these methods, however, has been applied to a full-scale, full-cycle LOX/kerosene engine. Together, the gaps in scale and operating-condition coverage, together with the open mixture-ratio dimension, define exactly the space this work occupies.
Table 1.
Representative plume-spectroscopic studies grouped by engine scale, propellant, and operating conditions, including the mixture-ratio (O/F) and chamber-pressure ranges where reported.
This work addresses these gaps through a systematic investigation of the full-cycle UV–visible emission spectra of a full-scale LOX/kerosene engine, from pre-injection oxidizer flow through steady combustion to post-shutdown purge. The objectives are to: (1) characterize how OH chemiluminescence bands and metallic atomic lines evolve across all combustion phases, identifying stable markers and their transient behavior; (2) establish quantitative, condition-specific markers that serve as indicators for combustion-state identification and anomaly detection; and (3) formulate practical condition-assessment criteria based on the presence or absence of specific spectral features at well-defined operating thresholds. The overall goal is to lay the foundation for an engineering-grade, non-contact, full-cycle health-monitoring system for operational reusable engines.
The principal innovations of this work are as follows. We obtain a full-cycle UV spectral measurement of a full-scale flight-weight LOX/kerosene engine, extending plume spectroscopy beyond the laboratory scale. We build a complementary marker framework in which the OH band marks steady-state combustion, the Ca I line marks both ignition and shutdown, and the Al I doublet distinguishes ignition from shutdown (present only at ignition). This framework overcomes the inability of single-signal optical emission spectroscopy (OES) to separate steady combustion from transient boundaries and to distinguish ignition from shutdown. We also reinterpret transient spectral overexposure, normally discarded as invalid data, as a condition-monitoring feature for throttle-up and throttle-down. The main difficulties of applying OES to a full-scale engine, namely intense vibration, strong thermal background, electromagnetic interference, and the absence of precision optical alignment, are addressed through a lens-free bare-fiber design, vibration/thermal isolation via a 25 m fiber, and external-trigger synchronization (Section 2).
2. Experimental System and Methods
2.1. Test Article and Operating Sequence
The test article is a full-scale LOX/RP-1 kerosene liquid rocket engine of the hundred-tonne thrust class, operating on an oxygen-rich staged combustion cycle. Its main specifications are listed in Table 2: a chamber pressure of 18 MPa, a nozzle area ratio of 35, and a total propellant mass-flow rate of about 410 kg/s at a nominal mixture ratio of 2.6. As in prior full-scale monitoring studies (e.g., the SSME health-monitoring program [6]), the thrust class, cycle type, and operating sequence below are sufficient to contextualize the measurements. All tests were run at a certified ground hot-fire facility, covering the complete operating cycle from ignition through steady operation to final shutdown.
Table 2.
Main specifications of the full-scale LOX/kerosene engine.
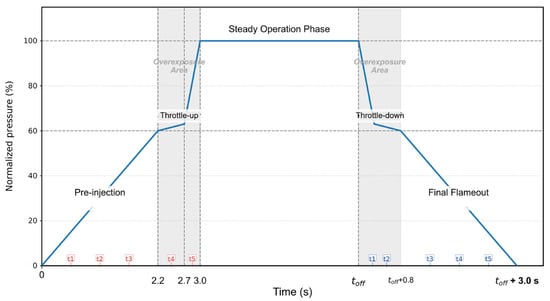
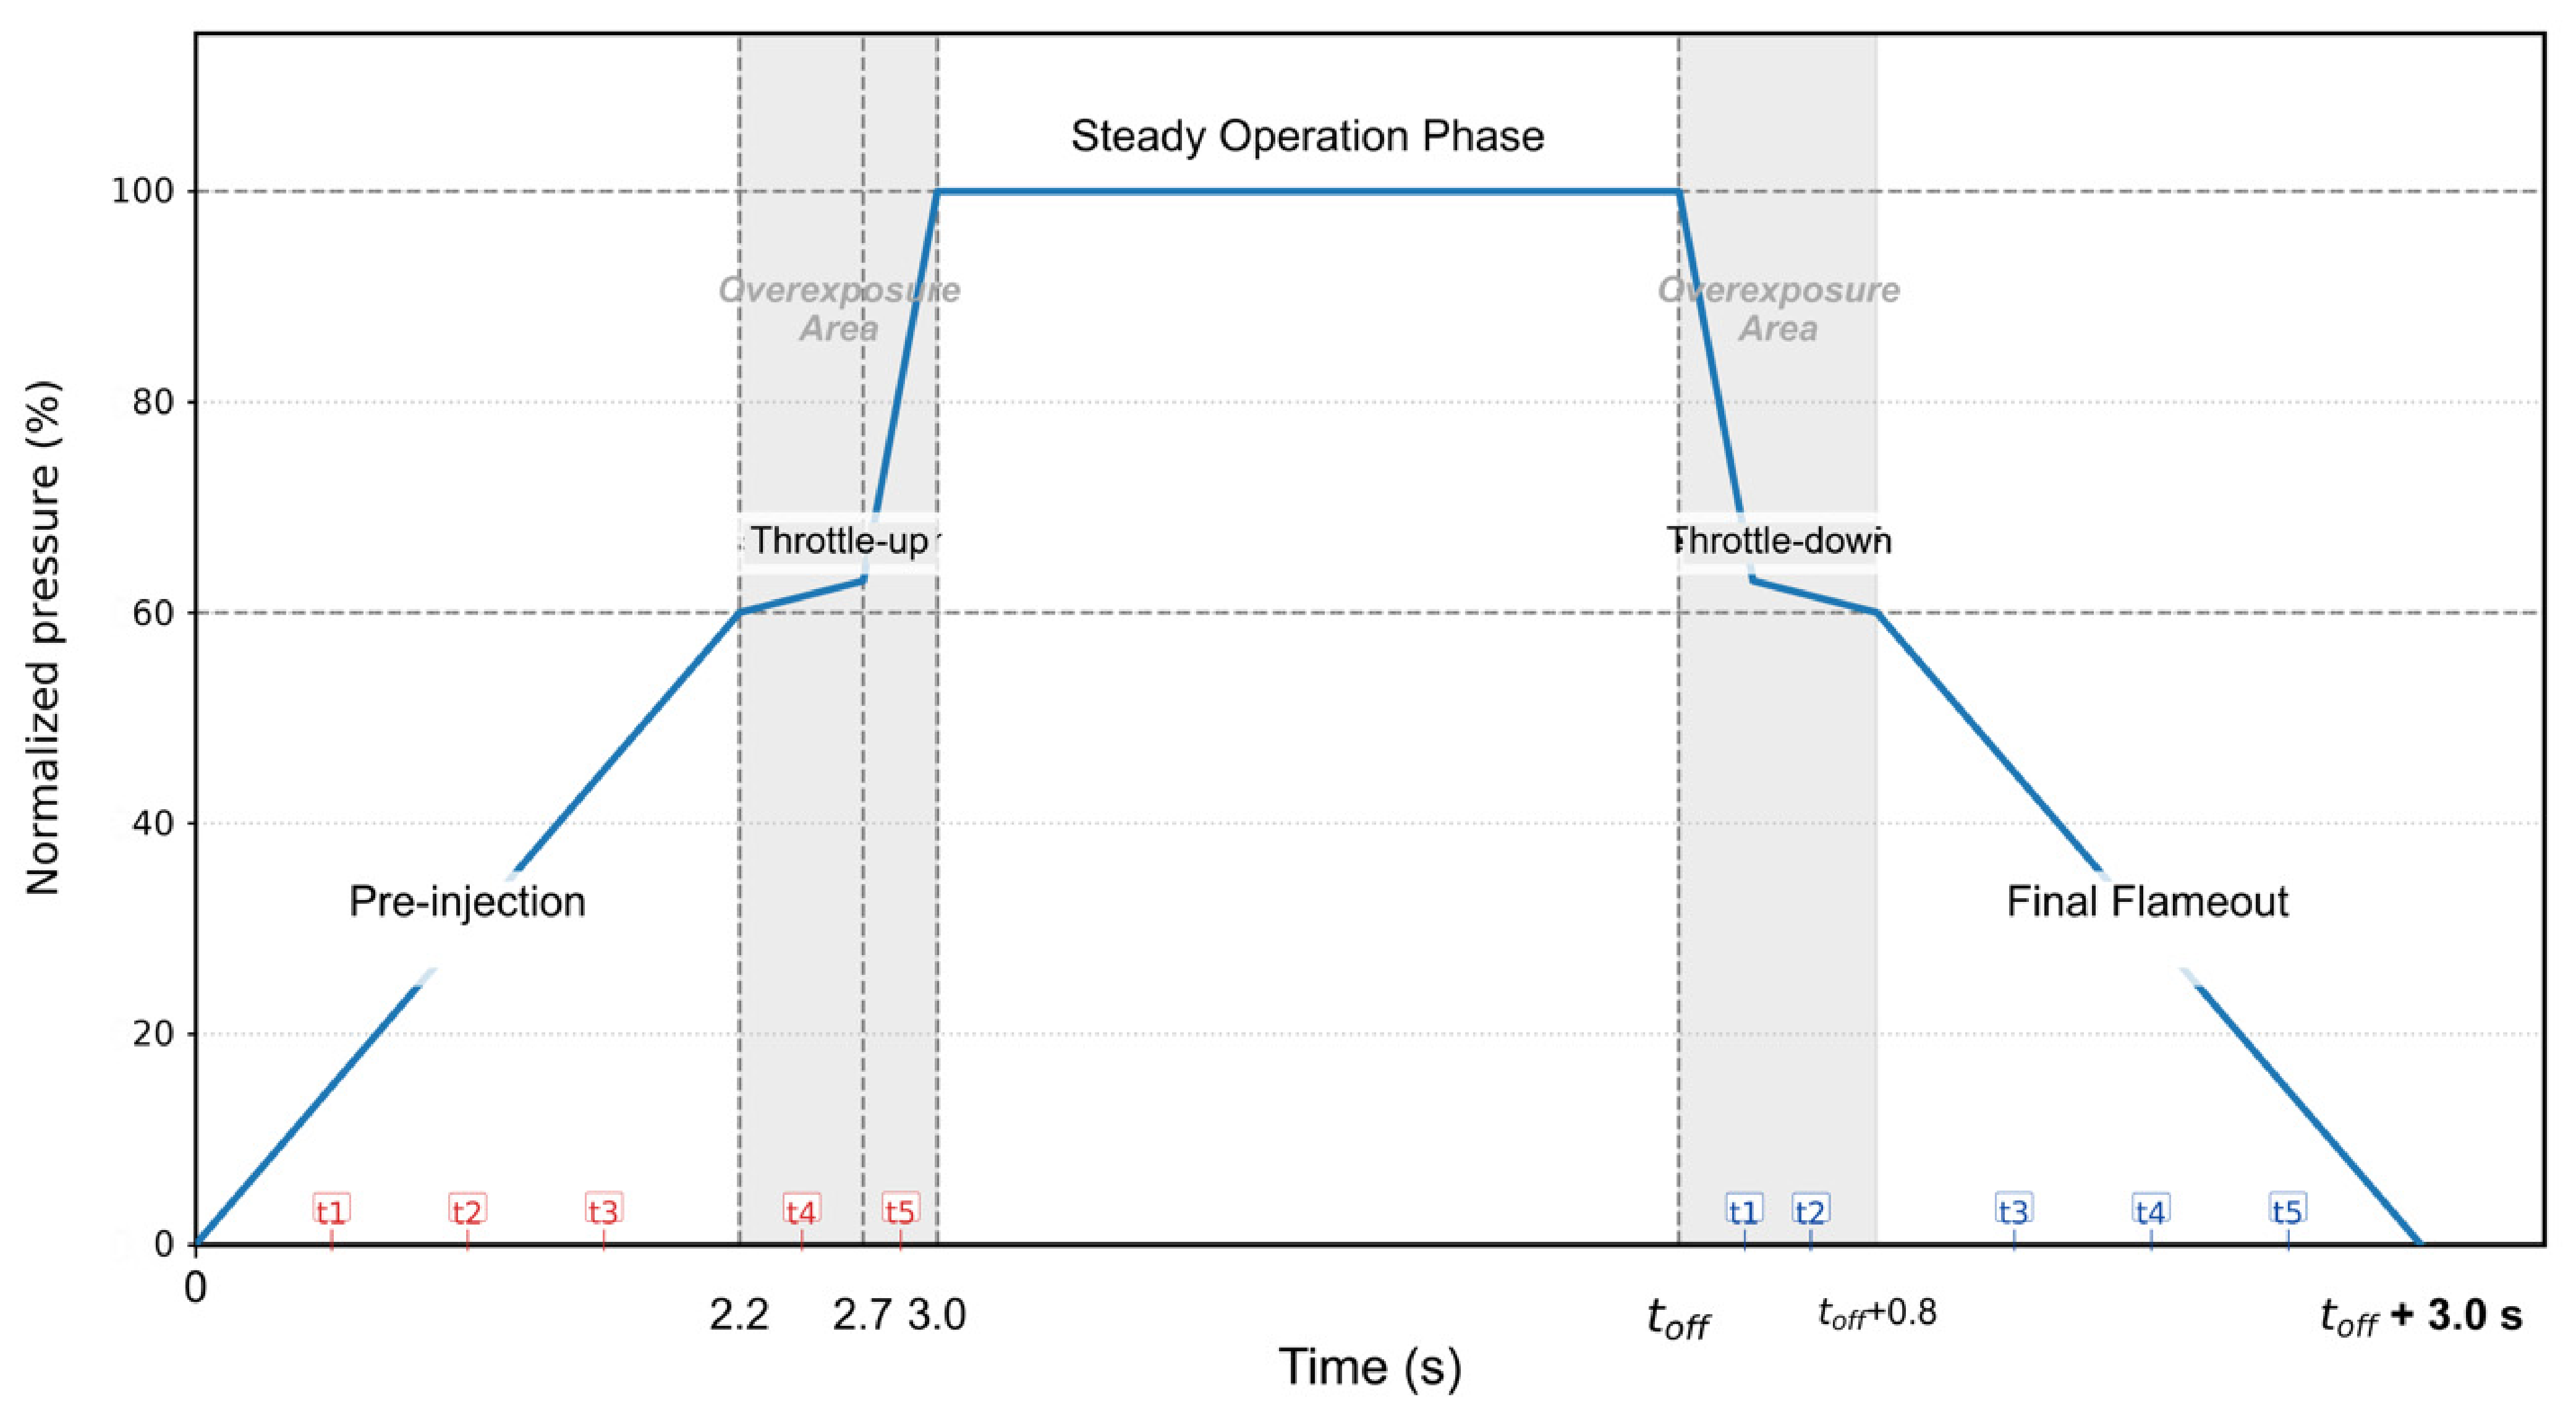
The engine follows a standardized throttle profile, shown in Figure 1 as the normalized nozzle-exit pressure trajectory. Throughout this paper, percentage values refer to fractions of rated nozzle-exit pressure. On the start command, the engine enters pre-injection (0–2.2 s), during which propellant pre-injection raises the pressure linearly to 60% of rated value at the design mixture ratio, and a two-stage pyrophoric ignition system using a triethylaluminum/triethylboron (TEA/TEB) mixture is deployed: a low-dose first pulse establishes an initial flame kernel, followed by a higher-dose second pulse that ensures robust, self-sustaining combustion of the core propellant flow. The throttle-up phase (2.2–3.0 s) then carries the engine from 60% to 100% rated condition, where it stays in steady operation until the shutdown command. During shutdown the engine depressurizes, returning to 60% in 0.8 s, after which the propellant valves close in sequence and the pressure decays to zero at t_off + 3.0 s. As Figure 1 shows, the ignition and shutdown segments evolve symmetrically. The shaded regions mark the two throttle transition intervals (throttle-up 2.2–3.0 s; throttle-down t_off to t_off + 0.8 s) in which the transient surge in OH-band emission drives the detector into spectral overexposure; these intervals are analyzed in Section 3.
Figure 1.
Normalized nozzle-exit pressure trajectory across the full operating cycle, expressed as a percentage of the rated pressure. The engine transitions through five successive stages; pre-injection (with two-stage ignition), throttle-up, steady operation, throttle-down, and final flameout. The shaded regions mark the two throttle transition intervals where the transient surge in OH-band emission saturates the detector.
2.2. UV Optical Emission Spectroscopy System
Applying spectral measurement to a full-scale engine poses difficulties that conventional laboratory spectrometers cannot readily meet. The operating conditions of a full-scale engine are complex and severe, involving intense vibration, thermal load, and electromagnetic interference. For a reusable engine the measurement system must further accompany the vehicle throughout the entire mission, from liftoff through descent and recovery, so long-term stability is paramount. Conventional precision spectrometers, although superior in resolution, are constrained by size, power, and deployment requirements and therefore cannot be applied directly to full-cycle engineering measurements. Full-scale hot-fire tests are also inherently scarce, so the measurement scheme must be adapted to the test stand over an extended period and must offer flexible adjustability. To meet these constraints, this work adopts a lens-free bare-fiber grating spectrometer. It contains no moving parts, and the flexible fiber can be routed freely within the vehicle without affecting the engine structure, enabling stable operation throughout the full mission cycle.
A rugged, lens-free bare-fiber passive OES system was deployed to accommodate the extreme test environment, including high vibration levels, electromagnetic interference, and intense thermal background radiation inherent to full-scale engine hot-fire testing. This design eliminates the need for precision optical alignment or hardware modifications to the engine itself, enabling robust, uninterrupted data acquisition across ignition, steady-state, and shutdown phases.
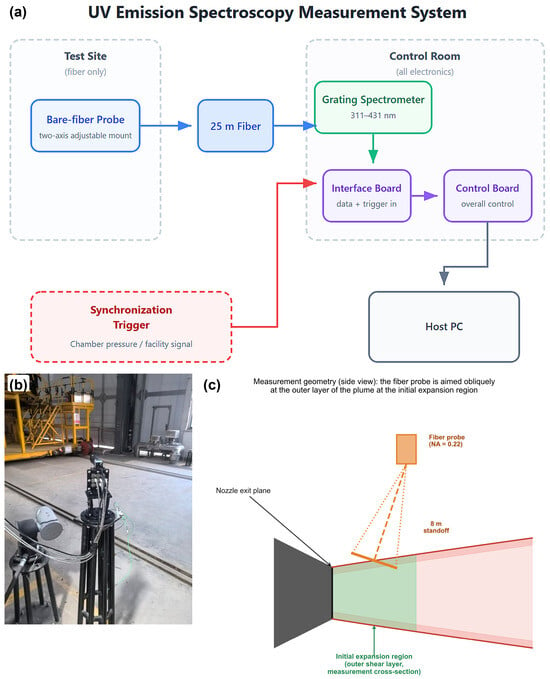
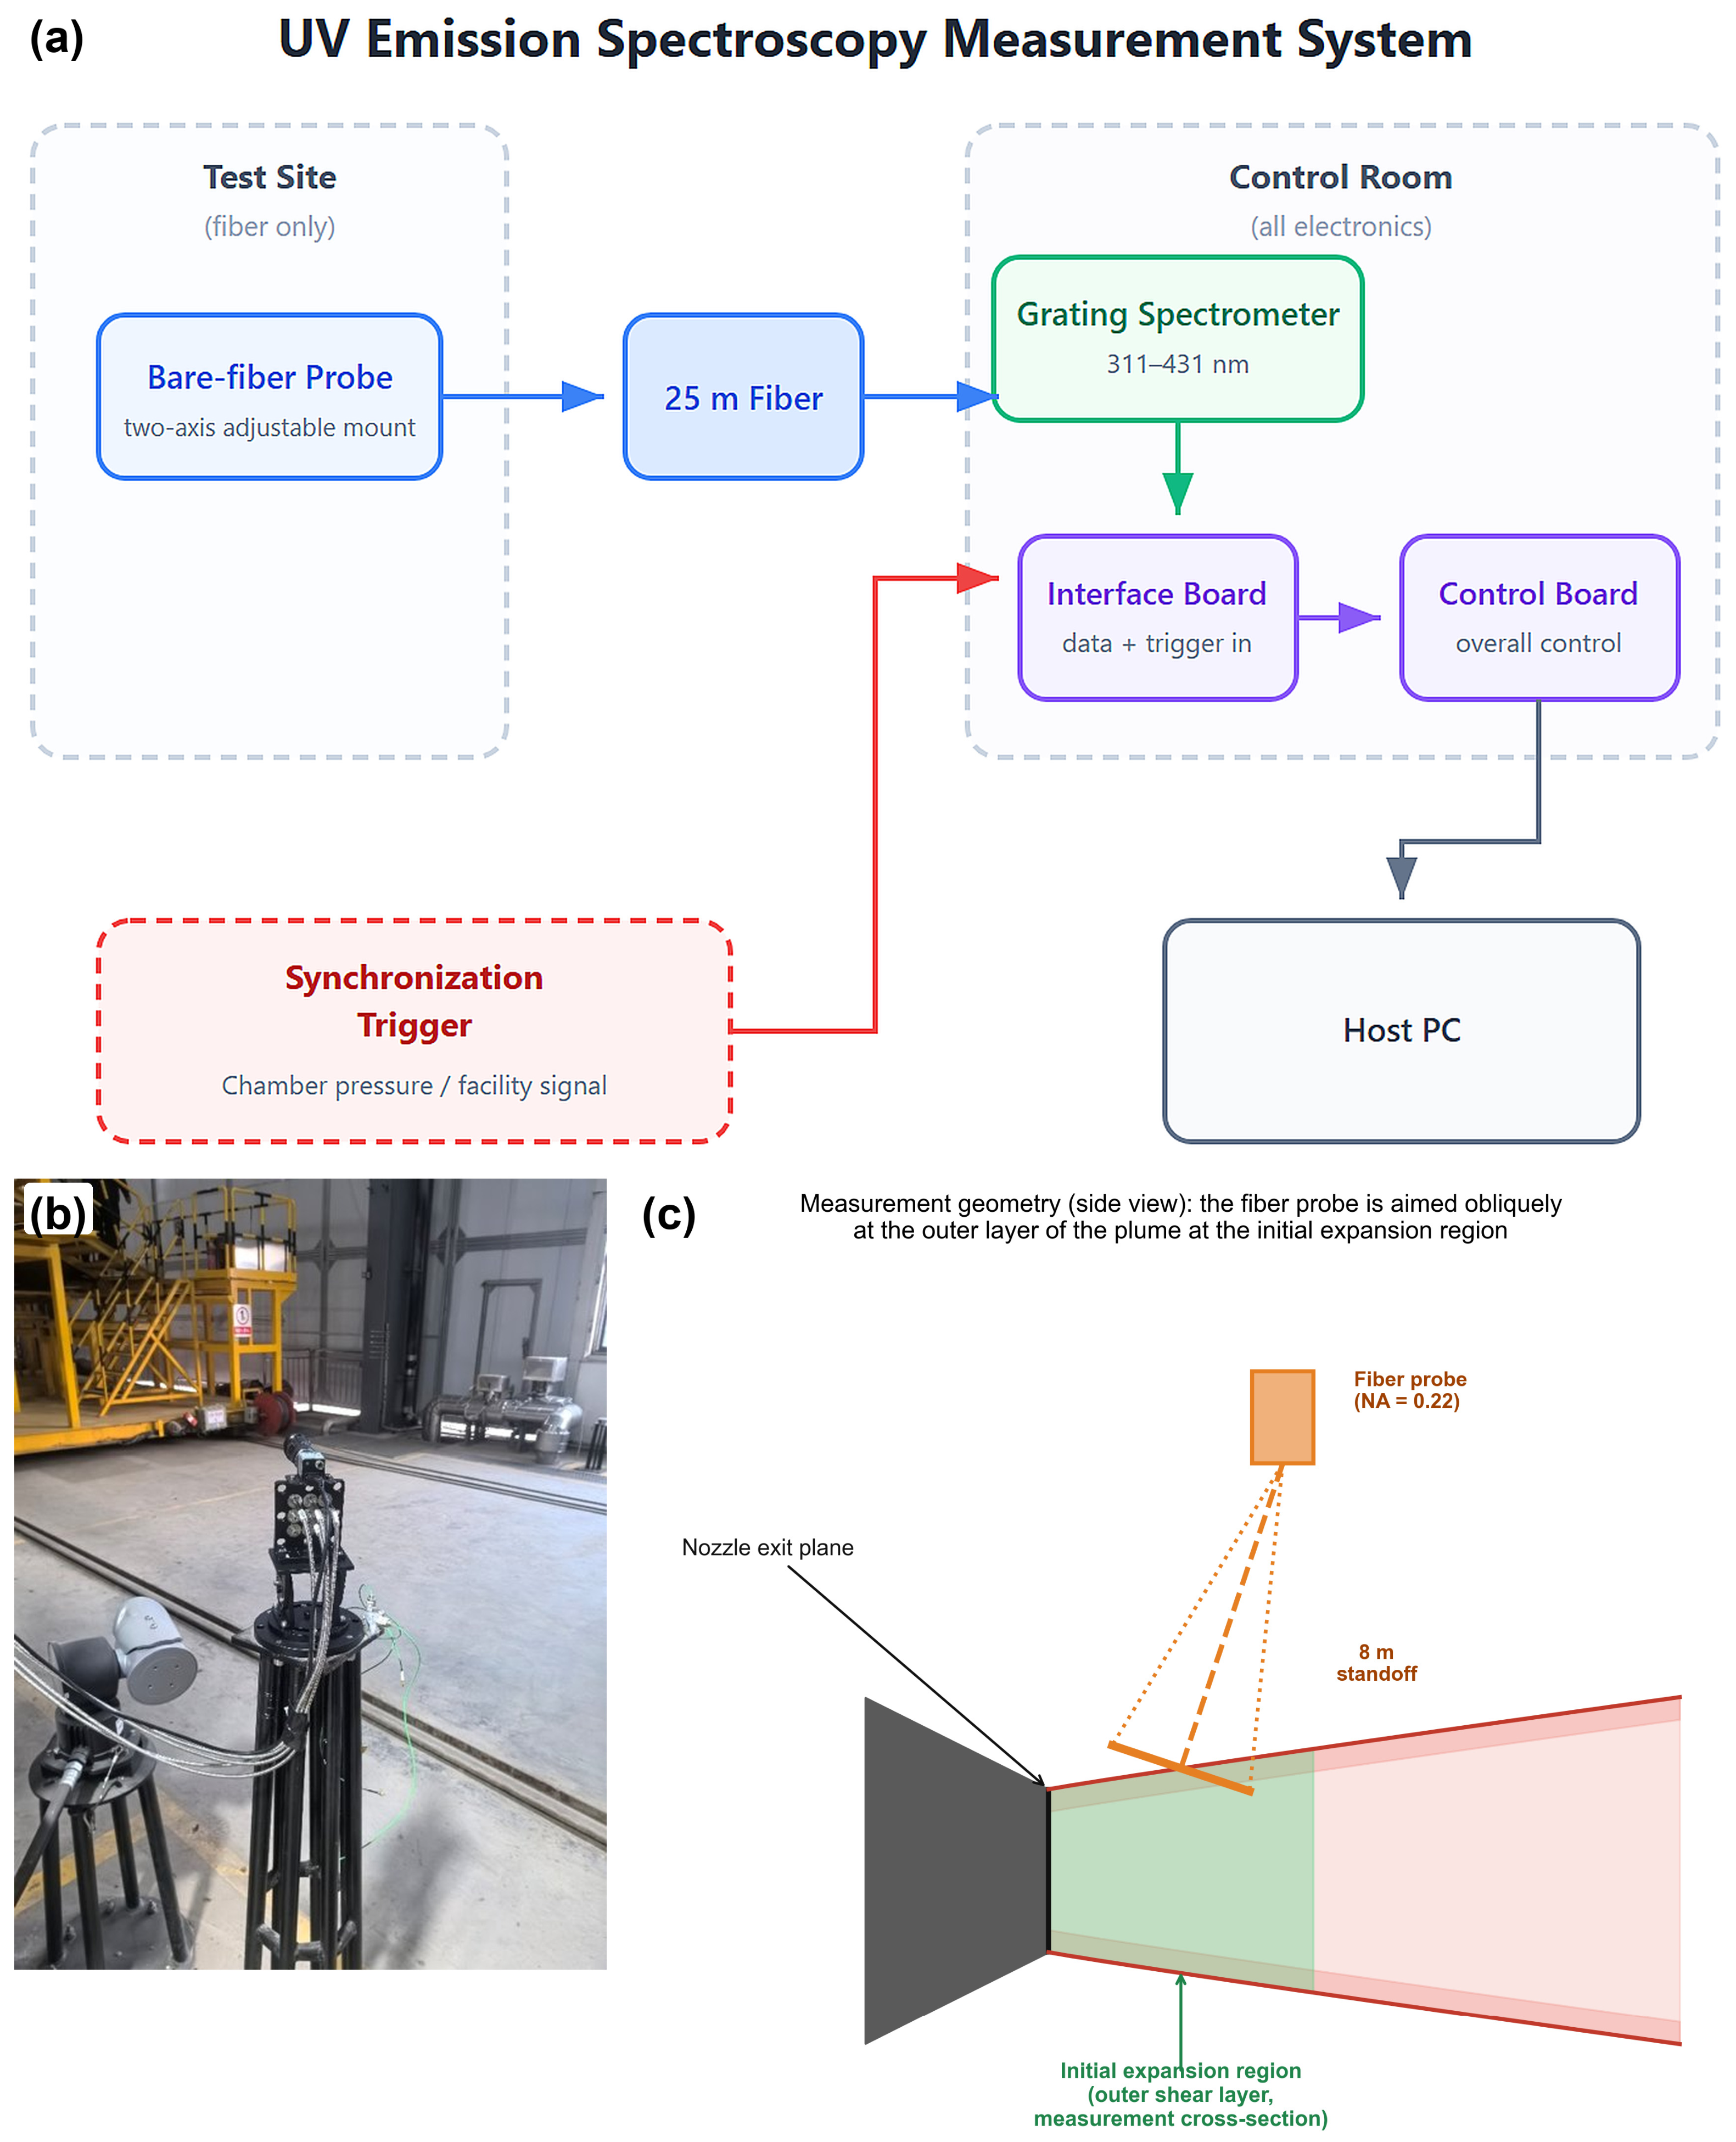
The measurement system, shown in Figure 2, is built around a fiber-coupled grating spectrometer with a spectral range of 311–431 nm and an optical resolution of 0.17–0.23 nm. A 25 m UV-enhanced fused-silica fiber (200 μm core, 0.22 numerical aperture) carries flame emission from the test article to the spectrometer, isolating it from engine vibration and thermal load. Acquisition is set to 200 ms per frame with a nominal 300 ms sampling interval; the actual interval deviates slightly owing to hardware timing jitter and is recovered from the recorded frame count (e.g., 384 frames over the 180 s steady-state test give an effective interval of about 469 ms). External-trigger synchronization aligns spectral acquisition with the facility control signals and the chamber-pressure transducer, ensuring a consistent temporal reference across all channels. The fiber probe is mounted on a two-axis adjustable stand fixed to the facility structure, allowing fine positioning to keep the field of view centered on the core flame region at the nozzle exit throughout the test.
Figure 2.
UV OES system and field deployment. (a) UV emission spectroscopy measurement system. (b) Deployment: probe mounted on a two-axis stand targeting the exhaust plume. (c) Two-dimensional schematic diagram.
The probe optical axis was aligned on the initial expansion region of the exhaust plume, directly downstream of the nozzle exit plane and upstream of the first shock diamond. Here the plume is still locally attached and comparatively dense, so the line of sight crosses the full plume cross-section where the transient combustion phenomena originate. The collection is line-of-sight integrated, so each spectrum is a chord-averaged emission along the whole plume diameter, not a spatially resolved point. This location matters for the saturation reported below. The self-absorption that traps OH* radiation at steady state, and whose collapse releases the trapped photons during the transients, acts along this long, dense line of sight (Section 4.3). Moving the probe downstream of the first shock diamond would shorten the absorbing path and change both the steady-state trapping and the transient photon release.
2.3. Calibration and Data Preprocessing
A rigorous calibration and preprocessing workflow was implemented to ensure measurement accuracy, reproducibility, and consistency across all test data.
Prior to each test, a two-step calibration was performed. First, wavelength calibration used a low-pressure mercury lamp as a traceable standard, with four reference lines (313.16, 334.15, 365.01, and 404.66 nm) spanning the measurement band. An uncertainty analysis accounting for reference-standard error, spectrometer clock drift, and measurement repeatability gave an expanded combined uncertainty of 0.02 nm (k = 2, 95% confidence interval). Second, relative intensity calibration used a deuterium–halogen standard source, correcting for wavelength-dependent grating diffraction efficiency and detector quantum efficiency so that emission intensities could be compared quantitatively across the full band.
Raw spectra passed through a standard preprocessing pipeline before feature extraction. Dark and ambient background were subtracted first: 100 frames of dark reference were acquired with the fiber aperture blocked under identical settings, and subtracted frame-by-frame to remove dark current and readout noise; static ambient spectra collected without flame emission were also subtracted to remove stray light. Baseline correction then used an asymmetric least-squares (ALS) algorithm to remove the continuous broadband background, and the residual signal in feature-free bands (311–312 and 430–431 nm) was verified against the dark-noise level to confirm no systematic offset remained.
2.4. Spectral Feature Extraction Methodology
For the OH A2Σ+ → X2Π band, a validated band-integration method was used (rather than peak height) to suppress fluctuations from flow turbulence and mild self-absorption in large-scale flames. The 314–317 nm window was selected to capture the characteristic OH feature near 315.8 nm while avoiding adjacent atomic lines and continuous background. The choice rests on two grounds. First, the spectrometer covers only 311–431 nm, so the dominant OH (0,0) band head near 306–310 nm lies below the detector range and is inaccessible; the 315.8 nm feature is the OH (1,1) band on the long-wavelength side of the (0,0) band and falls within the measurable range. Second, the (0,0) band head arises from the vibrationally cold ground state (v″ = 0), the most heavily populated level, and therefore suffers the strongest self-absorption along the long line-of-sight through the full-scale plume, biasing the intensity–concentration relation toward nonlinearity; the (1,1) band is much less self-absorbed, so its integrated intensity tracks the OH population more linearly [19]. The integrated intensity after baseline correction was used as a robust metric for relative OH concentration and heat-release rate [2,10].
For metallic atomic lines (Ca I, Al I), peak height after baseline correction was adopted as the intensity metric, and full width at half maximum (FWHM) was obtained via Lorentzian profile fitting. Given the narrow linewidth and negligible self-absorption of atomic lines under the test conditions, peak height provides a sufficient and robust proxy for relative excited-state population.
The temporal performance of the system involves two separate time scales. The first is the synchronization accuracy. Pre-test synchronization between the spectrometer and the chamber-pressure transducer gave a temporal alignment error below 10 ms, which is the accuracy with which each frame is time-stamped relative to the facility pressure signal. The second is the temporal resolution itself, set by the integration and sampling times. External-trigger synchronization together with frame-by-frame alignment to the pressure signal kept the alignment error at this level.
The exposure time was set to 200 ms per frame. This keeps the OH-band and metal-line signals within the detector’s linear range while maximizing the signal-to-noise ratio required for the stability analysis in Section 4.5. The ignition transient lasts about 3.0 s and the shutdown transient a comparable duration, so 200 ms resolves each transition into a sequence of consecutive frames, enough to track how the spectral features evolve across it. The detector and its readout electronics support millisecond- to microsecond-scale acquisition, so the temporal resolution can be raised in future work by shortening the exposure and increasing the repetition rate, with no change to the hardware.
3. Experimental Results and Analysis
3.1. Overall Spectral Evolution Law over Full Operating Cycle
Using full-cycle spectral measurements obtained during ground hot-fire testing of a full-scale LOX/kerosene engine, together with synchronized nozzle-pressure data, we divide the complete operating sequence into five stages: pre-injection (0–2.2 s, including two-stage ignition), throttle-up (2.2–3.0 s), steady-state combustion (3.0 s to t_off), throttle-down (t_off to t_off + 0.8 s), and final flameout. Spectral features are strongly coupled to the operating condition at every stage. The spectral evolution of ignition and shutdown is clearly reversed, with all feature changes tightly synchronized to the condition-transition timings.
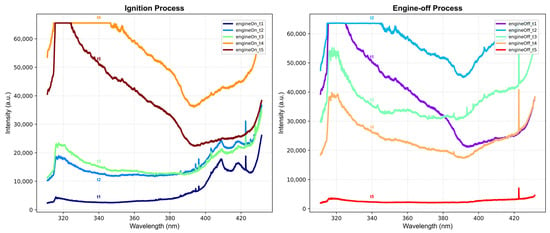
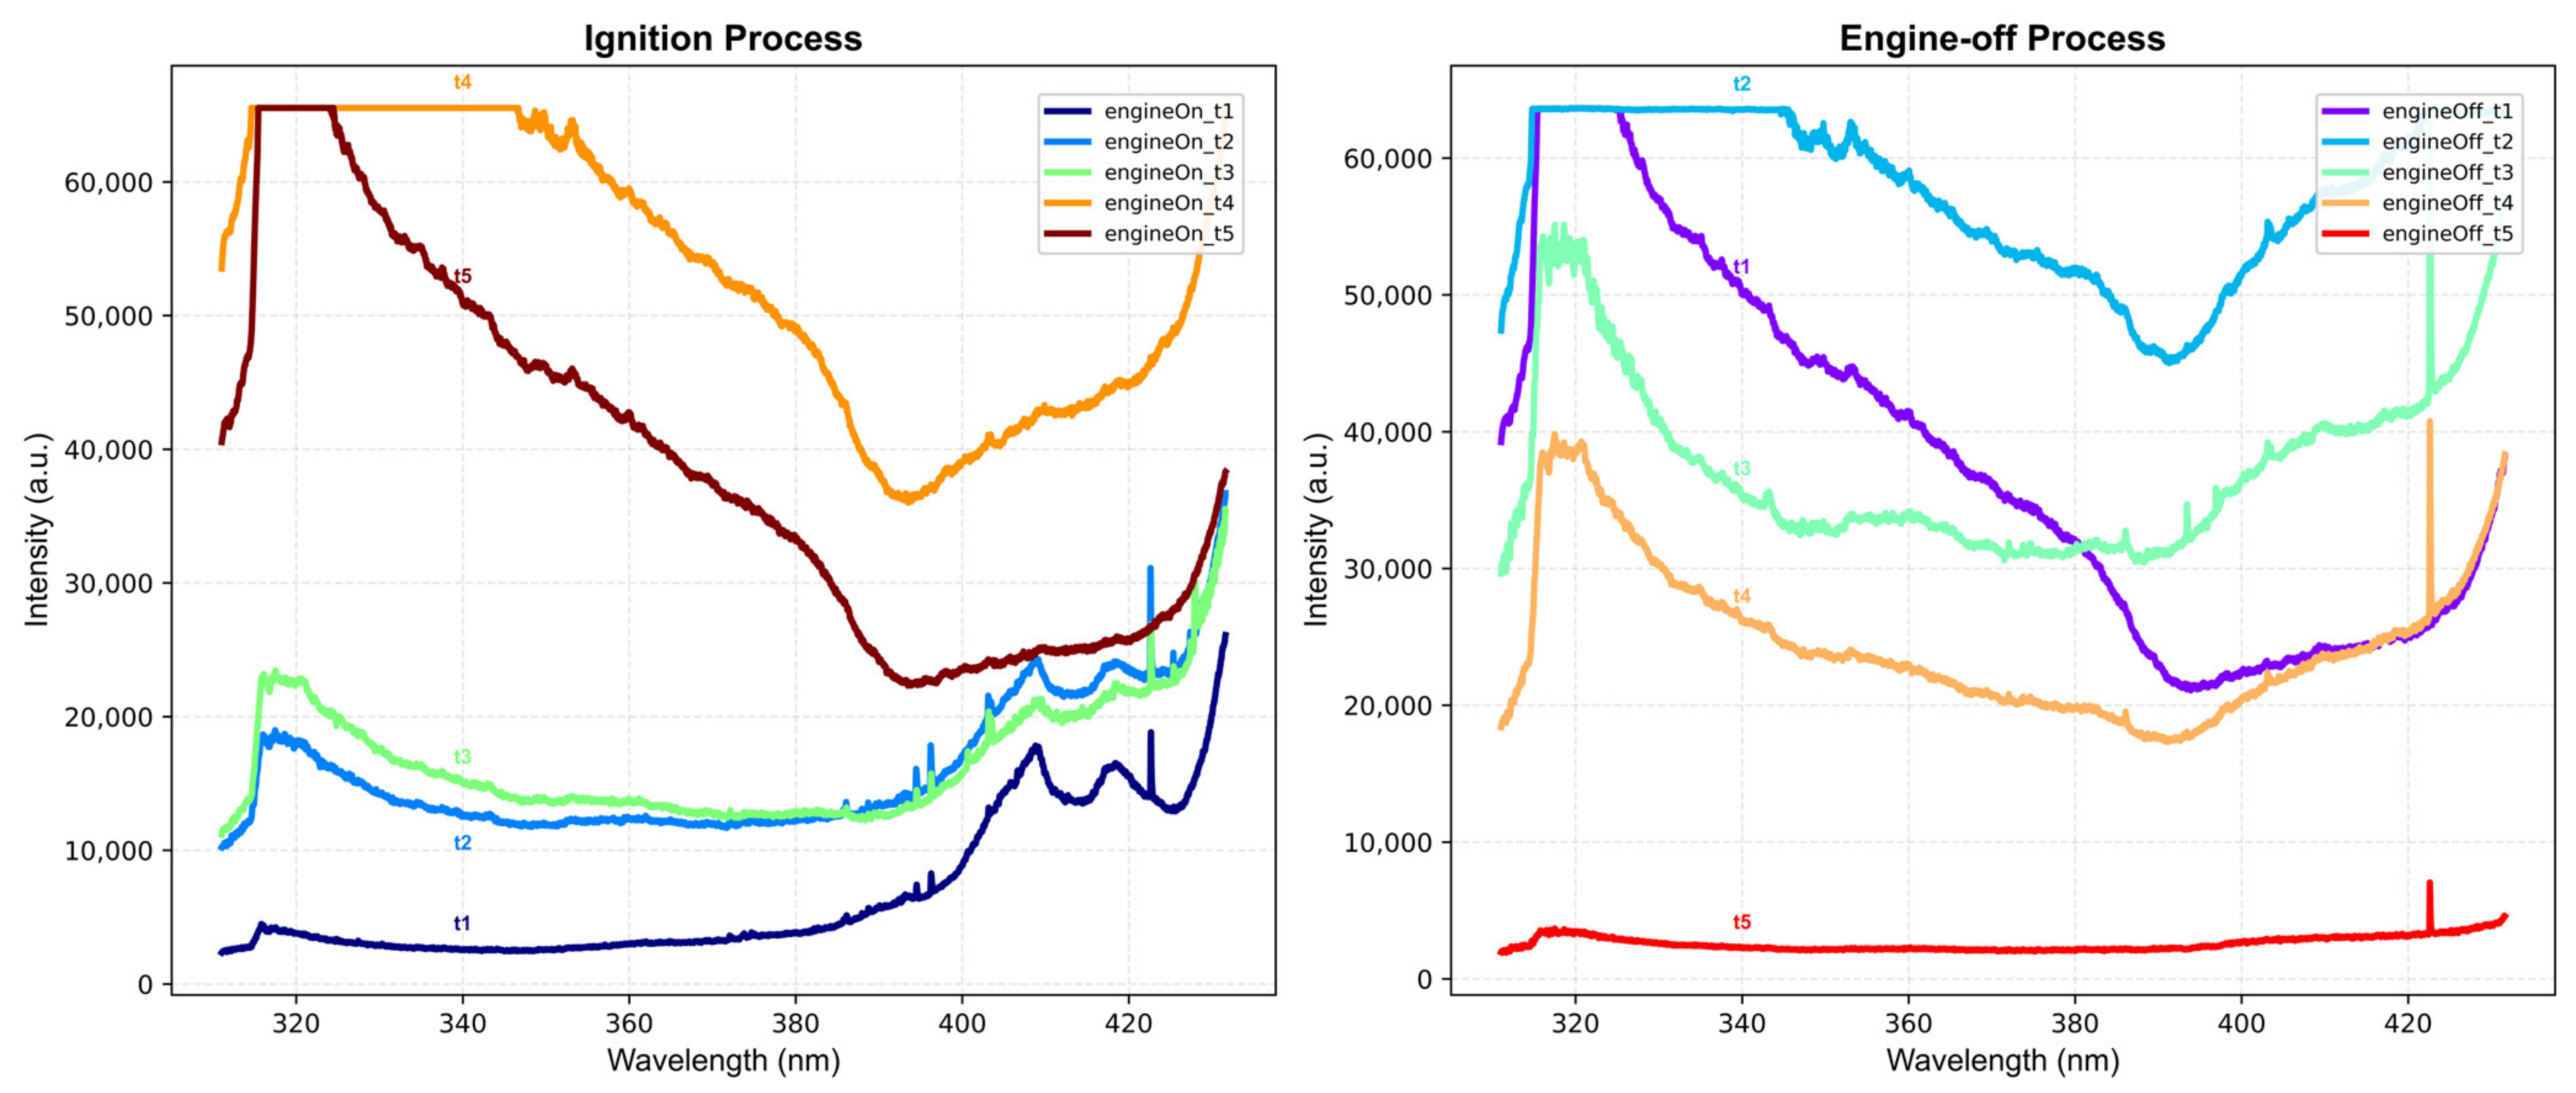
Figure 3 shows the original time-series spectra during the two transients. During ignition, the metallic peaks in the 390–431 nm range first appear during pre-injection (0–2.2 s), when two-stage ignition establishes the flame. As combustion develops through throttle-up (2.2–3.0 s), the OH band at 310–320 nm rises rapidly while the metal peaks fade and disappear. The shutdown transient shows the inverse sequence: after throttle-down (t_off to t_off + 0.8 s), the metal peaks reappear only at final flameout, after the OH signal has almost fully decayed. The five spectra in each panel are taken at the instants engineOn_t1–t5 (ignition) and engineOff_t1–t5 (shutdown), which are marked on the pressure timeline in Figure 1.
Figure 3.
Comparison of ultraviolet spectra of the exhaust plume during ignition and shutdown transients. (Left panel): ignition transient; (Right panel): shutdown transient.
This inverse correspondence shows that ignition and shutdown follow a mirror-inverse spectral symmetry. Metal peaks appear only at the ignition-onset and flameout boundaries, fade out during throttle-up, and are completely absent during steady combustion and throttle-down, confirming their exclusivity as boundary markers.
3.2. Spectral Features of the Ignition Transient and the Shutdown Transient
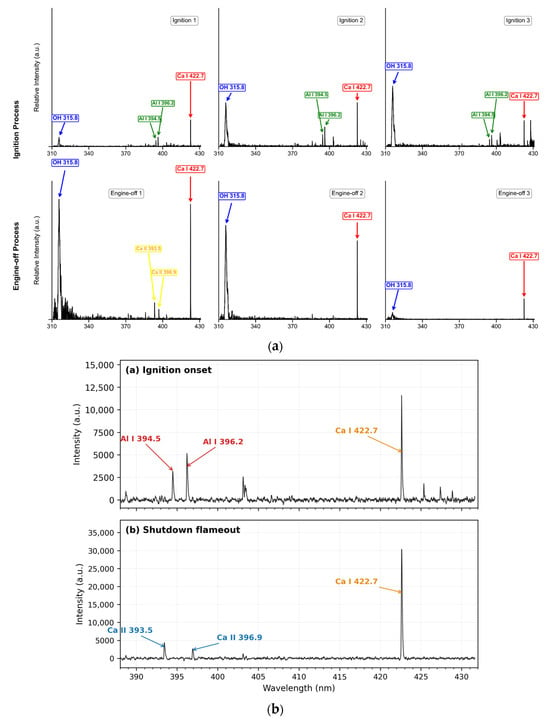
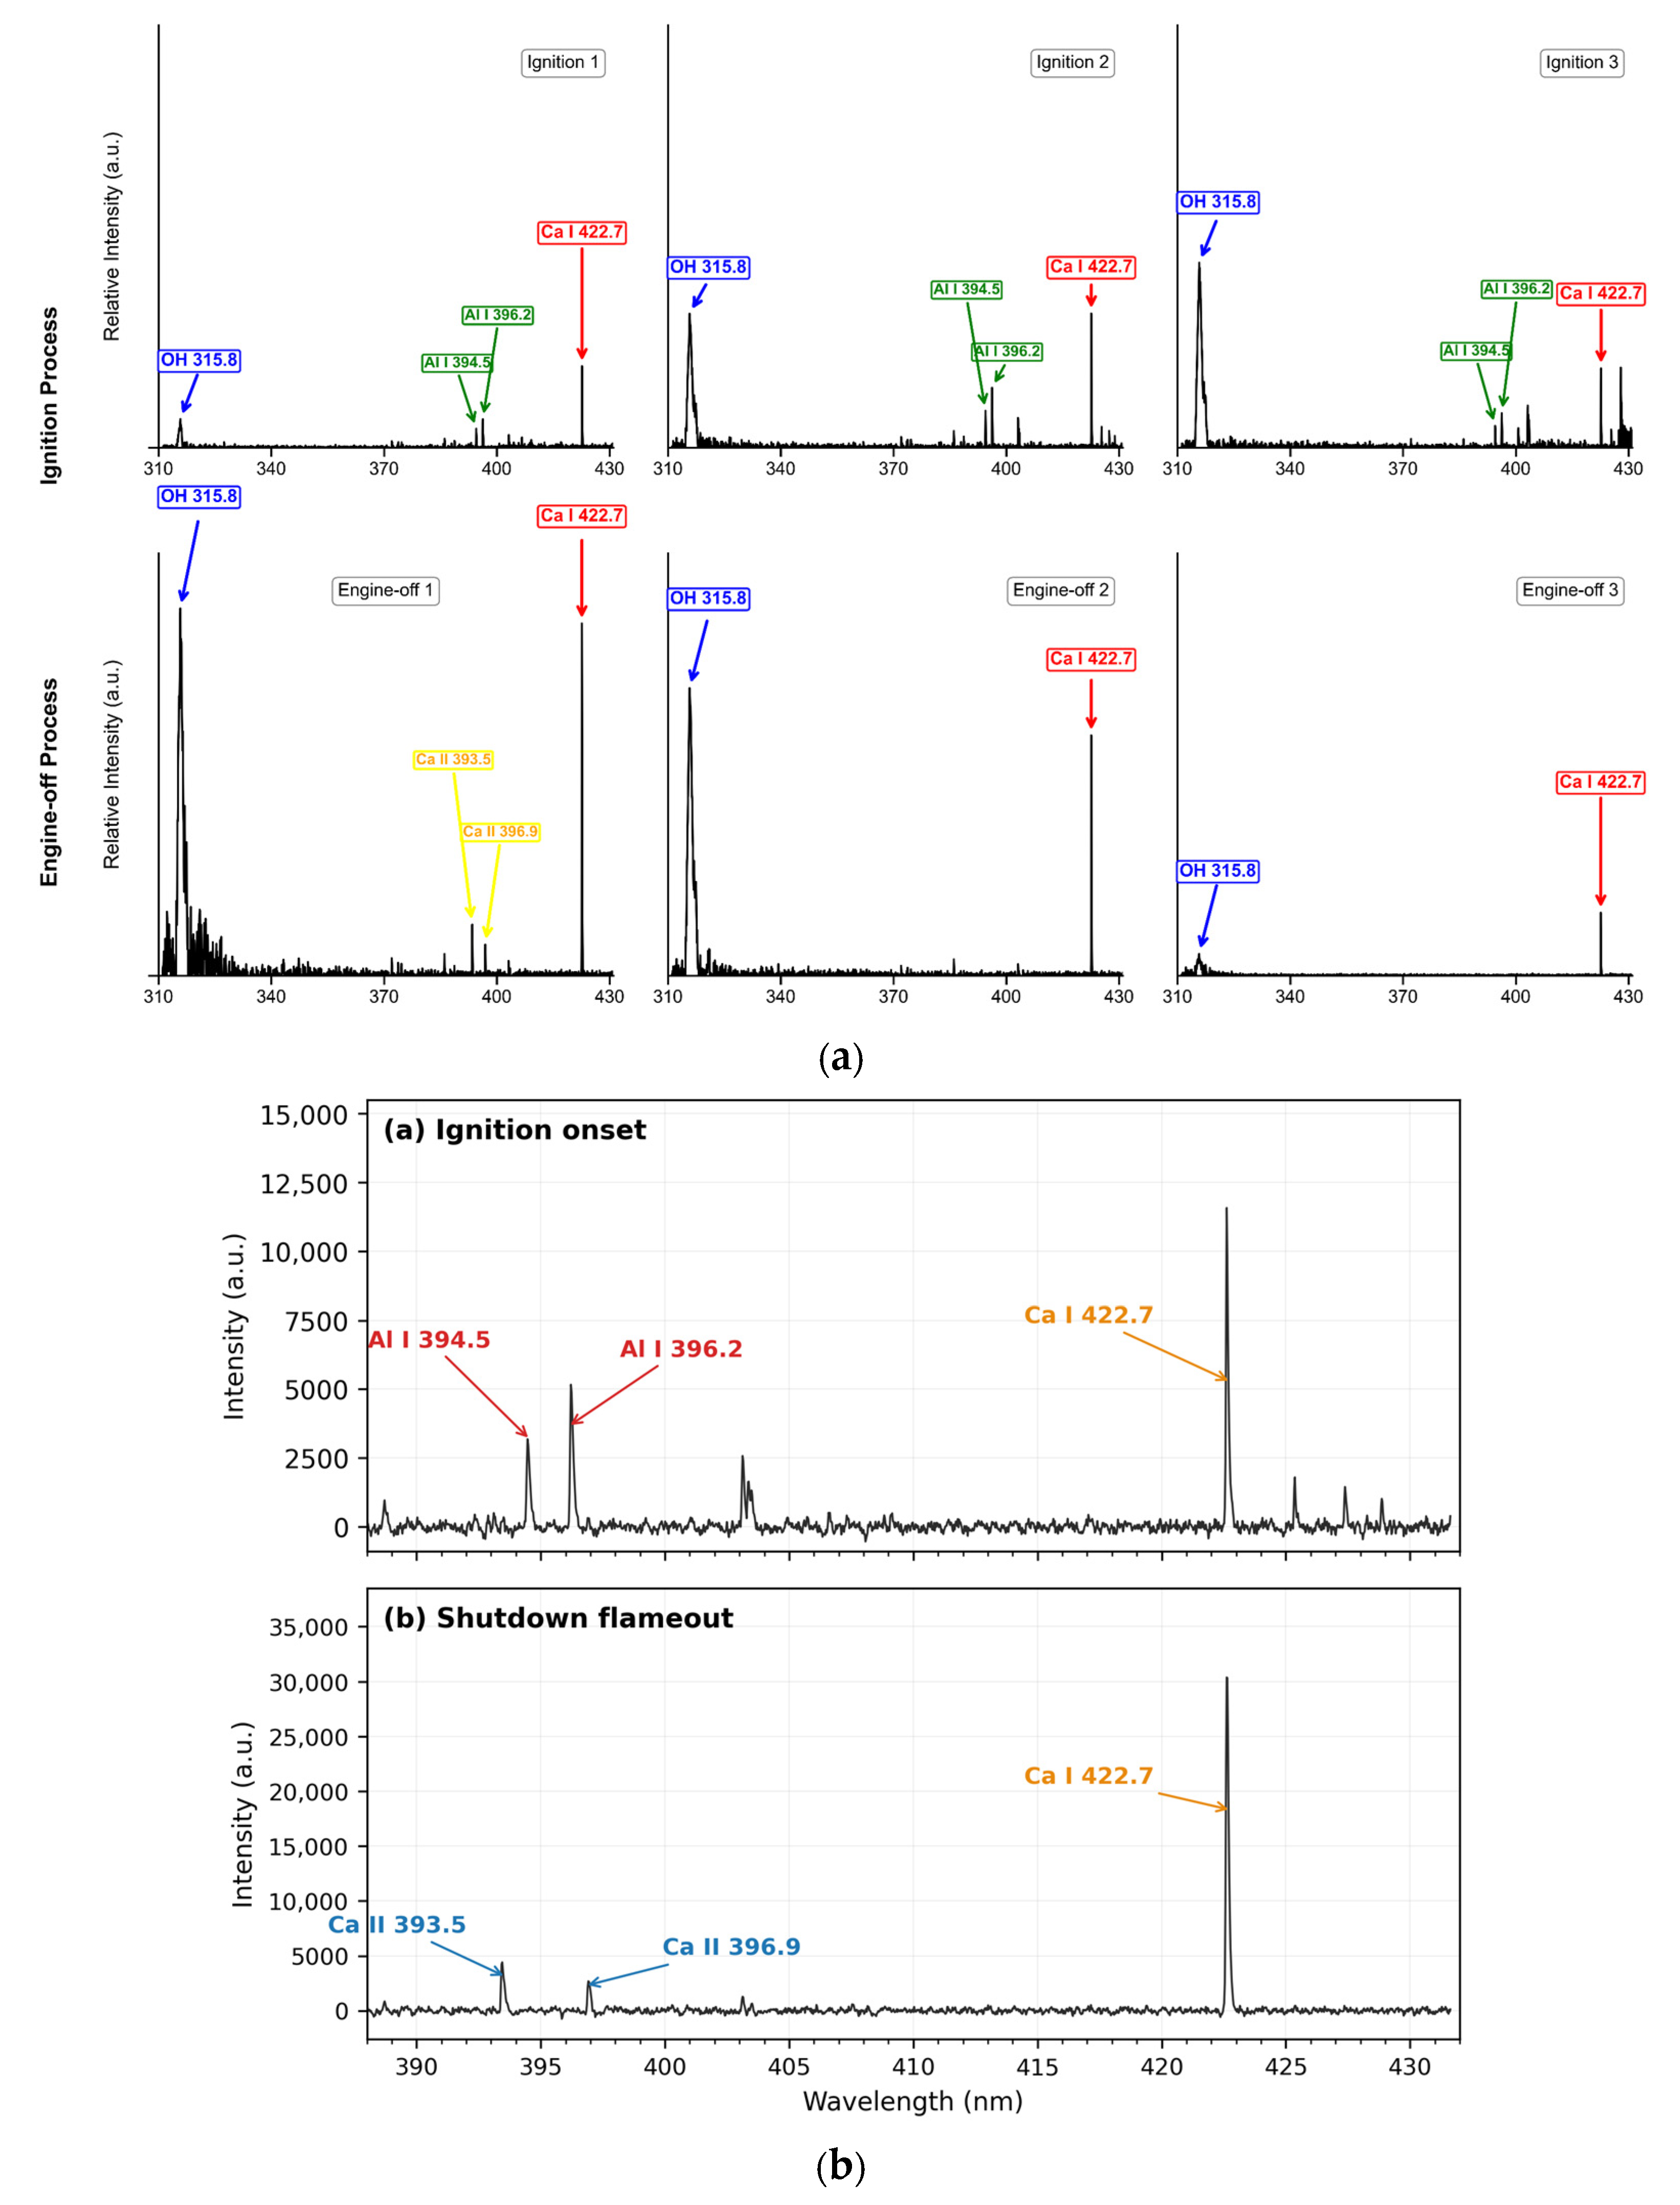
Figure 4 compares the full-cycle time series of ignition and shutdown. In Figure 4a, the upper row shows the ignition sequence: the Al I 394.5/396.2 nm doublet and the Ca I 422.7 nm line appear from the initial ignition stage and persist through early throttle-up, while the strong, stable OH band at 310–320 nm grows continuously and becomes the dominant spectral feature as combustion is established. The lower row shows the shutdown sequence: near rated power the OH band and Ca I 422.7 nm line reach their peak intensity and the Ca II H&K doublet emerges; during throttle-down the OH band fades as combustion weakens and the Ca II lines vanish, leaving the Ca I 422.7 nm line as the only metal feature discernible down to final flameout, while the Al I doublet stays absent throughout. This comparison confirms the complementary, non-mirror evolution of the metal lines on the two sides and verifies that metal peaks—the Al I doublet for ignition and the Ca II H&K doublet for shutdown—are unambiguous boundary markers.
Figure 4.
Time-series comparison of spectral features during ignition and shutdown transients. (a) Representative frames of the ignition (Ignition 1–3, (upper row)) and shutdown (Engine-off 1–3, (lower row)) sequences. (b) Magnified view of the 388–431 nm region comparing the Al I doublet (394.5/396.2 nm) at ignition onset and the Ca II H&K doublet (393.5/396.9 nm) at shutdown flameout against the local noise floor.
During ignition, the Al I 394.5/396.2 nm doublet and the Ca I 422.7 nm line evolve together with the OH band. At the begin of pre-injection, the metal peaks are already discernible while the OH band is still weak; the metal peaks and the OH band then strengthen together through two-stage ignition; as the engine throttles up toward rated power, the OH band keeps rising and becomes the dominant feature while the metal peaks decline in relative intensity. These three stages are denoted Ignition 1–3 in Figure 4a (upper row) and correspond to the instants engineOn_t1–t3 among the five time markers shown in Figure 3. The ignition doublet at 394.5/396.2 nm originates from the TEA component of the TEA/TEB igniter mixture, marking the establishment of combustion. Although the igniter is a TEA/TEB mixture, no boron spectral features are detected during the ignition plume registration. This absence follows directly from the spectral window of the instrument: the primary resonance lines of atomic boron lie in the vacuum ultraviolet below 250 nm, and the strong molecular bands of boron oxides (BO2) lie in the green region above 450 nm, so both fall entirely outside the 311–431 nm operating range and are invisible to the spectrometer even though boron is present in the ignition plume. The aluminum lines at 394.5/396.2 nm are the only igniter-derived atomic features within the measurable window, which is why they mark the ignition boundary. The measured metal peak wavelengths (422.7, 394.5, and 396.2 nm) match the NIST Atomic Spectra Database, and their narrow, stable line shapes rule out stray light and broadband continuum. The measured full width at half maximum (FWHM) of both Ca I and Al I lines is 0.15–0.25 nm, consistent with the instrument resolution and typical Doppler broadening in high-pressure rocket plumes, ruling out stray-light or continuum artifacts. A decisive asymmetry appears between the two metals across the two transients: the Al I doublet is present throughout the ignition sequence yet completely absent during shutdown. This asymmetry is significant because no additional igniter is injected at shutdown; its physical origin is discussed in Section 4.1. The assignment is unambiguous at the instrument resolution: the ignition pair at 394.5/396.2 nm is the Al I doublet, whereas the feature appearing in the shutdown sequence near 396 nm is the Ca II H&K doublet (393.5/396.9 nm), separated from Al I 396.2 nm by 0.7 nm, well beyond the spectral resolution, so the shutdown emission is unambiguously distinguished from aluminum.
Shutdown departs from a strict mirror of ignition in one decisive respect. In Engine-off 1, recorded just before throttle-down (near rated power), the OH band and the Ca I 422.7 nm line reach their maximum intensity of the cycle, and the Ca II H&K doublet appears, while the Al I doublet remains absent. As the engine throttles down (Engine-off 2), the OH band and the Ca I line decay together and the Ca II lines disappear. At final flameout (Engine-off 3), the OH band falls to near the noise level while the Ca I 422.7 nm line remains the last distinguishable emission feature before all emission ceases. The labels Engine-off 1–3 (Figure 4a, lower row) analogously correspond to the instants engineOff_t1–t3 in Figure 3. The engineOn/engineOff notation indexes the five sampling instants along the whole transient timeline, whereas Ignition/Engine-off 1–3 denote the representative stages within the ignition and shutdown sub-processes, respectively. Metal lines therefore mark the two combustion boundaries in a complementary way: the Al I doublet tracks the igniter only on the ignition side, whereas Ca emission (Ca I throughout combustion and Ca II H&K near rated power) characterizes the shutdown side.
3.3. Diagnostic Utility of Transient Overexposure
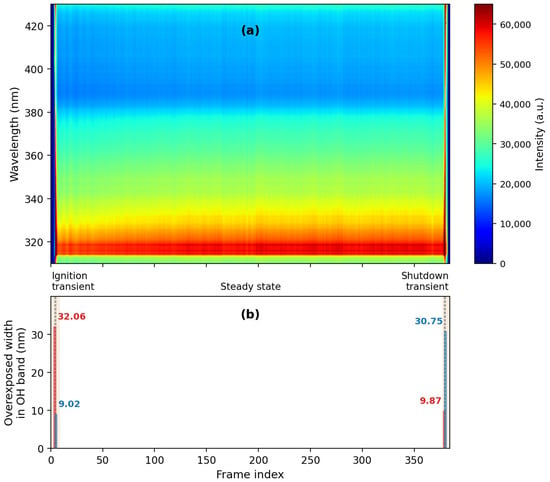
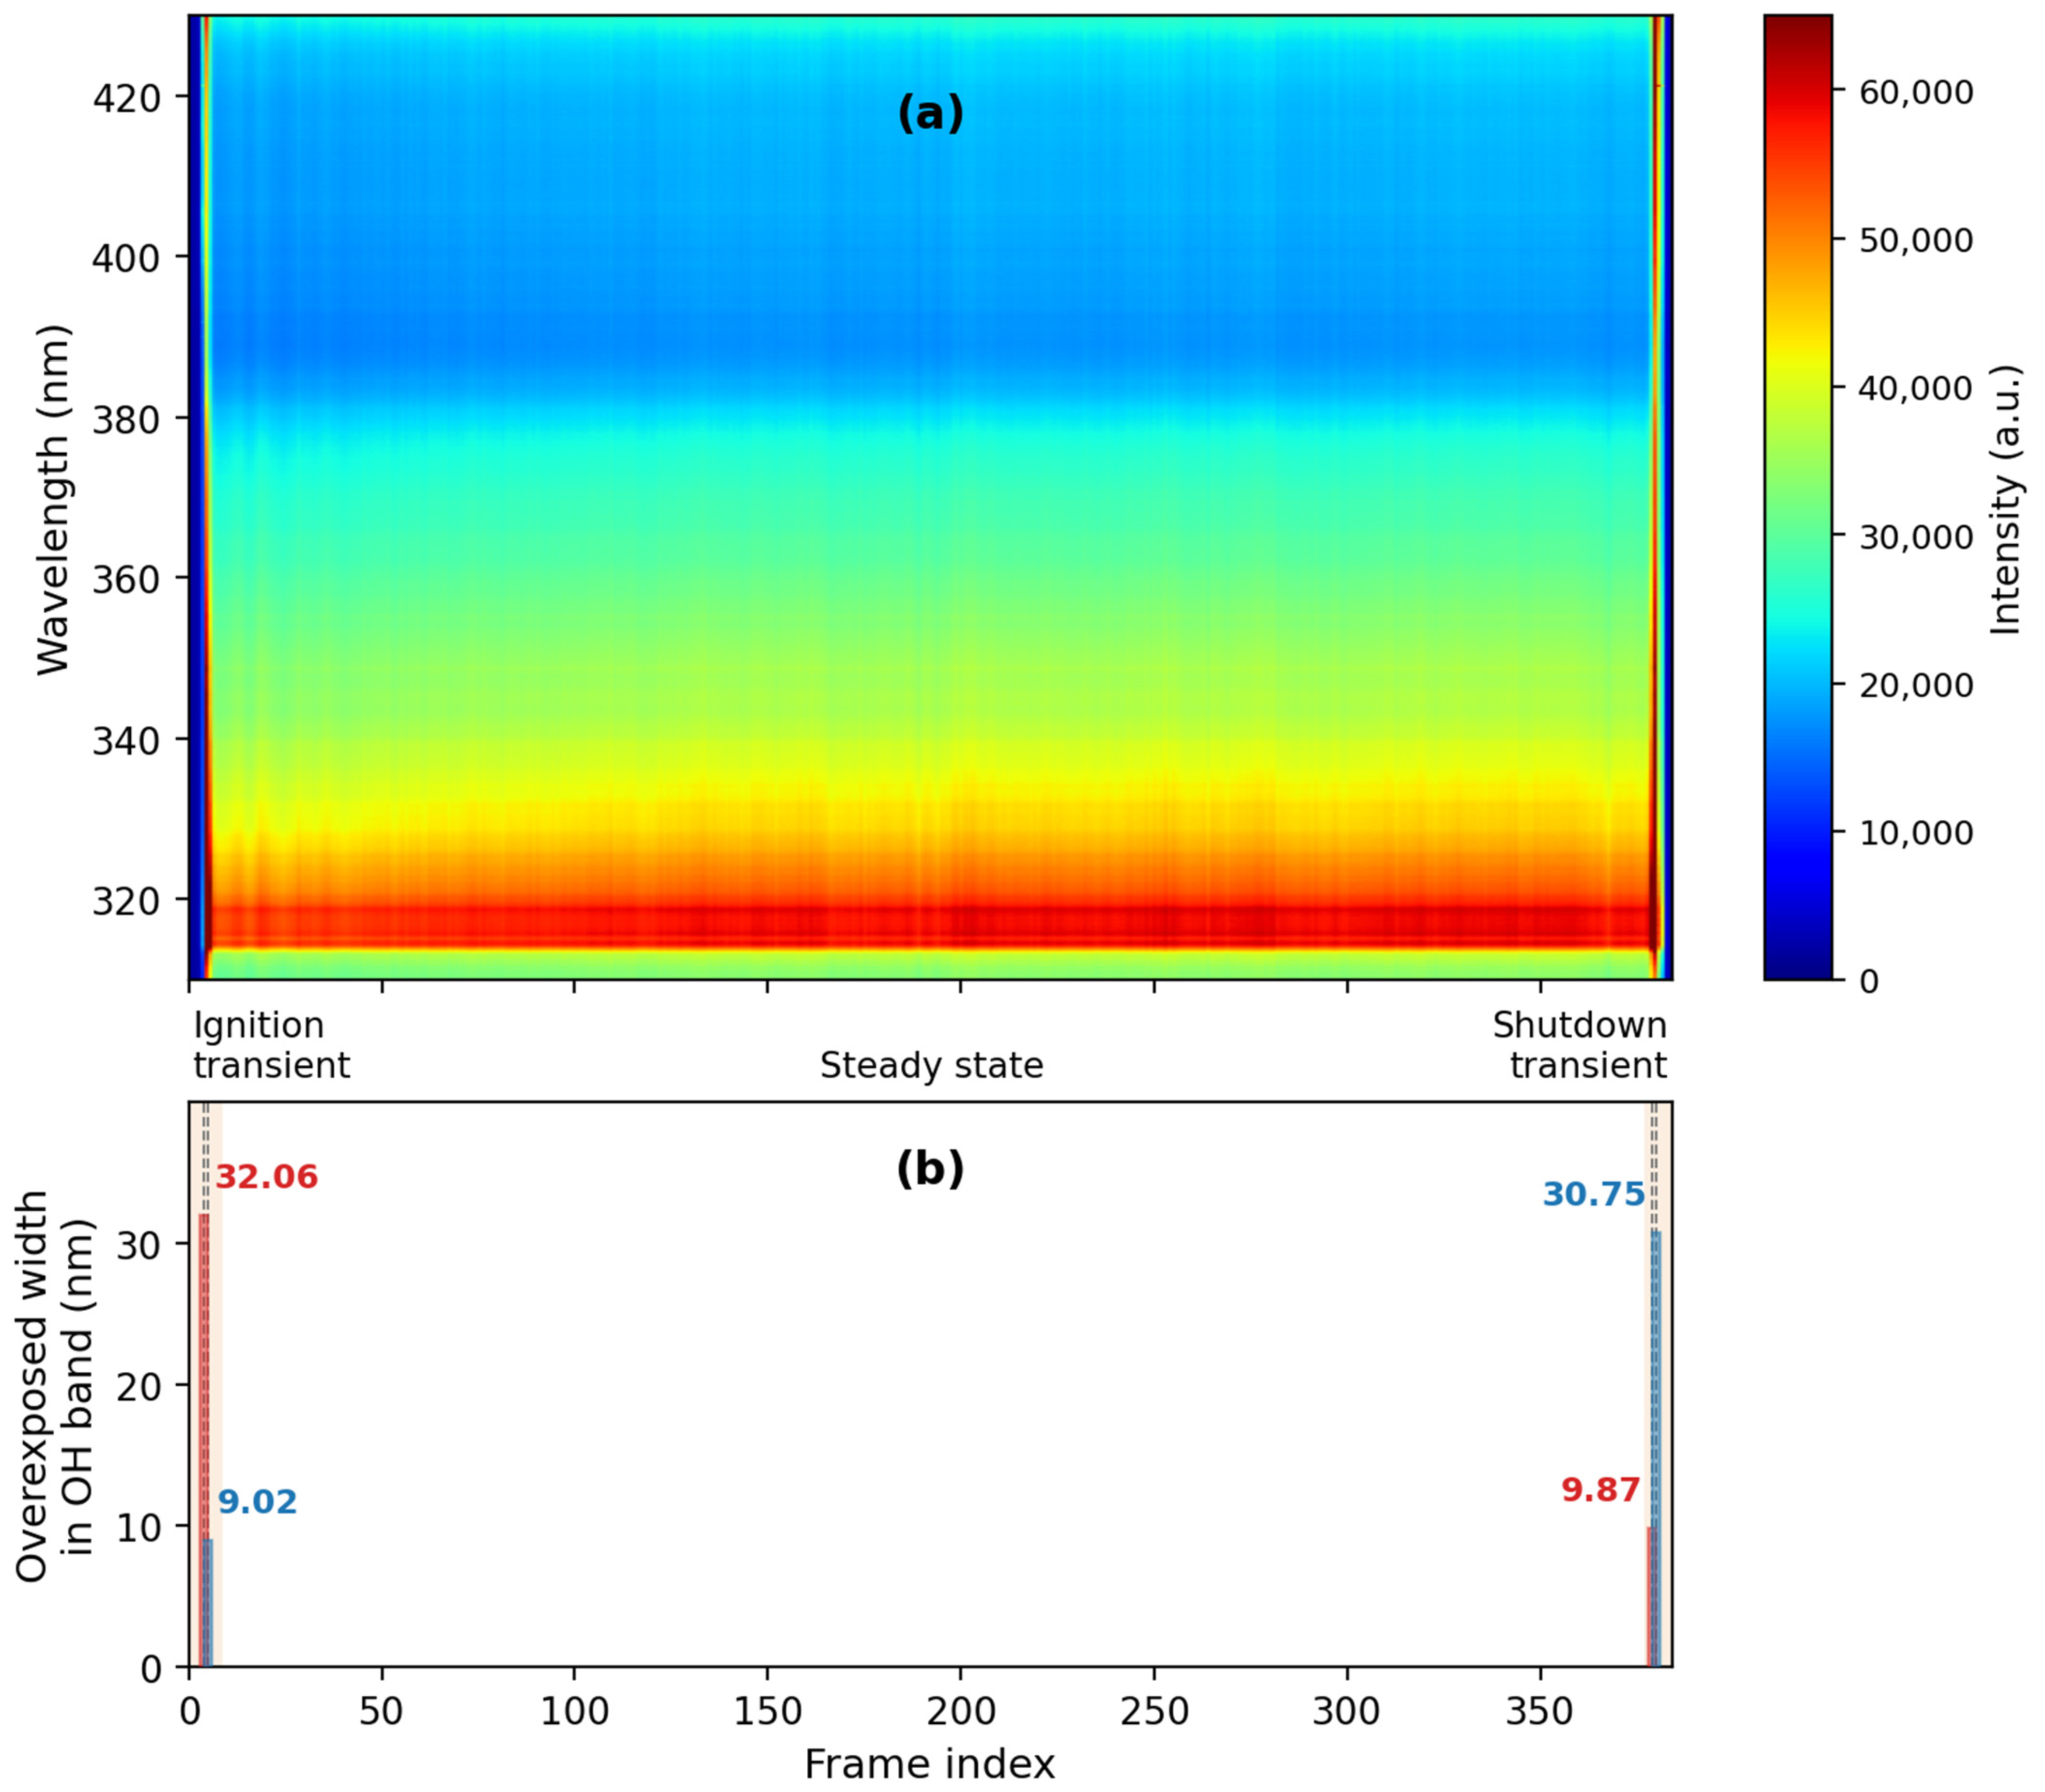
OH-band overexposure is observed only during the throttle transitions, and its onset coincides with the 60%-to-100% throttle-up point. Overexposure persists only through the ignition transition and resolves automatically once steady combustion is established; it never occurs during steady operation. Figure 5a presents a heatmap illustrating the temporal evolution of the plume emission spectra from pre-ignition through to post-shutdown. Figure 5b shows the time-resolved total number of wavelength bins exceeding the detector’s upper saturation limit over the full sequence.
Figure 5.
(a) Heatmap of time-series plume spectra over the full cycle. (b) Temporal profile of the count of saturated wavelength bins.
Consistent with this symmetry, OH overexposure also occurs during shutdown throttle-down, with nearly identical characteristics to the ignition event. It resolves precisely at throttle-down onset, coinciding with the 100%-to-60% transition. As with ignition, overexposure is confined to the shutdown transition, with no saturation during steady operation.
The saturation results from the parameter configuration of the measurement system. To obtain high-quality steady-state spectra with optimal signal-to-noise ratio, the system was set so that the steady-state signal intensity lies near the detector’s upper limit. Saturation is therefore confined to the throttle transition windows and never occurs in steady operation.
A further characteristic reinforces the monitoring value of these events: the spectral width of the saturated region, defined as the wavelength span over which the detector signal reaches its upper limit, evolves monotonically and direction-dependently through a transient. “Broad overexposure” means a larger span exceeds the limit and “narrow overexposure” a smaller one. During throttle-up (60% to 100%), the saturated span narrows from about 32 nm to 9 nm before saturation disappears; during throttle-down (100% to 60%), it widens from about 10 nm to 31 nm before vanishing. The two transitions thus run in opposite directions, a broad-to-narrow collapse during load-up and a narrow-to-broad expansion during load-down, mirroring the inverse relationship already established for ignition and shutdown. The physical mechanism underlying this transient overexposure is discussed in detail in Section 4.3.
Overexposure in both transients offers clear monitoring value. Its onset and resolution timings are tightly coupled to the critical combustion transitions, so condition changes can be identified quickly without complex quantitative analysis. The saturation is a deliberate part of the acquisition design. The exposure was set so that the steady-state signal sits near the detector ceiling, which maximizes the steady-state signal-to-noise ratio required for the stability analysis (Section 3.4) and guarantees that the transient OH* surge during throttle transitions crosses the saturation boundary. The saturation onset therefore acts as a built-in binary alarm for the transient phases, at no additional hardware cost. A different exposure or gain would shift the exact saturation boundary, but in any deployed system the acquisition configuration is fixed at calibration, and under that fixed configuration the appearance and disappearance of saturation is a consistent, reproducible indicator of the throttle transitions. In addition, the saturated span evolves directionally through each transient, narrowing during throttle-up and widening during throttle-down (Section 3.3), which gives a secondary, direction-sensitive signature that survives moderate changes in the acquisition setting.
3.4. Stability of Spectral Measurements During Steady-State Combustion
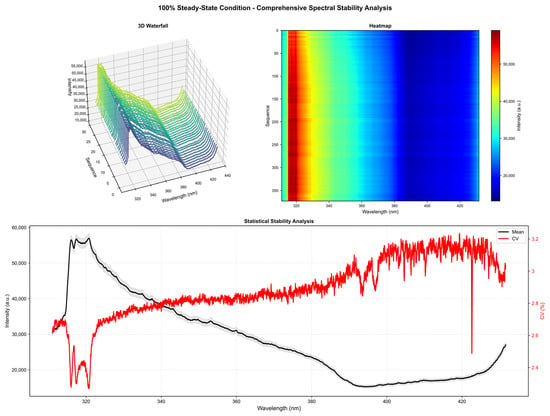
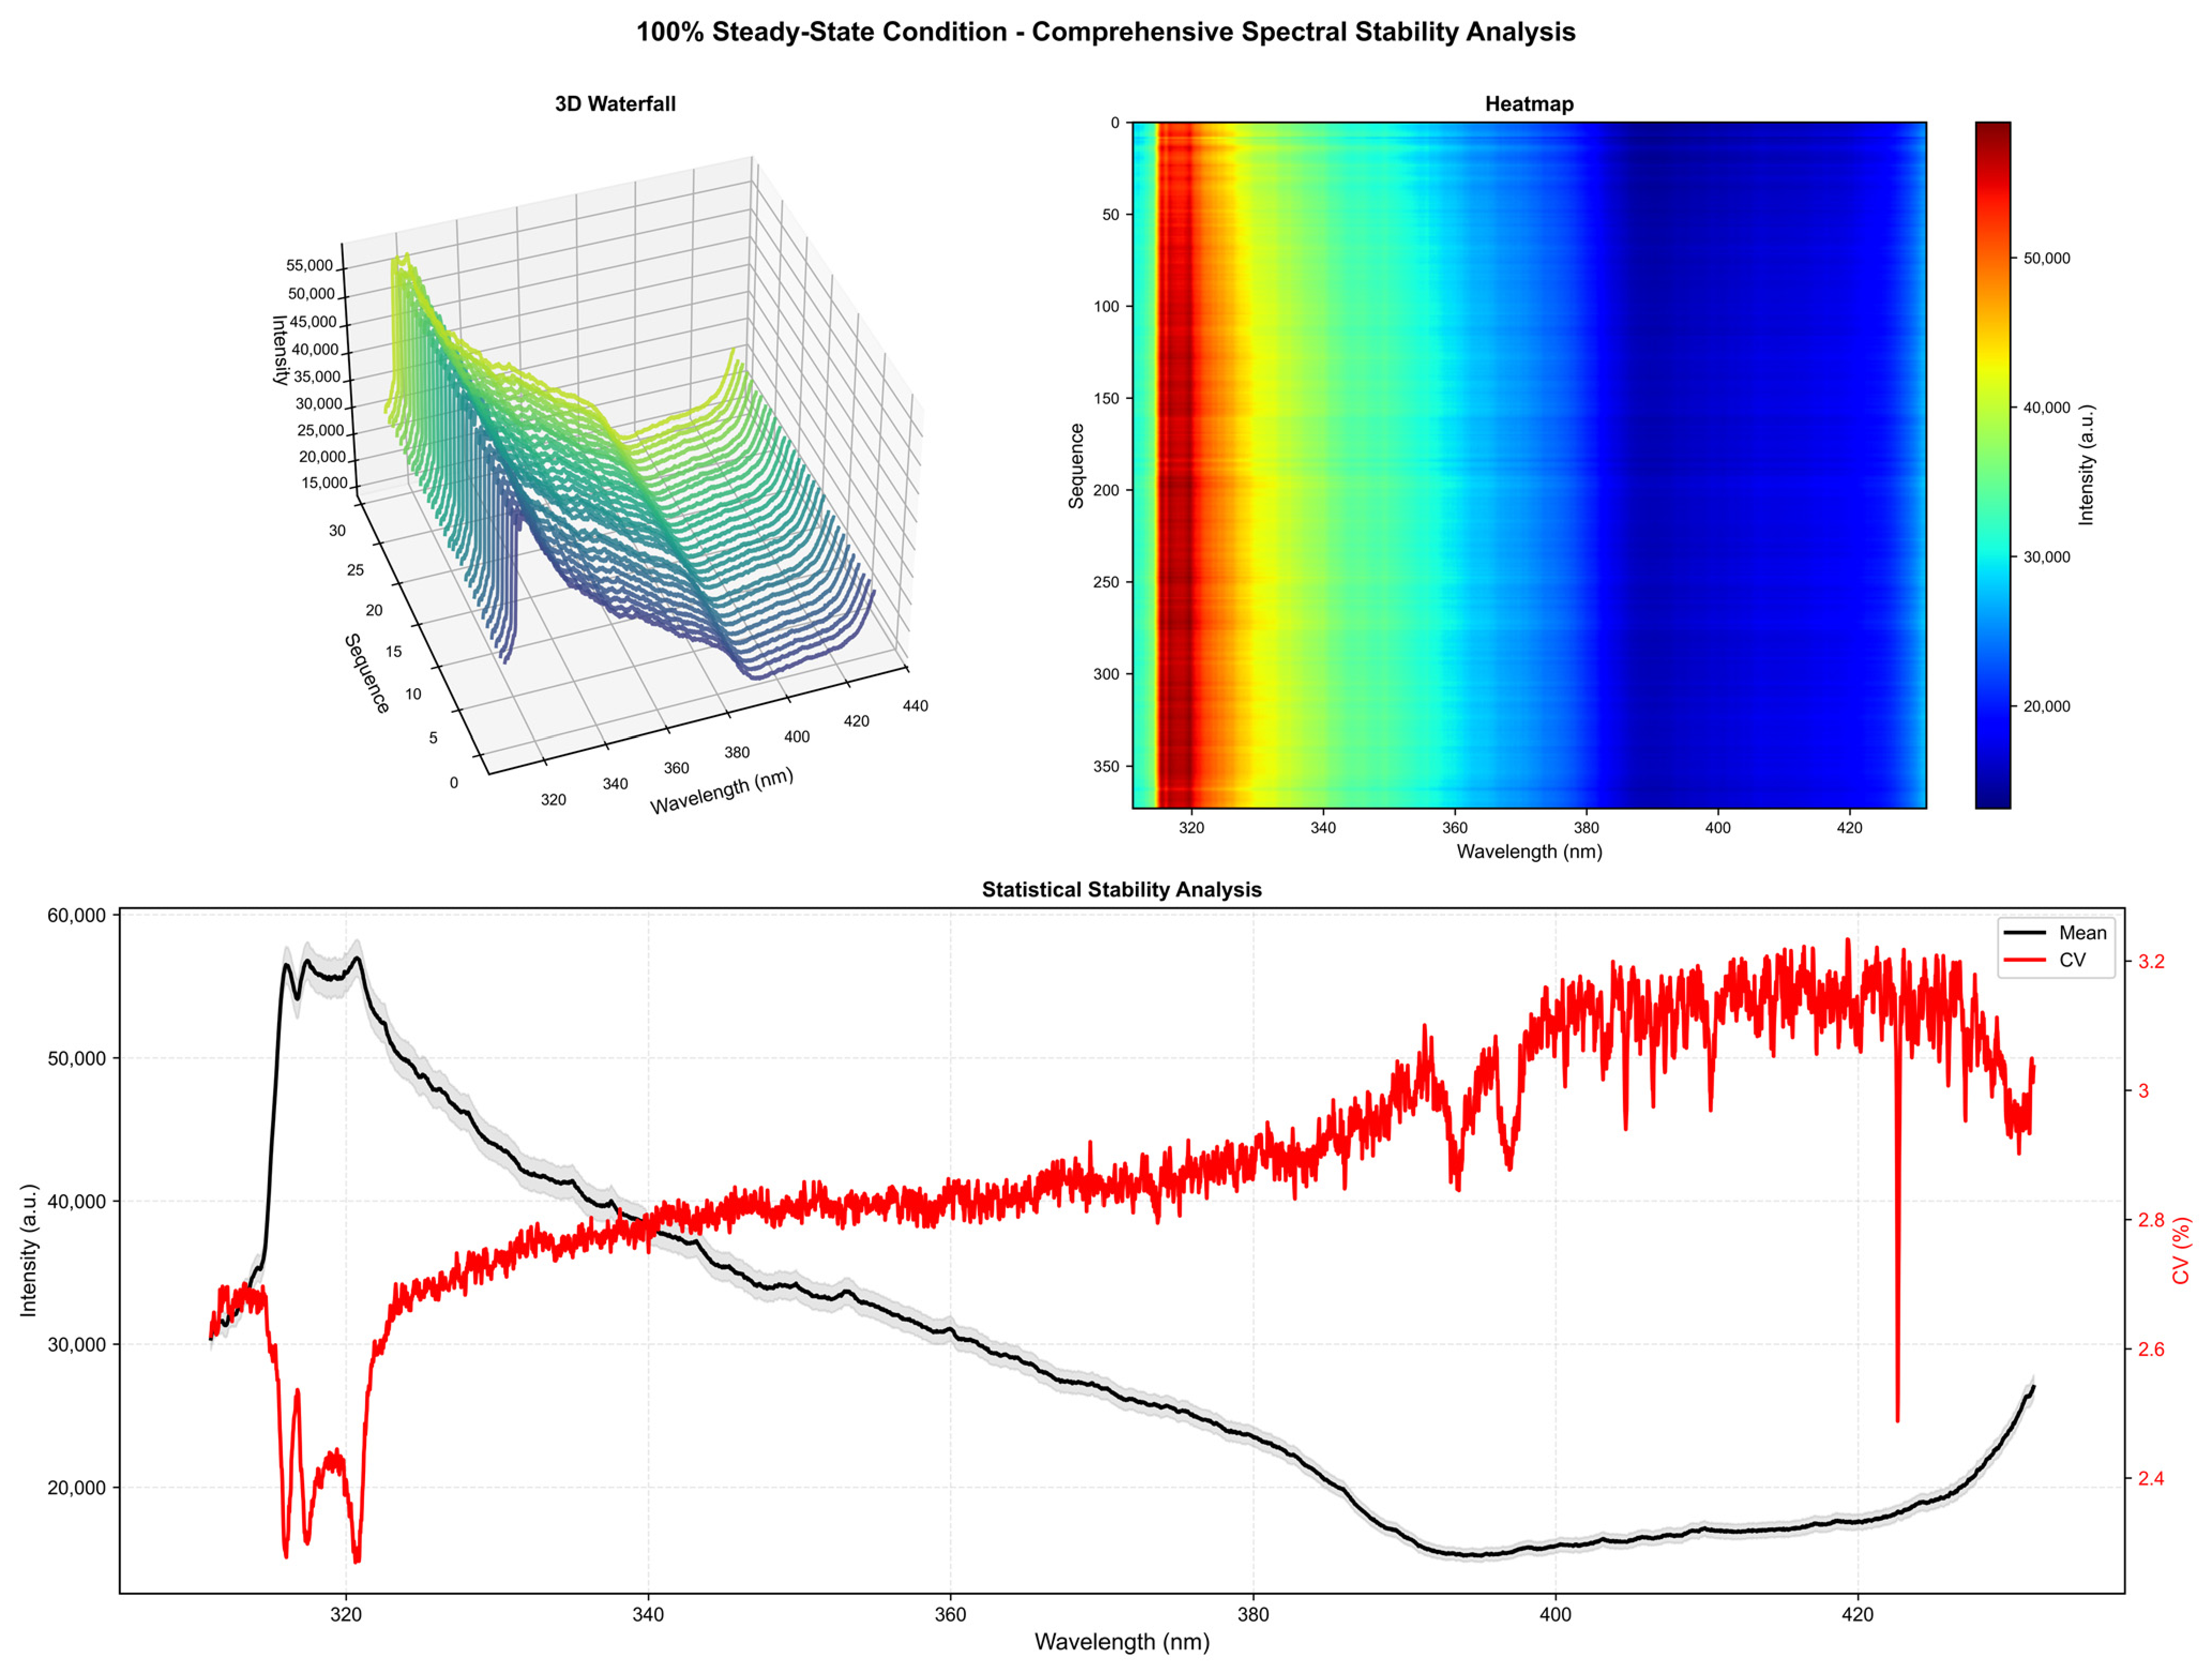
Figure 6 presents the stability analysis of steady-state combustion. The temporal evolution of the plume spectrum is shown in two ways: (i) a 3D waterfall of chronologically ordered spectra, and (ii) a heatmap of the complete time series of 384 sequentially recorded frames (358 steady-state, Table 3). Both views show that the full-wavelength spectral distribution stays highly consistent through steady operation, with no abrupt emission features. This consistency is the stability signature the present configuration is designed to capture. The 200 ms integration averages out fluctuations faster than roughly a few hertz, so the spectra follow the long-timescale (sub-second to minute) evolution of the combustion state, tracking drift and work-point holding across the run. Statistical analysis quantifies this: the mean spectrum shows the strong OH band at 310–320 nm as the only dominant feature, with no measurable peaks at the metal wavelengths 394.5, 396.2, and 422.7 nm. The coefficient of variation (CV) shows the OH band reaches a minimum of about 2.25%, confirming strong frame-to-frame consistency across the 358 steady-state frames, while the full-spectrum CV stays below about 3.0% through steady operation. The OH band is thus a reliable, stable steady-state marker, and the complete absence of metal peaks confirms that metal lines are exclusive transient markers.
Figure 6.
Comprehensive spectral stability analysis for the 180 s steady-state operation.
Table 3.
Summary of hot-fire tests and acquired steady-state spectra.
Table 3 summarizes the two hot-fire tests, the number of time-resolved frames, the steady-state subset, and the OH-band stability within each test. The 100% test alone provides more than 300 consecutive steady-state acquisitions with a frame-to-frame spectral correlation above 0.9997, a high-confidence within-run repeatability demonstration.
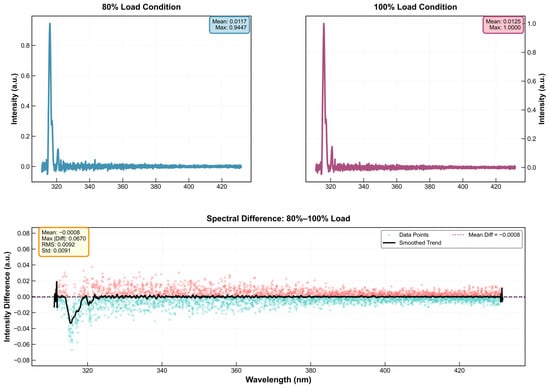
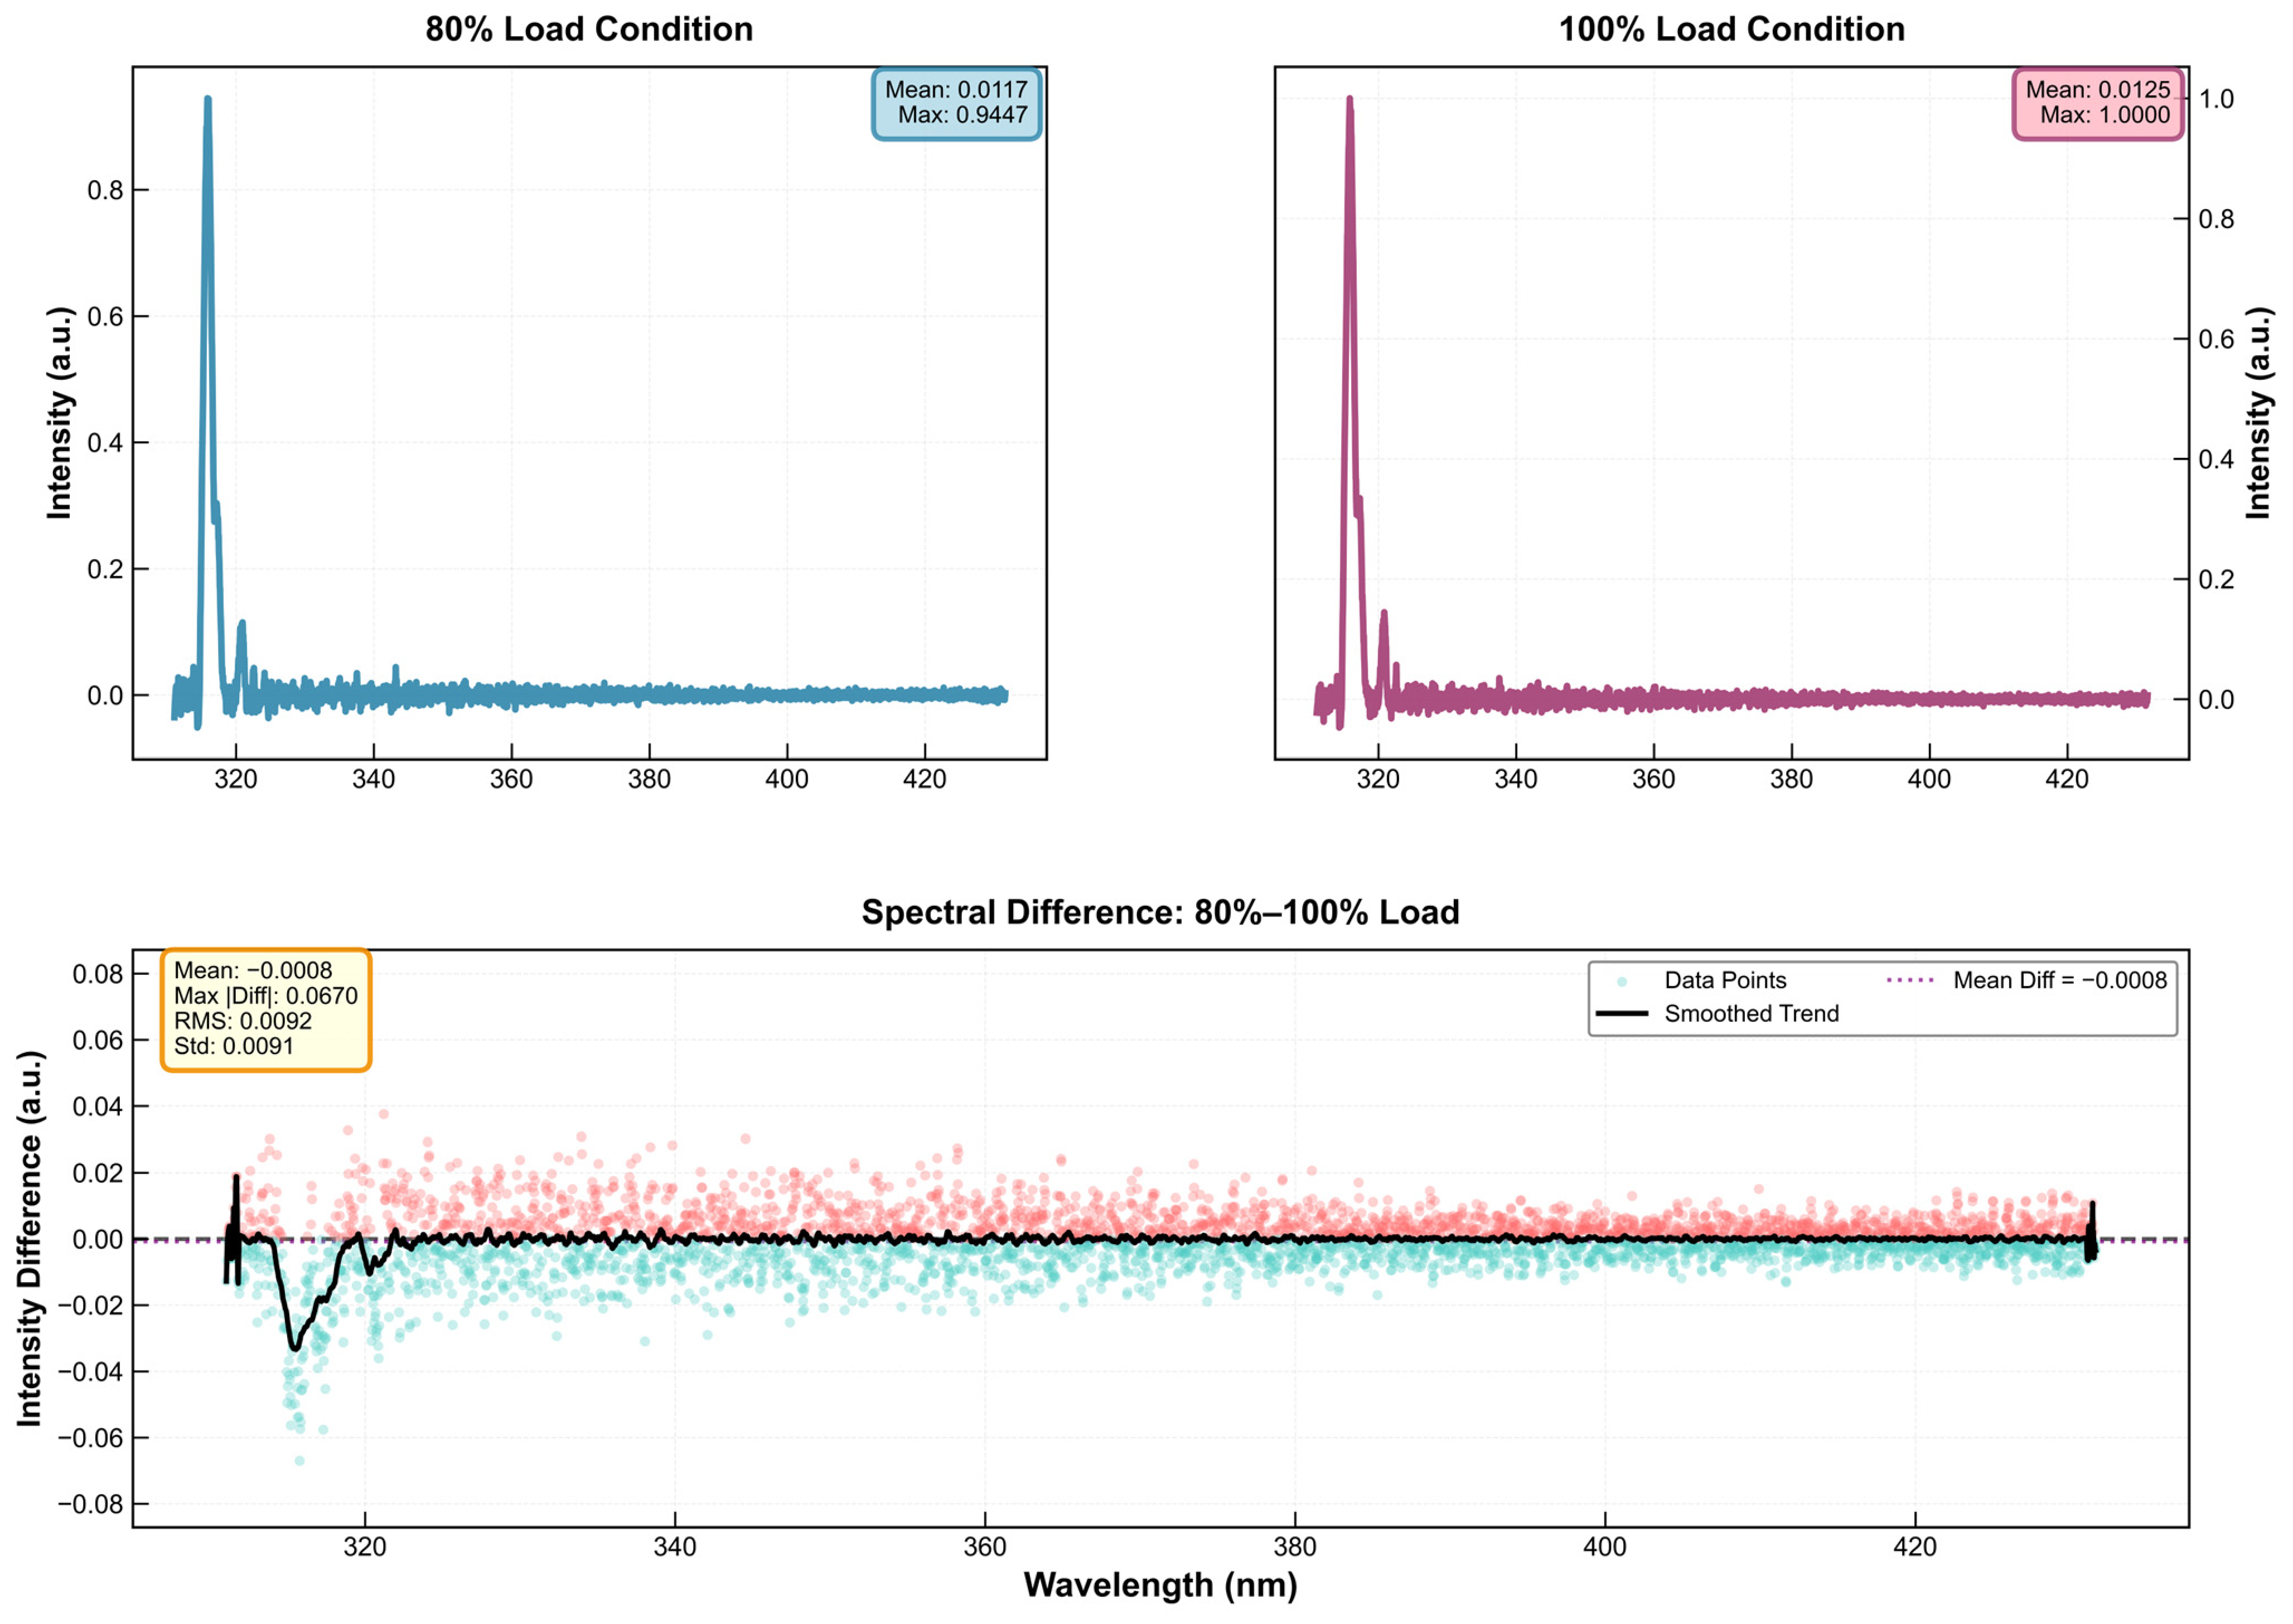
Figure 7 compares steady-state spectra at 80% and 100% rated load. The normalized spectra are nearly identical: the only strong feature is the OH band at 310–320 nm, with no metal peaks at 394.5, 396.2, or 422.7 nm under either condition, confirming that metal peaks are transient markers. The Pearson correlation between the two spectra reaches 0.9954, quantitatively verifying the high consistency of spectral shape across loads. The full-wavelength intensity-difference curve is nearly flat, with a mean of –0.0008 and a standard deviation of 0.0091 and no local peaks. The only difference between the two conditions is therefore the overall emission intensity, set by the higher heat-release rate at higher load; the spectral feature types and distribution are unchanged.
Figure 7.
Spectral comparison: 80% vs. 100% load conditions.
4. Discussion
4.1. Mirror-Inverse Spectral Evolution Mechanism Between Ignition and Shutdown Transients
The mirror-inverse spectral variation between ignition and shutdown arises from competing processes of propellant mixing, radical generation, and metal release at the combustion boundaries. At ignition, the pyrophoric igniter introduces trace metals into the combustion zone before stable combustion is established. The aluminum comes from the TEA (triethylaluminum) component of the igniter, which is consumed once its pyrophoric reaction establishes the flame. The calcium, which appears together with the aluminum at ignition, is available at both the ignition and shutdown boundaries because two sources supply it. It is a trace element in refined kerosene (RP-1) and in common lubricants and seal materials, and any calcium carried in with the propellant or the hardware is released into the plume. The oxygen-rich preburner and the high-pressure hot-oxygen flow it delivers can also strip calcium from metallurgical alloys and protective coatings by micro-erosion at the surfaces exposed to the oxidizing gas. Because calcium persists as a low-excitation neutral atom in the cooling plume, even a small, continuously replenished impurity population produces a detectable Ca I 422.7 nm line at the boundaries, where the OH and continuum background are dim. As the engine shuts down, the combustion-zone temperature drops sharply, yet just before complete extinction ionized calcium briefly appears as the Ca II doublet (393.5/396.9 nm) and then vanishes, while the neutral Ca I 422.7 nm line persists. This Ca II-before-Ca I sequence follows directly from the different excitation energies of the two species. The Ca I 422.7 nm line is a resonance transition of neutral calcium with an upper level only 2.93 eV above the ground state. The Ca II lines arise from excited singly ionized calcium, whose production additionally requires 6.11 eV ionization energy, so that populating the Ca II upper level demands roughly 9.26 eV, more than three times the energy of the Ca I line. Ionized-calcium emission is therefore confined to the brief, energetic moment at the shutdown boundary, when the collapsing flame still supplies high-energy electrons and residual thermal ionization; it disappears once the temperature falls below this threshold, while the low-excitation Ca I line persists on the trace calcium impurity. This excitation-energy contrast explains why calcium alone remains visible through the shutdown boundary. Short-lived micro-flame kernels at this stage excite the characteristic Ca and Al lines, while OH stays low because liquid kerosene and oxygen are not yet fully mixed. As the engine ramps to full power, two effects extinguish the metal lines. First, the igniter-derived metal source is consumed and not replenished, so the neutral metal population is strictly one-shot. Second, as the flame develops into a self-sustaining combustion field, the sharp rise in temperature and pressure raises the OH and continuum background against which the weak atomic lines can no longer stand out, while enhanced collisional quenching reduces the excited-metal fraction. The metal lines therefore vanish throughout nominal steady operation.
Shutdown follows a chemically reversed sequence. As the propellant valves close, heat release weakens and the OH population decays. Metal features reappear only at the final flameout threshold, once OH has faded to the noise floor. This symmetric, reversed trajectory is rarely documented in subscale work: small laboratory rigs cannot reproduce the extended throttle ascent, long steady hold, and throttle descent of a full-scale engine, so they miss the full transient evolution of propellant delivery and flame extinction. This observation fills a gap in full-cycle spectral characterization at the high chamber pressures of real engines, and provides a physical basis for separating ignition from shutdown with a single-channel UV measurement.
4.2. Physical Interpretation and Engineering Utility of Dual Diagnostic Markers (OH Band and Metallic Atomic Lines)
The OH chemiluminescence band near 315.8 nm and the Ca I line at 422.7 nm form a complementary dual-marker framework with separate physical origins, overcoming a key limitation of single-signal OES: the inability to separate steady combustion from transient boundaries.
The OH band serves as a reliable proxy for stable combustion intensity. Cross-comparison of spectra collected at different thrust levels shows that the OH signal maintains excellent consistency over long-duration firing, and that changes in engine power alter only the overall intensity, with the spectral feature distribution unchanged. This stability validates OH chemiluminescence as an effective indicator for continuous real-time monitoring that reflects relative heat-release rate without complex multi-sensor data fusion.
The calcium and aluminum lines, by contrast, act as exclusive boundary indicators for ignition onset and flame extinction. They never appear during throttle ramp-up, ramp-down, or steady combustion, and are therefore immune to variable engine load. They appear only at the two boundaries, where combustion has not yet been established (ignition) or is in the process of collapsing (shutdown), because those are the only moments when the igniter-derived metal population can stand out against a dim OH/continuum background. At steady state, the high temperature and pressure drive strong collisional quenching and raise the continuum, so the fixed metal population drops below the visible level above the background. A decisive distinction separates the two metals at the two boundaries: Ca I reappears at both ignition and shutdown, whereas Al I appears only at ignition. This asymmetry follows from their different release behavior. Aluminum is supplied exclusively by the TEA component of the igniter, consumed in one shot once its reaction establishes the flame, and no aluminum-bearing vapor is re-released at the cool shutdown boundary, so the Al I doublet stays absent there. Calcium, as a trace impurity in the igniter and kerosene, remains available at shutdown and re-emits in the weak-OH background. This source asymmetry thus provides a physically grounded, single-channel means of separating ignition (Ca I and Al I present) from shutdown (Ca I alone), which strengthens the practical utility of the metal markers for full-cycle state identification. Ca I 422.7 nm appears at both boundaries because of two properties that reinforce each other. The line is a low-excitation resonance transition (upper level 2.93 eV), so even a sparse calcium population emits as soon as a flame is present, whether the incipient ignition kernel or the residual collapsing flame at shutdown. Calcium is also continuously replenished from the propellant and the oxygen-rich hardware environment (Section 4.1), so some supply exists at both boundaries. Weak thermal excitation is enough to populate the upper level, and the continuous supply keeps the emitting population from being depleted. Aluminum has only the single-shot TEA charge and no replenishment, so its doublet appears only at ignition.
This distinction matters relative to prior full-scale studies. The metal lines in SSME plume monitoring come from gradual hardware erosion during steady operation [6], whereas the Ca and Al peaks here come from the pyrophoric igniter. Metal lines therefore act as dedicated markers of combustion start and termination in this engine. Ca I marks both boundaries and Al I marks ignition alone, so ignition and shutdown can be separated by the presence or absence of the Al I doublet. The temporal offsets between the metal lines and OH emission further support a simple discrimination logic for automated state classification, well suited to low-latency real-time monitoring during hot-fire tests.
4.3. Reinterpretation and Practical Application of Transient Overexposed Spectral Signals
Conventional optical measurement practice discards saturated, overexposed spectral frames as invalid artifacts. This work instead evaluates the monitoring value of the transient OH saturation that occurs during throttle transitions, challenging the standard practice of ignoring saturated data altogether. This reinterpretation extends spectral measurement to extreme high-radiation conditions and provides a straightforward tool for real-time hot-fire monitoring.
Spectral overexposure corresponds directly to instantaneous heat-release surges during thrust adjustment. The rapid rise in propellant mass flow during throttle-up triggers intense mixing and chemical reaction, sharply raising the OH concentration and pushing the detector into saturation; an equivalent reverse process occurs during throttle-down before shutdown. Saturation appears only within the narrow power-adjustment windows and never during steady firing, so its appearance and disappearance serve as a secondary feature for identifying throttle ramp-up and ramp-down.
The OH surge is a transient intensification of the OH* chemiluminescence itself. The 310–320 nm emission registered here is the electronically excited hydroxyl radical OH* (A2Σ+ → X2Π), which forms independently of ground-state OH during the transients. OH* is populated by specific, highly exothermic chemiluminescent steps, chiefly the termolecular recombination
which is the dominant OH*-formation pathway in hydrogen–oxygen and hydrocarbon flames, with a minor contribution from H + OH + OH → OH* + H2O [18].
H + O + M → OH* + M
The radiative lifetime of OH* is short (about 700 ns to 1 μs) and collisional quenching is severe at rocket-chamber pressures, so the instantaneous emission is set by the local OH* formation rate [18]. Reaching detector saturation requires a sustained energy input into the excited state.
The saturation is driven by fluid dynamics and a transient stoichiometry shift, combined with a collapse of self-absorption. During shutdown in this oxygen-rich staged-combustion engine, the fuel cutoff is followed by continued oxidizer flow from its inertia, so the local mixture briefly becomes highly oxygen-rich. This oxygen-rich regime accelerates the chemiluminescent formation of OH* and pushes the emission toward saturation.
At the same time, the abrupt pressure drop lowers the optical density of the plume and removes the self-absorption that, at steady state, traps a large fraction of the OH* photons along the long line of sight. Self-absorption is strongest in the OH A–X (0,0) band; measurements report 39–43% trapping in laminar flames [19] and up to 75% attenuation at 20 bar [20]. The (1,1) band probed here is less self-absorbed, but the long chord through the full-scale plume keeps the residual trapping significant, so its removal releases a photon flux the detector had not previously received. The accelerated OH* production and the release of this trapped radiation together saturate the spectrometer. The temperature stratification of the plume reinforces this view: above roughly 3000 K thermal excitation dominates the OH* population, and below roughly 2700 K chemical excitation dominates [20], so the cooling transient plume is the regime where the chemiluminescent pathway is most active. During throttle-up the same two effects act in the opposite order, as the oxidizer-led sequencing and the still-low gas density intensify and release the OH* emission before the steady high-pressure, self-absorbing plume is established.
This mechanism also explains the direction-dependent evolution of the saturated span described in Section 3.3. During throttle-up, the oxygen-rich shift and the still-developing gas density maximize the OH* formation rate early in the transient, so the saturated span is widest at that moment. As the flame establishes and the chamber pressure rises, self-absorption rebuilds along the line of sight and the escaping photon flux falls, so the span narrows, giving the broad-to-narrow collapse during load-up. During throttle-down the transient starts from the steady state, where the span is narrow. The fuel cutoff then accelerates OH* production while the pressure drop removes the self-absorption, so the escaping flux grows and the span widens before extinction, giving the narrow-to-broad expansion during load-down. The two transients run through the same excursion of production rate and optical density in opposite directions, so their saturated-span trajectories are mirror images, consistent with the comparable peak spans at ignition and shutdown (about 32 and 31 nm) and with OH* surges of similar magnitude at the two boundaries.
The transient-emission interpretation can be quantified directly from the recorded spectra, without using the saturated pixels, whose truncated values carry no physical information. In every overexposed frame, saturation is confined to the core of the OH band (314.6–335 nm in the ignition frame), while the short-wavelength wing (311–313.5 nm, well below the saturation front) and the extreme long-wavelength edge (≈350 nm) stay within the linear range and record genuine, untruncated intensities. These unsaturated pixels belong to the same OH vibronic band as the saturated core and rise in proportion to it, so they give a conservative lower bound on the true band intensity. The transient emission enhancement is therefore defined from measured quantities alone,
where IOH_wing is the mean intensity of the unsaturated short-wavelength wing (311–313.5 nm), with both numerator and denominator fully in the linear range. The wing interval 311–313.5 nm was chosen because it lies below the saturation front in every overexposed frame, so every pixel used is untruncated, and because it falls within the same OH (1,1) vibronic band as the saturated core, so the wing intensity scales with the band intensity. The interval is wide enough to average out frame-to-frame turbulence fluctuation yet narrow enough to keep a margin from the saturation front. For the four saturating frames this gives 1.68 and 1.26 (ignition frames 4–5) and 1.57 and 1.28 (shutdown frames 1–2); the saturation-front point at 350 nm gives an independent, consistent estimate of 1.78/1.28 (ignition) and 1.75/1.30 (shutdown). The wing lies 2–3 nm from the band center (315.8 nm), where the profile is still rising, so the true peak enhancement is larger than these wing-based values. The main error in this indirect estimate comes from the proportionality assumption between the wing and the band core, which changes by a few percent as the band shape varies from frame to frame. Residual readout noise and dark-current subtraction in the weak wing pixels add a further small error, and the extrapolation from the wing to the band peak is itself uncertain, so the result is reported as a conservative lower bound (1.3–1.8). The ignition and shutdown bounds are statistically indistinguishable, confirming the mirror-inverse symmetry: the OH* surge reaches the same relative strength whether the flame is being established or extinguished. A bound built purely from unsaturated data is therefore consistent with the chemiluminescent mechanism, which confirms that the transient OH surge and its manifestation as overexposure are physical markers of the two combustion boundaries.
Although saturated frames lose the absolute intensity needed for quantitative radical analysis, frame-by-frame synchronization with the pressure signal allows the start and end timestamps of saturation events to be extracted accurately. For routine full-cycle monitoring, no adjustment of acquisition parameters is needed; raw saturated data still support rapid qualitative judgment of the transient stage. For quantitative study of transient kinetics, the optical setup can be modified to widen the linear range, for example, by shortening the exposure or reducing the collection-fiber aperture. This dual-purpose use of saturated signals balances the high-throughput demands of ground test campaigns with the quantitative needs of transient-combustion research.
4.4. Limitations and Prospective for Future Work
This work completes a systematic full-cycle UV spectral measurement of a full-scale LOX/kerosene engine and develops condition-assessment criteria based on spectral features. Several limitations remain to be addressed in future work.
The measurement system covers only a fixed UV window, without simultaneous visible and near-infrared acquisition. Future multi-band systems could add markers for carbon-containing combustion intermediates, improving the ability to detect abnormal phenomena such as incomplete combustion and fuel-rich instabilities.
All tests here were run under nominal fault-free conditions, without induced anomalies such as injector clogging or mixture-ratio drift. The proposed criterion is therefore validated for distinguishing normal operating states (ignition, throttle-up, steady combustion, throttle-down, and shutdown); detecting off-nominal faults remains a further step. Future hot-fire tests with controlled fault injection will verify the robustness of the discrimination rules under off-nominal states and extend the framework toward full fault diagnosis.
All measurements were conducted at the design nominal mixture ratio, so how the mixture ratio modulates the OH-band and metal-line markers remains open and will be investigated through dedicated variable-mixture-ratio hot-fire tests. A drift in mixture ratio would affect marker identification as follows. The OH band is the most exposed. A fuel-lean (higher O/F) shift raises the flame temperature and the OH* population, so the OH-band intensity rises and, near the already-high steady-state ceiling, could begin to encroach on saturation, weakening the contrast between the steady and transient states that the overexposure criterion relies on. A fuel-rich shift lowers OH* and could depress the OH band toward the noise floor, reducing its value as a steady-state intensity marker. The metal-line markers are less sensitive in intensity and remain robust in discrimination, because the Ca and Al trace populations are set by the igniter and the hardware environment, so their lines persist. A strong fuel-rich drift that produces sooty, incomplete combustion would, however, raise a broadband continuum that could mask the weak Ca I line at the shutdown boundary and weaken the single-channel separation of ignition from shutdown.
The fiber probe is fixed at the nozzle exit and captures only line-of-sight integrated signals, so it gives no spatial resolution across the plume. Multi-point fiber arrays or high-speed spectral imaging could decouple the spatial non-uniformity in the turbulent exhaust and improve the inversion of radical concentration distributions.
For engineering deployment, the lens-free bare-fiber OES system validated here can be miniaturized and integrated into onboard measurement units of reusable launch vehicles. The lightweight single-channel discrimination logic imposes minimal computational cost and can run on embedded edge-computing chips, providing a non-intrusive real-time health-monitoring solution for in-flight operation and recovery.
4.5. Reproducibility and Robustness of the Spectral Criterion
A central concern for any full-scale monitoring approach is whether the reported spectral signatures are reproducible or merely incidental to a single test. Because full-scale LOX/kerosene hot-fire tests are constrained by the cost and scheduling of the test stand, the number of independent campaigns is inherently limited. We therefore establish reproducibility on several complementary levels.
First, within-run repeatability from time-resolved acquisition: Each test consisted of continuous time-resolved acquisition rather than a single snapshot. After transmission calibration and asymmetric least-squares (ALS) baseline correction, the 100% test (180 s, 384 frames) yielded 358 steady-state frames, and the 80% test (10 s) yielded 19 of 24. Across these frames the baseline-corrected OH-band integrated intensity remained highly stable, with coefficients of variation (CVs) of 2.25% (100% test) and 5.1% (80% test). This within-run consistency demonstrates that the measurement and the combustion state it resolves is stable over hundreds of independent acquisitions.
Second, spectral-signature consistency across operating conditions: The same OH feature was recovered in both tests despite the different thrust levels: the baseline-corrected OH peak position remained at the 315.8 nm feature under both 80% and 100% load, and the area-normalized, baseline-corrected OH spectral shape matched with r = 0.9998. This robustness to a change in operating condition rules out the possibility that the signature is an artifact of a single setting.
Third, consistency with established practice in full-scale monitoring: Relying on within-run, frame-to-frame consistency is consistent with the established literature on full-scale plume spectroscopy, notably the SSME health-monitoring program [6], where the monitoring validity of time-resolved plume emission was likewise established from continuous, high-rate acquisitions of a limited number of firings.
Two interference sources are worth considering. The first is test-stand stray light. The bare-fiber probe accepts emission from its entire field of view, so reflections from the stand structure, facility illumination, or adjacent surfaces could in principle contaminate the plume signal. Two measures limit this. The static ambient spectrum, acquired with the flame off but the stand illuminated, was subtracted frame-by-frame (Section 2.3). In addition, the narrow, instrument-limited linewidth of the Ca I and Al I lines (0.15–0.25 nm FWHM) is inconsistent with any broadband stray-light or reflection source, which would appear as a smooth, featureless background rather than narrow atomic lines. The second source is spatial turbulence fluctuation in the exhaust plume, which modulates the local emission along the line of sight from frame to frame. Its effect on the markers is limited by construction. The OH band is quantified by area integration over 314–317 nm, which averages out the spatially uncorrelated turbulence, and the boundary markers are identified by the presence or absence of narrow atomic lines, so the extraction depends on line shape rather than absolute intensity. Together these two sources add a small common-mode variance across frames, without biasing the extracted peak positions or the presence/absence criterion.
We therefore consider the OH-band steady-state criterion and the Ca/Al boundary markers to be reproducible within the practical constraints of full-scale testing, supported by within-run frame-to-frame stability, cross-condition invariance, and consistency with prior full-scale spectral monitoring.
5. Conclusions
(1) Stable full-cycle UV OES covering ignition, steady combustion, and shutdown was completed for a hundred-tonne-class full-scale LOX/kerosene engine, verifying the engineering applicability of the lens-free bare-fiber OES scheme in extreme test environments with strong vibration and interference. The scheme requires no modification to the engine or complex optical alignment, and can be extended directly to optical monitoring of ground hot-fire tests of other high-thrust liquid rocket engines.
(2) A validated set of spectral markers for the normal operating states of a full-scale LOX/kerosene engine was established. A mirror-inverse spectral evolution between ignition and shutdown was observed, and a full-cycle state-discrimination criterion was developed from the temporal correlation between the Ca/Al metal peaks and OH overexposure. The criterion distinguishes ignition, throttle-up, steady combustion, throttle-down, and shutdown with no complex quantitative calculation or multi-sensor fusion, using only single-channel spectral signals, and supports real-time monitoring and rapid state identification during hot-fire tests.
(3) The physical origin and monitoring value of spectral overexposure during throttle transients were clarified, extending the use of OES data under high-radiation conditions. The proposed method provides a practical supplement for health monitoring of reusable LOX/kerosene engines and can be further extended to non-intrusive onboard monitoring in flight, offering a new approach for state monitoring during the recovery phase of reusable rockets.
Author Contributions
. Conceptualization: Y.O.; Methodology: Y.O., A.S., and F.W.; Software: Y.O. and Zhuofan.Xiang.; Validation: Y.O., A.S. and F.W.; Formal Analysis: Y.O. and X.X.; Investigation: Y.O., X.X. and Z.X.; Resources: Y.O., X.X. and Z.X.; Data Curation: Y.O. and Z.X.; Writing—Original Draft: Y.O.; Writing—Review & Editing: Y.O.; Visualization: Y.O. and A.S.; Supervision: Y.O. and A.S.; Project Administration: Y.O., A.S. and F.W.; Funding Acquisition: Y.O., A.S. and F.W. All authors have read and agreed to the published version of the manuscript.
Funding
This research received no external funding.
Data Availability Statement
Data is unavailable due to privacy or ethical restrictions.
Conflicts of Interest
The authors declare no conflict of interest.
References
- Balance, H.C.; Bibik, O.; Cook, T.S.; Danczyk, S.; Schumaker, S.A.; Yang, V.; Lieuwen, T.C. Optical diagnostics in a high-pressure combustor with gaseous oxygen and kerosene. J. Propuls. Power 2019, 35, 717–730. [Google Scholar] [CrossRef] [Scilit]
- Bedard, M.J.; Fuller, T.L.; Sardeshmukh, S.; Anderson, W.E. Chemiluminescence as a diagnostic in studying combustion instability in a practical combustor. Combust. Flame 2020, 213, 211–225. [Google Scholar] [CrossRef] [Scilit]
- Guethe, F.; Guyot, D.; Singla, G.; Noiray, N.; Schuermans, B. Chemiluminescence as diagnostic tool in the development of gas turbines. Appl. Phys. B 2012, 107, 619–636. [Google Scholar] [CrossRef] [Scilit]
- Lee, A.S. Assessment of rotating detonation rocket engine pressure measurement methods. In Proceedings of the AIAA SciTech 2026 Forum; AIAA 2026-114331; American Institute of Aeronautics and Astronautics: Reston, VA, USA, 2026. [Google Scholar]
- Yan, S.; Li, Y.; Qin, H.Q.; Cui, X.; Gao, Y. Exhaust plume spectroscopic diagnostics of liquid rocket engine faults: From qualitative to quantitative, a review. Acta Aeronaut. Astronaut. Sin. 2026, 47, 133069. (In Chinese) [Google Scholar]
- Tejwani, G.D.; Bircher, F.E.; Van Dyke, D.B.; Thurman, C.C. Space Shuttle Main Engine health monitoring with exhaust plume emission spectroscopy. J. Spacecr. Rockets 1998, 35, 387–394. [Google Scholar] [CrossRef] [Scilit] [PubMed]
- Mahler, L.; Börner, L.; Jaeger, M. A process monitoring microreactor assembly for real-time reaction analysis using inline near-infrared spectroscopy and chemometrics. J. Flow Chem. 2025, 15, 1431–1440. [Google Scholar] [CrossRef] [Scilit] [PubMed]
- Kojima, J.; Ikeda, Y.; Nakajima, T. Basic aspects of OH(A), CH(A), and C2(d) chemiluminescence in the reaction zone of laminar methane–air premixed flames. Combust. Flame 2005, 140, 34–45. [Google Scholar] [CrossRef] [Scilit]
- Toscano, A.M.; Lato, M.R.; Fontanarosa, D.; De Giorgi, M.G. Optical diagnostics for solid rocket plumes characterization: A review. Energies 2022, 15, 1470. [Google Scholar] [CrossRef] [Scilit]
- He, L.; Guo, Q.; Gong, Y.; Wang, F.; Yu, G. Investigation of OH chemiluminescence and heat release in laminar methane–oxygen co-flow diffusion flames. Combust. Flame 2019, 201, 12–22. [Google Scholar] [CrossRef] [Scilit]
- Martin, J.; Armbruster, W.; Suslov, D.; Stützer, R.; Hardi, J.S.; Oschwald, M. Flame characteristics and response of a high-pressure LOX/CNG rocket combustor with large optical access. Aerospace 2022, 9, 410. [Google Scholar] [CrossRef] [Scilit]
- Su, Q.; Wang, J.; Yan, M.; Sun, Z.; Zha, B.; Huang, W. Dynamic characteristics of LOX/kerosene variable thrust liquid rocket engine test system based on general modular simulation method. Int. J. Aerosp. Eng. 2022, 2022, 2171471. [Google Scholar] [CrossRef] [Scilit]
- Wang, G.; Li, B.; Tan, Y.; Gao, Y. High-frequency combustion instability in liquid rocket engines: A review. Acta Aeronaut. Astronaut. Sin. 2024, 45, 529450. (In Chinese) [Google Scholar]
- Shin, S.; Kim, H.; Cho, S. Prediction of equivalence ratio in combustion flame using chemiluminescence emission and deep neural network. Int. J. Energy Res. 2023, 2023, 3889951. [Google Scholar] [CrossRef] [Scilit]
- Boué, Y.; Vinet, P.; Magniant, S.; Motomura, T.; Blasi, R.; Dutheil, J.-P. LOX/methane reusable rocket propulsion at reach with large scale demonstrators tested. Acta Astronaut. 2018, 152, 542–556. [Google Scholar] [CrossRef] [Scilit]
- Schmidt, V.; Sender, J.; Oschwald, M. Simultaneous observation of liquid phase distribution and flame front evolution during the ignition transient of a LOX/GH2-combustor. J. Vis. 2001, 4, 365–372. [Google Scholar] [CrossRef] [Scilit]
- Fei, L.; Zhang, F.; Tang, C.; Xu, T.; Yang, A.; Yang, B.; Huang, Z. An experimental investigation on MMH/NTO impinging jets flame characteristics at high chamber pressure. Proc. Combust. Inst. 2024, 40, 105709. [Google Scholar] [CrossRef] [Scilit]
- Kathrotia, T.; Fikri, M.; Bozkurt, M.; Hartmann, M.; Riedel, U.; Schulz, C. Study of the H + O + M reaction forming OH*: Kinetics of OH* chemiluminescence in hydrogen combustion systems. Combust. Flame 2010, 157, 1261–1273. [Google Scholar] [CrossRef] [Scilit]
- Sadanandan, R.; Meier, W.; Heinze, J. Experimental study of signal trapping of OH laser induced fluorescence and chemiluminescence in flames. Appl. Phys. B 2012, 106, 717–724. [Google Scholar] [CrossRef] [Scilit]
- Fiala, T.; Sattelmayer, T.; Gröning, S.; Hardi, J.; Stützer, R.; Webster, S.; Oschwald, M. Comparison between excited hydroxyl radical and blue radiation from hydrogen rocket combustion. J. Propuls. Power 2017, 33, 279–294. [Google Scholar] [CrossRef] [Scilit]
- Ren, Y.; Xu, B.; Chu, W.; Guo, K.; Tong, Y.; Nie, W. Effects of oxygen-fuel ratio on combustion stability of a model rocket engine with hypergolic propellant. J. Beijing Univ. Aeronaut. Astronaut. 2025, 51, 3030–3038. (In Chinese) [Google Scholar]
- Luo, J.; Qu, D.; Lin, X.; Wang, Z.; Zhang, K.; Li, F.; Chen, X.; Meng, D.; Liu, G.; Yu, X. Flame dynamics in the combustion chamber of hybrid rocket using multiangle chemiluminescence. J. Propuls. Power 2023, 39, 848–862. [Google Scholar] [CrossRef] [Scilit]
- Whitmore, S.A.; Frischkorn, C.I.; Petersen, S.J. In-situ optical measurements of solid and hybrid-propellant combustion plumes. Aerospace 2022, 9, 57. [Google Scholar] [CrossRef] [Scilit]
- Whitmore, S.A.; Borealis, C.I.; Francom, M.W. Minimally-intrusive, dual-band, fiber-optic sensing system for high-enthalpy exhaust plumes. Electron. Res. Arch. 2024, 32, 2541–2597. [Google Scholar] [CrossRef] [Scilit]
- Tan, S.; Yan, S.; Li, X.; Su, T.; Lei, Q.; Fan, W. Spectroscopic quantification of metallic element concentrations in liquid-propellant rocket exhaust plumes. Aerospace 2025, 12, 427. [Google Scholar] [CrossRef] [Scilit]
- Dai, W.; Shi, Y.; Ma, J.; Bu, M.; Wang, L.; Xie, Q.; Wen, H.; Wang, B. A high-performance ultraviolet optical sensing system for rotating detonation extreme combustion. Sensors 2026, 26, 3248. [Google Scholar] [CrossRef] [Scilit] [PubMed]

Disclaimer/Publisher’s Note: The statements, opinions and data contained in all publications are solely those of the individual author(s) and contributor(s) and not of MDPI and/or the editor(s). MDPI and/or the editor(s) disclaim responsibility for any injury to people or property resulting from any ideas, methods, instructions or products referred to in the content. |
© 2026 by the authors. Licensee MDPI, Basel, Switzerland. This article is an open access article distributed under the terms and conditions of the Creative Commons Attribution (CC BY) license.