


Abstract
Thermal coupling deformation is a critical challenge for high-precision, high-thermal-stability carbon fiber honeycomb core reflectors. This study proposes a comprehensive design method for such reflectors based on thermal coupling deformation. Three typical honeycomb core cell configurations are first compared to select an appropriate basic cell. The equivalent mechanical properties of the selected honeycomb core are then evaluated to establish the relationship between structural parameters and reflector thermal coupling deformation. An Ant Lion Optimizer (ALO) is subsequently used to optimize the honeycomb core height, cell edge length, number of skin plies, and ply angles while accounting for practical engineering constraints, including curing pressure and dead-weight deformation. The influence of manufacturing-induced ply angle deviations is further investigated, and a recommended process tolerance is identified. Finally, the optimized 2 m class reflector is evaluated through full-scale numerical simulation and thermal deformation testing. The predicted thermal deformation remains below 8 μm RMS at −120 °C. The measured RMS thermal deformations under uniform temperature fields at +120 °C and −120 °C were 6.8 and 7.2 μm, respectively. The differences between the estimated combined values and the experimental measurements are discussed in relation to the numerical predictions, testing system deviation, dead-weight deformation, and variability associated with ply angle deviations. Possible reasons for these differences are discussed to inform future work.
1. Introduction
Reflectors with ultrahigh surface accuracy and ultralow thermal deformation are required for modern terahertz antennas [1]. For next-generation spaceborne antennas operating at millimeter or submillimeter wavelengths, the root-mean-square (RMS) thermal deformation of the reflector is required to be less than 10 μm. Under such stringent requirements, conventional sandwich structures composed of carbon fiber skins and aluminum honeycomb cores may no longer provide sufficient thermal dimensional stability [2,3]. Carbon-fiber-reinforced composites, however, exhibit favorable thermomechanical properties and low coefficients of thermal expansion in space environments [4]. Owing to their thermal stability and compatibility with carbon fiber antenna structures, carbon fiber honeycomb cores are widely used in the design and manufacture of spaceborne antenna reflectors.
Considerable research has been conducted on the structural configurations and mechanical performance of honeycomb cores, particularly carbon fiber variants [5,6,7] and optimization-oriented honeycomb designs [8]. The thermal characteristics of lightweight metal mesh-based reflector antennas under different knitting conditions have also been investigated [9]. A common approach is to introduce probability and statistics, generate random samples based on a normal distribution, and perform the analysis and calculation of reflector thermal coupling deformation using finite element methods [10,11,12,13,14,15,16]. Rigid–flexible–thermal coupling frameworks have also been extended to other spacecraft composite components under space thermal environments [17], such as composite-laminated solar arrays [18], and multi-physics optimization has been applied to antenna structures [19]. However, existing finite element approaches often isolate thermal analysis from practical manufacturing boundary conditions. Research on systematically integrating the thermal coupling between the reflector’s honeycomb core and skins with actual engineering constraints, such as curing pressure and gravity-induced deformation, remains limited.
In this study, several typical carbon fiber honeycomb cell configurations are first compared through thermal coupling analysis to select an appropriate basic cell. The equivalent mechanical properties of the selected honeycomb core are then evaluated to provide a basis for the subsequent structural analysis. Considering practical engineering constraints, including curing pressure, dead-weight deformation, and areal density, the structural parameters of the honeycomb core and composite skins are jointly optimized using the Ant Lion Optimizer (ALO). The influence of manufacturing-induced ply angle deviations is further investigated. Finally, the optimized reflector is evaluated through full-scale numerical simulation and thermal deformation testing. The proposed approach provides a systematic design procedure for high-precision, high-thermal-stability carbon fiber honeycomb core reflectors.
2. Thermal Coupling Analysis of Carbon Fiber Honeycomb Cells
2.1. Cell Types
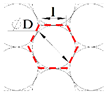
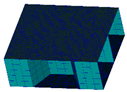
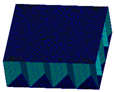
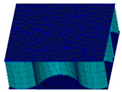
Typical honeycomb core cells include hexagonal cells (HCs), triangular cells (TCs), and circular cells (CCs). The corresponding sandwich configurations are shown in Table 1. An equal wall thickness assumption was adopted for each cell type.
Table 1.
Typical honeycomb core cells and corresponding sandwich structures.
The sandwich structures were discretized using shell elements. During the cell-level analysis, the center point of the upper skin was constrained in all six degrees of freedom. The upper and lower skins were made of M55J/Cyanate. The upper-skin layup was [0°/45°/−45°/90°], and the lower skin was symmetric to it. The carbon fiber honeycomb core was made of T300/Epoxy with a [0°/90°]s layup. The upper and lower skins were bonded to the honeycomb core using an adhesive film.
2.2. Thermal Coupling Analysis of Honeycomb Cells
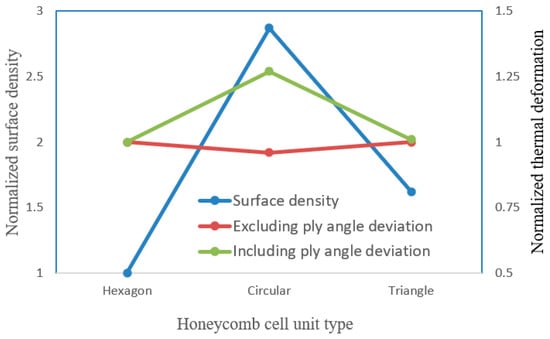
Material properties are shown in Table 2. The thermal coupling deformation of sandwich structures with different cells was calculated according to Equation (1), and the results are shown in Figure 1. The TC sandwich structure had the largest areal density, at 2.87 times that of the HC sandwich structure, and was sensitive to the thermal coupling deformation caused by the ply angle deviation. The thermal coupling deformation of the TC sandwich structure was 1.27 times that of the HC sandwich structure. The thermal stability of the HC and CC sandwich structures was similar, and they were insensitive to thermal coupling deformation caused by ply angle deviation. The HC had a smaller areal density, while the areal density of the CC sandwich structure was 1.62 times that of the HC sandwich structure. Therefore, the HC was selected as the basic cell of the carbon fiber honeycomb core.
where ε denotes the RMS thermal coupling deformation of the sandwich structure; pp is the total number of points used in the calculation; (xi, yi, zi) are the coordinates of point (i) before thermal deformation; and (, , ) are the corresponding coordinates of the same point after thermal deformation.
Table 2.
Material properties.
Figure 1.
Comparison of simulation results for different honeycomb core cells.
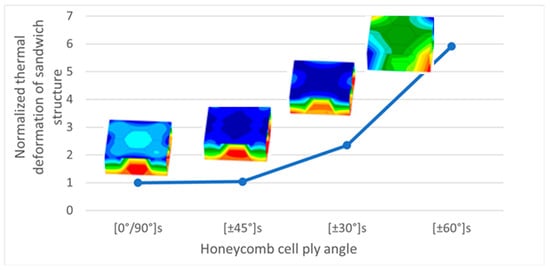
Figure 2 shows the thermal coupling deformation of the HC honeycomb core for different layups. The quasi-isotropic [0°/90°]s layup provides better thermal deformation compatibility with the upper and lower skins and therefore yields improved thermal coupling performance.
Figure 2.
Influence of the HC honeycomb core layers on the thermal coupling of sandwich structure.
3. Mechanical Property Equivalence Analysis of Carbon Fiber Honeycomb Core
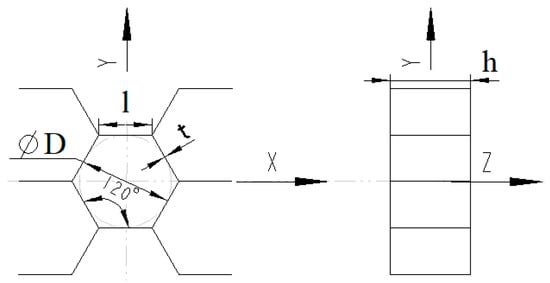
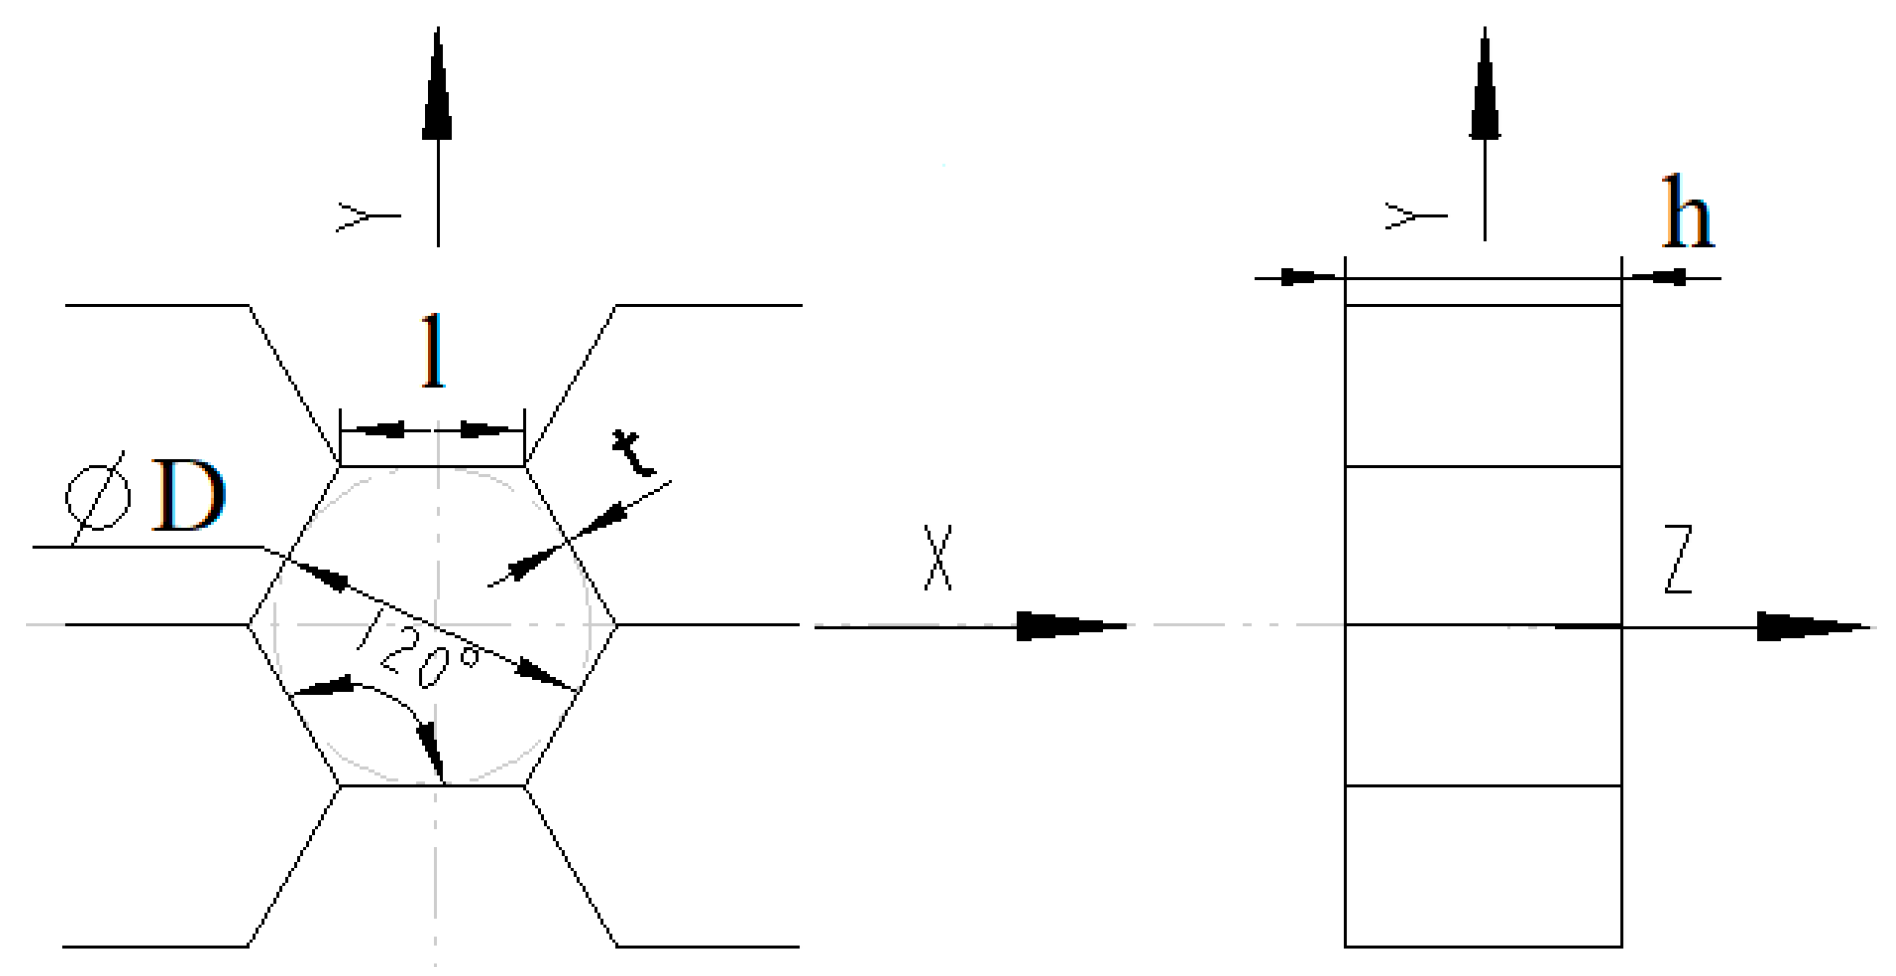
The mechanical properties of the honeycomb core are critical to the overall performance of its host structures and thus require accurate evaluation prior to structural analysis and design [20]. The dimensions of the HC honeycomb core are shown in Figure 3, and the mechanical property parameters of the equal-wall-thickness honeycomb core can be calculated using Equations (2)–(7) [21].
where E0 is the elastic modulus of the HC material; G0 is its shear modulus; t is the HC wall thickness; l is the HC edge length; and h is the HC height.
Figure 3.
Geometry of the HC honeycomb core.
Structural optimization is widely used in the design of laminated composites because their performance can be tailored through parameters such as ply angle and layer thickness [22]. For the quasi-isotropic composite laminate considered here, the equivalent mechanical properties are calculated using Equations (8)–(11) [23].
where E1 and E2 are the longitudinal and transverse elastic moduli of the unidirectional prepreg, respectively; G12 is the in-plane shear modulus; υ12 and υ21 are the in-plane Poisson’s ratios; α1 and α2 are the longitudinal and transverse coefficients of thermal expansion; and υ0 is the Poisson’s ratio of the HC material.
4. Thermal Deformation Analysis and Optimization of the Reflector
4.1. Boundary Constraints
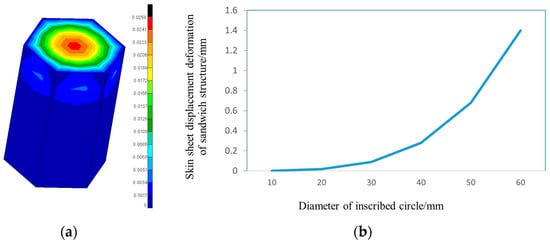
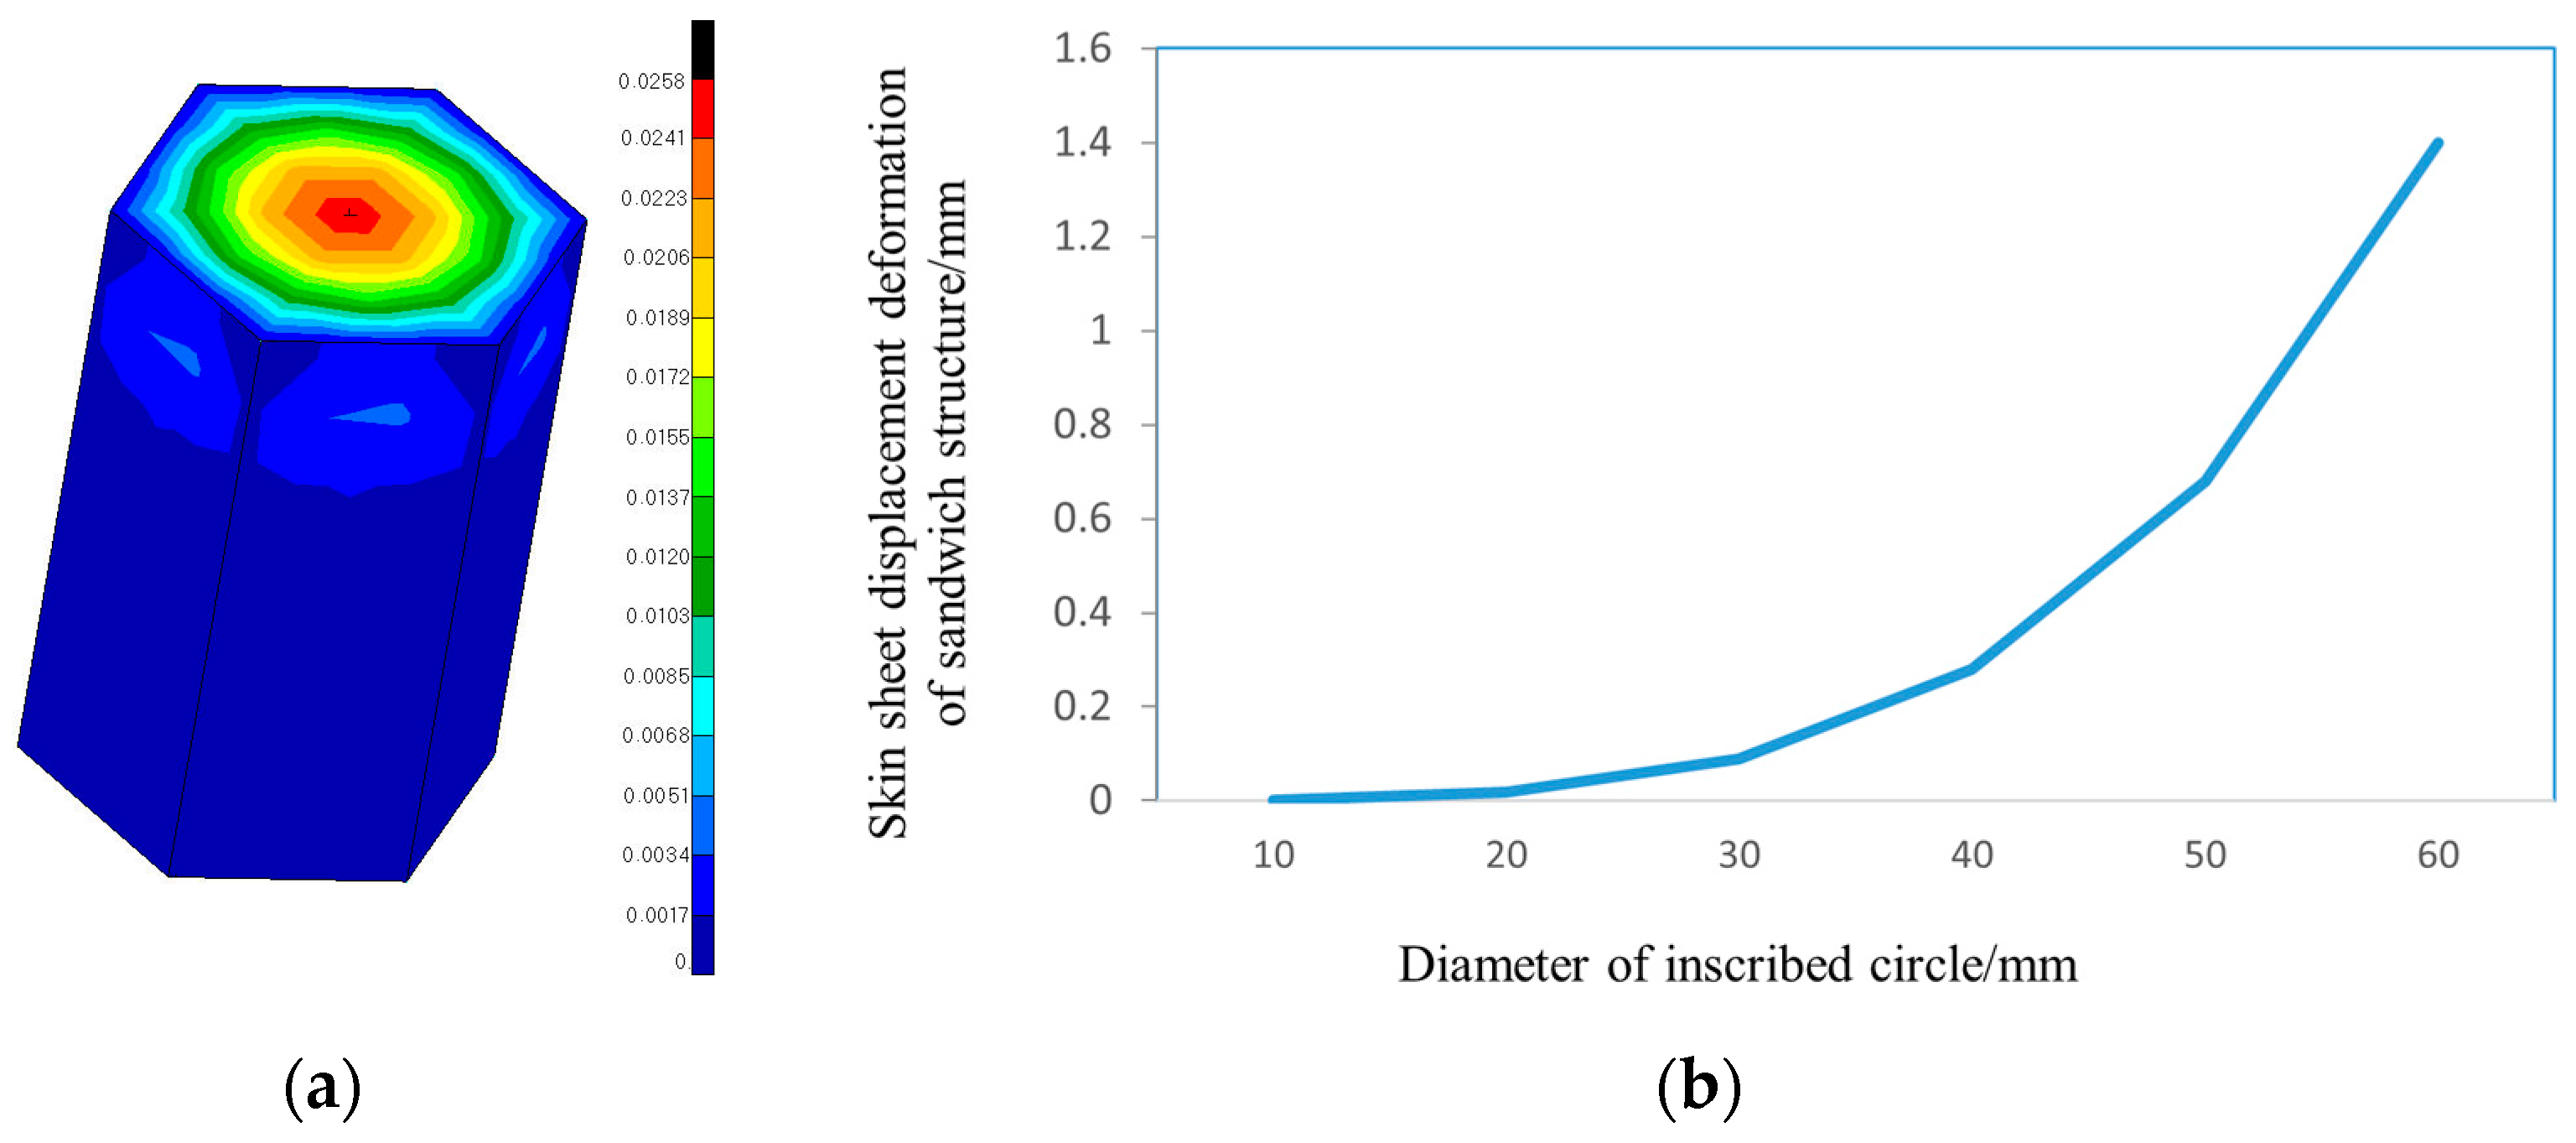
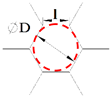
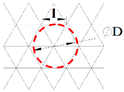
The honeycomb sandwich structure was obtained through secondary curing, with the upper and lower skins bonded to the honeycomb core via an adhesive film. To prevent print-through caused by an excessively large honeycomb cell size during the curing process, the HC honeycomb cell size had to be restricted. Therefore, an HC honeycomb cell analysis model was meshed using shell elements, a uniformly distributed pressure of 0.15 MPa was applied to the upper skin of the cell, and the six lower edges of the cell were constrained. Figure 4 shows the deformation of the HC honeycomb core under a curing pressure of 0.15 MPa. The simulation results indicate that the diameter of the inscribed circle of the HC should not exceed approximately 35 mm, corresponding to a cell edge length of 20 mm. The cell edge length should also be no less than 5 mm due to manufacturing and practical engineering constraints.
Figure 4.
Deformation analysis of the HC honeycomb core under curing pressure. (a) HC analysis model. (b) Analysis results.
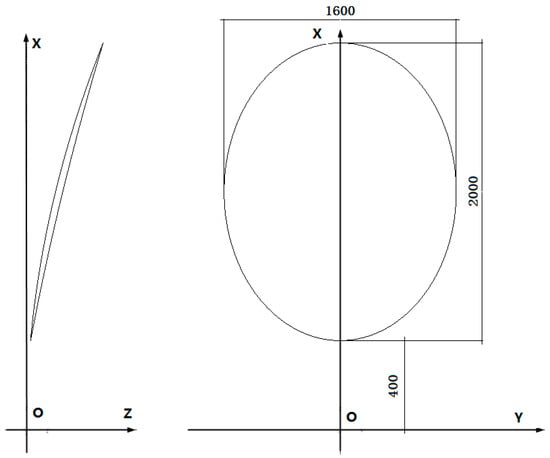
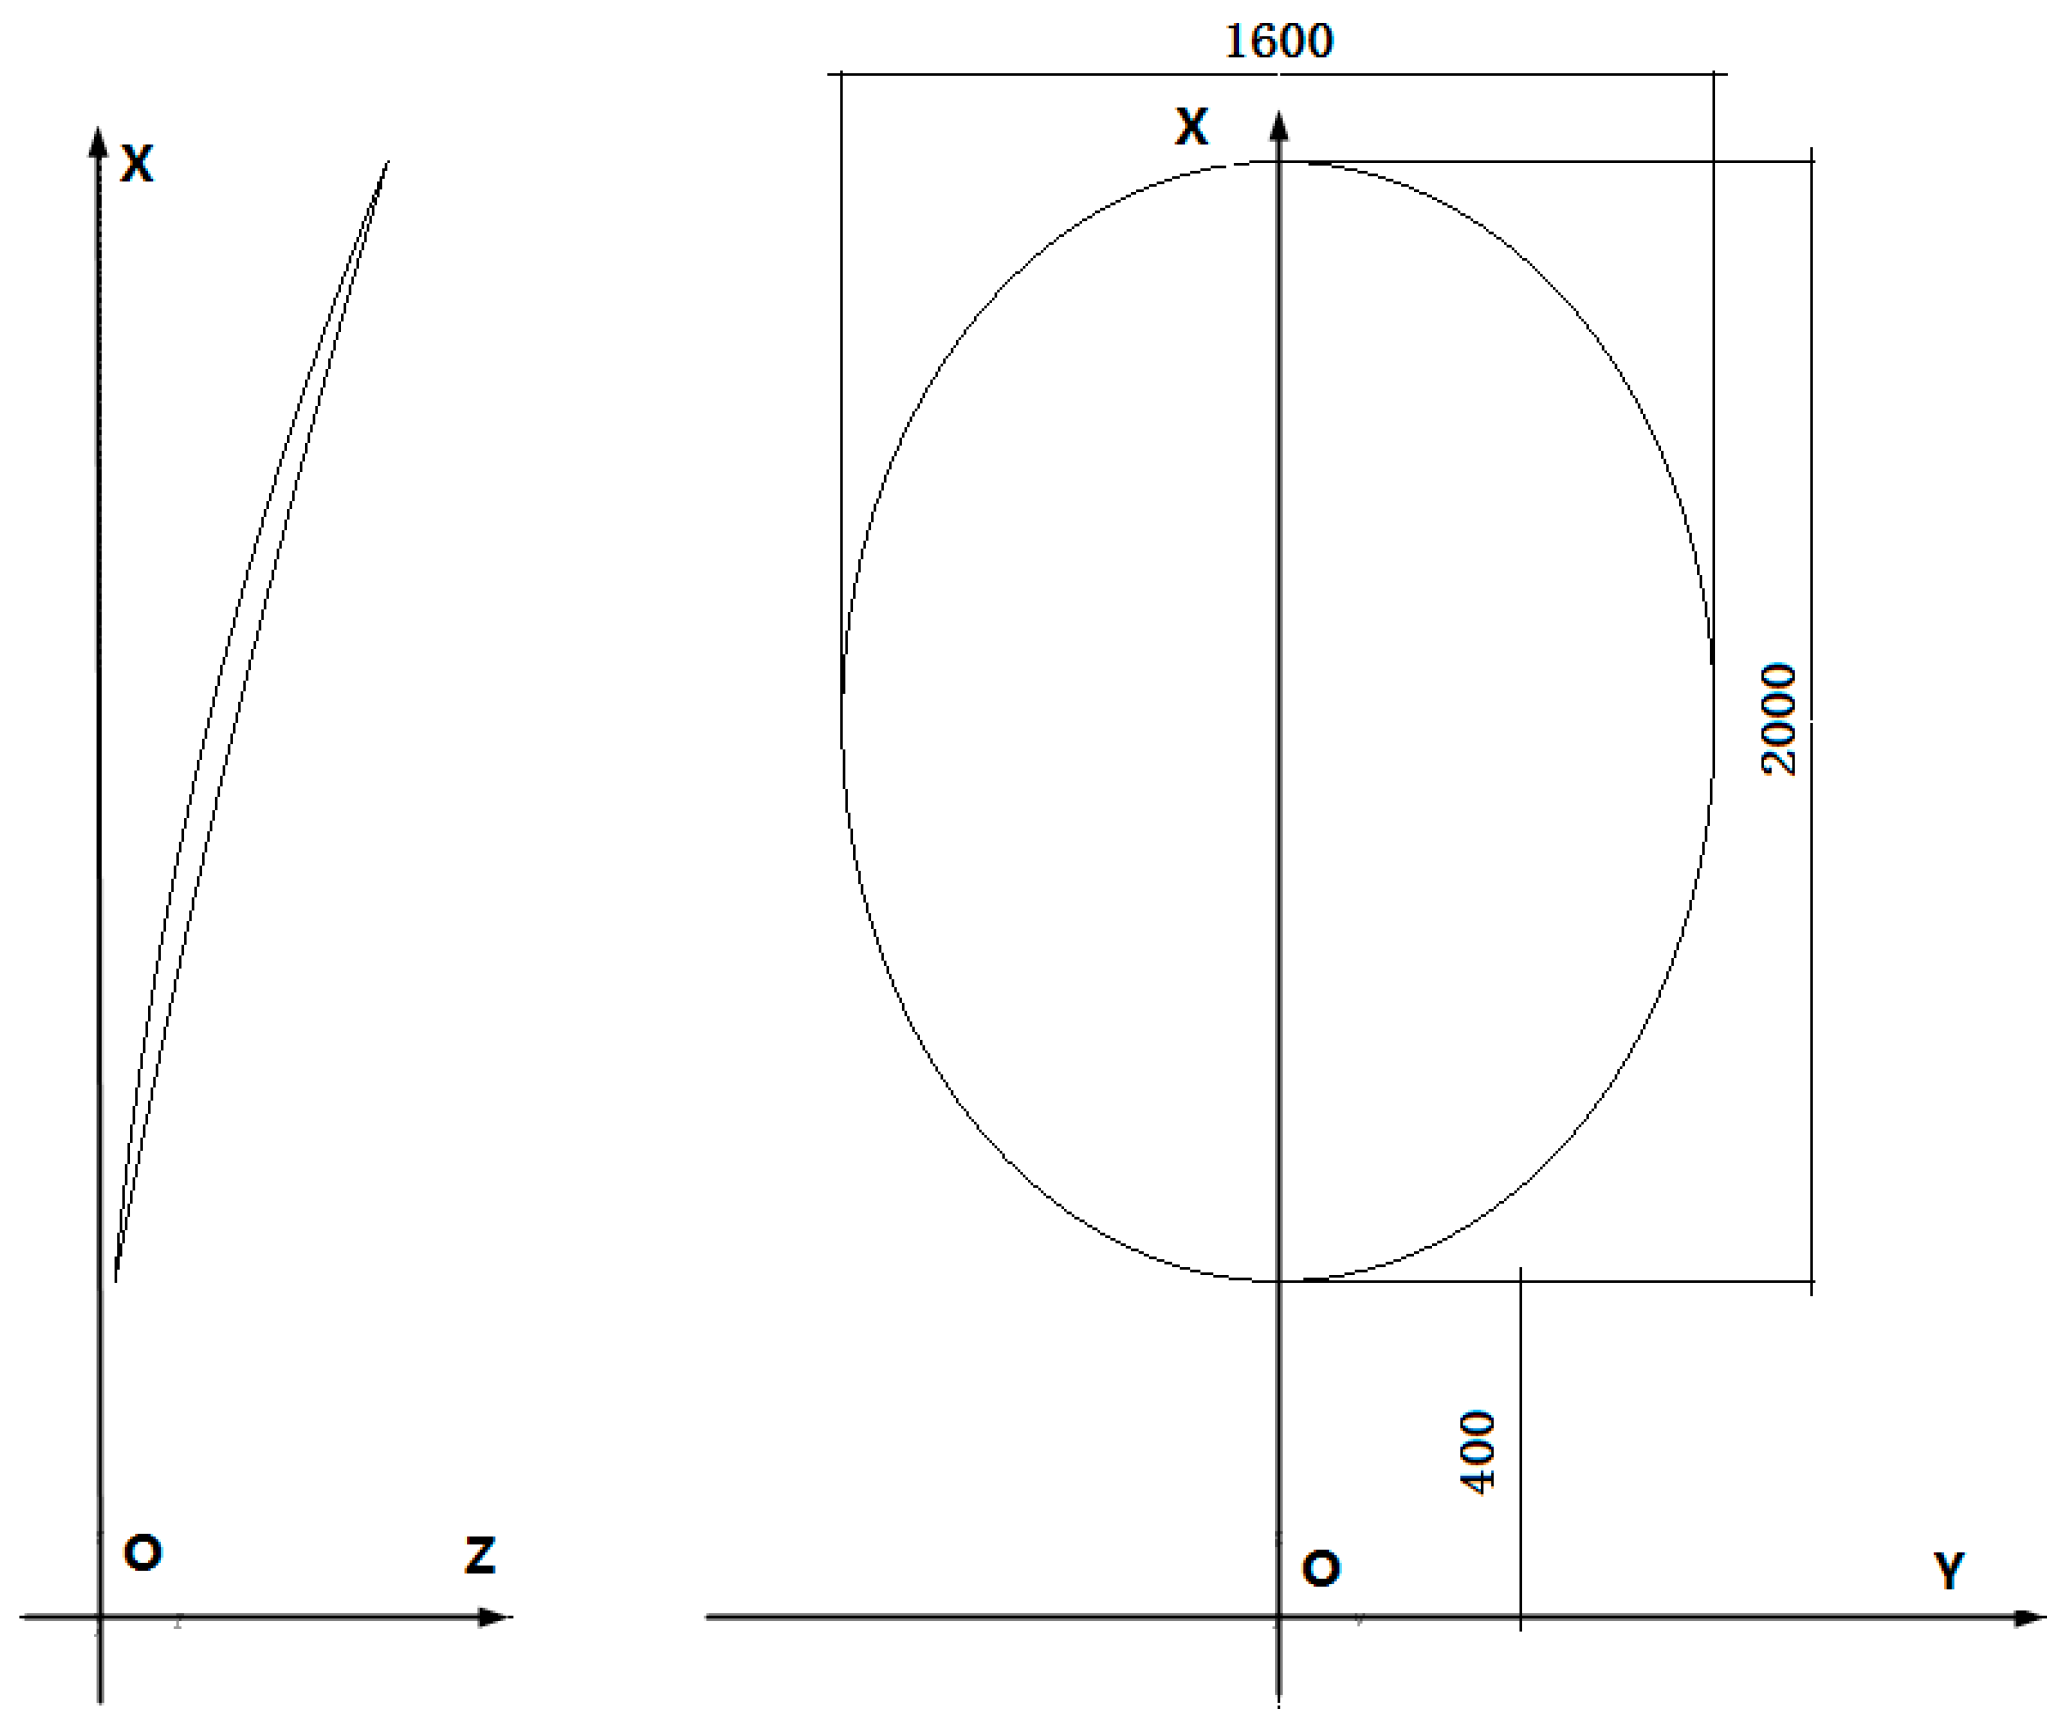
The geometric dimensions of the reflector are shown in Figure 5. Because dead-weight deformation can affect surface accuracy measurements, the honeycomb core height must be constrained to avoid excessive gravity-induced deformation during measurement.
Figure 5.
Geometric dimensions of the reflector (focal length F = 3000 mm).
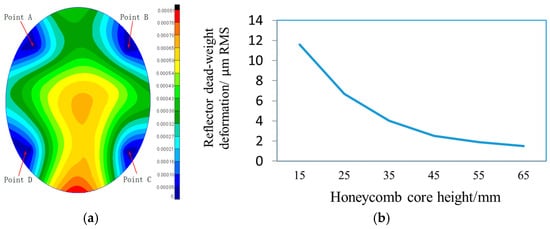
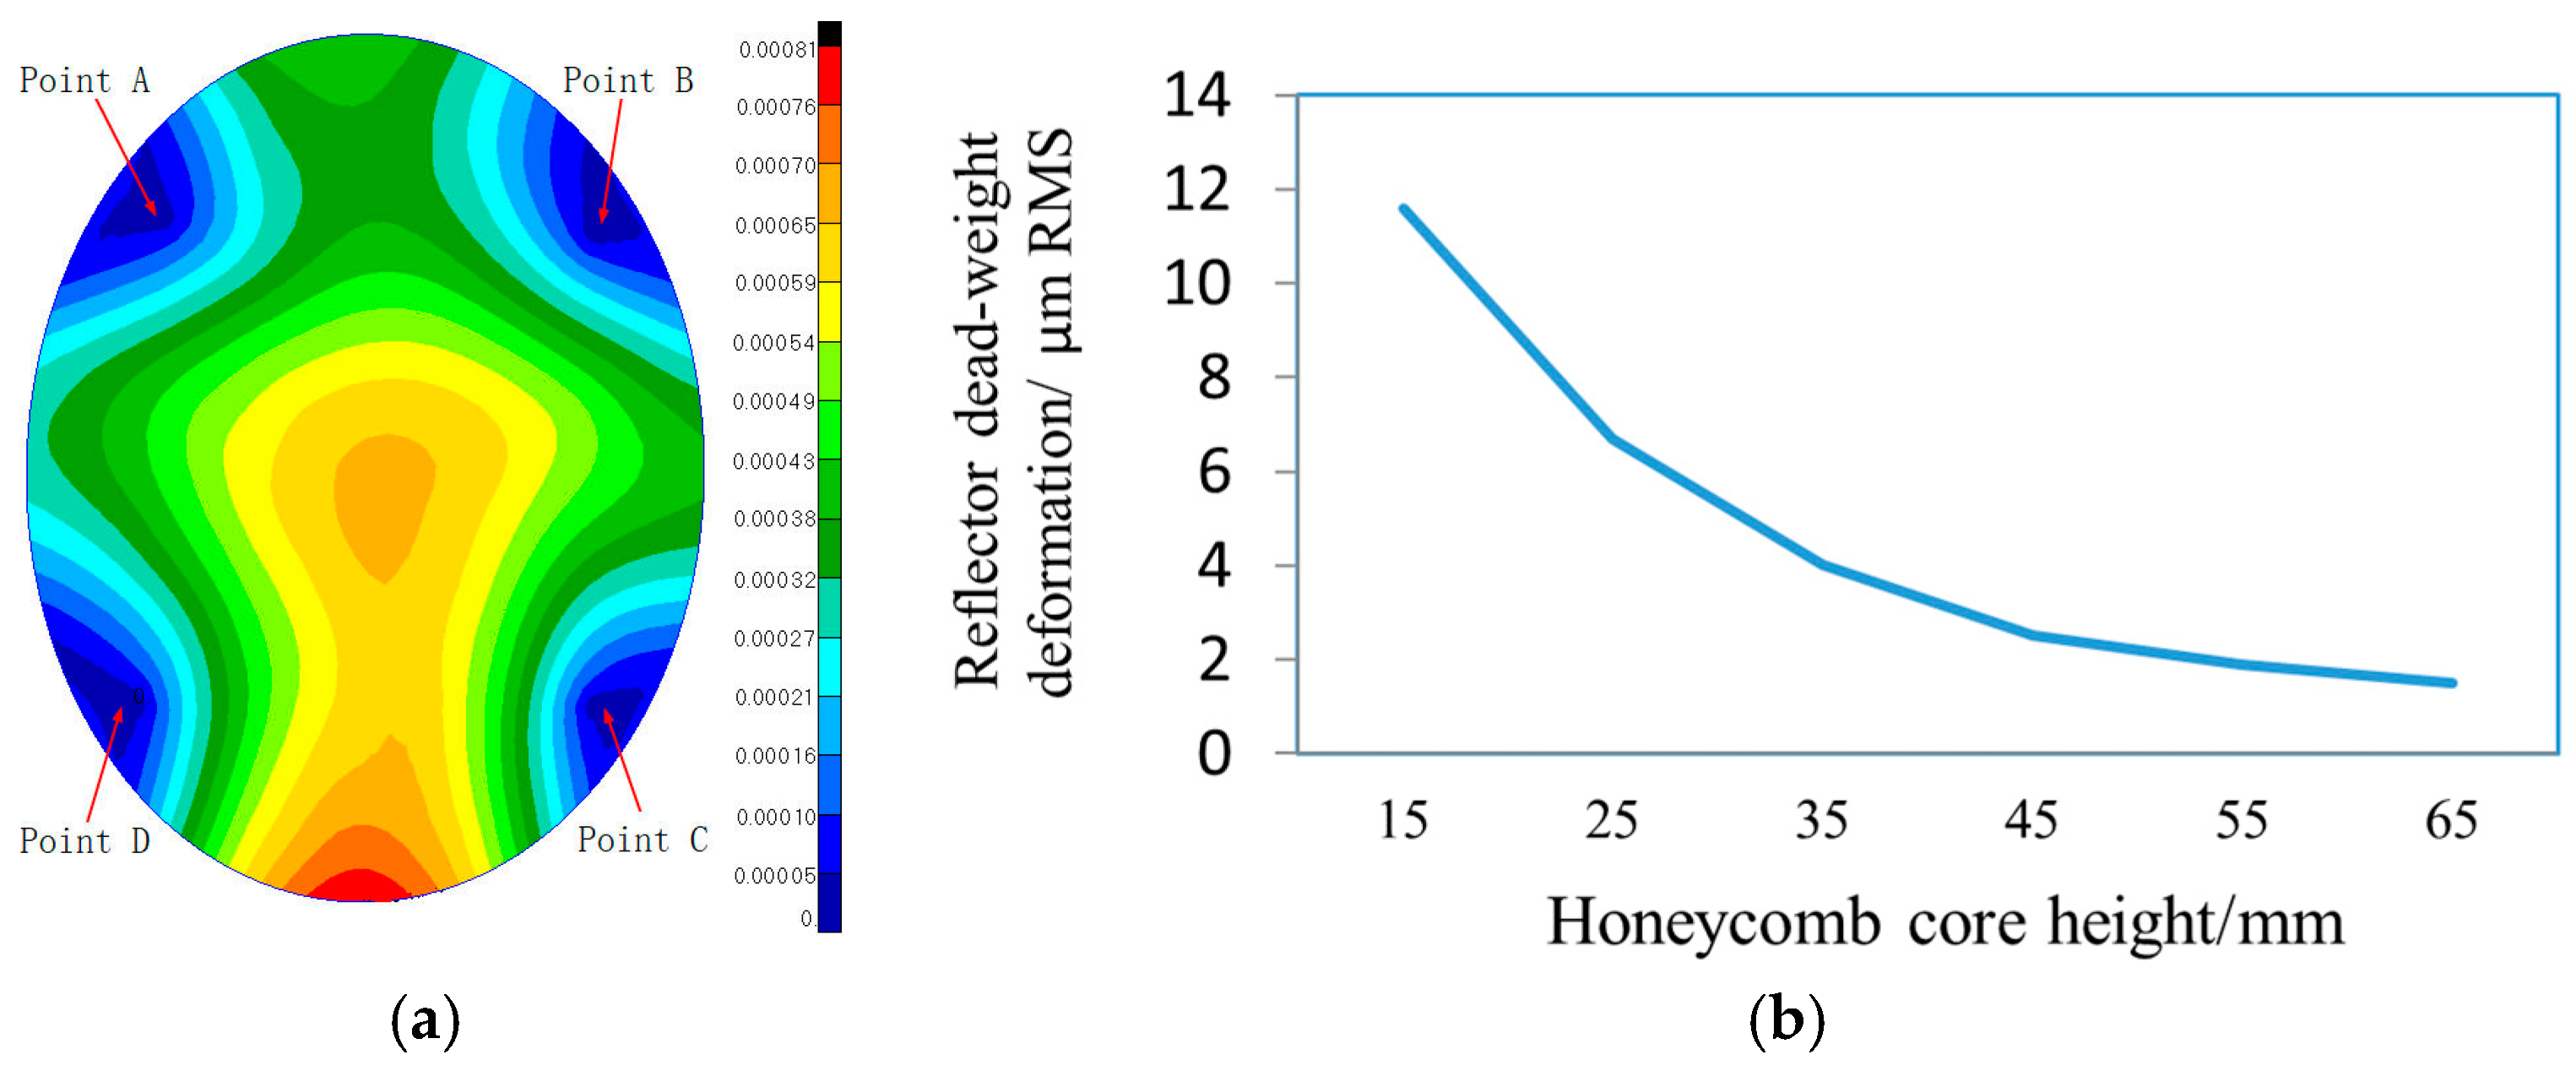
Figure 6 shows the relationship between reflector dead-weight deformation and honeycomb core height. The analysis model was discretized using shell elements, and all six degrees of freedom were constrained at four support points. The simulation results show that when the honeycomb core height was at least 45 mm, the dead-weight deformation satisfied the surface accuracy measurement requirement. The corresponding reflector dead-weight deformation was 2.1 μm RMS.
Figure 6.
Influence of HC honeycomb core height on reflector dead-weight deformation. (a) Constraint point distribution. (b) Analysis results.
According to Figure 5, let the reflector surface area be S (here, S = 2.6 m2). The mass of the upper and lower skins, Msheet, is then calculated as follows:
where Vsheet is the total volume of the upper and lower skins; ρsheet is the density of the skin material; and tsheet is the total thickness of the upper and lower skins.
Msheet = Vsheet∙ρsheet = S∙tsheet∙ρsheet
Table 3 gives the relationship between honeycomb core height and volume, from which the fitted relationship in Equation (13) is obtained. The equivalent density follows Equation (14) [21], and the honeycomb core mass is then obtained from Equation (15).
where ρcore is the density of the honeycomb core material; ρ* is the equivalent density of the HC honeycomb core; t is the wall thickness of the honeycomb core cell; l is the edge length of the honeycomb core cell; h is the core height; and Vcore is the honeycomb core volume.
Vcore = 0.2616∙h − 0.0110
Mcore = Vcoreρ*
Table 3.
Correspondence between the height and volume of the reflector honeycomb core.
Considering the reflector areal density limit of 10 kg/m2, Equations (12)–(16) indicate that the honeycomb core height h should not exceed 148 mm.
where M is the reflector mass, and ρsurface is the reflector areal density.
4.2. Thermal Coupling Optimization
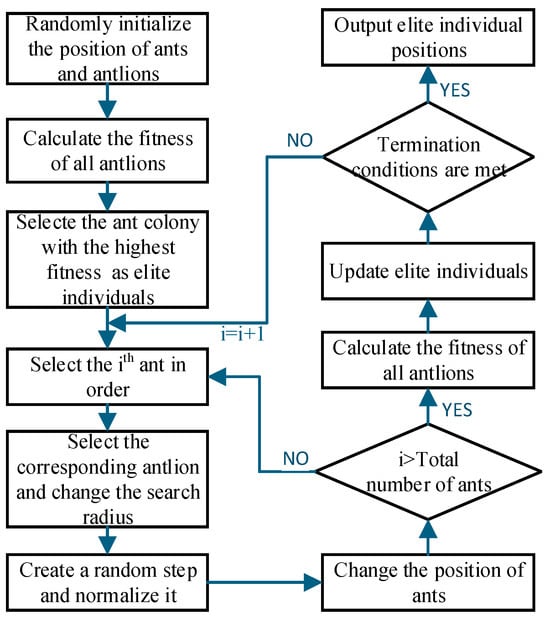
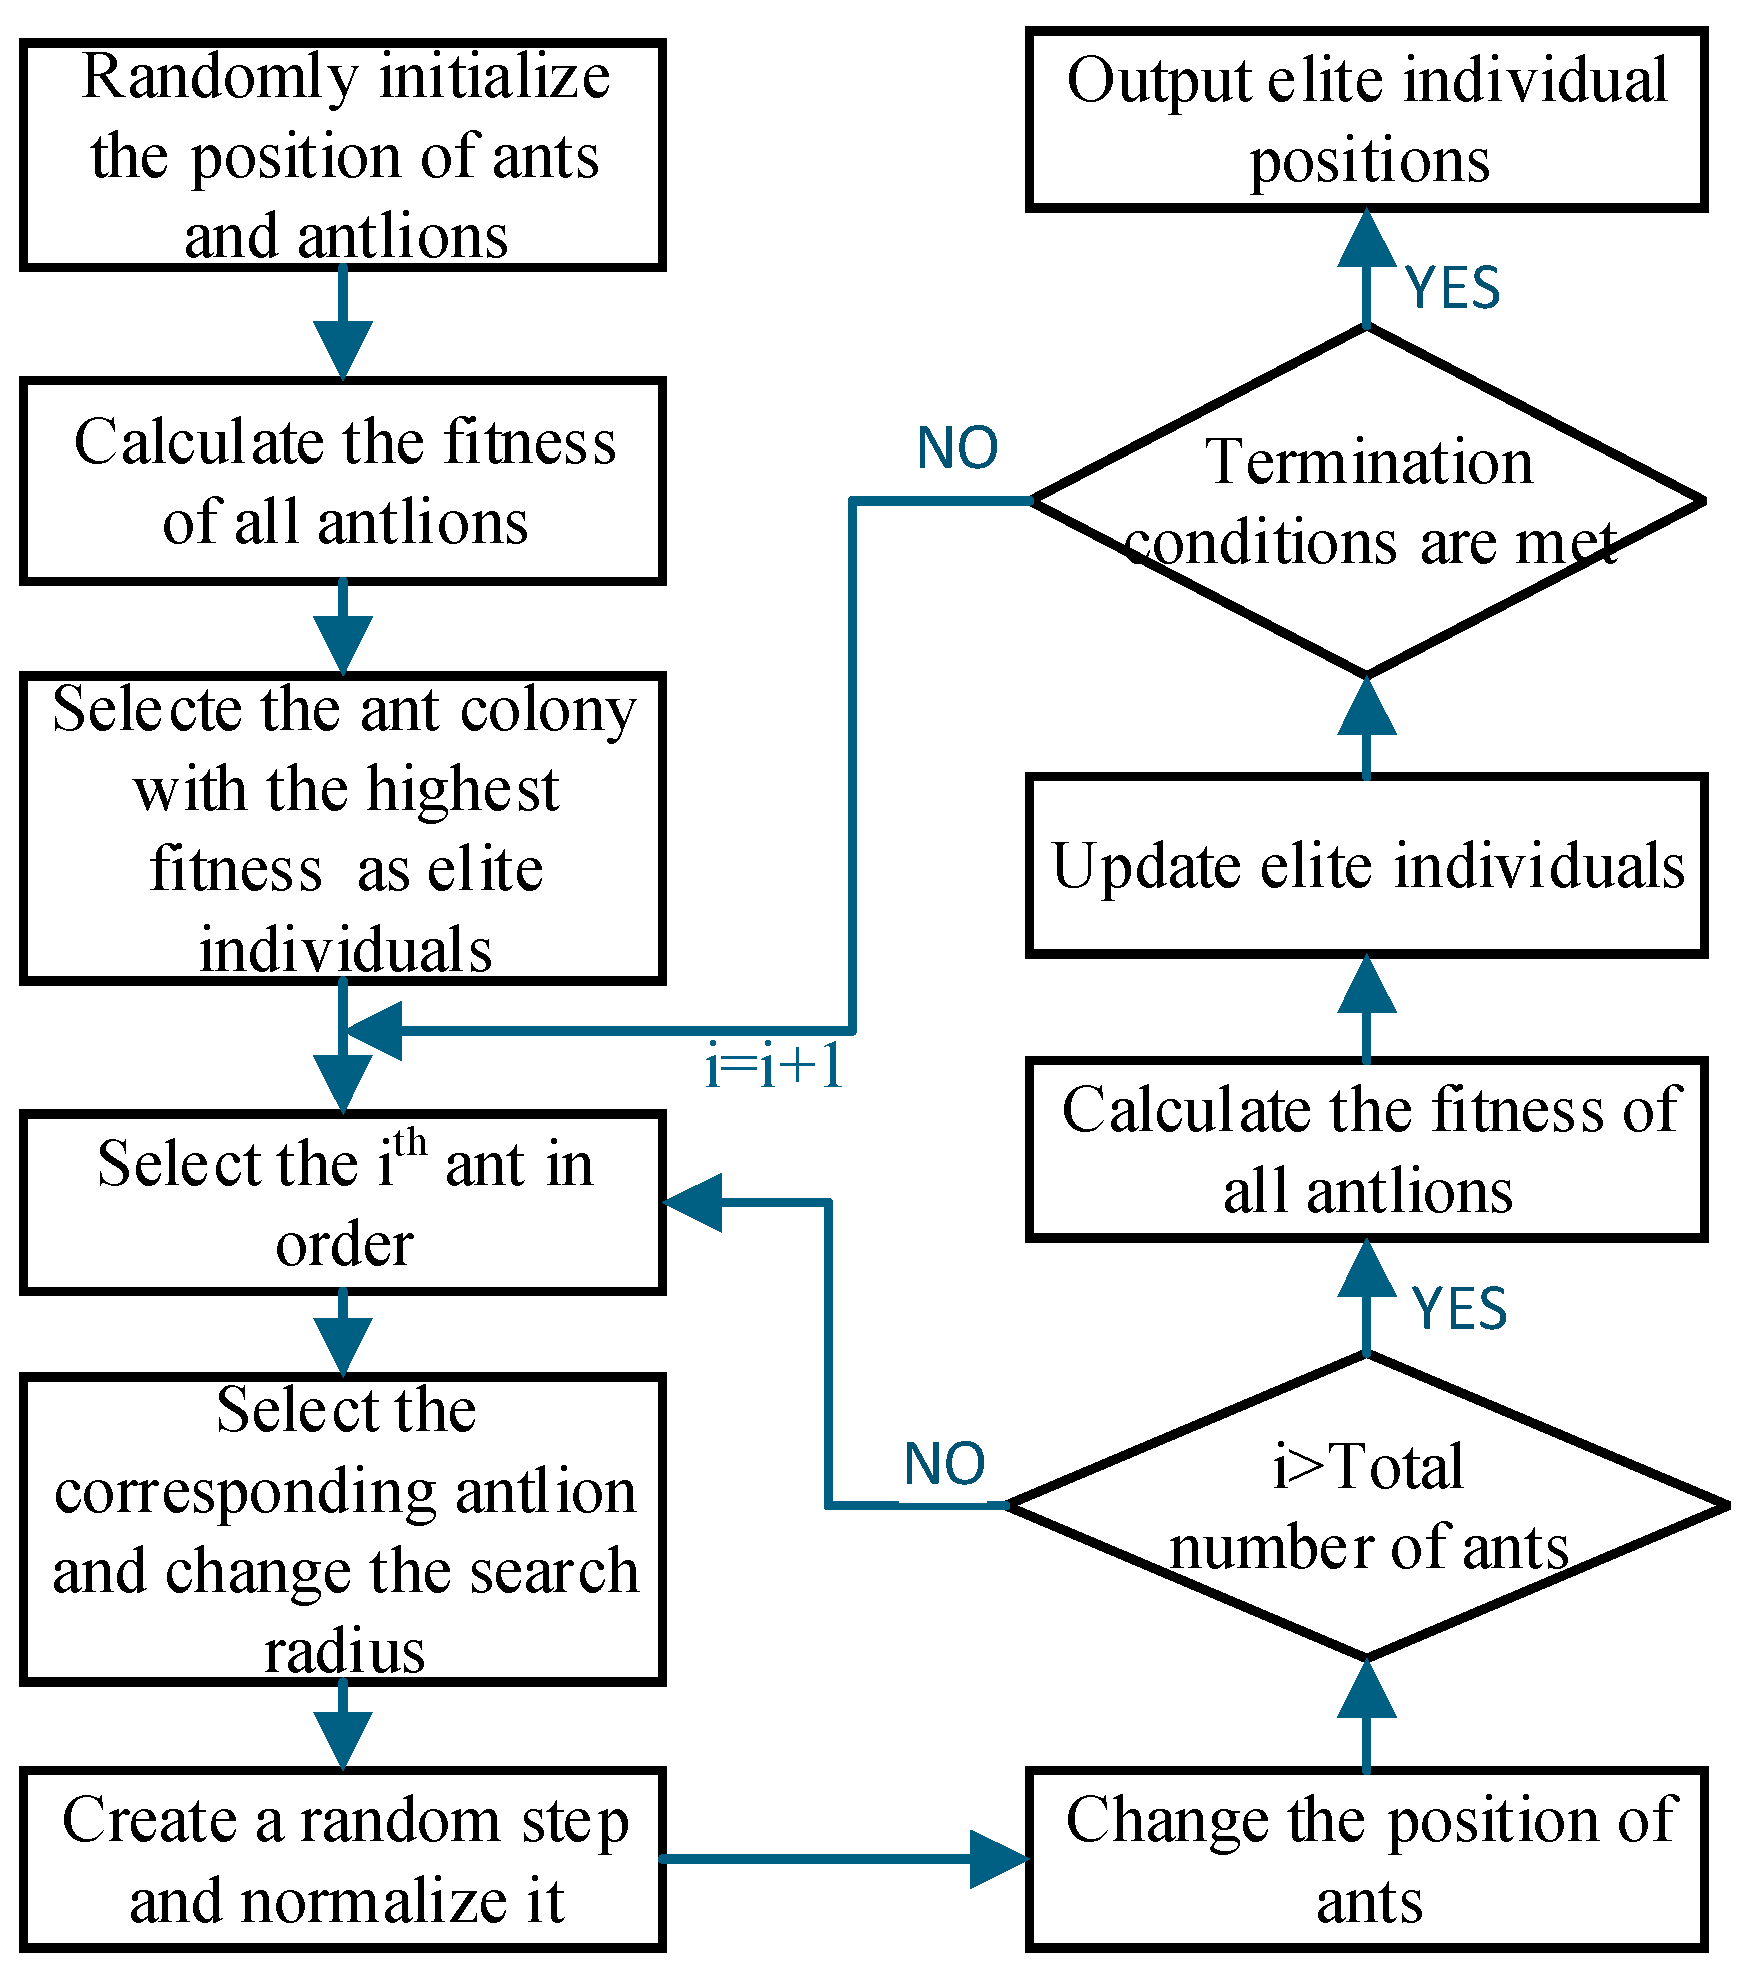
The ALO simulates the interaction between ant lions and ants during iterations. It was first proposed by Mirjalili in 2015 [24,25]. The core idea is that ants move randomly in the search space to represent candidate solutions, while ant lions capture them to improve fitness, and the best individual is selected as the optimal solution. Global search is achieved by introducing random walks of ants. Population diversity and the optimization performance of the algorithm are maintained through roulette wheel selection and elitism strategies.
For this specific reflector design, the optimization process encompasses a hybrid parameter space comprising continuous geometric dimensions, specifically the core height and cell edge length, alongside discrete composite variables, including the ply count and ply angles. The ant lion optimizer was adopted because its gradient-free stochastic search mechanism can handle optimization problems involving multiple variables and nonlinear engineering constraints, thereby providing a practical solution for the structural design. The calculation process, objective function, and convergence process are shown in Figure 7.
Figure 7.
ALO flowchart.
4.2.1. Optimization Setup
Based on the ALO formulation, the objective function, design variables, and boundary constraints are defined. The variables are the number of upper-skin plies n, ply angle p, honeycomb core height h, and cell edge length l. The variable n is an integer greater than or equal to 2.
In practical engineering applications, laminate ply angles are selected according to the following requirements:
- (a)
- Typical ply angles include 0°, 45°, 60°, and 90°.
- (b)
- The stacking sequence is selected according to the quasi-isotropic design principle.
- (c)
- The lower-skin layup is symmetric to the upper-skin layup.
The stacking sequence p is predefined for each admissible ply count n, reducing the number of independent design variables to three. The continuous search positions are mapped to specific parameter values.
Equation (17) defines the objective function, and the reflector thermal coupling deformation calculated by the FE model is used as the objective value.
fthermal_RMS = CostFunction(n,h,l)
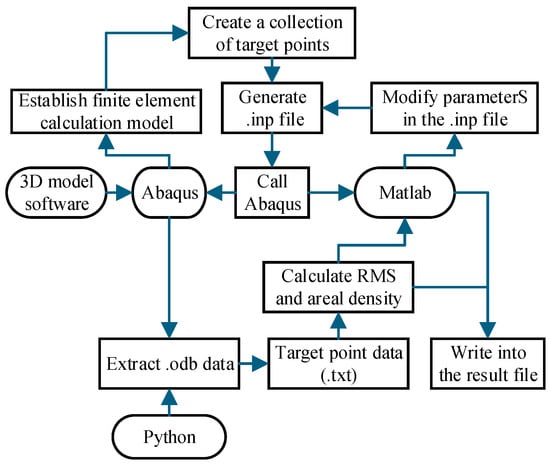
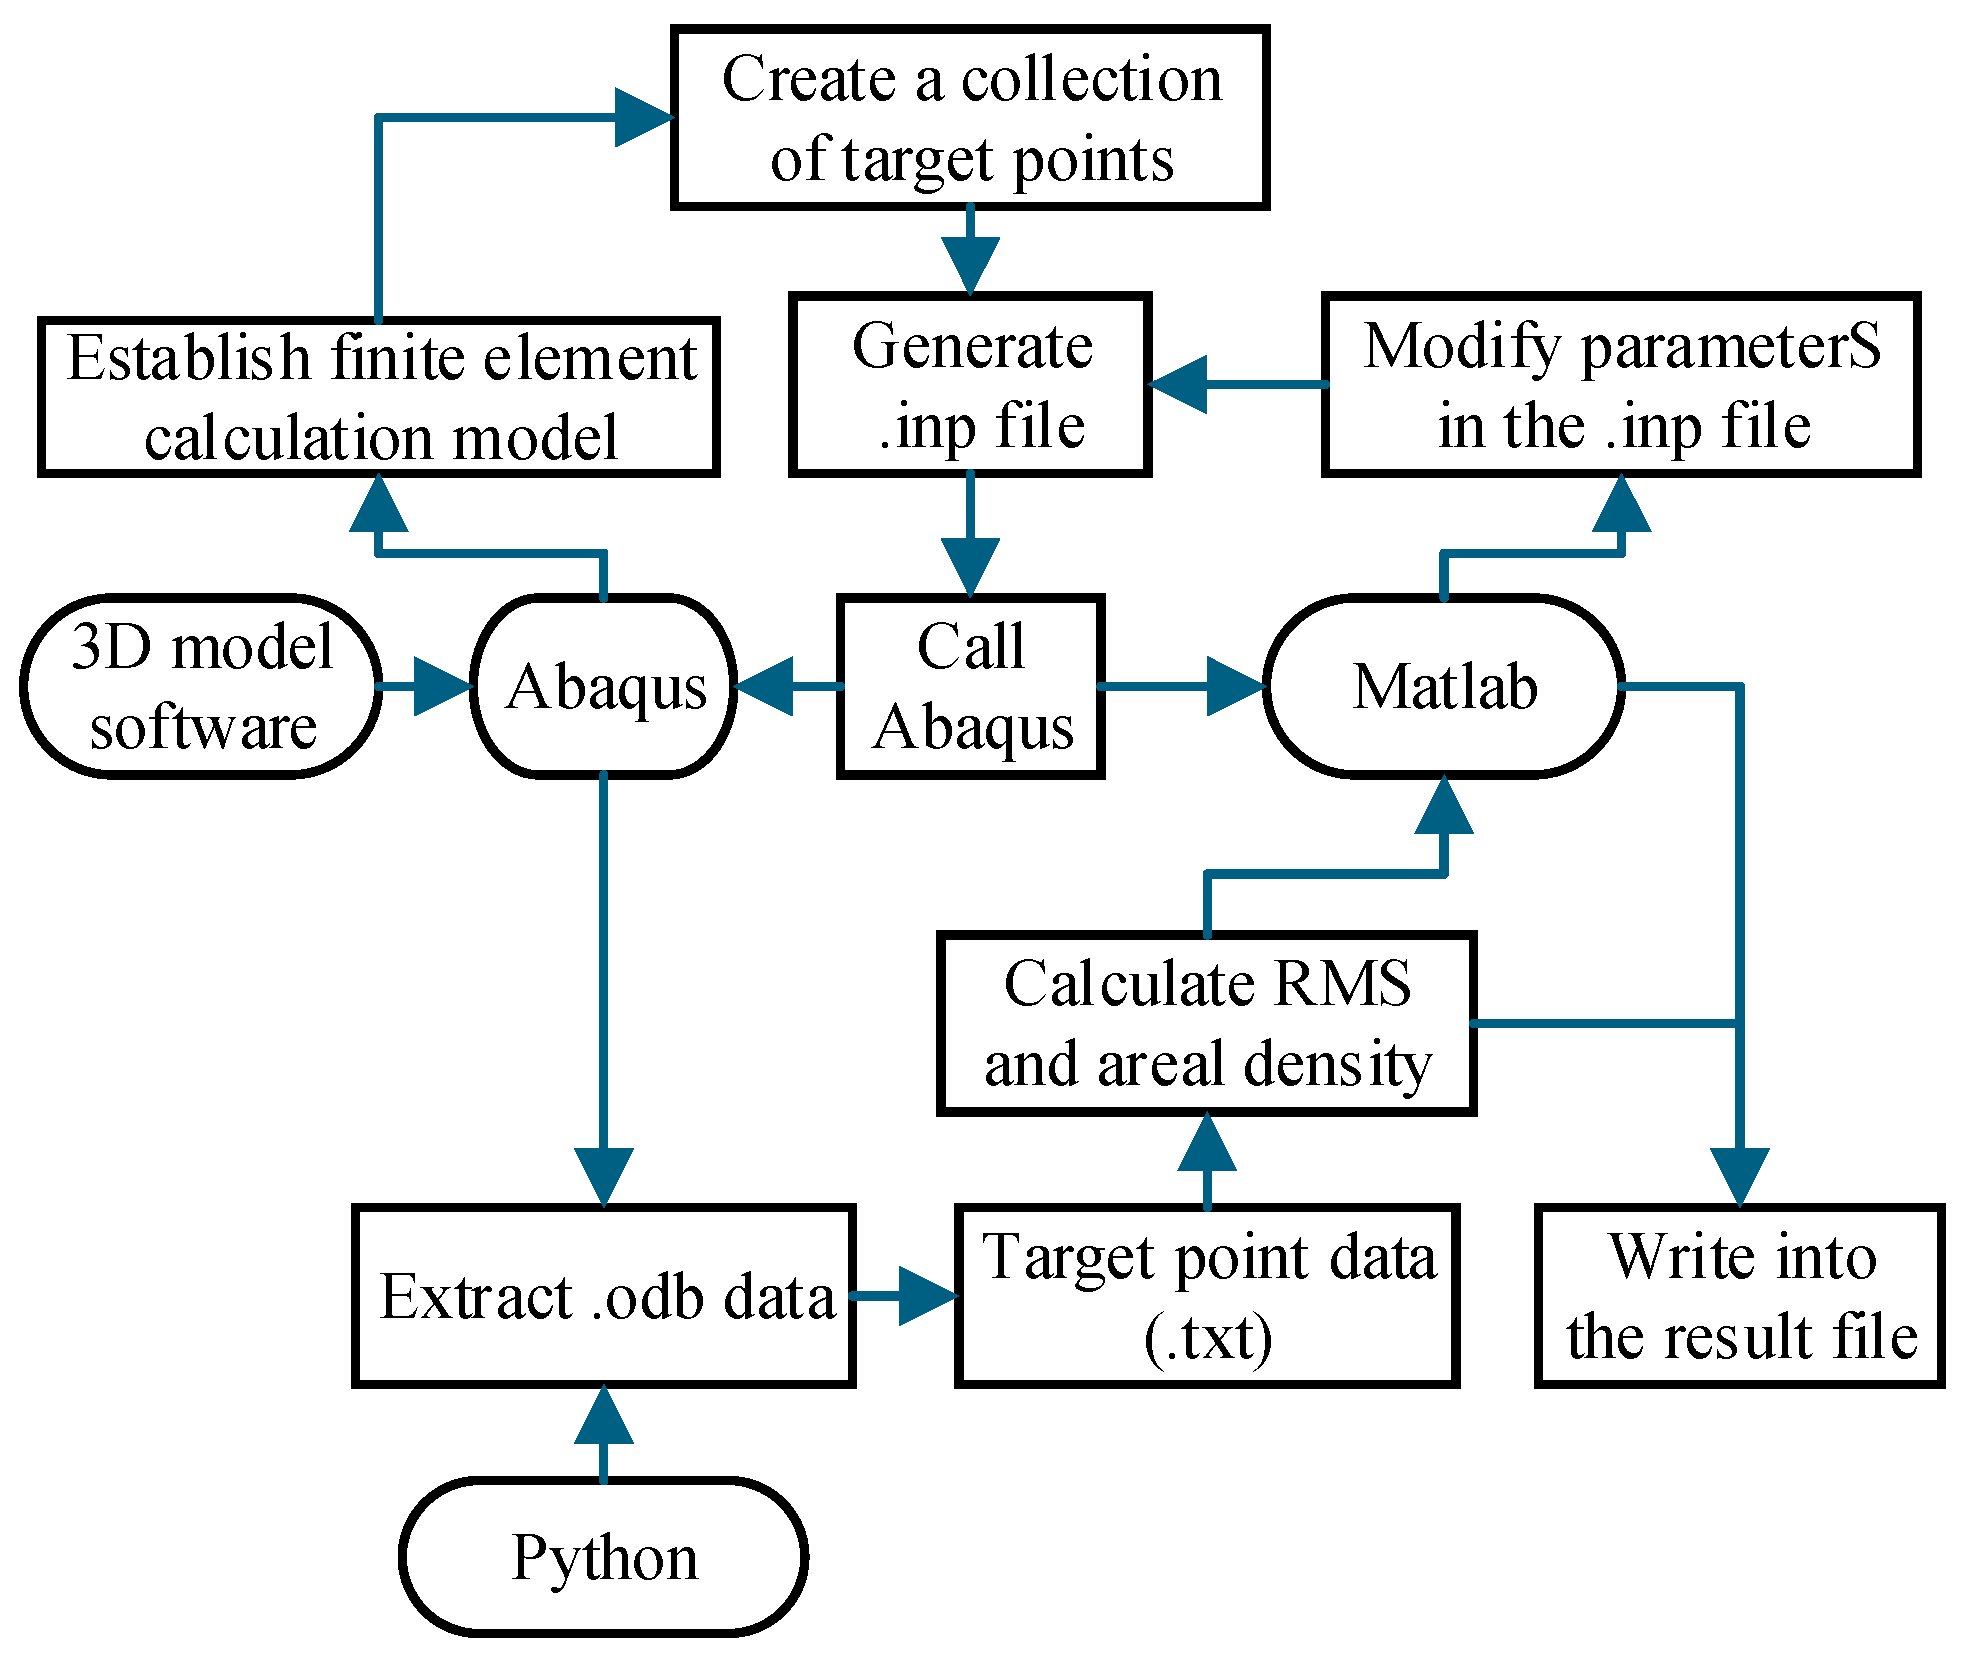
The optimization process is shown in Figure 8. The finite element analysis software Abaqus was used to calculate the thermal coupling deformation of the reflector, and the finite element model was defined in an .inp file generated using Python.
Figure 8.
Thermal coupling optimization workflow and data processing sequence.
The variables n, h and l were assigned to the ants and ant lions in the ALO. After the initial positions of the ants and ant lions were initialized, the input parameters in the .inp file were updated using the position parameters of each ant lion. In each subsequent iteration, after the ant positions were updated, the input variables n, h and l in the .inp file were rewritten using the position parameters of each ant. Abaqus was then used to perform a new finite element analysis.
4.2.2. Optimization Process
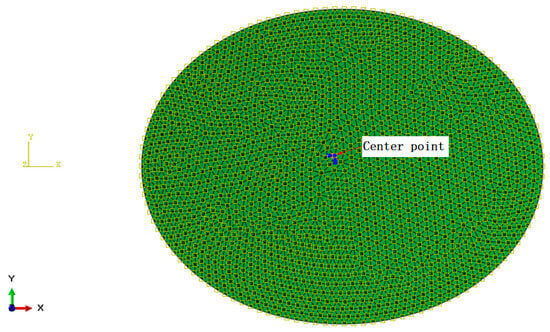
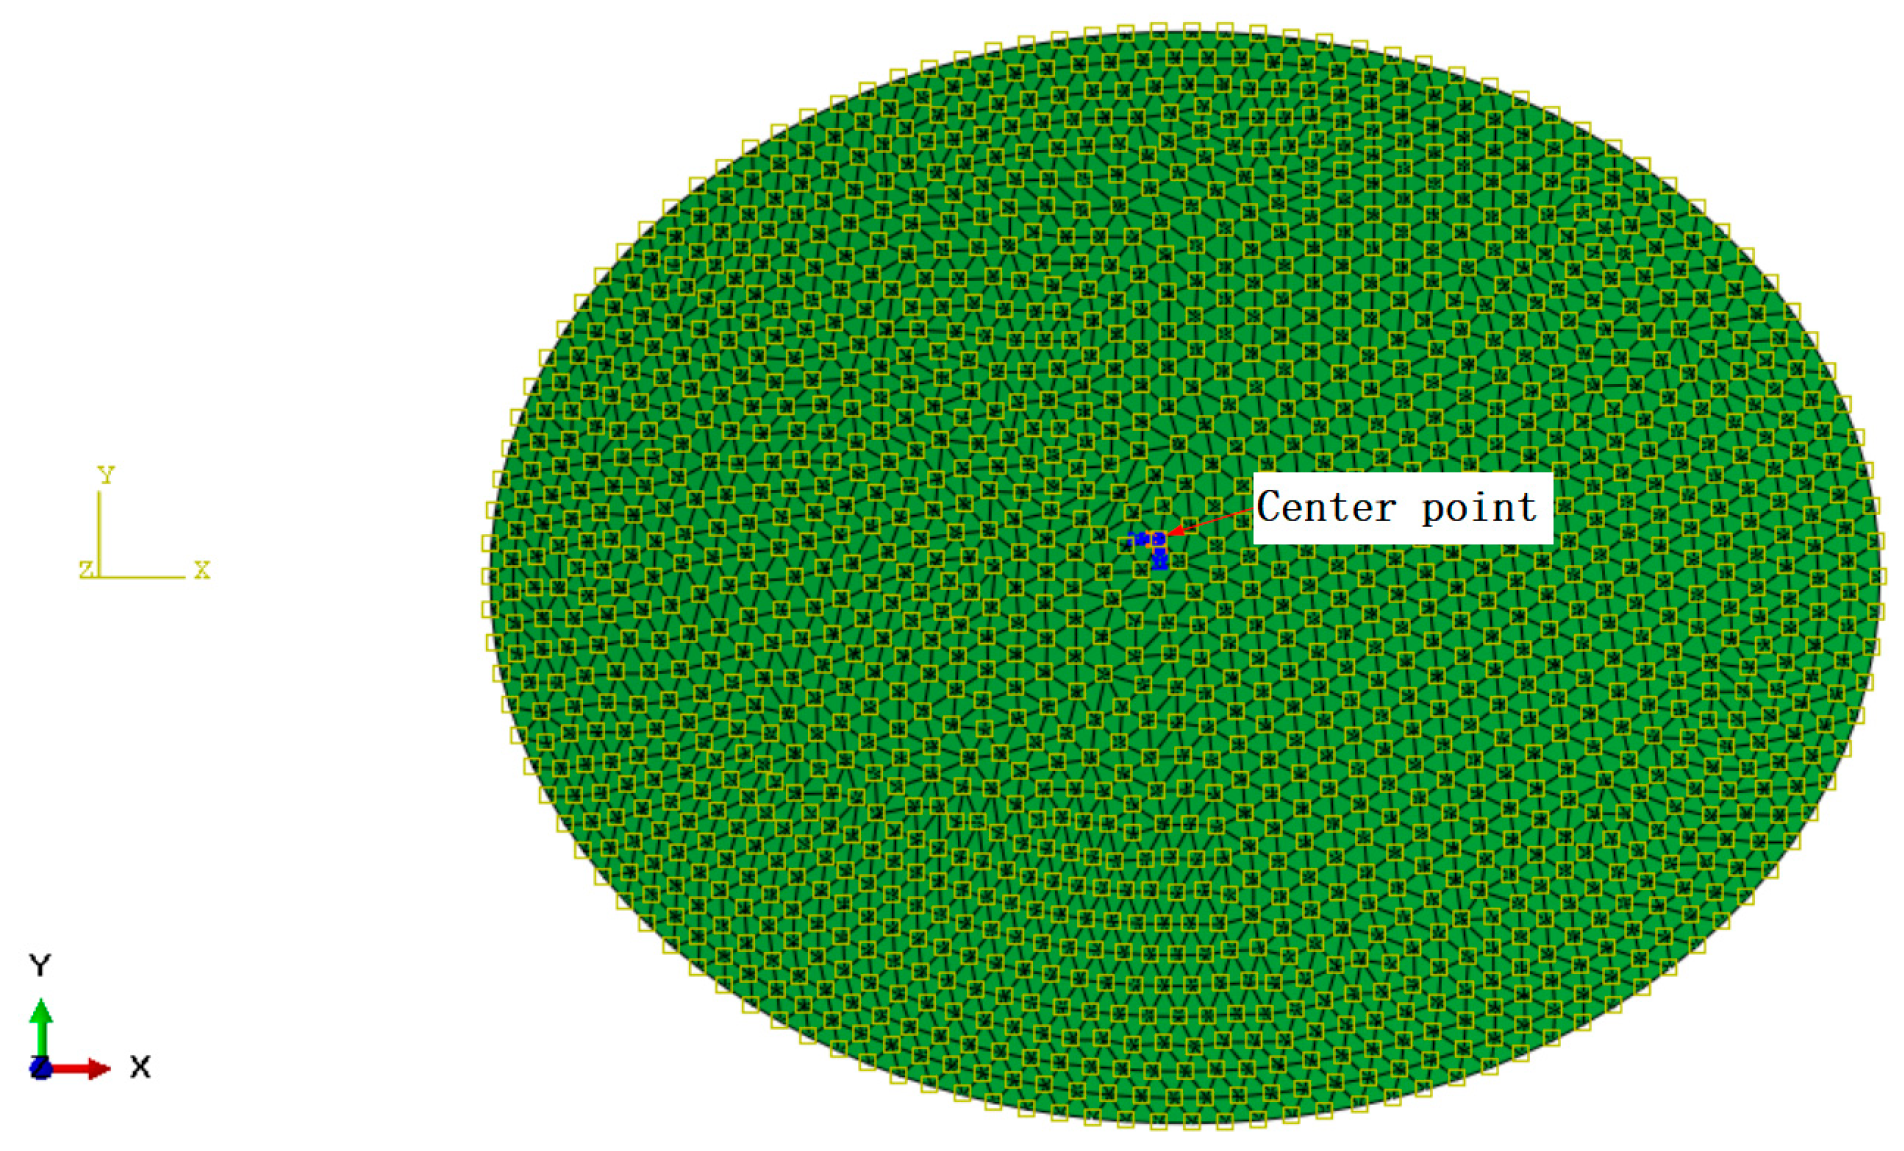
The reflector was discretized using 2632 shell elements and 1375 nodes. During the reflector-level analysis, the center point of the reflector was constrained in all six degrees of freedom. The analysis model is shown in Figure 9.
Figure 9.
Analysis model of the reflector.
The optimization process was implemented according to the principle of quasi-isotropic design. The practical manufacturing constraints of carbon fiber composites were incorporated into the reflector design. Thus, the range of variables is as follows:
- (1)
- n = 2, 3, …, 8;
- (2)
- The ply angle sequence p is defined as follows:
- When n = 2, p = [0°/90°];
- When n = 3, p = [0°/60°/−60°];
- When n = 4, p = [0°/45°/−45°/90°];
- When n = 5, p = [45°/−45°/0°/−45°/45°];
- When n = 6, p = [0°/60°/−60°/−60°/60°/0°];
- When n = 7, p = [0°/60°/−60°/0°/−60°/60°/0°];
- When n = 8, p = [0°/45°/−45°/90°/90°/−45°/45°/0°];
- (3)
- 45 mm ≤ h ≤ 148 mm;
- (4)
- 5 mm ≤ l ≤ 20 mm.
The main function of the optimization process was ALO (20, 10, [2, 45, 5], [8, 148.3, 20], 3, @costFunction), the population size was 20, the number of iterations was 10, and the number of independent runs was 200. Because the variable p is associated with the variable n, the number of variables was 3. The used function was costFunction (X), where the vector X = [X(1), X(2), X(3)]. Here, n = X(1) ∈ [2, 8], h = X(2) ∈ [45, 148.3], l = X(3) ∈ [5, 20].
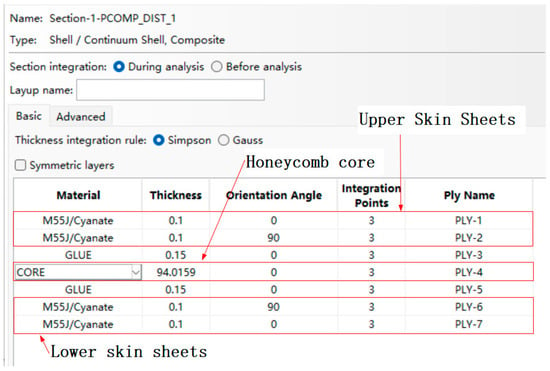
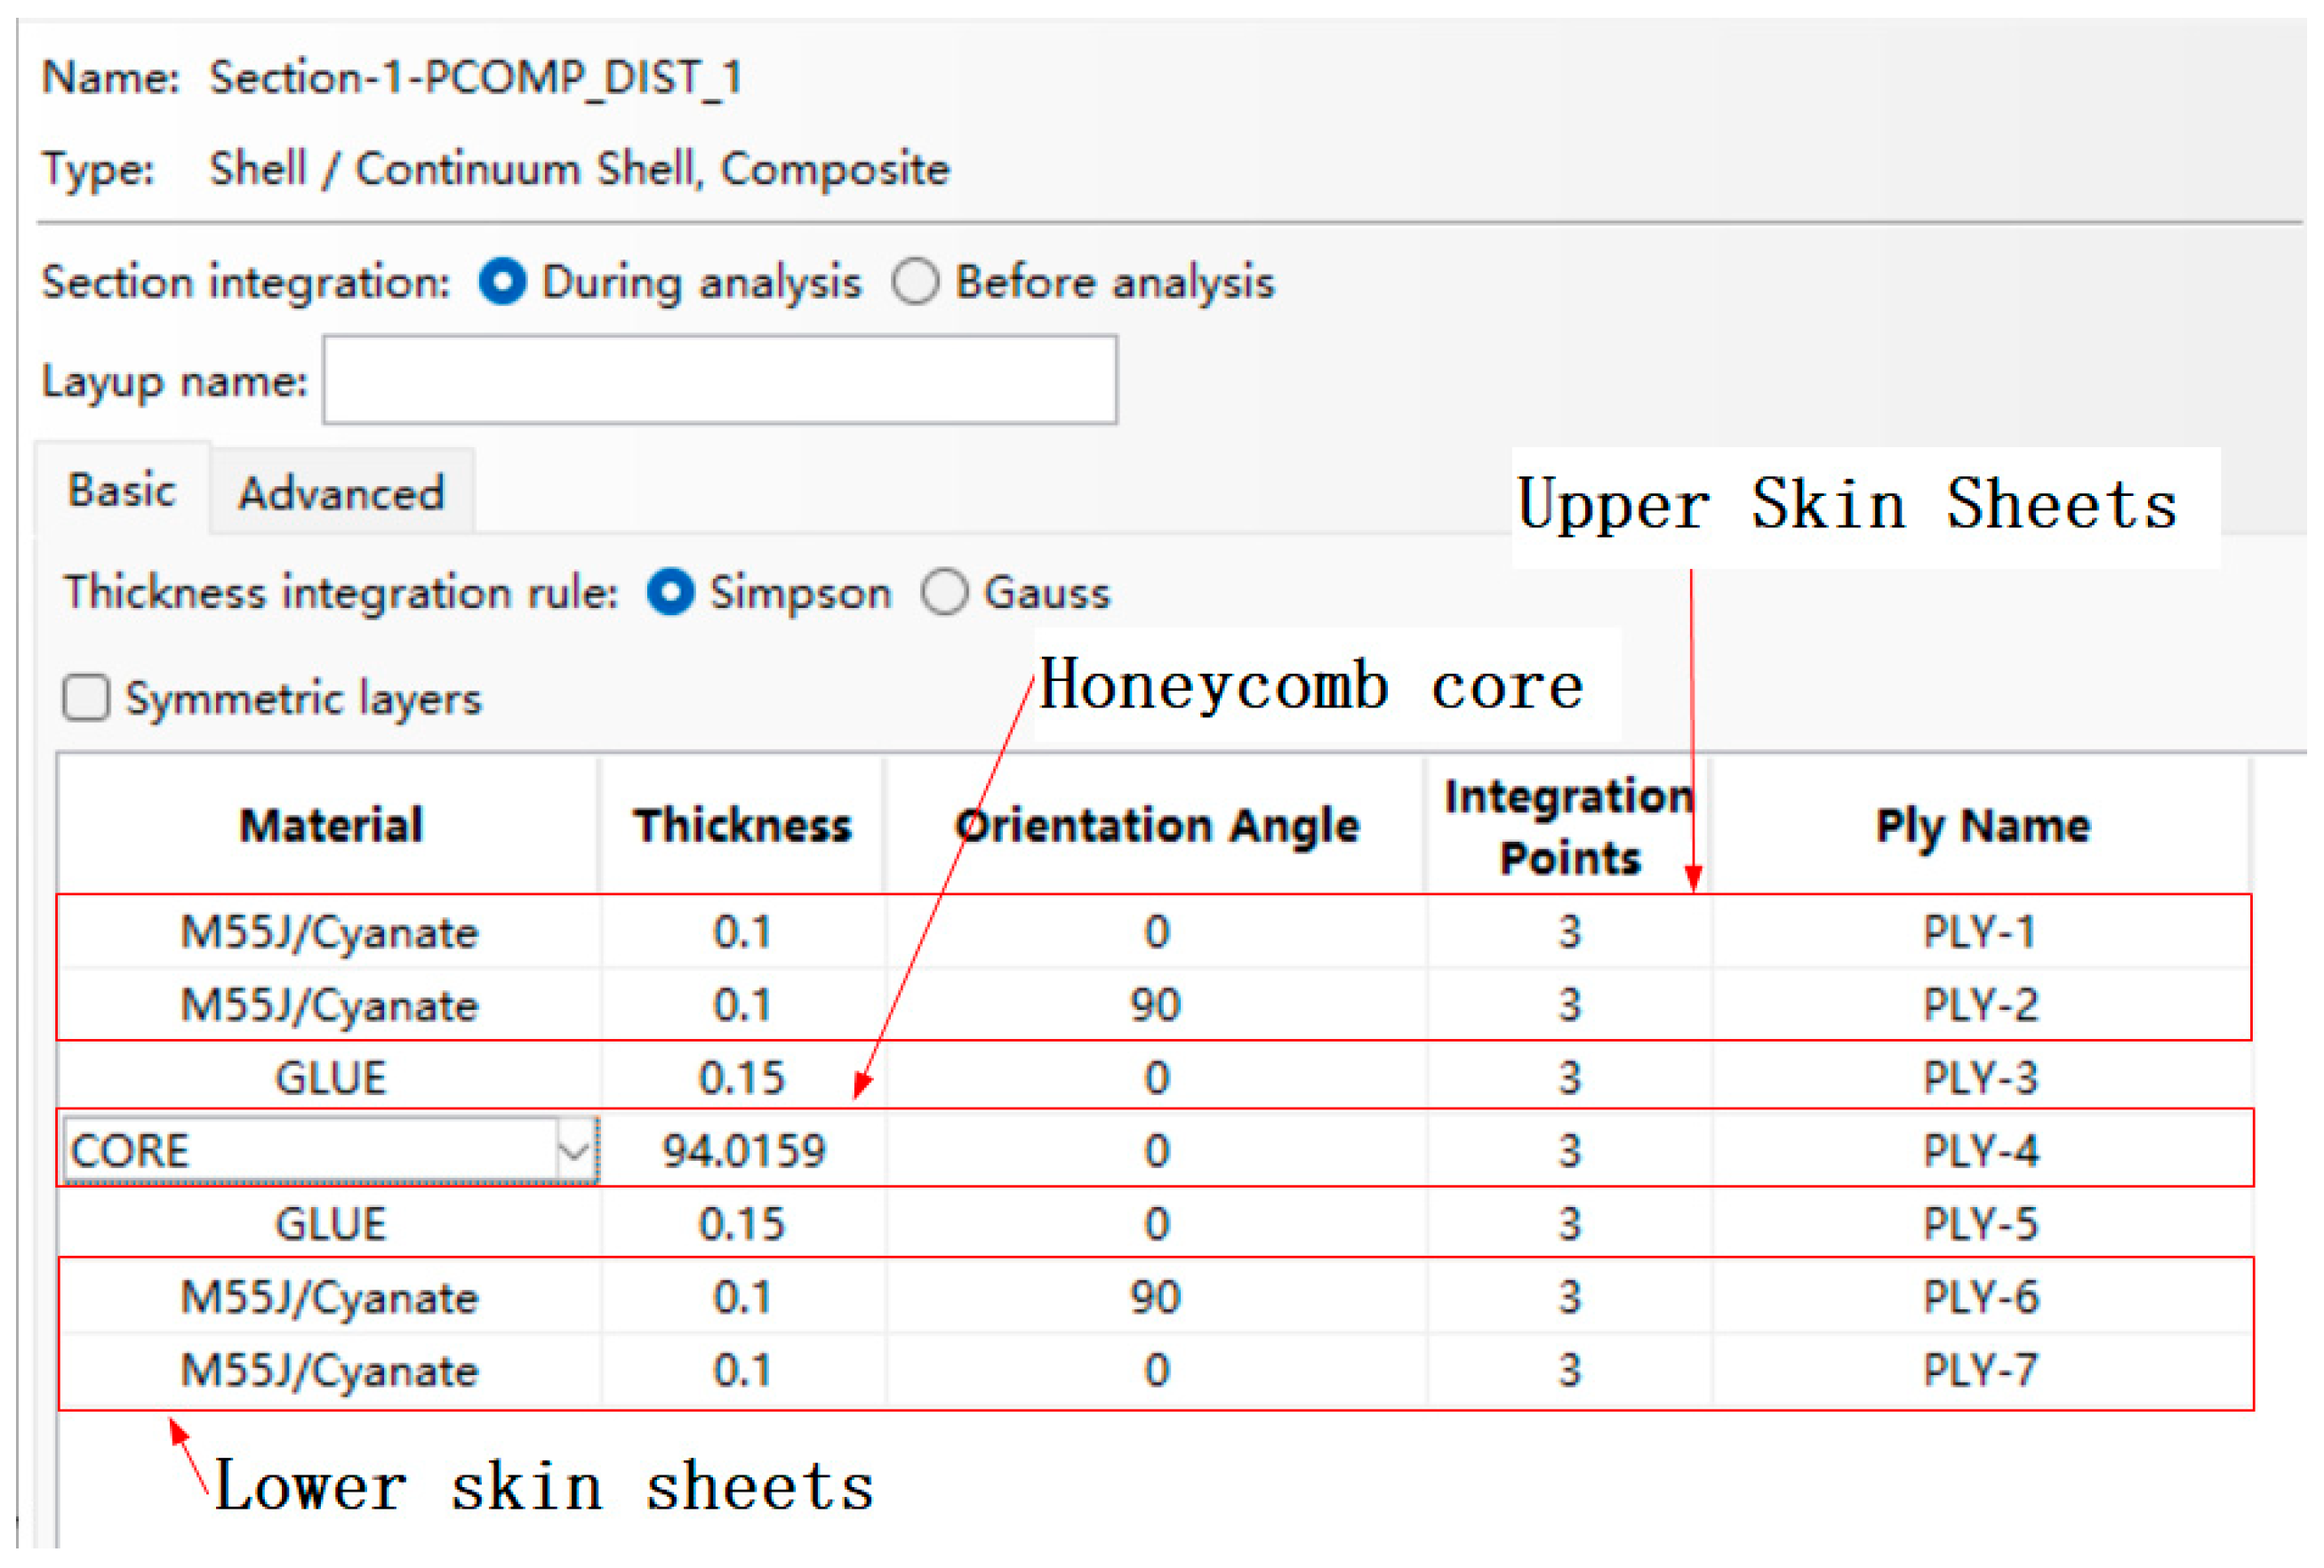
An example of the shell–element section properties is shown in Figure 10. The wall thickness t of the carbon fiber honeycomb core with a [0°/90°]s layup was 0.4 mm. The mechanical properties of the honeycomb core were calculated analytically using Equations (2)–(11) and automatically written into the .inp file by the costFunction function. The number of upper-skin plies n and the corresponding stacking sequence p were also automatically updated in the .inp file by the costFunction function. The updated section properties are shown in Figure 10. The reflector areal density was calculated analytically using Equation (16) and processed in the same manner.
Figure 10.
An example of the shell–element section properties when n = 2.
4.2.3. Optimization Results
With the reference temperature set to 20 °C, the ALO optimization results for a uniform temperature load of −120 °C are presented in Table 4. The thermal coupling deformation was calculated according to Equation (1) without applying a best-fit procedure. Here, (xi, yi, zi) in Equation (1) denote the theoretical coordinates of the reflector surface in the reference configuration.
Table 4.
ALO optimization results.
The minimum thermal coupling deformation was 4.1 μm RMS for an eight-ply skin, consistent with previous findings that increasing the number of plies can reduce the influence of ply angle deviations on thermal coupling deformation [26,27].
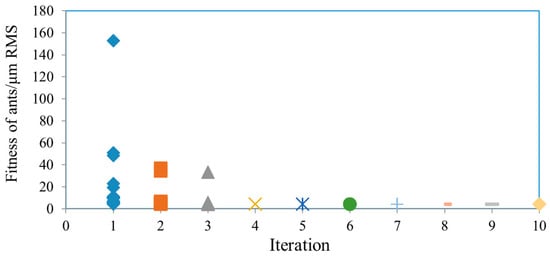
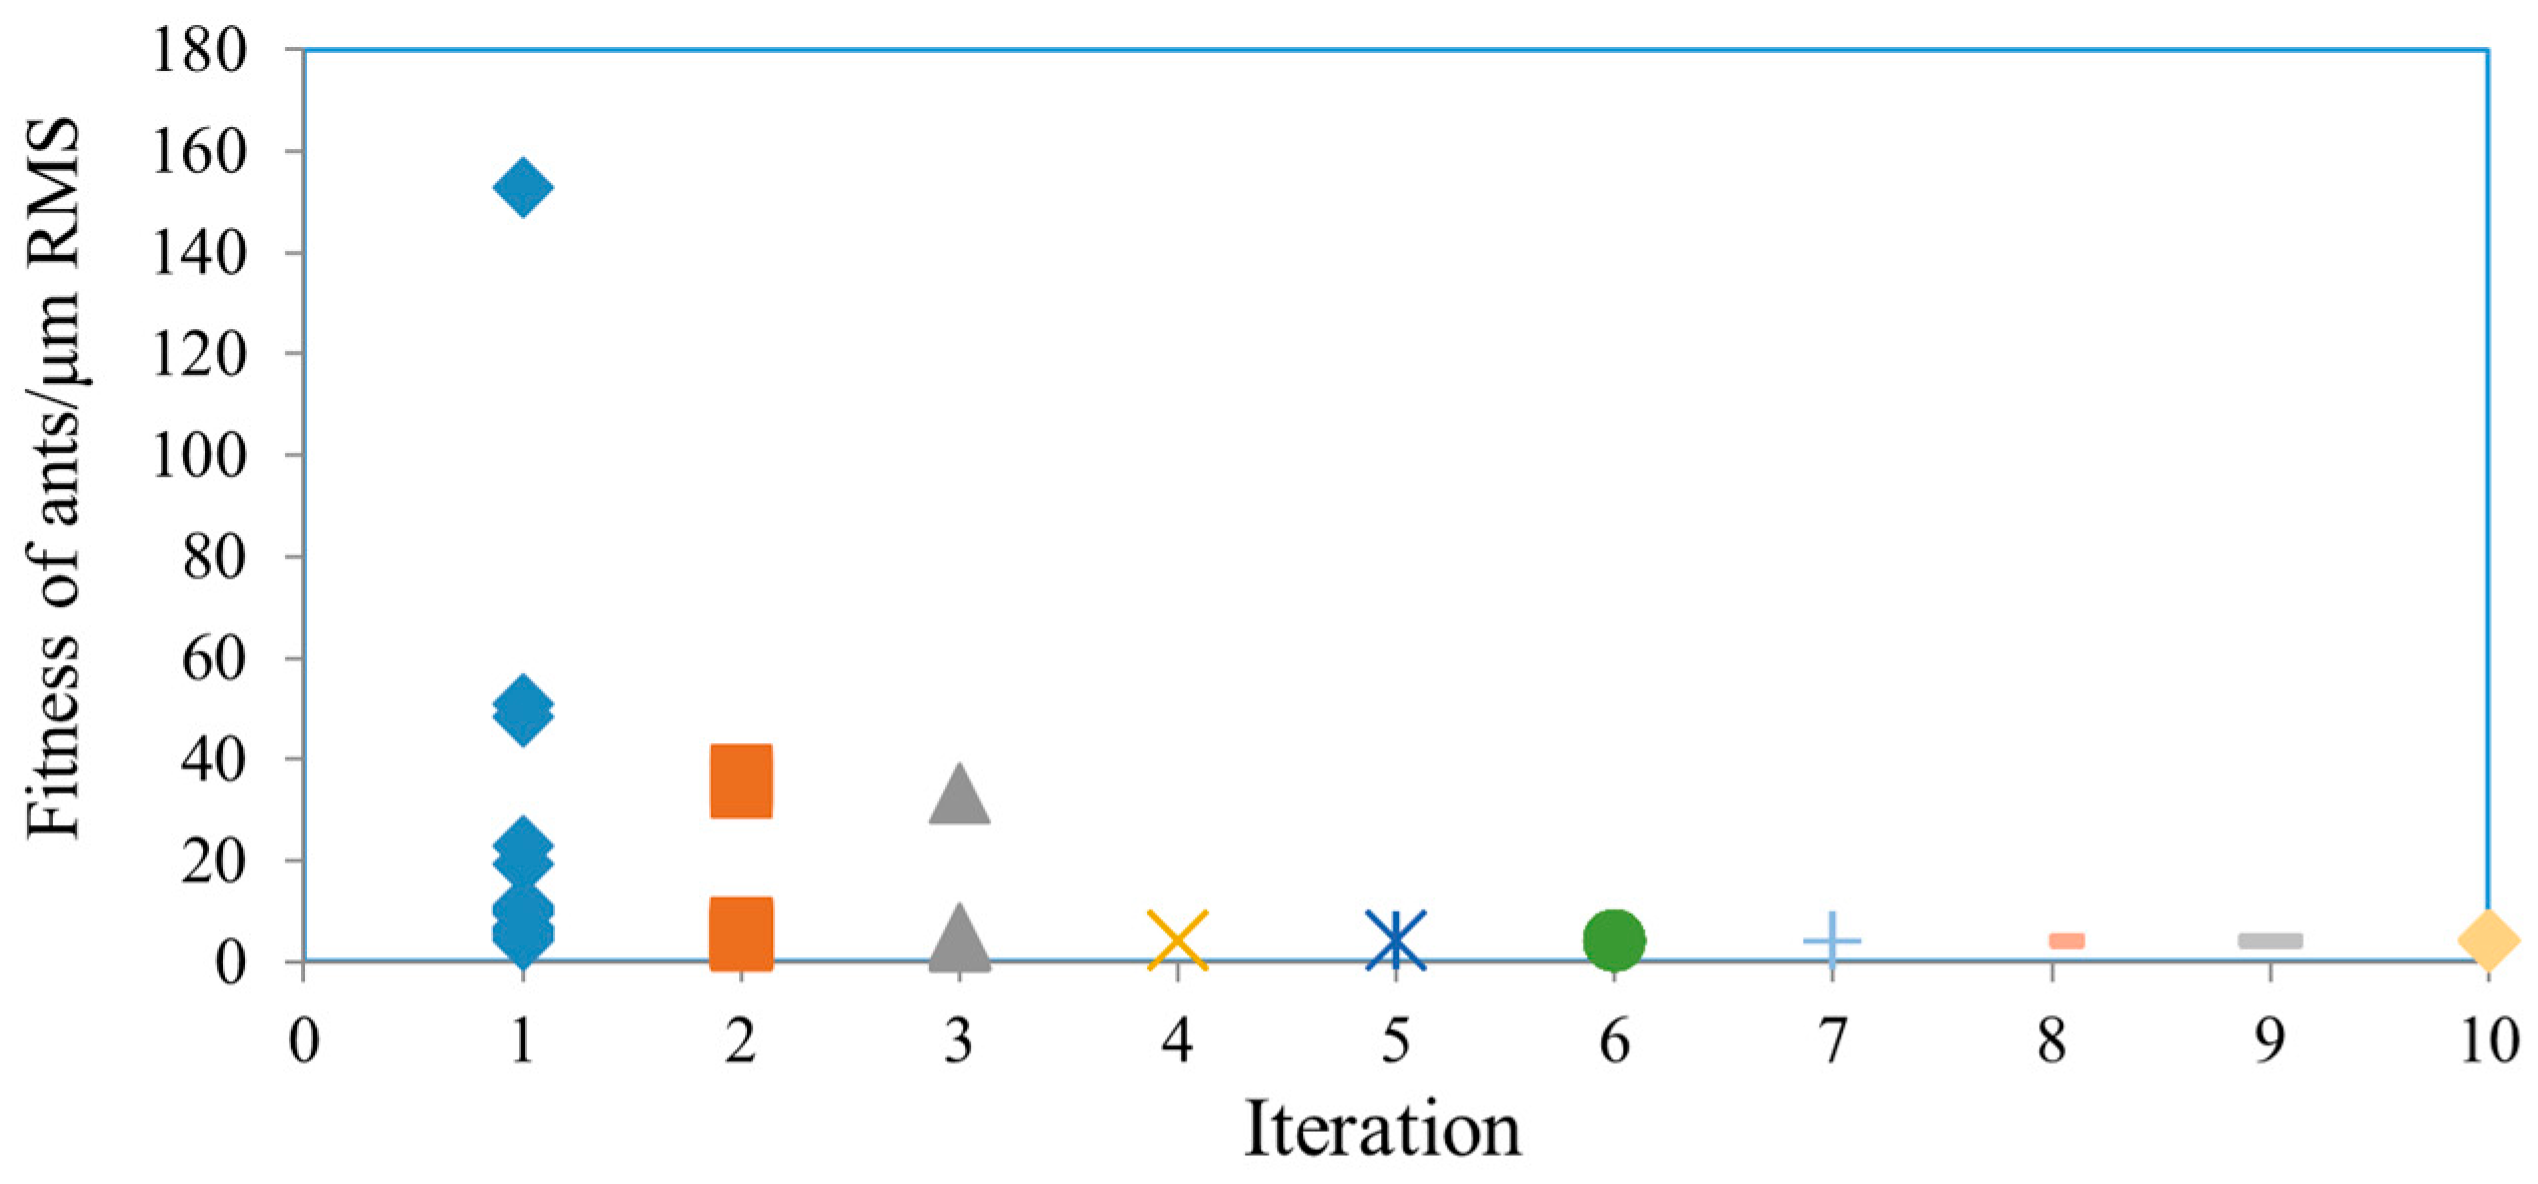
The fitness values of the candidate solutions during the iterations are shown in Figure 11.
Figure 11.
Fitness of each ant during thermal deformation optimization.
As the optimization proceeded, the ant positions gradually converged and the search range contracted, indicating convergence of the ALO procedure.
At each iteration, the ant with the highest fitness updated the elite ant lion, and the best solution obtained during the search was retained as the current optimum.
4.3. Ply Angle Deviation Analysis
The reflector consisted of M55J/Cyanate skins, a T300/Epoxy honeycomb core, and adhesive films. According to the above optimization results, the laminate stacking sequence was [0°/45°/−45°/90°/90°/−45°/45°/0°/0°(film)/0°(core)/0°(film)/0°/45°/−45°/90°/90°/−45°/45°/0°]. Thus, the upper and lower skins contained 16 plies in total.
In practical manufacturing processes, the actual ply angles inevitably deviate from theoretical values. Therefore, the influence of ply angle deviations in the skin sheets should be considered. Thermal coupling deformation of the reflector can be expressed by Equation (18).
where ply1, ply2, … …ply16 are the actual layup angles of the upper and lower skins.
fthermal_RMS = f(ply1, ply2, … …ply16)
The ply angle deviation is subject to the normal distribution model, and each ply angle is independent of each other. So, the random deviation of each ply angle of reflector △θi (i = 1, 2, ..., 16) satisfies Equation (19) [12]. The required value of ply angle deviation ±δ (δ = 0.5°, 1°, 1.5°, 2°) can be generated sample values of deviation angle with 16 layers by the ALO process.
where μ denotes the sample mean, and σ denotes the sample standard deviation.
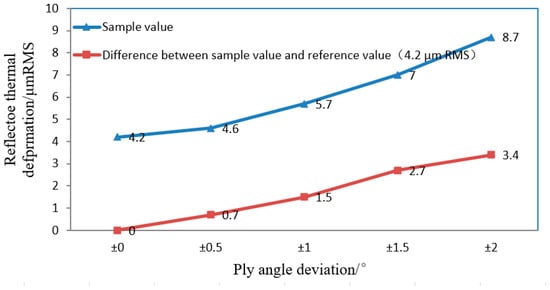
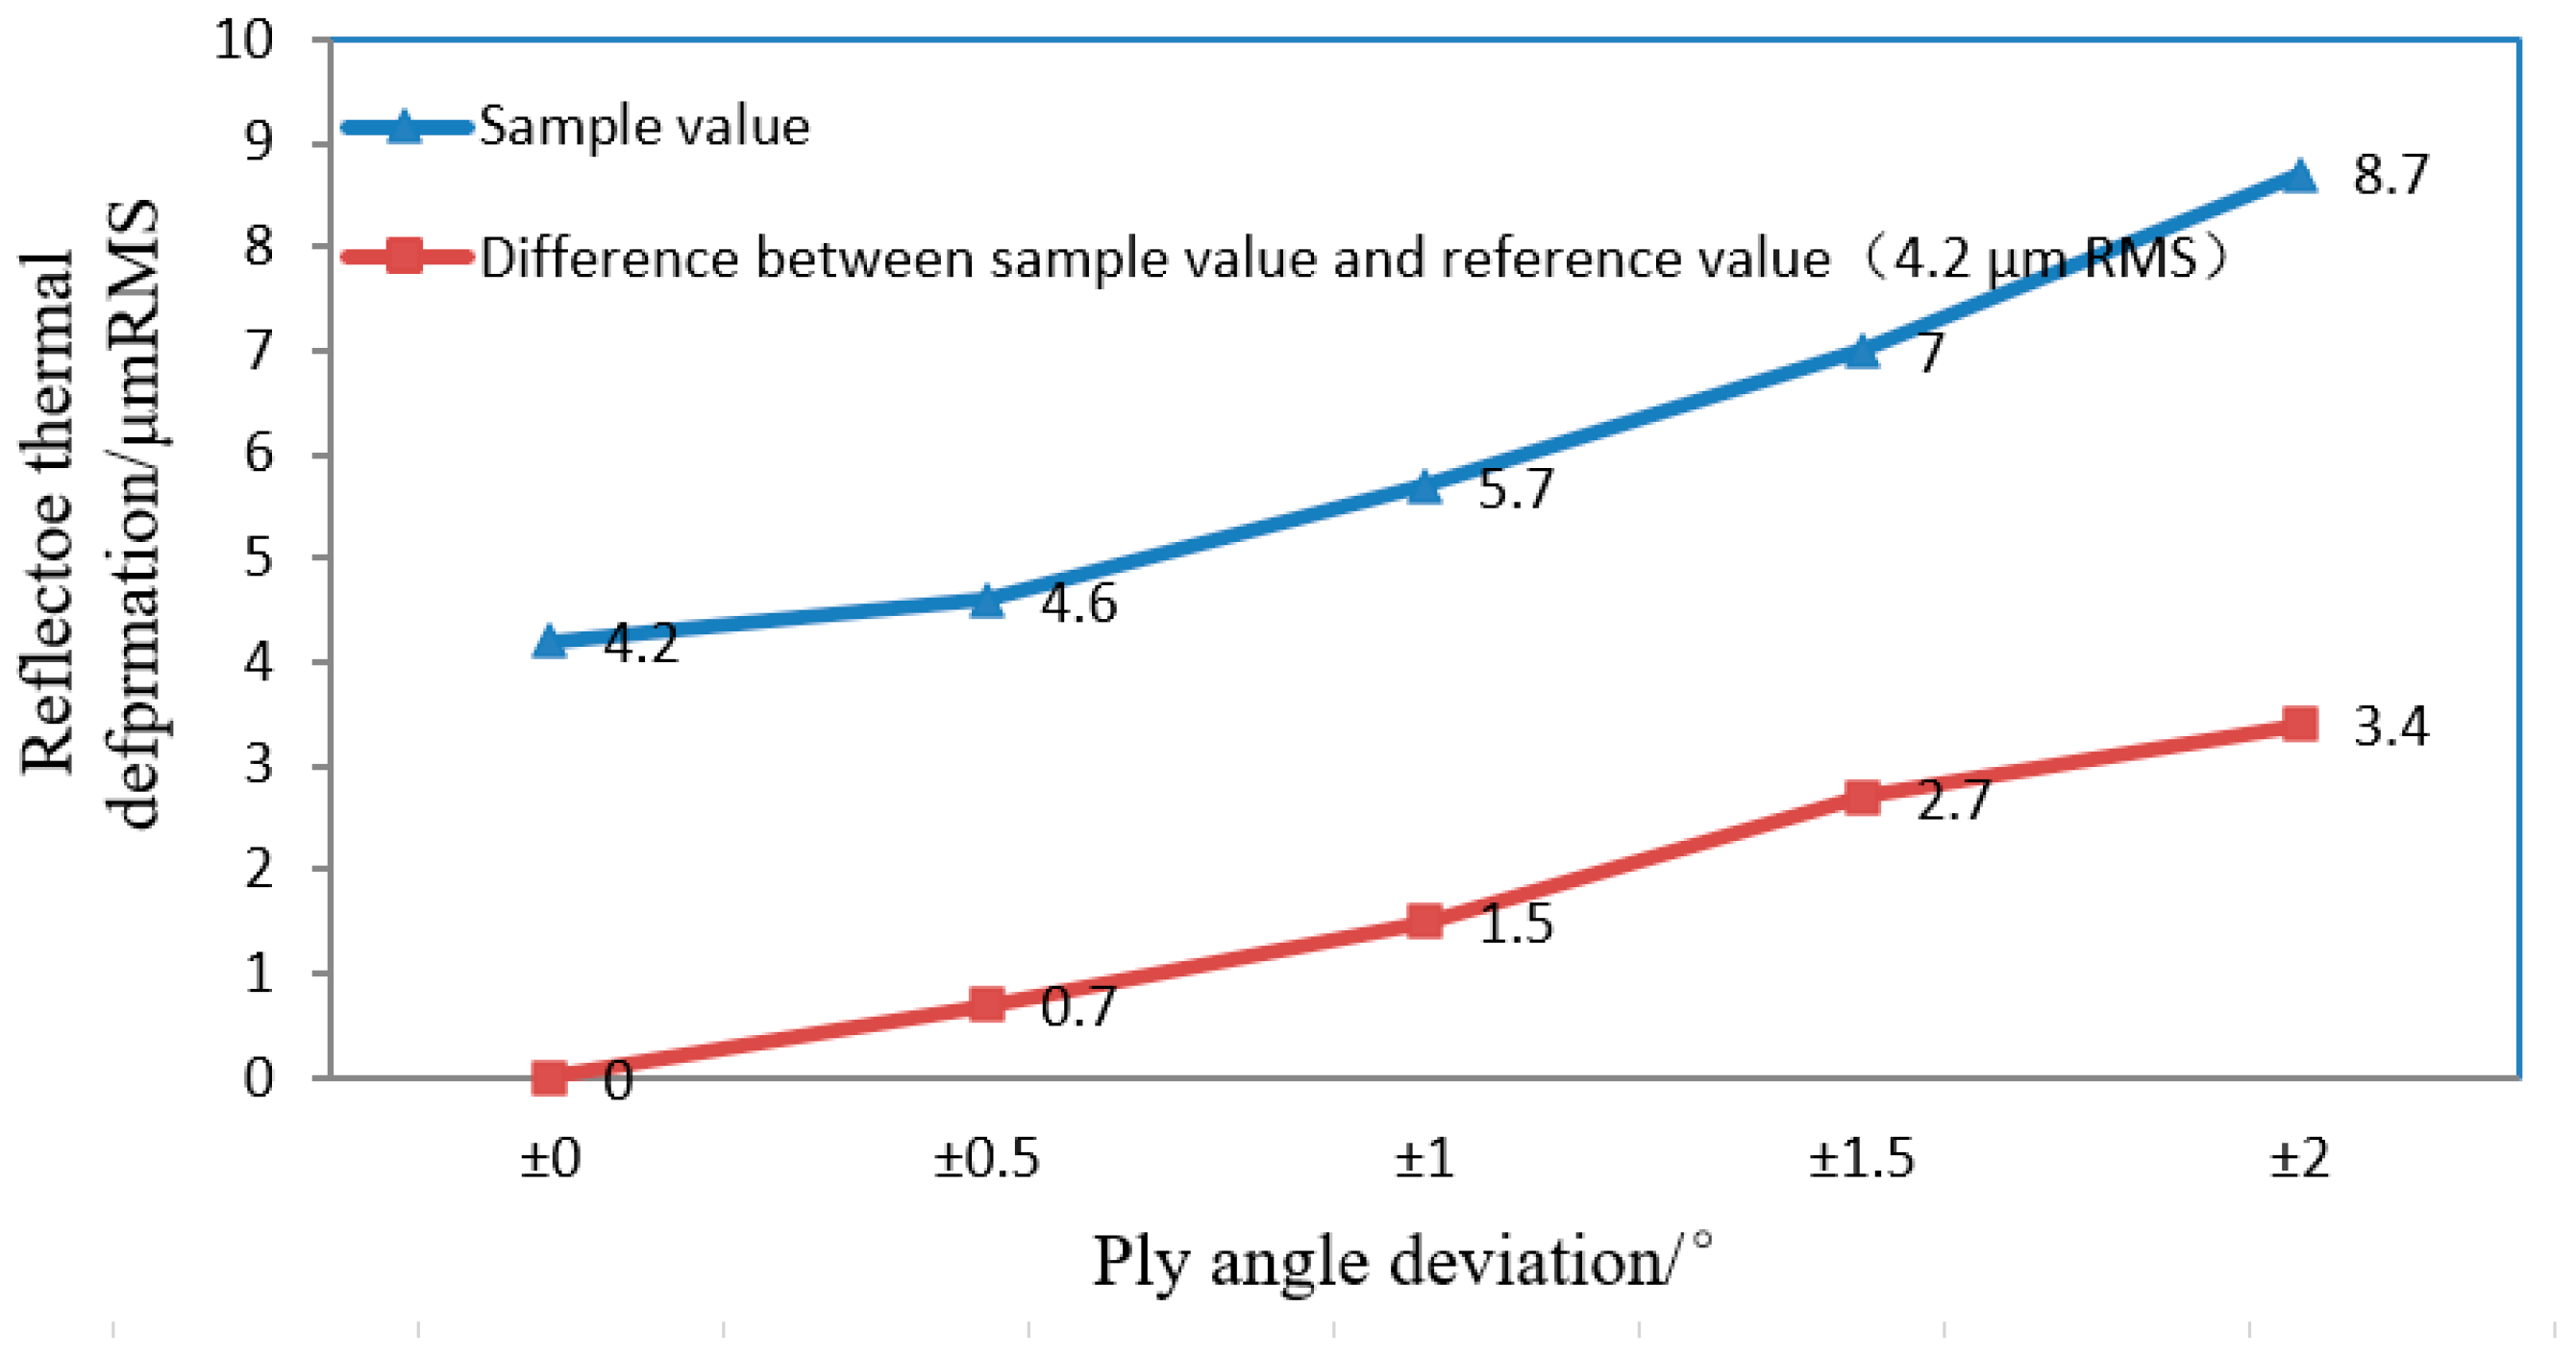
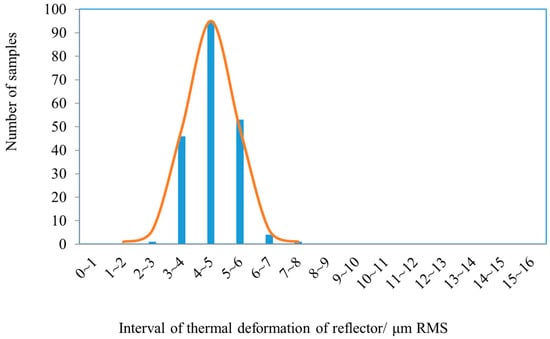
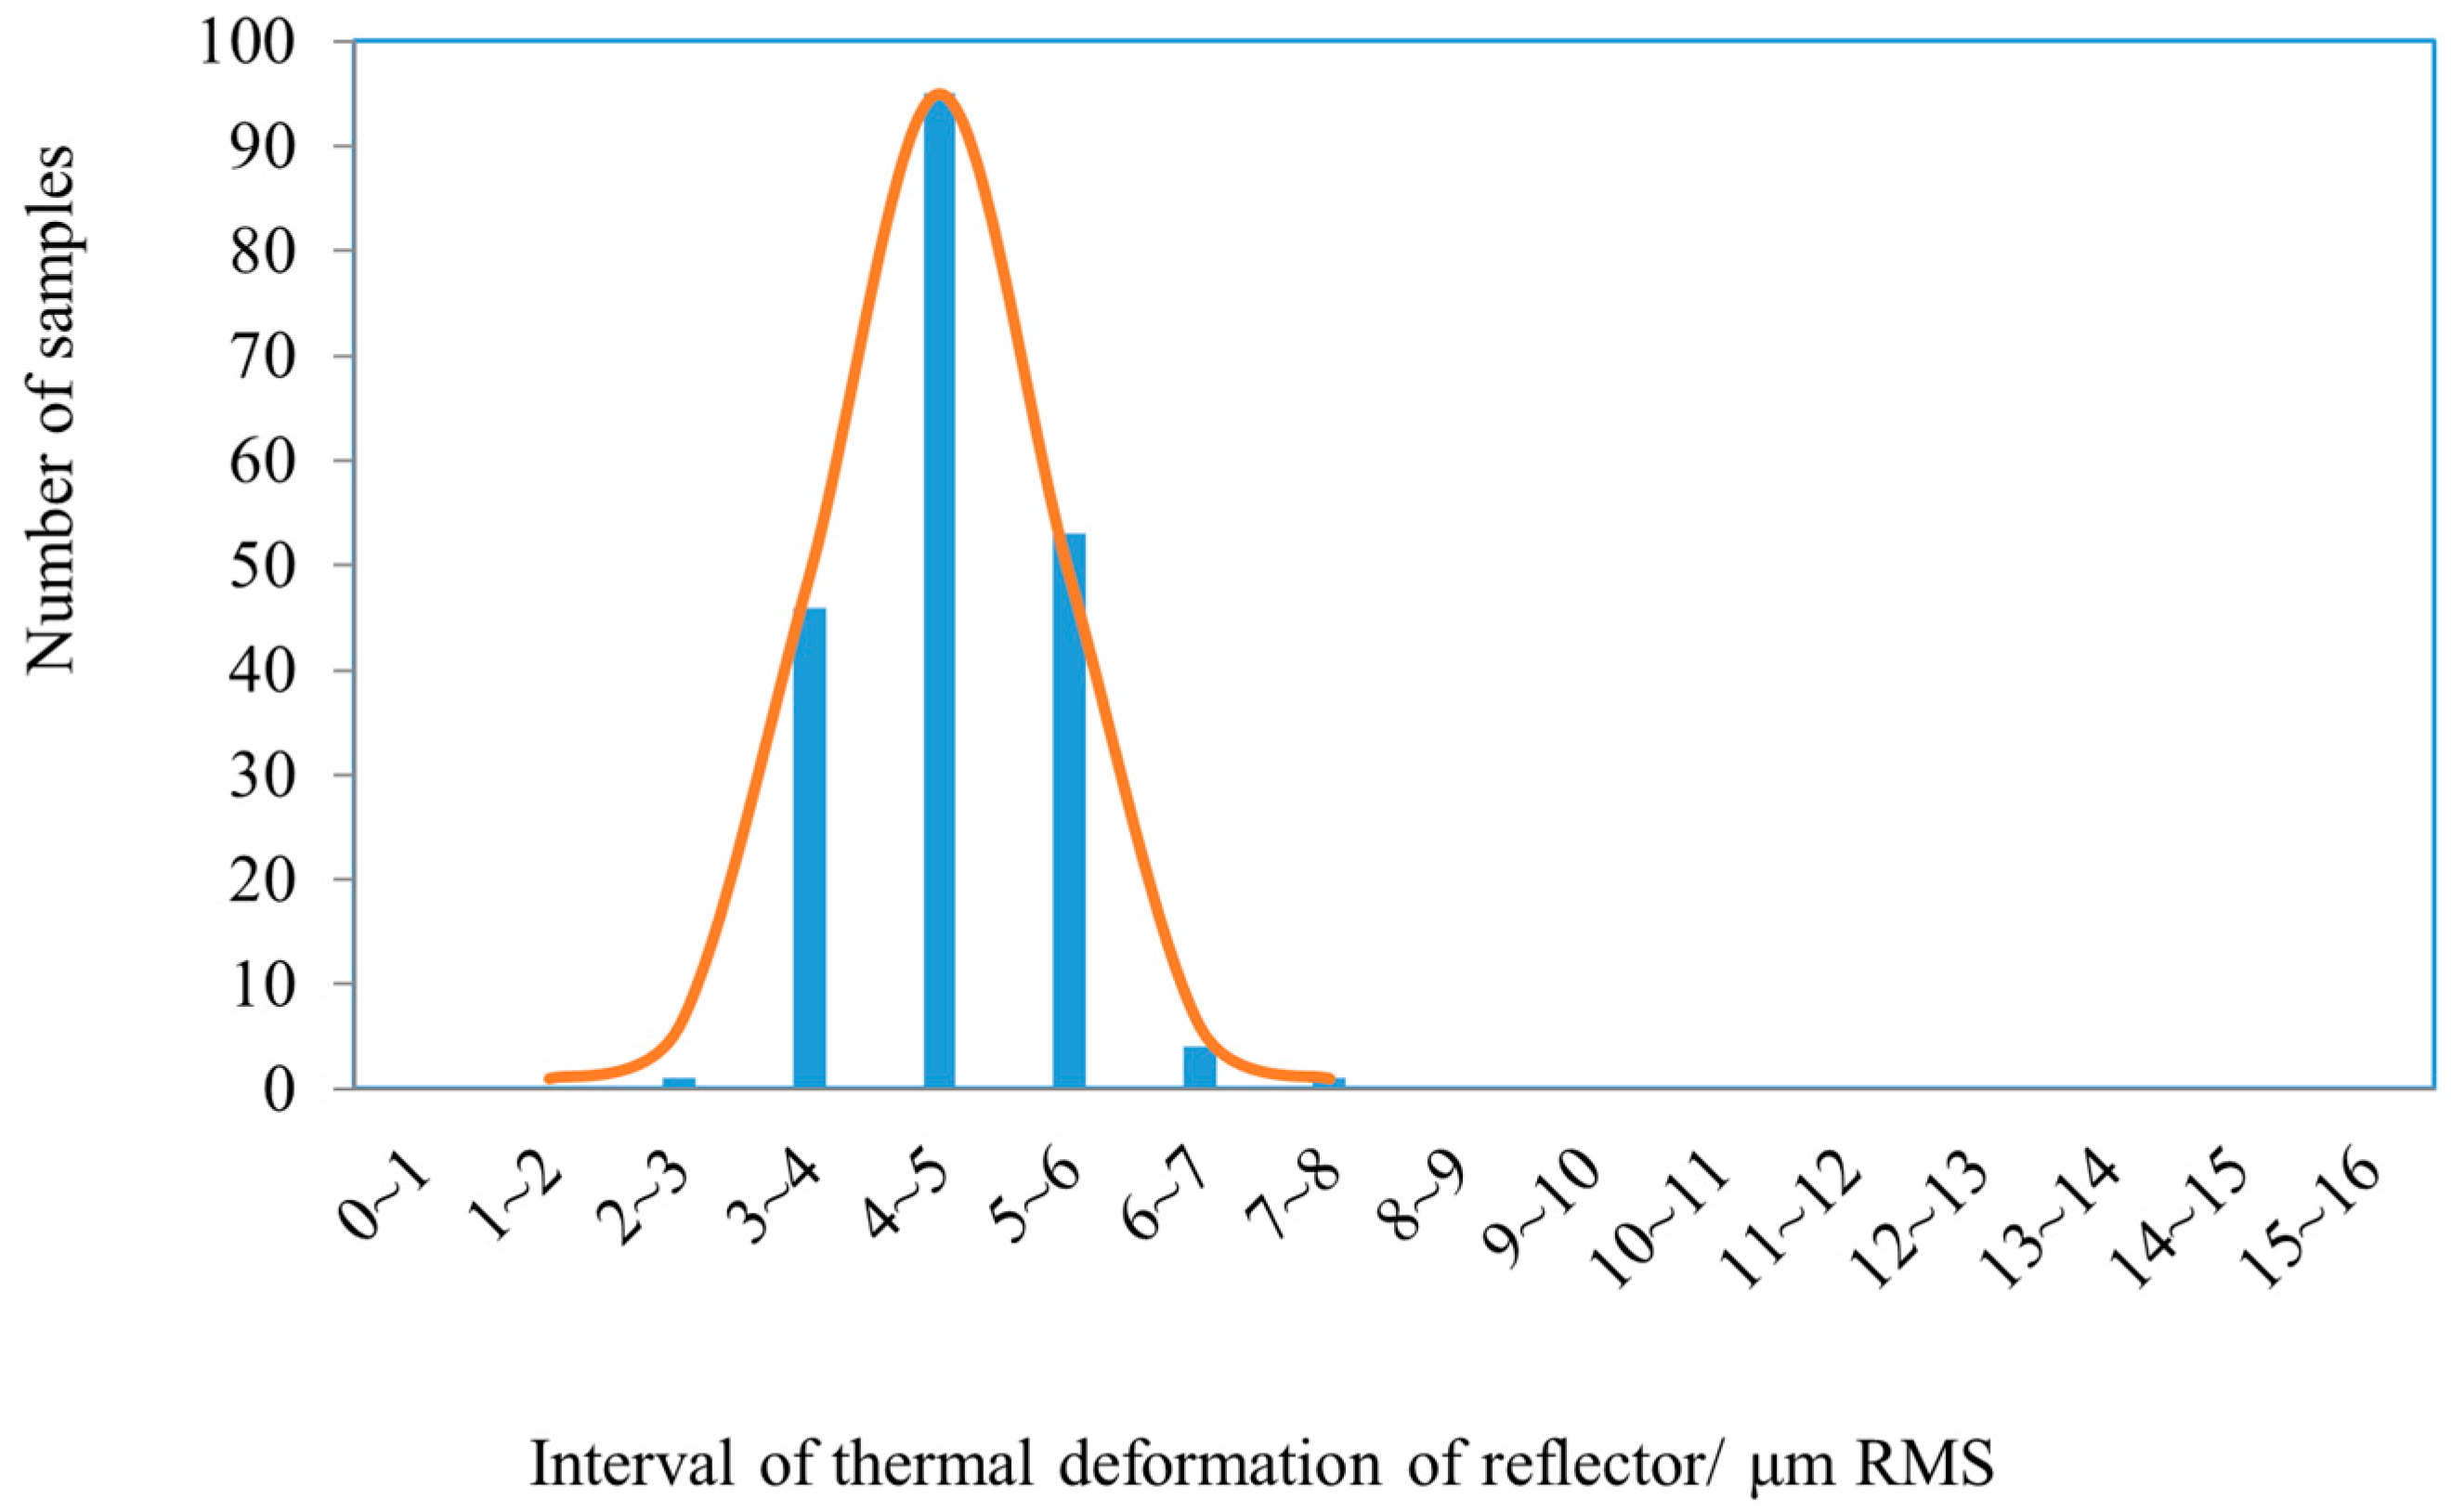
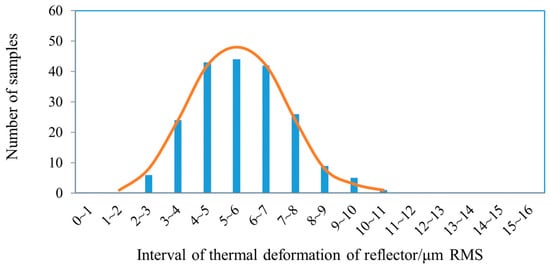
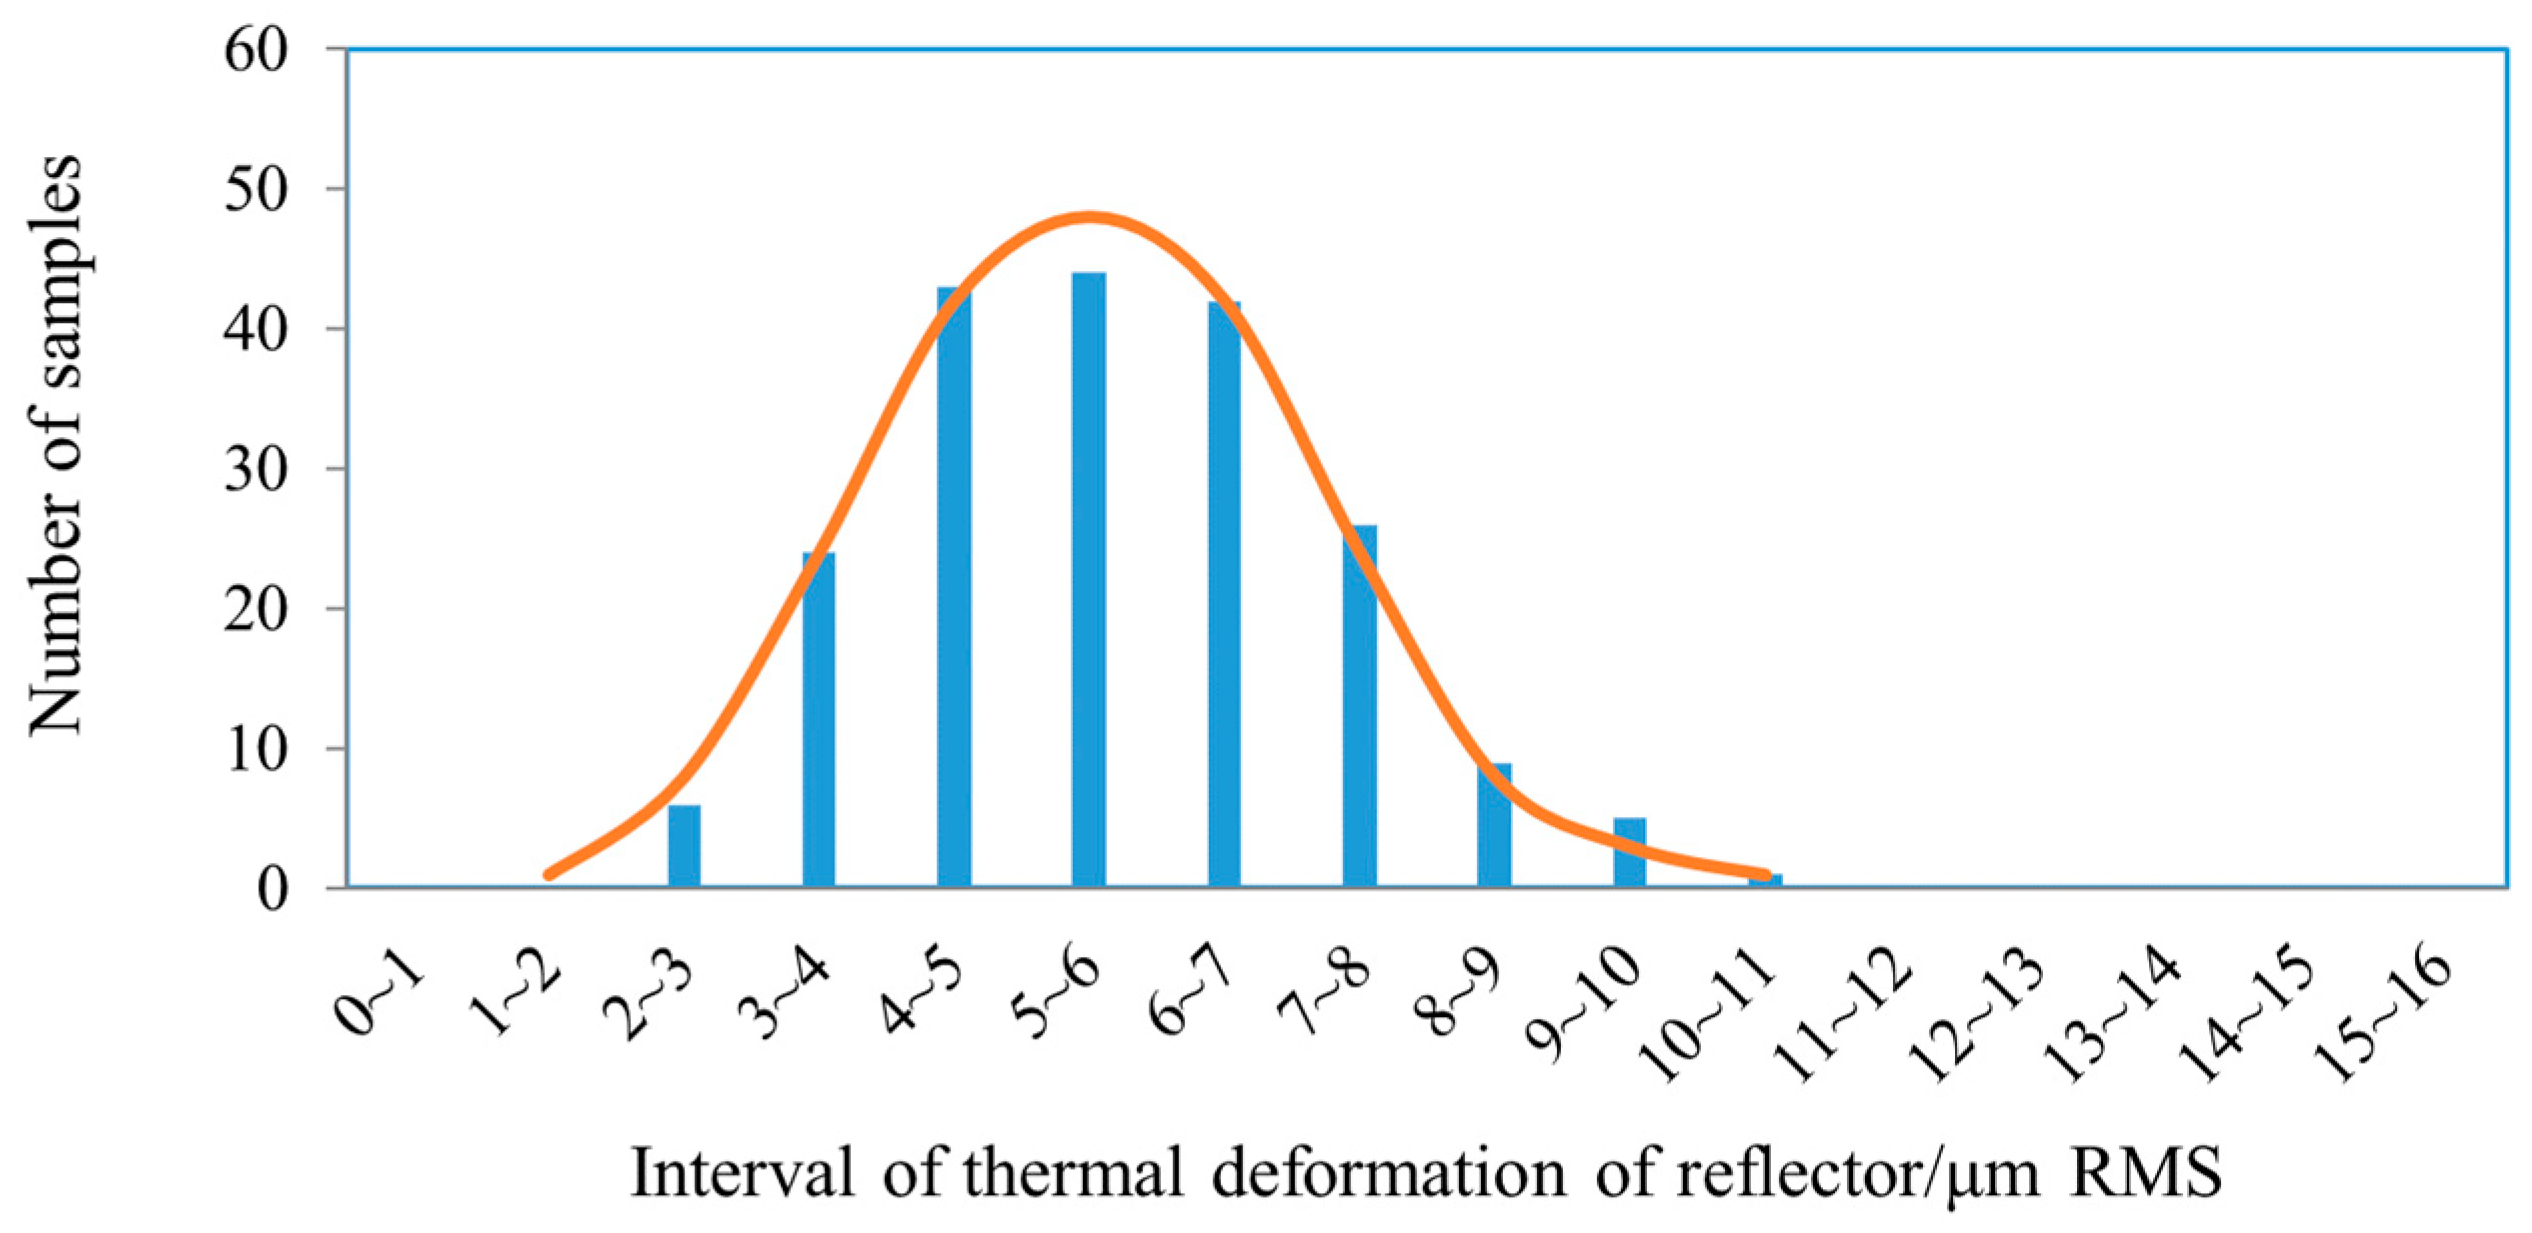
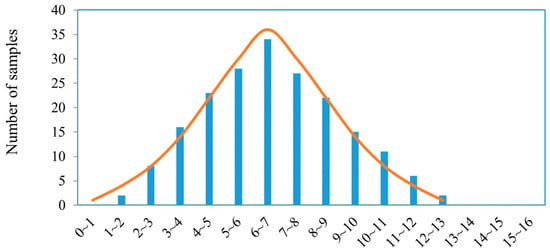
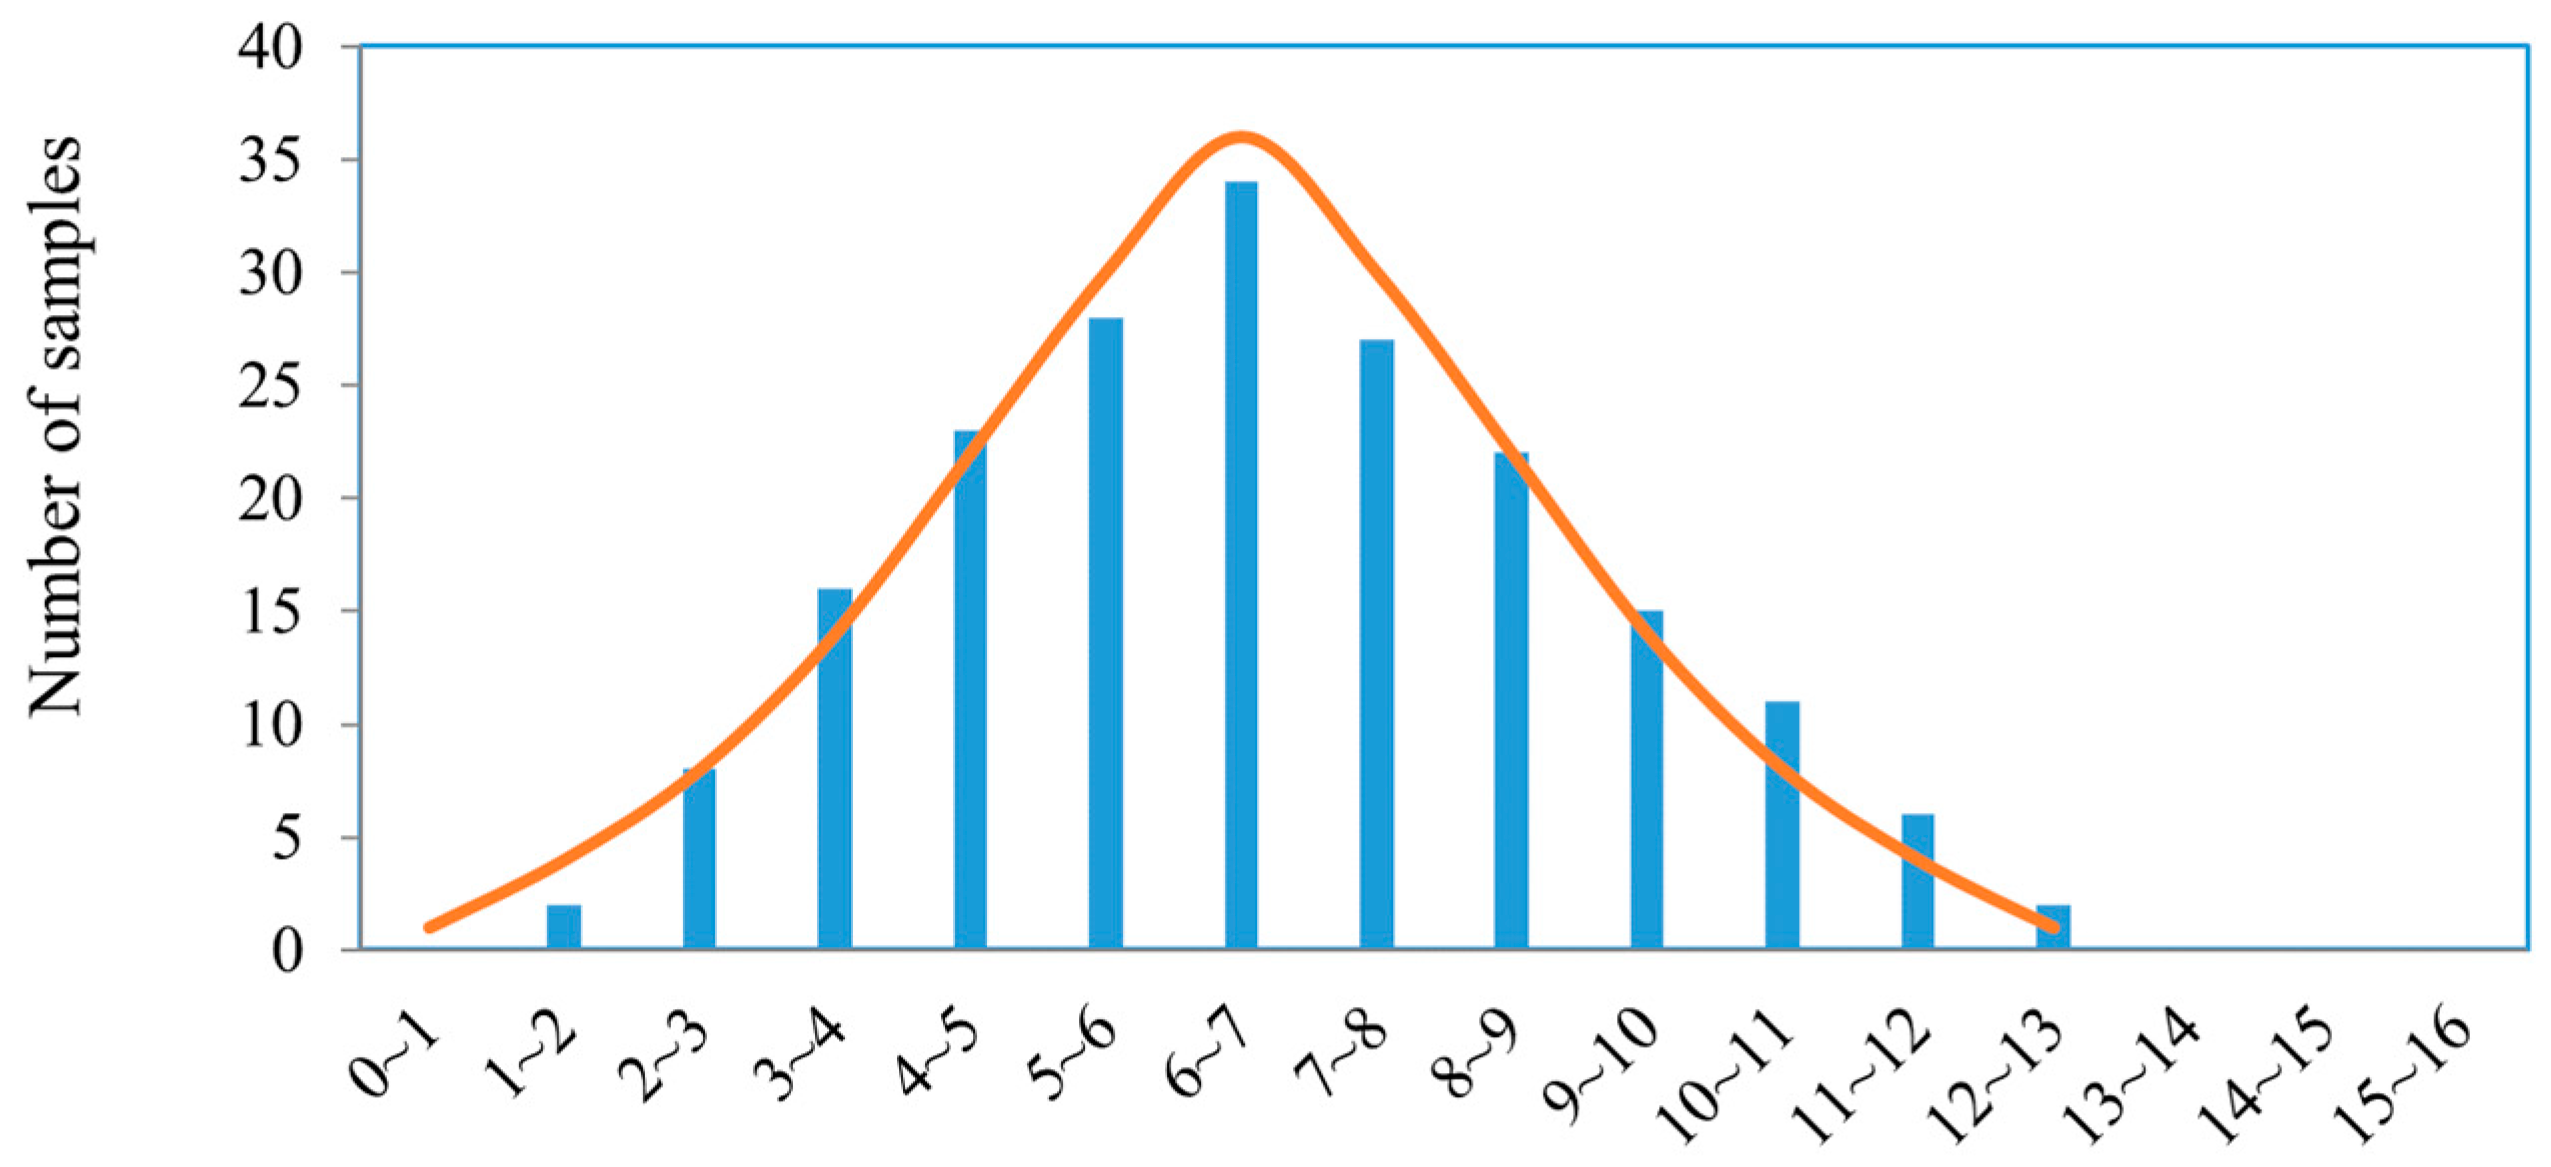
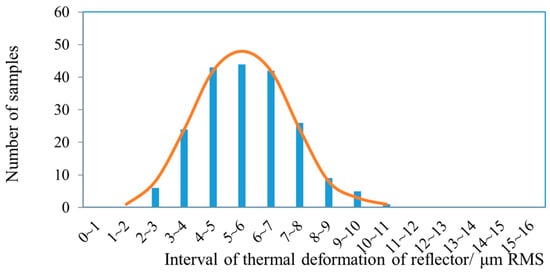
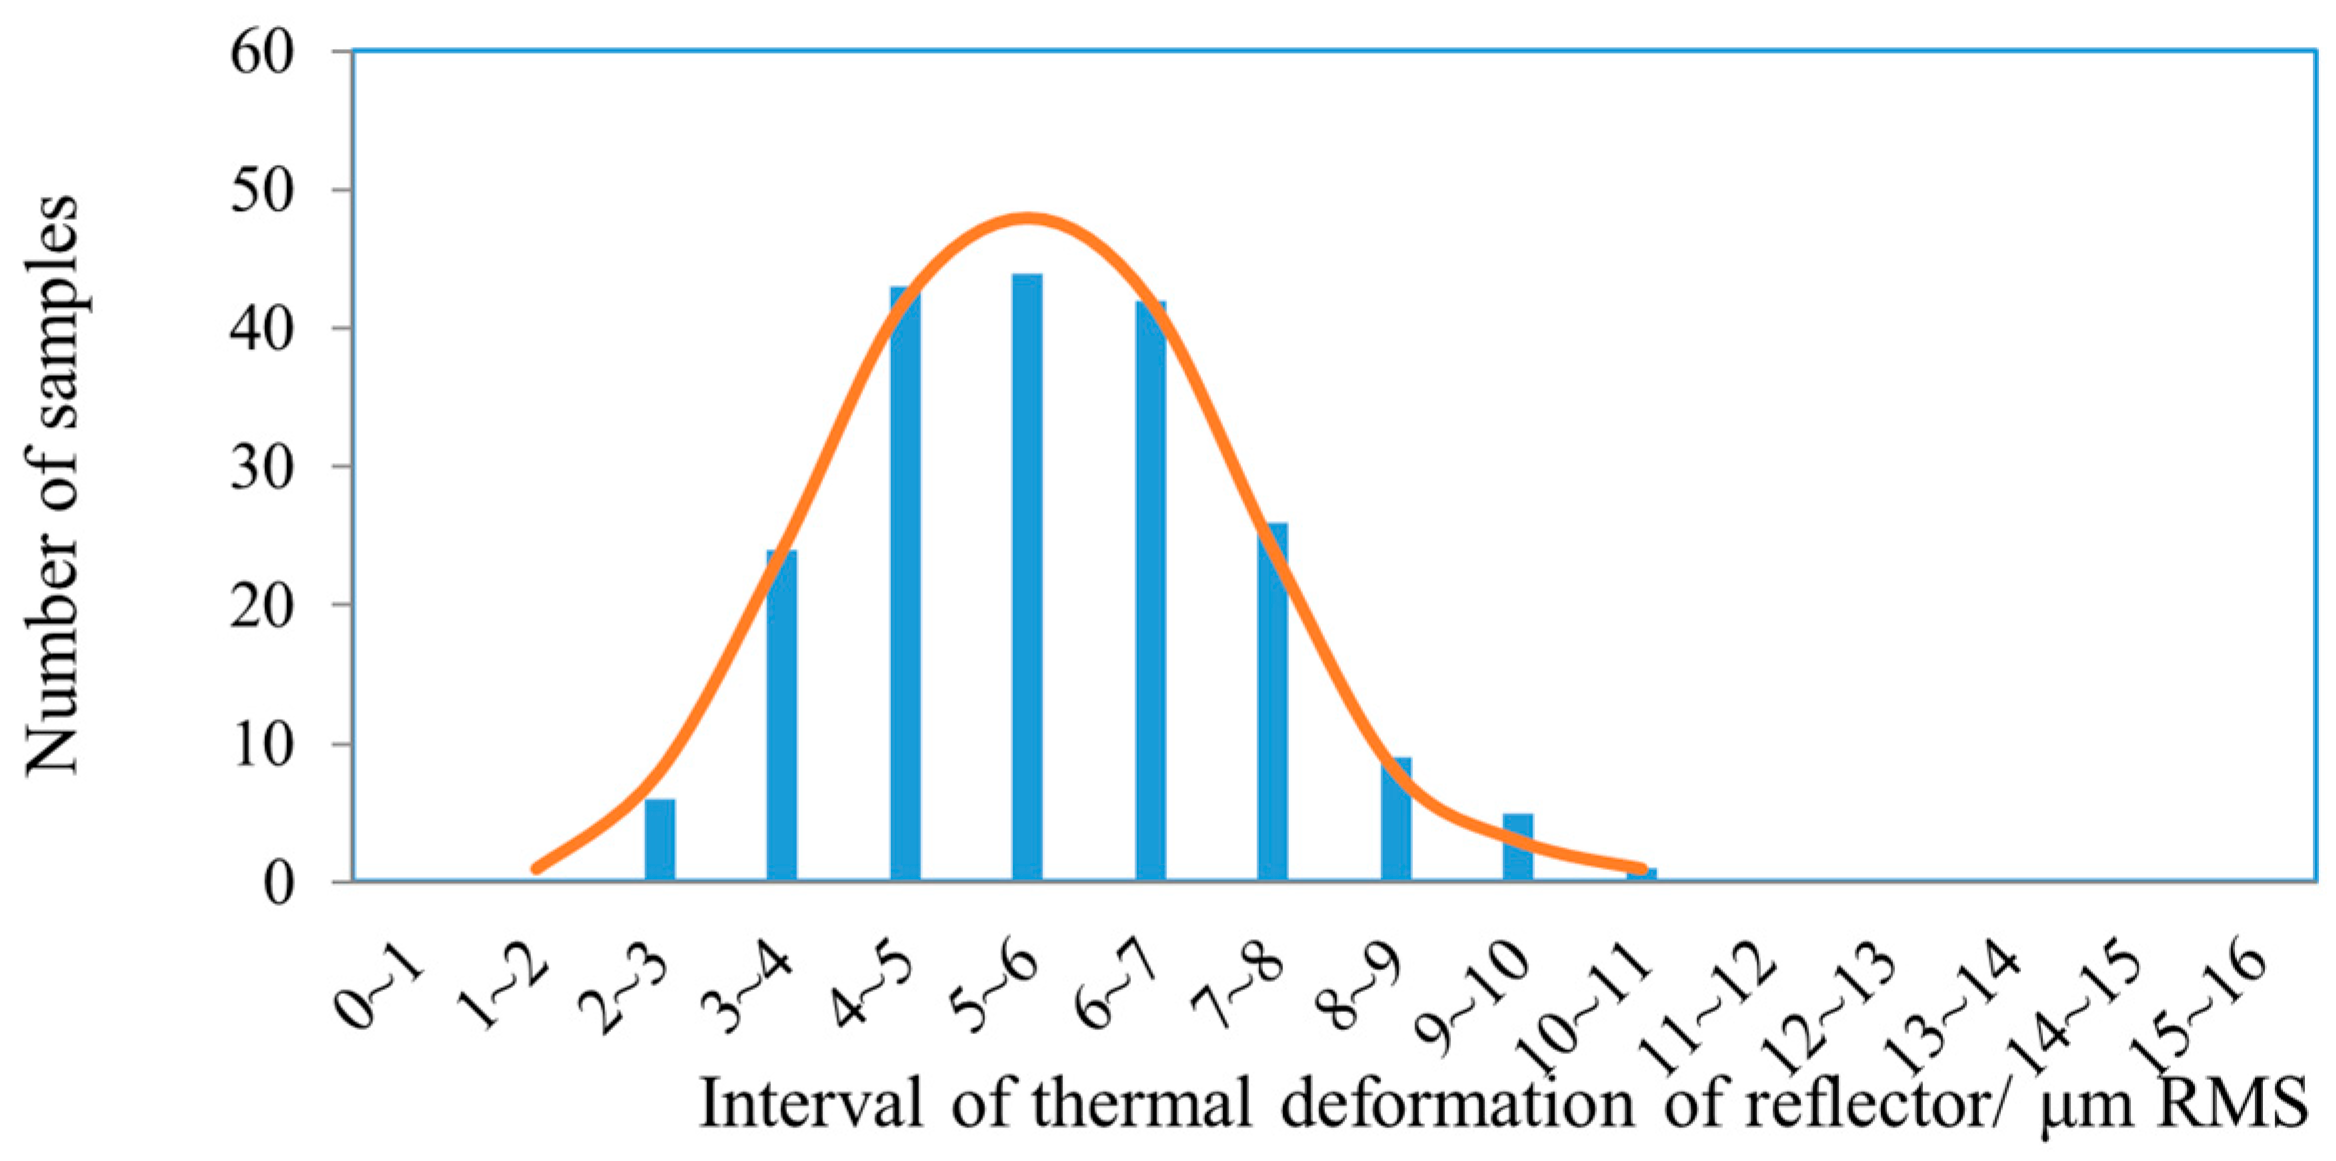
Results of the thermal coupling deformation of the reflector under different ply angle deviations are shown in Figure 12, which shows that the effect of thermal coupling deformation deteriorates as the ply angle deviation increases. The specific results of the thermal coupling deformation under different ply angle deviations are shown in Figure 13, Figure 14, Figure 15 and Figure 16. Here, the number of random-sampling samples is 200. When the deviation of the ply angle is ±0.5°, the sample mean of the thermal coupling deformation is 4.6 μm RMS, which is 9.5% larger than the theoretical value 4.2 μm RMS, and the interval of the thermal coupling deformation of the reflector is 2.9 μm RMS to 7.1 μm RMS. Therefore, the ply angle deviation of the reflector should be controlled to ±0.5° during manufacturing.
Figure 12.
Thermal coupling deformation under different ply angle deviations.
Figure 13.
Distribution of thermal deformation samples for a ply angle deviation of ±0.5°.
Figure 14.
Distribution of thermal deformation samples for a ply angle deviation of ±1°.
Figure 15.
Distribution of thermal deformation samples for a ply angle deviation of ±1.5°.
Figure 16.
Distribution of thermal deformation samples for a ply angle deviation of ±2°.
4.4. Product Thermal Deformation Simulation
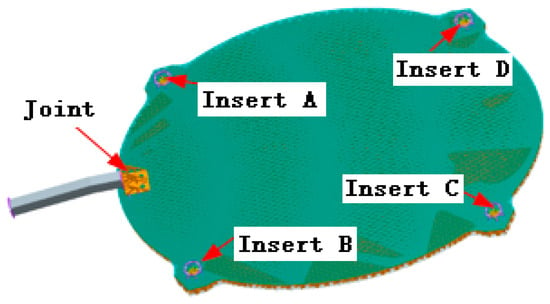
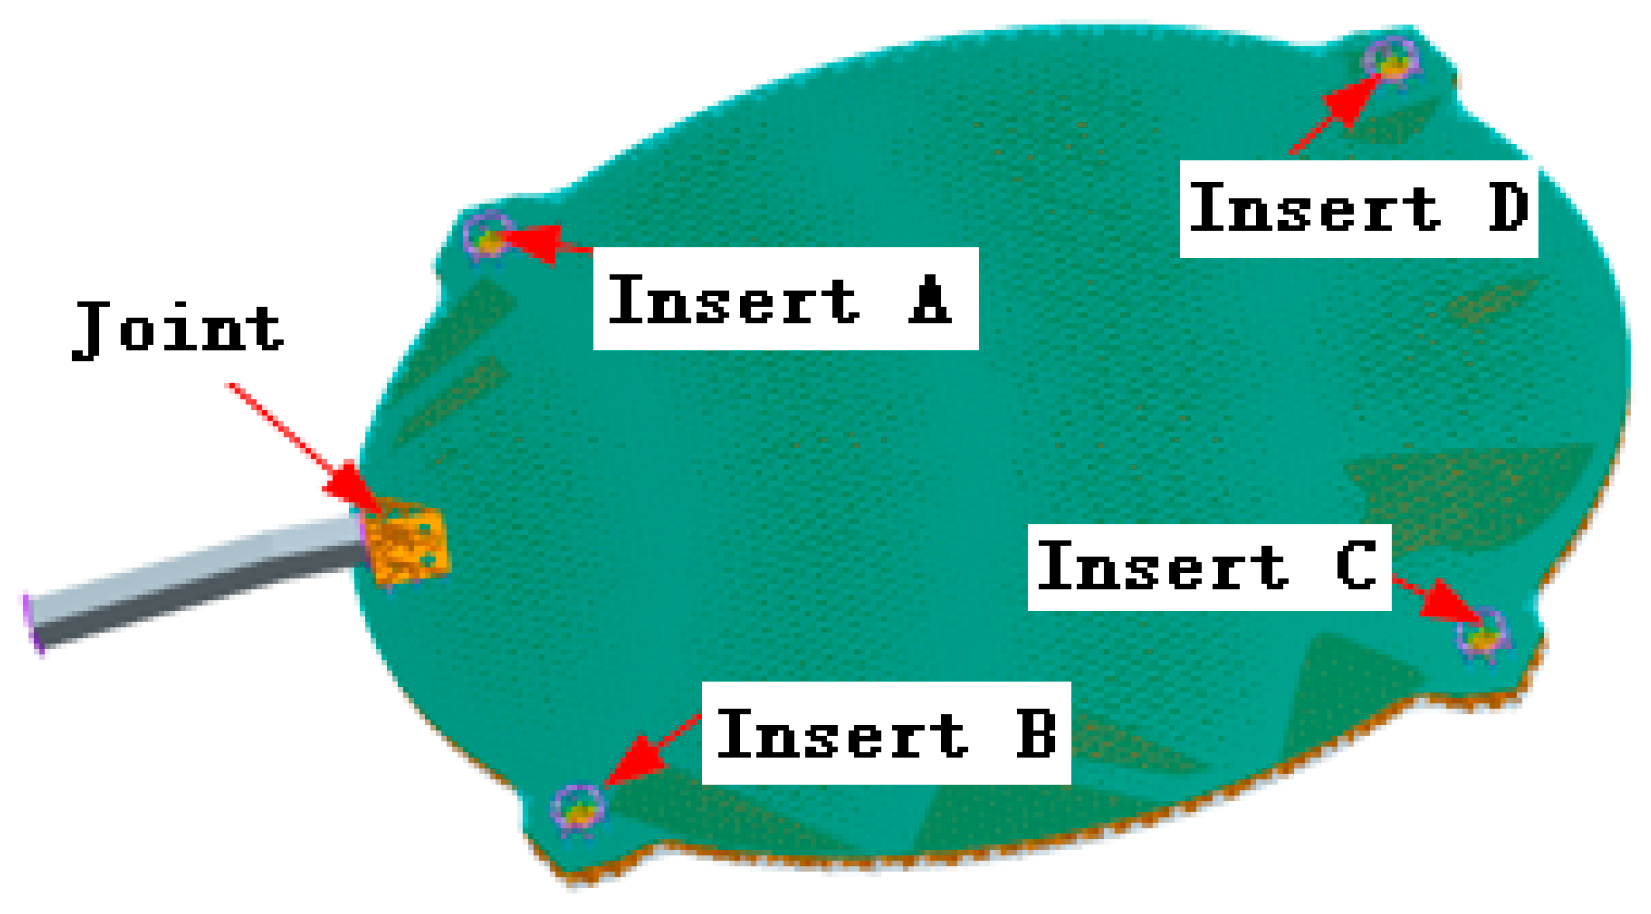
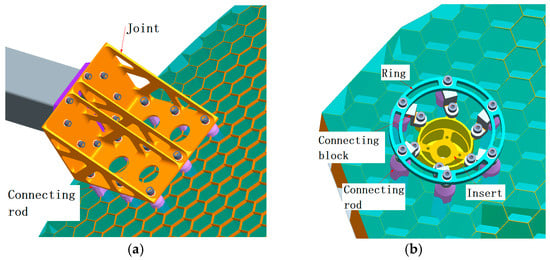
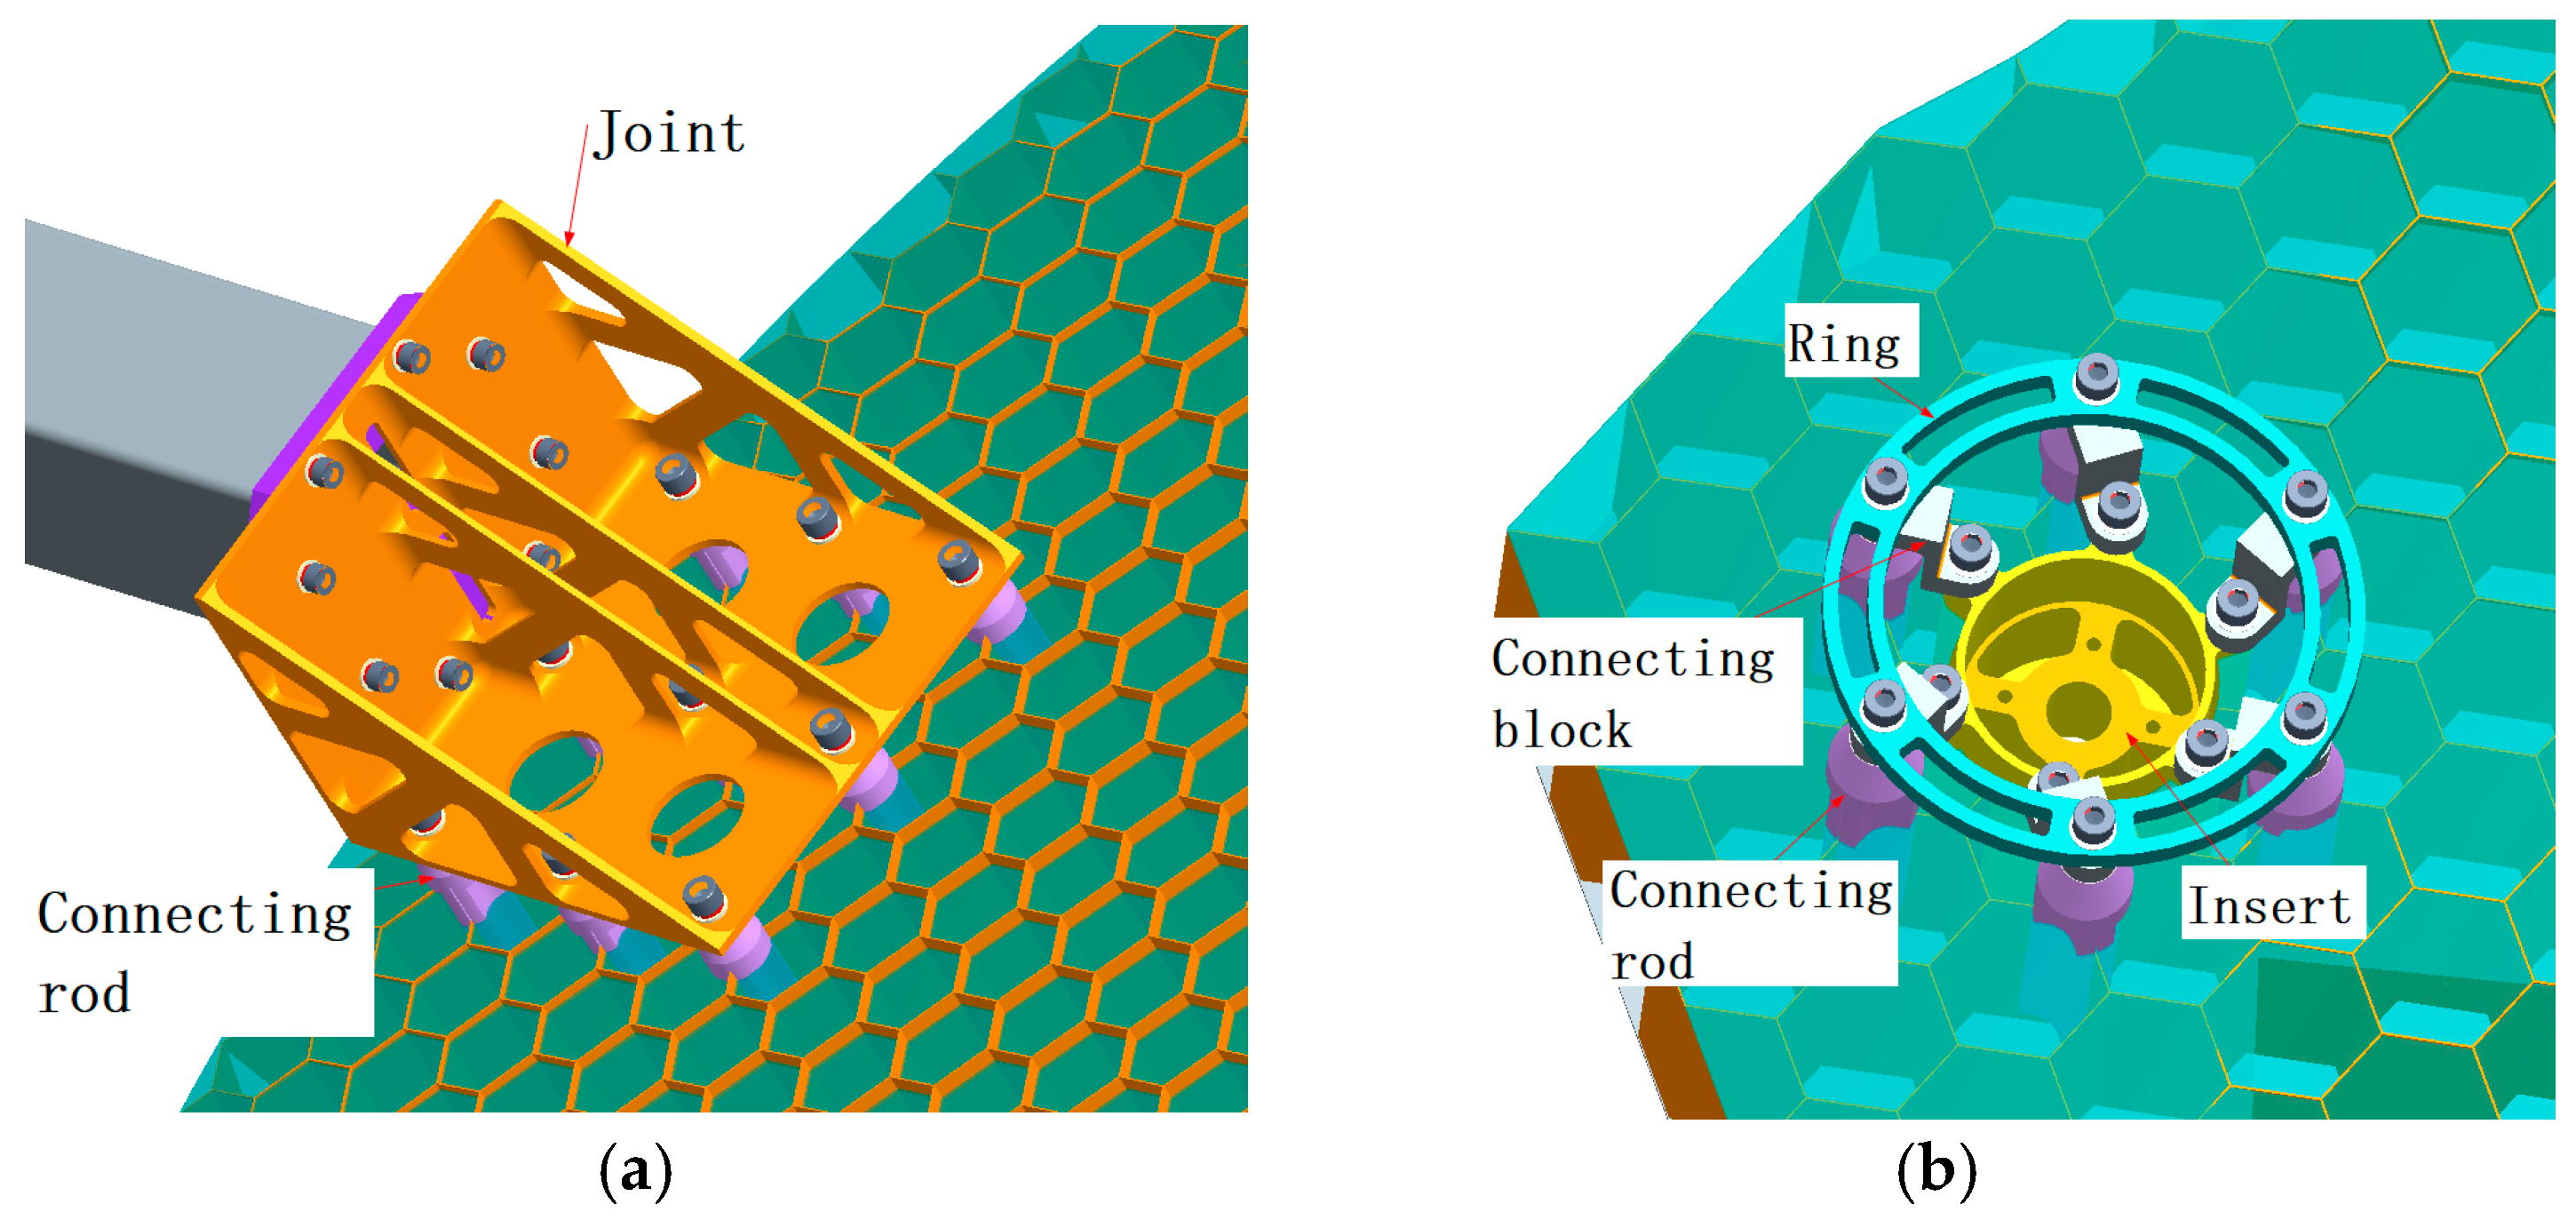
According to the above optimization results, a 3D model of the reflector with a weight of 14.6 kg is shown in Figure 17. To meet the requirements of locking and unfolding the reflector, a connection joint was designed with cross-sectional dimensions of 90 mm × 90 mm, and its material was Invar alloy. Four embedded inserts were also designed with a diameter of 50 mm, and their material was titanium alloy. The structure of the joint and the inserts is shown in Figure 18. The joint was connected with the shell of the reflector by nine connecting rods. The inserts were embedded in the shell, and the surrounding regions were filled with foam adhesive. The inserts were also reinforced by six connecting rods. The ring connected the embedded insert to the connecting rod using six connecting blocks, forming a stable structure. All connecting rods were inserted into and bonded to the honeycomb core walls.
Figure 17.
Three-dimensional structural model of the reflector (Note: a color represents a part).
Figure 18.
The model of the connecting structure. (a) Structure of the joint. (b) Structure of the insert (Note: a color represents a part).
The reflector was meshed by shell elements, and the center point of the reflector upper-skin sheet with 6 degrees of freedom was constrained during analysis. The reference temperature was set to 20 °C, and the thermal coupling deformation was calculated using Equation (1). Here, (xi, yi, zi) in Equation (1) denote the theoretical coordinates of the reflector surface in the reference configuration.
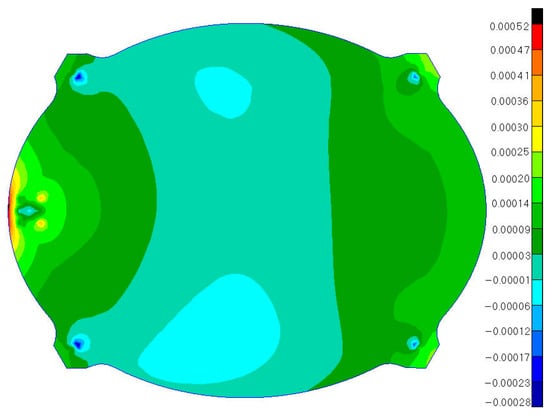
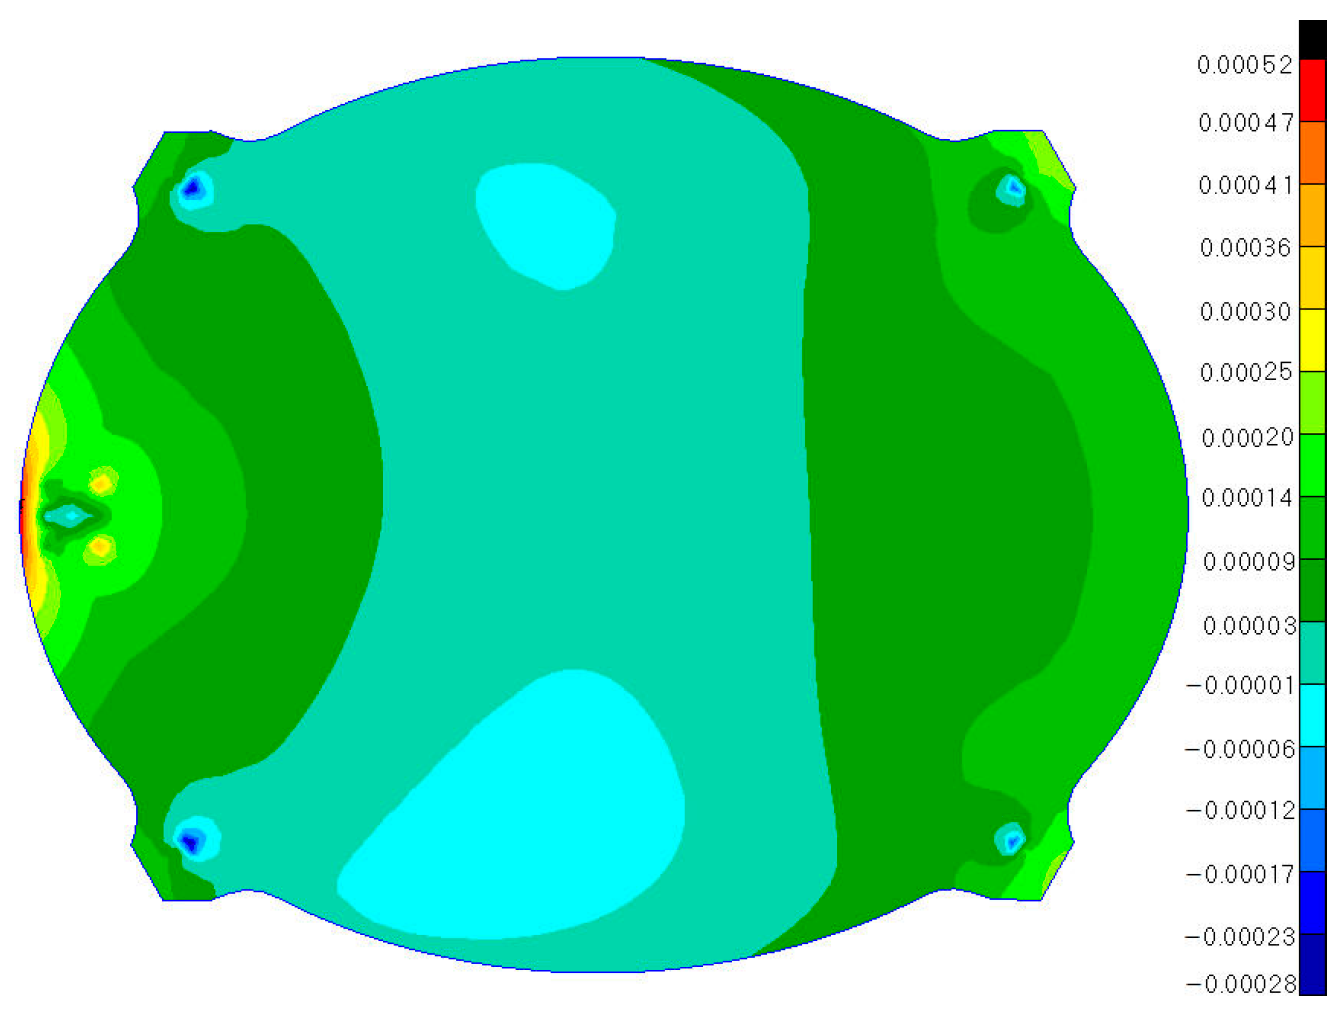
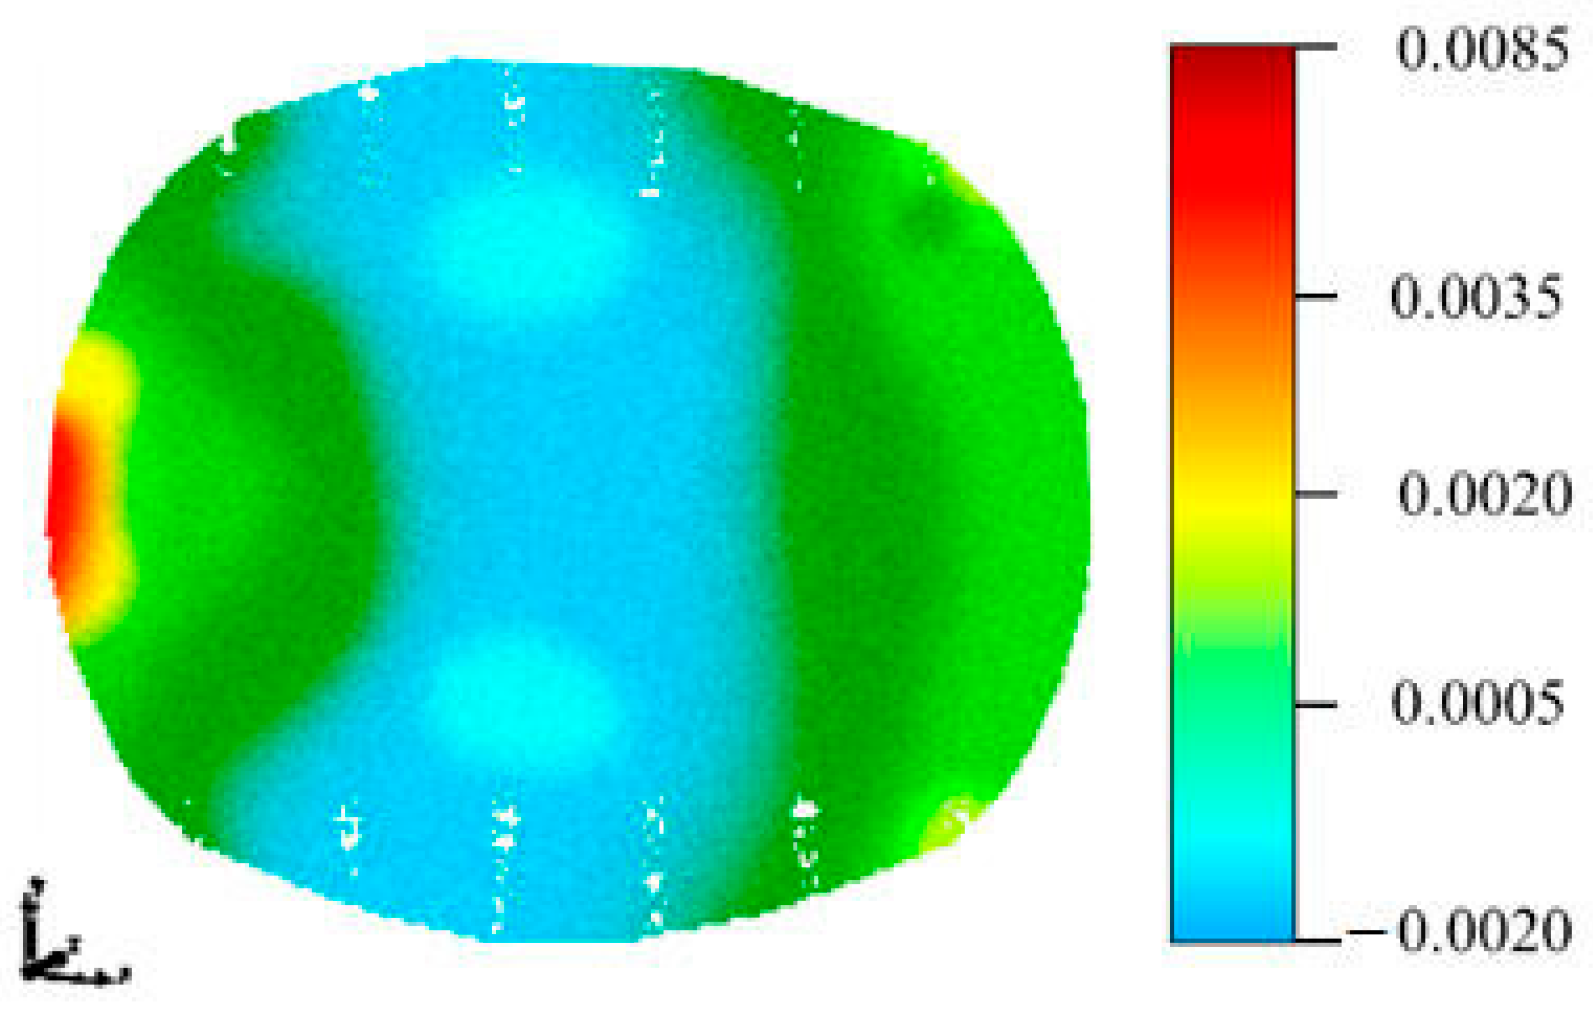
Considering the influence of joints and embedded inserts on the thermal deformation, the thermal coupling deformation at uniform temperatures of +120 °C and −120 °C was, respectively, 4.2 μm RMS and 5.9 μm RMS without applying a best-fit procedure, which meets the requirements of an RMS lower than 8 μm. Deformation diagrams are shown in Figure 19 and Figure 20.
Figure 19.
Thermal deformation contour at +120 °C.
Figure 20.
Thermal deformation contour at −120 °C.
Table 5 summarizes the influence of the connection joint and embedded inserts on thermal deformation. According to Table 4, the reflector thermal deformation was 4.1 μm, RMS when the joint and inserts were not included.
Table 5.
Influence of the joint and embedded inserts on thermal deformation at −120 °C.
4.5. Thermal Deformation Testing and Analysis
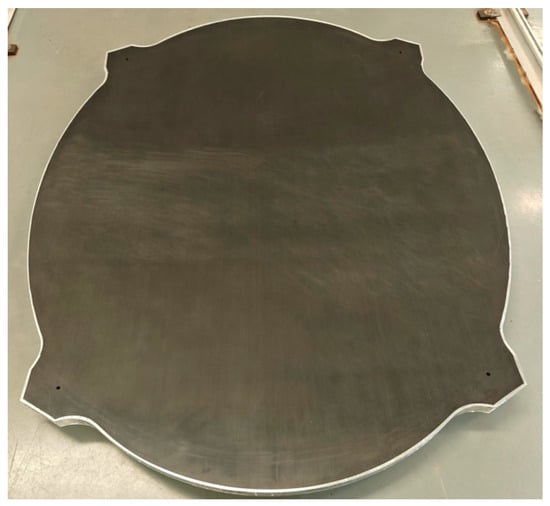
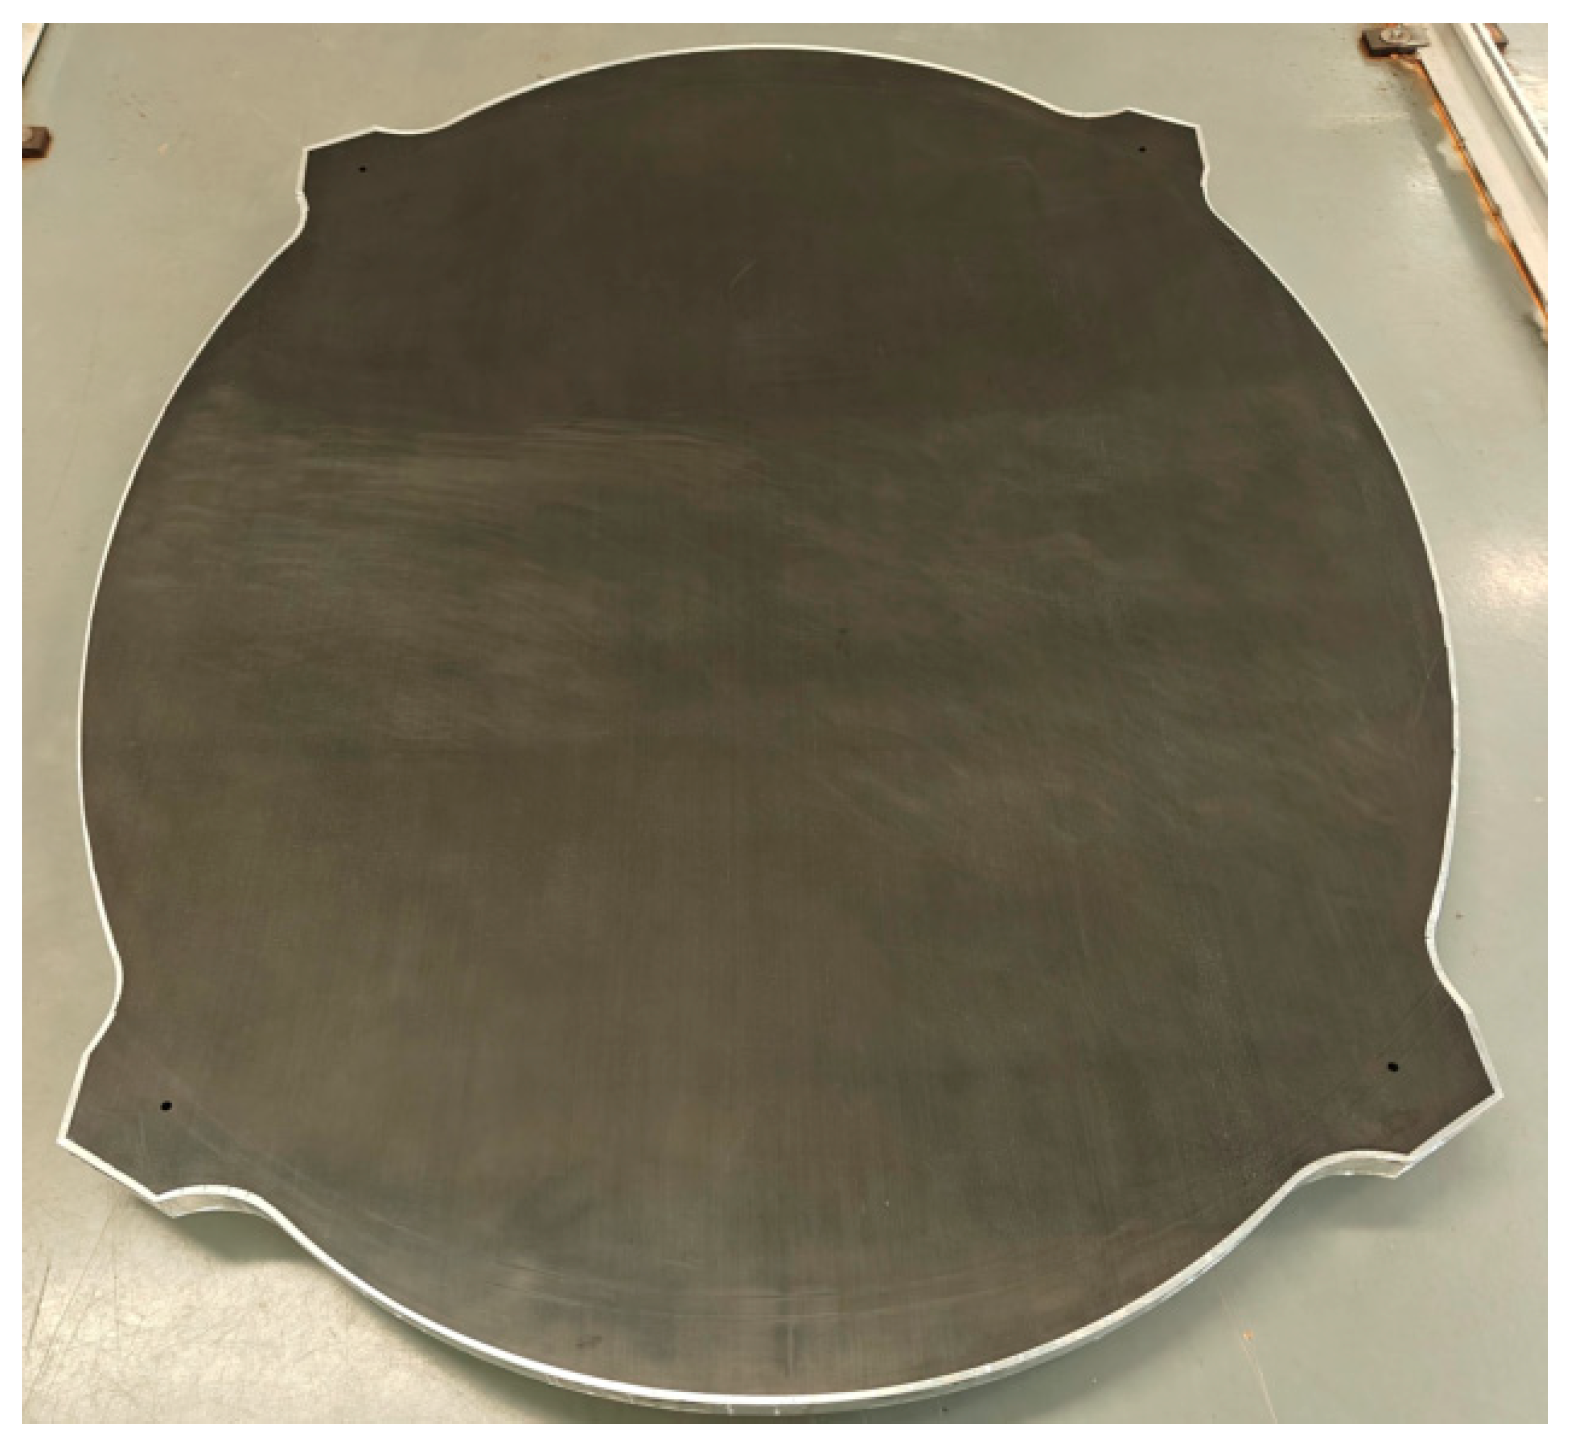
An engineering prototype of the carbon fiber honeycomb core reflector is shown in Figure 21. The reflector aperture is 2 m × 1.6 m.
Figure 21.
Engineering prototype of the carbon fiber honeycomb core reflector.
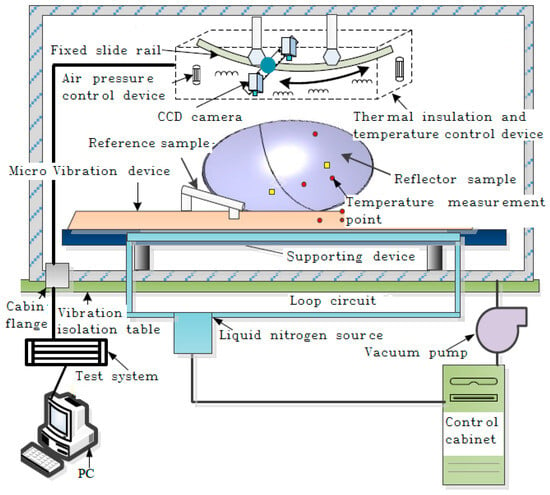
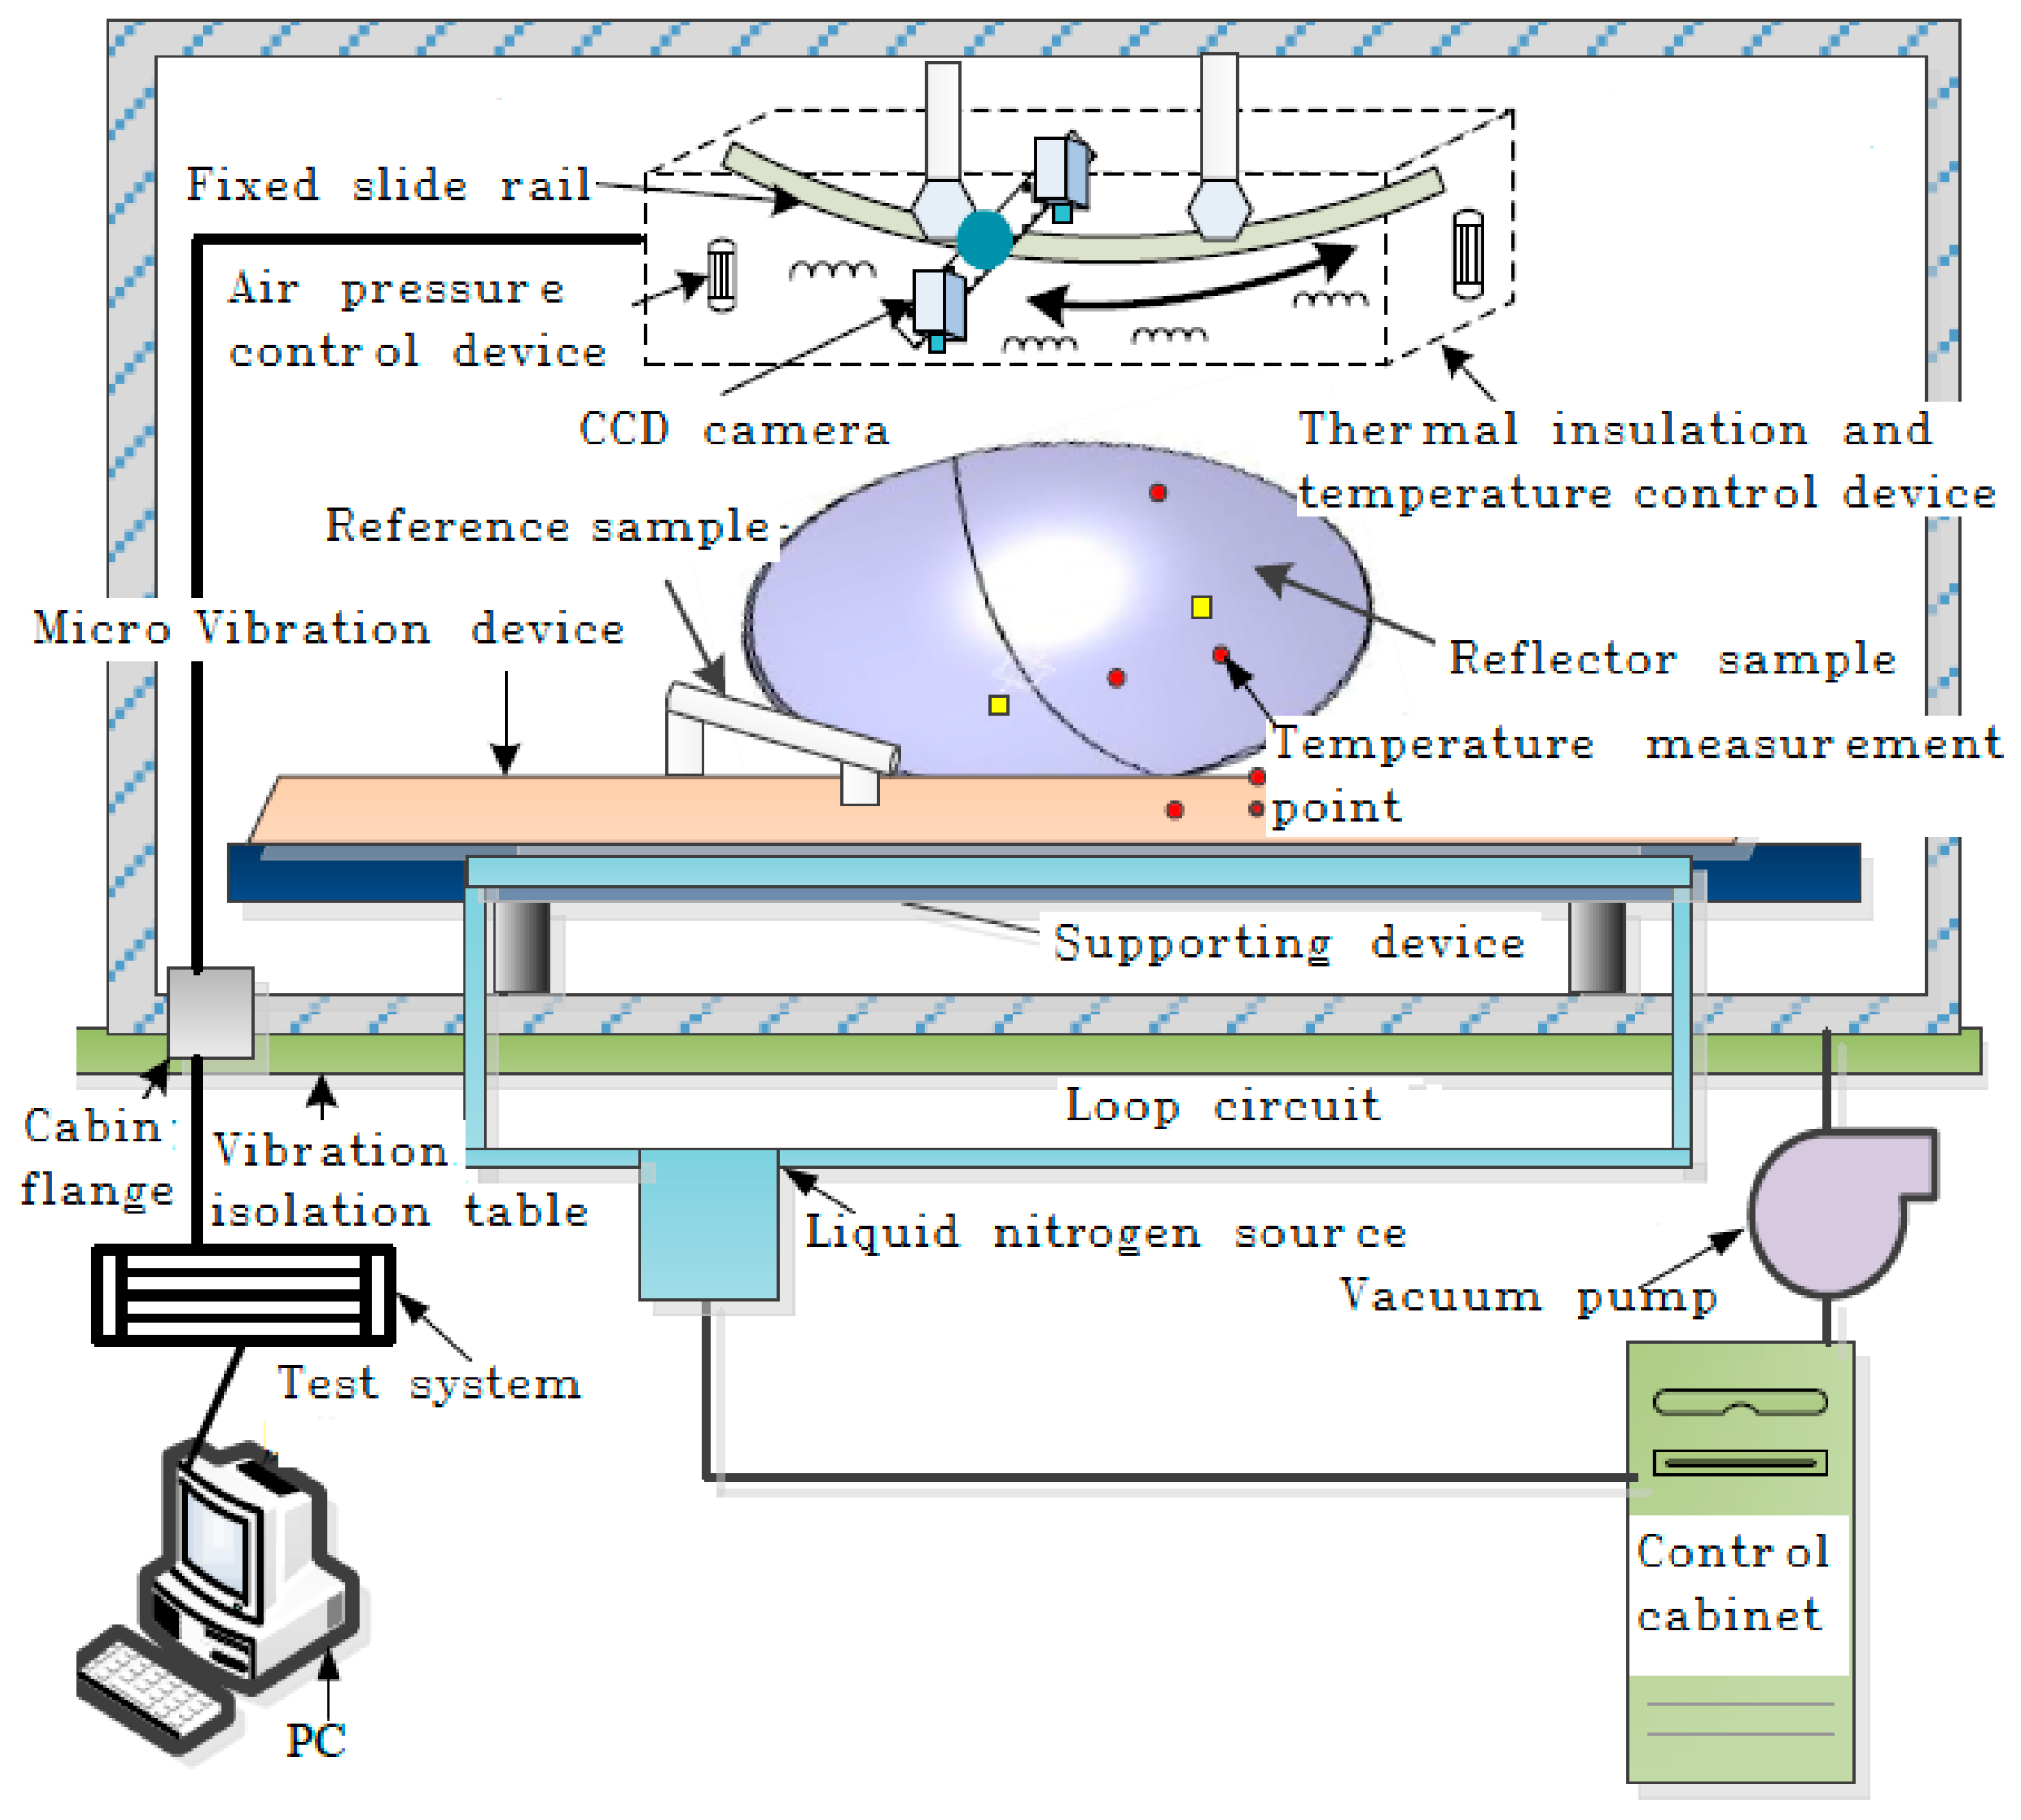
Thermal deformation tests of the reflector at +120 °C and −120 °C were conducted at Beijing Spacecraft Manufactory Co., Ltd. (Beijing, China). The testing system is shown in Figure 22.
Figure 22.
Thermal deformation testing system for the engineering prototype.
To verify the accuracy of the testing system, the reflector thermal deformation was measured using some standard samples. The comparison results between the theoretical deformation value and test value are shown in Table 6. According to the table, the maximum deviation within the temperature range of −120 °C to +120 °C was 2.8 μm, and the measurement accuracy of the testing system was 2.5 μm RMS.
Table 6.
Accuracy verification of the testing system.
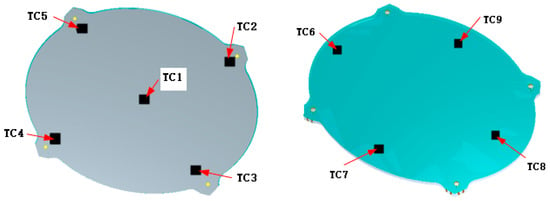
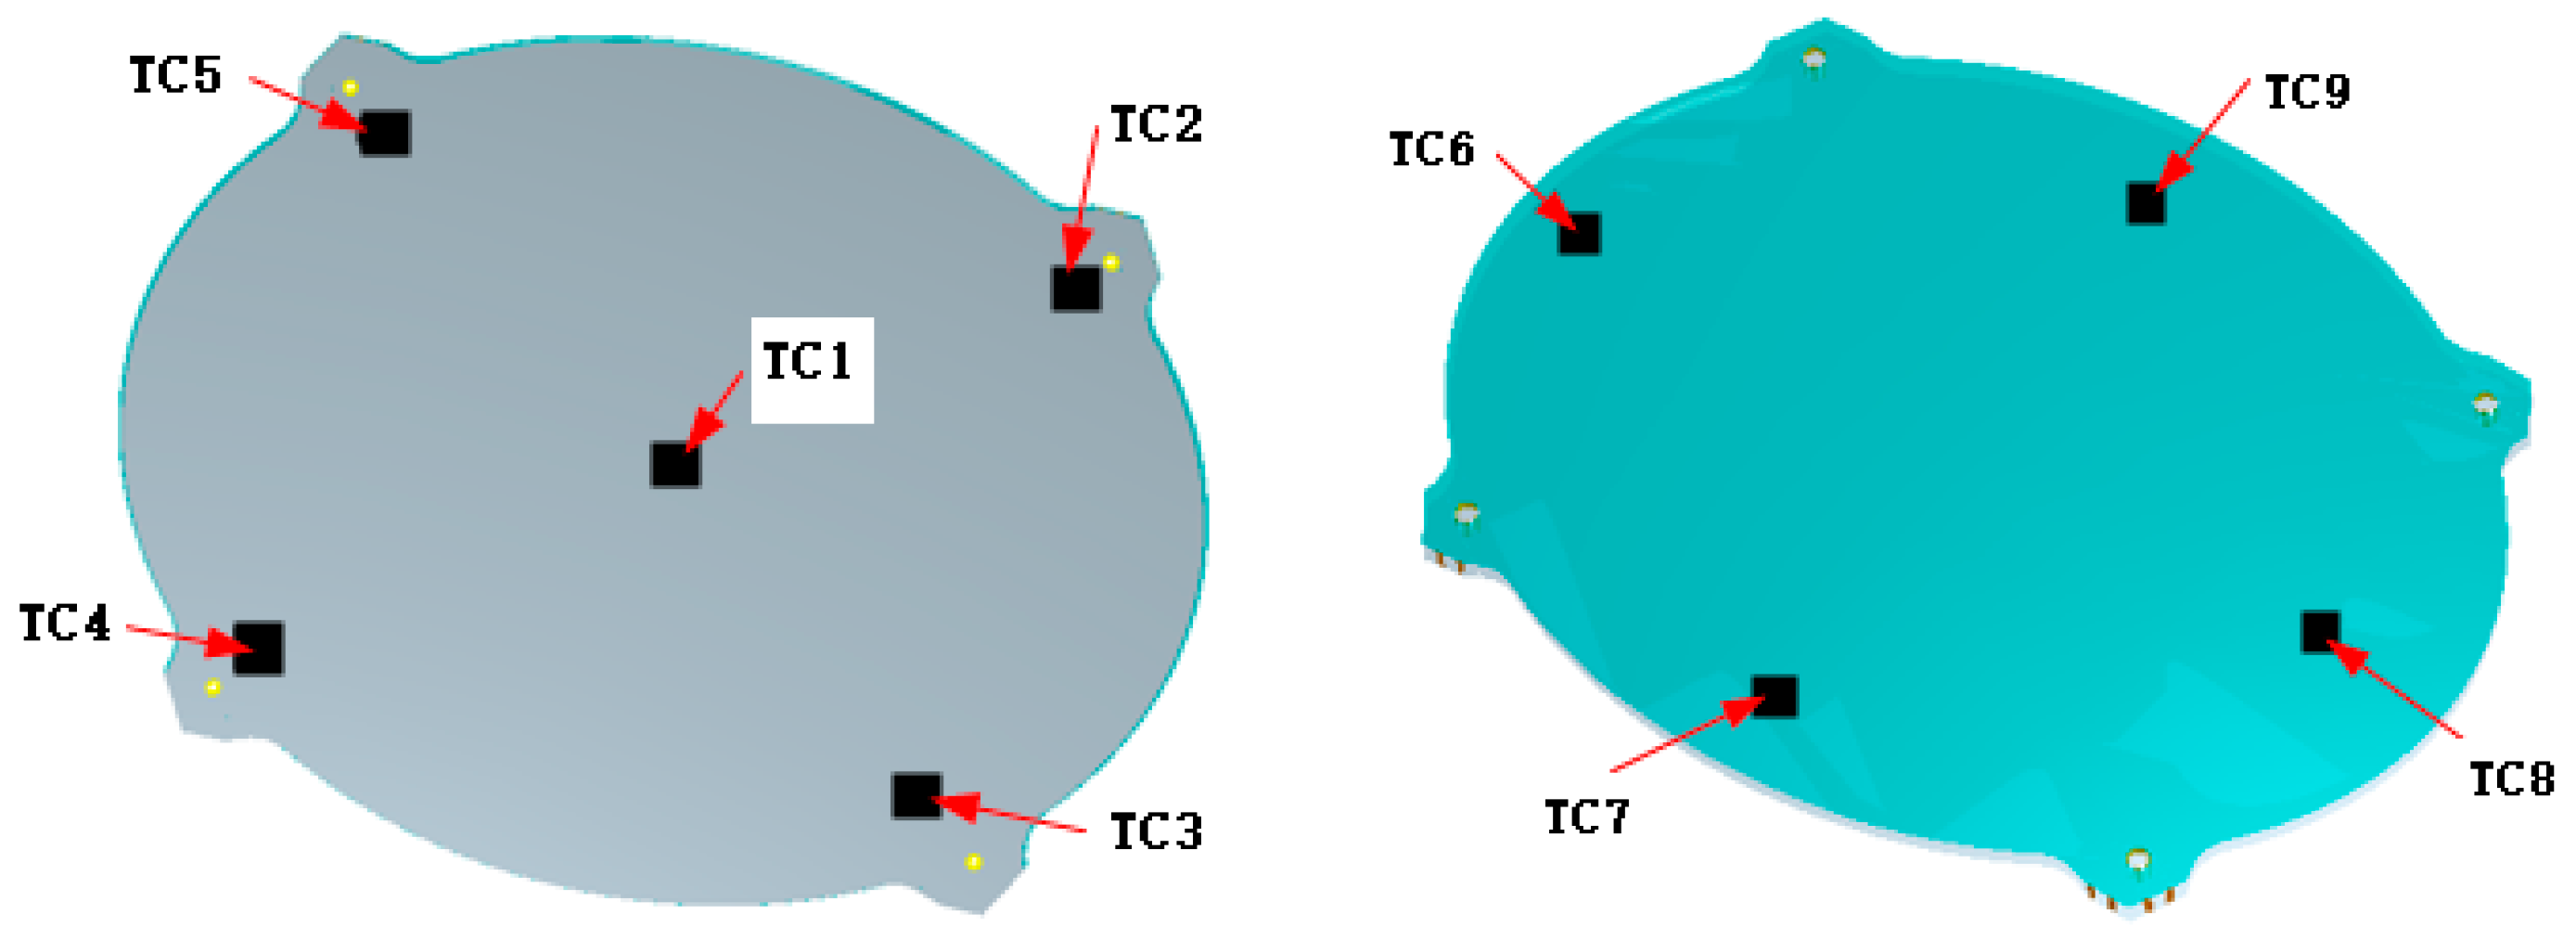
A test fixture was designed and manufactured to meet the accuracy requirements of the reflector thermal deformation test. The fixture conforms to the rear-surface geometry of the reflector. The fixture’s own thermal deformation does not induce deformation in the reflector. Before the thermal deformation test, the reflector underwent a thermal vacuum test to release absorbed moisture and stabilize the structure. The distribution of the temperature-monitoring points is shown in Figure 23. To ensure a sufficiently uniform temperature field, the reflector was maintained at the target temperature for 6 h before measurement. Temperatures recorded at the nine monitoring points are listed in Table 7. The target temperatures of ±120 °C were achieved, with a maximum deviation of approximately 1.0 °C among the monitoring points.
Figure 23.
Distribution of temperature monitoring points.
Table 7.
Temperatures recorded at the nine monitoring points.
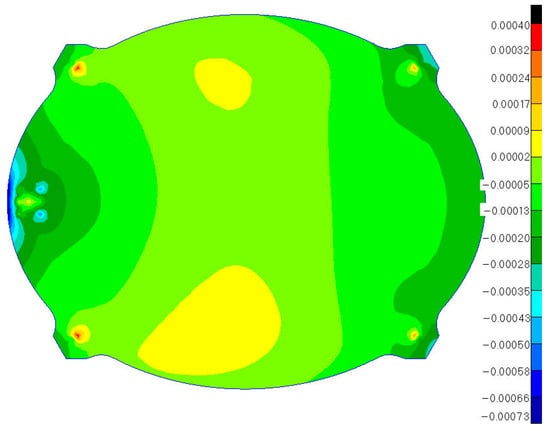
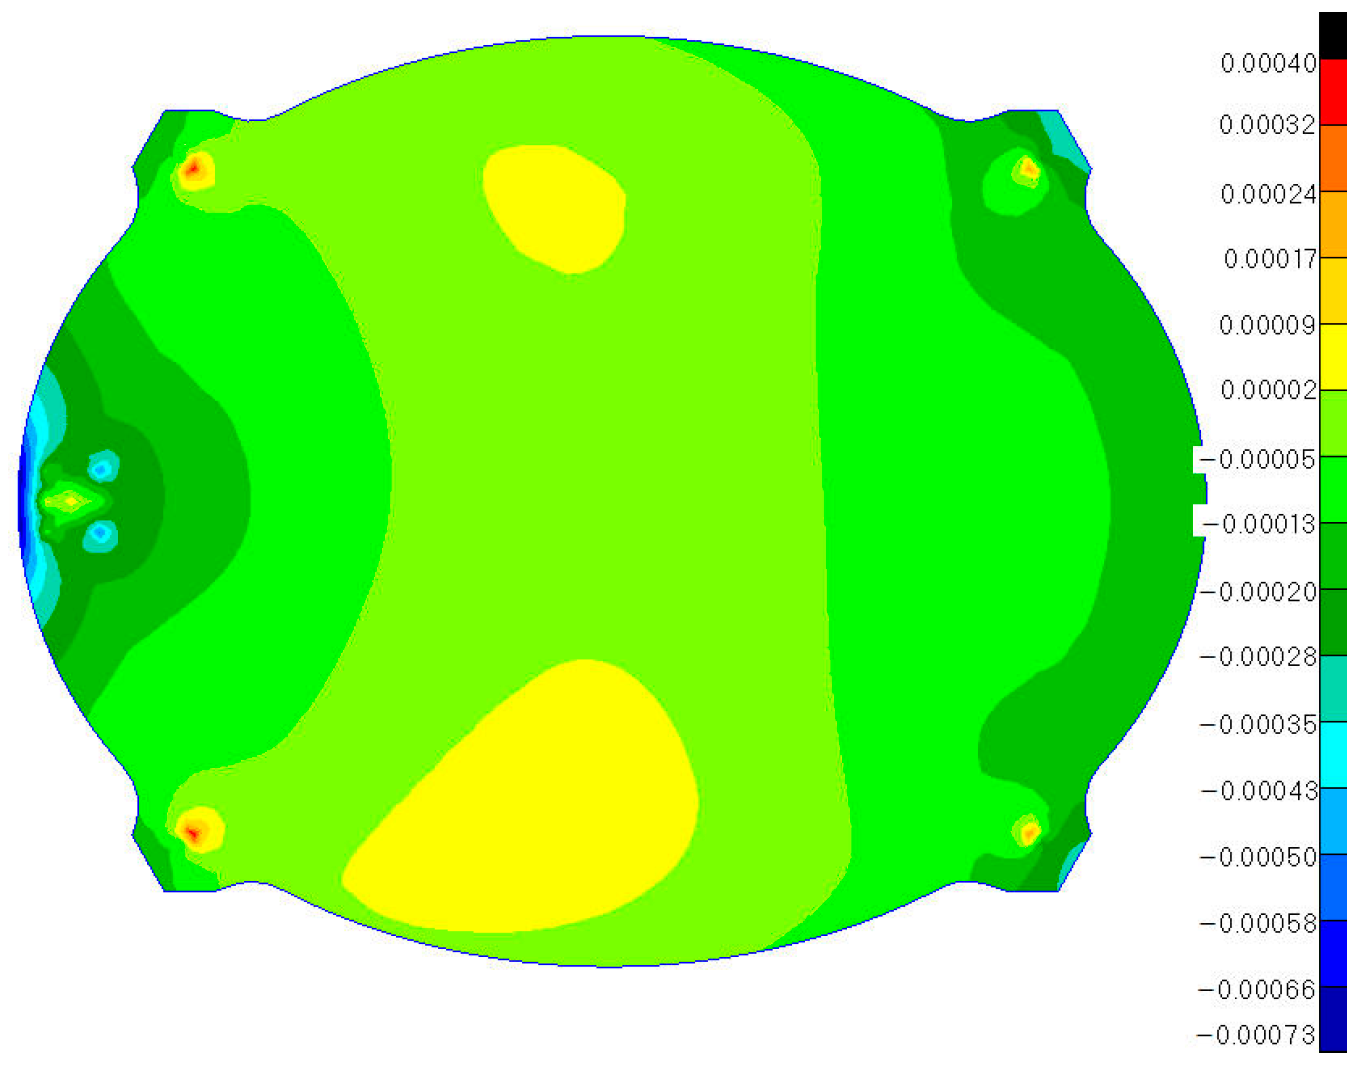
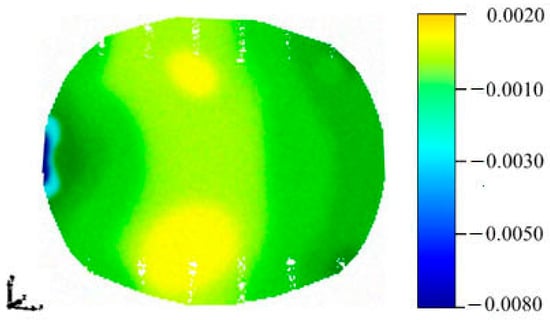
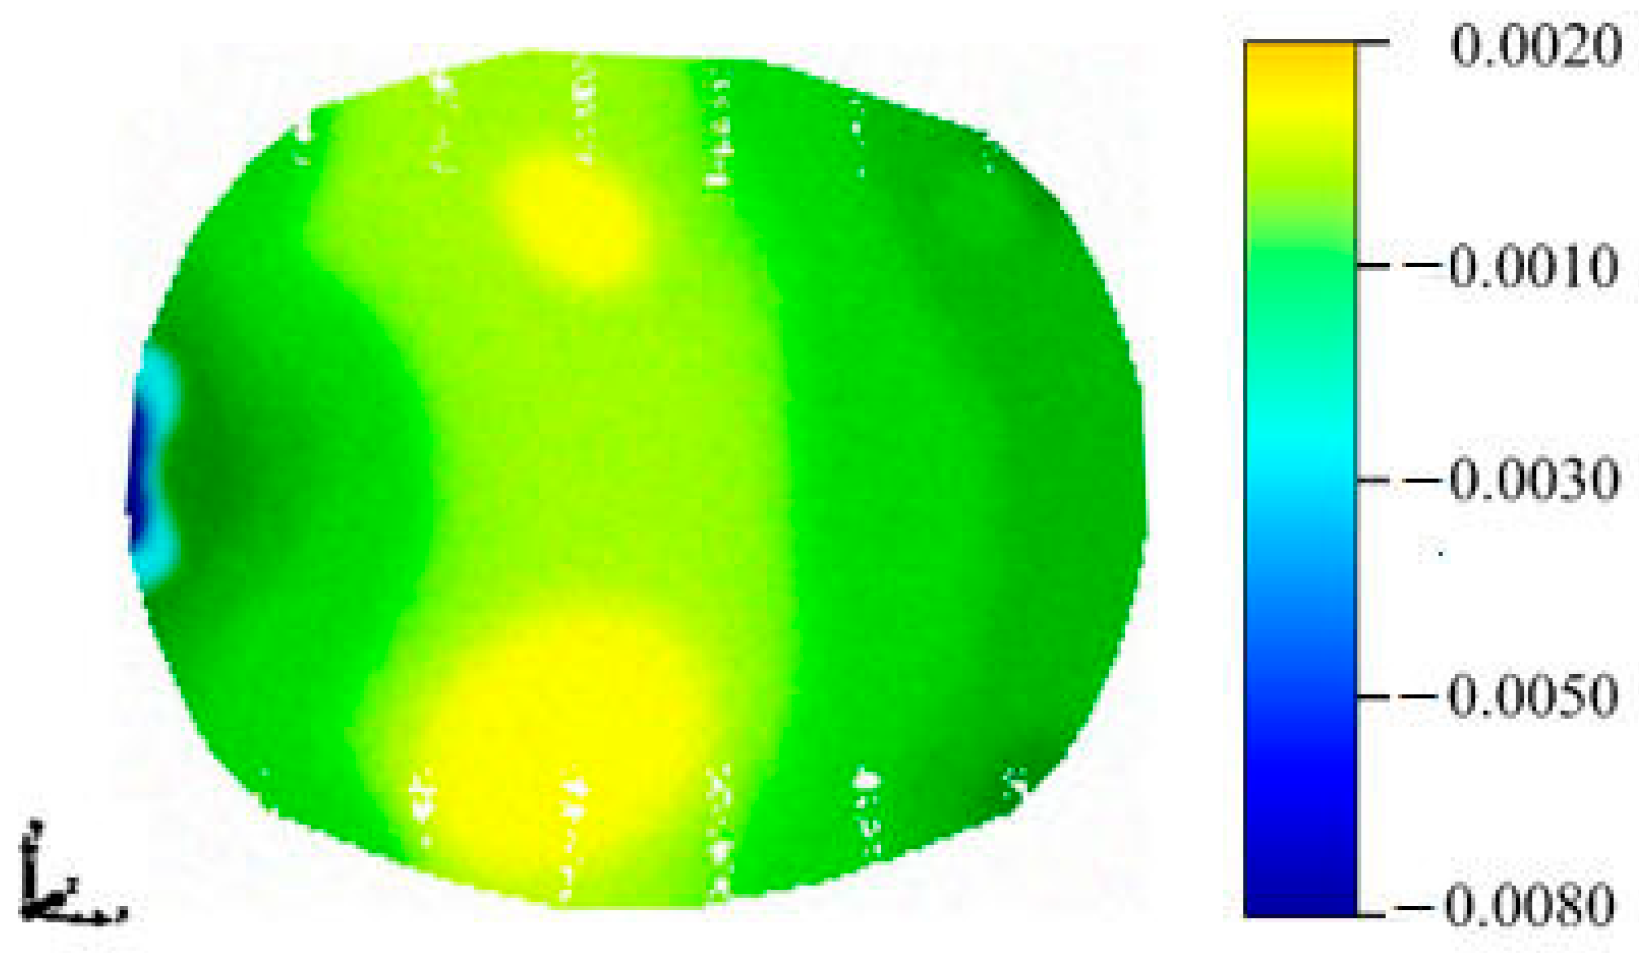
The reference temperature was taken as 20 °C, and the thermal coupling deformation was calculated using Equation (1). Here, (xi, yi, zi) in Equation (1) denote the measured coordinates of the actual manufactured reflector surface in the reference configuration, so that the initial manufacturing shape error is excluded from the calculated thermal deformation. The reflector was constrained at four support points during testing. Under a uniform temperature field at +120 °C, the two measured thermal deformation values were 7.0 and 6.6 μm RMS after best-fit processing, giving an average of 6.8 μm RMS after best-fit processing. At a uniform temperature of −120 °C, the corresponding values were 7.3 and 7.1 μm RMS, giving an average of 7.2 μm RMS. The corresponding measured deformation contours are shown in Figure 24 and Figure 25.
Figure 24.
Measured thermal deformation contour at −120 °C.
Figure 25.
Measured thermal deformation contour at +120 °C.
By combining the simulation value σ1, the testing system deviation σ2, the dead-weight deformation σ3, and the simulation sample standard deviation σ4, an estimated combined value σ5 was calculated using the empirical Equation (20), as shown in Table 8. The simulation sample standard deviation σ4 arose from ply angle deviations in the reflector. The difference between the experimental value σ6 and the estimated combined value σ5 was 1.4 μm RMS at +120 °C and 0.4 μm RMS at −120 °C. Possible reasons for this difference include:
Table 8.
Analysis of thermal deformation test results.
(1) The constraints during the reflector thermal deformation test;
(2) The variability in the performance of the resin-based materials;
(3) Inconsistencies in wall thickness caused by honeycomb core manufacturing.
5. Conclusions
This study proposes and experimentally validates a structural optimization method for carbon fiber honeycomb core reflectors based on thermal coupling deformation. Several representative honeycomb cell configurations were first compared, and the HC configuration was selected by considering both thermal stability and lightweight requirements. The equivalent mechanical properties of the honeycomb core were then evaluated, and practical engineering constraints were incorporated into an ALO-based multiparameter optimization procedure. The influence of manufacturing-induced ply angle deviations was further investigated, leading to a recommended ply angle tolerance of ±0.5°. Finally, full-scale numerical simulations and thermal deformation tests were performed to evaluate the optimized reflector. The results demonstrate that the proposed design procedure satisfies the thermal stability requirements of the reflector considered in this study.
Author Contributions
Conceptualization, W.J. and T.L.; methodology, W.J. and T.L.; software, W.J. and H.D.; validation, W.J. and H.D.; formal analysis, W.J.; investigation, W.J. and H.D.; resources, T.L.; data curation, W.J.; writing—original draft preparation, W.J.; writing—review and editing, W.J., T.L. and H.D.; manuscript formatting, Y.H.; visualization, W.J. and H.D.; supervision, T.L.; project administration, T.L.; funding acquisition, T.L. All authors have read and agreed to the published version of the manuscript.
Funding
The authors acknowledge financial support from the State Key Laboratory of Electromechanical Integrated Manufacturing of High-performance Electronic Equipments (Project No. EMIM24KF-06).
Data Availability Statement
The dataset is available from the authors upon request.
Conflicts of Interest
The authors declare no conflicts of interest.
Abbreviations
The following abbreviations are used in this manuscript:
| ALO | Ant Lion Optimizer |
| CC | Circular cell |
| E0 | Elastic modulus of HC material |
| Eex | Elastic modulus of x direction |
| Eey | Elastic modulus of y direction |
| fthermal_RMS | Thermal coupling deformation value of the reflector |
| F | Focal length |
| Gexy | Shear modulus of x-y direction |
| Gexz | Shear modulus of x-z direction |
| Geyz | Shear modulus of y-z direction |
| ν0 | Poisson’s ratio of HC material |
| h | Height of HC |
| HC | Hexagonal cell |
| l | Edge length of HC |
| tsheet | Sum of the upper- and lower-skin sheet thickness |
| n | Number of the upper- or lower-skin sheet layers |
| M | Reflector weight |
| p | Ply angle |
| plower | Ply angle of lower layer |
| pupper | Ply angle of upper layer |
| plyn | nth actual layup angles of the upper- and lower-skin sheets |
| pp | Number of points for the thermal coupling deformation calculation |
| RMS | Root-mean-square |
| S | Reflector surface area |
| t | Thickness of the honeycomb core wall |
| TC | Triangular cell |
| Vcore | Volume of the honeycomb core |
| Vsheet | Sum of the upper- and lower-skin sheet volume |
| α | Coefficient of thermal expansion |
| ε | RMS value of the thermal coupling deformation |
| ρcore | Density of the honeycomb core material |
| ρsheet | Density of the skin sheets |
| ρsurface | Overall areal density |
| ρ* | Equivalent density of the HC honeycomb core |
| ν | Poisson’s ratio |
| △θi | Ply angle deviation |
| μ | Sample mean |
| σ | Sample standard deviation |
References
- Zhou, S.; Zheng, Y.; Zhang, K.; Liu, X.; Cai, G. Rigid-flexible-thermal coupling dynamic modeling and attitude control of large spaceborne deployable parabolic truss antenna. Adv. Space Res. 2026, 77, 5364–5381. [Google Scholar] [CrossRef] [Scilit]
- Agarwal, P.; Viswanath, V.; John, A.; Sebastian, M.; Pandya, J.; Kumar, S. A method of metallisation of carbon fiber-reinforced plastic (CFRP) sandwich antenna reflector dish for high-frequency application. Int. J. Aeronaut. Space Sci. 2023, 24, 430–437. [Google Scholar] [CrossRef] [Scilit]
- Mustafaoglu, M.; Yesilyurt, M.; Razmi, A. Numerical analysis of anisotropic stress behavior under thermal load in laminated composite plates for space application. Adv. Space Res. 2026, 78, 3003–3015. [Google Scholar] [CrossRef] [Scilit]
- Nishihara, K.; Okuyama, K.-i.; Rodriguez, R.; Fajardo, I. The thermo-mechanical properties of carbon-fiber-reinforced polymer composites exposed to a low Earth orbit environment. Aerospace 2024, 11, 201. [Google Scholar] [CrossRef] [Scilit]
- Cai, D.; Zhang, H.; Wang, X. Design and validation of quasi-zero stiffness metamaterial core in composite sandwich structures. Compos. Struct. 2025, 371, 119502. [Google Scholar] [CrossRef] [Scilit]
- Fores-Garriga, A.; Gomes-Gras, G.; Perez, M. Lightweighted hybrid composite sandwich structures with additively manufactured cellular cores. Thin-Walled Struct. 2023, 191, 111082. [Google Scholar] [CrossRef] [Scilit]
- Ni, H.; Liu, J.; Liu, D.; Cao, H.; Pan, G. A novel honeycomb sandwich cylindrical shell with dual deformation mode for circumferential vibration isolation and enhanced stiffness. Mech. Syst. Signal Process. 2025, 226, 112359. [Google Scholar] [CrossRef] [Scilit]
- Qian, J.; Cheng, Y.; Zhang, A.; Zhou, Q.; Zhang, J. Optimization design of metamaterial vibration isolator with honeycomb structure based on multi-fidelity surrogate model. Struct. Multidiscip. Optim. 2021, 64, 423–439. [Google Scholar] [CrossRef] [Scilit]
- Son, M.-Y.; Chae, B.-G.; Sung, H.-M.; Oh, H.-U. Numerical investigation on the thermal characteristics of lightweight metal mesh-based reflector antenna with various knitting conditions. Aerospace 2024, 11, 780. [Google Scholar] [CrossRef] [Scilit]
- Ciolca, M.; Cormos, R.; Neagoe, C.; Hadar, A. A comparative study on the finite element analysis of multilayered honeycomb composite materials for aerospace structure. Materials 2025, 18, 1744. [Google Scholar] [CrossRef] [Scilit] [PubMed]
- Deng, Y.; Hu, X. Dynamic response of composite honey sandwich panels subjected to strong dynamic loading. Eng. Struct. 2025, 322, 119032. [Google Scholar] [CrossRef] [Scilit]
- Jiang, W.; Jiang, H.; Huo, T.; Liang, Y. Numerical simulation of ply angle deviation and thermal deformation behavior of CFRP reflector. J. Phys. Conf. Ser. 2023, 2633, 012012. [Google Scholar] [CrossRef] [Scilit]
- Liu, Z.; Dong, H.; Zheng, G.; Gao, Q. Vibroacoustic analysis of sandwich and honeycomb panels using an efficient FEM approach. Eur. J. Mech. A Solids 2026, 117, 106040. [Google Scholar] [CrossRef] [Scilit]
- Shi, Z.; Li, T.; Tang, Y.; Chen, X.; Yang, L.; Wang, Z. Minimization of cable-net reflector shape error by target approaching and procedural learning. J. Aerosp. Eng. 2022, 35, 04022012. [Google Scholar] [CrossRef] [Scilit]
- Sun, Z.; Duan, B.; Zhang, Y.; Yang, D.; Hu, N. Multi-material optimization design for mesh reflector antennas considering space thermal effects. Struct. Multidiscip. Optim. 2022, 65, 165. [Google Scholar] [CrossRef] [Scilit]
- Zhang, L.; Shi, Y.; Chen, S.; Zhao, X.; Yu, J.; Zhang, L. Vibration stress analysis and test verification of satellite honeycomb sandwich plate subjected to acoustic excitation. Sensors 2025, 25, 7444. [Google Scholar] [CrossRef] [Scilit] [PubMed]
- Hua, Y.; Zhang, N.; Shen, Y.; Sun, S.; Cui, H.; Ma, W. Dynamic modeling and thermo-mechanical coupling analysis of variable-geometry spacecraft antenna with clearance hinges under extreme thermal environment. Aerospace 2026, 13, 529. [Google Scholar] [CrossRef] [Scilit]
- Zhang, W.; Zhang, S.; Dong, Z.; Wang, H.; Yang, D.; Chen, M.; Liu, X. Rigid-flexible-thermal coupling dynamics for spacecraft with a composite-laminated solar array in a space thermal environment. J. Aerosp. Eng. 2026, 39, 04025123. [Google Scholar] [CrossRef] [Scilit]
- Huang, J.; Li, T.; Zhang, Y.; Dong, H. Prediction of electrical performance and multi-physics field optimization model for log-periodic dipole antenna. Struct. Multidiscip. Optim. 2025, 68, 41. [Google Scholar] [CrossRef] [Scilit]
- Cao, L.; Wu, J.; Zhang, Z.; Zhang, C.; Wan, W.; Bao, J.; Gao, Y. Design optimization of elastic metamaterials with multilayered honeycomb structure by Kriging surrogate model and genetic algorithm. Struct. Multidiscip. Optim. 2024, 67, 82. [Google Scholar] [CrossRef] [Scilit]
- Zhang, J. Thermal Deformation Analysis and Structural Optimization of Carbon Fiber Reinforced Polymer Antenna Reflector. Master’s Thesis, Xidian University, Xi’an, China, 2026. [Google Scholar]
- Hermansen, S.; Lund, E. Multi-material and thickness optimization of laminated composite structures subject to high-cycle fatigue. Struct. Multidiscip. Optim. 2023, 66, 259. [Google Scholar] [CrossRef] [Scilit]
- Chen, L.; Yang, B. Mechanical Analysis of Composite Materials; China Science and Technology Press: Beijing, China, 2006. [Google Scholar]
- Ciaburro, G.; Iannace, G.; Romero, V. Optimizing controlled-resonance acoustic metamaterials with perforated plexiglass disks, honeycomb structures, and embedded metallic masses. Fibers 2025, 13, 11. [Google Scholar] [CrossRef] [Scilit]
- Mirjalili, S. The ant lion optimizer. Adv. Eng. Softw. 2015, 83, 80–98. [Google Scholar] [CrossRef] [Scilit]
- Huo, L.; Cheng, X.; Yang, T. Aerothermoelastic response analysis for C/SiC panel of ceramic matrix composite shingle thermal protection system. Adv. Space Res. 2015, 55, 2352–2371. [Google Scholar] [CrossRef] [Scilit]
- Zhang, X.; Han, M. A phase-field model for thermal-mechanical-chemical coupling analysis of carbon/carbon composites. Compos. Struct. 2026, 382, 120088. [Google Scholar] [CrossRef] [Scilit]

Disclaimer/Publisher’s Note: The statements, opinions and data contained in all publications are solely those of the individual author(s) and contributor(s) and not of MDPI and/or the editor(s). MDPI and/or the editor(s) disclaim responsibility for any injury to people or property resulting from any ideas, methods, instructions or products referred to in the content. |
© 2026 by the authors. Licensee MDPI, Basel, Switzerland. This article is an open access article distributed under the terms and conditions of the Creative Commons Attribution (CC BY) license.