


Abstract
Low Earth orbit (LEO) satellite networks exhibit highly dynamic topologies, making it challenging to accurately identify critical inter-satellite links using conventional static graph methods. Existing approaches predominantly rely on delay or betweenness centrality as evaluation criteria and fail to account for temporal connectivity as a fundamental prerequisite for communication. This paper proposes the Evaluation of Temporal-Aware Path Connectivity (eTAPC), a method based on temporal connectivity for identifying critical links in LEO satellite networks. An event-driven slot partitioning strategy is adopted to construct a time-extended graph. Three complementary metrics are proposed, activity frequency, burstiness coefficient, and von Neumann entropy change, to characterize link importance from temporal coverage, fluctuation patterns, and topological bridging. These metrics are fused via the TOPSIS method with a predefined weight vector to produce a comprehensive ranking of link criticality. Experiments are conducted on real TLE data from both dense and sparse LEO constellations to validate the effectiveness of eTAPC. The results show that eTAPC outperforms existing methods on the dense Starlink constellation and achieves competitive performance on the sparse Iridium constellation. Overall, eTAPC provides a lightweight and effective solution for critical link identification in large LEO constellations, with low computational complexity.
1. Introduction
In recent years, low Earth orbit satellite constellations have become critical infrastructure for building integrated space-ground information systems and global broadband communication networks, owing to their large-scale deployment, global coverage, and low-latency transmission capabilities [1]. Large-scale constellations such as Starlink and Iridium establish space-based backbone networks through inter-satellite links (ISL). The maturation of inter-satellite laser communication and related technologies has made multi-hop routing between satellites feasible, reducing end-to-end propagation latency to the tens of milliseconds range [2]. This capability enables cross-regional end-to-end data relay and offers significant application value in civilian communications, emergency disaster relief, and remote sensing data transmission [3].
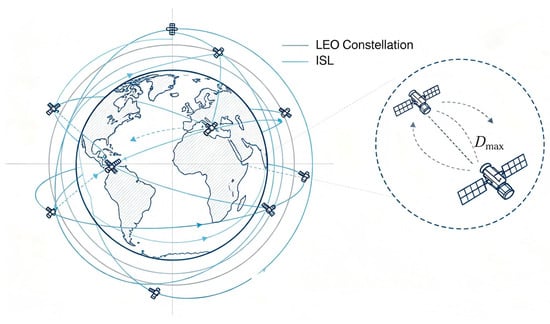
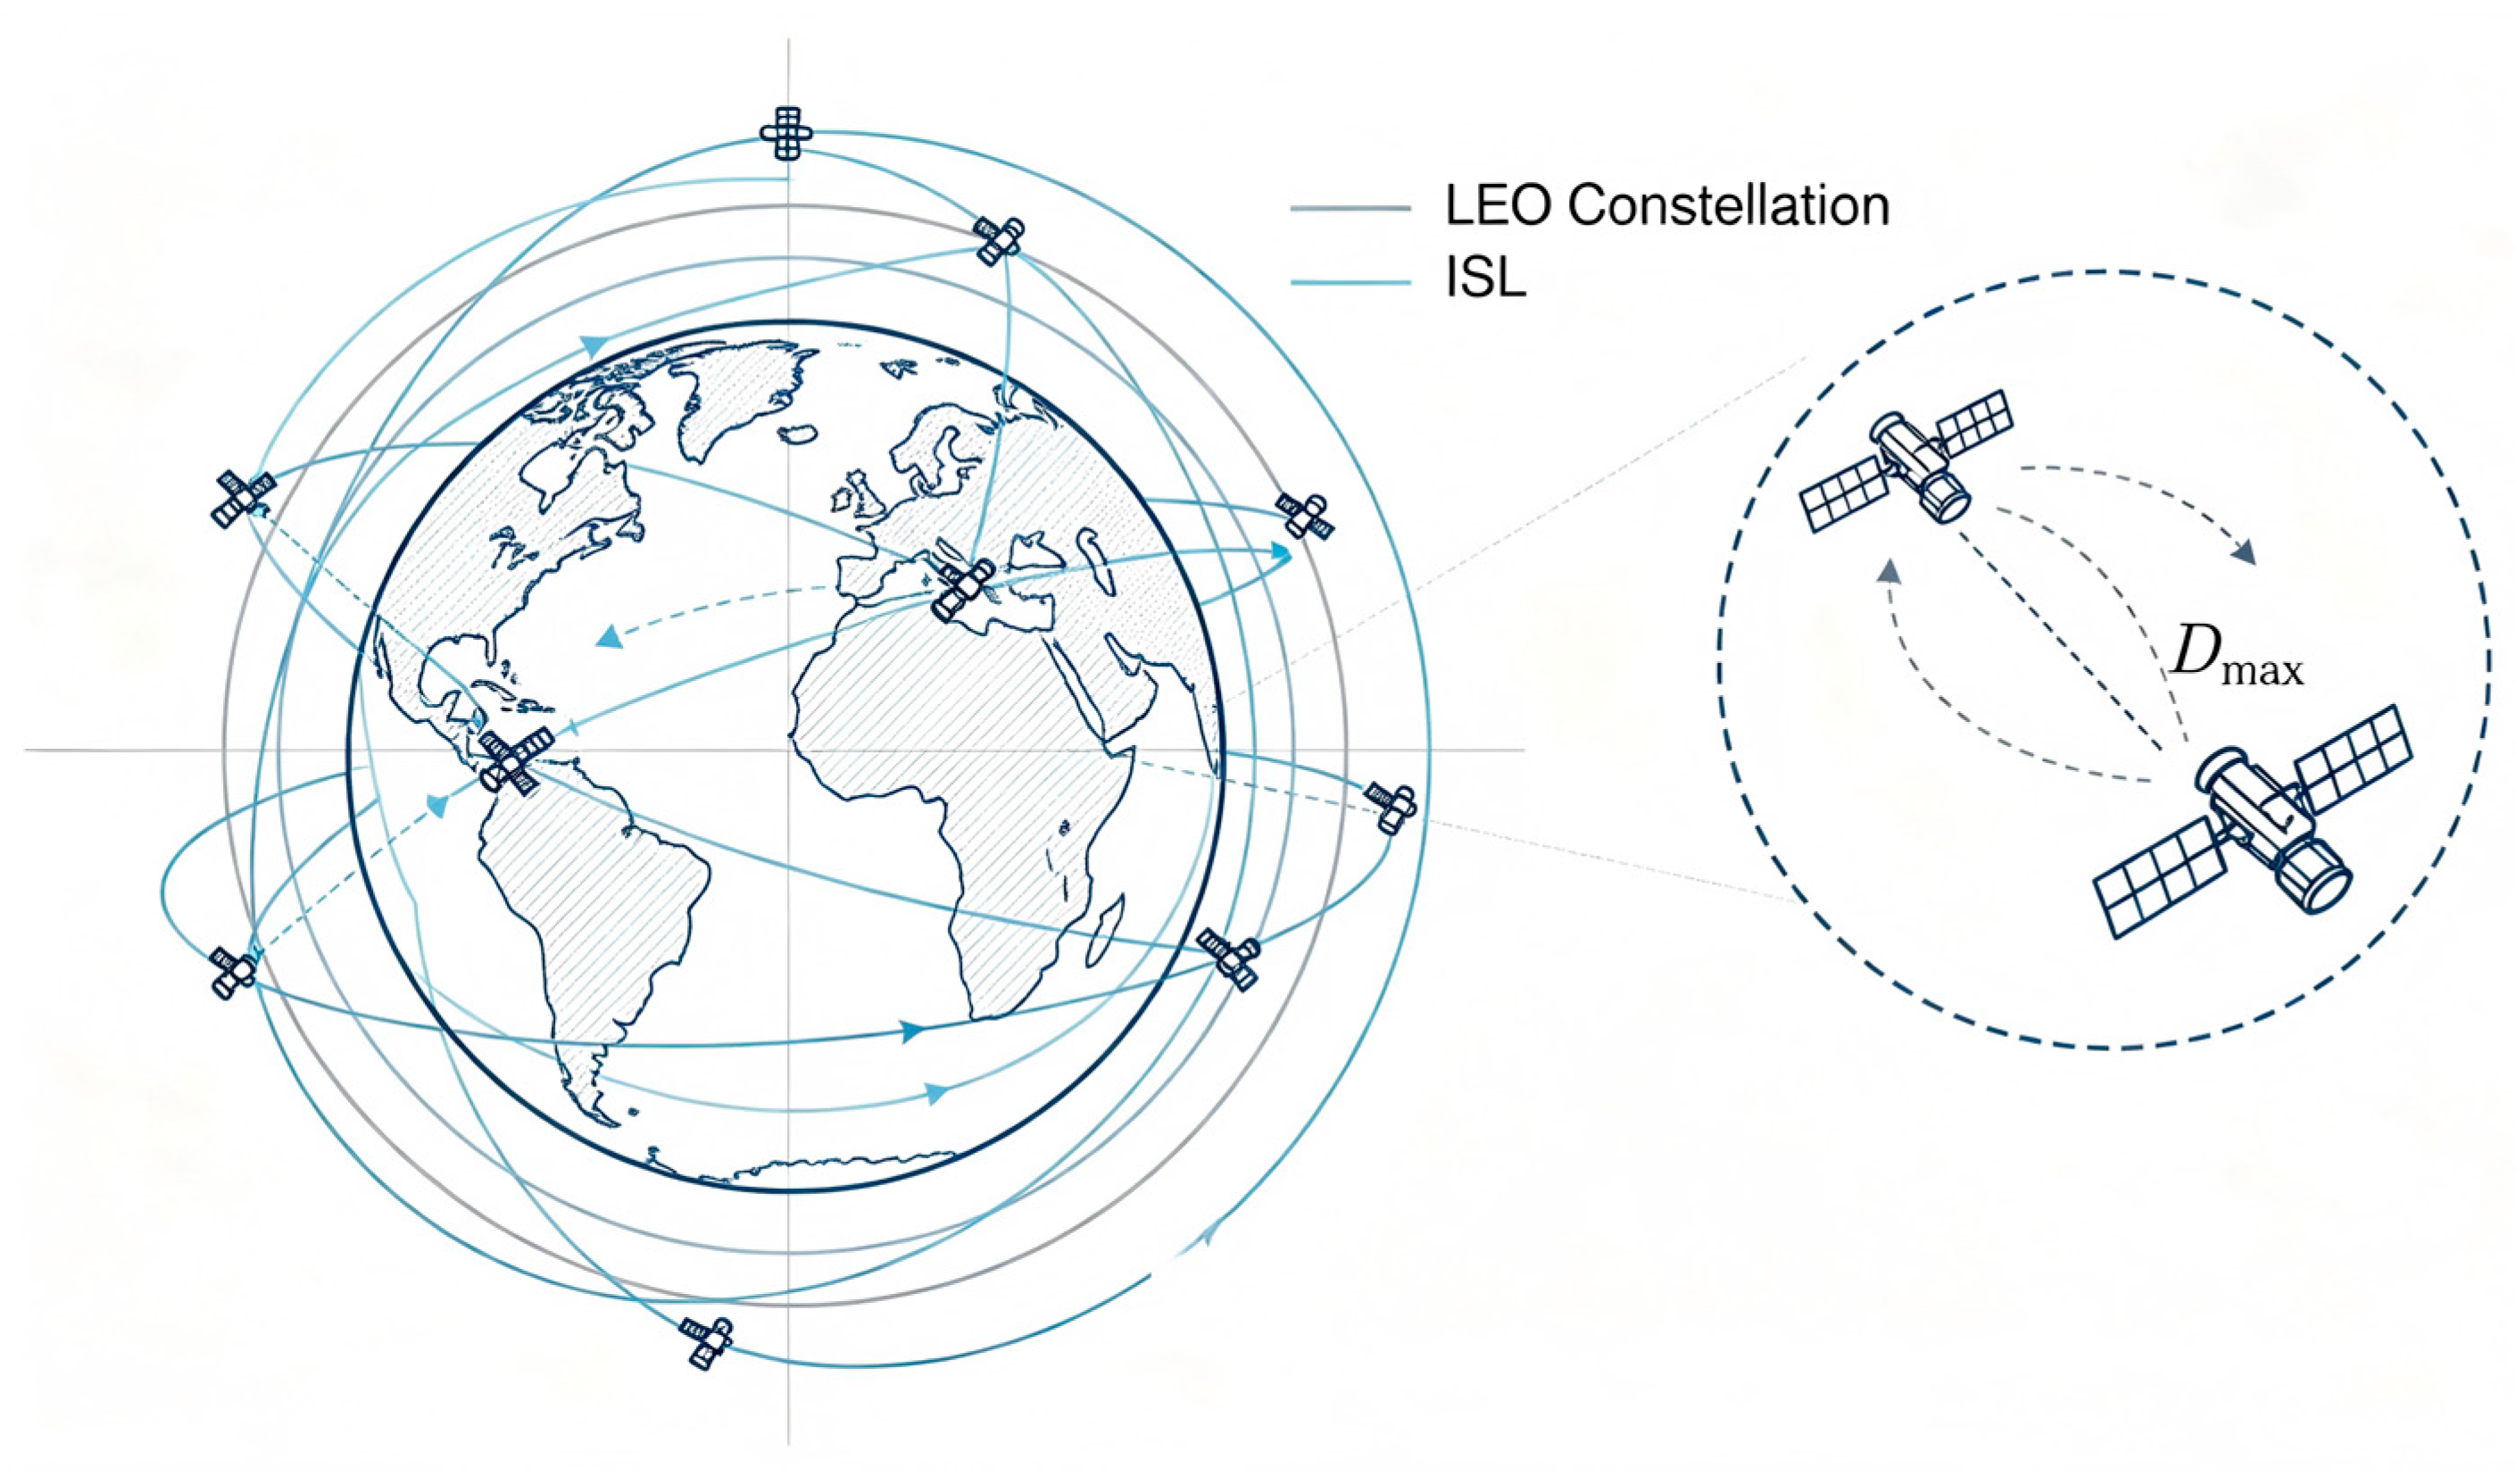
Low Earth orbit satellites operate at high speeds along fixed trajectories, and the availability of an inter-satellite link is determined by the relative geometric positions of the satellites. As shown in Figure 1, the LEO constellation consists of multiple orbital planes, with satellites interconnected via ISLs under the constraint of a maximum communication distance. The network topology thus exhibits strong temporal variability and intermittent connectivity, posing considerable challenges for network connectivity assessment [4]. In such networks, temporal connectivity differs from static connectivity: satellites connected in a static graph may still be unable to communicate if link activations are temporally misaligned, making temporal connectivity essential for end-to-end communication.
Figure 1.
LEO satellite constellation with ISL and Dmax. The satellite constellation comprises orbital planes with different inclinations. Satellites are connected via intra-orbit and inter-orbit ISLs, with the maximum communication distance denoted as Dmax. The dashed lines denote the maximum communication distance, and the arrows indicate the direction of inter-satellite links.
Moreover, LEO satellites operate over extended periods in harsh space environments characterized by intense radiation, extreme temperatures, solar wind, and frequent adverse conditions, resulting in a high probability of node and link failures that are difficult to rectify promptly through in-orbit operations. The failure of core links can readily cause localized degradation of network connectivity, performance deterioration, and even regional service outages. With ongoing progress in 5G non-terrestrial network standardization and the evolution of on-board processing architectures, network connectivity resilience has become a fundamental prerequisite for ensuring space communication services, and precise identification of critical links constitutes a key task for enhancing constellation resilience [5]. Consequently, identifying links that significantly impact global network connectivity is central to satellite network resilience assessment and holds considerable research significance and engineering value for improving the reliability of space communication networks.
In complex network theory, degree centrality, betweenness centrality, and K-core decomposition serve as classic methods for identifying critical nodes and links [6]. Degree centrality measures local connectivity [7]; betweenness centrality quantifies the bridging role of a node or link in shortest paths across the entire network [8]; K-core decomposition reveals core hierarchy by iteratively removing nodes with degree less than k [9]. These metrics have been preliminarily applied to satellite network analysis. However, static graph methods aggregate dynamic topologies into a single structure, discarding temporal evolution information. They cannot distinguish transient connectivity from persistent links and are therefore ill-suited for highly dynamic LEO networks [10].
Various dynamic network modeling approaches have been developed for time-varying networks. Time-varying graphs (TVGs) are commonly used to represent temporal concepts in space satellite networks [11]. Building on this foundation, researchers have proposed temporal centrality metrics, including temporal degree centrality and temporal betweenness centrality. In satellite networks, Xu et al. proposed an evaluation method based on time-slot correlations [12]. Guo et al. modeled mega-constellations as discrete temporal graphs and introduced Service-Aware Temporal Betweenness (SATB) to quantify node importance for end-to-end services [13]. Wang et al. proposed the PKN method, which employs cumulative time-valued graph modeling for LEO satellite networks [14]. These studies, however, focus on optimizing delay, betweenness, or service performance rather than using global temporal connectivity as the core evaluation metric.
In the domain of critical link detection, Liu et al. studied the problem from a delay perspective [15]. They showed that critical links in satellite networks vary over time, necessitating the identification of link sequences rather than static sets, and proposed a heuristic detection algorithm. Zhang et al. developed a label-based method for temporal edge centrality [16], but their approach did not fully account for link duration effects on transmission stability or cumulative hop loss, and has not been applied to satellite networks.
Although the above studies account for topological time variation, their evaluation metrics are limited to centrality, latency, throughput, or load, without considering temporal connectivity as a core benchmark. Moreover, most existing methods rely on global temporal path traversal, which incurs high computational complexity and is difficult to adapt to onboard lightweight computing. In contrast, we define link criticality by the drop in temporal reachability after link removal and propose three metrics that require only a scan of each link’s active time slots. Our method avoids global search, and suits lightweight computing.
To address these limitations, we propose Evaluation of Temporal-Aware Path Connectivity(eTAPC), a temporal-connectivity-based method for identifying critical links in LEO satellite networks. The main contributions are as follows.
- (1)
- Proposed a link evaluation framework that integrates temporal and structural dimensions. Link criticality is defined as the decline in network-wide temporal reachability after link removal, which better aligns with connectivity resilience assessment than traditional delay or degree-based metrics.
- (2)
- Designed three lightweight metrics, active frequency, burstiness coefficient, and von Neumann entropy change, to characterize link importance from temporal coverage, activity patterns, and structural bridging perspectives. These metrics avoid global temporal path search and have low computational complexity.
- (3)
- Developed a comprehensive ranking scheme that fuses the three metrics via TOPSIS, ensuring robust and interpretable ranking across different network topologies.
- (4)
- Validated the proposed method using real TLE data from Starlink and Iridium. Experimental results demonstrate that eTAPC achieves the best performance on the dense Starlink constellation and competitive performance on the sparse Iridium constellation, validating its effectiveness across different network densities.
The rest of this paper is organized as follows. Section 2 presents the system model, including the temporal graph formulation and formal definitions of temporal paths and reachability. Section 3 describes the proposed metric design, fusion framework, and algorithmic workflow. Section 4 validates the method through simulation experiments. Section 5 concludes the paper and discusses future research directions.
2. System Model
This paper focuses on the space segment of satellite internet architectures, specifically LEO constellation-based communication networks. In topology design, only the feasibility of inter-satellite links and network connectivity need to be considered, without addressing specific services. Inter-satellite links, referred to as ISLs, are assumed bidirectional, and their availability depends solely on geometric visibility: the inter-satellite distance must be less than the maximum communication range, and the line of sight must remain unobstructed by the Earth. Satellite nodes are equipped with onboard processors that support multi-hop store-and-forward, enabling information relaying along temporal paths. LEO satellites move at high speeds along their orbits, causing the network connectivity state to evolve continuously over time. The resulting temporal variability and structural complexity make traditional static analysis methods based on fixed topologies or Euclidean distances inadequate for capturing the dynamic evolution of the network. To address this, we combine complex network theory with temporal network analysis methods to construct a temporal network model for LEO satellite networks, providing a unified modeling foundation for quantitative evaluation of critical links.
2.1. Satellite Network Topology
A LEO satellite constellation consists of P equidistant orbital planes, with S satellites uniformly distributed in each plane. The total number of satellites is therefore N = P × S [17]. From a complex network perspective, satellites are nodes and wireless links are edges. Since inter-satellite links are typically bidirectional, the network topology at any time can be modeled as an unweighted undirected graph G = (V,E), where V = {v1, v2, …, vN} denotes the set of satellite nodes and E ⊆ V × V is the set of active links. The graph structure is described by the adjacency matrix , where auv = 1 if an available link exists between nodes u and v, and auv = 0 otherwise. The degree of node v, defined as , represents the number of links connected to that node.
This static model applies to a single time snapshot. However, LEO network topology evolves continuously with satellite motion and cannot be captured by a single graph [18]. We therefore adopt the time-varying graph model, which discretizes the observation window into time slots and represents the network evolution as a sequence of snapshots.
2.2. Building Event-Driven Sequence Diagrams
In satellite networks, topological changes occur only when inter-satellite links are established or terminated. Discretization accuracy can therefore be precisely controlled by identifying all topology change events. Let the contact window between satellites u and v be denoted as Cuv, representing the set of consecutive time intervals during which the two satellites satisfy the geometric visibility conditions. The start time ts and end time te of each contact window are collected into an event set. The set of all contact window endpoints is defined as:
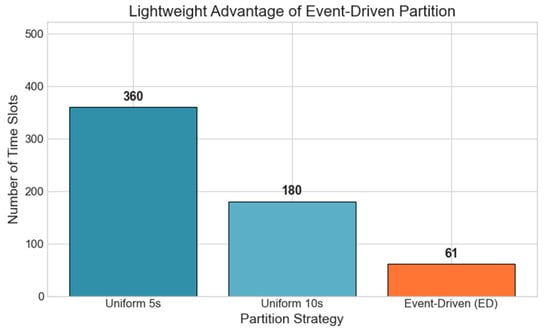
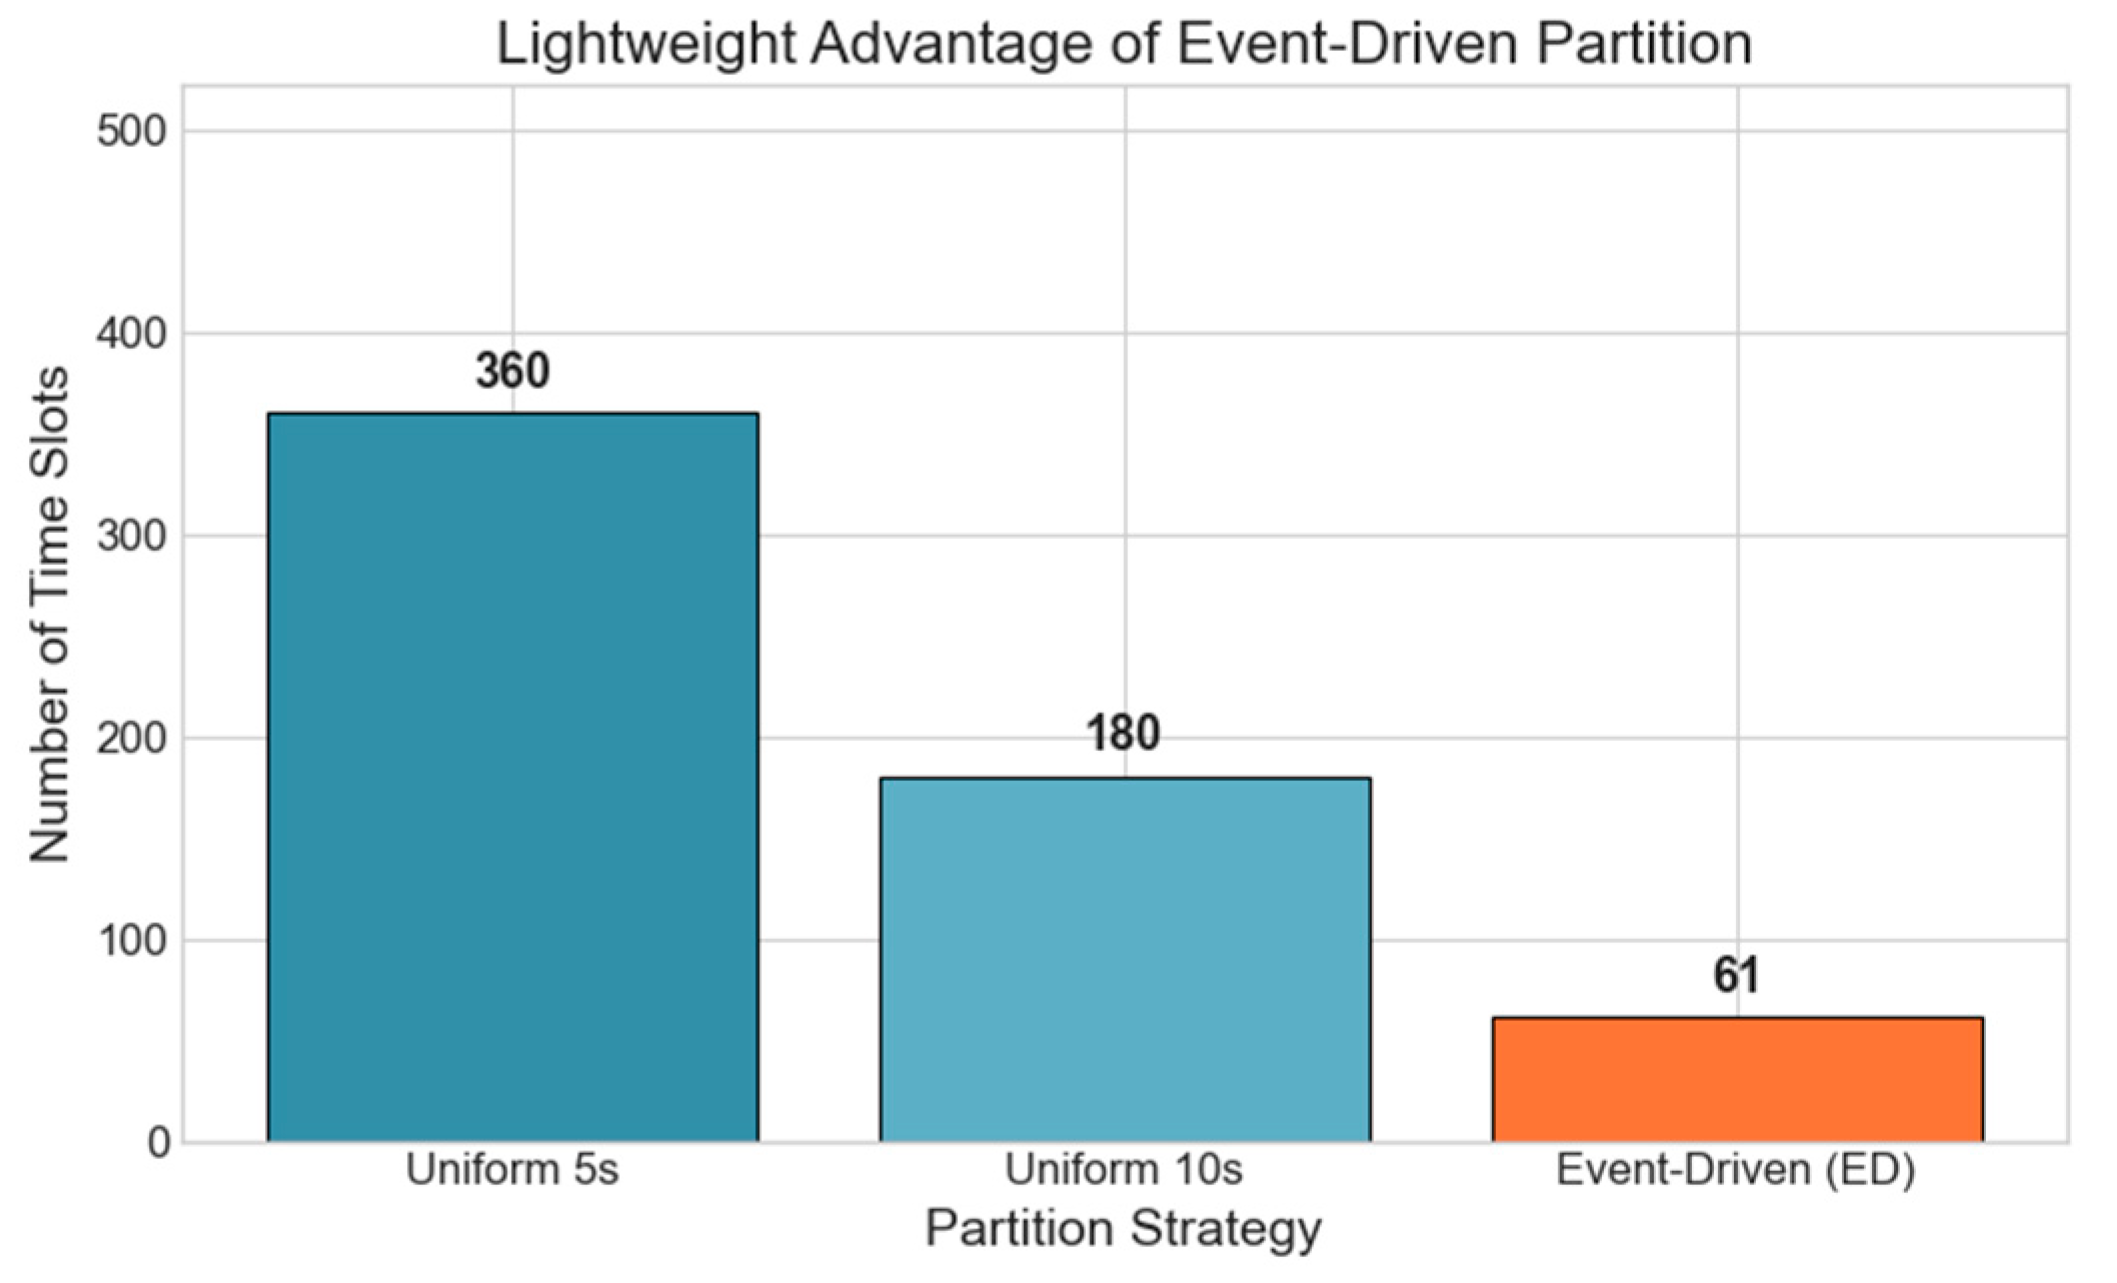
where V is the set of satellite nodes. Sorting and deduplicating Γevent yields the time slot boundary sequence {τ0, τ1, …, τM}, where M is the total number of time slots. Unlike uniform fixed-step discretization, the event-driven strategy produces a number of time slots proportional to the number of topological changes, avoiding redundant computation during stable periods and reducing storage and computational overhead, as illustrated in Figure 2.
Γevent = {ts,te|(ts,te)) ∈ Cuv, ∀u,v ∈ V}
Figure 2.
Comparison of the number of time slots generated by uniform discretization and the event-driven strategy. The event-driven approach produces significantly fewer time slots than uniform 5 s and 10 s discretization, demonstrating its advantage in reducing computational overhead.
Let the analysis window be [0,T], with topology change times denoted as τ0 < τ1 < … < τM, where τ0 = 0, and τM = T. The interval [τi−1,τi) between adjacent change points is a time slot of duration δi = τi − τi−1 within which the topology remains constant.
Based on this discretization, we define a temporal graph , where V is the set of satellite nodes, is the set of time slot indices, and is the set of temporal edges. Each temporal edge is a quadruple ei = (u, v, i, δi), where u,v ∈ V are the connected satellite nodes, is the time slot index indicating when the link is active, and δi is the duration of that time slot, reflecting the link’s stability. The temporal graph can be viewed as a hierarchical structure, where the i-th layer contains all active links in time slot i. Edges across layers are associated through temporal order, determined by the dynamic evolution of the network topology.
2.3. Temporal Reachability
Based on the event-driven temporal graph model, we provide rigorous definitions of temporal paths and temporal reachability. Temporal reachability is a fundamental concept in temporal graph theory with wide applications in information propagation, epidemic control, and communication network analysis. A temporal path is the basic unit of information propagation in a time-varying network. Given a temporal graph , a temporal path from source node to destination node is a sequence of edges p = (e1, e2, …, ek) that satisfies the following three constraints:
Temporal connectivity: ej = (vj−1,vi,ij), where v0 = s, vk = d, v0, v1, …, vk ∈ V, and ij is the time-slot index of the j-th edge. Adjacent edges must be spatially contiguous, meaning the endpoint of one edge equals the starting point of the next, ensuring continuous information forwarding across the physical topology [19].
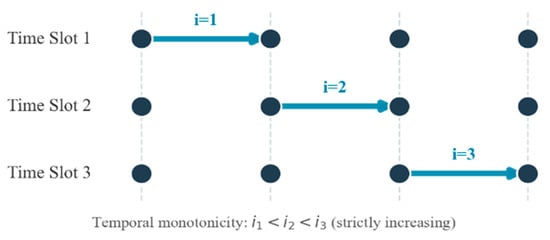
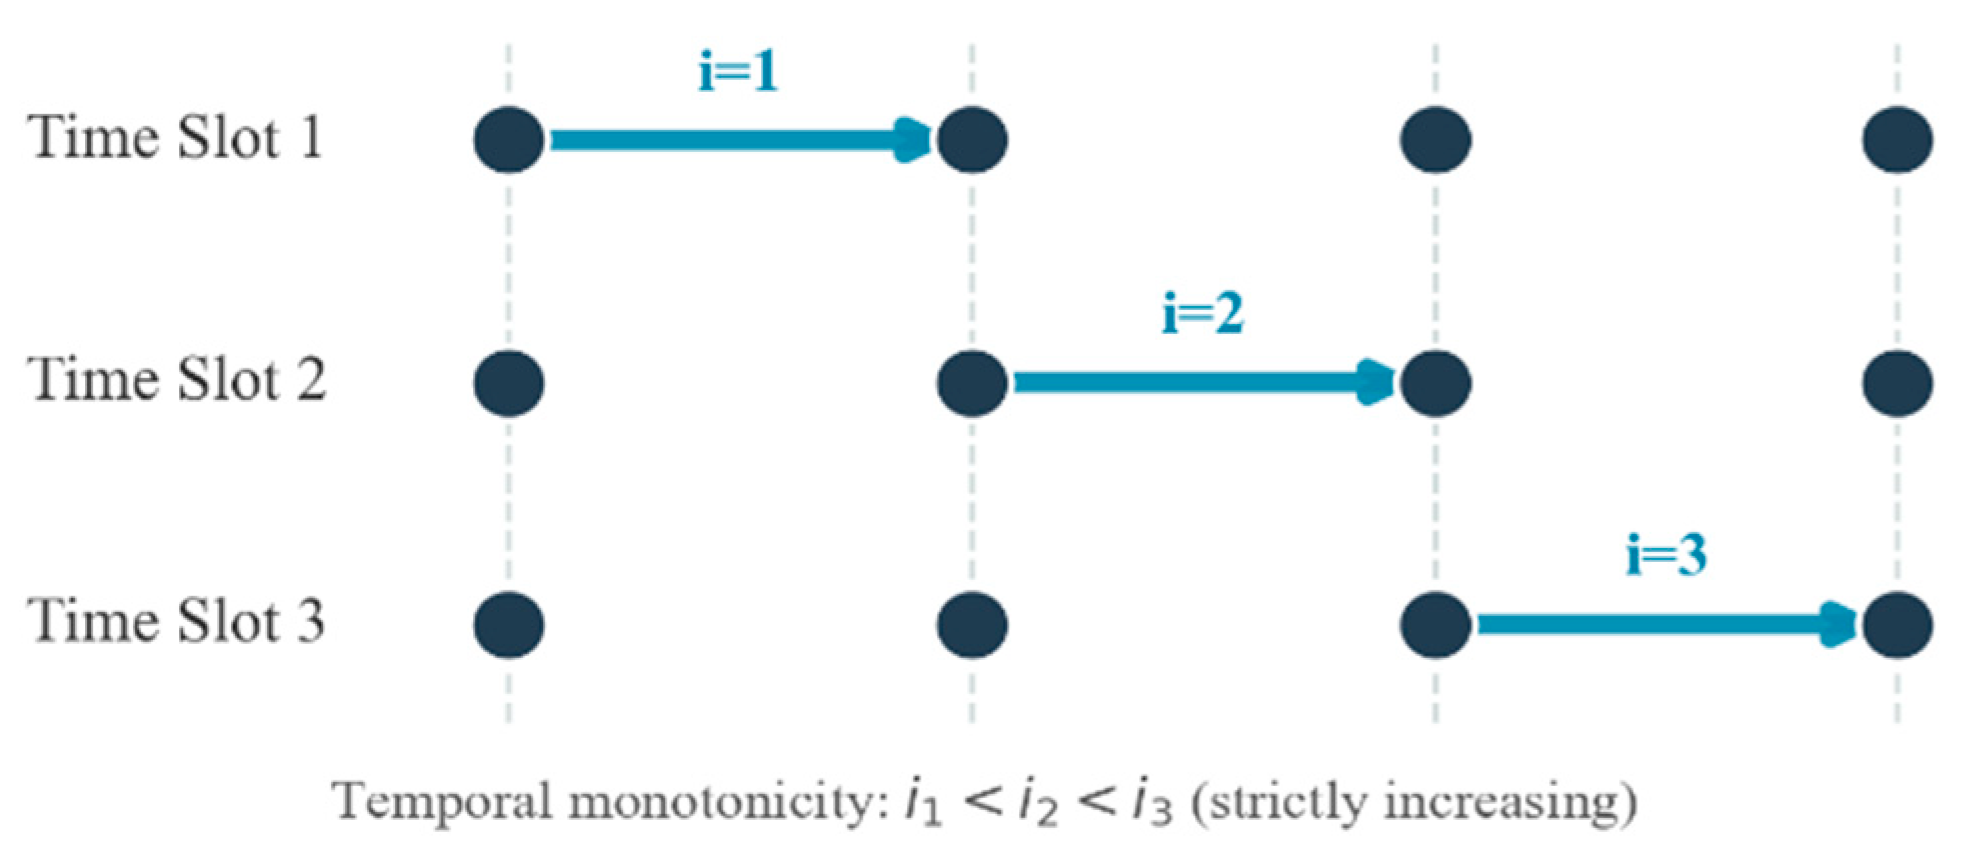
Temporal monotonicity: i1 < i2 < … < ik. The time-slot indices of the edges must strictly increase, meaning information propagates only forward in time, satisfying the causality requirement of time-varying networks [20].
Hop count: len(p) = k, where is the number of temporal edges in the path.
A temporal path satisfying these constraints is illustrated in Figure 3.
Figure 3.
A temporal path in a layered temporal graph. The path traverses edges from Time Slot 1 to Time Slot 3 with strictly increasing time slot indices, satisfying both topological connectivity and temporal monotonicity. Vertical dashed lines represent waiting connections that allow information to be held at a node and forwarded in a later time slot.
Temporal monotonicity is the fundamental distinction between temporal paths and static paths; temporal connectivity is not equivalent to static connectivity. A path with few hops in a static aggregated graph may fail to form a valid temporal path if its edge time stamps are not strictly increasing. Connected nodes in the static topology may thus be unable to communicate due to temporal misalignment. Temporal topology analysis can therefore identify dynamic vulnerabilities that static methods cannot capture, making it more suitable for assessing connectivity and resilience in highly dynamic LEO satellite networks.
In the event-driven temporal graph, slot boundaries are defined at the instants when the state of any inter-satellite link changes. The topology remains constant within each slot, and intra-slot transmission and processing delays are neglected; finer time scales within a slot are not distinguished. Consequently, the ordering among multiple links within the same slot cannot be defined. A packet arriving at a node in slot ij is buffered and can only be forwarded in a later slot ij+1 > ij, which yields strictly increasing time-slot indices i1 < i2 < … < ik. This constraint implies that at most one communication hop occurs within each slot, and multiple hops within the same slot are not supported. If multiple hops within the same slot were allowed, the path would lie entirely within a single static snapshot, temporal reachability would increase, and the importance of some links could be overestimated, which is detrimental to subsequent critical-link identification.
In a temporal graph , a temporal path maps to a directed path from the source layer to the destination layer, where cross-layer movement of a node is realized by waiting at the same node. If at least one temporal path exists from node s to node d, then d is temporally reachable from s. Temporal reachability is a fundamental prerequisite for a network to maintain end-to-end communication capability over time. Following Lee et al. [21], global temporal reachability is defined as the proportion of temporally reachable node pairs in the network:
where N = |V|. This metric measures the network’s ability to sustain end-to-end communication at the system level and serves as the core basis for evaluating link criticality. The more critical a link, the greater the damage to global temporal connectivity upon its removal [22]. The criticality score of link e is defined as the decrease in global temporal reachability, ΔR(e), after removing that link. A large ΔR(e) indicates that the link participates in numerous temporal paths between node pairs, and its failure causes many pairs to lose temporal reachability. When ΔR(e) ≈ 0, the link rarely appears in temporal paths and has negligible impact on network temporal connectivity.
3. Link Evaluation Using Temporal Feature Metrics
Section 2 defines ΔR(e) as the decrease in global temporal reachability after removing link e. Computing this value directly requires recalculating reachability for every link, resulting in complexity O(|E| ⋅ N ⋅ |E|), which is infeasible for LEO constellations with hundreds of satellites.
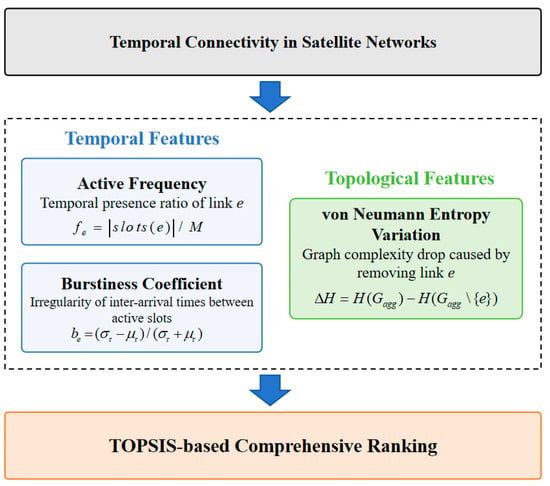
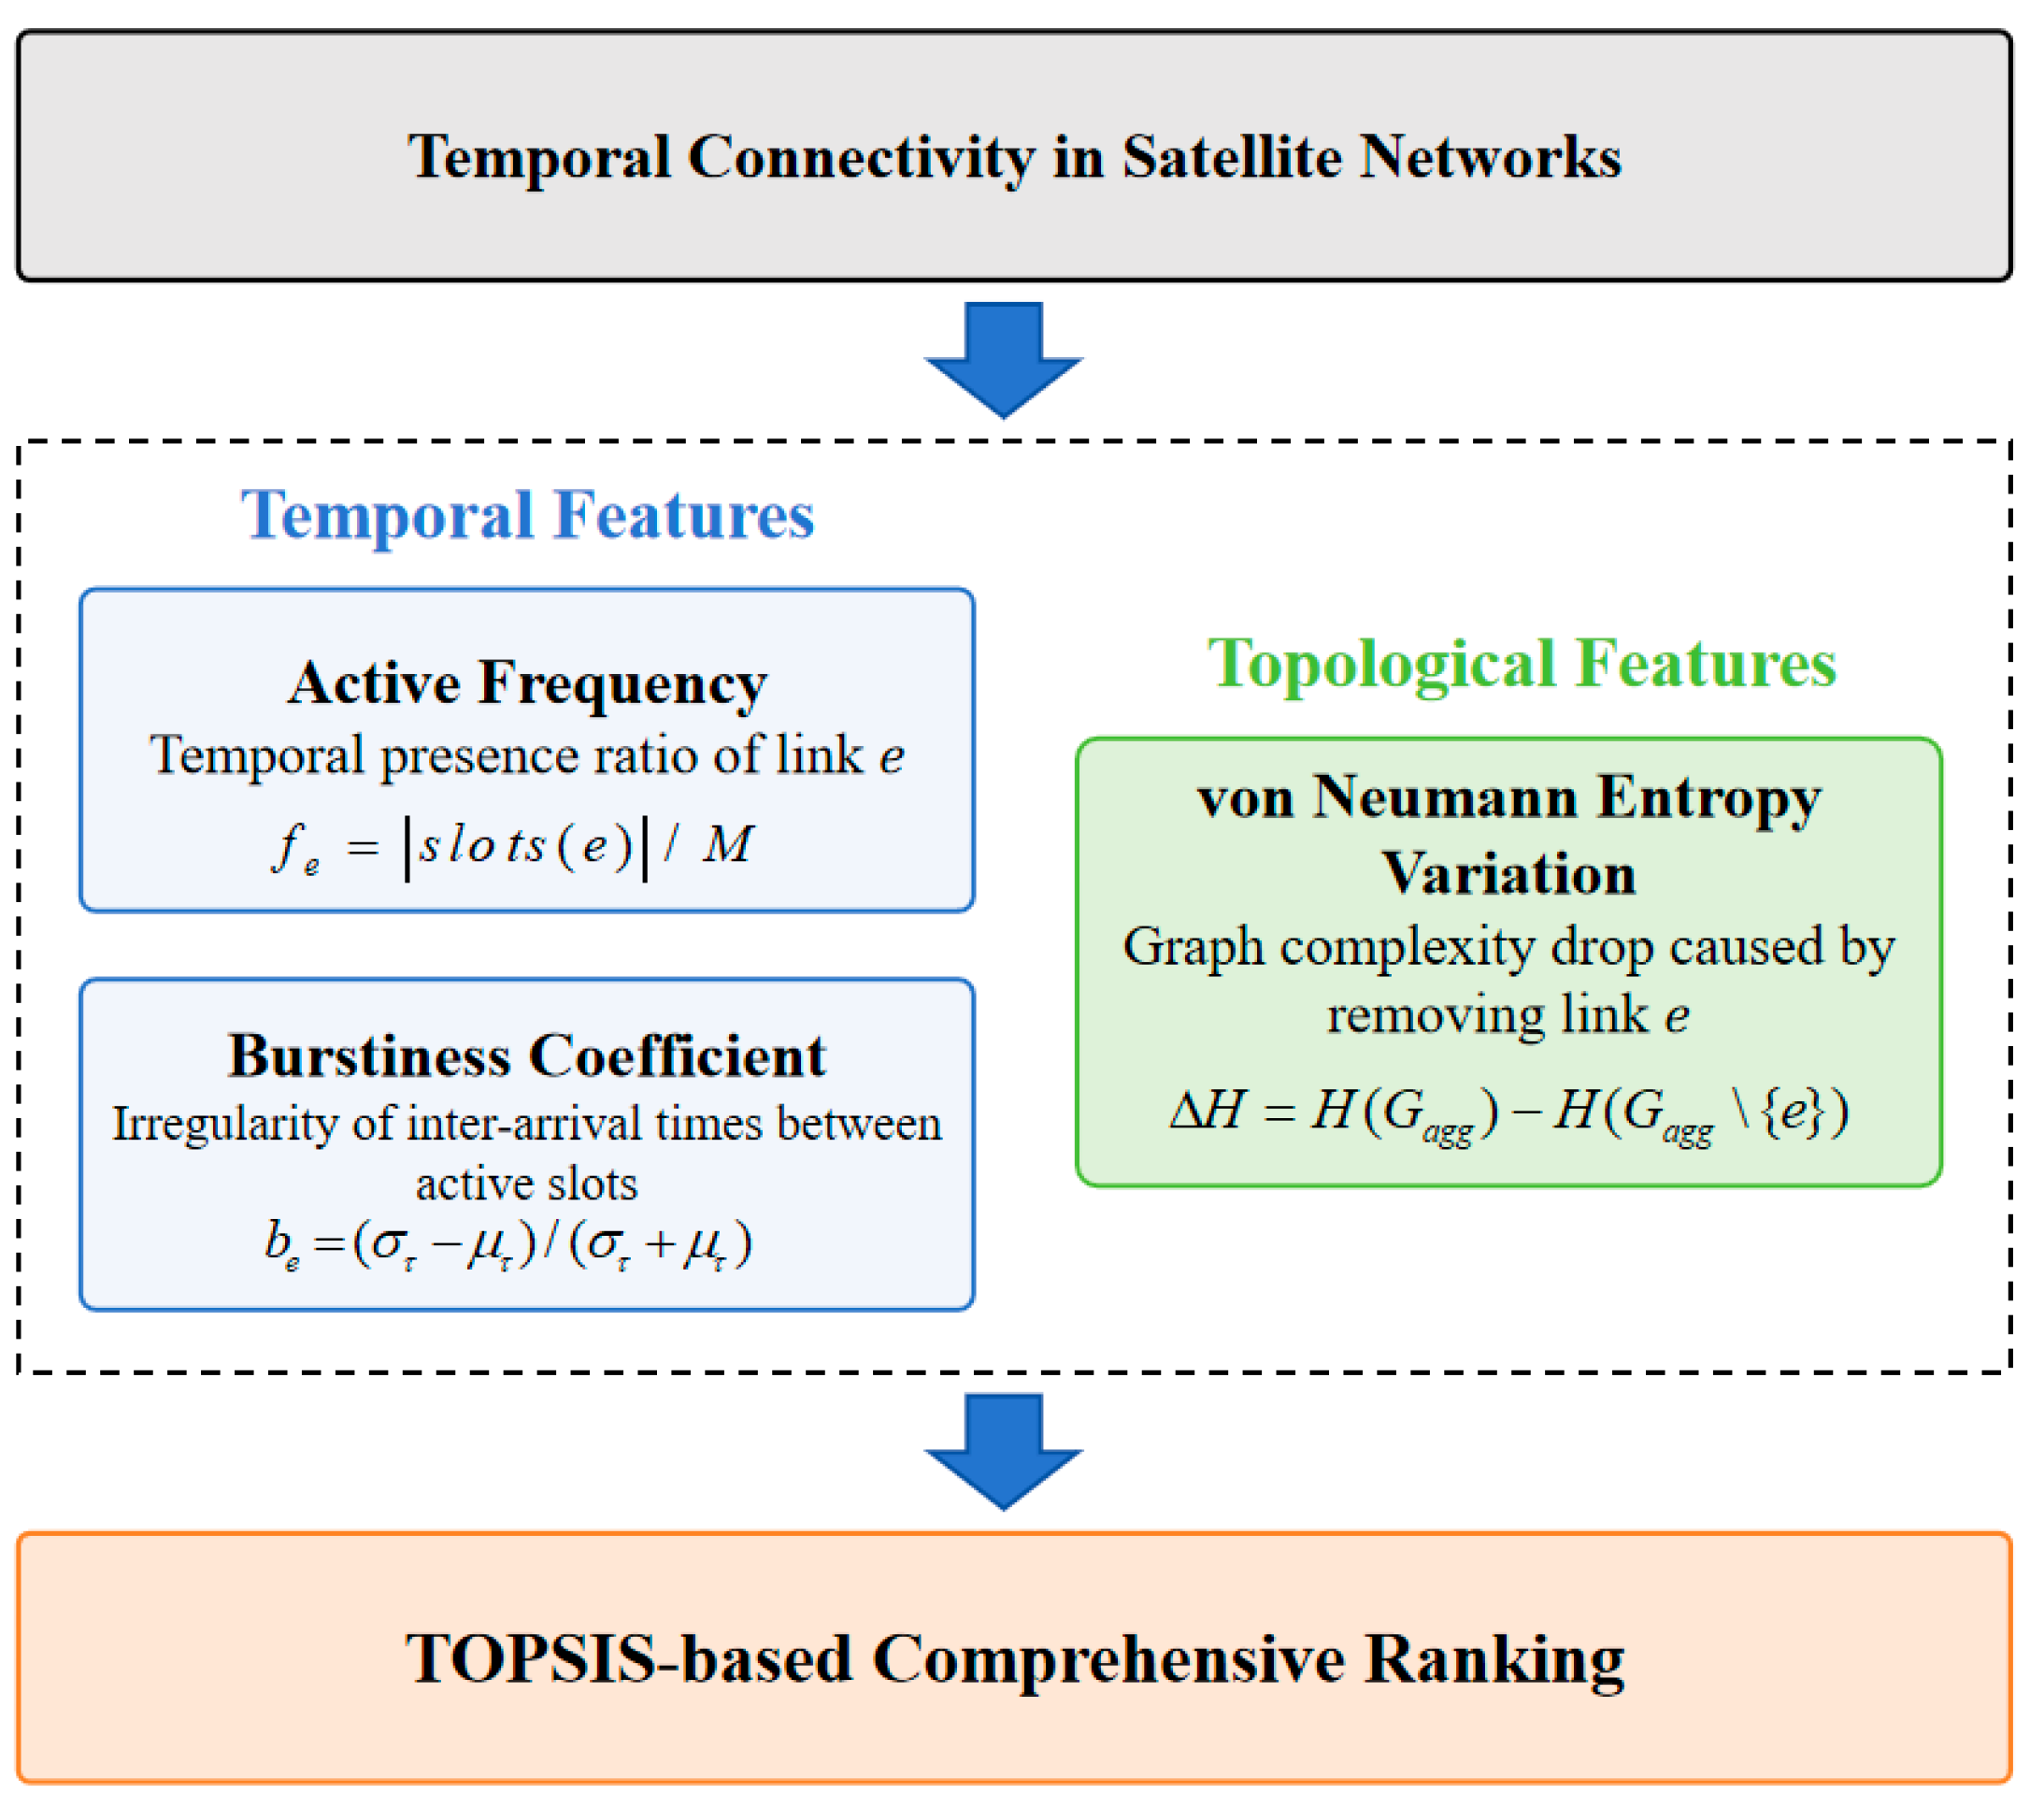
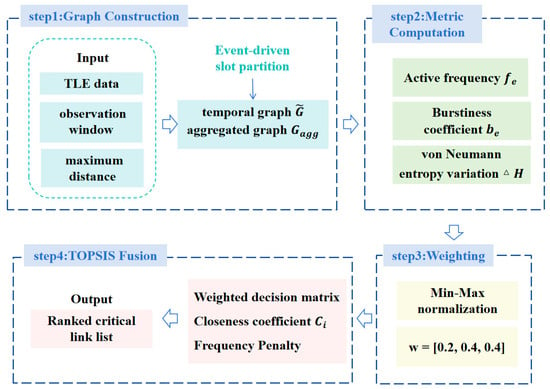
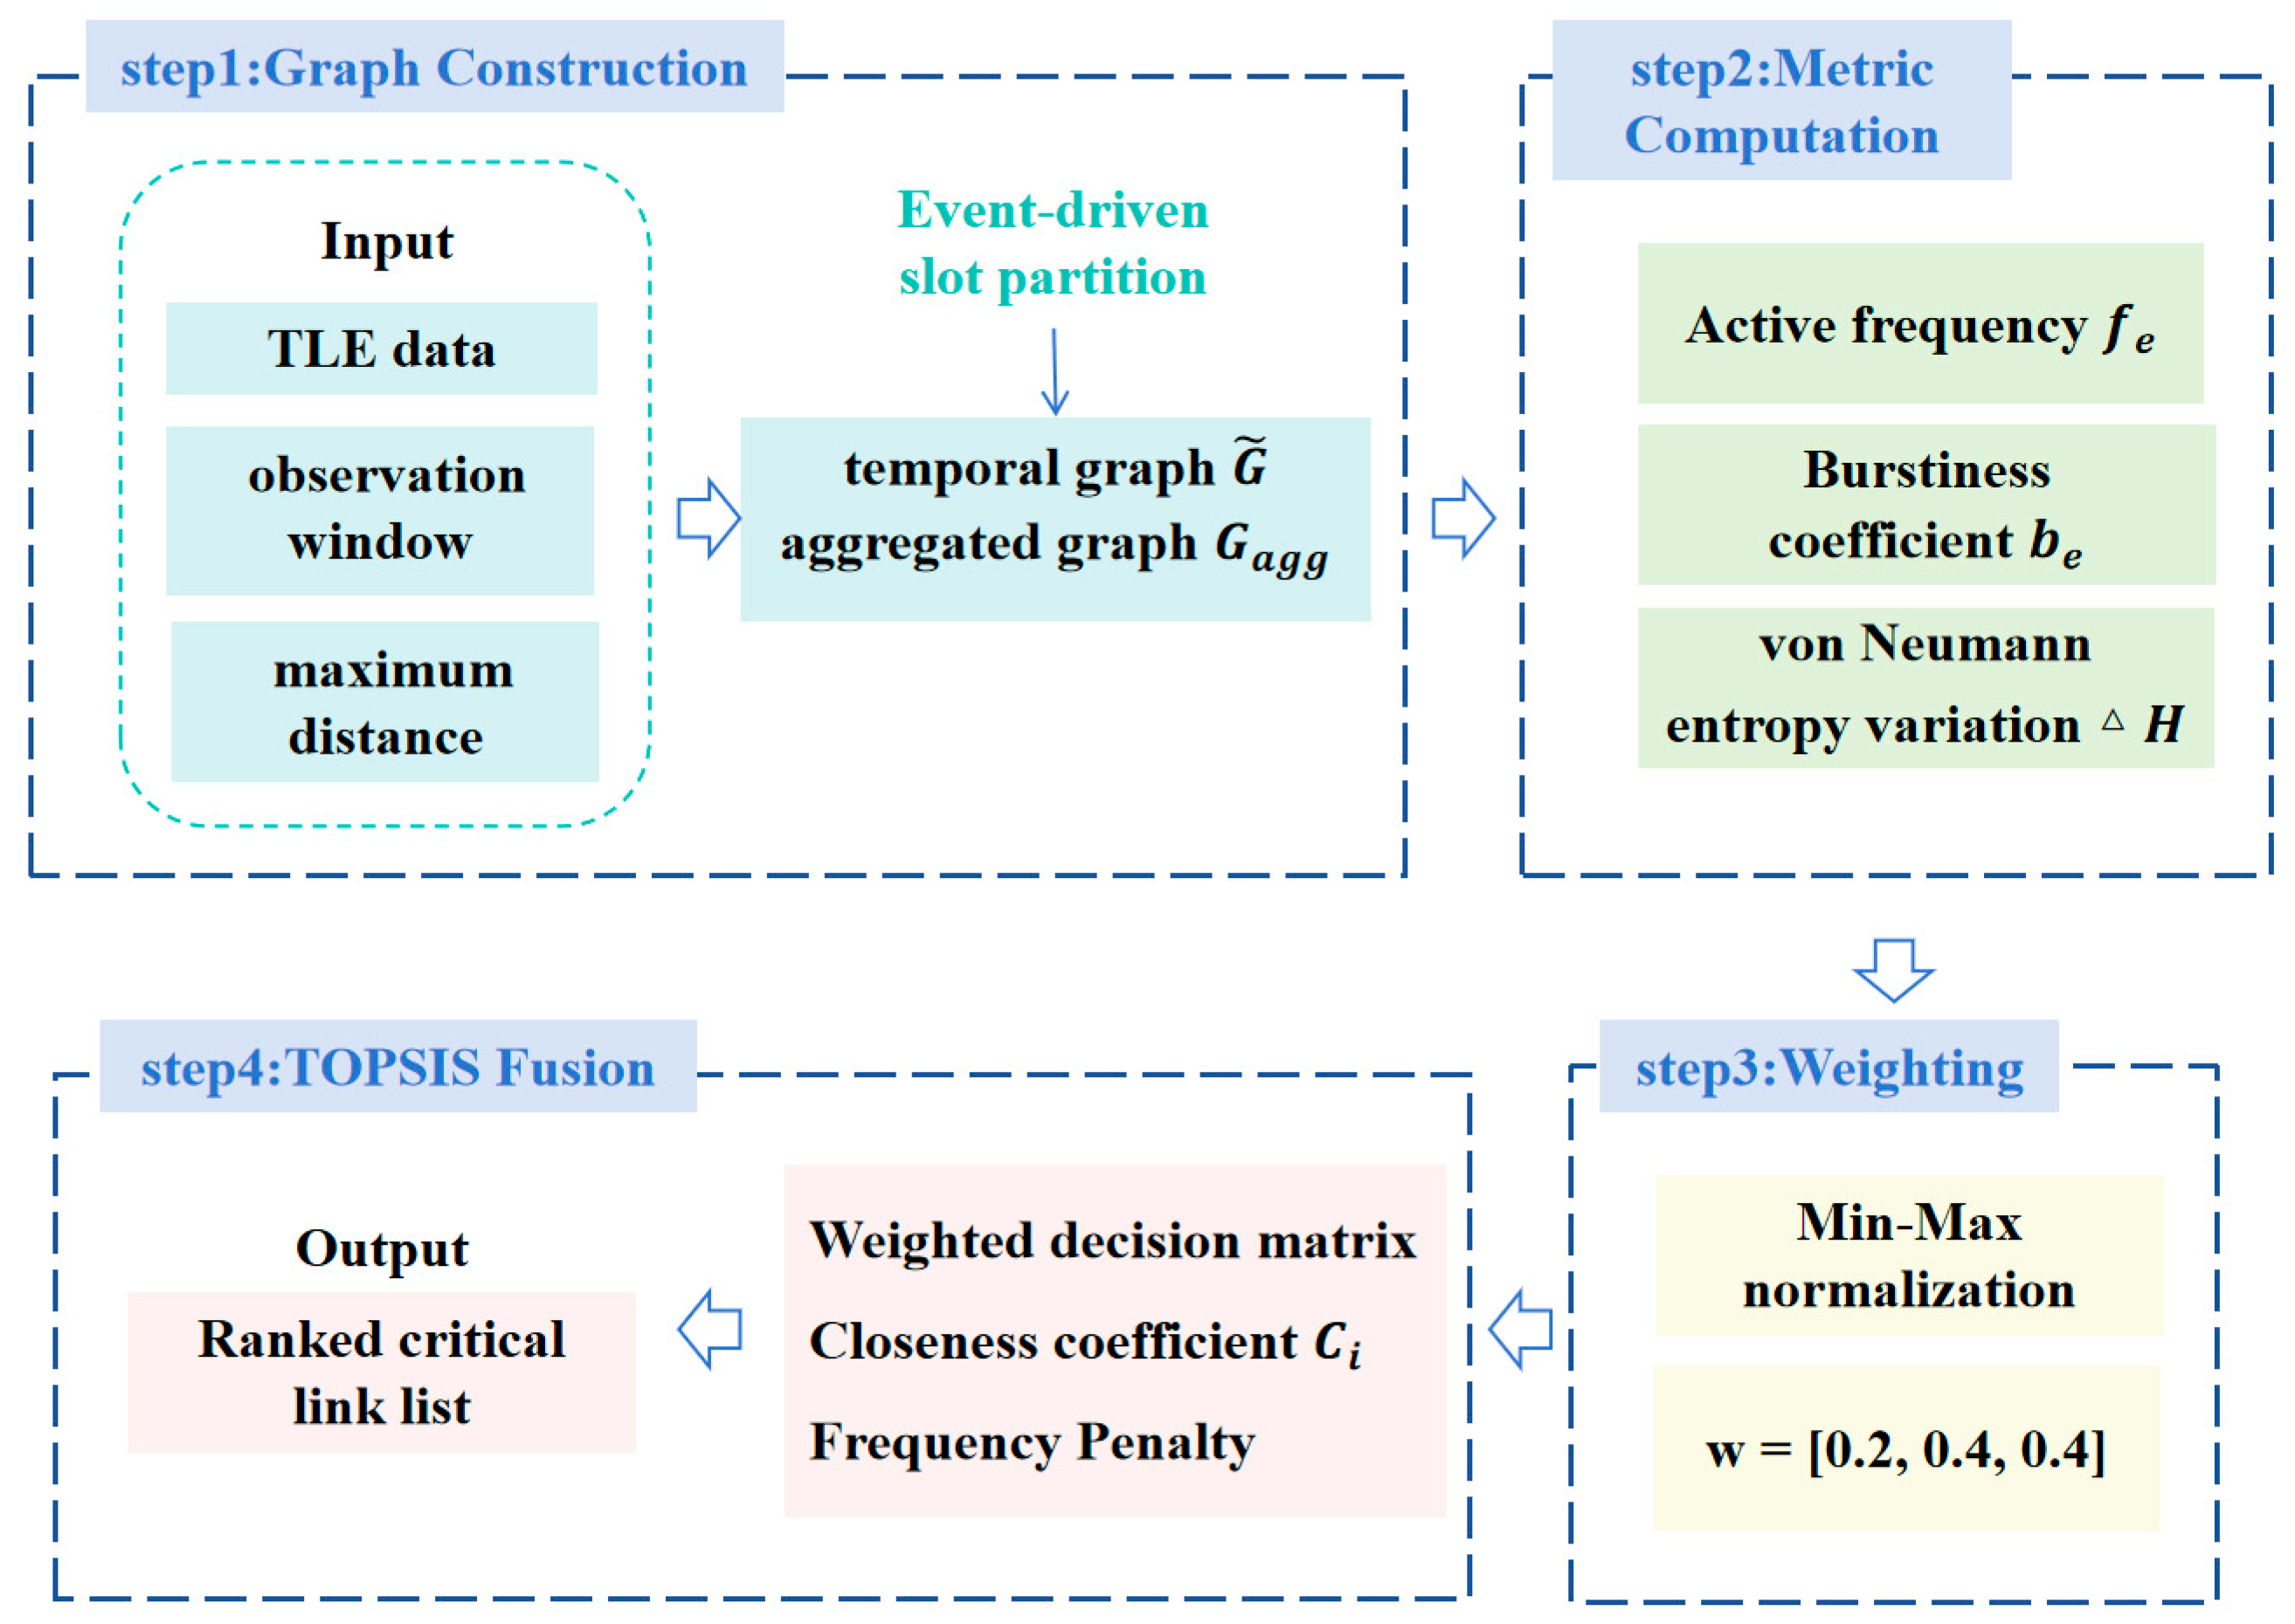
We therefore adopt a temporal connectivity perspective and construct a lightweight metric system. Three sub-metrics are designed to approximate ΔR(e) at low cost. Activity frequency measures the baseline connectivity duration of a link. Burstiness coefficient characterizes the temporal pattern of link activations. Von Neumann entropy change quantifies the structural contribution of a link to the aggregated graph. These metrics are then fused via the TOPSIS method with a predefined weight vector to produce a comprehensive link criticality score. The overall structure of the eTAPC evaluation framework is illustrated in Figure 4.
Figure 4.
Structure of the eTAPC evaluation framework.
The three metrics are selected based on the following considerations. Each metric captures link value from an independent temporal or structural dimension. Each metric can be computed by traversing only the link’s active time slots or by a single pass over the aggregated graph, avoiding global temporal path search. Together, the three metrics complement one another and collectively approximate the true contribution of a link to temporal connectivity.
3.1. Definition of Indicators
This section provides formal definitions of three temporal feature metrics. These metrics characterize the contribution of links to network temporal connectivity from the perspectives of temporal coverage, activity patterns, and structural importance.
3.1.1. Link Active Frequency
Link active frequency is defined as the ratio of the number of time slots in which the link appears to the total number of time slots in the observation window:
where is the set of time slots in which edge e appears, is the set of time slots for a given temporal graph, and M is the total number of time slots.
We use active time slot count rather than total physical duration to compute link active frequency. Event-driven time slots have unequal durations, and each time slot corresponds to a topology state. A temporal path is determined by strictly increasing time slot indices rather than physical time. A link active in multiple time slots can participate in multi-hop temporal paths across multiple topology states, independent of the duration of each state. A duration-weighted measure would bias toward links active during long stable periods, reflecting only topological stability rather than temporal importance. Therefore, counting active slots reflects the number of topology states in which a link is present, which is more relevant to temporal connectivity than physical duration.
Links that appear frequently are more likely to participate in multiple temporal paths, and their removal has a greater impact on temporal reachability. The active frequency satisfies fe ∈ [0, 1]; a larger value indicates higher link activity within the observation window. In satellite networks, intra-orbit ISLs exhibit high active frequency due to stable relative satellite positions, whereas inter-orbit ISLs show lower active frequency due to limited encounter windows.
3.1.2. Burstiness Coefficient
In temporal networks, link activity patterns depend not only on frequency but also on the regularity of inter-event intervals. The burstiness coefficient, proposed by Goh and Barabási, quantifies the degree of event clustering in a time series [23]. Let the active time slots of link e be sorted as t1 < t2 < … < tk, with inter event intervals τi = ti+1 − ti for i = 1, 2, …, k − 1, where k = |slots(e)|. The burstiness coefficient is defined as:
where μτ and στ are the mean and standard deviation of the intervals, respectively. The burstiness coefficient satisfies be ∈ [−1, 1]. When be → −1, link activity is periodic with uniformly distributed time slots. When be ≈ 0, activity approximates a Poisson process with random slot distribution. When be → +1, activity is bursty, with occurrences concentrated in few time slots. In LEO satellite networks, orbital motion causes ISL activity to exhibit short pulsed characteristics as satellites enter mutual communication range during specific periods. This metric effectively distinguishes periodically stable links from burst-concentrated links.
3.1.3. Von Neumann Entropy Change
The previous two metrics capture temporal features but do not consider the link’s position within the network topology. Von Neumann entropy, constructed from normalized eigenvalues of the Laplacian matrix, is widely used in complex network analysis. Passerini and Severini proposed an edge centrality metric based on von Neumann entropy, measuring link importance by the entropy change before and after link removal [24]. A larger entropy change indicates a more significant bridging role of the link in the network. Let the aggregated graph be Gagg = (V,Eagg), is obtained by merging all temporal edges into node pairs across time slots. The von Neumann entropy of Gagg is defined as:
where λ1, λ2, …, λN are the eigenvalues of the normalized graph Laplacian matrix L = D−1/2(D − A)D−1/2, with A the adjacency matrix and D the degree matrix. For large networks, direct eigenvalue computation is O(N3). The following approximation can be used:
where di is the degree of node i.
The structural contribution of link e is defined as the change in the von Neumann entropy of the aggregated graph after removing e:
ΔHe = H(Gagg) − H(Gagg\{e})
A larger ΔHe implies greater structural impact, indicating a more critical link. In implementation, when the network is small, exact aggregation is used. For large networks (N > 200), spectral perturbation theory is applied for batch approximation, estimating the perturbation contribution of each edge removal via eigenvalue decomposition to reduce computational cost.
The three metrics characterize temporal and structural features from complementary perspectives and avoid global temporal path search, making them suited for lightweight implementation.
3.2. Weight Configuration Analysis
In multi-attribute decision-making frameworks, the choice of metric weights directly affects the final ranking results. A reasonable weight assignment must reflect the actual contribution of each metric in the given evaluation scenario [25,26]. The relative importance of the three metrics defined in Section 3.1 cannot be determined a priori. To reveal their interrelationships and identify a reasonable weight configuration, we conduct a weight sensitivity analysis on the Iridium sparse constellation. Iridium has a network density of only 0.02, with a limited number of links and narrow metric distribution ranges. Weight variations therefore have a more pronounced impact on ranking outcomes, making it a suitable test scenario for distinguishing the evaluation differences among weight configurations.
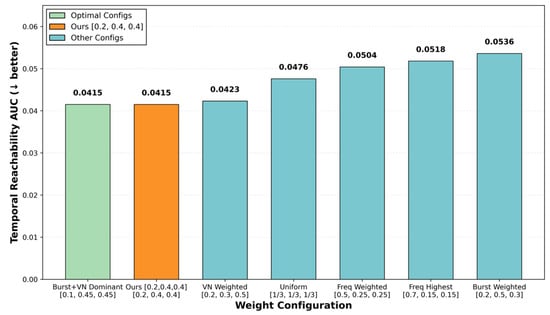
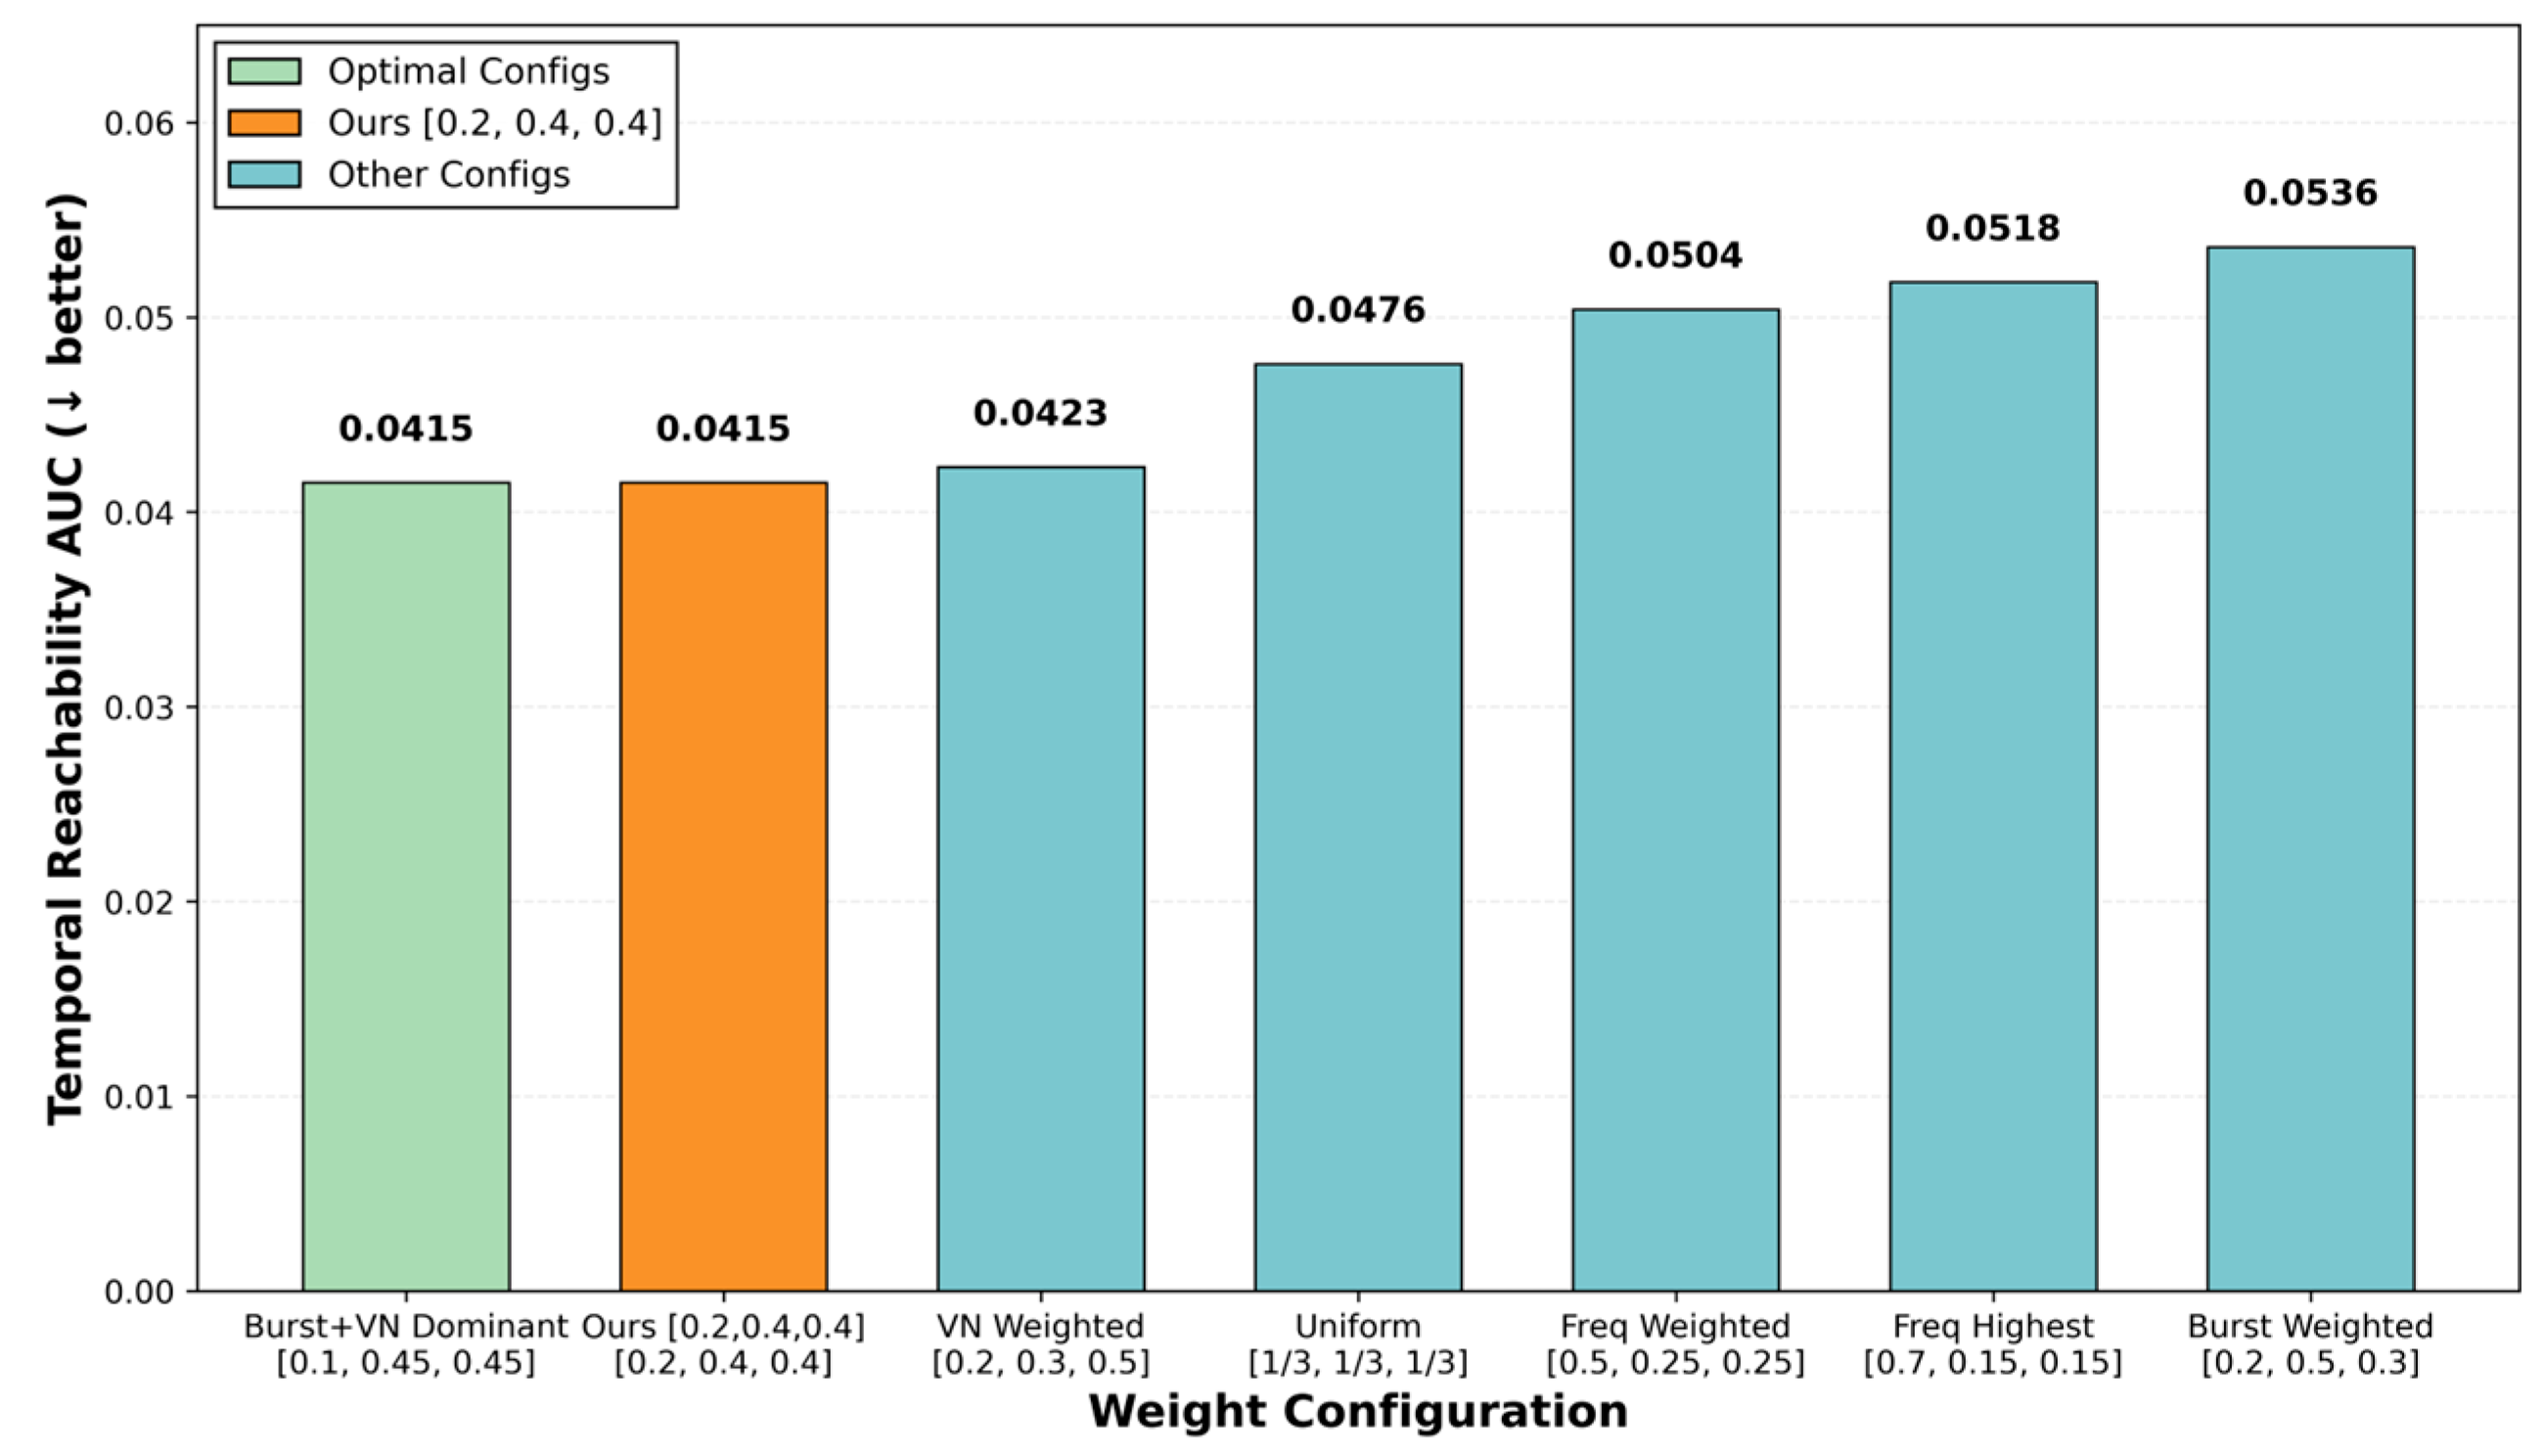
Seven representative weight configurations are selected for comparison, as shown in Figure 5 Temporal reachability AUC serves as the evaluation metric; a lower AUC indicates better discriminative performance.
Figure 5.
AUC comparison of seven weight configurations on the Iridium constellation. The downward arrow indicates that a smaller AUC corresponds to better performance. The proposed configuration [0.2, 0.4, 0.4] achieves the lowest AUC, tied with [0.1, 0.45, 0.45]. Excessive frequency weights lead to degraded performance.
Excessive frequency weights should be avoided. When ωf = 0.5 and 0.7, the corresponding Area Under the Curve (AUC) values are 0.0504 and 0.0518, significantly higher than that of our proposed scheme. In sparse constellations, link frequencies are generally low and concentrated in a narrow range. Overweighting frequency introduces substantial noise that hinders differentiation.
Burstiness and von Neumann entropy weights should be balanced. Our proposed configuration uses a 0.4:0.4 ratio between these two metrics, which ties with the configuration that assigns 0.45 to each as the optimal scheme. The burstiness-weighted configuration achieves an AUC of 0.0536, the worst among all schemes. This observation indicates that the two metrics are complementary, capturing temporal scarcity and topological bridging value respectively. Although ωf = 0.1 achieves the same AUC as our scheme, its Top-50 ranking contains 6% of links with frequency below 0.05, which is 4 percentage points higher than our scheme. When the frequency weight is too low, a link may receive an unduly high criticality score based solely on anomalous burstiness or entropy values, even if its active frequency is extremely low. Based on the above analysis, we determine the weight vector as:
where ωf, ωb, and ωh correspond to the weights of fe, be, and ΔHe, respectively. This configuration retains a baseline frequency weight while appropriately emphasizing burstiness and von Neumann entropy change.
w = [ωf, ωb, ωh] = [0.2, 0.4, 0.4]
The weight vector is determined on the sparse polar Iridium constellation. Its applicability to other constellations stems from the complementary roles of the three metrics. Active frequency captures link presence. Burstiness characterizes temporal activity distribution, relevant for both sparse polar and dense inclined constellations. Von Neumann entropy change reflects structural bridging, which is topology-dependent. These dimensions remain discriminative across different densities and orbital architectures. The weight vector retains a baseline frequency weight and balances the other two metrics, allowing it to adapt to different constellations without re-tuning. The generalizability of this weight configuration is further examined in Section 4 using the dense Starlink constellation.
3.3. Comprehensive Ranking Using TOPSIS
After determining the weight vector, we adopt the TOPSIS method, Technique for Order Preference by Similarity to Ideal Solution, to fuse the three weighted metrics into a single criticality score for comprehensive ranking. TOPSIS was introduced by Hwang and Yoon in 1981. Its core principle is that the optimal solution should have the shortest distance to the positive ideal solution and the longest distance to the negative ideal solution.
Step 1: Normalize the decision matrix. To eliminate dimensional differences among the metrics, we apply min–max normalization:
where xij is the value of the j-th metric for the i-th link.
Step 2: Construct the weighted decision matrix. Using the weight vector w = [ωf, ωb, ωh], we form the weighted normalized decision matrix:
Step 3: Determine the positive and negative ideal solutions. The positive ideal solution consists of the optimal value of each metric, while the negative ideal solution consists of the worst value. All three metrics are benefit-type, meaning larger values are better. Thus, and .
Step 4: Compute Euclidean distances and relative closeness. For each link, the distances to the positive and negative ideal solutions are calculated as:
The relative closeness of each link is then computed as:
The relative closeness Ci ∈ [0, 1] serves as the comprehensive criticality score for the link. A larger value indicates that the link is closer to the positive ideal solution and farther from the negative ideal solution, meaning it is more critical.
3.4. Algorithm Workflow and Complexity Analysis
This section presents the workflow of the eTAPC algorithm, illustrated in Figure 6. The algorithm takes satellite TLE data, observation window length, and maximum link distance as inputs and outputs a ranked list of critical links.
Figure 6.
Workflow of the eTAPC algorithm.
The workflow consists of four stages. First, an event-driven slot partitioning strategy constructs the temporal graph , while all edges across slots are merged to form the aggregated graph Gagg. Second, three metrics are computed for each temporal edge: active frequency fe burstiness coefficient be, and von Neumann entropy change ΔHe. Third, the metrics are normalized via Min–max scaling and weighted with the vector w = [0.2, 0.4, 0.4] determined in Section 3.2. Fourth, TOPSIS fusion produces a relative closeness coefficient Ci for each link. Links with active frequency below 5% are penalized up to 30%, those between 5% and 10% up to 10%, and those above 10% receive no penalty. The adjusted score is , where p(fe) is the penalty factor determined by the above rules. The links are then sorted in descending order of the adjusted coefficient to produce the final ranked list.
The frequency penalty is designed according to the importance of link activity for temporal paths. A link whose activity frequency is below 5% appears in fewer than 5% of the time slots, and its participation in multi-hop temporal paths is therefore rare. The 10% threshold defines a transition interval for links that are only occasionally active. The penalty coefficients 0.3 and 0.1 reduce the scores of low-activity links that would otherwise be overestimated in the Top-K ranking, while links of potential importance are retained. The validity of these parameter values is supported by the sensitivity analysis in Section 4.7.
The computational complexity of eTAPC consists of three components. Let |ε| denote the number of contact windows, M the number of time slots, the number of temporal edges, and N the number of satellite nodes.
Temporal graph construction has complexity O(|ε|logM).
Metric computation requires for active frequency and burstiness coefficient, and O(N3) for von Neumann entropy change in small networks (N ≤ 200), or O(N3 + |Eagg|) via spectral perturbation in large networks.
TOPSIS fusion and sorting contribute and , respectively. The overall complexity is therefore:
In typical LEO constellations, , making the dominant term. The algorithm avoids global temporal path search, achieving linear-logarithmic complexity and suitability for large-scale deployment.
4. Experimental Analysis
This section evaluates the proposed eTAPC method on two LEO satellite constellations with distinct topological characteristics: the dense Starlink shell constellation and the sparse Iridium polar constellation. The experiments are conducted from two perspectives: attack effectiveness and metric ablation.
4.1. Experimental Setup
4.1.1. Dataset
Two types of real TLE data were used in the experiment. The first dataset was from the Starlink constellation, from which 668 satellites with an inclination of approximately 53° and an orbital altitude of 530–550 km were selected. It featured an observation window of 30 min and a network density of approximately 0.19. The second dataset consisted of the Iridium polar constellation, comprising 66 operational satellites at an orbital altitude of approximately 780 km, with an observation window of 15 min and a network density of approximately 0.02. Based on the TLE data, the SGP4 orbital propagation model was used to calculate the instantaneous satellite positions. The availability of an inter-satellite link between two satellites was determined by geometric visibility conditions: the inter-satellite distance had to be less than the maximum communication range Dmax = 2000 km, and the line of sight had to be unobstructed by the Earth. After extracting the contact windows for all ISLs, an event-driven time-slot partitioning strategy was employed, and a temporal graph was constructed. The key experimental parameters are summarized in Table 1.
Table 1.
Experimental parameters.
4.1.2. Comparison Methods
To comprehensively evaluate the performance of eTAPC, the following four baseline methods were selected for comparison:
Critical Link Sequence Detection (CLSD) [15]: Calculates the frequency with which each link is used in the shortest-delay paths on a time-extended graph to quantify a link’s contribution to end-to-end communication delay. This method represents a delay-driven perspective on link evaluation.
Static Betweenness: Calculates the betweenness centrality of an edge on a static graph aggregated across all time slots, defined as the proportion of shortest paths between all node pairs that pass through that link. This method serves as a baseline that ignores temporal information.
Temporal Degree Centrality: Counts the number of times a link appears in each time slot, reflecting the link’s overall activity within the observation window, which represents a temporal activity-oriented evaluation perspective.
Random Baseline: Randomly generates a centrality score within the interval [0, 1] for each temporal edge.
4.1.3. Evaluation Criteria
Four metrics quantify network performance degradation after link removal.
Global Efficiency (GE):
where N is the number of nodes and dij is the shortest-path hop count. A larger E indicates higher propagation efficiency; a faster drop in E under attack implies greater disruption.
Largest Component Ratio (LCR):
Here, CK denotes the k-th connected component, and |CK| is the number of nodes it contains. A larger L means better retained connectivity; a sharp decline reflects fragmentation.
Temporal Reachability (TR):
where ℜ is the set of ordered node pairs (s,d) connected by a time-increasing path. A higher R indicates stronger temporal connectivity, essential for end-to-end services in satellite networks.
Average Temporal Distance (ATD):
where τs(d) is the earliest arrival timeslot. A smaller corresponds to lower average delay; an increase in under attack indicates degraded temporal efficiency.
Area Under the Curve (AUC): We also adopt AUC as a comprehensive metric, which integrates the variation in the above four metrics over a progressive link removal process. GE, LCR, and TR are performance-type metrics, and their values decrease as links are removed. A smaller AUC therefore corresponds to more accurate identification of critical links. ATD is a cost-type metric, and its value increases as latency increases after an attack. A larger AUC therefore corresponds to more accurate identification of critical links.
4.2. Validity Verification
4.2.1. Link Attack Experiments
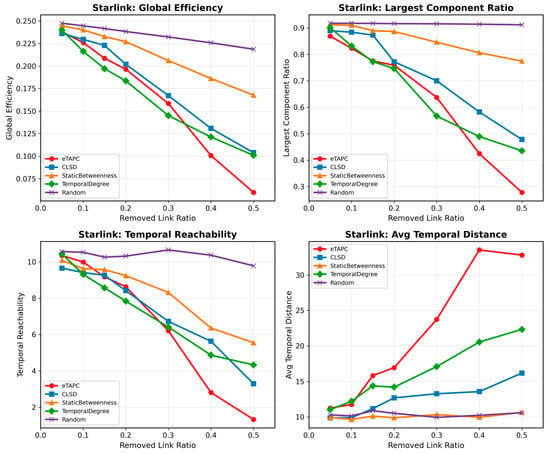
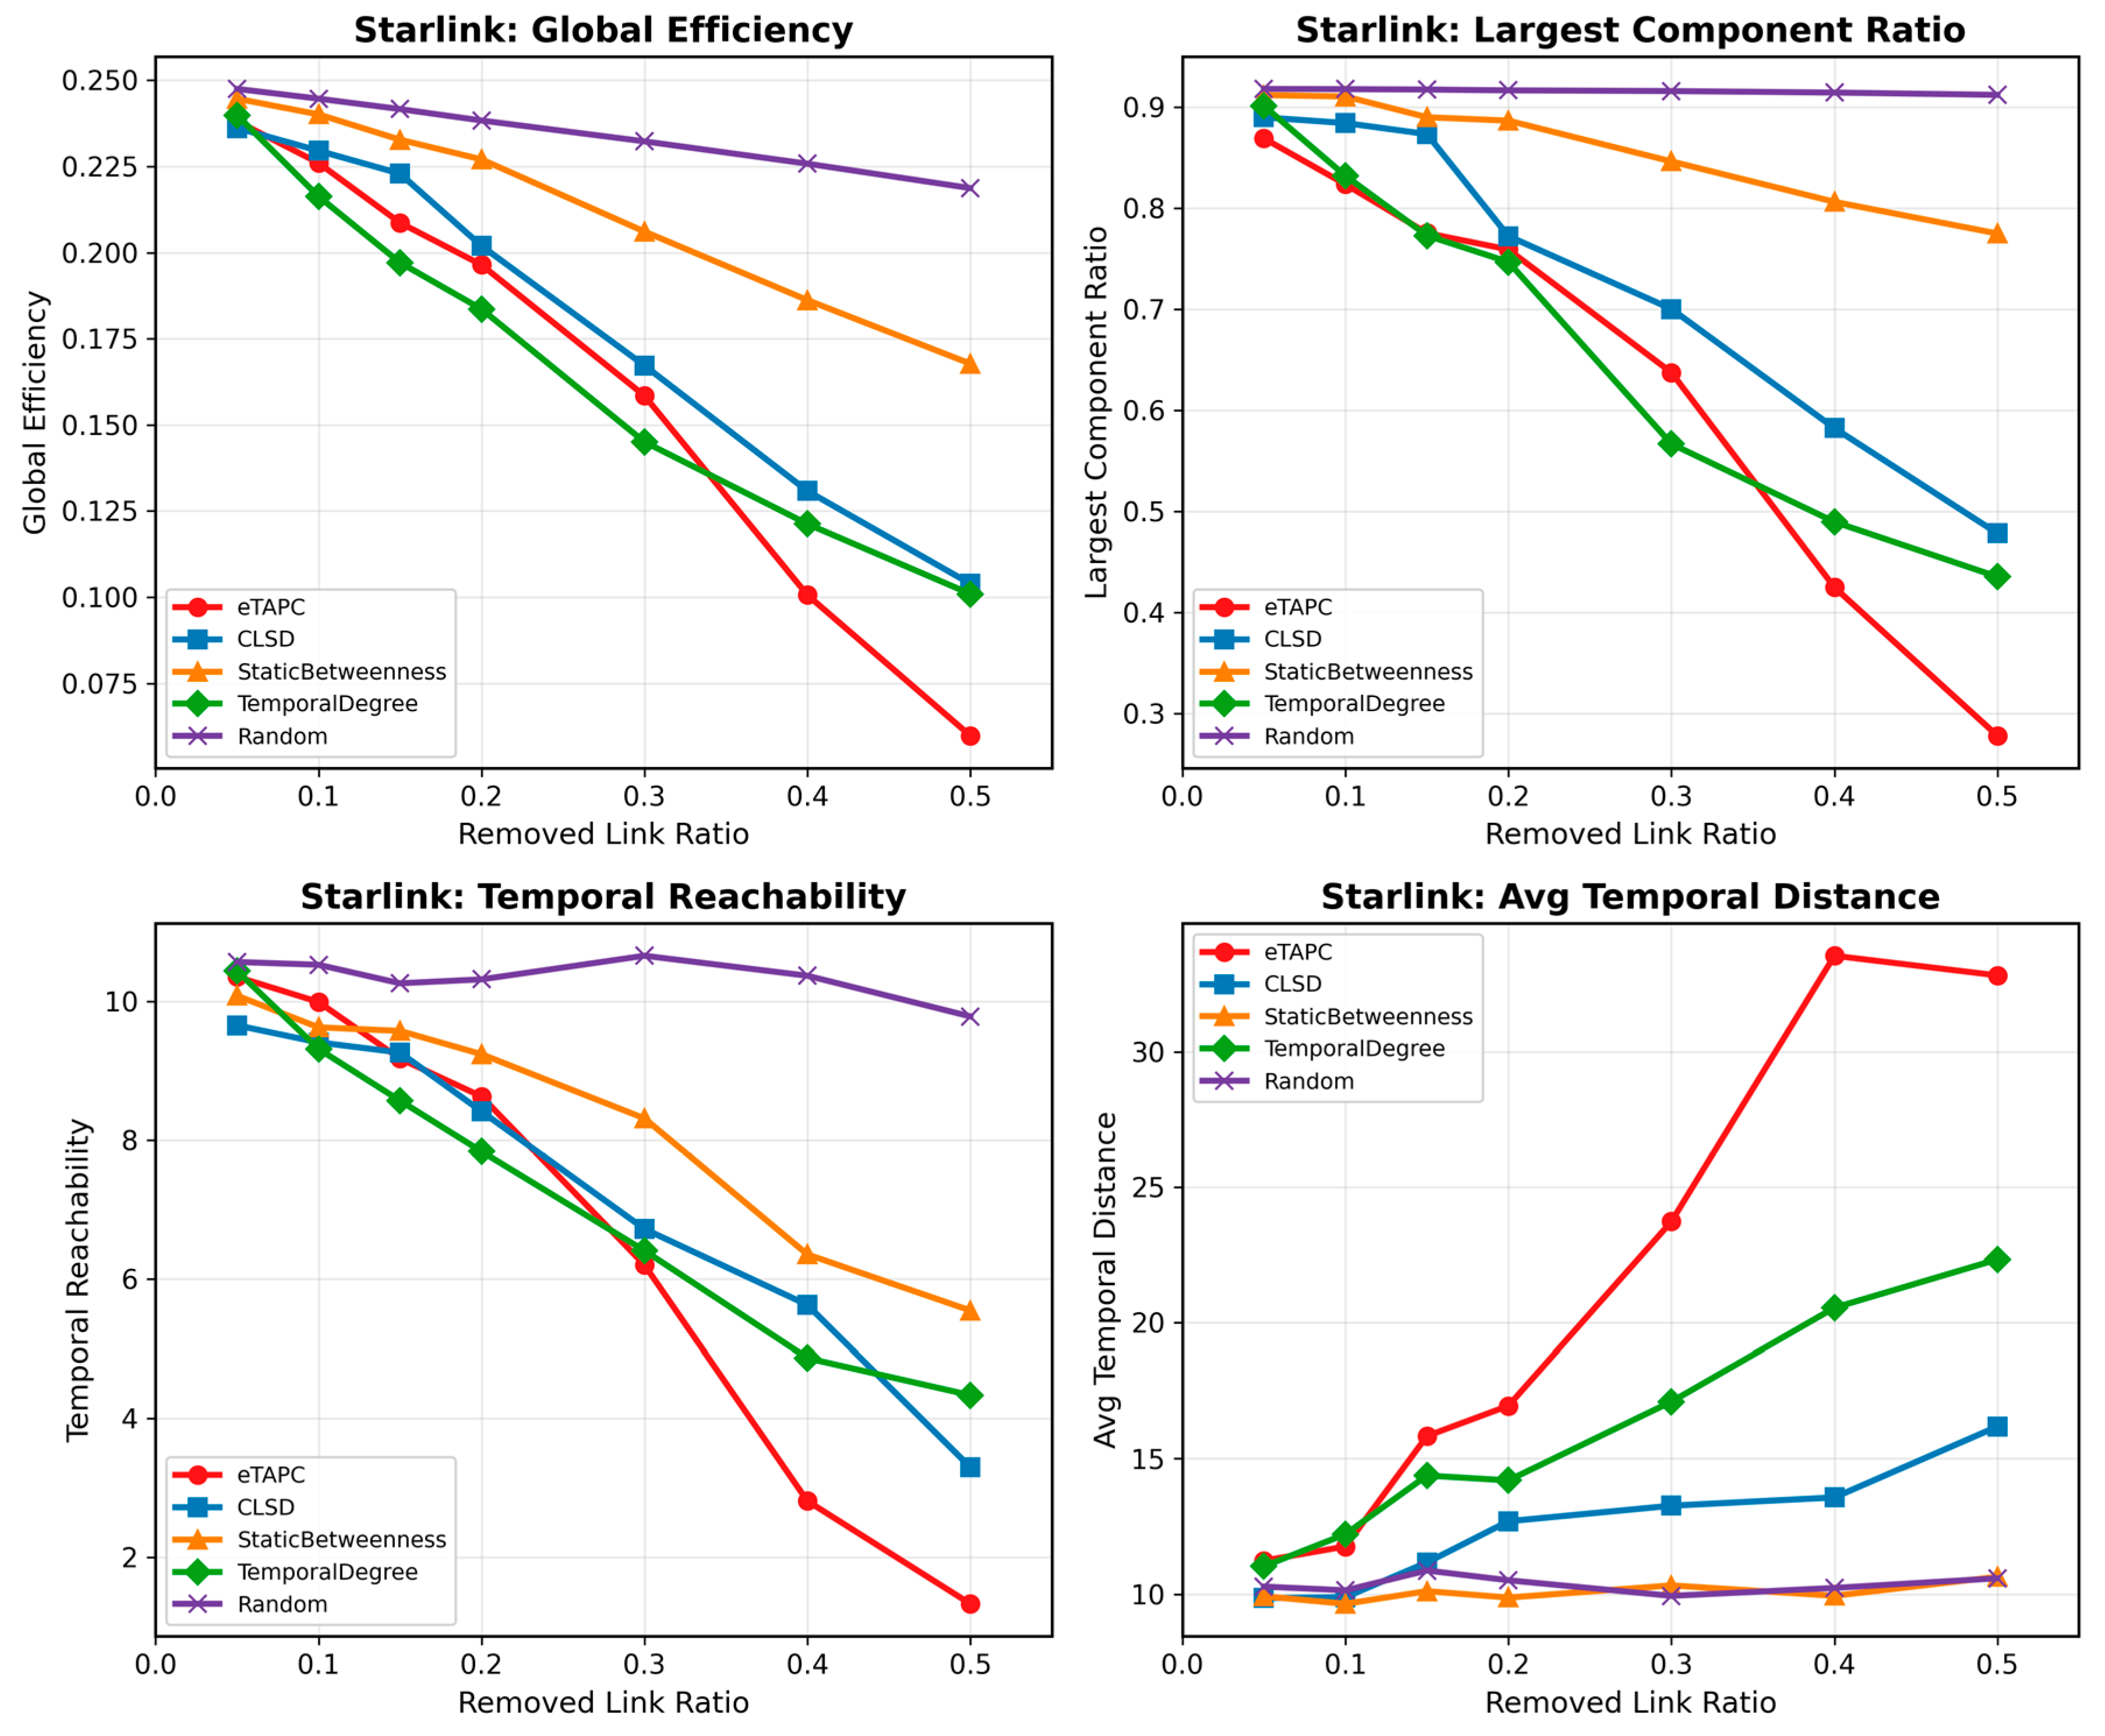
Table 2 summarizes the AUC values for the five methods on the Starlink constellation. eTAPC achieves the best results across all four metrics. For temporal reachability, the AUC of eTAPC is 2.635, representing a 17.8% reduction compared to CLSD, a 14.6% reduction compared to temporal degree centrality, and a 27.8% reduction compared to Static Betweenness. eTAPC also achieves the best results for global efficiency, largest component ratio, and average temporal distance, validating its effectiveness in dense networks. As shown in the Starlink constellation attack curves in Figure 7, eTAPC exhibits the steepest decline when the attack ratio is low (r ≤ 0.15), indicating that its top-ranked links have a significant impact on the network’s global connectivity.
Table 2.
AUC comparison on Starlink.
Figure 7.
Attack performance comparison on Starlink. Lower AUC is better for GE, LCR, and TR; higher AUC is better for ATD.
Table 3 summarizes the corresponding AUC values on the Iridium constellation. eTAPC achieves an AUC of 0.0468 for temporal reachability, outperforming the random baseline and temporal degree centrality by 31% and 7%. For global efficiency, largest component ratio, and average temporal distance, eTAPC ranks second or third among the five methods, with the performance gap to the best-performing method remaining within 10% in all cases.
Table 3.
AUC comparison on iridium.
Notably, eTAPC does not achieve the lowest AUC for every metric on Iridium, which is expected. In sparse networks, limited redundant paths make connectivity dominated by a few bridge links, so static betweenness and delay-based CLSD can also identify some critical links, reducing the advantage of the proposed multi-dimensional temporal metrics. In contrast, in the dense Starlink constellation, abundant alternative paths make temporal coverage, burstiness, and structural bridging more discriminative, enabling eTAPC to achieve the best AUC on all four metrics. Although eTAPC is not optimal for every metric on Iridium, its lightweight design offers a clear advantage in computational efficiency, making it more suitable for online deployment in large-scale constellations. Subsequent analyses will evaluate its correlation with the exact temporal-reachability loss ΔR(e), computational efficiency, and ablation performance.
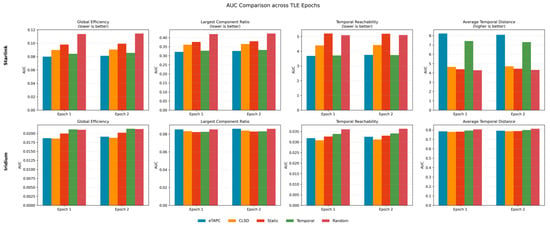
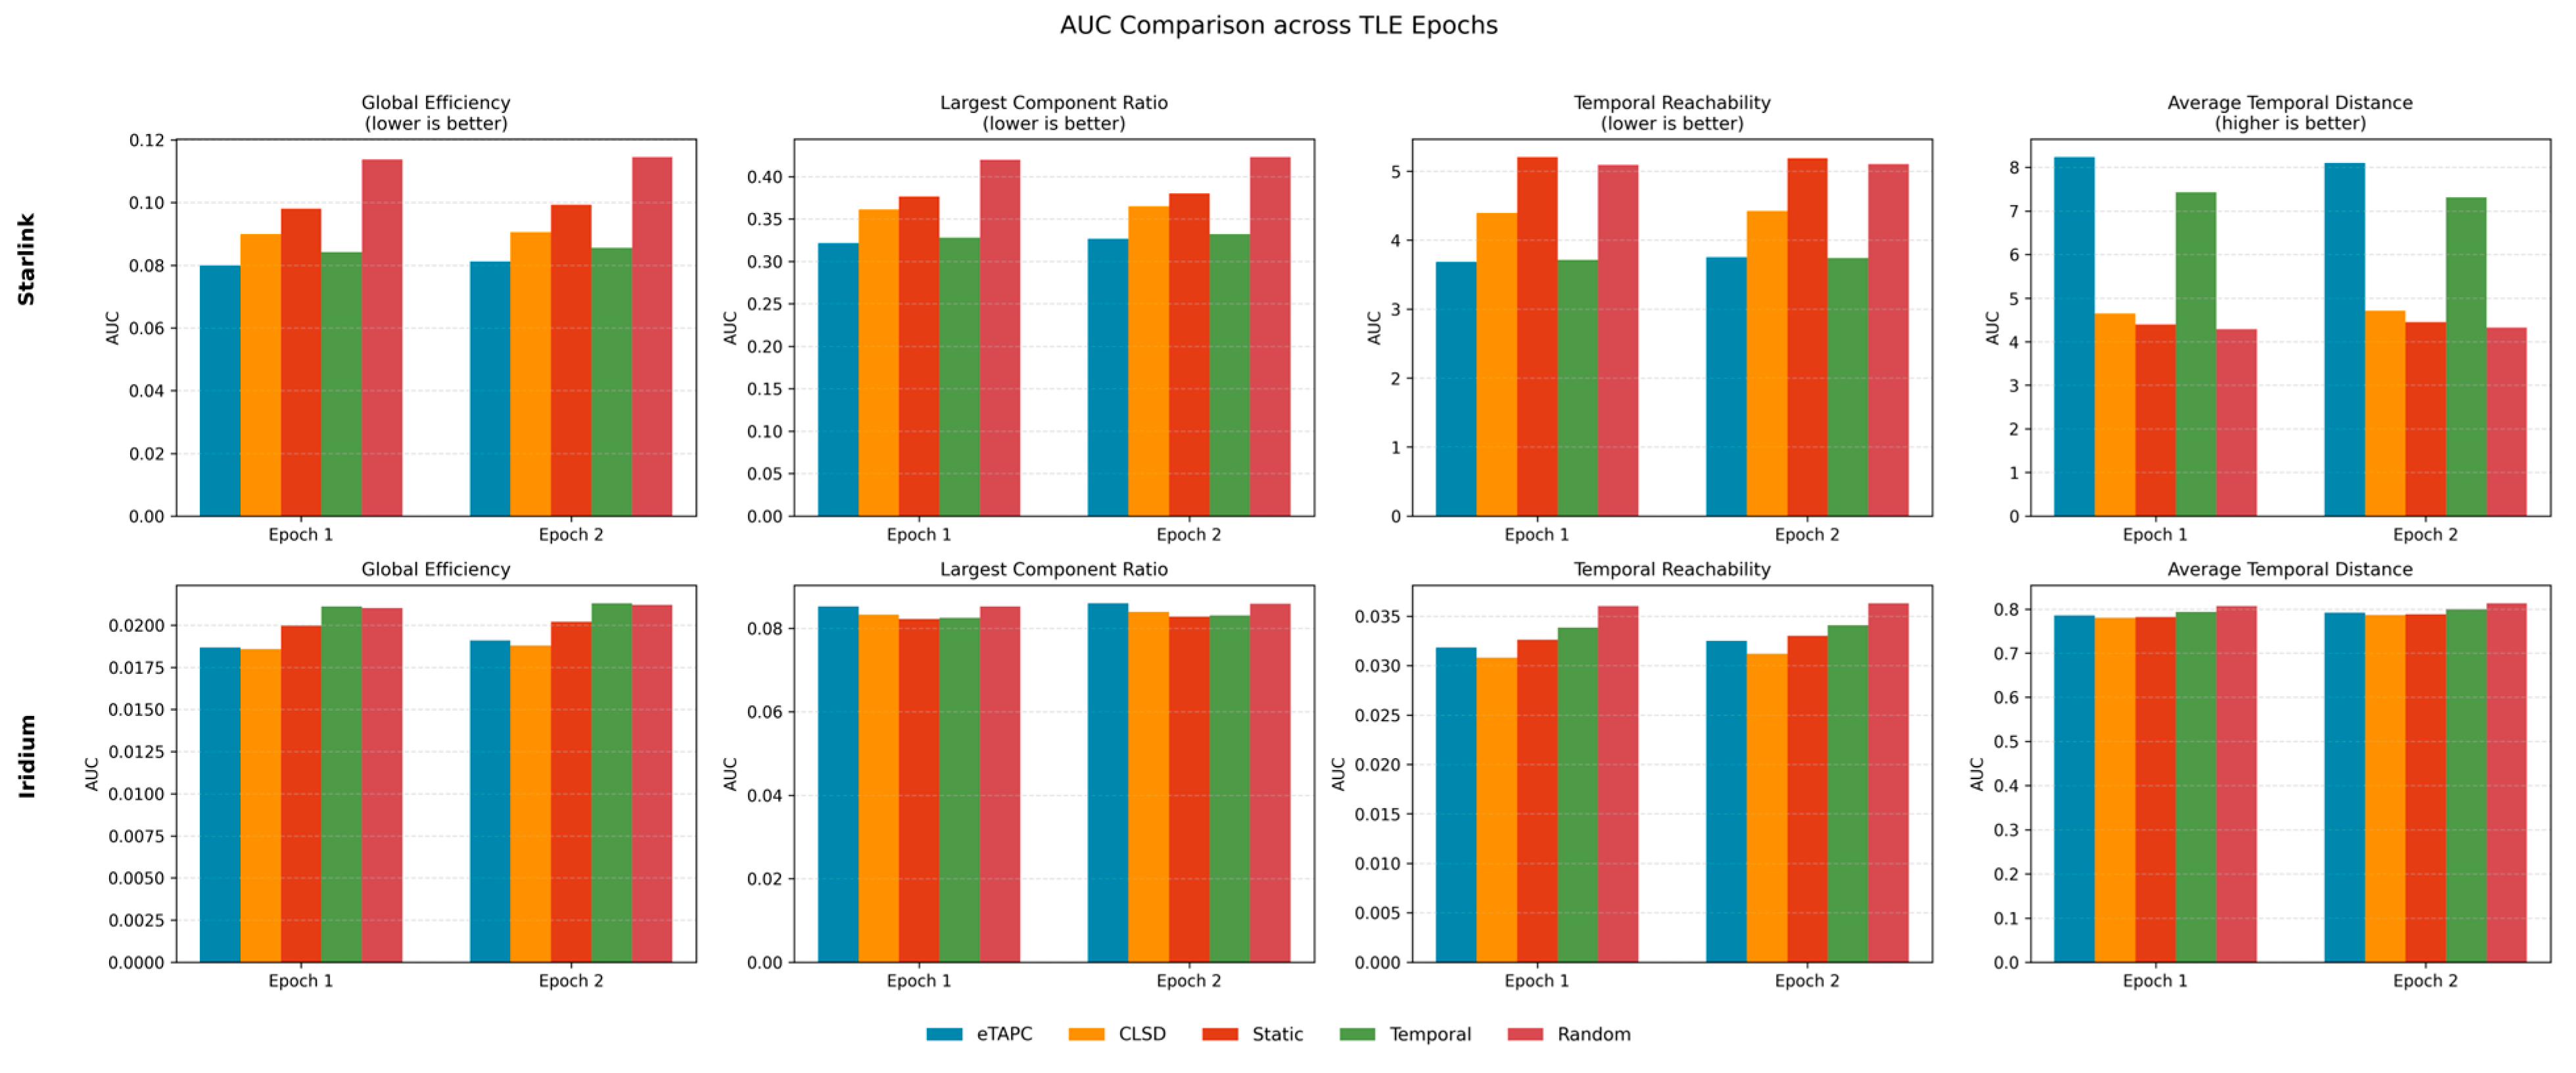
To verify generalizability, we repeated the attack experiments using TLE data with different epochs for each of the Starlink and Iridium constellations under identical settings. Figure 8 shows that eTAPC’s temporal reachability AUC varies by less than 5% across different TLE epochs, with consistent method ranking. Specifically, eTAPC remains optimal on all four metrics for Starlink and within 10% of the best method for the temporal reachability AUC on Iridium. These results confirm that eTAPC does not rely on a specific TLE epoch and exhibits good temporal stability and generalizability.
Figure 8.
AUC comparison under two TLE epochs.
4.2.2. Top-K Link Score Distribution
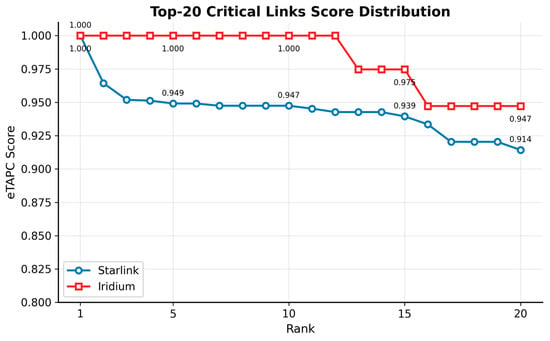
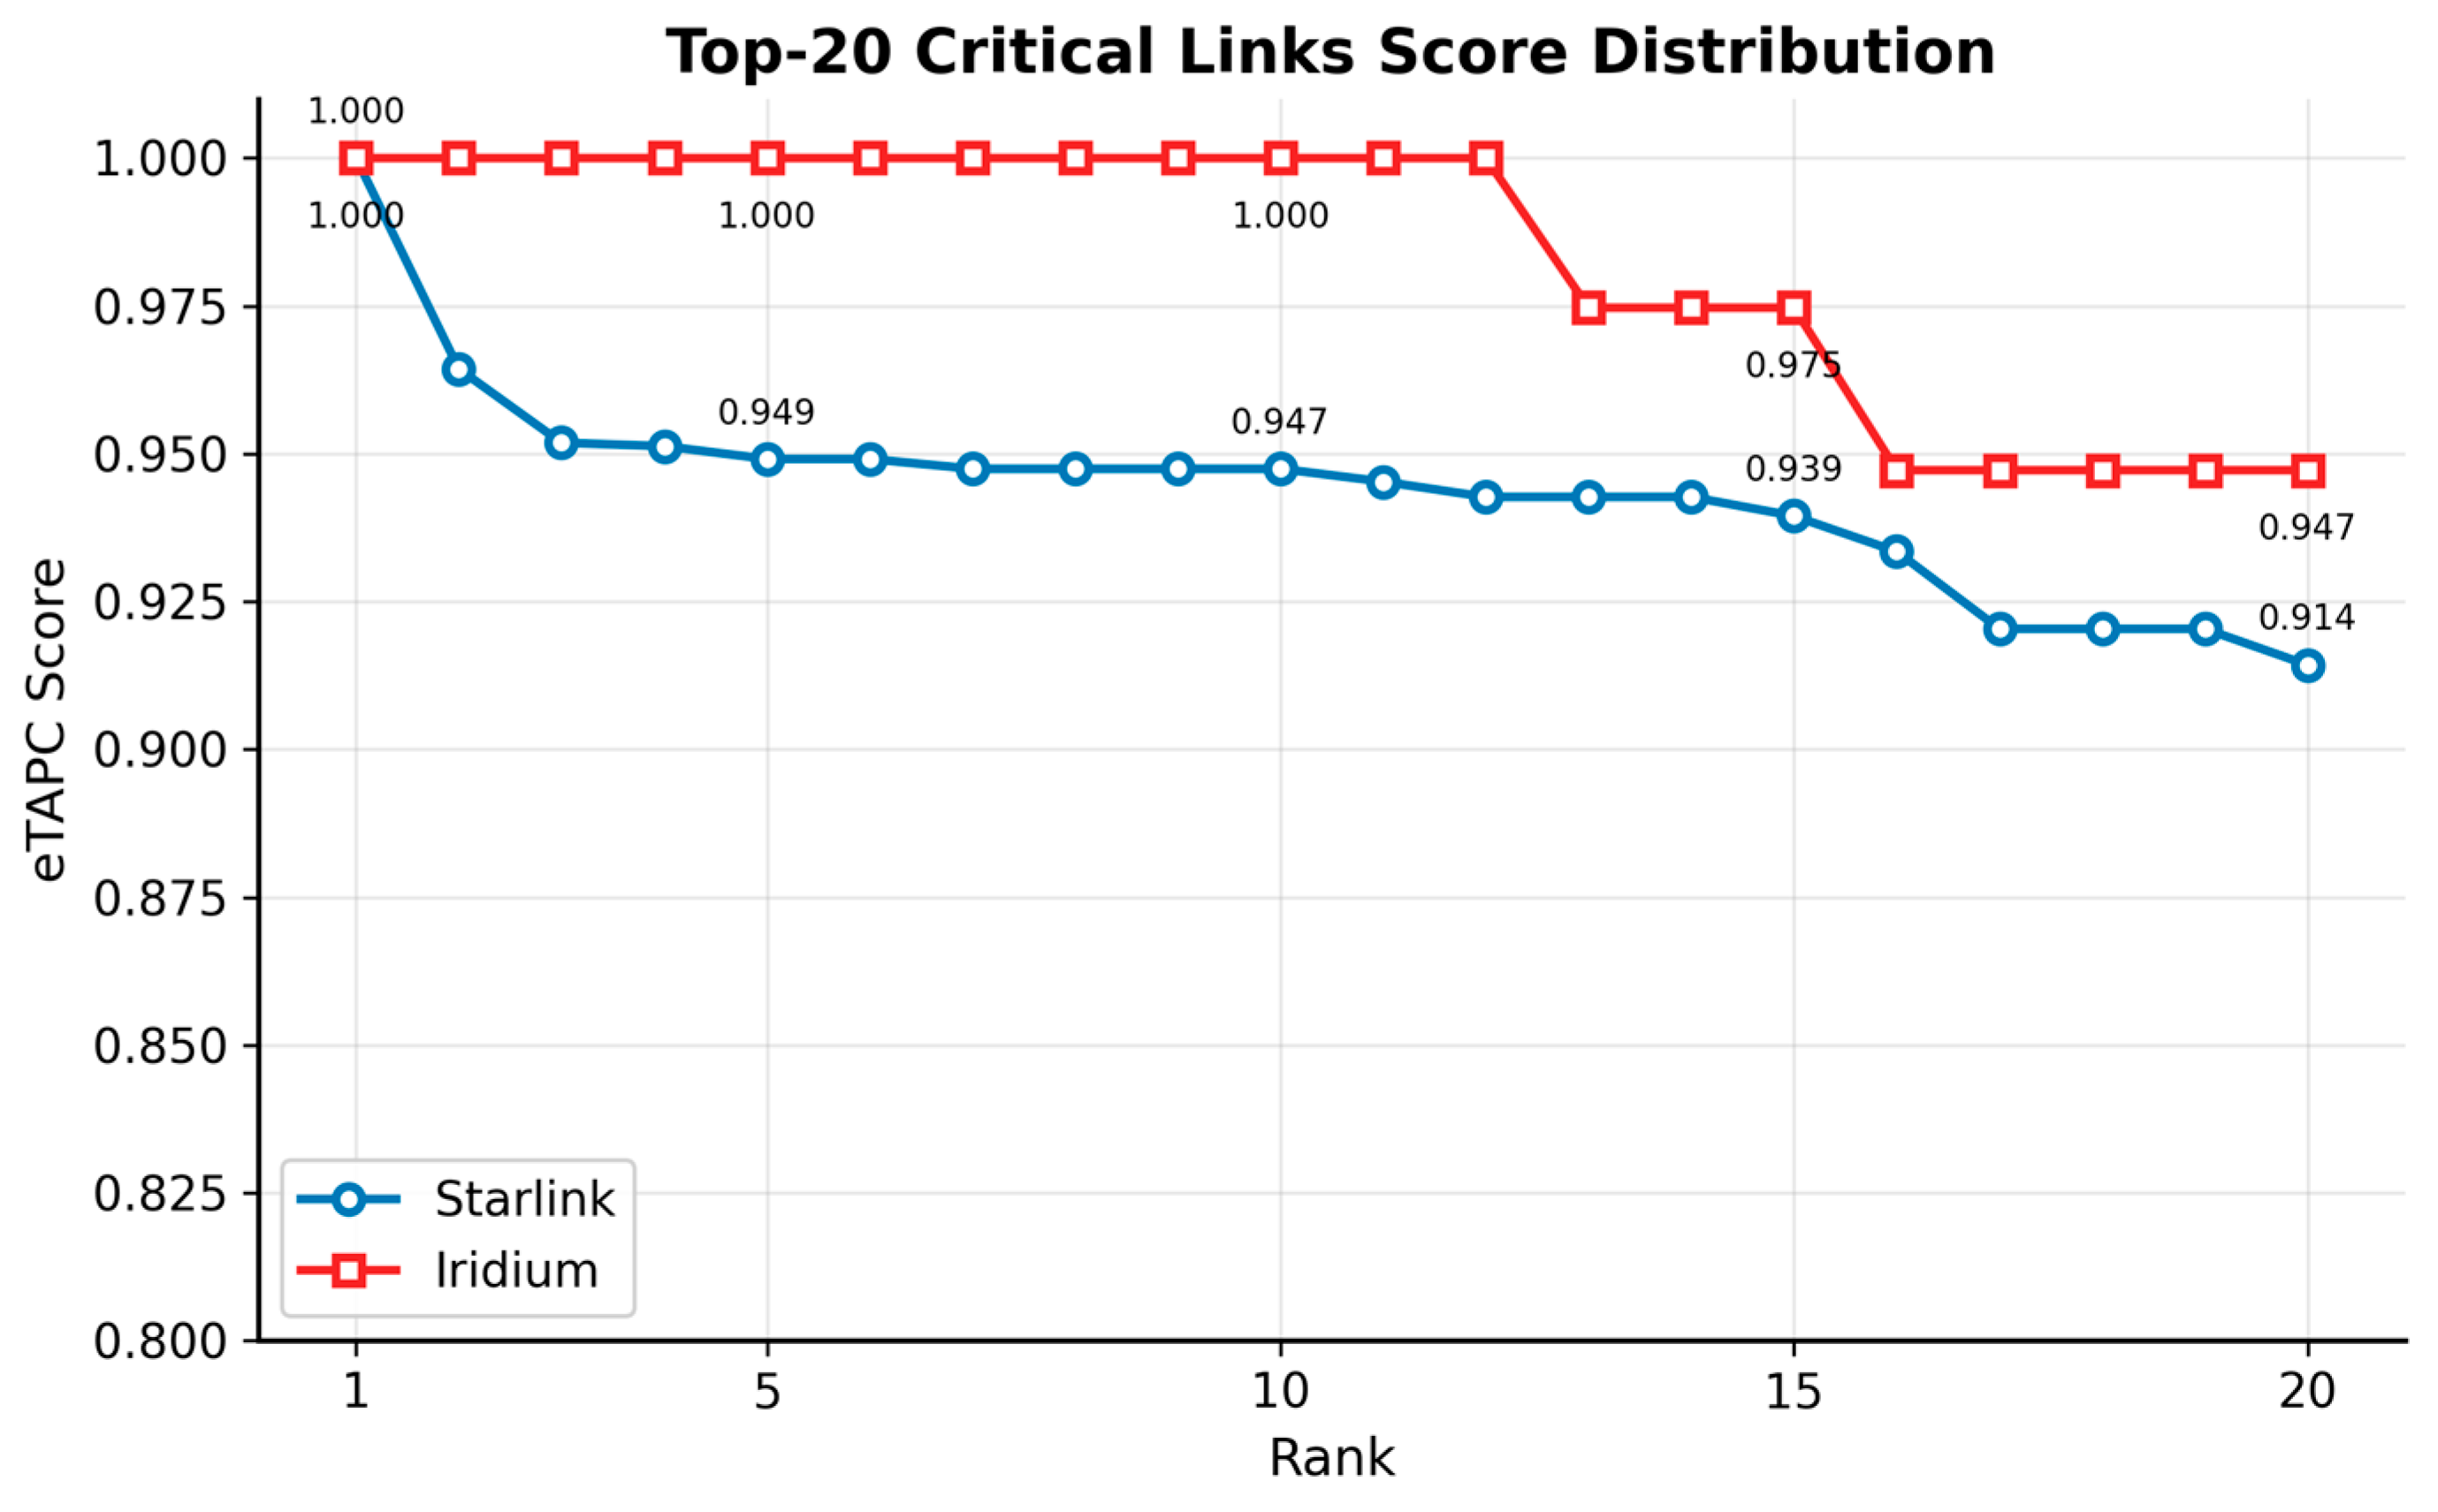
Figure 9 shows that the eTAPC scores for both Starlink and Iridium decrease as the rank increases, but the decay patterns differ significantly.
Figure 9.
Score distribution of the top-20 critical links on the Starlink and Iridium constellations.
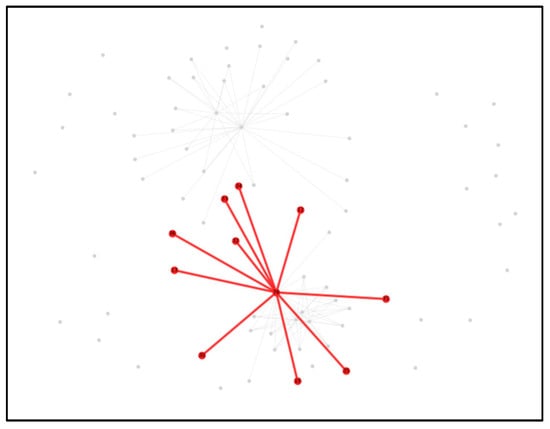
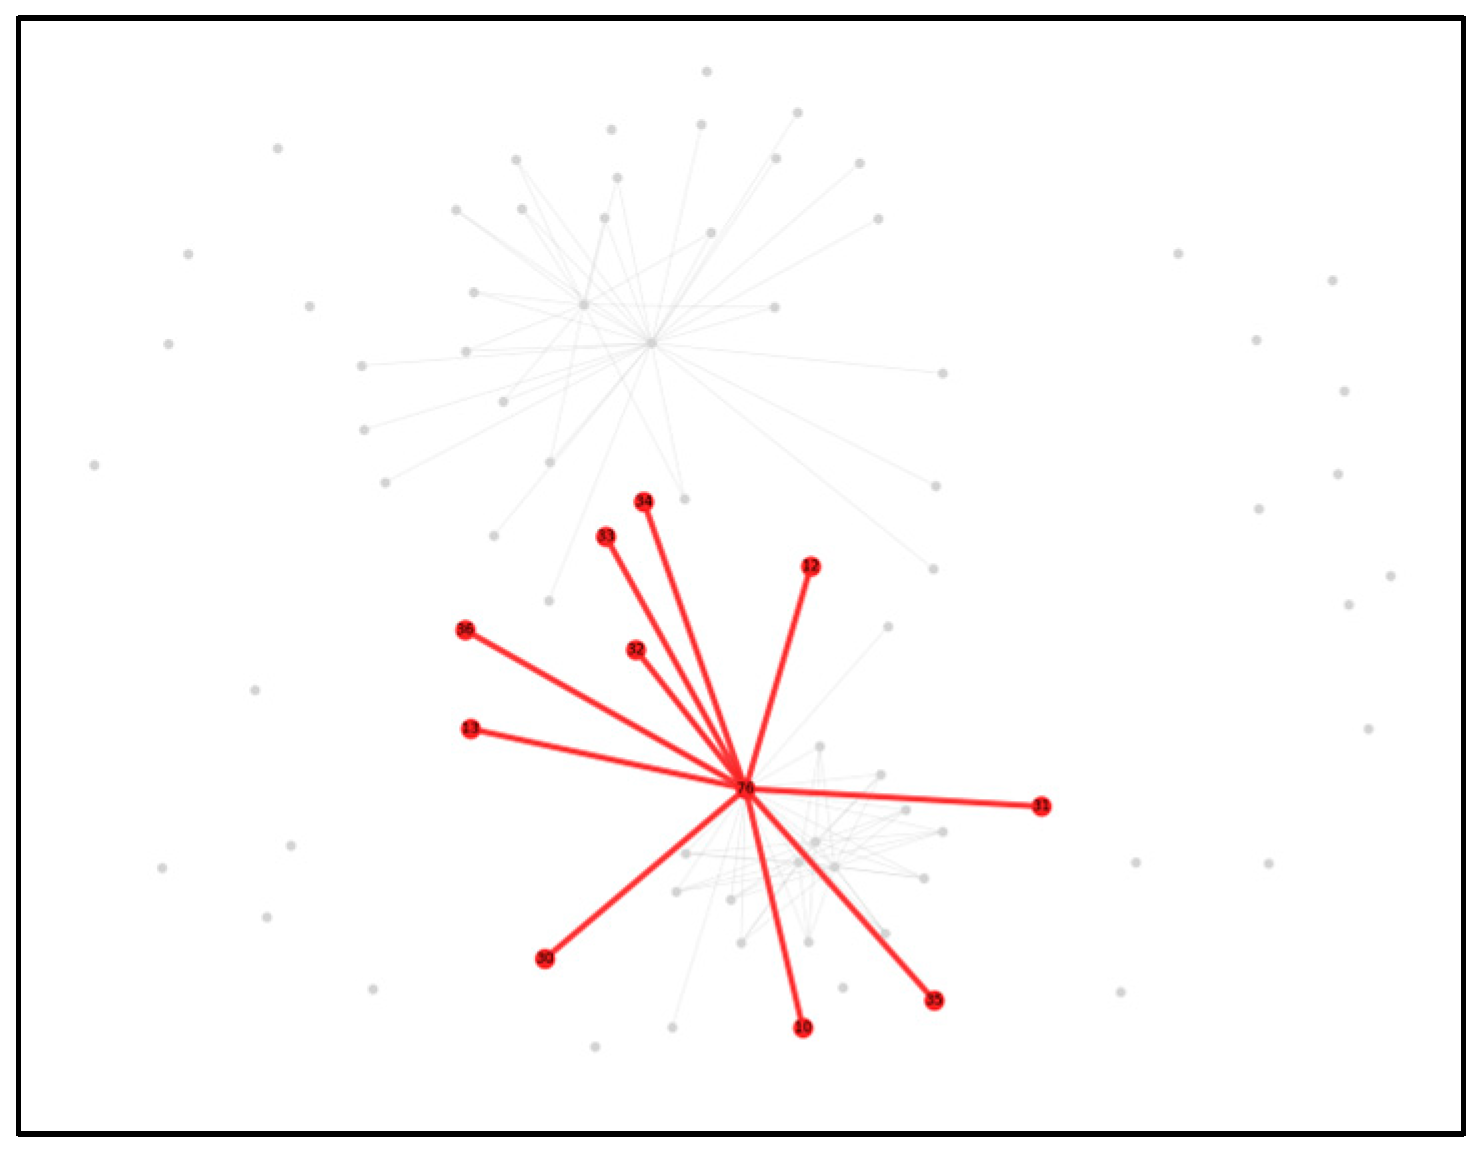
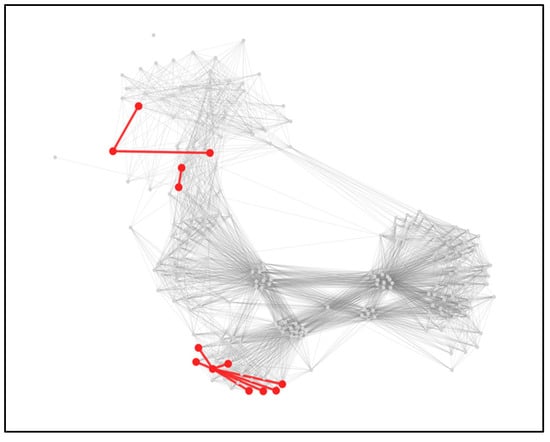
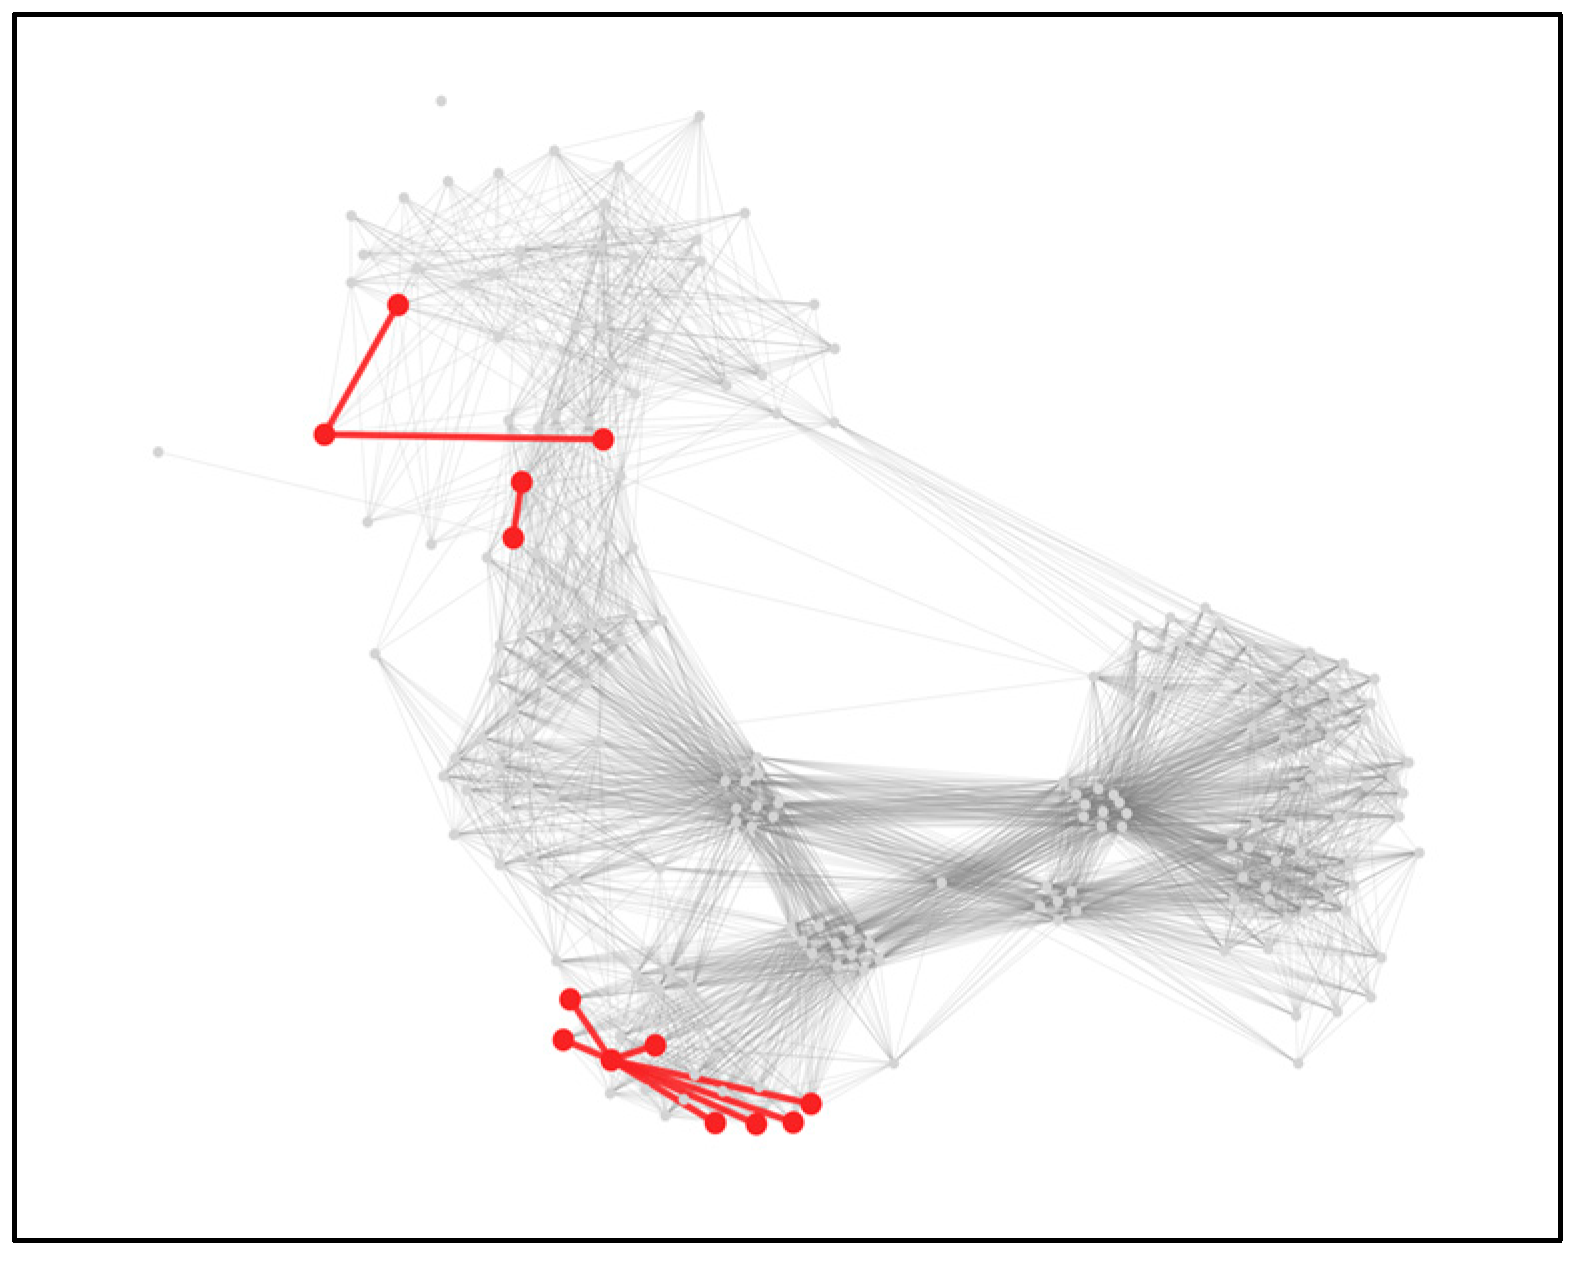
Figure 10 shows the topological distribution of the top-10 critical links on the Iridium constellation Figure 11 shows the corresponding distribution on the Starlink constellation.
Figure 10.
Top-10 critical links identified by eTAPC on the Iridium constellation. The red lines and nodes represent the top-10 critical links identified by eTAPC, while the grey lines and nodes represent the remaining network topology.
Figure 11.
Top-10 critical links identified by eTAPC on the Starlink constellation. The red lines and nodes represent the top-10 critical links identified by eTAPC, while the grey lines and nodes represent the remaining network topology. For Starlink, the scores of the top-10 links are concentrated between 0.95 and 1.00, and the score for the 20th-ranked link drops only to approximately 0.93, exhibiting a gentle decline. This pattern reflects the characteristic that multiple links are equally critical in dense networks. For Iridium, the scores drop rapidly from 1.00 for the top-ranked link to 0.89 for the 10th-ranked link, falling below 0.85 by the 20th-ranked link. This steep decline indicates that in a sparse network, only a few links perform irreplaceable connectivity functions, and the comprehensive scores of high-ranking links differ very little; thus, the removal of any single critical link would result in a comparable degree of performance degradation.
4.3. Correlation with Exact ΔR(e)
To validate that the three proposed metrics collectively approximate the true link criticality, we computed the exact temporal reachability loss ΔR(e) for each physical link on the Iridium constellation by sequentially removing each link and recalculating the global temporal reachability. We then compared the eTAPC ranking with the exact ΔR(e) ranking using Spearman rank correlation. The Spearman correlation coefficient is ρ = 0.898 with p < 10−10, indicating a strong positive correlation between the eTAPC score and the actual temporal-reachability loss. This confirms that the proposed lightweight metrics effectively capture the essential characteristics of link criticality without the need for expensive global path search.
4.4. Ablation Experiment
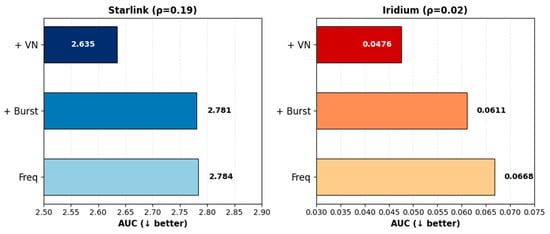
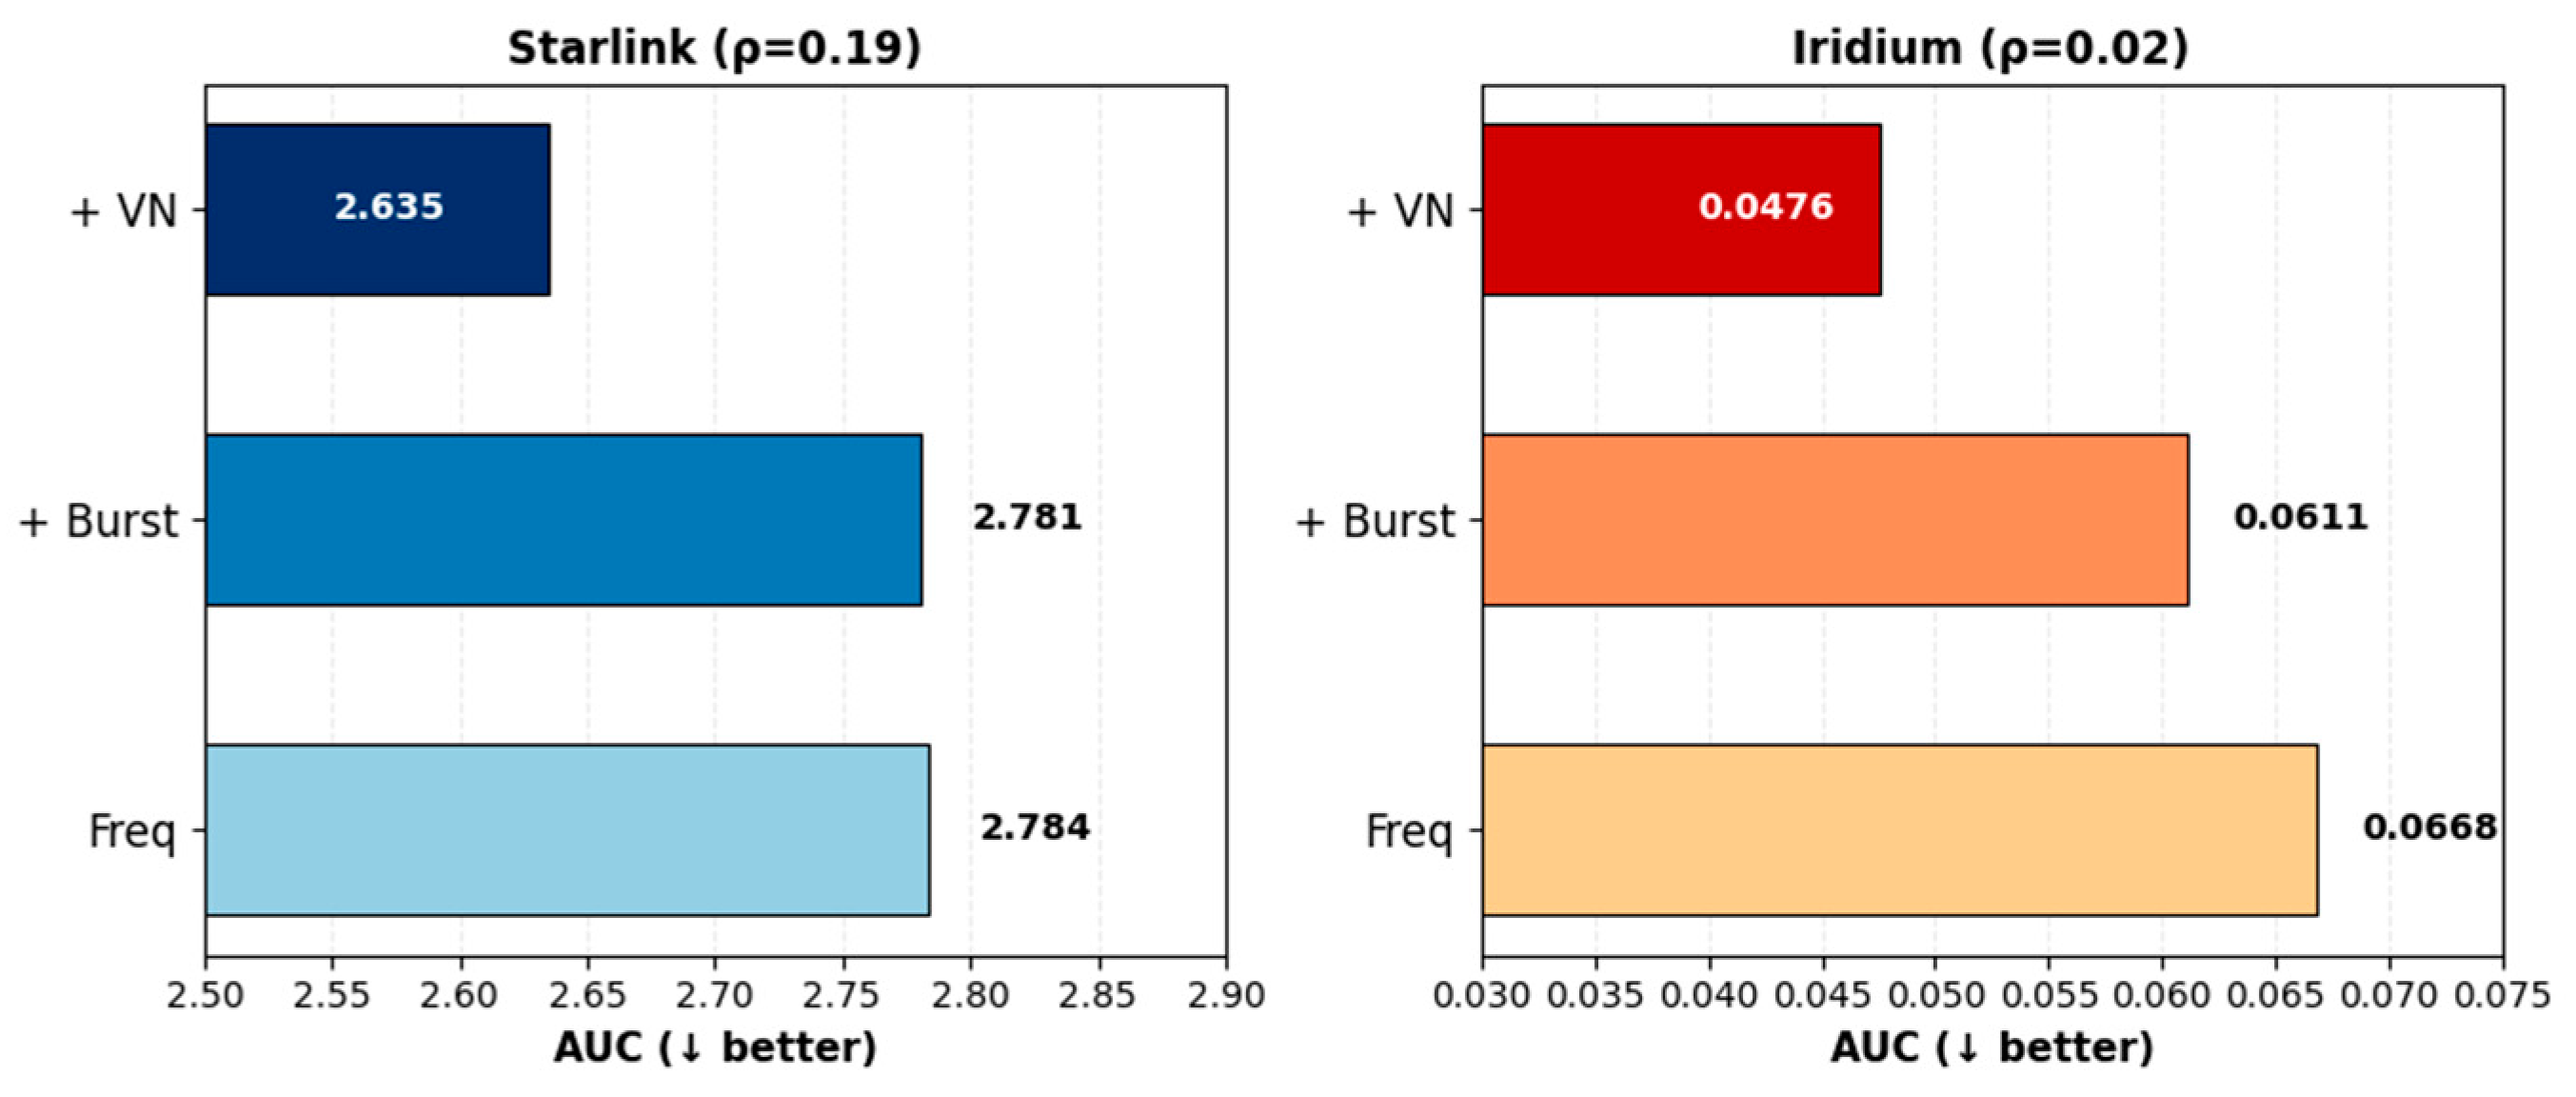
An ablation experiment was conducted to verify the independent contribution of each metric by incrementally incorporating them into the evaluation framework. Figure 12 presents the ablation results for the two constellations.
Figure 12.
AUC comparison of three metric configurations on the Starlink and Iridium constellations. The downward arrow indicates that a smaller AUC corresponds to better performance. The results show that incremental addition of metrics progressively improves performance on both constellations, with the complete three-metric configuration achieving the lowest AUC.
For the Starlink constellation, using frequency alone yielded strong performance, showing that in dense shell networks, link activity serves as the primary factor in ensuring temporal connectivity. Adding the burstiness coefficient produced only a marginal improvement. When von Neumann entropy was further incorporated, the AUC decreased to 2.635, indicating that structural information provides a complementary dimension that cannot be fully captured by frequency and burstiness alone.
For the Iridium constellation, frequency alone produced relatively weak results. Introducing burstiness improved performance by 8.5%, while incorporating von Neumann entropy further enhanced it by 12.4%. These results demonstrate that in sparse topologies, link burst characteristics and bridging structures become the core criteria for identifying critical links.
A cross-constellation comparison reveals that network density significantly influences the contribution of each metric. Dense networks are dominated by link frequency, whereas sparse networks rely more on burst characteristics and topological structure. No single metric performs optimally across all network scenarios.
4.5. Computational Efficiency Evaluation
To verify the scalability of eTAPC, we measured the runtime on both the Iridium constellation with 66 satellites and the Starlink constellation with 668 satellites. The results are summarized in Table 4. On Starlink, eTAPC completes the workflow in 1.92 s on average, approximately 90 times faster than CLSD (172.79 s). On Iridium, eTAPC completes in 0.004 s, compared to 0.042 s for CLSD. These results confirm that eTAPC scales well to large constellations and maintains a significant computational advantage over methods requiring global temporal path traversal.
Table 4.
Runtime comparison on Iridium and Starlink constellations.
4.6. Sensitivity to Observation Window Length
To verify whether the identified critical links remain critical over longer orbital periods, two additional analyses were conducted.
First, the Top-20 critical links identified under sliding windows with the same window length but different starting times were compared. The results show that the Top-20 set changes as the window shifts. This is an inherent characteristic of continuously evolving LEO network topology, and a static set of critical links is meaningless. Second, the attack experiments were repeated on extended windows. The window was extended to 90 min for Starlink and 60 min for Iridium. The AUC of temporal reachability is summarized in Table 5.
Table 5.
AUC of temporal reachability under extended observation windows.
For Starlink under the 90min window, eTAPC still achieves the lowest AUC, validating its effectiveness for large dense constellations over long windows. For Iridium under the 60 min window, eTAPC ranks second, while Temporal Degree performs best. This is because the highly regular polar topology of Iridium reduces the discriminative power of burstiness and entropy metrics over long windows, whereas a simple occurrence-count metric becomes more robust. These results indicate that although the specific critical links vary over time, the proposed method can identify the most critical links under any given observation window.
4.7. Sensitivity to Frequency Penalty Parameters
To assess the sensitivity of the final ranking to the frequency penalty parameters, the thresholds were varied from 2% to 20% and the penalty coefficients from 0.1 to 0.5. The Spearman correlation coefficient between the resulting Top-50 ranking and the baseline ranking was then calculated for the Starlink constellation. As reported in Table 6, all correlation coefficients are greater than 0.92, which indicates that the ranking remains stable under moderate to large variations in the penalty parameters. The largest deviation occurs when both thresholds are doubled, for which the correlation is 0.929; this value still indicates strong consistency. These results indicate that the penalty mechanism does not introduce arbitrary dependence on the selected thresholds and that the Top-50 ranking is robust.
Table 6.
Sensitivity of the Top-50 ranking to frequency penalty parameters for the Starlink constellation.
5. Conclusions
This paper proposes eTAPC, a method based on temporal connectivity for identifying critical links in LEO satellite networks. Link criticality is defined as the degradation of temporal reachability after link removal. Three lightweight metrics, active frequency, burstiness coefficient, and von Neumann entropy change, are fused via TOPSIS for ranking. Experiments on Starlink and Iridium validate its effectiveness, with eTAPC achieving the best performance on the dense Starlink constellation and competitive performance on the sparse Iridium constellation. In particular, eTAPC provides a favorable trade-off between accuracy and computational cost, making it suitable for onboard deployment. Future work will incorporate traffic and capacity constraints and develop an online distributed architecture.
Author Contributions
Conceptualization, X.N.; Methodology, X.N. and J.D.; Software, X.N. and Y.Z.; Validation, X.N.; Formal analysis, X.N., K.Q., J.D., Y.Z. and Z.X.; Investigation, X.N., K.Q., J.D., Y.Z. and Z.X.; Resources, K.Q.; Writing—original draft, X.N.; Writing—review & editing, X.N., K.Q., J.D., Y.Z. and Z.X.; Visualization, X.N.; Supervision, K.Q. All authors have read and agreed to the published version of the manuscript.
Funding
This research received no external funding.
Data Availability Statement
The TLE data used in this study are publicly available from CelesTrak (https://celestrak.org). The generated code and processed data are available from the corresponding author upon reasonable request.
Acknowledgments
During the preparation of this manuscript, the authors used DeepSeek-V4.1-Flash for translation purposes. The authors have reviewed and edited the output and take full responsibility for the content of this publication. No generative-AI tools were used for research design, data simulation or result analysis.
Conflicts of Interest
The authors declare no conflict of interest.
Abbreviations
The following abbreviations are used in this manuscript:
| LEO | Low Earth Orbit |
| ISL | Inter-Satellite Link |
| GEO | Geostationary Earth Orbit |
| eTAPC | Evaluation of Temporal-Aware Path Connectivity |
| TLE | Two-Line Element |
| TVGs | Time-varying graphs |
| TOPSIS | Technique for Order Preference by Similarity to Ideal Solution |
| CLSD | Critical Link Sequence Detection |
| SATB | Service-Aware Temporal Betweenness |
| SGP4 | Simplified General Perturbations 4 |
| AUC | Area Under the Curve |
| GE | Global Efficiency |
| LCR | Largest Component Ratio |
| TR | Temporal Reachability |
| ATD | Average Temporal Distance |
References
- Chen, Q.; Yang, L.; Zhao, Y.; Wang, Y.; Zhou, H.; Chen, X. 3-ISL Topology: Routing Properties and Performance in LEO Megaconstellation Networks. IEEE Trans. Aerosp. Electron. Syst. 2025, 61, 4961–4972. [Google Scholar] [CrossRef] [Scilit]
- Pengnoo, M.; Maneekut, R.; Kaewplung, P. Performance Analysis of Dynamically Routed O-ISLs Under PAT Constraints in LEO Constellations. IEEE Access 2026, 14, 98843–98860. [Google Scholar] [CrossRef] [Scilit]
- Feng, H.; Wang, F.; Lai, J.; Wu, Q.; Zhu, L. QoE-Oriented Streaming Power Allocation in LEO Satellite Networks. IEEE Open J. Commun. Soc. 2026, 7, 8539–8553. [Google Scholar] [CrossRef] [Scilit]
- Adekambi, K.O.A.; Deng, Q.; Jiang, J.; Pei, Y.; Zhang, X.; Bachirou, W.O.A. PLARR: A Spatio-Temporal Aware Routing Framework for Resilient LEO Satellite Networks. In Proceedings of the 2025 5th International Conference on Information Communication and Software Engineering (ICICSE); IEEE: Piscataway, NJ, USA, 2025; pp. 300–305. [Google Scholar]
- Ozeki, R.; Rihan, M.; Rizk, H.; Matthiesen, B.; Dekorsy, A.; Yamaguchi, H. Clustered Federated Learning With Contrastive Loss and Staleness-Aware Aggregation for LEO Satellite Constellations. IEEE Open J. Commun. Soc. 2026, 7, 8056–8072. [Google Scholar] [CrossRef] [Scilit]
- Yang, H.; Chen, Q.; Yang, L.; Yin, Z.; Zhao, Y. Research progress and prospects of invulnerability for low Earth orbit mega-constellation networks. Xi Tong Gong Cheng Yu Dian Zi Ji Shu/Syst. Eng. Electron. 2025, 47, 2025–2035. [Google Scholar]
- Scrocciolani, S.; Messina, V.; Alarcia, R.M.G.; Sindermann, J.; Golkar, A. Advancing Satellite Network Performance: Network Analysis for Federated Satellite Systems. IEEE Access 2024, 12, 45616–45630. [Google Scholar] [CrossRef] [Scilit]
- Brandes, U. A Faster Algorithm for Betweenness Centrality. J. Math. Sociol. 2001, 25, 163–177. [Google Scholar] [CrossRef] [Scilit]
- Qiu, F.; Yu, C.; Feng, Y.; Li, Y. Key Node Identification for a Network Topology Using Hierarchical Comprehensive Importance Coefficients. Sci. Rep. 2024, 14, 12039. [Google Scholar] [CrossRef] [Scilit]
- Guo, B.; Zhang, Z.; Atapattu, S.; Pan, M.; Yan, Y.; Xiong, Z.; Li, H. Enabling Real-Time Computing and Transmission Services in Large-Scale LEO Satellite Networks. IEEE Trans. Veh. Technol. 2025, 74, 12813–12828. [Google Scholar] [CrossRef] [Scilit]
- Zhang, Z.; Jiang, C.; Guo, S.; Qian, Y.; Ren, Y. Temporal Centrality-Balanced Traffic Management for Space Satellite Networks. IEEE Trans. Veh. Technol. 2018, 67, 4427–4439. [Google Scholar] [CrossRef] [Scilit]
- Xu, R.; Di, X.; He, X.; Qi, H. Evaluation Method of Node Importance in Temporal Satellite Networks Based on Time Slot Correlation. EURASIP J. Wirel. Commun. Netw. 2021, 2021, 188. [Google Scholar] [CrossRef] [Scilit]
- Guo, B.; Xiong, Z.; Zhang, Z.; Li, B.; Niyato, D.; Yuen, C.; Han, Z. Resilience of Mega-Satellite Constellations: How Node Failures Impact Inter-Satellite Networking Over Time? IEEE Trans. Commun. 2025, 73, 15705–15721. [Google Scholar] [CrossRef] [Scilit]
- Wang, S.; Zhao, Y.; Xie, H. PKN: Improving Survivability of LEO Satellite Network through Protecting Key Nodes. In Proceedings of the 15th International Conference on Emerging Networking EXperiments and Technologies; Association for Computing Machinery: New York, NY, USA, 2019; pp. 7–8. [Google Scholar]
- Bi, Y.; Liu, R.; Sheng, M.; Li, J.; Wu, W.; Wu, J.; Wang, Z. Exploring on the Critical Link Sequence of Satellite Networks. In Proceedings of the 2019 IEEE 89th Vehicular Technology Conference (VTC2019-Spring); IEEE: Piscataway, NJ, USA, 2019; pp. 1–6. [Google Scholar]
- Tianming, Z.; Jie, Z.; Cibo, Y.U.; Lu, C.; Yunjun, G.A.O.; Bin, C.A.O.; Jing, F.A.N.; Ge, Y.U. Labeling-Based Centrality Approaches for Identifying Critical Edges on Temporal Graphs. Front. Comput. Sci. 2025, 19, 192601. [Google Scholar] [CrossRef] [Scilit]
- Li, Y.; Xu, Y.; Zhang, Q.; Yang, Z. Age-Optimized Multihop Information Update Mechanism on the LEO Satellite Constellation via Continuous Time-Varying Graphs. IEEE Internet Things J. 2023, 10, 7189–7203. [Google Scholar] [CrossRef] [Scilit]
- Indaco, M.; Guzzetti, D. Transformer-Based Anomaly Detection in P-LEO Constellations: A Dynamic Graph Approach. Acta Astronaut. 2024, 218, 177–194. [Google Scholar] [CrossRef] [Scilit]
- Holme, P. Network Reachability of Real-World Contact Sequences. Phys. Rev. E Stat. Nonlinear Soft Matter Phys. 2005, 71, 046119. [Google Scholar] [CrossRef] [Scilit]
- Pan, R.K.; Saramaki, J. Path Lengths, Correlations, and Centrality in Temporal Networks. Phys. Rev. E Stat. Nonlinear Soft Matter Phys. 2011, 84, 016105. [Google Scholar] [CrossRef] [Scilit]
- Lee, E.; Emmons, S.; Gibson, R.; Moody, J.; Mucha, P.J. Concurrency and Reachability in Treelike Temporal Networks. Phys. Rev. E 2019, 100, 062305. [Google Scholar] [CrossRef] [Scilit]
- Zou, L.; Wang, H. Vulnerability of Information Transport on Temporal Networks to Link Removal. IEEE Trans. Netw. Sci. Eng. 2025, 12, 2932–2941. [Google Scholar] [CrossRef] [Scilit]
- Goh, K.-I.; Barabási, A.-Ĺ. Burstiness and Memory in Complex Systems. EPL (Europhys. Lett.) 2006, 81, 48002. [Google Scholar]
- Passerini, F.; Severini, S. Quantifying Complexity in Networks: The von Neumann Entropy. Int. J. Agent Technol. Syst. 2009, 1, 58–67. [Google Scholar] [CrossRef] [Scilit]
- Rocco, C.M.; Barker, K.; González, A.D. Multi-Criteria Ranking across Importance Measures for Stochastic Networks. Life Cycle Reliab. Saf. Eng. 2023, 12, 187–196. [Google Scholar] [CrossRef] [Scilit]
- Wang, J.; Zhang, Q.; Pan, C. Command and Control Network Architecture Optimization Method Based on Dual-Layer Weighting and TOPSIS-GRA of Indicators. Appl. Soft Comput. 2025, 184, 113711. [Google Scholar] [CrossRef] [Scilit]

Disclaimer/Publisher’s Note: The statements, opinions and data contained in all publications are solely those of the individual author(s) and contributor(s) and not of MDPI and/or the editor(s). MDPI and/or the editor(s) disclaim responsibility for any injury to people or property resulting from any ideas, methods, instructions or products referred to in the content. |
© 2026 by the authors. Licensee MDPI, Basel, Switzerland. This article is an open access article distributed under the terms and conditions of the Creative Commons Attribution (CC BY) license.