


Abstract
Fluidic thrust vectoring technology has emerged as one of the key research hotspots in next-generation advanced aircraft design, owing to its compact structure, rapid response and low weight penalty. The aerodynamic vectoring nozzle serves as the core component of this technology. Currently, research on four-way axisymmetric fluidic thrust vectoring nozzles remains limited, and corresponding experimental studies suffer from high costs and strict technical requirements. To fill this gap, this paper presents an experimental study on the control laws of an aerodynamic vectoring nozzle prototype under low-speed jet conditions for preliminary design verification. Taking this nozzle type as the research object, the jet deflection characteristics under various wall configurations are investigated at a jet exit velocity of approximately 80 m/s. Among the four evaluated Coanda wall structures, the composite design integrating a smooth curved front section and a beveled rear–middle section is finally determined. Its key performance indicators meet the engineering requirements: a maximum deflection angle of 13.6°, a control linearity of 87.1% for pitch (vertical) control and 89.8% for yaw (lateral) control, a thrust loss of 4%, and a response rate of no less than 200°/s. This work provides a valuable reference for subsequent practical engineering applications.
1. Introduction
Thrust vectoring technology has become one of the core design technologies for next-generation advanced aircraft, as it enables aircraft to obtain the required control forces and moments under extreme flight conditions such as low speed and high angle of attack. Fighter aircraft equipped with thrust vectoring technology can perform post-stall maneuvers, rapid steering, and agile tactical movements while ensuring flight safety, demonstrating superior maneuverability, agility, and stealth performance [1].
Thrust vectoring technology is divided into mechanical thrust vectoring and fluidic thrust vectoring. The core of thrust vectoring technology is to change the jet direction and thus the thrust direction, realizing vector control of the resultant force [2]. Mechanical thrust vectoring deflects the primary jet by adjusting the mechanical structure of the nozzle through direct motor-driven control and has reached maturity on well-known fighters such as the F-35 and the J-10. However, it also faces inherent drawbacks: numerous moving parts, complex mechanical structure, significant weight penalty, slow response speed, and large thrust loss. In contrast, fluidic thrust vectoring technology has become a research hotspot in the field of vectoring technology due to its advantages, including a fixed aerodynamic profile, low thrust loss, rapid response, and minimal weight increase, and has broad application prospects and engineering value [3,4].
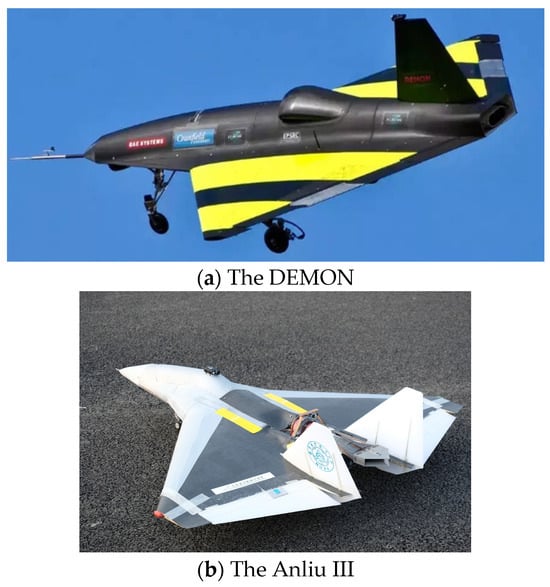
Over the past two decades, research institutions worldwide have carried out extensive experimental studies and prototype development on fluidic thrust vectoring technology and achieved fruitful technical results. A number of advanced UAVs applying fluidic thrust vectoring technology have been developed successively, including JAVA, the 19-Anliu III, and DEMON. Warsop from BAE Systems (Bristol, UK) and Crowther from the University of Manchester summarized the achievements of multiple UAV models, including JAVA and MAGAMA, in control and trimming without conventional control surfaces using flow control technology over the past two decades [5]. Researcher J.P.Fielding from Cranfield University elaborated the design concept of the DEMON UAV equipped with advanced technologies such as fluidic thrust vectoring [6]. The GU research group at Nanjing University of Aeronautics and Astronautics (NUAA) developed a wedge-shaped aerodynamic vectoring nozzle to alleviate problems such as hysteresis and abrupt jumps during jet vector deflection. Numerical simulations and experiments verified that this type of nozzle features favorable linearity and rapid response, and its control laws were further investigated. Based on this nozzle, the 19-Anliu III UAV was developed, as shown in Figure 1 [7]. Such UAVs realize attitude control, flight trimming, and maneuver adjustment through fluid flow control technology. Performance comparisons with traditional control-surface control have successfully verified the feasibility and advancement of fluidic thrust vectoring technology, laying a solid technical foundation for its engineering application in manned fighters and large stealth aircraft. Nevertheless, the fluidic thrust vectoring systems on such advanced UAVs are restricted to single-axis pitch control with certain technical limitations.
Figure 1.
UAVs with fluidic thrust vectoring technology.
According to differences in operating mode and secondary flow source, fluidic thrust vectoring technology can be subdivided into active and passive categories. Current active fluidic thrust vectoring schemes include counter-flow control, co-flow control, throat-shifting control, and shock vector control [8]. Most of the above fluidic thrust vectoring technologies require active injection of secondary flow for control, which requires additional high-pressure air source equipment and supporting auxiliary structures such as complex gas pipelines and regulating valves. This not only reintroduces problems such as increased equipment weight, complex structure, and cumbersome maintenance, but it is also prone to failures such as unstable secondary flow supply and fluctuating jet deflection. These issues increase system complexity and weight, as well as incur additional energy consumption [9].
Passive fluidic thrust vectoring technology addresses many shortcomings of active schemes. It requires no additional high-pressure air source or complex air pipelines and passively induces secondary flow by relying on the aircraft’s own flow field environment. It features a simple structure, high reliability, stable primary jet deflection, and higher control accuracy, with remarkable comprehensive performance advantages. Therefore, it has rapidly become a key research direction in the global aviation field. Xiao designed a novel passive fluidic thrust vectoring nozzle based on the ejector effect in 2012 [10]. Without an external air source, this nozzle generates a pressure difference by asymmetrically controlling the passive secondary flow near the nozzle wall via the ejection effect of the primary jet, thereby realizing jet deflection. Shi conducted synchronous measurements of nozzle force, pressure, and flow field to deeply analyze the dynamic processes of jet attachment and detachment [11]. Huang compared the force vector angle control characteristics and jet structure of trailing-edge beveled nozzles and two-dimensional nozzles under low-speed conditions, classified the flow modes of jet deflection, and obtained the flow field characteristics corresponding to different flow modes [12]. However, the above studies are limited to two-dimensional configurations with a single control direction.
The aerodynamic vectoring nozzle is the core actuator of passive fluidic thrust vectoring technology and the key carrier for precise thrust vector control, which directly determines the accuracy, efficiency, and stability of vector regulation. Its core working principle relies on the negative-pressure entrainment effect and the Coanda wall attachment effect in fluid mechanics. During operation, the negative-pressure entrainment generated by the high-speed primary jet passively draws ambient air around the nozzle intake valves as secondary flow [13]. The secondary flow intake is regulated via the valve-opening valve structure to achieve proportional control of the primary jet deflection angle. Meanwhile, by virtue of the wall attachment characteristic of the Coanda effect, the high-speed primary jet deflects stably along the nozzle wall, maximizing the primary jet deflection amplitude and achieving optimal vector control performance [14]. This ultimately enables full-range, high-precision attitude maneuver control of aircraft, providing core technical support for the development of next-generation aircraft with high performance, stealth capability, and agility [15,16].
At present, most aerodynamic vectoring nozzles designed for passive fluidic thrust vectoring are limited to two-dimensional or single bidirectional configurations. Experiments are costly and demanding, so there is an urgent need for efficient and low-cost preliminary experiments to verify design models in advance. Most existing studies are dominated by numerical simulations conducted after conceptual design, making it necessary to develop rapid and low-cost approaches to validate numerical predictions [17]. Furthermore, there are few studies on four-way axisymmetric vectoring nozzle designs, and the control performance and wall attachment characteristics of jets in all directions remain unclear [18,19].
The three major contributions of this work are summarized as follows:
- A low-cost, rapid iterative force measurement experimental method for four-directional axisymmetric fluidic thrust vectoring nozzles is proposed, which adopts a micro turbofan as the power source and an ATI six-component force balance as the measurement device.
- The thrust vector angle control characteristics of four Coanda wall configurations are systematically compared under three low equivalent jet velocities of 20, 50 and 80 m/s.
- The curved-inclined hybrid wall configuration simultaneously improves the initial deflection capability at the wall leading edge and the stable wall attachment performance at the trailing edge, yielding a nozzle design that satisfies the preliminary engineering specifications.
This study provides a reference for practical engineering application and supports further full-scale prototype experiments.
2. Materials and Methods
2.1. ATI Thrust Vector Angle Measurement Experiment
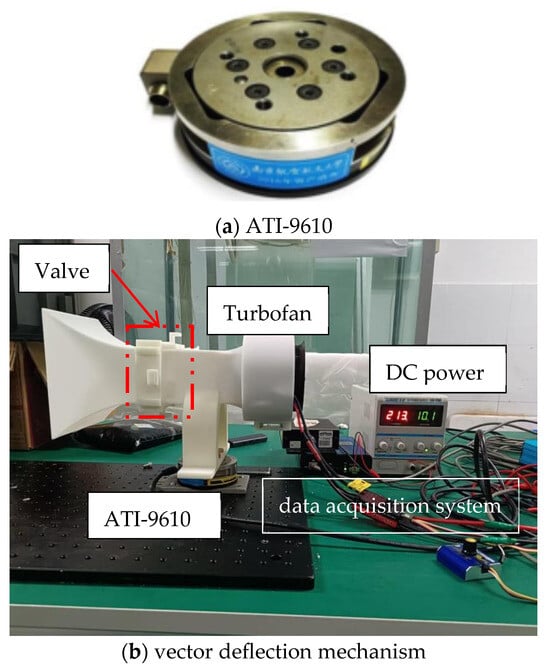
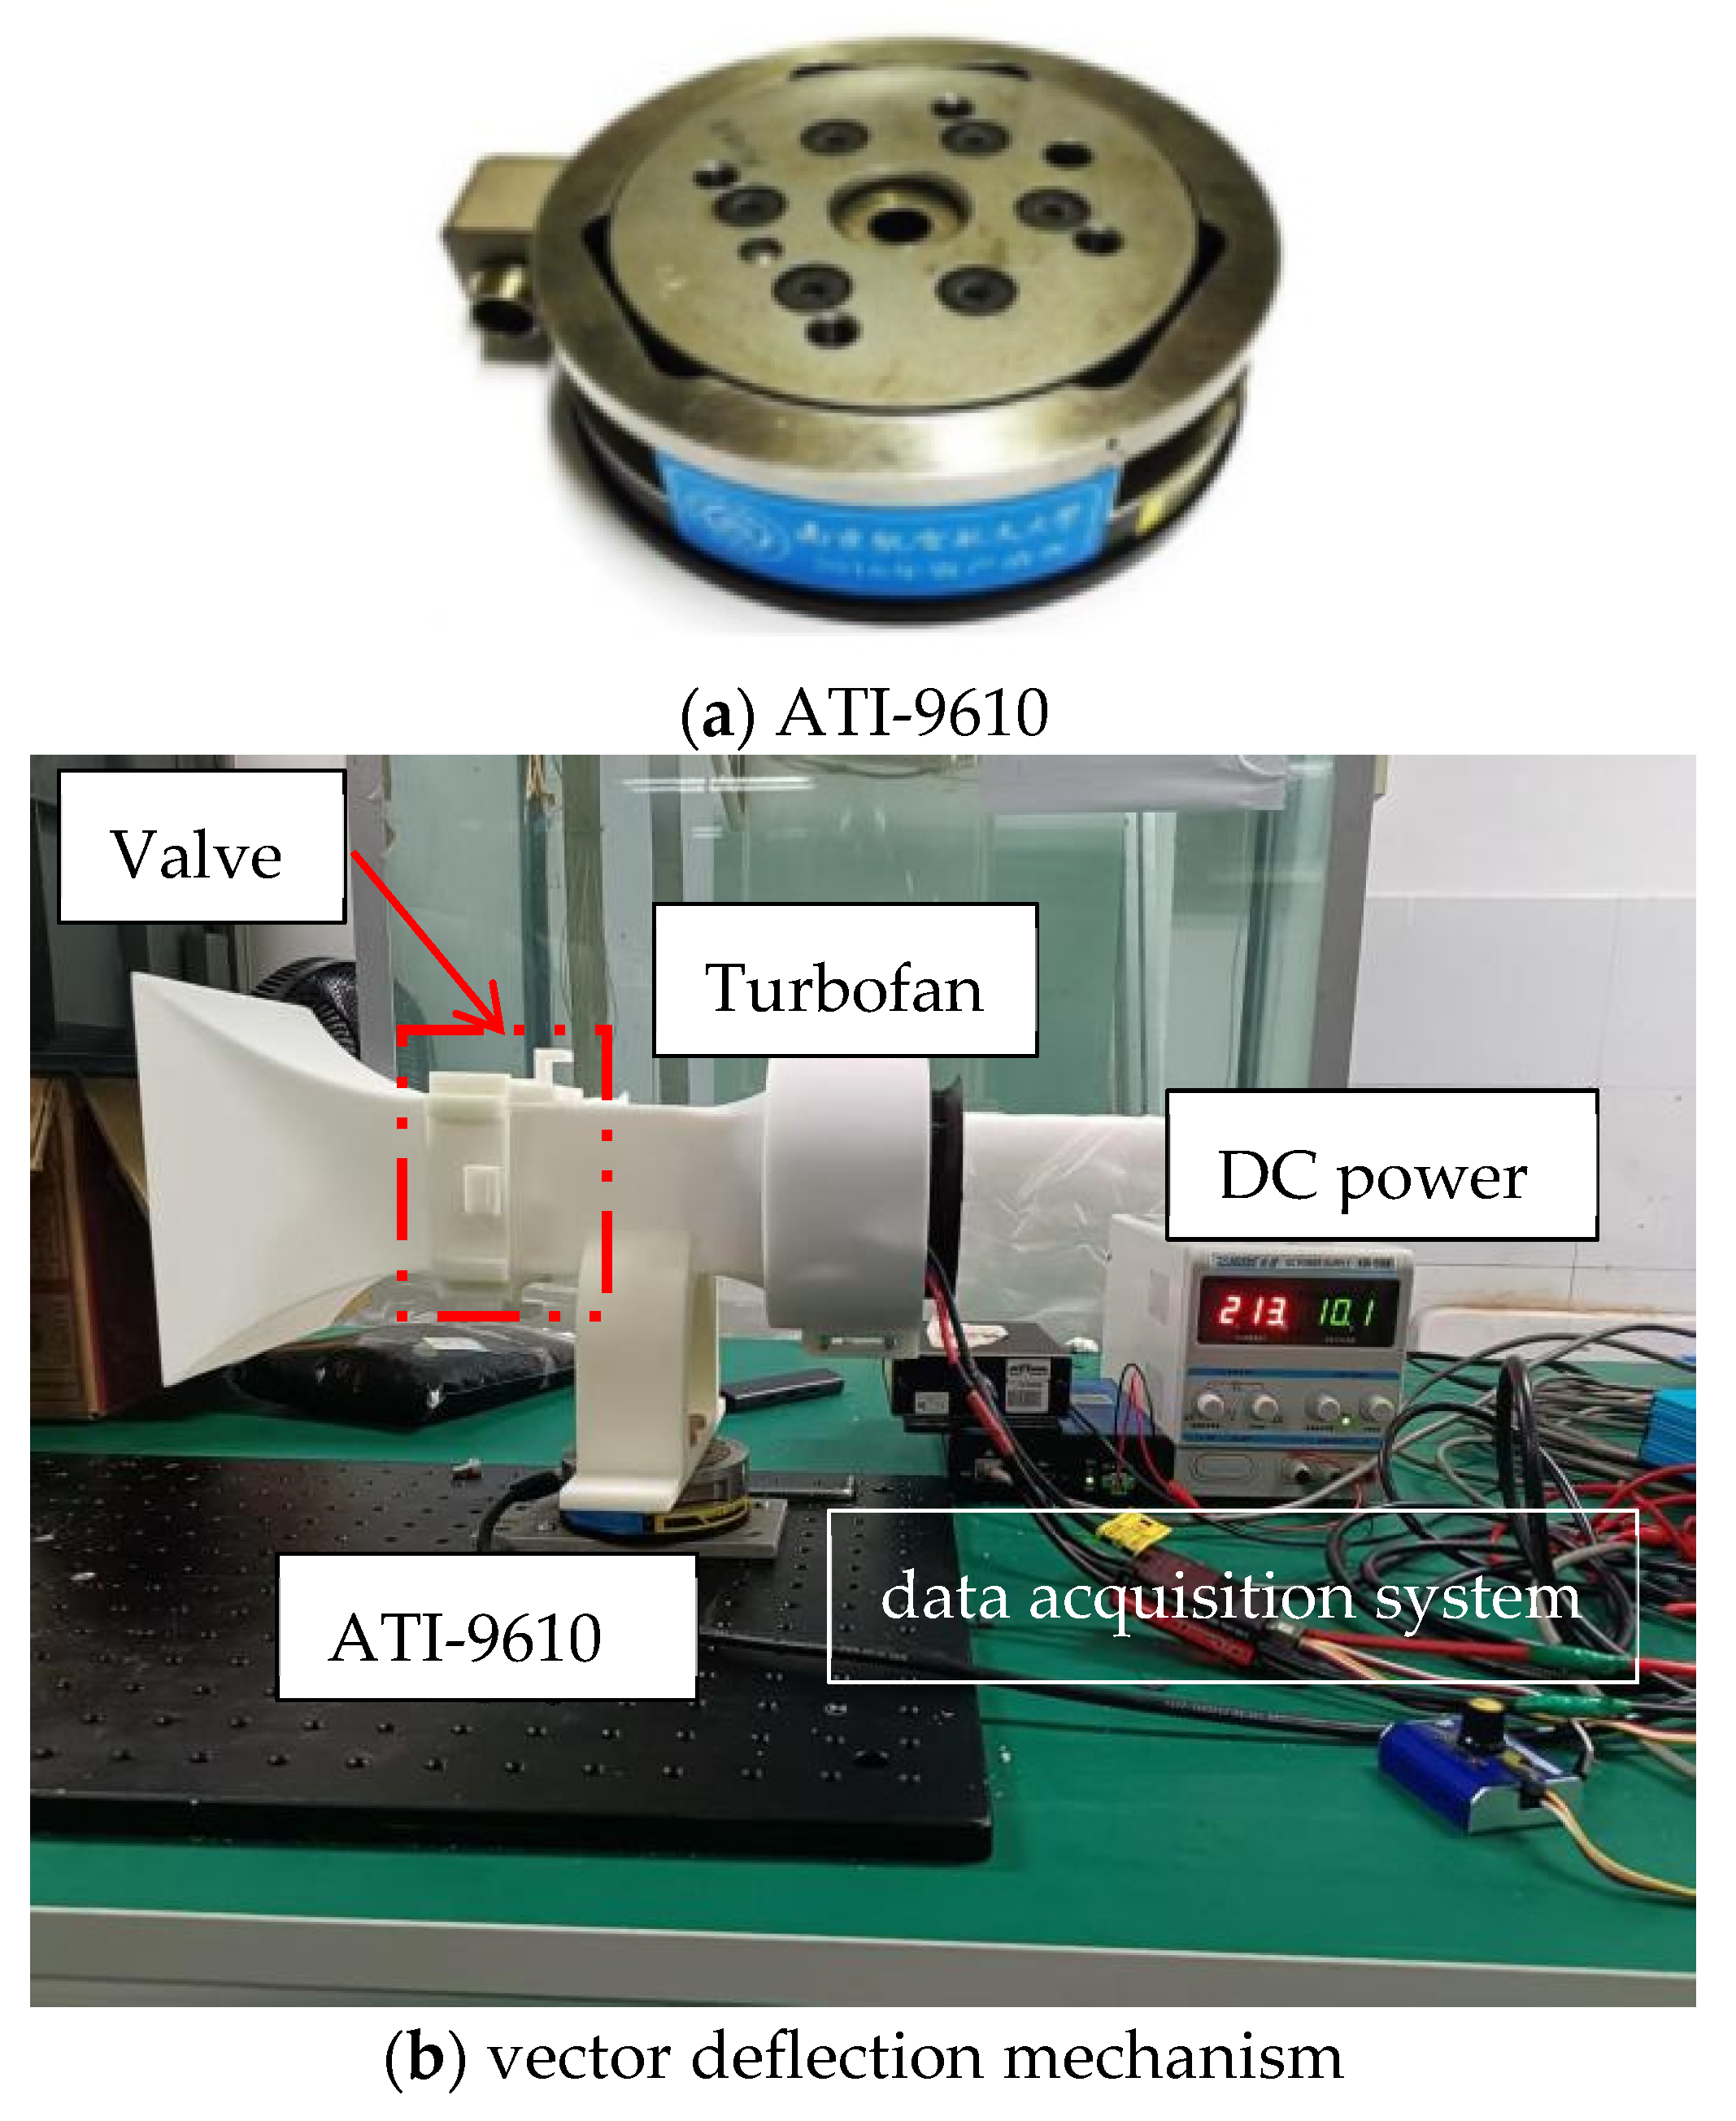
In this study, the force vector angle measuring device comprises a vector deflection mechanism, a strain balance, a data acquisition system and a power supply system, including a four-way axisymmetric aerodynamic vectoring nozzle. The deflection mechanism is powered by a turbofan, which can provide jet velocities in the range of 0–80 m/s. In this device, the equipment is supplied with constant voltage by a regulated DC power supply, and the internal forces in three-dimensional space are measured by an ATI-9610 six-component strain balance [7]. This type of balance consists of a floating frame and a fixed frame. The floating frame is rigidly connected to the nozzle model, and the bottom of the fixed frame is connected to the base. In the experiment, the maximum sampling frequency can reach 5000 Hz; the measuring ranges of the X, Y and Z axes are 165 N, 165 N and 495 N, respectively, and the accuracy of the three measuring axes is 1%. See Figure 2 and Table 1 for details. Four valves are used to control jet deflection in four directions. For single-direction deflection, only the valve corresponding to the target direction is open, while the other three valves remain fully closed.
Figure 2.
Experimental mechanism.
Table 1.
Measurement accuracy table of ATI-9610.
2.2. Design of Aerodynamic Nozzle and Experimental Process
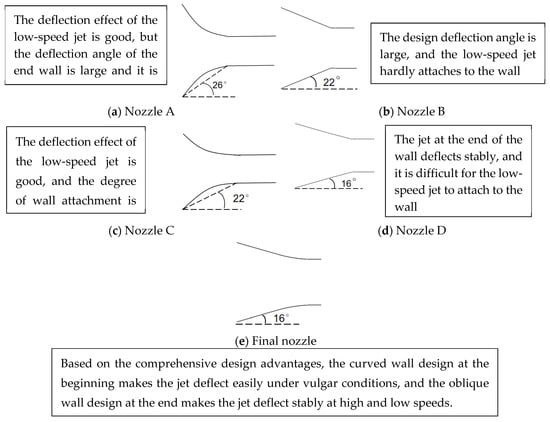
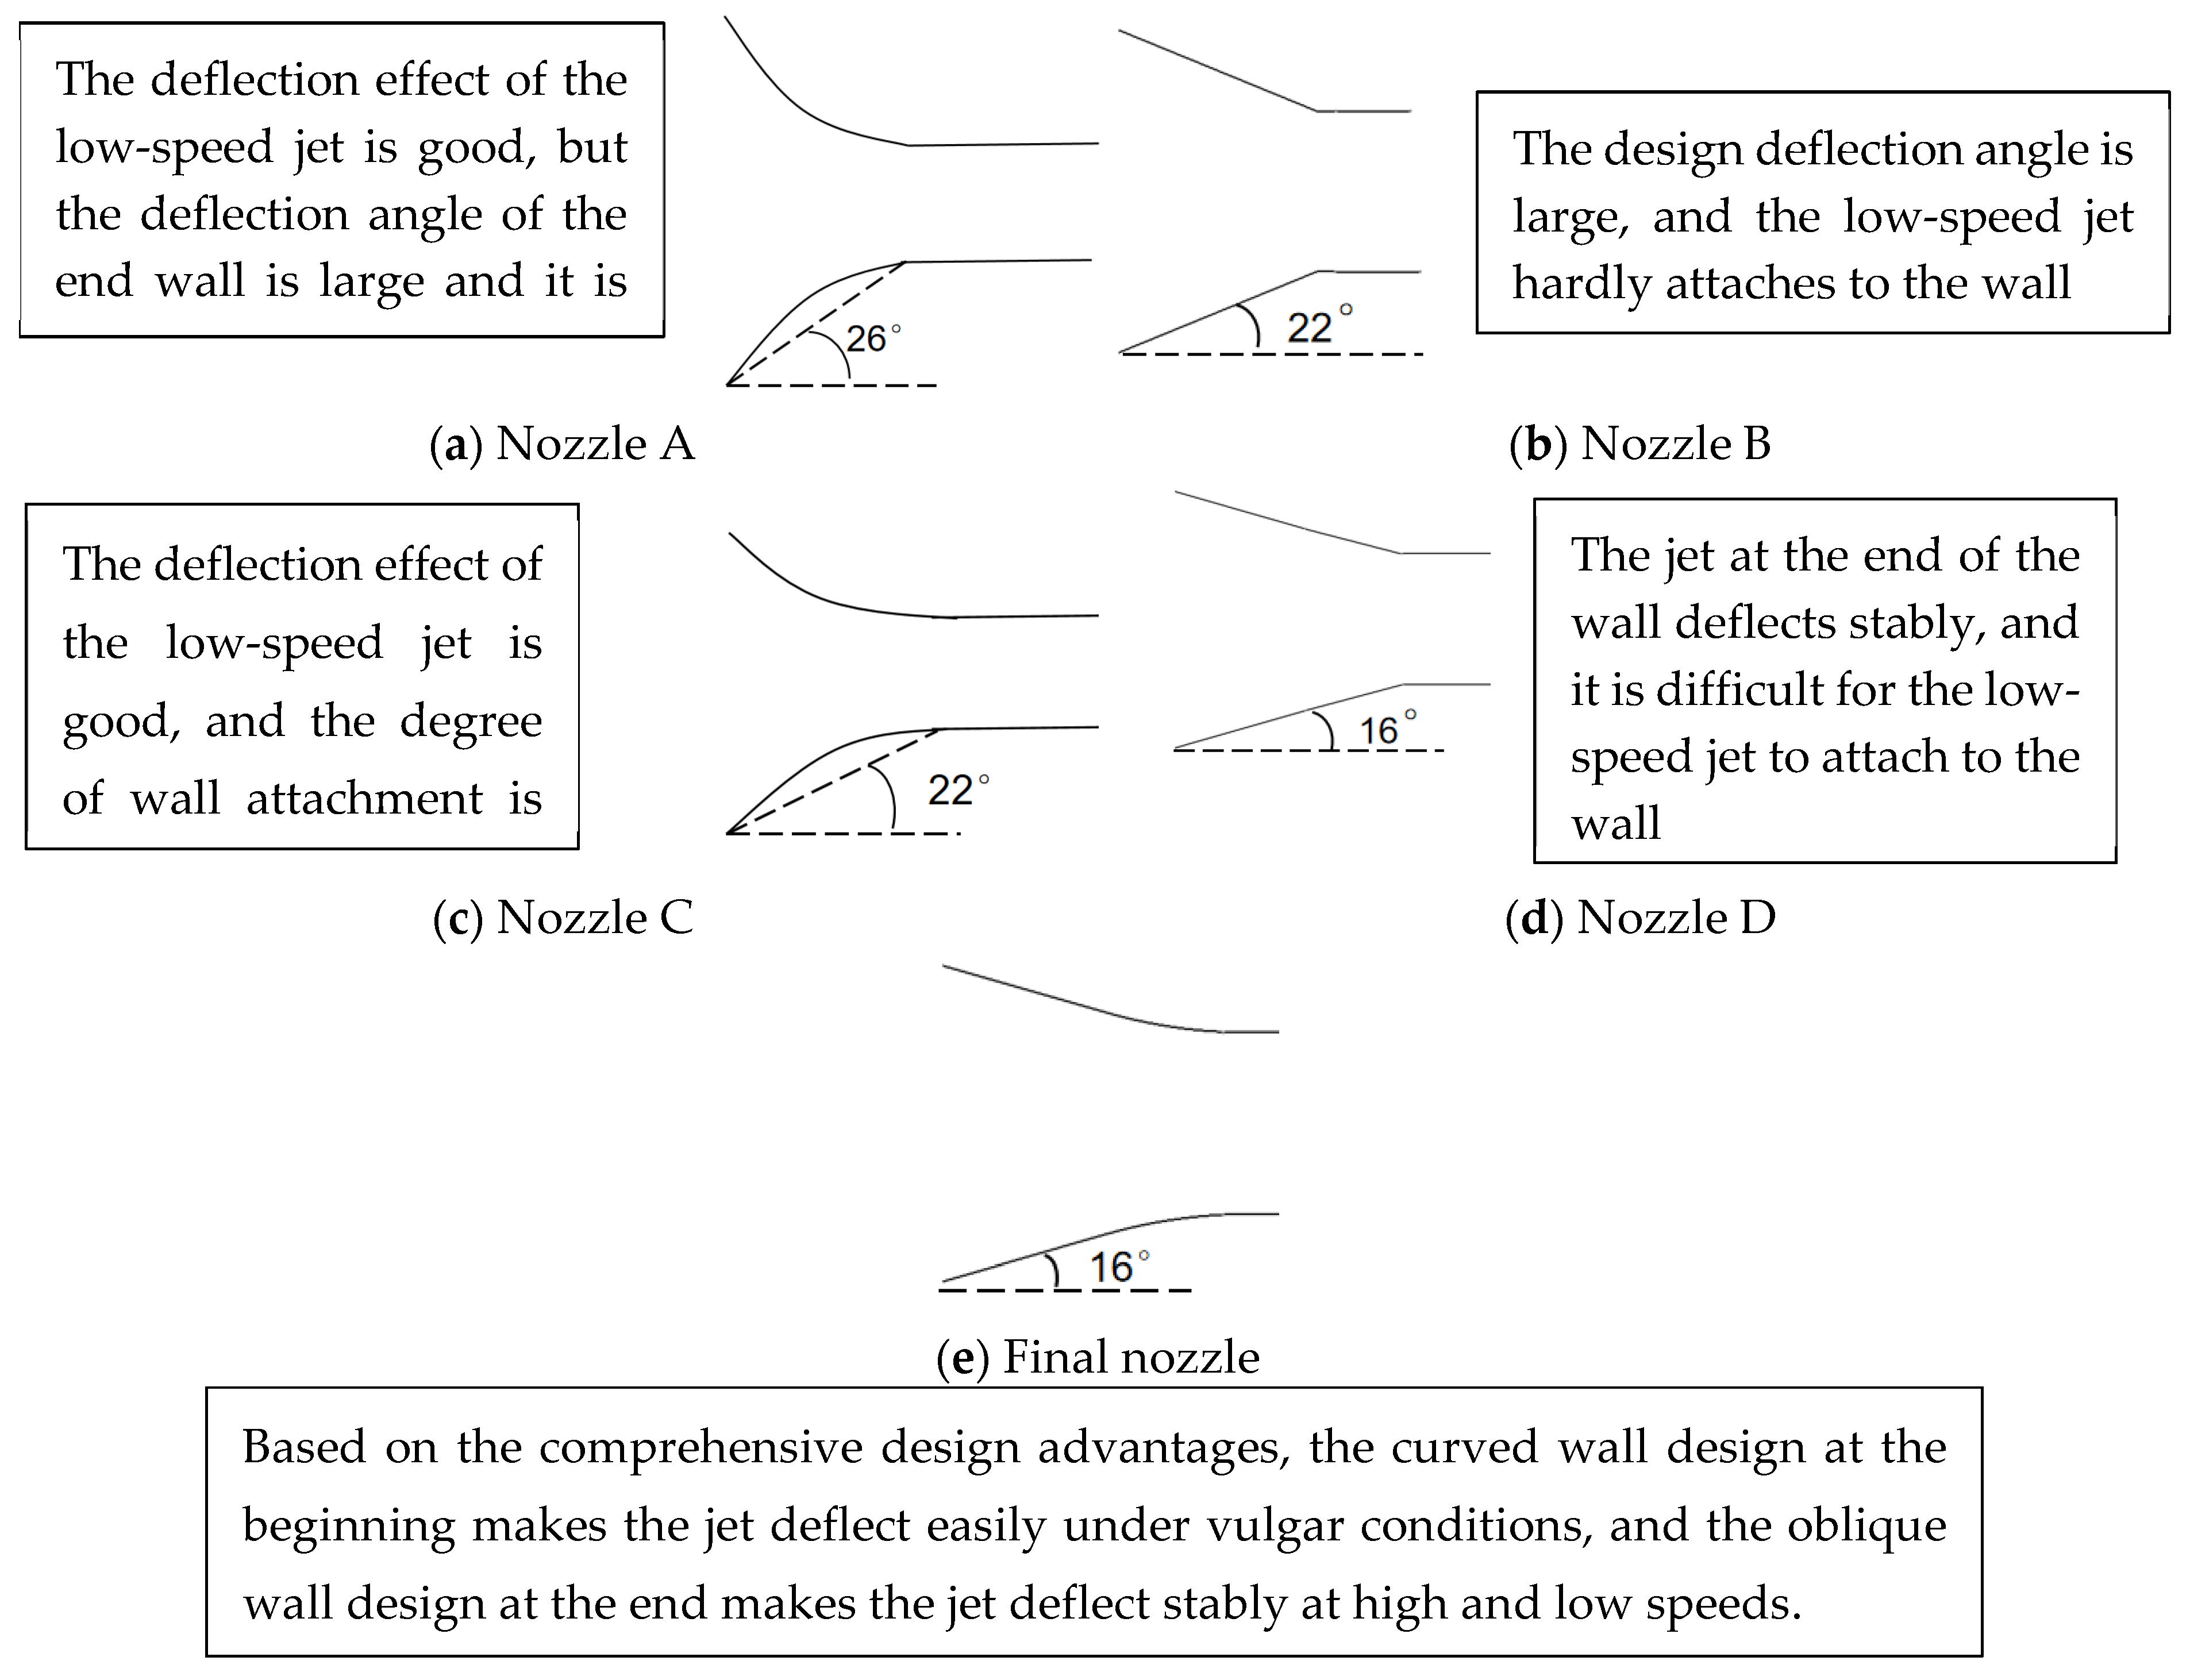
After installing the equipment, a Pitot tube was used to calibrate the wind speed. Wind speed calibration was performed with the turbofan set at 35%, 70% and 100% throttle positions, corresponding to jet velocities of approximately 20 m/s, 50 m/s and 80 m/s, respectively. In this experiment, a micro turbofan with a maximum thrust of 4 kg was used, and the speed–outlet velocity correspondence was determined according to the calibration results. The experiments were carried out with four different types of Coanda walls. The variations in the force vector angle were measured at wind speeds of 20 m/s, 50 m/s and 80 m/s, and the underlying laws were summarized. The aerodynamic vectoring nozzles with four different Coanda walls were named as follows: Nozzle A is designed with an arc-shaped wall with a radius of curvature of 146 mm and a central angle of 26°; Nozzle B is designed with an arc-shaped wall with a radius of curvature of 152 mm and an included angle of 22°; Nozzle C is designed with an oblique cutting wall with an angle of 22°; and Nozzle D is similar to Nozzle C but with an angle of 16°.
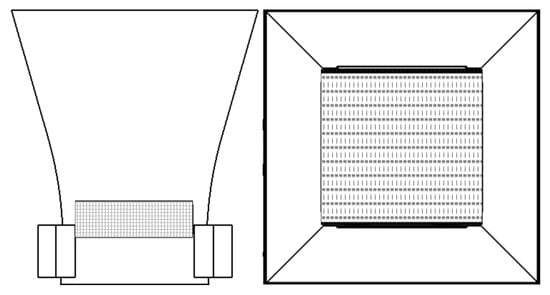
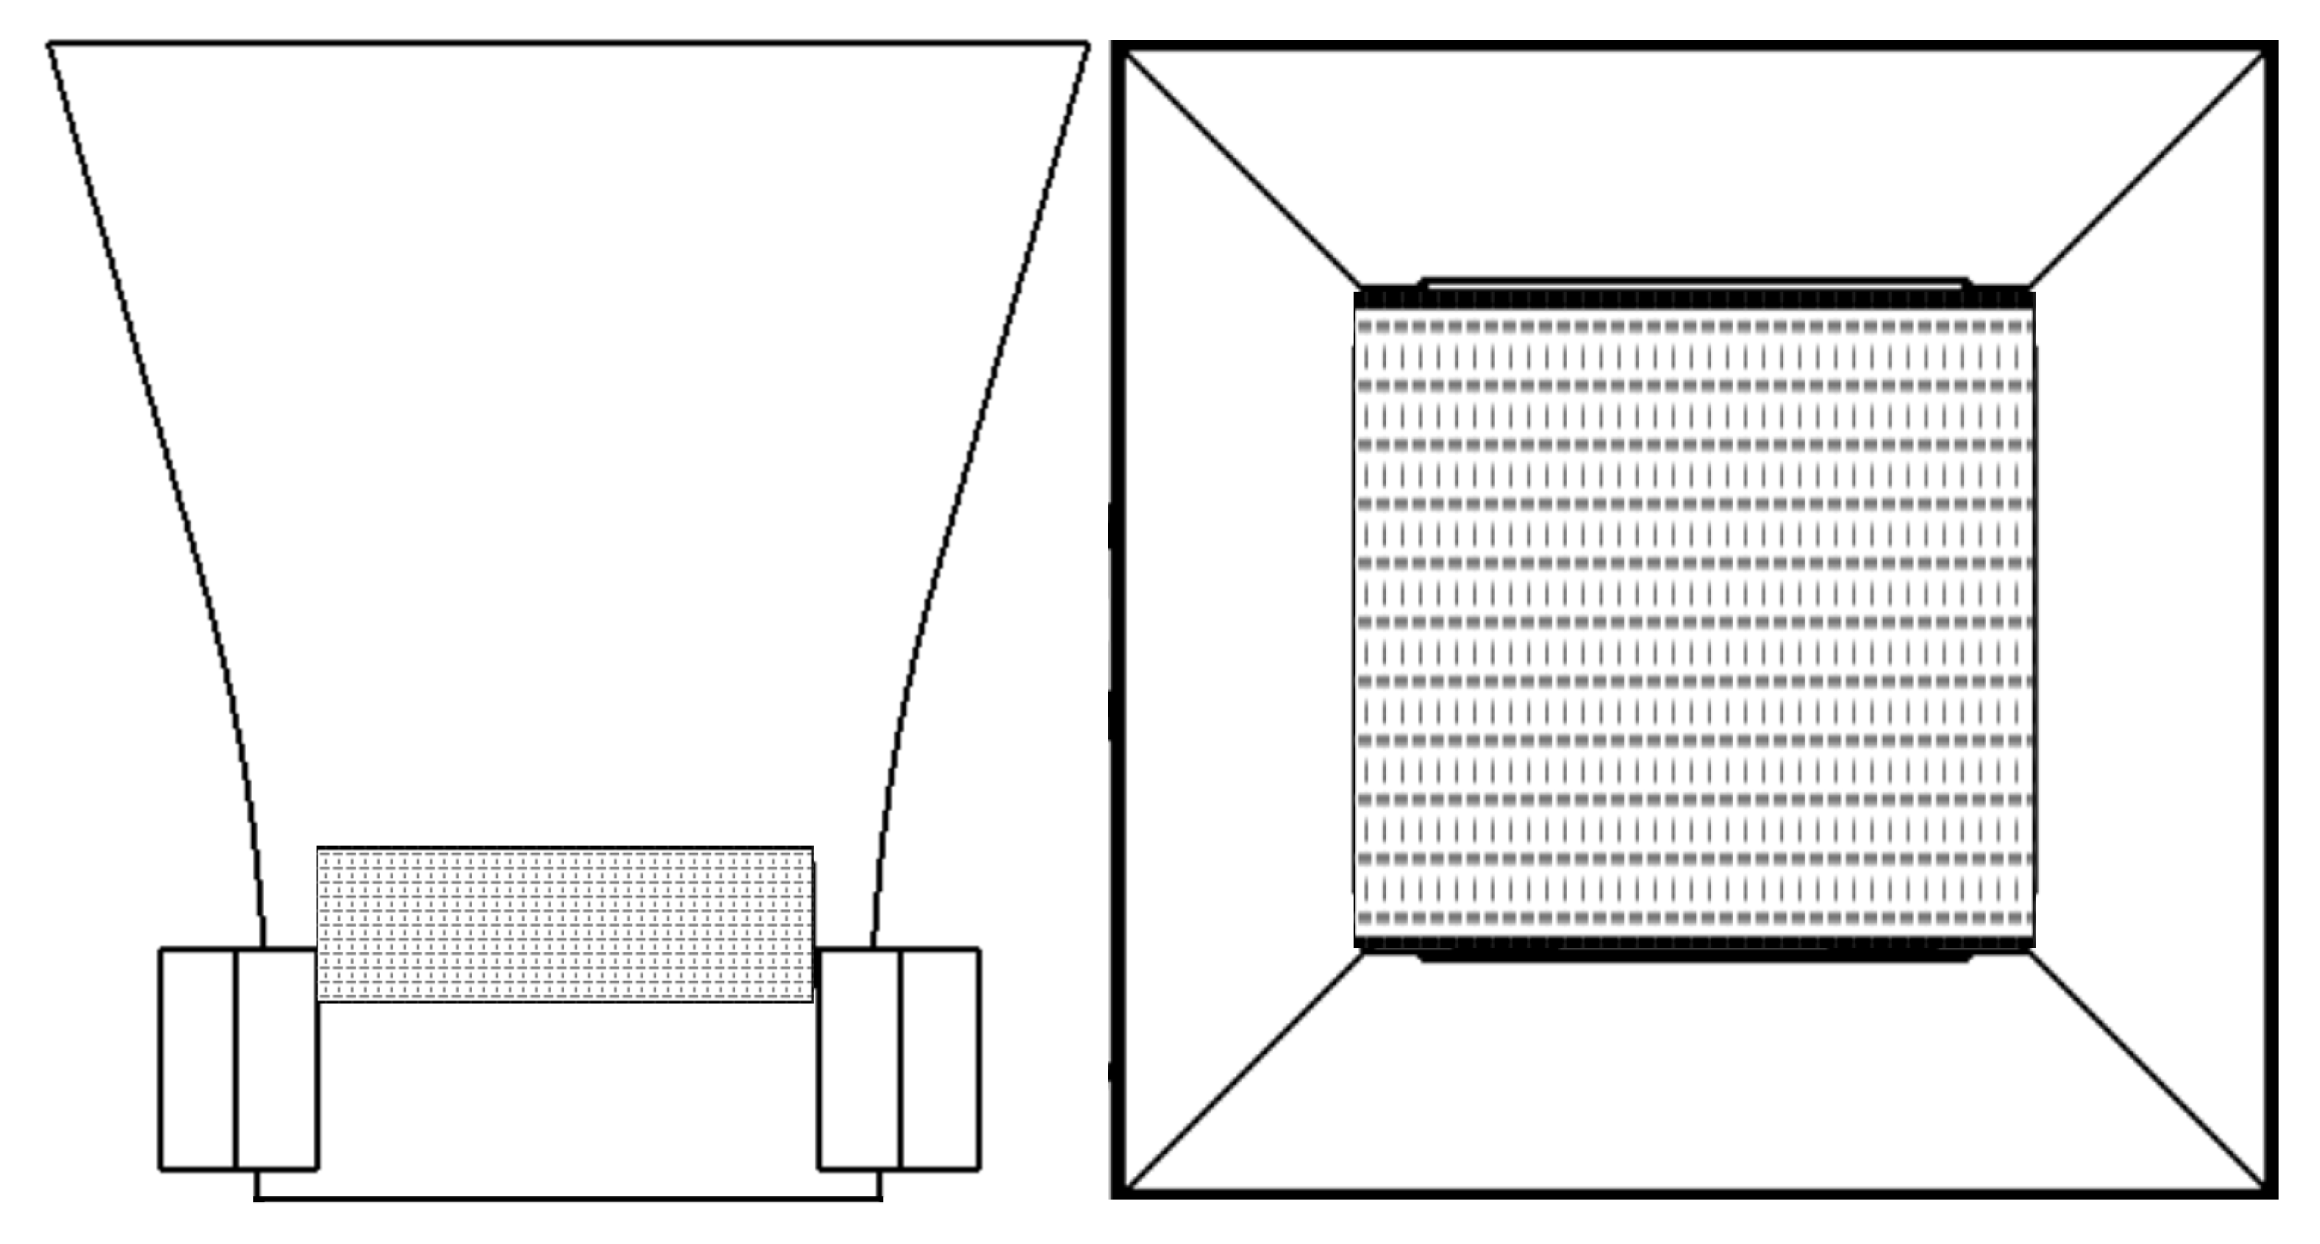
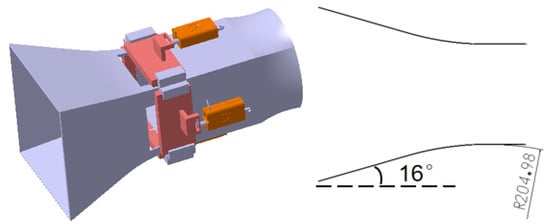
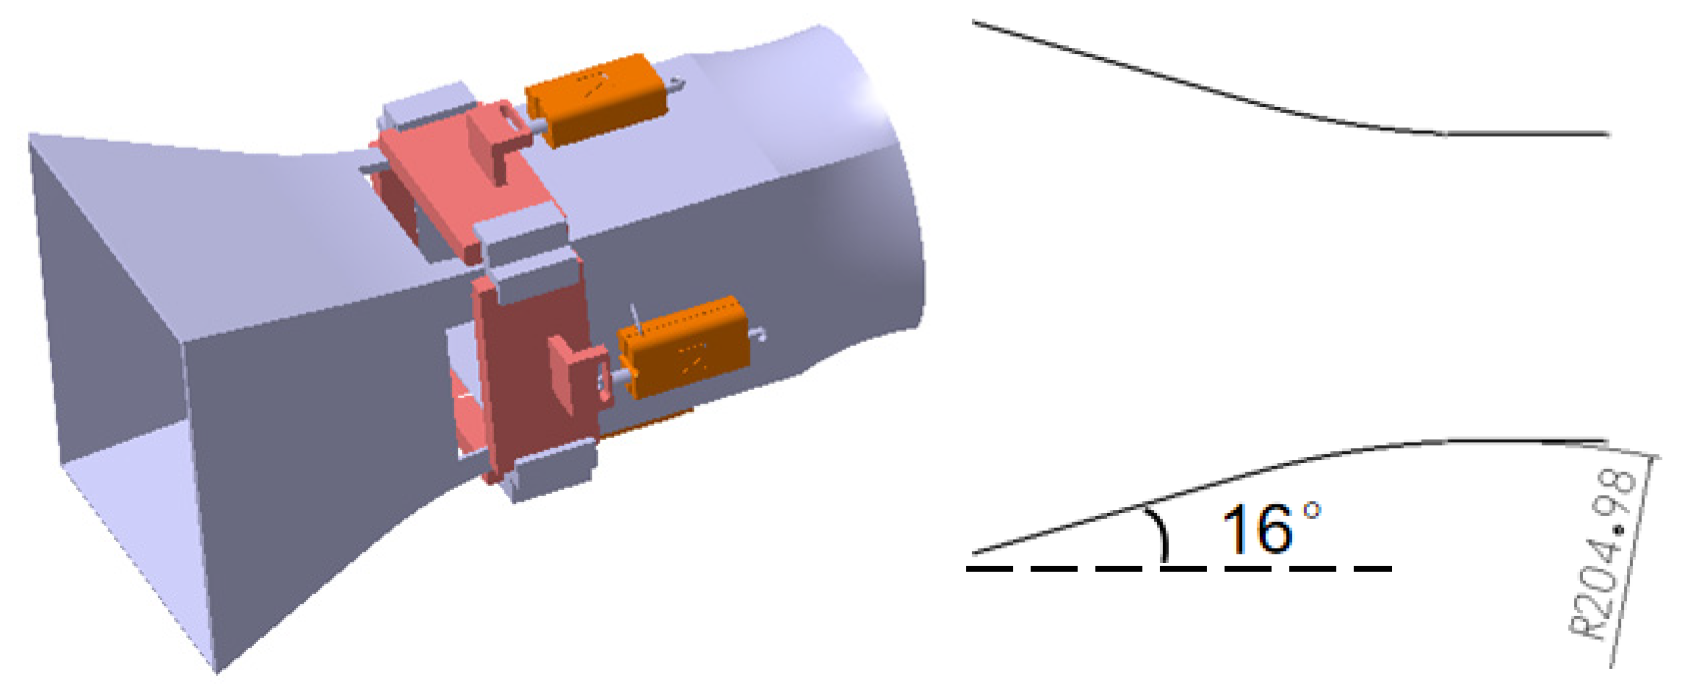
Finally, by combining the advantages and characteristics of the above walls, a composite wall was designed, with a circular arc at the front section with a radius of curvature of 205 mm and an obliquely cutting wall at the middle and rear section with a bevel angle of 16; the details are shown in Figure 3.
Figure 3.
Two-dimensional design drawings of four types of Coanda walls.
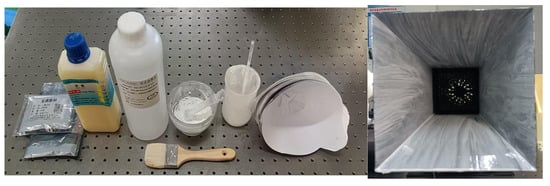
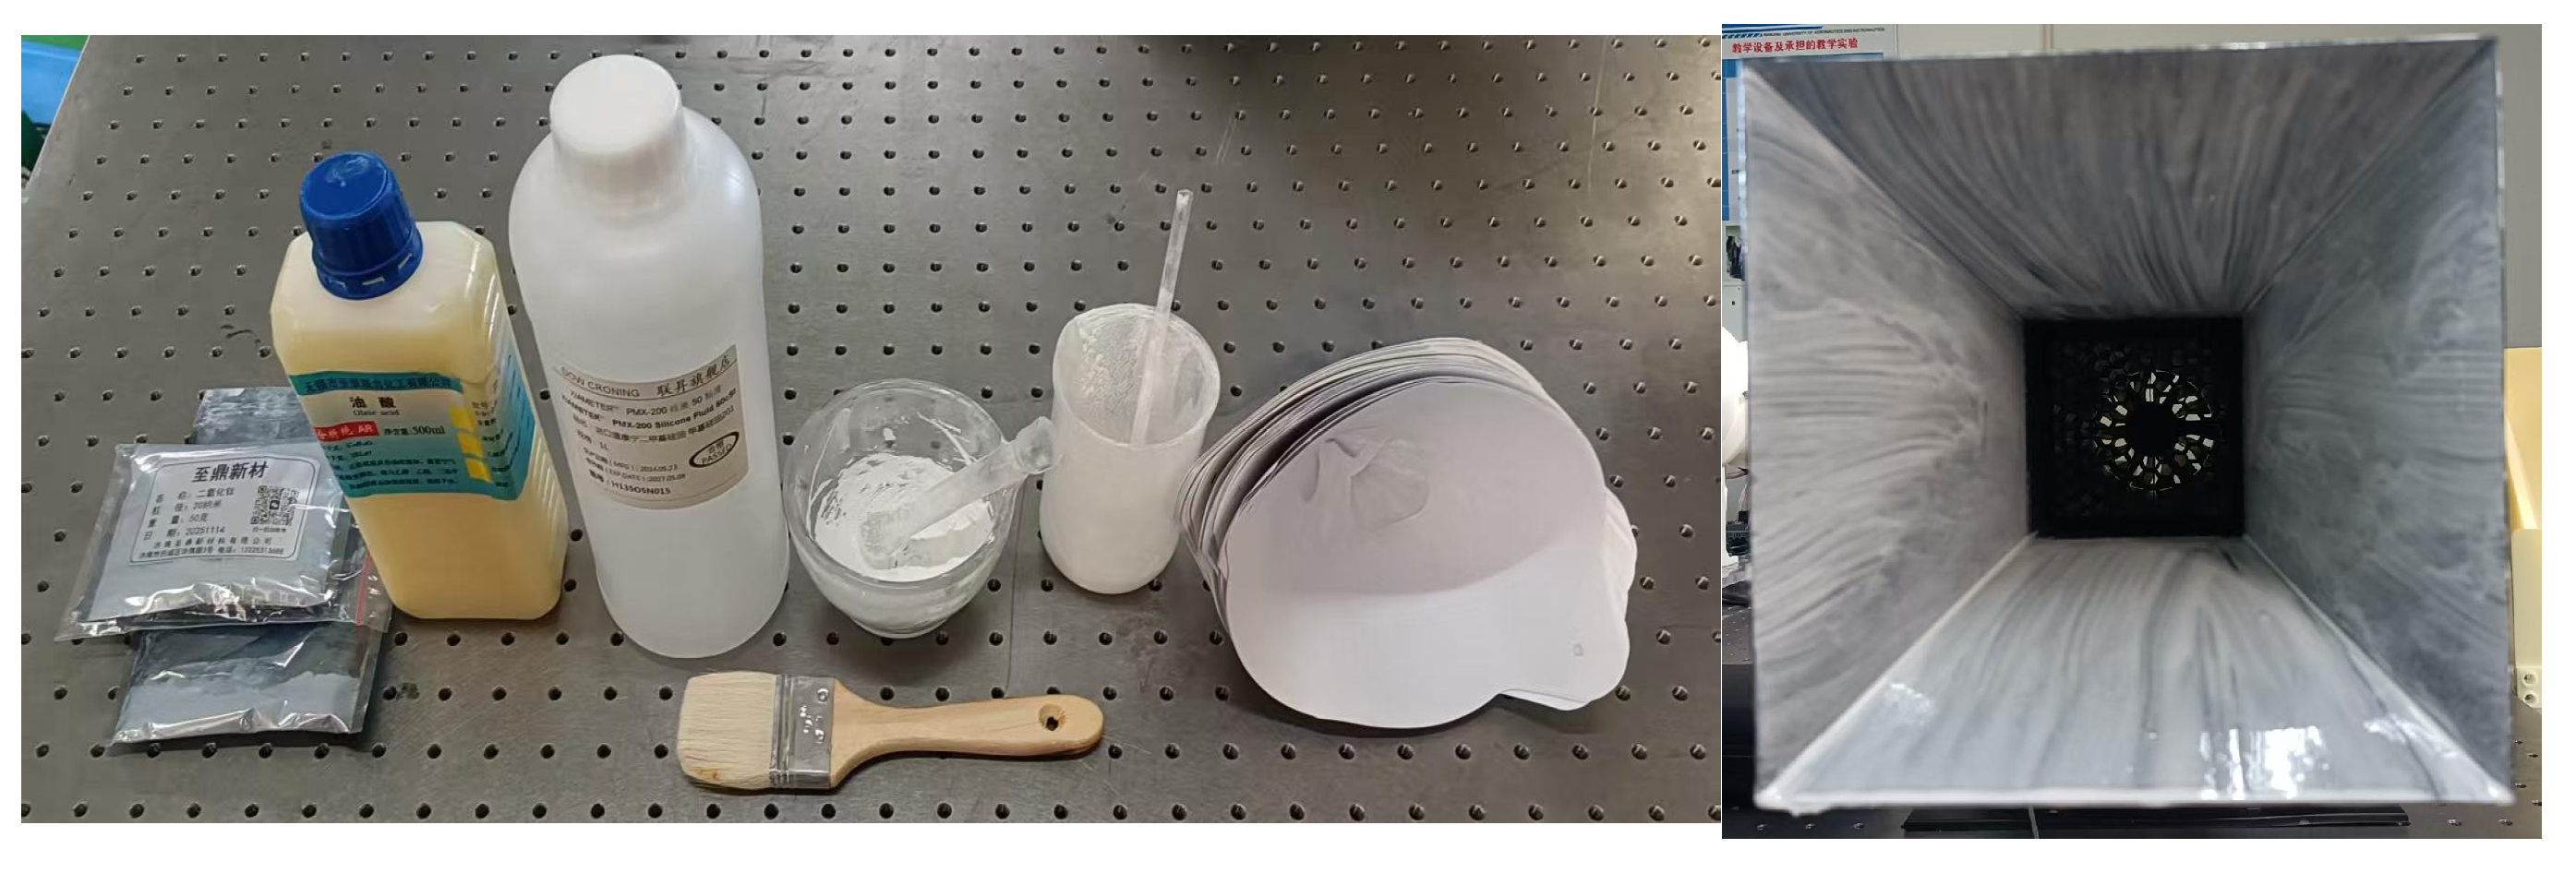
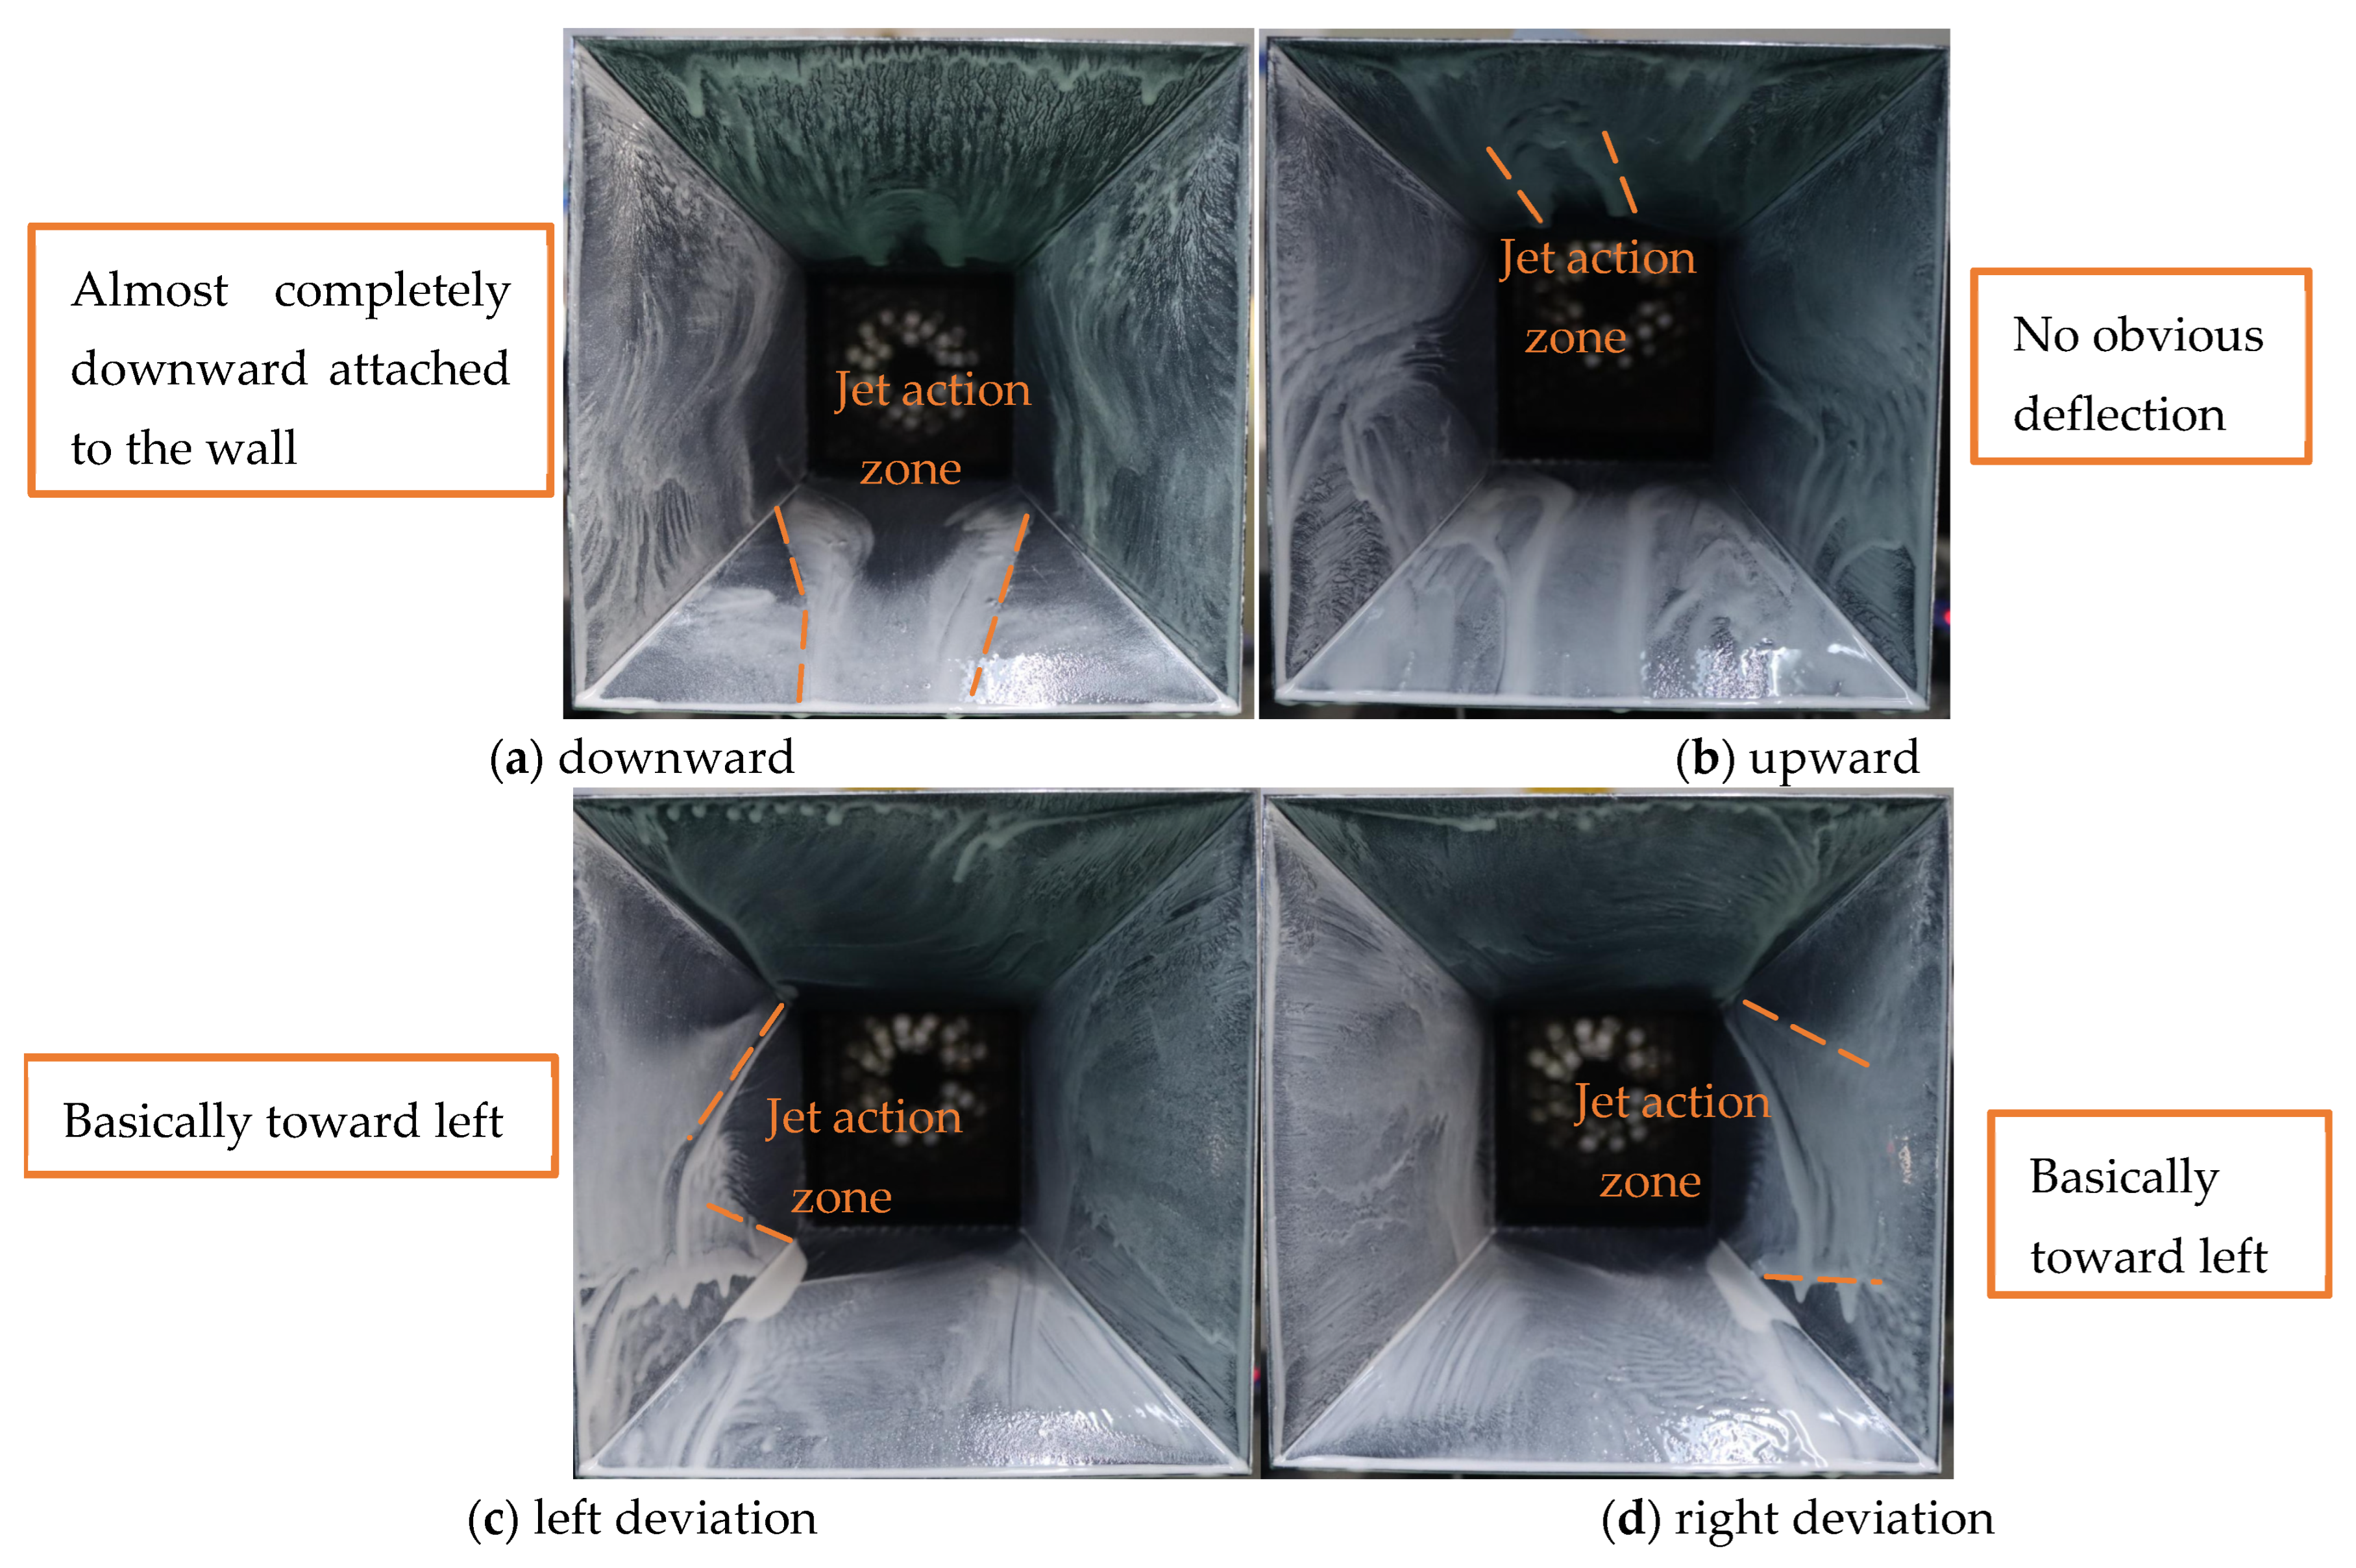
During the above-mentioned thrust vector angle measurement experiments, an oil flow experiment was employed as an auxiliary means to explore the wall attachment of the jet, as shown in Figure 4.
Figure 4.
Oil experiment.
As an effective method, an oil flow visualization experiment is often used to study complex flows such as separated flow and vortex flow. A mixture of titanium dioxide, simethicone oil and oleic acid is evenly stirred and smeared on the wall surface. When preparing the oil flow mixture, the mass fraction of TiO2 powder is typically set at around 20%, which can be increased or decreased appropriately according to the required concentration and visualization clarity. One or two drops of oleic acid are then added to the mixture using a pipette. Through the analysis of the oil flow on the surface of the research object, information such as the location, separation mode and vortices of the flow on the model surface can be obtained, and the friction lines formed by the jet on the object surface can be approximately visualized.
2.3. Technical Roadmap
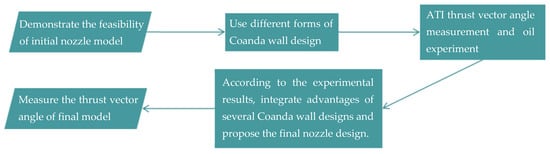
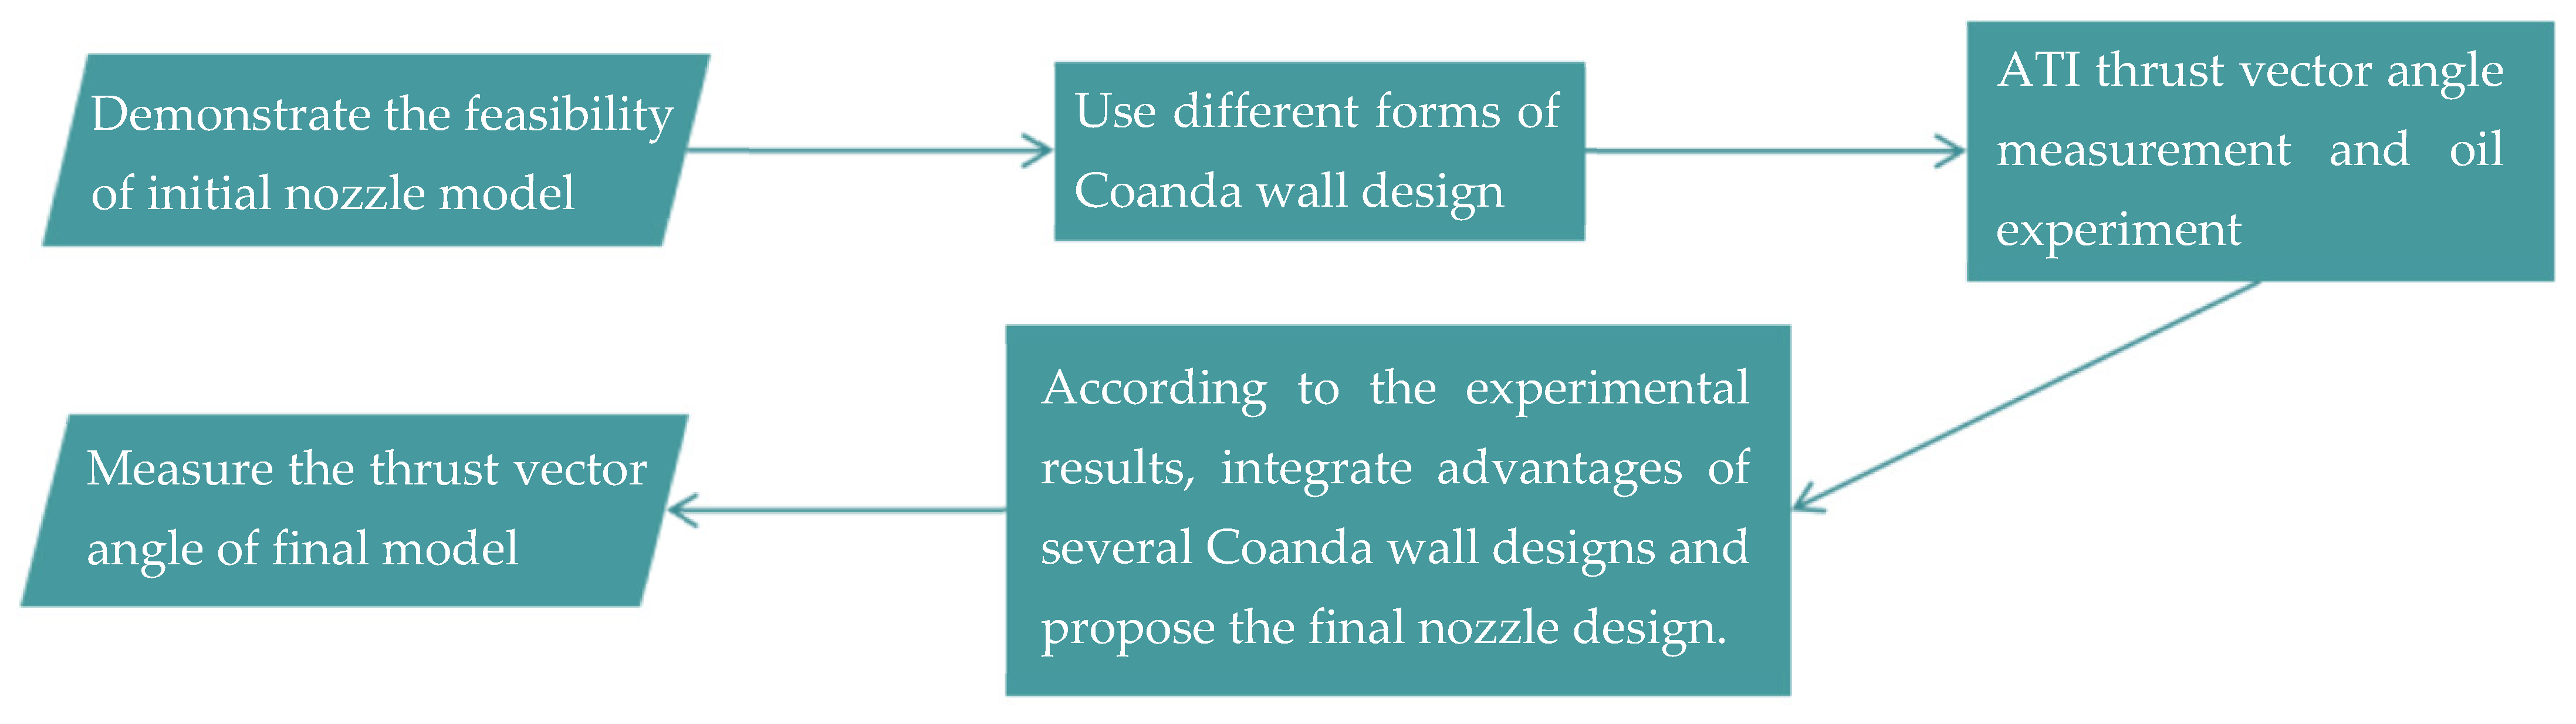
According to the above methods, a technical map is summarized in Figure 5.
Figure 5.
Technical roadmap.
2.4. Experimental Uncertainty Analysis
An experimental uncertainty analysis was conducted based on the error propagation method, considering all major measured parameters. The uncertainties of each parameter and the overall thrust vector angle error are summarized in Table 2. The maximum relative error of the thrust vector angle is estimated to be approximately ±2.3% under the test conditions, which is within an acceptable range for low-speed aerodynamic experiments.
Table 2.
The experiment uncertainty analysis.
3. Results
3.1. Deflection Results of Three Jet Velocities for the Curved Wall Design
In this study, four different types of Coanda walls are employed as jet attachment surfaces. An experimental test rig is constructed, consisting of an ATI force balance, a data acquisition system and a regulated power supply. Through static force measurement via the ATI balance, the variation in the thrust vector angle at ten valve opening levels in a single direction is investigated under different jet exit velocities.
The valve opening levels are defined as the ratio of instantaneous valve opening area to the full valve opening area, with a uniform step size of 10%. The positive vectoring direction is specified as follows: for the pitch axis, the upper valve is open while the lower valve is closed; for the yaw axis, the left valve is open while the right valve is closed. The reverse valve configuration corresponds to the negative direction. In passive fluidic thrust vectoring technology, the ratio of the induced secondary flow rate to the primary jet flow rate is a key parameter governing jet deflection and directly determines the deflection performance prior to the onset of wall attachment. In this experiment, thrust vector angles of the four wall configurations were measured under three jet exit velocity conditions. The valve opening was set to ten discrete increments from 0% to 100%, with a 10% step for each actuation. The output force components along the X and Y axes were measured using an ATI multi-axis force balance, and the thrust vector angles were calculated from the acquired experimental data.
As shown in Figure 6, all four directional valves share the same full opening area. Given the jet exit channel area , the engineering-estimated discharge coefficient , the valve opening ratio k, and the corresponding valve opening area , the induced secondary flow ratio at a jet velocity of 80 m/s is derived as follows:
Figure 6.
Secondary flow inlets and primary jet exit.
The low-speed jet (v = 80 m/s, Mach number = 0.24, altitude of 0 km (sea level), and atmospheric temperature of 25 °C; the characteristic length is taken as the nozzle exit length of 125 mm, and the dynamic viscosity coefficient Pas, ) is treated as incompressible flow, and the air density is taken as under standard conditions. It is approximated that the driving pressure difference across the valve equals the dynamic pressure of the primary jet, the static pressure in the wall attachment cavity is equivalent to that of the primary jet, and the total pressure of the primary flow is equal to the ambient atmospheric pressure, which is a widely adopted simplification for preliminary estimation in this field.
The discharge coefficient of the intake valve adopts the conventional engineering empirical value, while that of the primary jet channel is taken as unity. A is the effective flow area of the valve, is the air density, v is the primary jet exit velocity, and is the driving pressure difference across the valve, which equals the dynamic pressure of the primary jet: . Accordingly, the mass flow rate equation is derived as follows, where denotes the discharge coefficient:
The secondary flow rate is determined through analytical formula calculation, which incorporates parameter estimation based on engineering experience.
With single-side valve intake (the opposite valve remains closed during deflection), the full opening area of a single valve is , and the corresponding flow area at valve opening ratio k is kA1. The flow ratio can be calculated according to the formula:
where denotes the secondary flow rate and m denotes the nozzle jet flow rate. When the valve is fully open (100% opening), the secondary flow rate accounts for approximately 12.5% of the primary jet flow rate.
This result is a simplified estimation. The actual secondary flow rate is influenced by factors including the Coanda wall profile, flow separation and pressure distribution.
In this simplified derivation, the flow ratio has no direct correlation with the jet velocity. Since both the secondary flow rate and the primary flow rate are proportional to the velocity, the velocity terms cancel out in the ratio, so the form of this estimation formula remains consistent under different jet velocities.
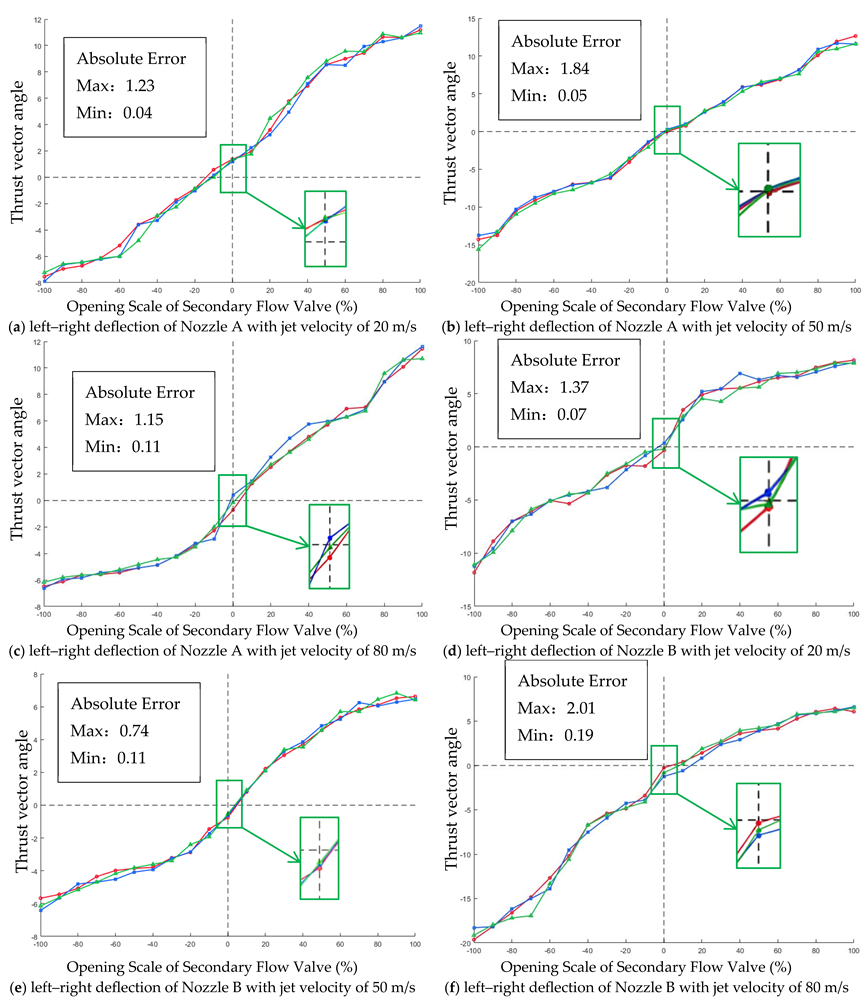
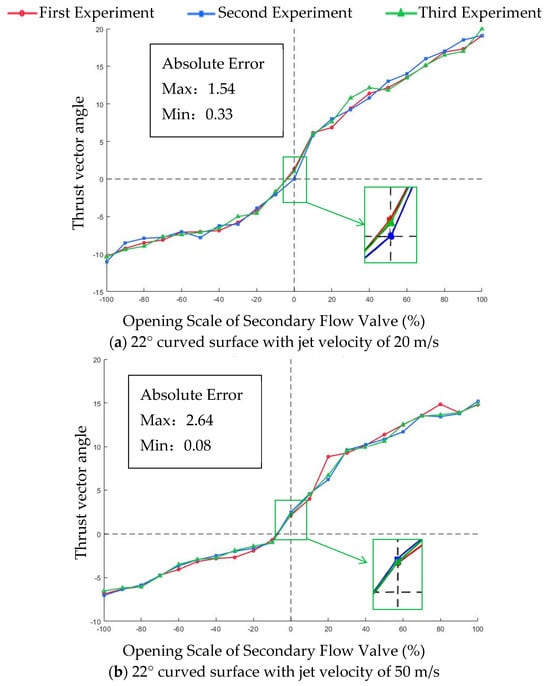
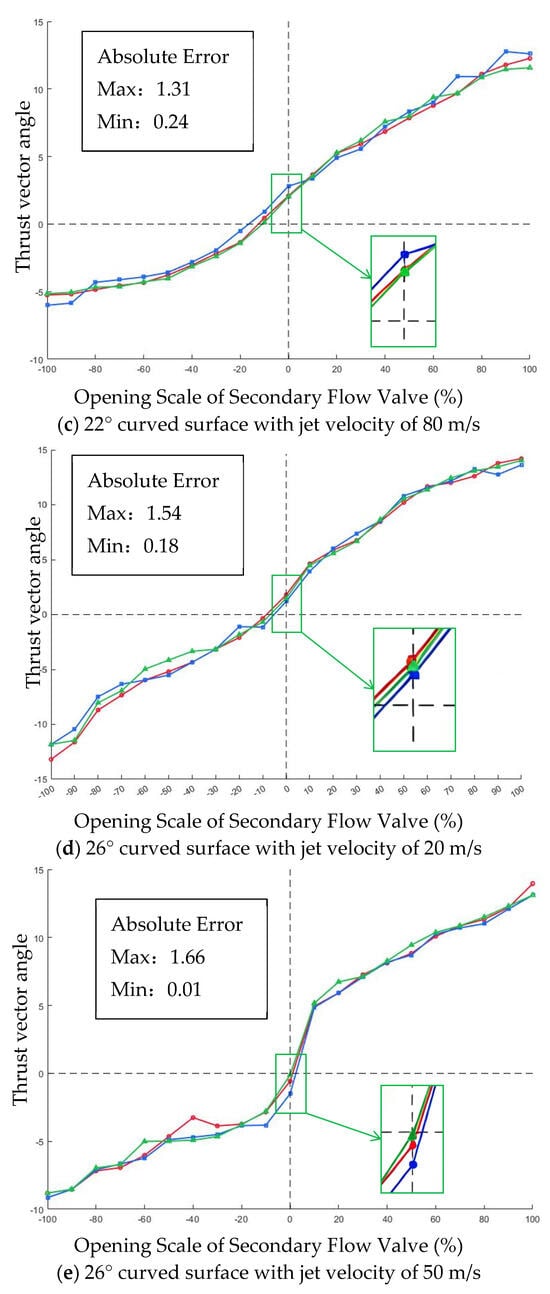
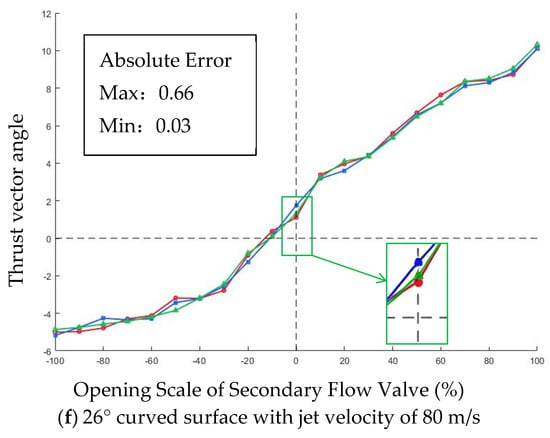
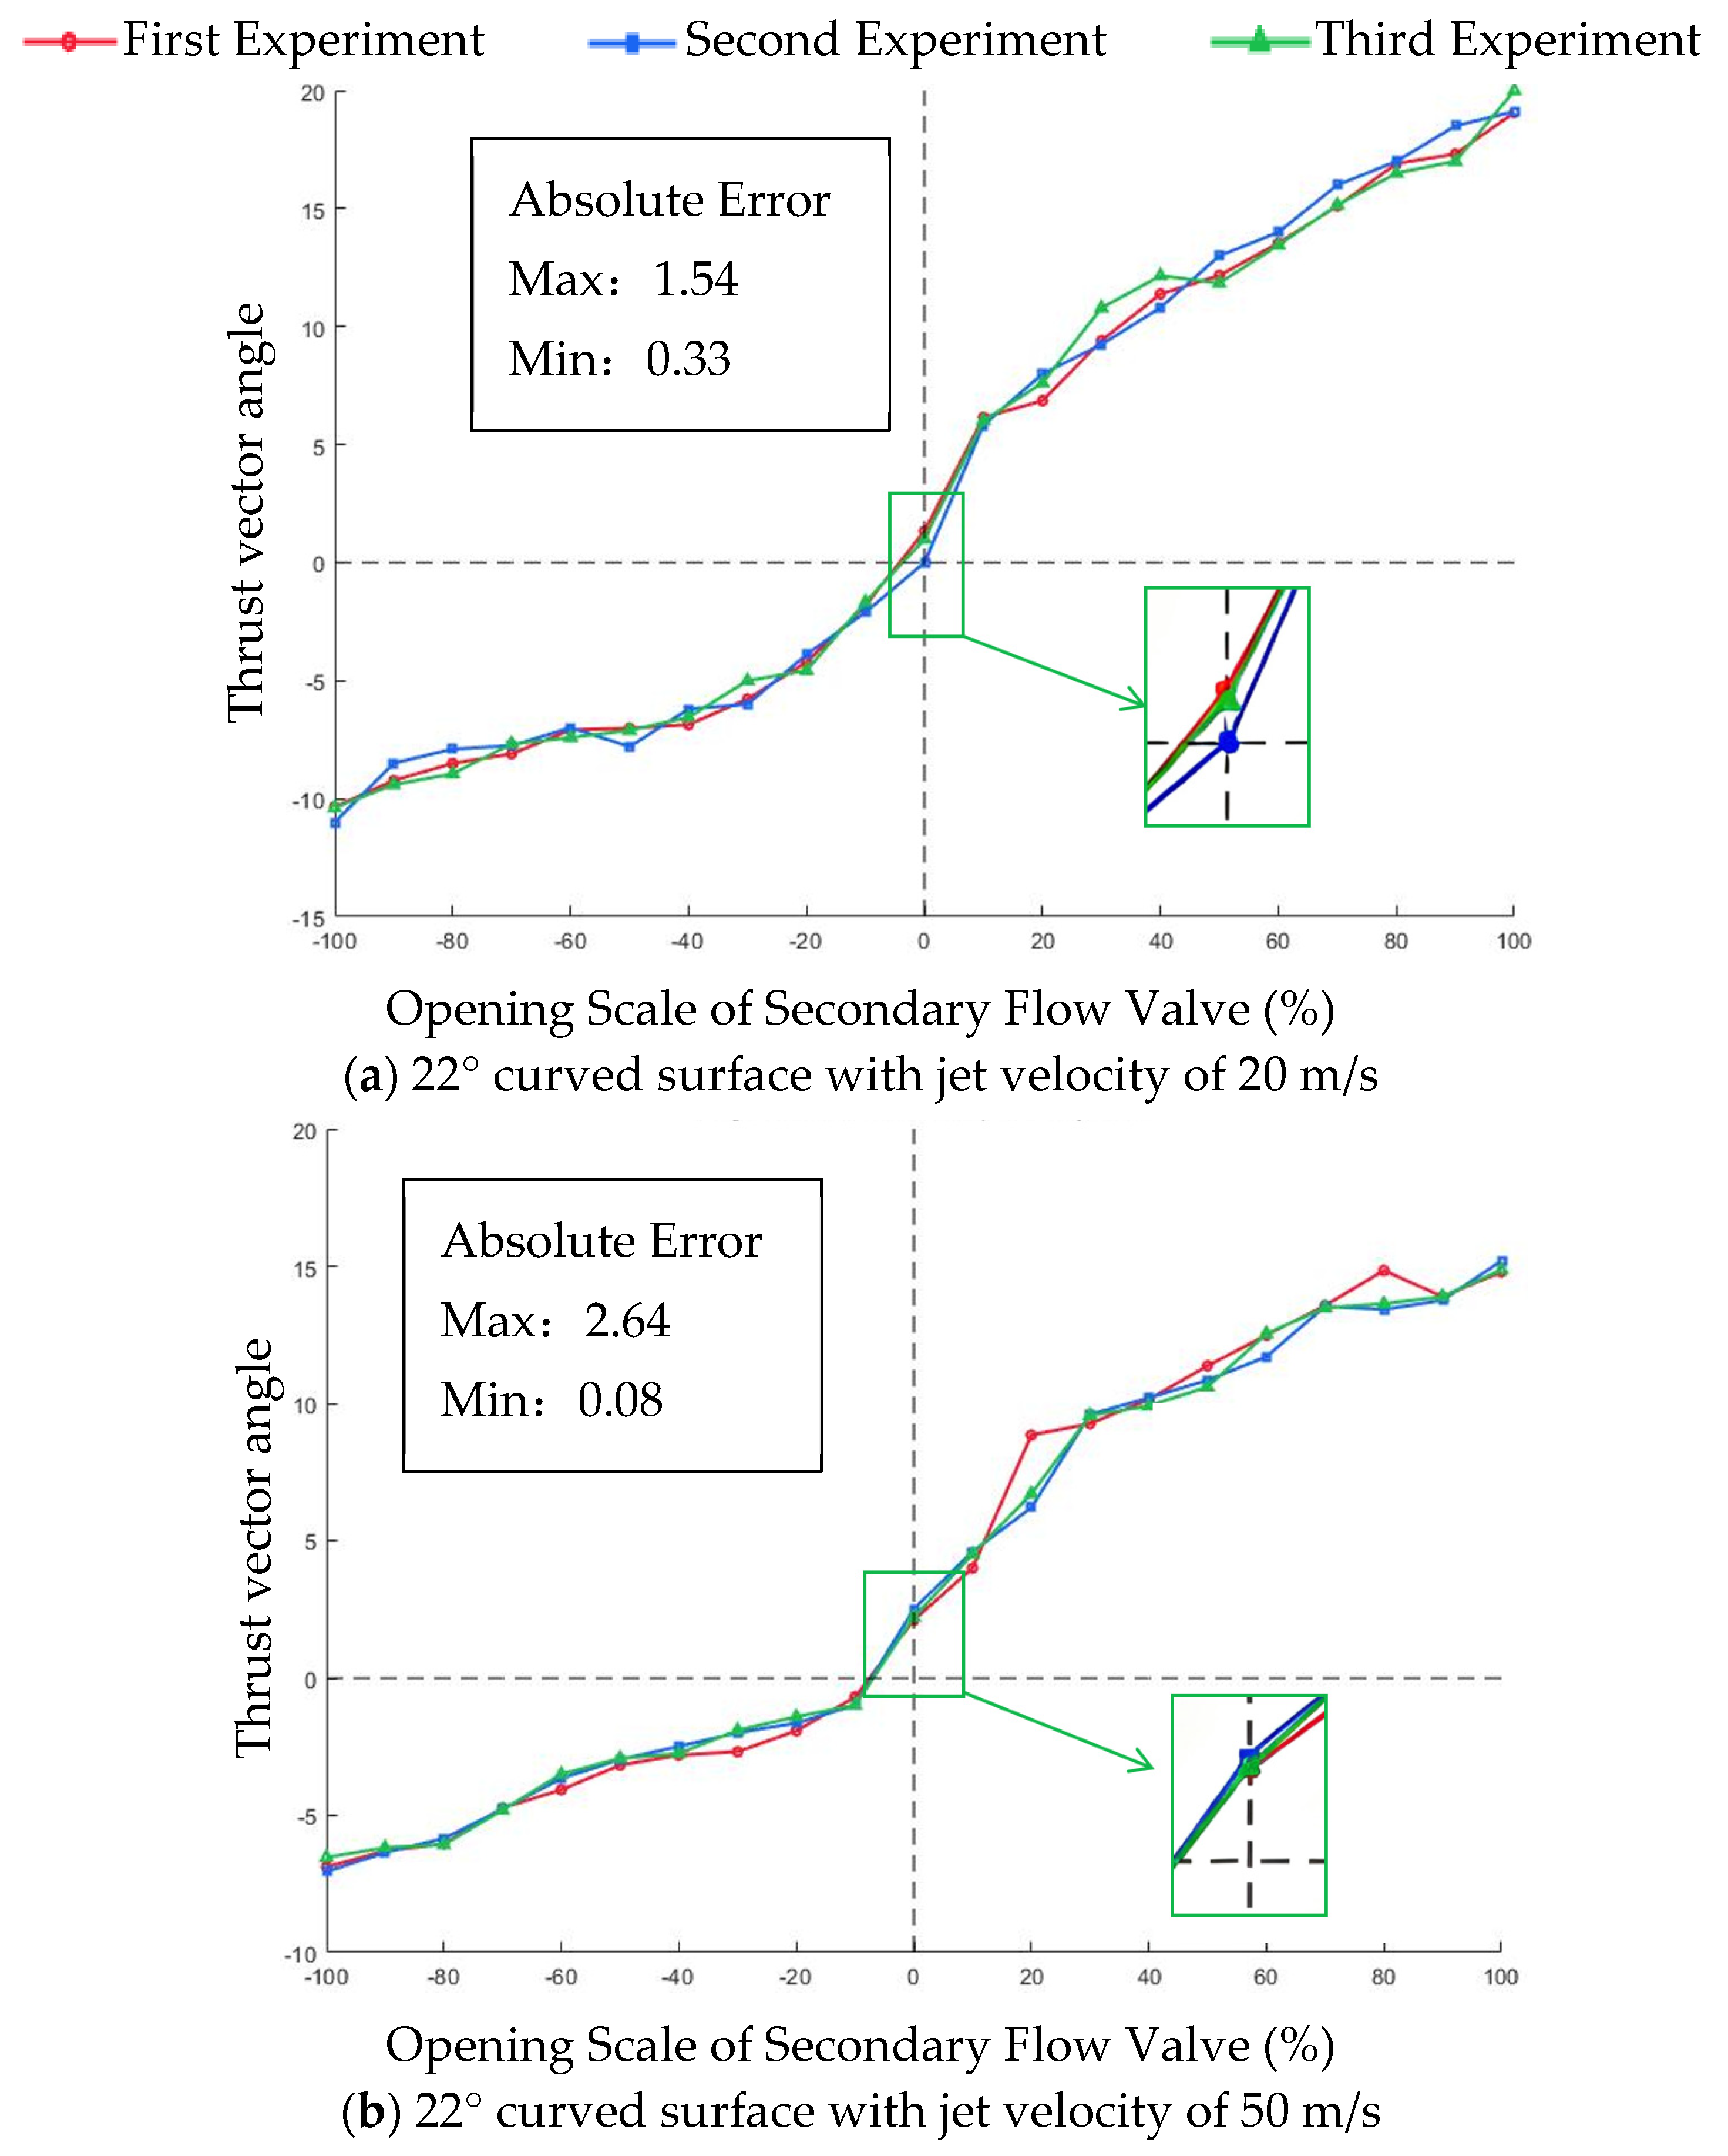
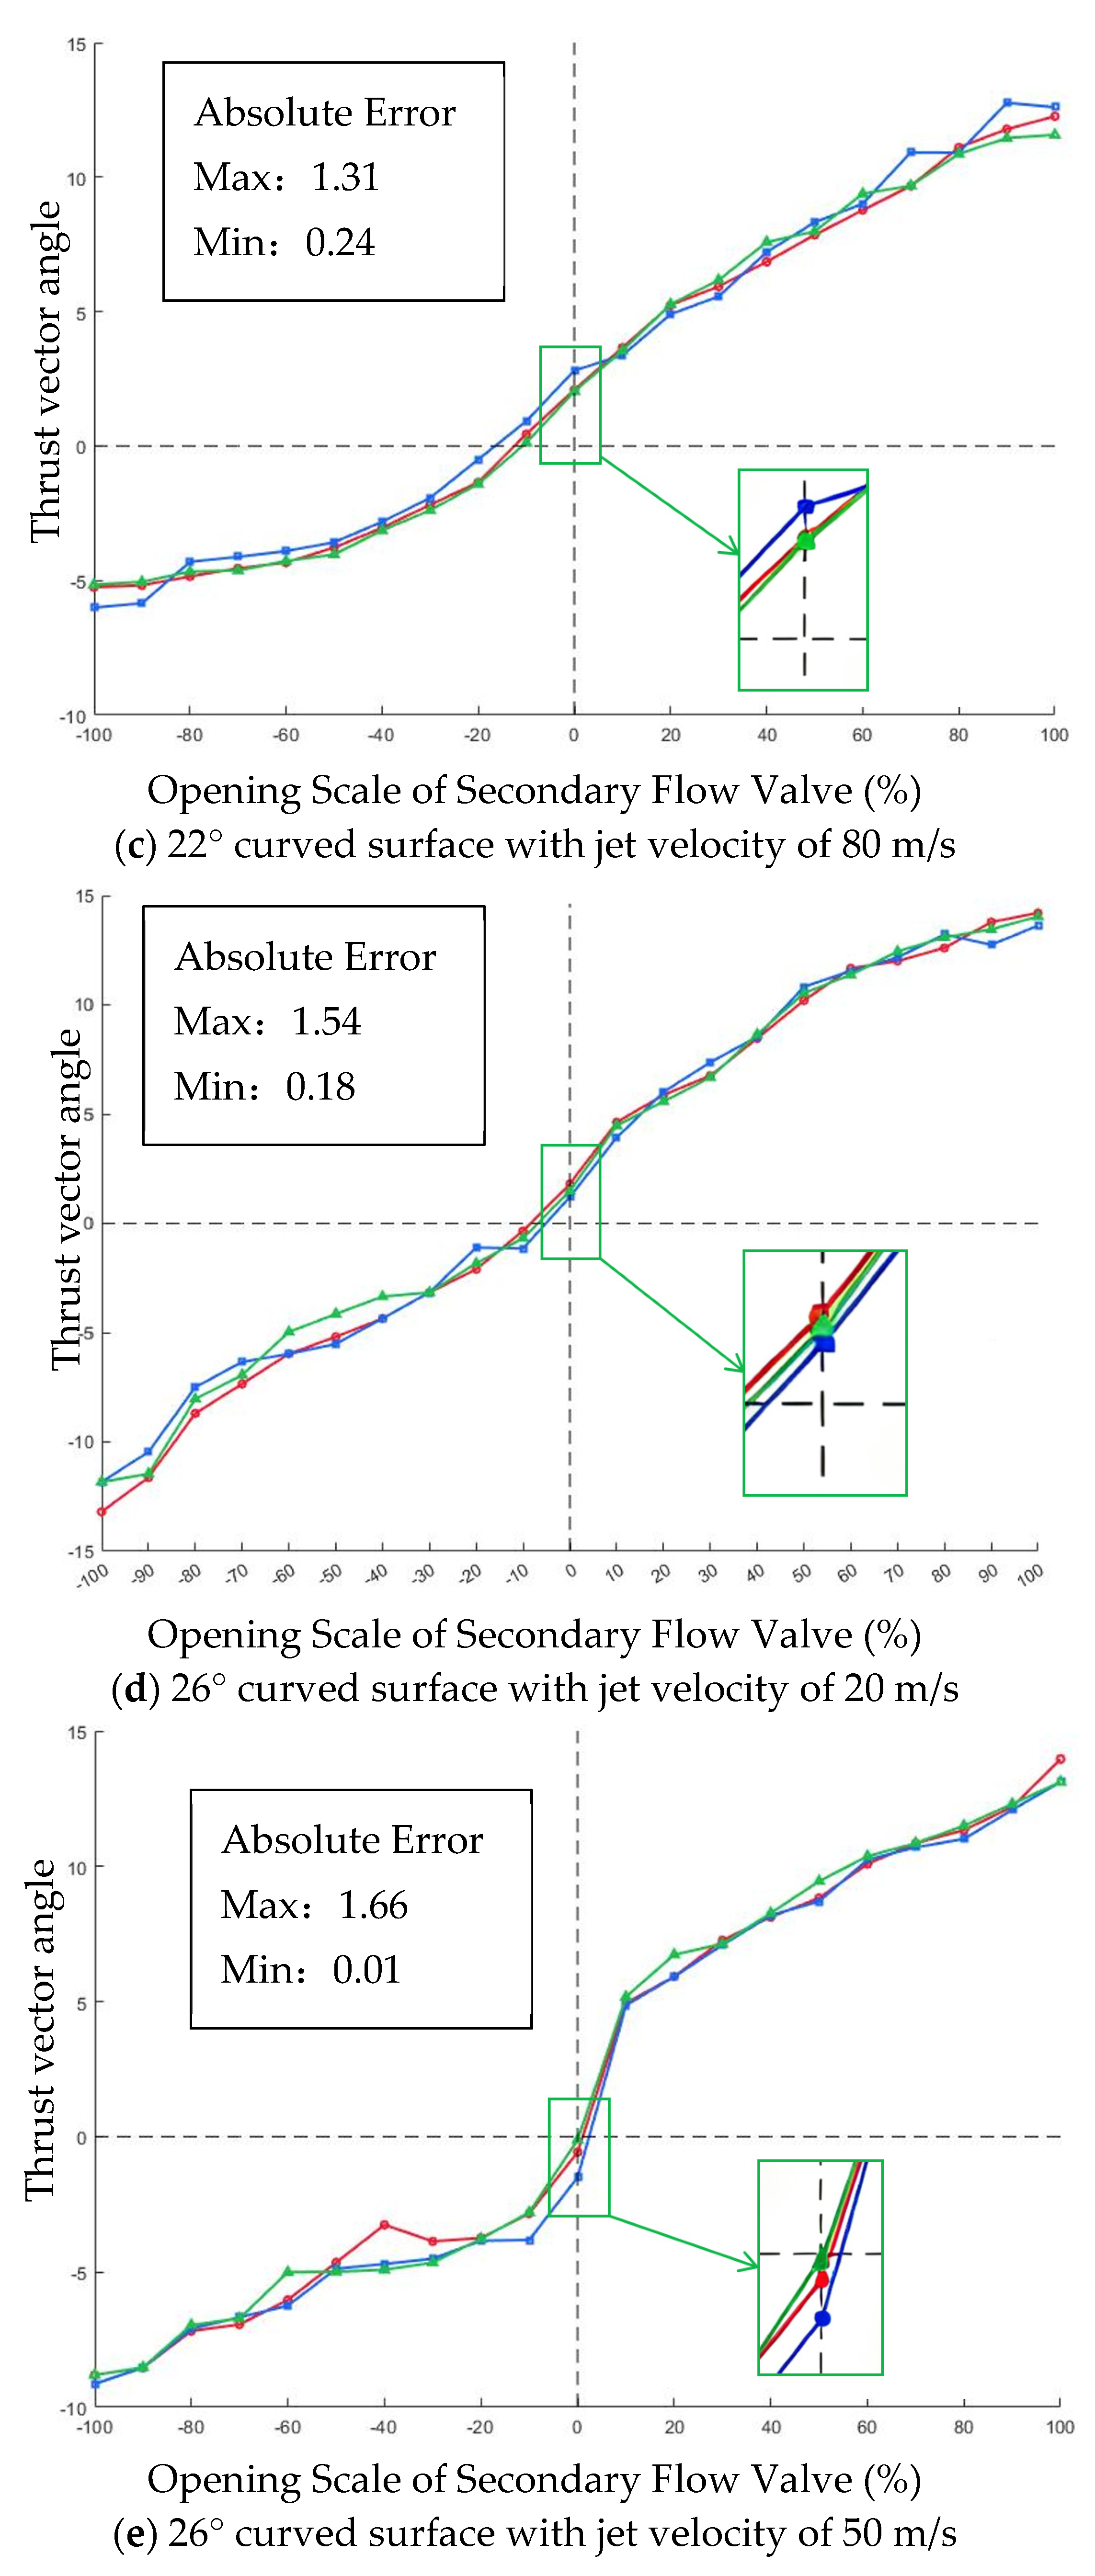
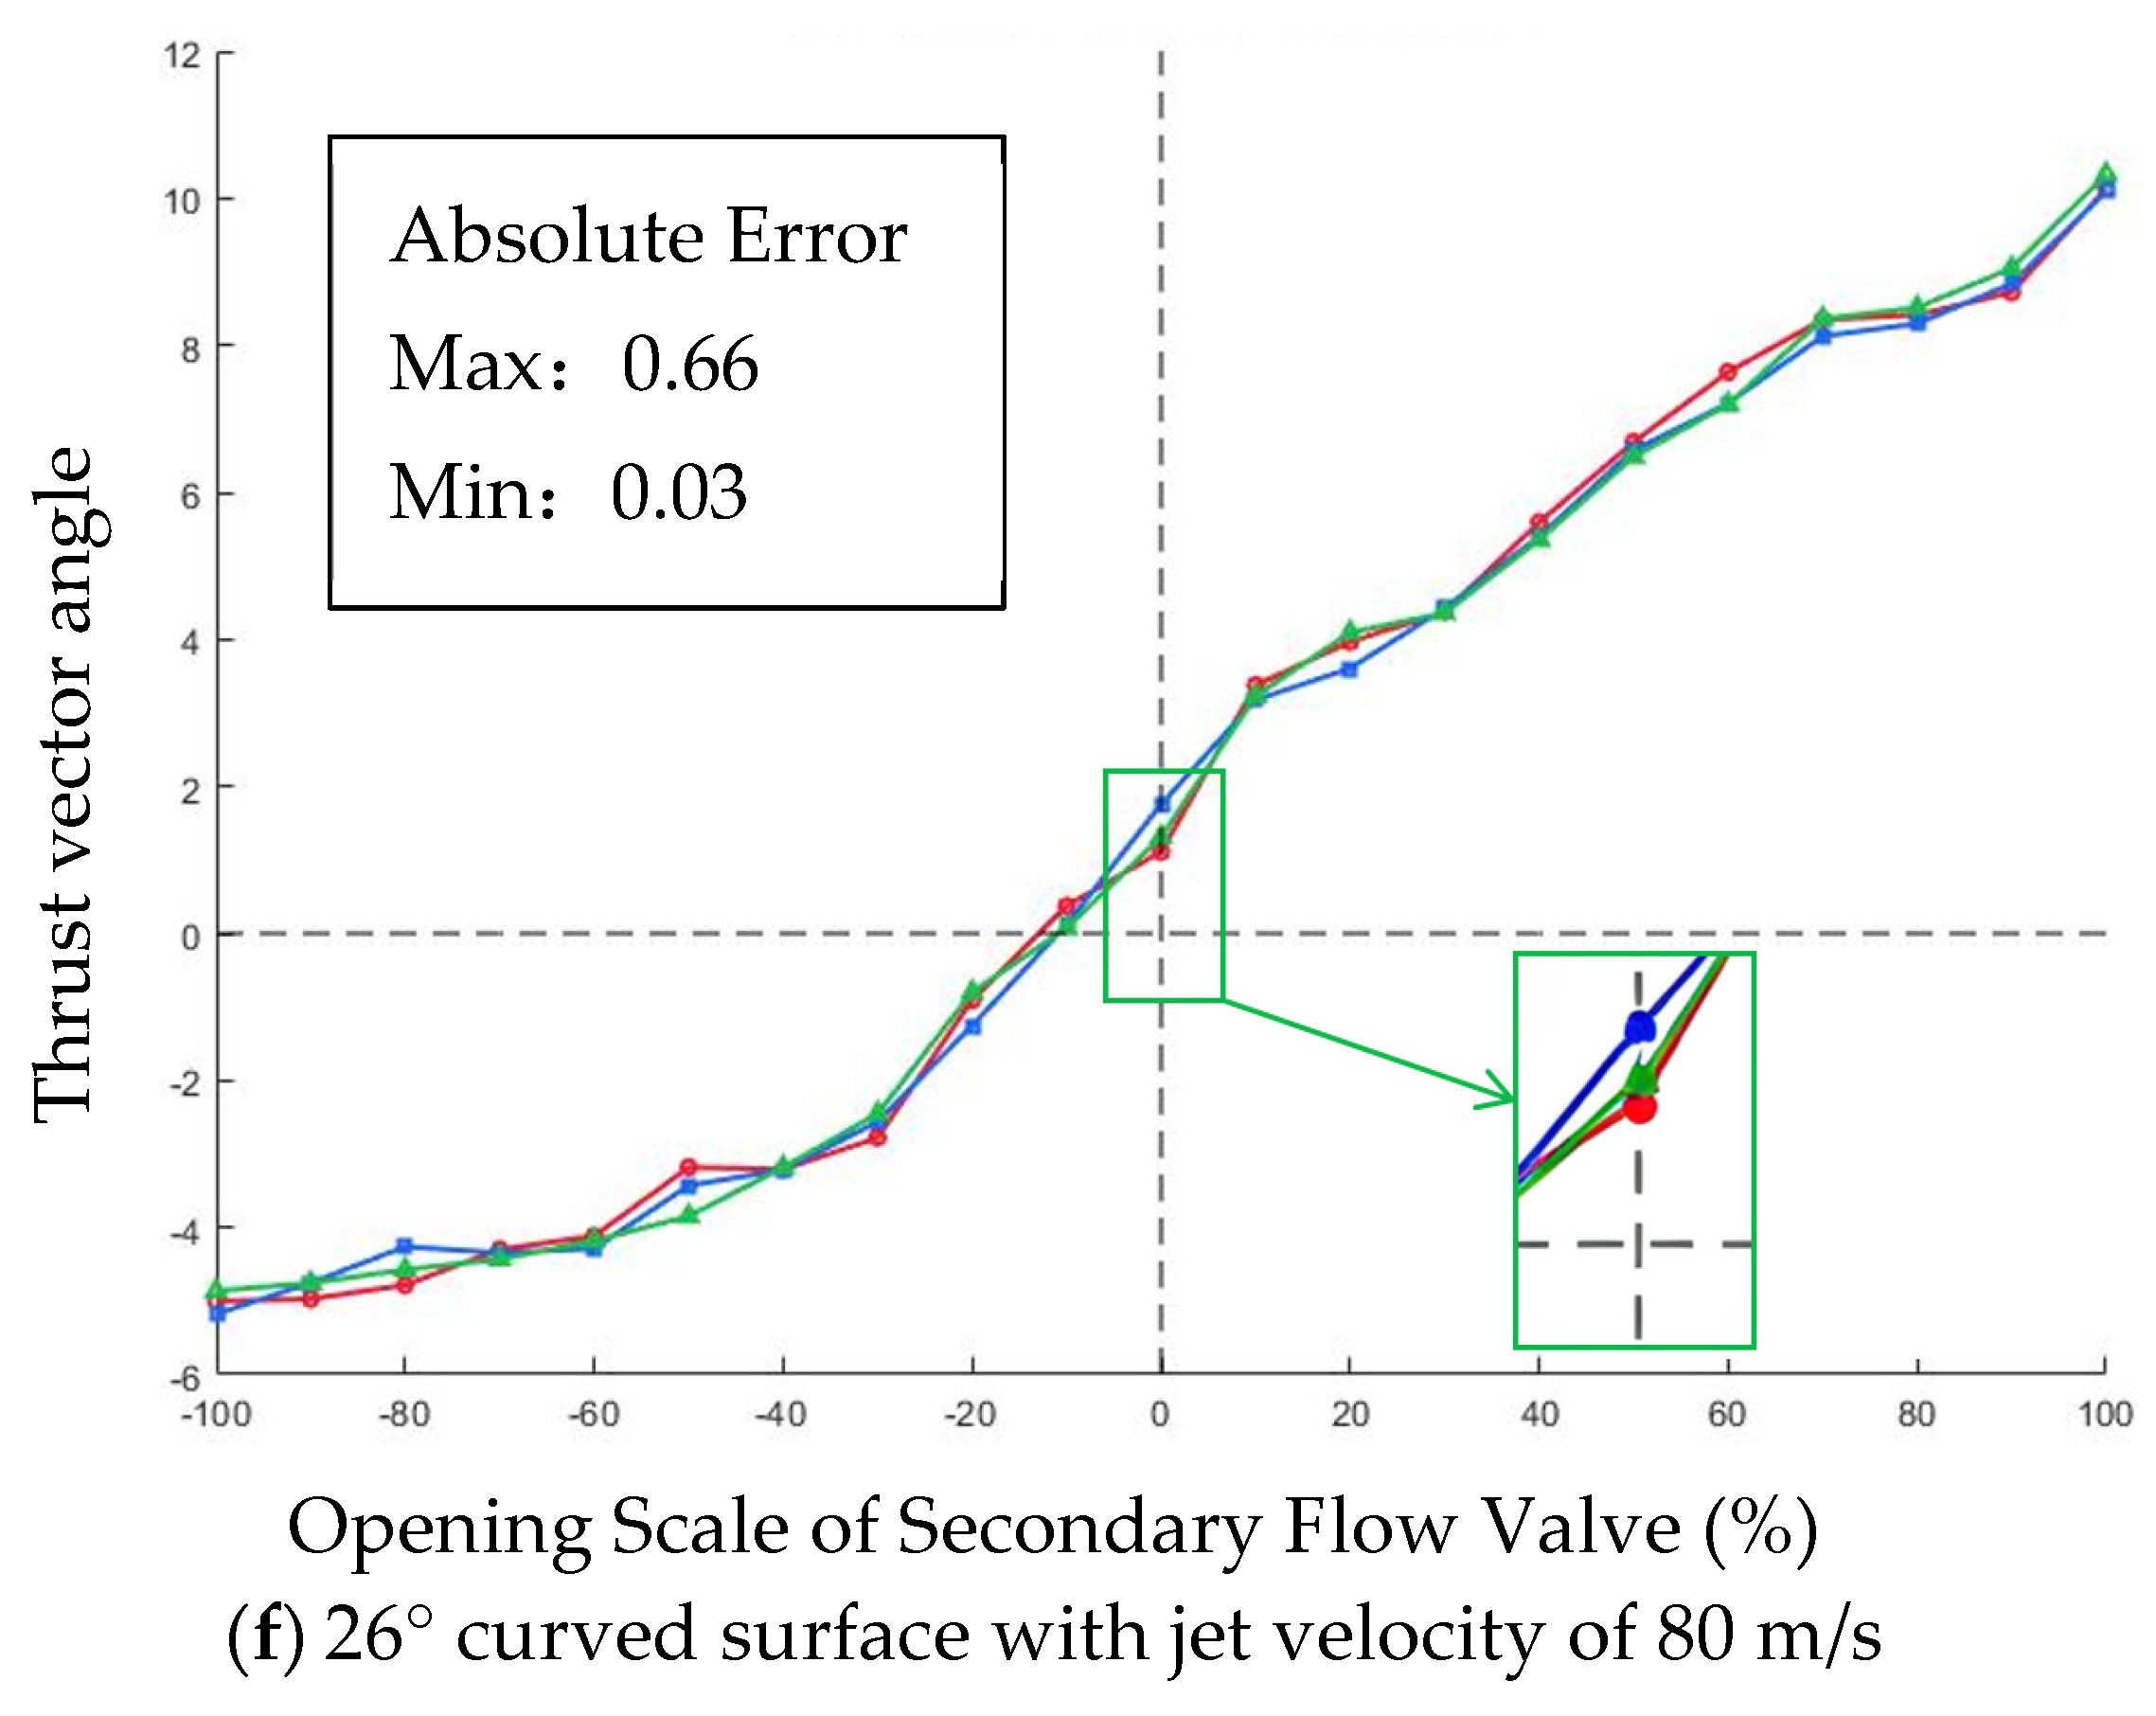
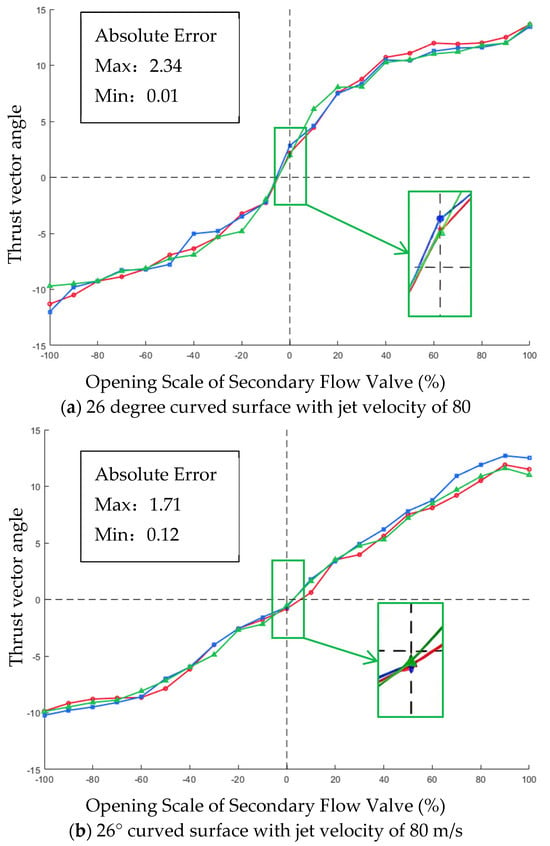
Both Nozzle A and Nozzle B adopt a curved wall design. Nozzle A features a larger wall curvature, where the line connecting the start and end points of the wall surface forms a 26° angle with the horizontal plane, while that of Nozzle B forms a 22° angle. For the thrust vector angle measurement experiments of the two curved wall nozzles, taking the pitch (up–down) valve opening as an example, the thrust vector angles corresponding to ten opening levels in a single direction were measured at jet exit velocities of 20 m/s, 50 m/s and 80 m/s. The results are presented in Figure 7, while the results for the yaw (left–right) direction are provided in Appendix A.
Figure 7.
Vector angle deflection of up–down on a curved wall surface.
At 0% valve opening, a small initial jet deflection occurs due to installation misalignment of the thrust line of the propulsion system. With increasing valve opening, the induced secondary flow rate rises correspondingly, resulting in gradual jet deflection. The deflection angle exhibits a linear relationship with the valve opening within a certain range and reaches its maximum at full opening under the combined action of the Coanda wall attachment effect.
For Nozzle A, the vector angle ranges from −13° to 14° at a jet exit velocity of 20 m/s, from −9° to 14° at 50 m/s, and from −5° to 10° at 80 m/s. For Nozzle B, the thrust vector angle ranges from −11° to 20° at 20 m/s, from −7° to 15° at 50 m/s and from −6° to 12° at 80 m/s. For the above two curved wall design nozzles, the greater the jet exit velocity, the smaller the maximum deflection angle, but no consistent trend is observed between the two wall designs. Combined with the oil flow experiment, it is found that the curved wall design renders the jet attachment to the wall unstable, which leads to unstable deflection.
3.2. Analysis of Experimental Results
3.2.1. Repeatability and Uncertainty Analysis
Measurement error refers to the difference between a single measured value and the true value of the measurand; it is an intrinsic deviation that cannot be accurately quantified as the true value is generally unknown, but it can be categorized into systematic and random errors. Measurement uncertainty is a parameter associated with measurement results that characterizes the dispersion of values reasonably attributed to the measurand, synthesized from statistically evaluated Type A components and non-statistically evaluated Type B components to quantify the credible range of measurement results. Repeatability describes the degree of consistency of multiple measurement results obtained under identical conditions, reflects only result dispersion caused by random factors, and constitutes the calculation basis and a component of Type A standard uncertainty.
In this experiment, an ATI-9610 balance was used to measure the thrust vector angle of the deflection mechanism composed of the four-way axisymmetric aerodynamic vectoring nozzle. Three experiments were carried out at the same jet velocity, taking the 22° curved surface with a jet velocity of 80 m/s in the up–down direction as an example.
The ATI six-component balance adopted in this work is a high-precision force measurement device, and the test rig and air supply system exhibit good stability, resulting in low random dispersion in the measurement results. Three replicate measurements are adequate to stably characterize the random fluctuation characteristics of the measured values. The uncertainty analysis in this paper employs the small-sample Student’s t-distribution method to calculate the confidence interval and expanded uncertainty rather than the normal distribution for large samples. For two degrees of freedom, the t-critical value at the 95% confidence level is 4.303, which is much larger than 1.96 from the normal distribution. This method inherently introduces a conservative statistical correction for small sample sizes, ensuring the rigor and reliability of the uncertainty evaluation. According to the component-wise assessment, Type B components (including instrument accuracy, installation alignment, operating condition fluctuation, etc.) dominate the total uncertainty, while the Type A random uncertainty accounts for a relatively small proportion. Further increasing the number of repeated measurements can only reduce the Type A component slightly, providing very limited improvement in the total uncertainty. Therefore, three repeated measurements are sufficient and reasonable from an engineering perspective and can fully satisfy the requirements of repeatability verification and uncertainty analysis.
As shown in Table 3, the minimum difference among the experimental results of the three thrust vector angle measurements is 0.29°, and the maximum difference is 1.31°. The data scatter may arise from a dynamic imbalance in the turbofan, the suction of the secondary flow, the connections of the sensors, and other factors.
Table 3.
Results for the 22° curved surface with a jet velocity of 80 m/s in the up–down direction.
3.2.2. Experimental Standard Deviation and Repeatability Coefficient
The experimental standard deviation of triplicate measurements under each condition is calculated via Bessel’s formula, which characterizes the dispersion of measured values:
where is the number of repeated measurements, is the arithmetic mean of the three measurements, denotes the i-th measured value and is the experimental standard deviation of a single measurement.
The coefficient of variation of repeatability (repeatability coefficient) is adopted as the relative repeatability metric to eliminate the influence of the vector angle amplitude:
Calculation results over the full operating range show that:
- The experimental standard deviation of a single measurement ranges from 0.21° to 0.53°, with a maximum difference of 1.31° and a minimum range of 0.29° among the triplicate results;
- The repeatability coefficient is approximately 4–9% under large vector angle conditions (valve opening ±100%) and is slightly higher for small-angle conditions due to the lower absolute values of the measurements;
- The overall measurement repeatability is favorable, and the stability of the test system satisfies the requirements of low-speed proof-of-concept experiments.
3.2.3. Confidence Interval
Since only three repeated measurements are available for each condition (small sample), the t-distribution is applied to calculate the confidence interval of the mean value at a 95% confidence level:
where CI denotes the confidence interval, represents the sample arithmetic mean of repeated measurements, is the two-tailed critical value of Student’s t-distribution, where is the significance level and corresponds to the degree of freedom, and is the standard error of the mean (SEM), which quantifies the sampling uncertainty associated with the sample mean.
Taking the 100% valve opening condition in Table 3 as an example, the triplicate measured values of the thrust vector angle are 12.26, 12.60 and 11.57. The confidence level is 95%, corresponding to a significance level of . For a 95% confidence level with a degree of freedom , according to the Student’s t-distribution quantile table, the two-tailed critical value for two degrees of freedom at the 95% confidence level is . The sample arithmetic mean is calculated as
According to Equation (3), the experimental standard deviation s is calculated to be 0.116.
Typical results are given as follows:
- Valve opening −100%: mean value , 95% confidence interval ;
- Valve opening 0%: mean value 2.31°, 95% confidence interval ;
- Valve opening 100%: mean value 12.14°, 95% confidence interval .
3.2.4. Propagation and Synthesis of Uncertainty
The thrust vector angle is indirectly derived from the axial thrust and normal force measured by the balance, following . According to the law of propagation of uncertainty, the combined standard uncertainty of the vector angle is synthesized from the standard uncertainties of input quantities:
where the sensitivity coefficients are:
The uncertainty components are divided into two categories:
- Type A standard uncertainty: obtained from statistical analysis of repeated measurements,
- Type B standard uncertainty: mainly originates from the measurement accuracy of the ATI balance, the alignment error of nozzle installation, the pressure fluctuation in secondary flow suction, and jet velocity instability, which are estimated according to instrument specifications and engineering experience.
After synthesizing independent Type A and Type B components, the expanded uncertainty is obtained as with a coverage factor (corresponding to a confidence level of approximately 95%).
3.2.5. Error Source Analysis
The dispersion and error of experimental data mainly arise from dynamic balance fluctuations in the turbofan air source, pressure pulsation during secondary flow suction, connection noise in the sensors and the data acquisition system, installation clearance and alignment deviation of the nozzle, and ambient airflow disturbance in the test section. The overall error level is within the acceptable range for low-speed proof-of-concept experiments.
The secondary flow ratio is calculated on the basis of several assumptions, which introduce additional Type B uncertainties into the derived results. These assumptions include the adoption of a constant empirical discharge coefficient for the flow passage, the one-dimensional uniform flow approximation across the secondary flow channel, the steady-state flow hypothesis that neglects jet pulsation and pressure fluctuation, the assumption of complete momentum exchange between the primary jet and the entrained secondary flow, and the omission of minor leakage losses and distributed frictional resistance along the flow path. Among these factors, the fixed empirical discharge coefficient contributes the largest uncertainty component, typically on the order of to , while flow non-uniformity and unsteady flow effects account for approximately to and , respectively, under the low-subsonic operating conditions () of the present study. Propagated through the subsequent calculation chain, these model-induced uncertainties exert a limited influence on the final results of thrust vector angle and thrust loss, and the overall deviation remains within an acceptable range that does not undermine the core conclusions of this work.
3.3. Deflection Observed by the Oil Flow Experiment
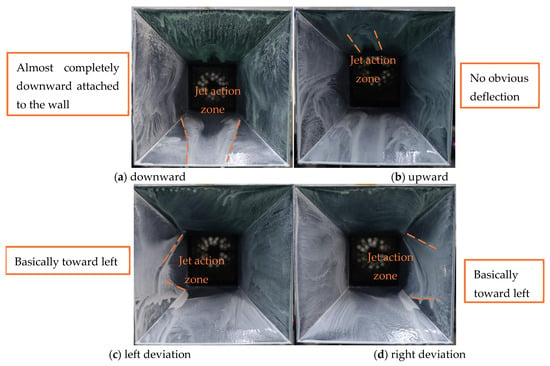
To verify the wall attachment of the jet, oil flow experiments were carried out, as shown in Figure 8. The fluid adjacent to the wall drives the wall-attached oil film to move via viscous shear force. The final traces retained by the oil film (friction lines/oil flow streaks) directly reflect the direction and relative magnitude of the wall shear stress.
Figure 8.
Oil experiment for the attachment effect.
When the jet attaches to the wall, the surrounding oil flow tracer particles migrate along the jet exit direction, and vortices are induced by three-dimensional effects. The surrounding oil film leaves distinct traces corresponding to the pressure distribution of the flow field. In this state, the oil flow streaks are continuous and smooth, extending overall along the tangential direction of the wall profile and aligning with the main flow direction. The oil film maintains a uniform thickness without obvious local accumulation or breakage, and the streaks feature favorable parallelism free from large-scale divergence or disorder. When the jet inertia is excessively high, the wall curvature undergoes an abrupt change, or the adverse pressure gradient exceeds the critical value, the jet detaches from the wall, and wall attachment breaks down. The oil flow streaks diverge and fracture abruptly, giving rise to an approximately flow-perpendicular “zero-shear line”. Downstream of the separation point, the oil film thickens and accumulates markedly, with chaotic and irregular streaks; even reverse oil flow traces opposite the main flow direction may emerge, which arise from the reverse shear action of the recirculating flow.
The oil flow images show that the friction line is clearly visible when the jet is deflected downward, and the jet basically remains attached to the wall, with a friction line length of approximately 103 mm. When the jet is deflected upward, almost no friction line appears, so it can be considered that the deflection does not produce wall attachment. When the jet is deflected to the left or right, the friction line is clear over the front half of the wall, with a length of approximately 50 mm, indicating that the wall attachment is maintained over the front section but not over the rear end.
3.4. Deflection Results of Three Jet Velocities for the Oblique Wall Design
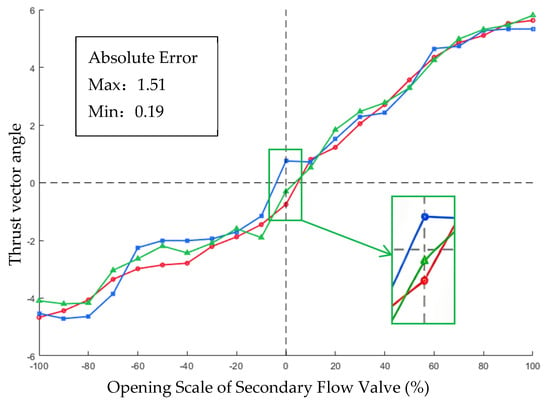
Nozzles C and D adopt an obliquely cut wall design. Although the two types of oblique walls adopt different bevel angles, their thrust vector angles show no obvious deflection at the three different jet outlet velocities in either the up–down or left–right direction. Taking Nozzle D with an outlet of 80 m/s as an example in Figure 9 (), its angle deflects between −4° and 6° in the up–down direction, and it can be considered that there is no wall attachment effect.
Figure 9.
Vector angle deflection in the left–right direction for the 16° oblique wall surface.
For the curved wall, the continuous curvature along the flow path progressively steers the jet towards the wall via the Coanda effect, enabling a larger deflection angle. Nevertheless, the continuous curvature causes gradual accumulation of the adverse pressure gradient along the wall, which readily reaches the critical threshold for flow separation. The jet is thus prone to detachment under operating fluctuations or inflow disturbances, resulting in degraded wall attachment stability. For the inclined wall, the straight tilted profile introduces no curvature variation along the flow direction, and the adverse pressure gradient remains mild and smoothly distributed. Flow separation is much less likely to be triggered, endowing the jet with better attachment stability. However, the straight wall provides limited steering effects on the jet. It can only achieve limited deflection by virtue of the initial wall attachment effect, without continuous deflection enhancement from wall curvature, leading to relatively inferior deflection performance.
3.5. Vector Angle Measurement Experiment
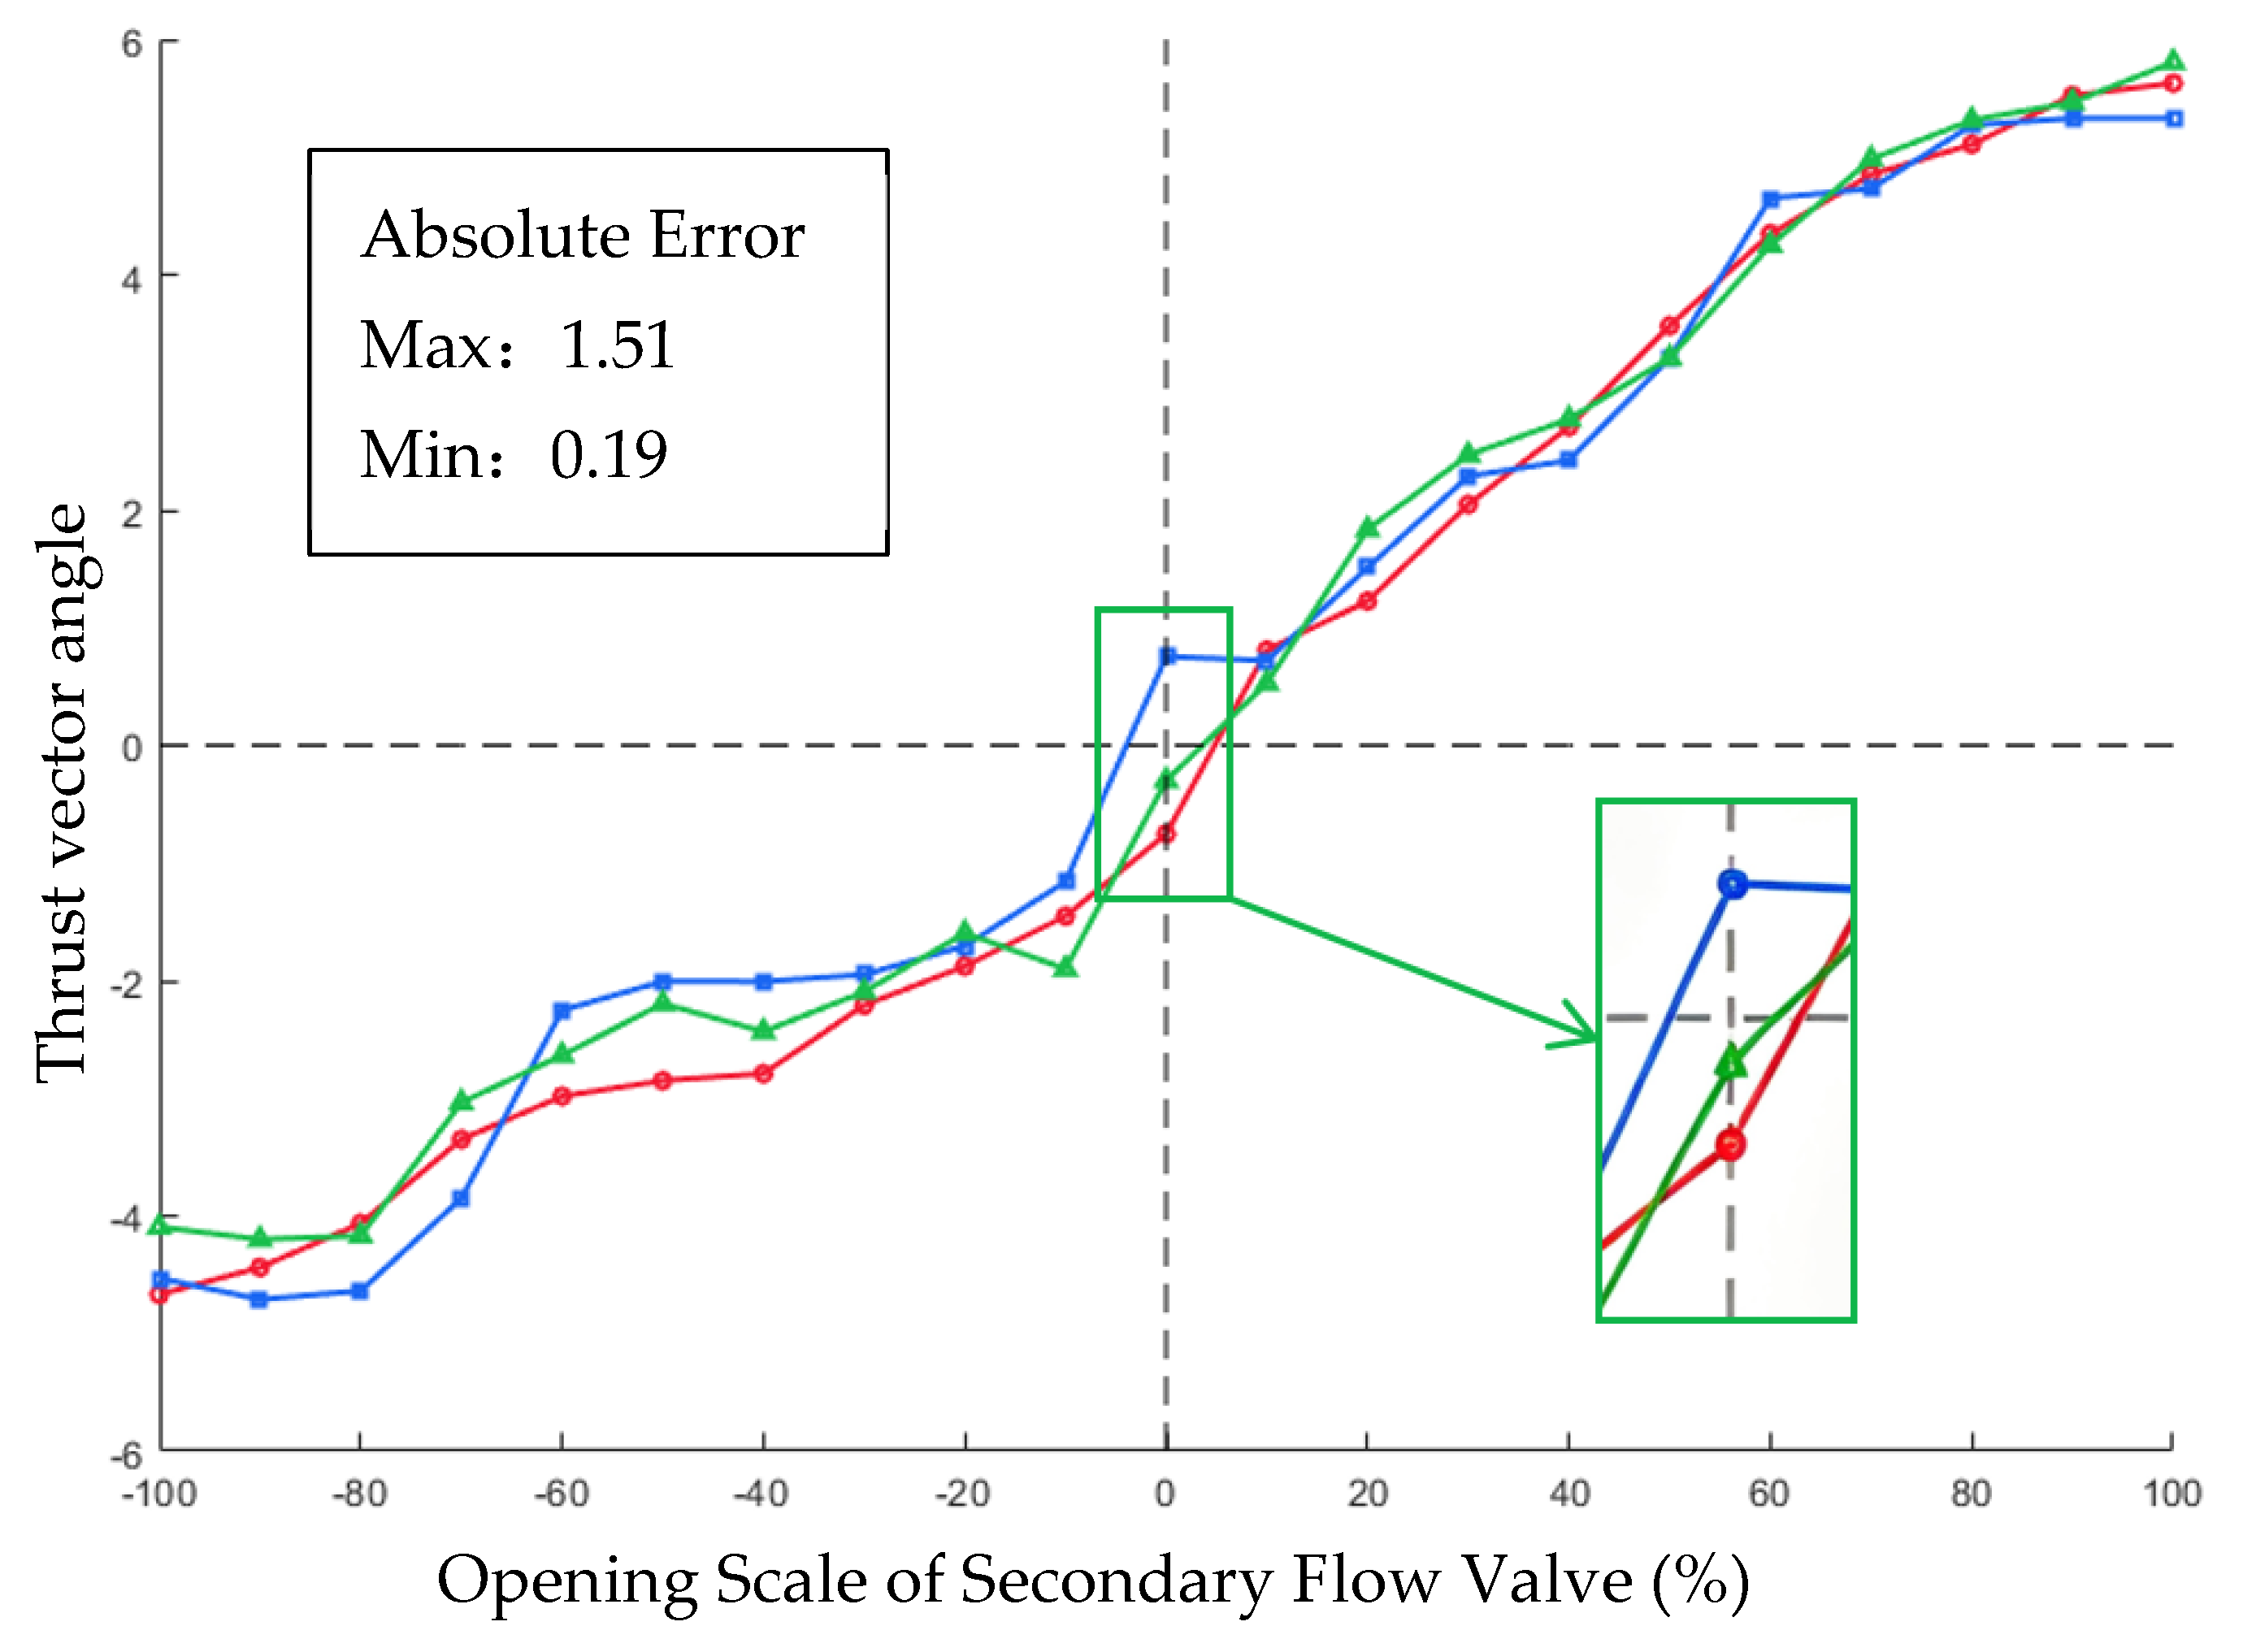
By combining the characteristic that the curved wall facilitates jet attachment with the stability of the obliquely cut wall, a composite design with a curved front wall and the obliquely cut middle and rear sections is proposed, as shown in Figure 10; the results are shown in Figure 11. Deflection experiments in the pitch and yaw directions of this type of nozzle were conducted under identical test conditions (v = 80 m/s, Mach number = 0.24, altitude of 0 km (sea level), and atmospheric temperature of 25 °C; the characteristic length was taken as the nozzle exit length of 125 mm, and the dynamic viscosity coefficient Pas, ).
Figure 10.
Final design of the fluidic vectoring nozzle.
Figure 11.
Vector angle deflection.
Considering freestream drag, as well as the weight increment and assembly issues introduced by the vectoring nozzle, constraints are imposed on the overall design parameters of the nozzle:
- The overall axial length of the nozzle is controlled within 200 mm;
- The nozzle outlet is designed as a square, with its side length limited to no more than 180 mm.
For the final design model, the connection curvature is set to 0.0049 with a radius of curvature of 205 mm. The key dimensional parameters are listed below:
- Nozzle outer profile dimension: 180 mm × 180 mm.
- Square main outlet size: 125 mm × 125 mm.
- Primary jet inlet radius: 35 mm.
- The valve has a length of 60 mm and a width of 16 mm.
- Primary jet outlet size: 72 mm × 72 mm.
- The secondary flow channel adopts a slotted configuration.
The front part of the nozzle is curved, with a radius of curvature R of about 205 mm, and the middle and rear parts are designed with an oblique cutting angle of 16°. When the jet outlet velocity is 80 m/s, the deflection angles of the up–down valves range from −12° to 13°, and the linear similarity is 87.1%. The deflection angles of the left–right valves range from −10° to 11°, and the linear similarity is 89.8%. The formula adopted to calculate the linear similarity is given as follows:
where represents the linear similarity coefficient that characterizes the linear consistency between two datasets, expressed as a percentage. n is the total number of matched data points involved in the comparison. denotes the reference value at the i-th data point, which acts as the benchmark for deviation calculation, while refers to the corresponding compared value at the i-th data point. is the absolute deviation between the reference and compared values for each data point, and is the absolute value of the reference value, which is used to normalize the absolute deviation and eliminate the influence of data magnitude on the evaluation results.
Specifically, the relative deviation is calculated for each experimental data point, followed by arithmetic averaging.
The pure curved wall design features poor regularity in deflection angles and a large single-direction deflection range, and the oil flow experiments verify that its wall attachment effects in multiple directions all deviate from expectations. The pure inclined wall design can hardly achieve effective wall attachment. In contrast, when the nozzle adopts the curved–inclined composite wall design, its deflection angle data conform to expectations with strong regularity. The maximum deflection angle reaches 13.6°, which essentially satisfies the design target of 16°, and effective wall attachment can be verified. Therefore, it is concluded that this nozzle configuration delivers the optimal performance.
Comparison with a Similar Type of Nozzle
Based on the published literature [7], comparisons with similar aerodynamic vectoring nozzles are conducted in terms of four indicators: maximum vectoring angle, linearity, response time and thrust loss. Taking the two-dimensional wedge-shaped fluidic vectoring nozzle with an aspect ratio of 5:1 as the comparison object, the performance data are listed as Table 4:
Table 4.
Comparison with 2D aerodynamic nozzle.
Thrust loss is also measured using the ATI six-component force balance by comparing the thrust output of the power plant under non-deflected conditions before and after the nozzle is mounted. The nozzle thrust at three distinct jet velocities is recorded, and the maximum thrust loss value is adopted as the final result. For the dynamic response measurement, the turbofan is started first. After the jet flow stabilizes, a step command is applied to the valve to fully open it in a single direction at high speed. The deflection angle and response time are recorded throughout the process. The deflection is deemed complete once the jet stabilizes at the maximum deflection angle, and the influence of the valve opening speed is neglected in the measurement.
It can be concluded from the table above that the overall performance of the four-way axisymmetric fluidic vectoring nozzle is slightly inferior to that of the two-dimensional wedge-shaped fluidic vectoring nozzle. The aspect ratio of this axisymmetric nozzle is 1:1, which generates intense horn vortex interference at the nozzle outlet and forms concentrated vortex cores. This phenomenon deteriorates the nozzle performance to a certain extent.
4. Discussion
Passive fluidic thrust vectoring technology draws secondary flow externally via negative pressure. The secondary flow deflects the primary jet, and the Coanda effect then attaches the jet to the wall surface to achieve flow deflection; the proposed wall design enables the jet to attach to the wall more readily at the initial section. In the nozzle with the curved wall design, the slope of the front of the wall is small, and it gradually increases with the position. For the fixed nozzle design, the greater the jet velocity, the greater the inertia force and Reynolds number; the lower the jet velocity, the smaller the Reynolds number and the more pronounced the effect of fluid viscosity. In this type of wall design, the maximum thrust vector angle is generally large, but it does not reach the design maximum vector angle, and the deviation between the up–down and left–right directions is large. The maximum angle changes irregularly as the jet speed changes, and the deflection performance at lower jet velocities does not meet actual engineering requirements. The oil flow experiment shows that the effect of jet attachment to the wall is unstable in the design of curved wall design nozzles.
For the two oblique wall design nozzles with different bevel angles, the vector deflection effect is poor under low-speed conditions, and the jet is difficult to deflect at the front section. Here, the deflection result of the nozzle with the 16° oblique plane design at an outlet jet speed of 80 m/s is taken as an example, showing that the airflow exhibits basically no effective deflection and the wall attachment effect does not come into play. Based on this experiment, it is concluded that when the jet velocity is not sufficiently high, the single fixed-angle inclined plane design plays a poor role in jet deflection.
The finally designed aerodynamic vectoring nozzle not only alleviates the problem that the jet at the front of the nozzle is difficult to deflect but also avoids the deflection instability caused by the purely curved wall design, and its overall performance is good. Due to the thrust line installation error of the power plant, there are some deviations in the deflection angles of the axisymmetric nozzle in the up–down and left–right directions, but the overall performance meets the design expectations.
The weakening effect of an increasing Reynolds number on the Coanda wall attachment is dominated by two mechanisms. On the one hand, momentum mixing in the free shear layer is enhanced. With an increase in the Reynolds number, the turbulence intensity of the jet free shear layer rises, and the momentum exchange and mass entrainment rate between the jet and ambient fluid accelerate. This leads to intensified velocity decay in the jet core along the flow path and reduces the effective momentum driving the jet to attach to the wall, which macroscopically manifests as a shortened attachment length and a decreased maximum deflection angle. On the other hand, the separation tendency of the wall boundary layer is aggravated. Within the low-speed subsonic range of this experiment, viscous stress still has a non-negligible influence. An increase in the Reynolds number raises the proportion of inertial force, but the ability of the boundary layer fluid to overcome the adverse pressure gradient is not enhanced synchronously. Moreover, the strong mixing of the shear layer elevates the peak value of the adverse pressure gradient on the wall, making the boundary layer more likely to reach the critical separation condition. Consequently, the wall attachment stability decreases with increasing flow velocity. The experimentally observed phenomenon that the deflection angle slightly decreases and the wall attachment stability margin reduces under high-speed conditions is consistent with the above mechanism analysis.
The force vector angle measurement experimental scheme for aerodynamic vectoring nozzles based on a micro turbofan proposed in this paper features core advantages of significantly lowering the experimental threshold and economic cost in the early development stage of vectoring nozzles, enabling preliminary design verification and rapid iteration of nozzle configurations, and providing an efficient and low-cost technical approach for performance screening of multiple schemes.
Conventional performance verification experiments for fluidic thrust vectoring nozzles are associated with high test rig construction investment, large operational energy consumption and high safety risks, resulting in extremely high cost and time overhead for parallel verification of multiple schemes in the early development stage. In contrast, the proposed scheme adopts a micro turbofan as the jet power source without the need to construct complex systems. The test rig features a simple structure, short construction cycle and low operation and maintenance costs, enabling proof-of-concept verification under multiple configurations and operating conditions with limited funding and remarkably reducing the research and development cost in the pre-research phase.
Meanwhile, this experimental mode can proceed in parallel with nozzle scheme design, forming a closed-loop rapid iteration of “design–fabrication–test”. For different Coanda wall configurations, such as curved walls, beveled walls and curved–bevel composite walls, it enables rapid testing and comparison of core performances, including force vector angle control characteristics, wall attachment stability and multidirectional deflection consistency. Schemes with obvious performance defects can be eliminated at the early design stage, and the optimal configuration direction can be identified so as to avoid subversive problems in the subsequent full-scale development phase and effectively shorten the overall research and development cycle.
Although the experiment is limited by the jet velocity of the micro power unit and falls into the category of low-speed proof-of-concept verification, the core physical mechanisms of jet wall-attached deflection—including the Coanda wall attachment effect, secondary flow ejection characteristics and jet entrainment laws—are essentially consistent with those of industrial high-speed nozzles. The deflection control laws, influence trends of wall configurations and flow mechanism conclusions obtained from the experiment can provide qualitative guidance and an initial parameter basis for the engineering design of subsequent full-scale, high-Mach-number nozzles, playing the role of preliminarily verifying design ideas and mitigating R&D risks in advance. In addition, the micro power test rig is flexible in construction and can be conveniently equipped with various test methods such as force balance and oil flow visualization so as to simultaneously acquire force characteristic data and flow field wall attachment patterns, meeting multi-dimensional pre-research verification requirements.
At present, there are few literature studies on four-way axisymmetric aerodynamic vector nozzles, and most existing research focuses on the performance of two-dimensional vector nozzles. In addition, deflection experiments of aerodynamic vector nozzles are associated with high costs, long test cycles and high safety risks. The pre-design experiments of the nozzle conducted in this paper with a movable power unit follow the identical principle of inducing jet wall-attached deflection. The jet velocity is normalized by the ratio of the induced secondary flow rate to the exit jet flow rate, and the results demonstrate that the influence on deflection remains consistent at relatively low jet velocities. The research findings of this paper can provide a reference for the design and application of practical engineering nozzles.
The maximum jet velocity of 80 m/s in this experiment corresponds to a Mach number of approximately 0.24, which falls into the typical regime of incompressible subsonic flow where fluid density variation is negligible. The Coanda wall attachment and jet deflection are dominated by momentum entrainment within the shear layer. When extrapolating the results to high-Mach operating conditions, gas compressibility effects become prominent. The interactions among expansion waves, shock waves and the boundary layer inside the nozzle will fundamentally alter the wall shear layer structure and adverse pressure gradient distribution, resulting in essential differences in the triggering mechanism of flow separation compared with low-Mach conditions. The experiments are conducted under low pressure ratio conditions, and the inlet-to-outlet pressure ratio of the nozzle is far lower than the operating pressure ratio of high-Mach nozzles. The core driving force of Coanda attachment is the pressure difference between the wall and the jet. Under high pressure ratio conditions, both the static pressure distribution at the nozzle exit and the streamwise pressure gradient along the wall differ significantly from those under low pressure ratio conditions. Meanwhile, the entrainment capacity of the secondary flow is directly determined by the inlet-to-outlet pressure ratio. Merely matching the flow rate ratio cannot guarantee similarity of the wall pressure distribution and entrainment driving force. The essence of fluidic thrust vector deflection is momentum exchange, and the deflection magnitude ultimately depends on the momentum ratio of the secondary flow to the primary flow, rather than the mere flow rate ratio. Under low-Mach conditions, the fluid density remains approximately constant, so the flow rate ratio and momentum ratio exhibit an approximately linear correspondence. However, under high-Mach conditions, there are remarkable differences in both density and velocity between the primary and secondary flows, and the same flow rate ratio may correspond to a considerably deviated momentum ratio.
For future work, industrial-grade aviation turbojet engines can be adopted to carry out high-speed jet deflection experiments by equipping them with vector nozzles for further investigation. Under high-speed jet conditions, an increase in the Reynolds number raises the ratio of fluid inertial force to viscous force, which may weaken the wall attachment effect of the jet. The overall deflection performance under such conditions requires further follow-up research, and a moderately optimistic expectation can be held based on previous experimental experience.
This paper applies four different Coanda wall designs under low-speed jet conditions to a four-way axisymmetric aerodynamic vectoring nozzle and measures the force vector angle of the assembled deflection mechanism using an ATI force balance measurement system. Finally, integrating the deflection performance, wall attachment characteristics and the advantages of the four research configurations, a novel wall design is proposed to achieve rapid and low-cost pre-design of the nozzle, which verifies the feasibility of this technical route to a certain extent. Nevertheless, further verification and research on jet flow field characteristics and control laws under high-thrust, high-speed jet power units are still required.
5. Conclusions
Combining thrust vector angle measurement experiments and oil flow visualization tests under a jet velocity of approximately 80 m/s, this study finalizes a curved–inclined hybrid wall structure featuring a smooth curved front section and a beveled rear–middle section for a four-directional axisymmetric aerodynamic vectoring nozzle, which exhibits favorable linearity and excellent vector deflection performance. Quantitative experimental results demonstrate that the optimized nozzle achieves a maximum deflection angle of 13.6°, a control linearity of 87.1% for pitch motion and 89.8% for yaw motion, a thrust loss of only 4%, and a response rate higher than 200°/s. This work proposes a rapid, low-cost experimental method based on low-speed jet tests for the preliminary validation of the nozzle conceptual design, and the experimental results align well with design expectations and justify further verification work. Moreover, analytical derivation demonstrates the similarity of secondary flow induction characteristics between low-speed and high-speed jet conditions, which experimentally validates the deflection performance of the aerodynamic vectoring nozzle to a certain degree and provides a valuable reference for subsequent industrial-scale experimental verification. Nevertheless, given that high-speed jets induce complex three-dimensional flow effects that are absent in low-speed test conditions, systematic experimental validation under realistic engineering conditions remains indispensable for fully evaluating the nozzle’s practical performance.
Author Contributions
Conceptualization, D.S., Y.G. and Y.B.; methodology, D.S. and Y.B.; software, D.S., G.F. and W.S.; validation, G.F. and W.S.; writing—original draft preparation, D.S.; writing—review and editing, D.S. and Y.B. All authors have read and agreed to the published version of the manuscript.
Funding
This research received no external funding.
Data Availability Statement
The datasets used and analyzed during the current study are available from the author upon reasonable request.
Conflicts of Interest
The authors declare no conflicts of interest.
Appendix A
References
- Wang, H.F. Key Technologies and Future Applications of Thrust Vectoring on Fighter Aircraft. Acta Aeronaut. Et. Astronaut. Sin. 2020, 41, 20–43. [Google Scholar]
- Xu, J.L.; Huang, S.; Pan, R.F. Research on Fluidic Thrust Vectoring Nozzle: Recent Developments and Future Trends. Acta Aeronaut. Astronaut. Sin. 2025, 27, 87–92. (In Chinese) [Google Scholar]
- Yang, Z.H.; Gu, Y.S.; Zhou, Y.H.; Zhang, Y.; Fan, Y.H. Research on the control characteristics of multi-axis supersonic fluidic thrust vectoring nozzle based on the passive secondary flow. J. Exp. Fluid Mech. 2026, 40, 39–46. [Google Scholar] [CrossRef]
- Yadav, A.; R, V.; Perumal, A.K. Parametric Study on the thrust of a supersonic jet vectoring manipulated by fluidic injection. In Proceedings of the AIAA Aviation 2023 Forum, San Diego, CA, USA, 12–16 June 2023. [Google Scholar]
- Warsop, C.; Crowther, W.J. Fluidic Flow Control Effectors for Flight Control. AIAA J. 2018, 56, 3808–3824. [Google Scholar] [CrossRef] [Scilit]
- Fielding, J.P.; Lawson, C.P.; Pires, R.; Monterzino, G. Development of the Demon Technology Demonstrator UAV. In Proceedings of the 27th International Congress of the Aeronautical Sciences, Nice, France, 19–24 September 2010. [Google Scholar]
- Zhou, Y.H. Research on Multi-axis Passive Fluid Thrust Vector. Master of Engineering, Nanjing University of Aeronautics and Astronautics, Nanjing, China, 2021. [Google Scholar]
- Singh, A. Experimental investigation of pulsed fluidic thrust vectoring in a Mach 1.6 axisymmetric jet using transverse air injection for enhanced vectoring efficiency. Aerosp. Sci. Technol. 2026, 173, 111860. [Google Scholar] [CrossRef] [Scilit]
- Wu, K.; Kim, T.H.; Kim, H.D. Performance Assessment of the Dual-Throat Nozzle Thrust Vector Control in a 3D Rectangular Nozzle. J. Korean Soc. Propuls. Eng. 2020, 24, 12–24. [Google Scholar] [CrossRef] [Scilit]
- Xiao, Z.Y.; Gu, Y.S.; Jiang, X.; Chen, Z.B. A New Fluidic Thrust Vectoring Technique Based on Ejecting Mixing Effects. Acta Aeronaut. Astronaut. Sin. 2012, 33, 1967–1974. (In Chinese) [Google Scholar]
- Shi, N.X.; Gu, Y.S.; Xu, T.H.; Liu, G.T.; Zhang, C.; Zhou, Y.H.; Guo, J.L. Vectoring Control of Bilateral Parallel Offset Jet: Flow Characteristics and Control Mechanism. Aerospace 2026, 13, 443. [Google Scholar] [CrossRef] [Scilit]
- Huang, Z.; Gu, Y.S.; Li, L.K.; Wu, Z.M.; Zhou, Y.H.; Deng, S. Trailing-Edge Beveling Effect on Passive Fluidic Thrust Vectoring Nozzle Jet Deflection Control. Aerospace 2025, 12, 1091. [Google Scholar] [CrossRef] [Scilit]
- Zhang, Y.; Xu, J.; Pan, R.; Li, Y.; Ma, Z.; Huang, S. Numerical Investigation of Short Takeoff and Landing Exhaust System Using Bypass Dual Throat Nozzle. Aerosp. Sci. Technol. 2023, 138, 108316. [Google Scholar] [CrossRef] [Scilit]
- Wu, K.; Kim, H.D.; Jin, Y. Fluidic Thrust Vector Control Based on Counter-Flow Concept. Proc. Inst. Mech. Eng. Part G. J. Aerosp. Eng. 2018, 233, 1412–1422. [Google Scholar] [CrossRef] [Scilit]
- Mason, M.; Crowther, W. Fluidic Thrust Vectoring for Low Observable Air Vehicles. In Proceedings of the AIAA Flow Control Conference, Portland, OR, USA, 28 June–1 July 2004. [Google Scholar]
- Tanveer, A.; Ahmad, S.M. Mathematical Modelling and Fluidic Thrust Vectoring Control of a Delta Wing UAV. Aerospace 2023, 10, 563. [Google Scholar] [CrossRef] [Scilit]
- Tanveer, A.; Ahmad, S.M. Exploration of Fluidic Thrust Vectoring Control on a Dynamic Test Rig: Computational and Experimental Analysis. Eng. Proc. 2023, 56, 90. [Google Scholar] [CrossRef] [Scilit]
- Liu, Y.; Pan, C.; Guo, H.; Liu, J.H. Experiment Study on Flow Structure of Transition Boundary Layer of The Underwater Vehicles. J. Exp. Fluid Mech. 2024, 38, 14–22. [Google Scholar]
- Fu, J.; Wang, C.; Liu, C.; Xu, B.C. Application and Demand Analysis of Fluidic Thrust Vectoring. J. Aerosp. Power 2023, 2, 63–66. (In Chinese) [Google Scholar]

Disclaimer/Publisher’s Note: The statements, opinions and data contained in all publications are solely those of the individual author(s) and contributor(s) and not of MDPI and/or the editor(s). MDPI and/or the editor(s) disclaim responsibility for any injury to people or property resulting from any ideas, methods, instructions or products referred to in the content. |
© 2026 by the authors. Licensee MDPI, Basel, Switzerland. This article is an open access article distributed under the terms and conditions of the Creative Commons Attribution (CC BY) license.