Abstract
The hydrological processes of agricultural fields during the fallow season in east-central Mississippi remain poorly understood, due to the region’s unique rainfall patterns. This study utilized long-term rainfall records from 1924 to 2023 to evaluate runoff characteristics and the runoff response to various rainfall events during fallow seasons in Mississippi by applying the DRAINMOD model. The analysis revealed that the average rainfall during the fallow season was 760 mm over the past 100 years, accounting for 65% of the annual total. In dry, normal, and wet fallow seasons, the average rainfall was 528, 751, and 1010 mm, respectively, corresponding to runoff of 227, 388, and 602 mm. Runoff frequency increased with wetter weather conditions, rising from 16 events in dry seasons to 23 in normal seasons and 30 in wet seasons. Over the past century, runoff dynamics were predominantly regulated by high-intensity rainfall events during the fallow season. Very heavy rainfall events (mean frequency = 11 events) generated 215 mm of runoff and accounted for 53% of the total runoff, while extreme rainfall events (mean frequency = 2 events) contributed 135 mm of runoff, making up 34% of the total runoff. Water table depth played a critical role in shaping spring runoff dynamics. As the water table decreased from 46 mm in March to 80 mm in May, the soil pore space increased from 5 mm in March to 14 mm in May. This increased soil infiltration and water storage capacity, leading to a steady decline in runoff. The study found that the mean daily runoff frequency dropped from 13.5% in March to 7.6% in May, while monthly runoff decreased from 74 to 38 mm. Increased extreme rainfall (R95p) in April contributed over 45% of the total runoff and resulted in the highest daily mean runoff of 20 mm, compared to 18 mm in March and 16 mm in May. The results from this century-long historical weather data could be used to enhance field-scale water resource management, predict potential runoff risks, and optimize planting windows in the humid east-central Mississippi.
1. Introduction
Nutrient loss and soil erosion caused by surface runoff have become key issues limiting agricultural productivity and degrading environmental quality in agricultural systems [1,2,3]. In recent years, the southeastern United States has experienced more frequent and intense rainfall events, including extremes [4,5,6], increasing the risk and unpredictability of surface runoff. This risk is particularly pronounced in east-central Mississippi due to two primary factors. Firstly, the predominantly silty and silty clay soils in this region are characterized by low infiltration rates and limited water-holding capacity [7]. Moreover, a warm moisture source from the Gulf of Mexico and mid-latitude weather systems tracking in from the west during late winter and spring generate frequent heavy rainfall events [8,9]. Given the hydrological changes and poor soil hydraulic properties in east-central Mississippi, a comprehensive understanding of the rainfall–runoff relationship and its underlying drivers is essential for optimizing regulation strategies and the sustainable management of water resources.
Several factors have been identified as critical in influencing runoff characteristics. Among them, rainfall intensity and duration are the primary drivers of runoff dynamics since rainfall serves as the main water input in the water balance equation [10,11]. High-intensity or long-duration rainfall events typically lead to larger runoff peaks, shorter response times, and higher total runoff volumes [12,13,14]. While rainfall intensity and duration define event-scale runoff characteristics, interannual rainfall variability governs broader runoff dynamics over decadal timescales. Beyond interannual variability, distinct seasonal cycles in rainfall and evapotranspiration (ET) also play a critical role in shaping runoff generation patterns [15,16]. During the wet season, over 50% of rainfall may contribute to stream flow, due to low evaporative demand and high soil moisture, compared to only about 20% during the summer, when evapotranspiration is high [17,18]. Additionally, rainfall can explain as much as 65–70% of the variation in runoff during the winter and spring, characterized by higher rainfall and relatively lower evapotranspiration in the southeastern US, compared to only 20% during the drier summer period [19].
Another important factor is soil moisture conditions, which directly affect how rainwater is partitioned into infiltration versus surface runoff during a rainfall event [20]. Soil moisture conditions are shaped by a range of interacting factors, including rainfall dynamics, ET, soil properties, water table levels, vegetation cover, and climate variability [21,22]. Soil characteristics largely control water retention capacity, while the balance between rainfall and ET determines the amount of water available for runoff generation. Intense rainfall events can rapidly saturate the soil, significantly increasing the risk of runoff. In addition, the temporal variability of water-table levels across diverse topographies can alter regional climate patterns and regulate the surface hydrological cycle [23,24]. Due to the intricate interactions among these factors, accurately characterizing runoff dynamics and rainfall–runoff relationships remains a considerable challenge.
To date, most of the existing studies in Mississippi have primarily focused on nutrient loss and water quality impacts driven by surface runoff [25,26,27,28], while limited attention has been given to rainfall–runoff relationships and the key factors influencing runoff characteristics. This study aims to: (1) characterize rainfall and runoff dynamics during the fallow seasons from 1924 to 2023; and (2) evaluate runoff responses to different rainfall categories, based on DRAINMOD simulations in east-central Mississippi.
2. Materials and Methods
2.1. Study Site
The simulation study was conducted in Noxubee County (33.263° N, 88.536° W), which contained approximately 22,900 ha of cropland in 2014, accounting for 12.3% of the county’s total area [7]. Noxubee County is located in the Black Belt Prairie of east-central Mississippi, a major agricultural region within the East Gulf Coastal Plain (Figure 1). The region has a humid climate, with a 50-year (1974–2023) mean annual rainfall of around 1350 mm. The mean daily temperature is around 18 °C, ranging from 7 °C in January to 27 °C in July. According to the NRCS-SSURGO database (Soil Survey Geographic Database, https://websoilsurvey.nrcs.usda.gov/app/WebSoilSurvey.aspx, accessed on 10 May 2025), over 50% of the soils in Noxubee County are silty clay and silty clay loam, including Vaiden, Leeper, Brooksville, and Kipling, with Vaiden alone constituting 40% [29]. Therefore, Vaiden soil was selected for the simulation study.
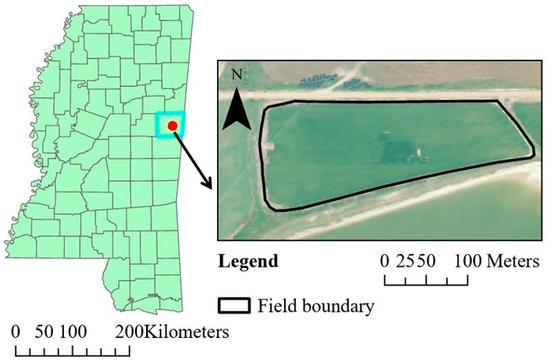
Figure 1.
Location of the study area in Noxubee County, Mississippi.
2.2. DRAINMOD Description and Input Parameters
DRAINMOD is a field-scale, process-based, one-dimensional model designed to simulate the hydrological process in a poorly drained and artificially drained field [30]. It calculates water balance at the soil surface and profile, running on either hourly or daily time increments.
The water balance at the field surface can be expressed as follows:
where R is rainfall (cm), I is the cumulative infiltration (cm), RO is surface runoff (cm), and ΔSS is the change in water accumulated at the soil surface (cm).
R = I + RO + ΔSS
The water balance in the soil profile can be expressed as follows:
where ΔWS is the change in the soil water storage of the profile (cm), ET is evapotranspiration (cm), and S is seepage (cm). Vertical seepage was not considered in this study, due to the presence of a restrictive soil layer below 200 cm, as reported in the NRCS-SSURGO database.
ΔWS = ET + S − I
The Green and Ampt equation is used to calculate infiltration [31]:
where IR is the infiltration rate (cm h−1), Ks is the soil’s saturated hydraulic conductivity of the transmission zone (cm h−1), Md is the difference between the soil’s saturated and initial moisture (cm3 cm−3), and Hf is the effective soil suction at the wetting front (cm).
IR = Ks + KsMdHf/I
Daily potential evapotranspiration (PET) is calculated in DRAINMOD using the temperature-based Thornthwaite method, which requires daily maximum and minimum temperatures as inputs. To improve its accuracy, monthly correction factors are applied to adjust the original estimates. These correction factors are determined by calculating the ratio of Penman–Monteith’s PET, based on five years of meteorological data from the same site, to Thornthwaite’s PET for each month [30].
During a rainfall event, rainwater first infiltrates into the soil profile. Once the soil profile becomes fully saturated, excess water begins to accumulate on the surface. Runoff is generated only when the amount of accumulated water exceeds the maximum depression storage (Sm). In this study, a value of 1 cm is adopted for the maximum depression storage, as this is commonly used in most agricultural fields [32,33,34].
The input parameters for DRAINMOD include meteorological data, soil properties, and field management practices. Historical daily rainfall and temperature records (1924–2023) were obtained from the online databases (https://www.ncdc.noaa.gov/cdo-web/, accessed on 10 May 2025) observed at a weather station (33.25° N, 88.53° W) in Brooksville by Mississippi State University. Undisturbed soil samples (rings, 1 cm and 6 cm in height, and 6 cm in diameter) were collected at depths of 0–15, 15–30, 30–60, and 60–100 cm to measure field capacity, wilting point, saturated hydraulic conductivity, and bulk density. Based on the observed soil moisture data from the same field, Zhang et al. [7] further calibrated these soil parameters. In this study, the soil properties required by DRAINMOD were either measured values (Table 1) or previously calibrated values at the same site. Given that rainfall input was based on the observed data, infiltration and evapotranspiration were accurately estimated using physically based models or previously calibrated methods, and seepage was assumed to be negligible, the measured soil parameters enabled an accurate estimation of soil water storage. Therefore, the runoff calculated by the water balance equation in DRAINMOD is considered reliable.

Table 1.
Soil properties of Vaiden in Noxubee County, shown as the input parameters required by the DRAINMOD model.
2.3. Rainfall Indices
To quantify the intensity and frequency of rainfall events during the fallow season from November to April, this study adopted a set of indices that are recommended by the Expert Team on Climate Change Detection and Indices (ETCCDI) [35]. Based on the indices in Table 2, rainfall events were classified into 4 categories for subsequent analysis: light rainfall (1–10 mm/d), heavy rainfall (10–20 mm/d), very heavy rainfall (20–95th percentile mm/d), and extreme rainfall (≥95th percentile mm/d).
Table 2.
Details of the precipitation indices and their descriptions, as defined by the ETCCDI.
2.4. Classifying Wet, Normal, and Dry Years
The classification of long-term meteorological data into wet, normal, and dry years establishes a fundamental framework for drought assessment and water resource management. Previous studies have applied frequency analysis to evaluate soybean production and crop irrigation demand under different weather conditions [29,36,37].
In the present study, the fallow season was categorized into wet, normal, and dry categories based on rainfall amount, to facilitate a comprehensive assessment of runoff response. Fallow-season rainfall data (n = 100) were sorted in descending order, with the highest rainfall year assigned the rank of m = 1 and the lowest, m = 100. The probability of exceeding a rainfall amount (P) for each ranked year (m) was then calculated as: P = m/(n + 1) × 100%. Based on P-values, the fallow seasons were classified into three categories: wet (P ≤ 25%), normal (25% < P < 75%), or dry (P ≥ 75%). This resulted in 25 wet, 25 dry, and 50 normal years over the study period.
3. Results
3.1. Rainfall and Frequency During the Fallow Seasons
Based on the 100-year weather dataset (1924–2023), the mean annual rainfall was 1327 mm, with approximately 65% of annual rainfall occurring during the fallow season, averaging 760 mm, ranging from 279 to 1260 mm as shown in Figure 2a. Monthly rainfall ranged from 104 mm (November) to 138 mm (March), peaking in early spring (Figure 2b).
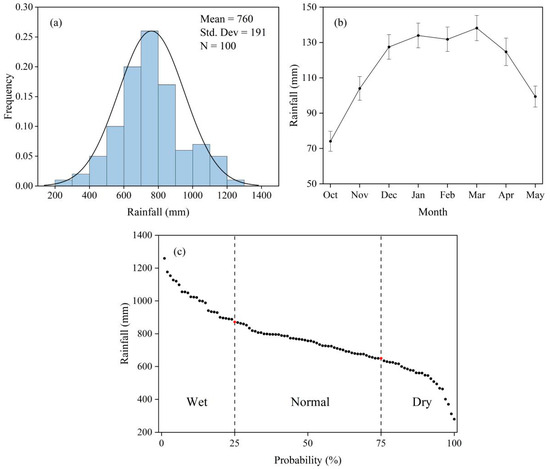
Figure 2.
Rainfall characteristics during the fallow season from 1924 to 2023 in Noxubee County, Mississippi: (a) rainfall frequency (b) monthly rainfall, and (c) probability of rainfall.
According to the probability of fallow-season rainfall (Figure 2c), these 100 years were categorized into three categories: 25 wet years (876–1264 mm, mean = 1010 mm), 50 normal years (636–872 mm, mean = 751 mm), and 25 dry years (286–631 mm, mean = 528 mm).
3.2. Rainfall Characteristics During the Fallow Seasons
The number of wet days (rainfall ≥ 1 mm/d) exhibited pronounced interannual variability: dry years recorded 28–48 wet days (mean = 39), normal years 35–58 days (mean = 46), and wet years 41–66 days (mean = 52). Among these wet days, the frequency of heavy rainfall (R10) accounted for 45% of total wet days during the fallow season, ranging from 15 to 31 days in 90% of the observed years. The mean of R10 was 18, 24, and 29 days in dry, normal, and wet years. Moreover, mean R20 exceeded 8 days in 95% of the observed years and consistently accounted for more than 50% of R10 across all years (Figure 3).
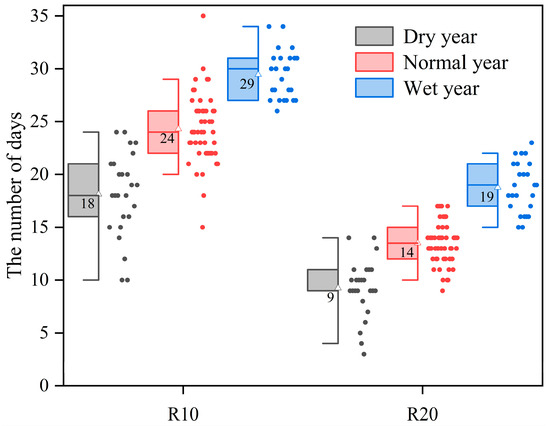
Figure 3.
The number of days when rainfall was ≥ 10 mm/d (R10) and rainfall was ≥ 20 mm/d (R20), sorted by fallow-season rainfall amount from 1924 to 2023 in Noxubee County, Mississippi. Box plots show the 25th, 50th, and 75th percentiles (box lines), with brackets indicating the 5th and 95th percentiles. Triangle symbols and numbers inside the boxes represent mean values.
To better characterize extreme rainfall patterns in the study area, we employed percentile-based thresholds to analyze both the amount of extreme rainfall (R95p) and its contribution to total fallow-season rainfall (R95pToT). During the fallow season, the frequency of extreme rainfall ranged from 1 to 4 events in 80% of the observed years (with 10 years recording no events), averaging nearly 3 events. The extreme rainfall amount (R95p) varied from 51 to 561 mm, with a mean of 183 mm. The mean R95pTOT was 22%, with values in 80% of the years ranging between 7% and 35% (Figure 4).
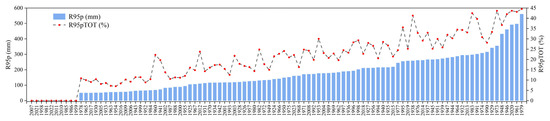
Figure 4.
R95p (total rainfall from extreme rainfall) and its contribution to total fallow-season rainfall (R95pTOT) from 1924 to 2023 in Noxubee County, Mississippi.
However, extreme rainfall characteristics varied across different rainfall years. Dry years experienced fewer extreme rainfall (0–4 events, 6 years without extreme rainfall) and lower R95p (mean = 72 mm), leading to the lowest R95pTOT at 13%. In normal years, the frequency of extreme rainfall ranged from 1 to 5 events (only 4 years without extreme rainfall), and the mean R95p was 152 mm, accounting for 20% of the fallow-season rainfall. In contrast, wet years experienced both higher frequency (2–7 events) and intensity (mean R95p = 284 mm), with extreme rainfall contributing 28% of total rainfall. Similarly, the simple daily rainfall intensity followed this trend, increasing from 14 mm/day in dry years to 20 mm/day in wet years (Figure 5).
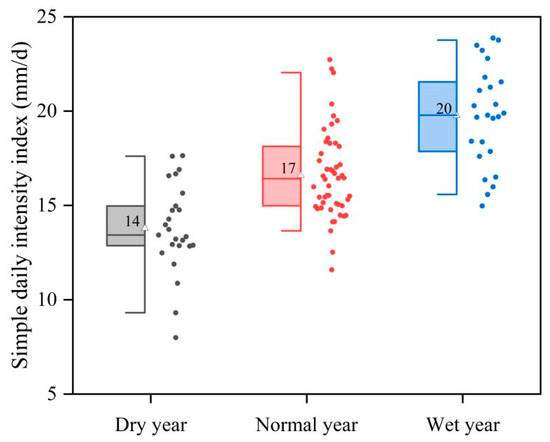
Figure 5.
Box plots of simple daily intensity index values, sorted by fallow-season rainfall amount from 1924 to 2023 in Noxubee County, Mississippi. Box plots show the 25th, 50th, and 75th percentiles (box lines), with brackets indicating the 5th and 95th percentiles. Triangle symbols and numbers inside the boxes represent mean values.
The planting season in Mississippi typically extends from March to May, during which farmers carry out essential field operations such as fertilization, tillage, and sowing. Considering the sensitivity of agricultural activities to rainfall patterns, we further analyzed the monthly rainfall characteristics throughout this critical period.
Very heavy rainfall and extreme rainfall events contributed more than 43% and 17% of the total rainfall, respectively. April exhibited pronounced extreme rainfall characteristics, demonstrated by a higher mean SDII value of 18 mm/day and extreme rainfall contributing up to 29% of the total rainfall (Figure 6b). In contrast, extreme rainfall events occurred less frequently and exhibited lower intensity in May: the median values of R10 and R20 were 3 and 1 days, respectively, one day fewer than those recorded in March and April (Figure 6a). Additionally, the 100-year record also showed a clear difference in extreme rainfall frequency: extreme events occurred in 37 of these years during March and April, but only in 19 years in May.
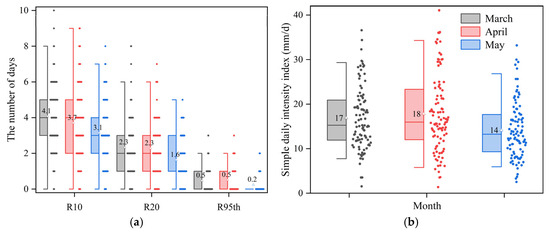
Figure 6.
(a) The number of days when rainfall was ≥10 mm/d (R10), ≥20 mm/d (R20), and ≥95th percentile mm/d (R95th). (b) Simple daily intensity index during the spring months from 1924 to 2023 in Noxubee County, Mississippi. Box plots show the 25th, 50th, and 75th percentiles (box lines), with brackets indicating the 5th and 95th percentiles. The triangle symbols and the numbers inside the boxes represent the mean values.
3.3. Runoff Characteristics in Different Rainfall Category Years During Fallow Seasons from 1924 to 2023
Due to variations in rainfall, the mean runoff increased from 227 mm in dry years to 388 mm in normal years and reached 602 mm in wet years, with 80% of years exhibiting runoff of between 210 and 608 mm. Similarly, the mean runoff frequency showed a consistent rise, climbing from 16 events in dry years to 23 in normal years and peaking at 30 in wet years, with 80% of the observed years falling between 15 and 30 (Figure 7). Furthermore, the mean runoff-to-rainfall ratio increased from 42% in dry years to 52% in normal years and reached 62% in wet years.
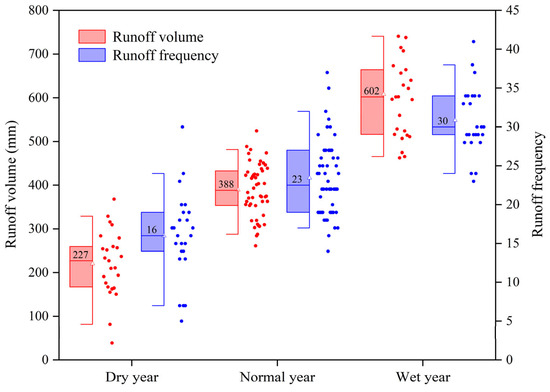
Figure 7.
Frequency and volume of runoff during the fallow season. Box plots show the 25th, 50th, and 75th percentiles (box lines), with brackets indicating the 5th and 95th percentiles. The triangle symbols and numbers inside the boxes represent mean values.
3.4. Runoff Response to Different Rainfall Categories During Fallow Seasons from 1924 to 2023
In Table 3, rainfall events exceeding 10 mm/d accounted for 53% of all events and contributed 87% of the total fallow-season rainfall. Specifically, very heavy rainfall (25% of events) and extreme rainfall (5%) contributed 46% and 22% of the total rainfall, respectively, serving as the primary drivers of runoff generation.
Table 3.
Runoff characteristics in different rainfall categories during the fallow season.
While low-intensity rainfall events (1–10 mm/d) were the most frequent, they contributed minimally (only 3%) to total runoff. In contrast, very heavy and extreme rainfall events generated significantly higher mean runoff volumes of 215 mm and 135 mm, respectively. Collectively, these high-intensity rainfall events accounted for nearly 60% of runoff events and contributed over 85% of the total runoff volume. Moreover, the runoff-to-rainfall ratio increased markedly with rainfall intensity, rising from just 11% for low-intensity rainfall events to 82% under extreme rainfall.
Light rainfall led to fewer than eight runoff events in 92% of fallow seasons, whereas heavy rainfall triggered over five runoff events in 82% of years (Figure 8). Very heavy rainfall was the dominant driver of runoff events (mean frequency = 11), with more than 65% of years recording 7–13 events. Extreme rainfall, however, typically resulted in fewer than 5 events.
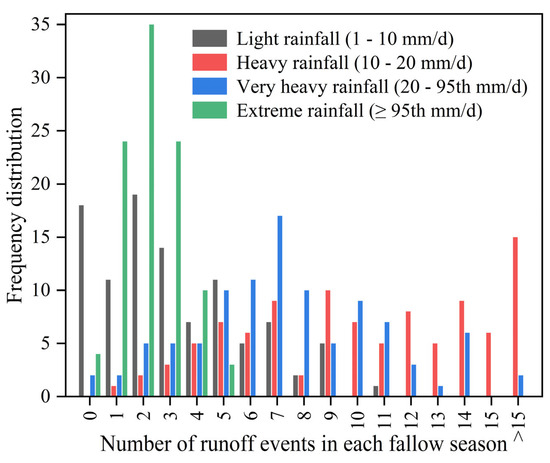
Figure 8.
Frequency distribution of runoff events occurring in different rainfall categories during the fallow season.
3.5. Rainfall-Runoff Dynamics in Spring from 1924 to 2023
Since the optimal planting windows in Mississippi coincide with the typically wet early spring, we aim to analyze spring runoff characteristics to provide guidance for farmers in scheduling agricultural operations.
Monthly runoff volume and frequency (Figure 9a) generally declined throughout the fallow season. March had the highest runoff frequency (mean = 4 events), with only 3 months recording no runoff events in the past 100 years, fewer than April (9 months) and May (15 months). In 85% of the observed Aprils, runoff frequency ranged from 1 to 6 events. In contrast, May showed the lowest runoff frequency and minimal interannual variability, with nearly 60% of months experiencing fewer than 2 runoff events. This declining trend was also reflected in daily runoff frequency, decreasing from its peak (20%) in March to its lowest (3%) in May.
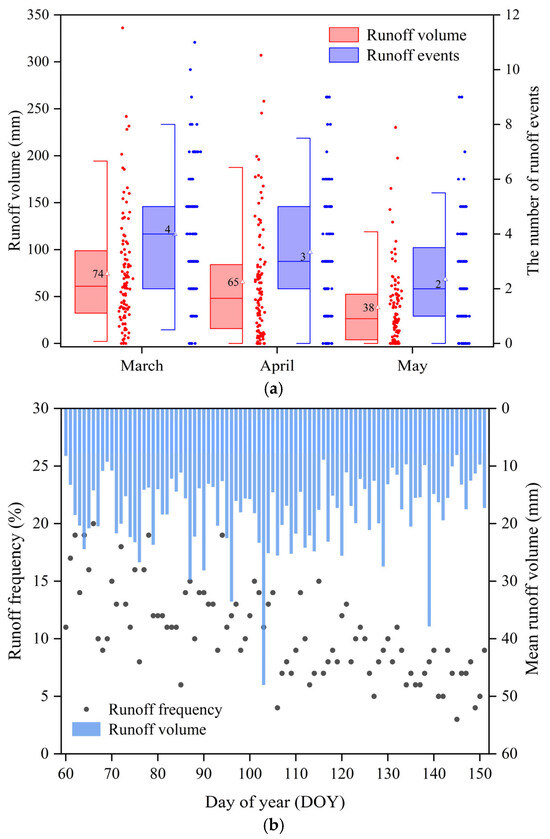
Figure 9.
(a) The monthly frequency and volume of runoff in spring. (b) The frequency of runoff events and mean runoff volume on each day (DOY 60-151). Box plots show the 25th, 50th, and 75th percentiles (box lines), with brackets indicating the 5th and 95th percentiles. The triangle symbols and numbers inside the boxes represent mean values.
The mean runoff volume declined from 74 mm in March to 38 mm in May, with runoff events typically occurring when daily rainfall exceeded 10 mm. Notably, very heavy rainfall and extreme rainfall events contributed 90% of the total spring runoff (Table 4). While March showed more rainfall than April, the higher R95p values in April led to both an increased runoff contribution (45%) and higher mean runoff per event (34 mm). Furthermore, the average runoff volume per event was highest in April (20 mm), exceeding that of March (18 mm) and May (16 mm), due to more frequent extreme rainfall.
Table 4.
Mean runoff volume and the contributions from different rainfall categories in spring.
4. Discussion
4.1. Runoff–Rainfall Relationships
The southeastern United States receives an average annual rainfall of 1200–1500 mm; however, the rainfall pattern exhibits distinct seasonality across the region [38]. During winter, Gulf cyclones transport warm, moist air from the Gulf of Mexico northward along frontal boundaries, while in spring, mid-latitude cyclones from the west generate additional frontal activity [4,39]. Therefore, these atmospheric systems contribute to frequent intense rainfall events and bring approximately 65% of total rainfall during the fallow season from November to April in the study area.
Rainfall amounts are widely recognized as the primary driver of runoff generation [40]. In our simulation, the mean annual runoff was 576 mm, accounting for 43% of the average annual rainfall, which closely aligns with the 510 mm recorded in Louisiana [41], 506 mm in Mississippi [42], and 467 mm in the Piedmont Plateau of South Carolina [43]. Notably, approximately 70% of the runoff occurred during the fallow season within the study area, which was around 53% of the average rainfall (760 mm). Furthermore, our study revealed a strong positive correlation between fallow-season rainfall and runoff (y = 0.79x − 20.23, R2 = 0.91, p < 0.01), indicating that annual rainfall explains approximately 91% of the variation in runoff.
While annual or seasonal rainfall can predict long-term runoff trends, accurate prediction at shorter time scales (e.g., weekly or daily) requires the consideration of more detailed rainfall characteristics, including rainfall intensity, daily rainfall, and extreme events. The infiltration process is limited by rainfall intensity when the latter is below the soil infiltration rate [44,45]. However, when rainfall intensity exceeds the soil infiltration rate, excess water accumulates on the soil surface, generating infiltration-excess runoff [46]. In the study area, the low saturated hydraulic conductivity of Vaiden soil (Kₛ < 10 mm/day) means that the peak rainfall intensities frequently surpass the infiltration rates. However, depression storage, vegetation cover, and crop residue can significantly delay the initiation of runoff by intercepting rainfall and trapping water in surface depressions [47,48,49]. Conversely, Figure 10a shows that a shallow groundwater table in winter and early spring restricts the soil pore space, leading to saturation-excess runoff becoming the dominant process.
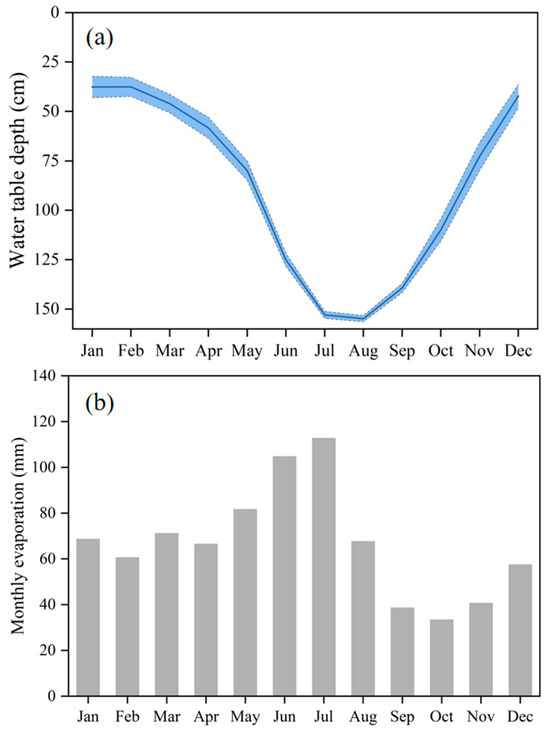
Figure 10.
(a) Monthly water table depth with 95% confidence intervals. (b) Monthly mean evaporation from 1924 to 2023 in Noxubee County, Mississippi.
The relationship between rainfall and runoff varied with rainfall characteristics; therefore, many researchers have investigated the effect of extreme rainfall events on runoff dynamics [40,50,51]. By categorizing different rainfall events, we found that very heavy and extreme rainfall events generated 38% and 24% of total runoff, respectively. Furthermore, in wet early spring years, extreme rainfall events had a more dominant impact, contributing an average of 40% to total runoff. Keim [39] also identified heavy winter–spring rainfall in Louisiana as a major driver of runoff.
4.2. Interannual and Seasonal Variability in Runoff Dynamics
Rainfall and runoff in the study region show strong interannual variability, with rainfall consistently being identified as the primary driver across all fallow seasons (dry, wet, and normal). The wet fallow seasons received 90% more rainfall than dry fallow seasons, but the corresponding runoff increased by 176%. This nonlinear runoff–rainfall relationship was further supported by simple regression analysis, which revealed a stronger correlation and steeper slope during wet years (y = 0.95x − 35.46, R2 = 0.81) compared to dry years (y = 0.59x − 9.24, R2 = 0.61), indicating enhanced runoff generation potential under wetter conditions. This disproportionate response has been reported in previous studies. For example, Rose [41] observed that an 18% rainfall deficit during droughts resulted in a 39% reduction in runoff. Allen et al. [52] noted that a 27% decrease in annual rainfall led to a 75% reduction in runoff. Similarly, Keim et al. [41] observed a 28% runoff increase from just an 11% rainfall rise.
In addition to interannual variability, runoff within the study area also exhibits typical seasonal patterns. Our simulations indicated that 70% of the annual runoff occurred during wet fallow seasons. Furthermore, the runoff-to-rainfall ratio during this wet period is significantly higher (0.52) compared to the dry summer season (0.27). These seasonal runoff patterns are consistent with previous findings from the other regions in the southern USA, where summer runoff exhibits greater variability due to elevated ET and high-intensity convective storms [16,17]. Keim et al. [41] further demonstrated that winter and spring rainfall is more likely to generate runoff, as it typically falls on saturated soils during periods of low ET in Louisiana. A seasonal trend in ET rates can be observed in Figure 10b, increasing from 33 mm in October to a peak of 110 mm in June and July. The contrasting evaporation patterns reveal that 95% of summer rainfall was lost to ET, while less than 50% was lost during March and April. The seasonal variability in the difference between rainfall and ET plays a crucial role in driving frequent early-spring runoff events across the Mississippi region.
4.3. Impacts of Water Table Depth
Soil moisture has a great influence on runoff generation mechanisms [19,53,54]. The antecedent precipitation index (API), which is typically based on 7-day or 30-day rainfall prior to a runoff event, has been widely used in studies to classify soil antecedent moisture conditions [55]. A key limitation of this approach is that it only considers rainfall inputs while ignoring the critical role of soil infiltration capacity in the water balance. As demonstrated by Skaggs et al. [28], soil moisture dynamics in the vadose zone are largely governed by groundwater table depth and soil water retention properties. To address the above limitations, we quantified the available soil pore space and corresponding rainfall thresholds for runoff generation, based on the simulated groundwater table dynamics (Table 5).
Table 5.
Temporal dynamics of the soil pore space and rainfall thresholds required for runoff generation during the fallow season.
Following a conventional crop harvest in late October, the combined effects of reduced soil evaporation and frequent rainfall result in a pronounced rise of the water table below ground from 130 cm to 37 cm during winter. Additionally, the Vaiden silty clay in the study area tends to maintain high saturation degrees under low soil suction conditions. By early spring, the shallow water table causes near-saturated conditions in the vadose zone, severely limiting the available pore space for rainfall infiltration. As shown in Table 5, the estimated available storage capacity gradually increases from 3 mm in January to 14 mm by May, which explains the corresponding decline in both runoff frequency and volume over time. The shallow water table exerts a direct influence on soil profile moisture and infiltration capacity, thereby regulating the runoff characteristics during the rainfall events. This finding aligns with the findings of Amatya et al. [56], who reported notable shifts in the runoff–rainfall ratio due to fluctuations in groundwater depth. Specifically, during the dry season of 2007, the ratio was 0.07, but it had previously increased to 0.26 in September 2006 because of the near-surface water table. Similarly, Katimon et al. [57] found that when the water table was less than 55 cm in a tropical peat catchment, higher variability in the runoff ratio and increased runoff volumes were observed. In agriculture systems, a shallower water table in controlled drainage conditions, compared to free drainage, resulted in significantly higher runoff volumes during the non-growing season [58,59].
By comparing the rainfall data with the established rainfall thresholds, the mean frequency of threshold-exceeding rainfall events from March to May was calculated as 3, 3, and 1, respectively, which is 1 event fewer than the corresponding observed runoff frequencies. This discrepancy may arise from neglecting the heightened runoff risk after consecutive rainfall events. When the soil is waterlogged or saturated, even light rainfall can trigger a runoff event in the model. Overall, integrating field-scale water table fluctuations with soil properties enables an accurate estimation of air-filled porosity in the soil profile, thereby enhancing the prediction of runoff risk and soil erosion before heavy rainfall events.
4.4. Uncertainties and Limitations
There are several uncertainties in the soil and weather parameters of the hydrological models used in this study. Due to the limited resolution of rainfall data, the study was unable to accurately capture runoff characteristics occurring on hourly or minute-based timescales. This may have led to an underestimation of saturation-excess runoff, especially since rainfall in the region often occurs as high-intensity events within the short duration of a few hours. Additionally, surface depression storage plays a key role in partitioning rainfall between infiltration and runoff. However, a fixed value of 1 cm was used for the whole simulation period, which failed to reflect the temporal variability in surface depression storage caused by tillage practices and crop residue [60,61].
Despite these limitations, this study provides valuable insights into potential rainfall-runoff relationships during the fallow season. Future research should focus on (1) improving the temporal resolution of rainfall data to better capture short-duration, high-intensity runoff events; (2) quantifying the effects of field-specific management practices and vegetation cover or mulch on surface depression storage to reduce the current uncertainties; and (3) analyzing runoff response to rainfall across different soil textures and land use types.
5. Conclusions
On the basis of long-term weather data, we utilized DRAINMOD to investigate rainfall and runoff dynamics during the fallow season in Noxubee County, Mississippi. The results showed that the fallow season accounted for 65% of annual rainfall, with rainfall ranging from 279 to 1260 mm. On average, there were 10 heavy, 11 very heavy, and 2 extreme rainfall events in each fallow season, contributing disproportionately to the total rainfall by 19%, 46%, and 22%, respectively.
Runoff exhibited strong interannual variability, with both the volume and frequency increasing under wetter conditions. Mean runoff rose from 227 mm in dry years to 602 mm in wet years, with the corresponding rainfall–runoff ratios increasing from 42% to 62%. Correspondingly, the mean runoff frequency also increased from 16 events in dry years to 23 events in normal years and 30 events in wet years, with 80% of the frequencies ranging between 15 and 30 events. Seasonally, runoff volume and frequency declined from early to late spring; however, the greater intensity of extreme rainfall events (R95p) in April contributed over 45% of the total runoff, resulting in the highest daily mean runoff (20 mm), compared to 18 mm in March and 16 mm in May.
High-intensity rainfall events are the primary drivers of runoff dynamics. Specifically, the average runoff generated by very heavy and extreme rainfall was 215 mm and 135 mm, respectively. These high-intensity rainfall events accounted for nearly 60% of runoff events and contributed more than 85% of the total runoff volume. During the spring months, water table dynamics played a dominant role in rainwater partitioning. The available soil pore space increased from 5 mm in March to 14 mm in May, leading to a 49% reduction in mean runoff (from 74 mm to 38 mm) and a 50% decline in monthly runoff frequency (from 4 to 2 events).
This study provides valuable insights for field-scale water resource management in the region. Monitoring water table depth or soil moisture allows farmers to assess runoff and waterlogging risks during wet springs and to identify the optimal windows for spring planting and tillage. Furthermore, understanding rainfall–runoff relationships can help optimize fertilization schedules, thereby reducing nutrient loss and mitigating water pollution from surface runoff. Building on these findings, policymakers may consider promoting conservation practices such as cover cropping or no-till agriculture to further reduce surface runoff, soil erosion, and nutrient loss in similar humid regions.
Author Contributions
Conceptualization, methodology, software, validation, formal analysis, investigation, data curation, R.P. and G.F.; writing—original draft preparation, R.P.; writing—review and editing, G.F., Y.O. and G.B.; visualization, R.P.; supervision, G.F. and J.B.; project administration, G.F. and J.B.; funding acquisition, G.F. and J.B. All authors have read and agreed to the published version of the manuscript.
Funding
This research was funded by the USDA-ARS National Program 216: 6064-21660-001-000D.
Data Availability Statement
The data presented in this study are available from the corresponding author on reasonable request.
Acknowledgments
We would like to acknowledge the support of USDA-ARS, the Department of Plant and Soil Sciences at Mississippi State University, and all our collaborators in this study.
Conflicts of Interest
The authors declare no conflicts of interest.
References
- Kunkel, K.E.; Pielke, R.A., Jr.; Changnon, S.A. Temporal fluctuations in weather and climate extremes that cause economic and human health impacts: A review. Bull. Am. Meteorol. Soc. 1999, 80, 1077–1098. [Google Scholar] [CrossRef]
- Kunkel, K.E. North American trends in extreme precipitation. Nat. Hazards 2003, 29, 291–305. [Google Scholar] [CrossRef]
- Pimentel, D. Soil erosion: A food and environmental threat. Environ. Dev. Sustain. 2006, 8, 119–137. [Google Scholar] [CrossRef]
- Powell, E.J.; Keim, B.D. Trends in daily temperature and precipitation extremes for the southeastern United States: 1948–2012. J. Clim. 2015, 28, 1592–1612. [Google Scholar] [CrossRef]
- Skeeter, W.J.; Senkbeil, J.C.; Keellings, D.J. Spatial and temporal changes in the frequency and magnitude of intense precipitation events in the southeastern United States. Int. J. Climatol. 2019, 39, 768–782. [Google Scholar] [CrossRef]
- Bishop, D.A.; Williams, A.P.; Seager, R. Increased fall precipitation in the southeastern United States driven by higher-intensity, frontal precipitation. Geophys. Res. Lett. 2019, 46, 8300–8309. [Google Scholar] [CrossRef]
- Zhang, B.; Feng, G.; Read, J.J.; Kong, X.; Ouyang, Y.; Adeli, A.; Jenkins, J.N. Simulating soybean productivity under rainfed conditions for major soil types using APEX model in East Central Mississippi. Agric. Water Manag. 2016, 177, 379–391. [Google Scholar] [CrossRef]
- Keim, B.D. Preliminary analysis of the temporal patterns of heavy rainfall across the southeastern United States. Prof. Geogr. 1997, 49, 94–104. [Google Scholar] [CrossRef]
- Keim, B.D. Precipitation annual maxima as a measure of change in extreme rainfall magnitudes in the southeastern United States over the past century. Southeast. Geogr. 1999, 39, 235–245. [Google Scholar] [CrossRef]
- Assouline, S.; Selker, J.S.; Parlange, J.Y. A simple accurate method to predict time of ponding under variable intensity rainfall. Water Resour. Res. 2007, 43. [Google Scholar] [CrossRef]
- Liu, H.; Lei, T.W.; Zhao, J.; Yuan, C.P.; Fan, Y.T.; Qu, L.Q. Effects of rainfall intensity and antecedent soil water content on soil infiltrability under rainfall conditions using the run off-on-out method. J. Hydrol. 2011, 396, 24–32. [Google Scholar] [CrossRef]
- Fang, N.F.; Shi, Z.H.; Li, L.; Guo, Z.L.; Liu, Q.J.; Ai, L. The effects of rainfall regimes and land use changes on runoff and soil loss in a small mountainous watershed. Catena 2012, 99, 1–8. [Google Scholar] [CrossRef]
- Ran, Q.; Su, D.; Li, P.; He, Z. Experimental study of the impact of rainfall characteristics on runoff generation and soil erosion. J. Hydrol. 2012, 424, 99–111. [Google Scholar] [CrossRef]
- Ziadat, F.M.; Taimeh, A.Y. Effect of rainfall intensity, slope, land use and antecedent soil moisture on soil erosion in an arid environment. Land Degrad. Dev. 2013, 24, 582–590. [Google Scholar] [CrossRef]
- Kirono, D.G.; Chiew, F.H.; Kent, D.M. Identification of best predictors for forecasting seasonal rainfall and runoff in Australia. Hydrol. Process. Int. J. 2010, 24, 1237–1247. [Google Scholar] [CrossRef]
- La Torre Torres, I.B.; Amatya, D.M.; Sun, G.; Callahan, T.J. Seasonal rainfall–runoff relationships in a lowland forested watershed in the southeastern USA. Hydrol. Process. 2011, 25, 2032–2045. [Google Scholar] [CrossRef]
- Amatya, D.M.; Chescheir, G.M.; Skaggs, R.W.; Fernandez, G.P. Hydrology of poorly drained coastal watersheds in eastern North Carolina. In Proceedings of the 2002 ASAE Annual Meeting, Chicago, IL, USA, 28–31 July 2002; American Society of Agricultural and Biological Engineers: Saint Joseph, MI, USA, 2002. [Google Scholar][Green Version]
- Amatya, D.M.; Skaggs, R.W.; Blanton, C.D.; Gilliam, J.W. Hydrologic and water quality effects of harvesting and regeneration of a drained pine forest. In Hydrology and Management of Forested Wetlands, Proceedings of the International Conference, New Bern, NC, USA, 8–12 April 2006; American Society of Agricultural and Biological Engineers: Saint Joseph, MI, USA, 2006. [Google Scholar]
- Song, S.; Wang, W. Impacts of antecedent soil moisture on the rainfall-runoff transformation process based on high-resolution observations in soil tank experiments. Water 2019, 11, 296. [Google Scholar] [CrossRef]
- Zimmermann, B.; Elsenbeer, H.; De Moraes, J.M. The influence of land-use changes on soil hydraulic properties: Implications for runoff generation. For. Ecol. Manag. 2006, 222, 29–38. [Google Scholar] [CrossRef]
- Wei, L.; Zhang, B.; Wang, M. Effects of antecedent soil moisture on runoff and soil erosion in alley cropping systems. Agric. Water Manag. 2007, 94, 54–62. [Google Scholar] [CrossRef]
- Cui, X.; Li, X. Role of surface evaporation in surface rainfall processes. J. Geophys. Res. Atmos. 2006, 111. [Google Scholar] [CrossRef]
- Elias, D.; Ierotheos, Z. Quantifying the rainfall-water level fluctuation process in a geologically complex lake catchment. Environ. Monit. Assess. 2006, 119, 491–506. [Google Scholar] [CrossRef] [PubMed]
- Kaya, Y. Evaluation of ICESat-2 Laser Altimetry for Inland Water Level Monitoring: A Case Study of Canadian Lakes. Water 2025, 17, 1098. [Google Scholar] [CrossRef]
- Maul, J.D.; Cooper, C.M. Water quality of seasonally flooded agricultural fields in Mississippi, USA. Agric. Ecosyst. Environ. 2000, 81, 171–178. [Google Scholar] [CrossRef]
- Adeli, A.; Tewolde, H.; Jenkins, J.N.; Rowe, D.E. Cover crop use for managing broiler litter applied in the fall. Agron. J. 2011, 103, 200–210. [Google Scholar] [CrossRef]
- Adeli, A.; Tewolde, H.; Shankle, M.W.; Way, T.R.; Brooks, J.P.; McLaughlin, M.R. Runoff quality from no-till cotton fertilized with broiler litter in subsurface bands. J. Environ. Qual. 2013, 42, 284–291. [Google Scholar] [CrossRef] [PubMed]
- Baker, B.H.; Czarnecki, J.P.; Omer, A.R.; Aldridge, C.A.; Kröger, R.; Prevost, J.D. Nutrient and sediment runoff from agricultural landscapes with varying suites of conservation practices in the Mississippi Alluvial Valley. J. Soil Water Conserv. 2018, 73, 75–85. [Google Scholar] [CrossRef]
- Feng, G.; Ouyang, Y.; Adeli, A.; Read, J.; Jenkins, J. Rainwater deficit and irrigation demand for row crops in Mississippi Blackland Prairie. Soil Sci. Soc. Am. J. 2018, 82, 423–435. [Google Scholar] [CrossRef]
- Skaggs, R.W.; Youssef, M.A.; Chescheir, G.M. DRAINMOD: Model use, calibration, and validation. Trans. ASABE 2012, 55, 1509–1522. [Google Scholar] [CrossRef]
- Skaggs, R.W. Drainage simulation models. Agric. Drain. 1999, 38, 469–500. [Google Scholar]
- Abduljaleel, Y.; Awad, A.; Al-Ansari, N.; Salem, A.; Negm, A.; Gabr, M.E. Assessment of subsurface drainage strategies using DRAINMOD model for sustainable agriculture: A review. Sustainability 2023, 15, 1355. [Google Scholar] [CrossRef]
- Youssef, M.A.; Liu, Y.; Chescheir, G.M.; Skaggs, R.W.; Negm, L.M. DRAINMOD modeling framework for simulating controlled drainage effect on lateral seepage from artificially drained fields. Agric. Water Manag. 2021, 254, 106944. [Google Scholar] [CrossRef]
- Ghane, E.; Askar, M.H. Predicting the effect of drain depth on profitability and hydrology of subsurface drainage systems across the eastern USA. Agric. Water Manag. 2021, 258, 107072. [Google Scholar] [CrossRef]
- Zhang, X.; Alexander, L.; Hegerl, G.C.; Jones, P.; Tank, A.K.; Peterson, T.C.; Trewin, B.; Zwiers, F.W. Indices for monitoring changes in extremes based on daily temperature and precipitation data. Wiley Interdiscip. Rev. Clim. Change 2011, 2, 851–870. [Google Scholar] [CrossRef]
- Zhang, B.; Feng, G.; Kong, X.; Lal, R.; Ouyang, Y.; Adeli, A.; Jenkins, J.N. Simulating yield potential by irrigation and yield gap of rainfed soybean using APEX model in a humid region. Agric. Water Manag. 2016, 177, 440–453. [Google Scholar] [CrossRef]
- Tang, Q.; Feng, G.; Fisher, D.; Zhang, H.; Ouyang, Y.; Adeli, A.; Jenkins, J. Rain water deficit and irrigation demand of major row crops in the Mississippi Delta. Trans. ASABE 2018, 61, 927–935. [Google Scholar] [CrossRef]
- Kunkel, K.E.; Stevens, L.E.; Stevens, S.E.; Sun, L.; Janssen, E.; Wuebbles, D.; Konrad, C.E., II; Fuhrman, C.M.; Keim, B.D.; Kruk, M.C.; et al. Regional climate trends and scenarios for the US National Climate Assessment 2013: Part 2. Climate of the Southeast US. Available online: https://www.nesdis.noaa.gov/about/documents-reports/technical-reports (accessed on 10 May 2025).
- Keim, B.D. Spatial, synoptic, and seasonal patterns of heavy rainfall in the southeastern United States. Phys. Geogr. 1996, 17, 313–328. [Google Scholar] [CrossRef]
- Jian, S.; Yin, C.; Wang, Y.; Yu, X.; Li, Y. The possible incoming runoff under extreme rainfall event in the Fenhe river basin. Front. Environ. Sci. 2022, 10, 812351. [Google Scholar] [CrossRef]
- Keim, B.D.; Faiers, G.E.; Muller, R.A.; Grymes III, J.M.; Rohli, R.V. Long-term trends of precipitation and runoff in Louisiana, USA. Int. J. Climatol. 1995, 15, 531–541. [Google Scholar] [CrossRef]
- Lu, J.; Sun, G.; McNulty, S.G.; Amatya, D.M. Modeling Actual Evapotranspiration from Forested Watersheds Across the Southeastern United States 1. J. Am. Water Resour. Assoc. 2003, 39, 886–896. [Google Scholar] [CrossRef]
- Rose, S. Rainfall–runoff trends in the south-eastern USA: 1938–2005. Hydrol. Process. Int. J. 2009, 23, 1105–1118. [Google Scholar] [CrossRef]
- Kleinman, P.J.; Srinivasan, M.S.; Dell, C.J.; Schmidt, J.P.; Sharpley, A.N.; Bryant, R.B. Role of rainfall intensity and hydrology in nutrient transport via surface runoff. J. Environ. Qual. 2006, 35, 1248–1259. [Google Scholar] [CrossRef] [PubMed]
- Ben-Hur, M.; Lado, M. Effect of soil wetting conditions on seal formation, runoff, and soil loss in arid and semiarid soils—A review. Soil Res. 2008, 46, 191–202. [Google Scholar] [CrossRef]
- Buchanan, B.; Auerbach, D.A.; Knighton, J.; Evensen, D.; Fuka, D.R.; Easton, Z.; Wieczorek, M.; Archibald, J.A.; McWilliams, B.; Walter, T. Estimating dominant runoff modes across the conterminous United States. Hydrol. Process. 2018, 32, 3881–3890. [Google Scholar] [CrossRef]
- Vermang, J.; Norton, L.D.; Huang, C.; Cornelis, W.M.; Da Silva, A.M.; Gabriels, D. Characterization of soil surface roughness effects on runoff and soil erosion rates under simulated rainfall. Soil Sci. Soc. Am. J. 2015, 79, 903–916. [Google Scholar] [CrossRef]
- Guzha, A.C. Effects of tillage on soil microrelief, surface depression storage and soil water storage. Soil Tillage Res. 2004, 76, 105–114. [Google Scholar] [CrossRef]
- Zhao, L.; Hou, R.; Wu, F.; Keesstra, S. Effect of soil surface roughness on infiltration water, ponding and runoff on tilled soils under rainfall simulation experiments. Soil Tillage Res. 2018, 179, 47–53. [Google Scholar] [CrossRef]
- Yaduvanshi, A.; Sharma, R.K.; Kar, S.C.; Sinha, A.K. Rainfall–runoff simulations of extreme monsoon rainfall events in a tropical river basin of India. Nat. Hazards 2018, 90, 843–861. [Google Scholar] [CrossRef]
- Dang, S.; Liu, X.; Yin, H.; Guo, X. Prediction of sediment yield in the middle reaches of the Yellow River basin under extreme precipitation. Front. Earth Sci. 2020, 8, 542686. [Google Scholar] [CrossRef]
- Allen, P.M.; Harmel, R.D.; Dunbar, J.A.; Arnold, J.G. Upland contribution of sediment and runoff during extreme drought: A study of the 1947–1956 drought in the Blackland Prairie, Texas. J. Hydrol. 2011, 407, 1–11. [Google Scholar] [CrossRef]
- Zehe, E.; Becker, R.; Bárdossy, A.; Plate, E. Uncertainty of simulated catchment runoff response in the presence of threshold processes: Role of initial soil moisture and precipitation. J. Hydrol. 2005, 315, 183–202. [Google Scholar] [CrossRef]
- Zehe, E.; Graeff, T.; Morgner, M.; Bauer, A.; Bronstert, A. Plot and field scale soil moisture dynamics and subsurface wetness control on runoff generation in a headwater in the Ore Mountains. Hydrol. Earth Syst. Sci. 2010, 14, 873–889. [Google Scholar] [CrossRef]
- James, A.; Routlet, N. Antecedent moisture conditions and catchment morphology as controls on spatial patterns of runoff generation in small forest catchments. J. Hydrol. 2009, 377, 351–366. [Google Scholar] [CrossRef]
- Amatya, D.; Callahan, T.; Trettin, C.; Radecki-Pawlik, A. Hydrologic and Water Quality Monitoring on Turkey Creek Watershed, Francis Marion National Forest, SC. In Proceedings of the ASABE Annual International Meeting, Reno, NV, USA, 21–24 June 2009; American Society of Agricultural and Biological Engineers: Saint Joseph, MI, USA, 2009. [Google Scholar]
- Katimon, A.; Shahid, S.; Khairi Abd Wahab, A.; Ali, M.H. Hydrological behaviour of a drained agricultural peat catchment in the tropics. 1: Rainfall, runoff and water table relationships. Hydrol. Sci. J. 2013, 58, 1297–1309. [Google Scholar] [CrossRef]
- Tan, C.S.; Drury, C.F.; Gaynor, J.D.; Welacky, T.W.; Reynolds, W.D. Effect of tillage and water table control on evapotranspiration, surface runoff, tile drainage and soil water content under maize on a clay loam soil. Agric. Water Manag. 2002, 54, 173–188. [Google Scholar] [CrossRef]
- Tan, C.S.; Zhang, T.Q. Surface runoff and sub-surface drainage phosphorus losses under regular free drainage and controlled drainage with sub-irrigation systems in southern Ontario. Can. J. Soil Sci. 2011, 91, 349–359. [Google Scholar] [CrossRef]
- Prosdocimi, M.; Jordán, A.; Tarolli, P.; Keesstra, S.; Novara, A.; Cerdà, A. The immediate effectiveness of barley straw mulch in reducing soil erodibility and surface runoff generation in Mediterranean vineyards. Sci. Total Environ. 2016, 547, 323–330. [Google Scholar] [CrossRef] [PubMed]
- Zhao, C.; Gao, J.E.; Huang, Y.; Wang, G.; Zhang, M. Effects of vegetation stems on hydraulics of overland flow under varying water discharges. Land Degrad. Dev. 2016, 27, 748–757. [Google Scholar] [CrossRef]


Disclaimer/Publisher’s Note: The statements, opinions and data contained in all publications are solely those of the individual author(s) and contributor(s) and not of MDPI and/or the editor(s). MDPI and/or the editor(s) disclaim responsibility for any injury to people or property resulting from any ideas, methods, instructions or products referred to in the content. |
© 2025 by the authors. Licensee MDPI, Basel, Switzerland. This article is an open access article distributed under the terms and conditions of the Creative Commons Attribution (CC BY) license (https://creativecommons.org/licenses/by/4.0/).