Next Issue
Volume 13, January
Previous Issue
Volume 12, November


Climate, Volume 12, Issue 12 (December 2024) – 35 articles

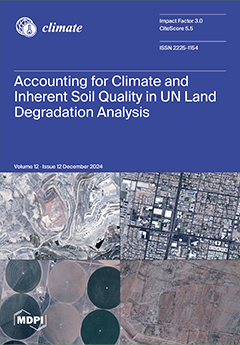
Cover Story (view full-size image): Climate change and land degradation (LD) are some of the most critical challenges for humanity. Land degradation (LD) is the focus of the United Nations (UN) Convention to Combat Desertification (UNCCD) and UN Sustainable Development Goal 15 (SDG 15: Life on Land). Land degradation is composed of inherent and anthropogenic LD, which are both impacted by inherent soil quality (SQ) and climate. Conventional LD analysis does not consider inherent SQ because it is not the result of land use/land cover change (LULC), which can be tracked using remote sensing platforms. Furthermore, traditional LD analysis does not link anthropogenic LD to climate change through greenhouse gas (GHG) emissions. This study demonstrates how to account for inherent SQ using the state of Arizona (AZ) as a case study. View this paper
  • Issues are regarded as officially published after their release is announced to the table of contents alert mailing list.
  • You may sign up for e-mail alerts to receive table of contents of newly released issues.
  • PDF is the official format for papers published in both, html and pdf forms. To view the papers in pdf format, click on the "PDF Full-text" link, and use the free Adobe Reader to open them.
Order results
Result details
Section
Select all
Export citation of selected articles as:
30 pages, 5657 KiB  
Article
The Impact of Climate Change on Energy Consumption on Small Tropical Islands
by Julien Gargani
Climate 2024, 12(12), 227; https://doi.org/10.3390/cli12120227 - 23 Dec 2024
Viewed by 1503
Abstract
The anthropic causes of climate change are well known, but the influence of climate change on society needs to be better estimated. This study estimates the impact of climate change on energy consumption on small tropical islands using monthly temperatures and energy production/consumption [...] Read more.
The anthropic causes of climate change are well known, but the influence of climate change on society needs to be better estimated. This study estimates the impact of climate change on energy consumption on small tropical islands using monthly temperatures and energy production/consumption statistics during the last decades. Here, we show, using energy, meteorological, demographic, and economic datasets, as well as statistical correlations, that energy consumption is sensitive to (i) cyclonic activity and (ii) temperature warming. On small tropical islands, increased electricity consumption correlates with temperatures rising above 26 °C in relation to air conditioner electricity consumption. On La Réunion Island, a +1 °C increase is expected to cause an electricity production of 1.5 MWh/inhabitant per year, representing a growth of 3.2%. Considering that non-renewable sources are primarily used to produce electricity, this feedback contributed significantly (i.e., 2000 to 4000 TWh) to the greenhouse gas increase caused by climate warming over the last decades on tropical islands. Demographic and wealth variations, as well as socio-economic crises, also have a significant impact on energy consumption (2 kWh for 1000 inhabitants, 0.008 GWh/inhabitant growth for a 10,000 GDP/inhabitant growth, and a 0.2 GWh/inhabitant decrease during COVID-19, for annual consumption, respectively) and must be taken into account for decadal variation analysis. The relationship between climate change and energy consumption in tropical areas should be better integrated into climatic scenarios to adapt building isolation and energy production. Full article
Show Figures

Figure 1

18 pages, 4785 KiB  
Article
A Merging Approach for Improving the Quality of Gridded Precipitation Datasets over Burkina Faso
by Moussa Waongo, Juste Nabassebeguelogo Garba, Ulrich Jacques Diasso, Windmanagda Sawadogo, Wendyam Lazare Sawadogo and Tizane Daho
Climate 2024, 12(12), 226; https://doi.org/10.3390/cli12120226 - 20 Dec 2024
Viewed by 1017
Abstract
Satellite precipitation estimates are crucial for managing climate-related risks such as droughts and floods. However, these datasets often contain systematic errors due to the observation methods used. The accuracy of these estimates can be enhanced by integrating spatial and temporal resolution data from [...] Read more.
Satellite precipitation estimates are crucial for managing climate-related risks such as droughts and floods. However, these datasets often contain systematic errors due to the observation methods used. The accuracy of these estimates can be enhanced by integrating spatial and temporal resolution data from in situ observations. Nevertheless, the accuracy of the merged dataset is influenced by the density and distribution of rain gauges, which can vary regionally. This paper presents an approach to improve satellite precipitation data (SPD) over Burkina Faso. Two bias correction methods, Empirical Quantile Mapping (EQM) and Time and Space-Variant (TSV), have been applied to the SPD to yield a bias-corrected dataset for the period 1991–2020. The most accurate bias-corrected dataset is then combined with in situ observations using the Regression Kriging (RK) method to produce a merged precipitation dataset. The findings show that both bias correction methods achieve similar reductions in RMS error, with higher correlation coefficients (approximately 0.8–0.9) and a normalized standard deviation closer to 1. However, EQM generally demonstrates more robust and consistent performance, particularly in terms of correlation and RMS error reduction. On a monthly scale, the superiority of EQM is most evident in June, September, and October. Following the merging process, the final dataset, which incorporates satellite information in addition to in situ observations, demonstrates higher performance. It shows improvements in the coefficient of determination by 83%, bias by 11.4%, mean error by 96.7%, and root-mean-square error by 95.5%. The operational implementation of this approach provides substantial support for decision-making in regions heavily reliant on rainfed agriculture and sensitive to climate variability. Delivering more precise and reliable precipitation datasets enables more informed decisions and significantly enhances policy-making processes in the agricultural and water resources sectors of Burkina Faso. Full article
Show Figures

Figure 1

24 pages, 7095 KiB  
Article
Effect of Temperature on the Spread of Contagious Diseases: Evidence from over 2000 Years of Data
by Mehmet Balcilar, Zinnia Mukherjee, Rangan Gupta and Sonali Das
Climate 2024, 12(12), 225; https://doi.org/10.3390/cli12120225 - 20 Dec 2024
Viewed by 1249
Abstract
The COVID-19 pandemic led to a surge in interest among scholars and public health professionals in identifying the predictors of health shocks and their transmission in the population. With temperature increases becoming a persistent climate stress, our aim is to evaluate how temperature [...] Read more.
The COVID-19 pandemic led to a surge in interest among scholars and public health professionals in identifying the predictors of health shocks and their transmission in the population. With temperature increases becoming a persistent climate stress, our aim is to evaluate how temperature specifically impacts the incidences of contagious disease. Using annual data from 1 AD to 2021 AD on the incidence of contagious disease and temperature anomalies, we apply both parametric and nonparametric modelling techniques and provide estimates of the contemporaneous, as well as lagged, effects of temperature anomalies on the spread of contagious diseases. A nonhomogeneous hidden Markov model is then applied to estimate the time-varying transition probabilities between hidden states where the transition probabilities are governed by covariates. For all empirical specifications, we find consistent evidence that temperature anomalies have a statistically significant effect on the incidence of a contagious disease in any given year covered in the sample period. The best fit model further indicates that the contemporaneous effect of a temperature anomaly on the response variable is the strongest. As temperature predictions continue to become more accurate, our results indicate that such information can be used to implement effective public health responses to limit the spread of contagious diseases. These findings further have implications for designing cost effective infectious disease control policies for different regions of the world. Full article
(This article belongs to the Special Issue Climate Impact on Human Health)
Show Figures

Figure 1

19 pages, 11114 KiB  
Article
Development of a Diagnostic Algorithm for Detecting Freezing Precipitation from ERA5 Dataset: An Adjustment to the Far East
by Mikhail Pichugin, Irina Gurvich, Anastasiya Baranyuk, Vladimir Kuleshov and Elena Khazanova
Climate 2024, 12(12), 224; https://doi.org/10.3390/cli12120224 - 17 Dec 2024
Viewed by 1240
Abstract
Freezing precipitation and the resultant ice glaze can have catastrophic impacts on urban infrastructure, the environment, forests, and various industries, including transportation, energy, and agriculture. In this study, we develop and evaluate regional algorithms for detecting freezing precipitations in the Far East, utilizing [...] Read more.
Freezing precipitation and the resultant ice glaze can have catastrophic impacts on urban infrastructure, the environment, forests, and various industries, including transportation, energy, and agriculture. In this study, we develop and evaluate regional algorithms for detecting freezing precipitations in the Far East, utilizing the ERA5 reanalysis dataset from the European Centre for Medium-Range Weather Forecasts, along with standard meteorological observations for 20 cold seasons (September–May) from 2004 to 2024. We propose modified diagnostic algorithms based on vertical atmospheric temperature and humidity profiles, as well as near-surface characteristics. Additionally, we apply a majority voting ensemble (MVE) technique to integrate outputs from multiple algorithms, thereby enhancing classification accuracy. Evaluation of detection skills shows significant improvements over the original method developed at the Finnish Meteorological Institute and the ERA5 precipitation-type product. The MVE-based method demonstrates optimal verification statistics. Furthermore, the modified algorithms validly reproduce the spatially averaged inter-annual variability of freezing precipitation activity in both continental (mean correlation of 0.93) and island (correlation of 0.54) regions. Overall, our findings offer a more effective and valuable tool for operational activities and climatological assessments in the Far East. Full article
(This article belongs to the Special Issue Extreme Weather Detection, Attribution and Adaptation Design)
Show Figures

Figure 1

16 pages, 2534 KiB  
Article
Mapping Methane—The Impact of Dairy Farm Practices on Emissions Through Satellite Data and Machine Learning
by Hanqing Bi and Suresh Neethirajan
Climate 2024, 12(12), 223; https://doi.org/10.3390/cli12120223 - 15 Dec 2024
Cited by 1 | Viewed by 1466
Abstract
Methane emissions from dairy farms are a significant driver of climate change, yet their relationship with farm-specific practices remains poorly understood. This study employs Sentinel-5P satellite-derived methane column concentrations as a proxy to examine emission dynamics across 11 dairy farms in Eastern Canada, [...] Read more.
Methane emissions from dairy farms are a significant driver of climate change, yet their relationship with farm-specific practices remains poorly understood. This study employs Sentinel-5P satellite-derived methane column concentrations as a proxy to examine emission dynamics across 11 dairy farms in Eastern Canada, using data collected between January 2020 and December 2022. By integrating advanced analytics, we identified key drivers of methane concentrations, including herd genetics, feeding practices, and management strategies. Statistical tools such as Variance Inflation Factor (VIF) and Principal Component Analysis (PCA) addressed multicollinearity, stabilizing predictive models. Machine learning approaches—Random Forest and Neural Networks—revealed a strong negative correlation between methane concentrations and the Estimated Breeding Value (EBV) for protein percentage, demonstrating the potential of genetic selection for emissions mitigation. Our approach refined concentration estimates by integrating satellite data with localized atmospheric modeling, enhancing accuracy and spatial resolution. These findings highlight the transformative potential of combining satellite observations, machine learning, and farm-level characteristics to advance sustainable dairy farming. This research underscores the importance of targeted breeding programs and management strategies to optimize environmental and economic outcomes. Future work should expand datasets and apply inversion modeling for finer-scale emission quantification, advancing scalable solutions that balance productivity with ecological sustainability. Full article
(This article belongs to the Special Issue Applications of Smart Technologies in Climate Risk and Adaptation)
Show Figures

Figure 1

16 pages, 237 KiB  
Article
“Taking Action in Community Is Much, Much Preferable to Doing It Alone”: An Examination of Multi-Level Facilitators of and Barriers to Sustained Collective Climate Change Activism Among US Residents
by Lauren Dayton, Kelsie Parker, Julia Ross, Saraniya Tharmarajah and Carl Latkin
Climate 2024, 12(12), 222; https://doi.org/10.3390/cli12120222 - 14 Dec 2024
Viewed by 1160
Abstract
To enact climate mitigation policies, sustained collective activism is essential to create political pressure and prioritize addressing climate change. Climate change activism includes behaviors such as contacting elected officials to urge them to take action on climate change, volunteering, and signing petitions. Climate [...] Read more.
To enact climate mitigation policies, sustained collective activism is essential to create political pressure and prioritize addressing climate change. Climate change activism includes behaviors such as contacting elected officials to urge them to take action on climate change, volunteering, and signing petitions. Climate change activism is often measured as a one-time event, not sustained activism efforts, which are necessary to enact sufficiently impactful policy changes. To examine barriers to and facilitators of sustained climate change activism, 23 in-depth interviews were conducted between August and December 2023 among members of an innovative national climate change-focused organization. Eligibility included being at least 18 years of age, English-speaking, a US resident, and highly engaged in a climate change activism group. Content analysis of interview transcripts was employed, and five themes emerged as barriers, four themes as facilitators, and five themes as both facilitators of and barriers to sustained climate change activism. The study identified strategies to promote the critical behavior of sustained climate change activism, which included fostering a community of climate change activists, clear instructions on how to engage in activism behaviors for all technical abilities, supporting mental health, and creating climate change activism as a habit and identity. Full article
28 pages, 10117 KiB  
Article
The Drought Regime in Southern Africa: Long-Term Space-Time Distribution of Main Drought Descriptors
by Fernando Maliti Chivangulula, Malik Amraoui and Mário Gonzalez Pereira
Climate 2024, 12(12), 221; https://doi.org/10.3390/cli12120221 - 13 Dec 2024
Viewed by 3552
Abstract
Drought consequences depend on its type and class and on the preparedness and resistance of communities, which, in turn, depends on the knowledge and capacity to manage this climate disturbance. Therefore, this study aims to assess the drought regime in Southern Africa based [...] Read more.
Drought consequences depend on its type and class and on the preparedness and resistance of communities, which, in turn, depends on the knowledge and capacity to manage this climate disturbance. Therefore, this study aims to assess the drought regime in Southern Africa based on vegetation and meteorological indices. The SPI and SPEI were calculated at different timescales, using ERA5 data for the 1971–2020 period. The results revealed the following: (i) droughts of various classes at different timescales occurred throughout the study period and region; (ii) a greater Sum of Drought Intensity and Number, in all classes, but lower duration and severity of droughts with the SPI than with the SPEI; (iii) drought frequency varies from 1.3 droughts/decade to 4.5 droughts/decade, for the SPI at 12- to 3-month timescales; (iv) the number, duration, severity and intensity of drought present high spatial variability, which tends to decrease with the increasing timescale; (v) the area affected by drought increased, on average, 6.6%/decade with the SPI and 9.1%/decade with the SPEI; and (vi) a high spatial-temporal agreement between drought and vegetation indices that confirm the dryness of vegetation during drought. These results aim to support policymakers and managers in defining legislation and strategies to manage drought and water resources. Full article
Show Figures

Figure 1

16 pages, 2925 KiB  
Article
A Comprehensive AI Approach for Monitoring and Forecasting Medicanes Development
by Javier Martinez-Amaya, Veronica Nieves and Jordi Muñoz-Mari
Climate 2024, 12(12), 220; https://doi.org/10.3390/cli12120220 - 13 Dec 2024
Viewed by 1272
Abstract
Medicanes are rare cyclones in the Mediterranean Sea, with intensifying trends partly attributed to climate change. Despite progress, challenges persist in understanding and predicting these storms due to limited historical tracking data and their infrequent occurrence, which make monitoring and forecasting difficult. In [...] Read more.
Medicanes are rare cyclones in the Mediterranean Sea, with intensifying trends partly attributed to climate change. Despite progress, challenges persist in understanding and predicting these storms due to limited historical tracking data and their infrequent occurrence, which make monitoring and forecasting difficult. In response to this issue, we present an AI-based system for tracking and forecasting Medicanes, employing machine learning techniques to identify cyclone positions and key evolving spatio-temporal structural features of the cloud system that are associated with their intensification and potential extreme development. While the forecasting model currently operates with limited training data, it can predict extreme Medicane events up to two days in advance, with precision rates ranging from 65% to 80%. These innovative data-driven methods for tracking and forecasting provide a foundation for refining AI models and enhancing our ability to respond effectively to such events. Full article
(This article belongs to the Special Issue Addressing Climate Change with Artificial Intelligence Methods)
Show Figures

Figure 1

22 pages, 6758 KiB  
Article
Analysis of the Observed Trends in Rainfall and Temperature Patterns in North-Eastern Nigeria
by Deborah Ishaku, Emmanuel Tanko Umaru, Abel Aderemi Adebayo, Ralf Löwner and Appollonia Aimiosino Okhimamhe
Climate 2024, 12(12), 219; https://doi.org/10.3390/cli12120219 - 11 Dec 2024
Cited by 1 | Viewed by 2369
Abstract
The present study offers a comprehensive evaluation of the monthly rainfall and temperature patterns across nine stations and fifty-nine points in North-Eastern Nigeria using NASA’s Prediction of Worldwide Energy Resources data, spanning four decades (1981–2021). By employing the Mann–Kendall (MK) test and inverse [...] Read more.
The present study offers a comprehensive evaluation of the monthly rainfall and temperature patterns across nine stations and fifty-nine points in North-Eastern Nigeria using NASA’s Prediction of Worldwide Energy Resources data, spanning four decades (1981–2021). By employing the Mann–Kendall (MK) test and inverse distance weighting (IDW) interpolation, the researchers effectively detected and visualized trends in climate variables. The MK test results indicate contrasting rainfall trends, with notable decreases in Akko, Billiri, Maiduguri, Numan, and Yola, and increases in Gombe, Abadam, Biu, and Mubi. The trends in the maximum temperature were found to be statistically significant across all stations, showing a consistent increase, whereas the minimum temperature trends exhibited a slight but insignificant decrease. The application of the Theil–Sen slope estimator quantified these trends, providing nuanced insights into the magnitudes of changes in climate variables. The IDW results further corroborate the general trend of decreasing rainfall (z = −0.442), modest increases in the maximum temperature (z = 0.046), and a marginal decline in the minimum temperature (z = −0.005). This study makes an important contribution by advocating for the proactive dissemination of climate information. Given the evident climate shifts, particularly the increasing temperatures and fluctuating rainfall patterns, timely access to such information is crucial to enhancing climate resilience in the region. The rigorous statistical methods applied and the detailed spatial analysis strengthen the validity of these findings, making this study a valuable resource for both researchers and policymakers aiming to address climate variability in North-Eastern Nigeria. These research results may also be useful for understanding the climate variabilities in different parts of the world. Full article
Show Figures

Figure 1

21 pages, 2159 KiB  
Article
Multi-Secular Trend of Drought Indices in Padua, Italy
by Francesca Becherini, Claudio Stefanini, Antonio della Valle, Francesco Rech, Fabio Zecchini and Dario Camuffo
Climate 2024, 12(12), 218; https://doi.org/10.3390/cli12120218 - 10 Dec 2024
Cited by 1 | Viewed by 1356
Abstract
The aim of this work is to investigate drought variability in Padua, northern Italy, over a nearly 300-year period, from 1725 to 2023. Two well-established and widely used indices are calculated, the standardized precipitation index (SPI) and the standardized precipitation evapotranspiration index (SPEI). [...] Read more.
The aim of this work is to investigate drought variability in Padua, northern Italy, over a nearly 300-year period, from 1725 to 2023. Two well-established and widely used indices are calculated, the standardized precipitation index (SPI) and the standardized precipitation evapotranspiration index (SPEI). They are compatible with a data series starting in the early instrumental period, as both can be estimated using only temperature and precipitation data. The Padua daily precipitation and temperature series from the early 18th century, which were recovered and homogenized with current observations, are used as datasets. The standard approach to estimate SPI and SPEI based on gamma and log-logistic probability distribution functions, respectively, is questioned, assessing the fitting performance of different distributions applied to monthly precipitation data. The best-performing distributions are identified for each index and accumulation period at annual and monthly scales, and their normality is evaluated. In general, they detect more extreme drought events than the standard functions. Moreover, the main statistical values of SPI are very similar, regardless of the approach type, as opposed to SPEI. The difference between SPI and SPEI time series calculated with the best-fit approach has increased since the mid-20th century, in particular in spring and summer, and can be related to ongoing global warming, which SPEI takes into account. The innovative trend analysis applied to SPEI12 indicates a general increasing trend in droughts, while for SPI12, it is significant only for severe events. Summer and fall are the most affected seasons. The critical drought intensity–duration–frequency curves provide an easily understandable relationship between the intensity, duration and frequency of the most severe droughts and allow for the calculation of return periods for the critical events of a certain duration. Moreover, the longest and most severe droughts over the 1725–2023 period are identified. Full article
(This article belongs to the Special Issue Climate Variability in the Mediterranean Region)
Show Figures

Figure 1

13 pages, 769 KiB  
Article
Factors Contributing to Effective Climate Change Adaptation Projects in Water Management: Implications from the Developing Countries
by Yuki Shiga and Rajib Shaw
Climate 2024, 12(12), 217; https://doi.org/10.3390/cli12120217 - 10 Dec 2024
Viewed by 1178
Abstract
The adaptation finance gap is widening as the impact of climate change grows more disruptive around the globe. Although progress in adaptation planning and implementation has been observed across all sectors and regions, this trend of a widening resource gap calls for more [...] Read more.
The adaptation finance gap is widening as the impact of climate change grows more disruptive around the globe. Although progress in adaptation planning and implementation has been observed across all sectors and regions, this trend of a widening resource gap calls for more ‘effective’ climate adaptation projects. Therefore, the purpose of this paper is to provide a comprehensive analysis to explore potential factors contributing to the effectiveness of climate change projects in developing countries with a particular focus on water management financed under multilateral funds that have been implemented on the ground, completed and documented. Thirty-five projects from the multilateral funds were collected and analyzed for this purpose. Project evaluation documents have been studied, and the effectiveness rating at completion has been assessed against possible contributing factors through regression analysis. The results showed that the factors contributing to project effectiveness converge around several elements: (i) capacity building and education (|r| > 0.3); (ii) healthy and resilient livelihoods (|r| > 0.2); and (iii) climate data and a robust theory of change (stated by >30% of projects). The implications from this study can provide a useful quantitative ground for discussion around the effective adaptation projects in water management as well as inform relevant international processes such as the Global Goal on Adaptation and global stocktake. Full article
Show Figures

Figure 1

11 pages, 1637 KiB  
Article
Views of Health Professionals About Climate and Health in Sierra Leone: A Cross-Sectional Study
by Isaac S. Sesay and Konstantinos C. Makris
Climate 2024, 12(12), 216; https://doi.org/10.3390/cli12120216 - 10 Dec 2024
Cited by 1 | Viewed by 1288
Abstract
Climate change presents one of the biggest global threats to society, while the impact of its manifestations on human health has been poorly characterized and quantified, especially in middle- and low-income countries. The perceptual views of health professionals about the climate and health [...] Read more.
Climate change presents one of the biggest global threats to society, while the impact of its manifestations on human health has been poorly characterized and quantified, especially in middle- and low-income countries. The perceptual views of health professionals about the climate and health nexus are critical for the effective implementation of climate policies. The Sierra Leone health professionals are no exception to this, and no such data exist for their country. To this extent, we distributed a cross-sectional survey to understand the perceptual views and beliefs of health professionals in Sierra Leone about the climate and health nexus. A validated international questionnaire on the topic was electronically administered to 265 participants. A descriptive analysis of the survey responses was conducted. Results showed that almost all of the respondents (97%) felt that climate change is an important issue; more than half (68%) of them were very worried about climate change, and 28% were somewhat worried. About half of respondents believed that human activities mostly caused climate change, while 40% of health professionals felt this was equally caused by human activities and natural changes in the environment. The need to engage health professionals with the public and policymakers to bring the health effects of climate change to their attention was particularly highlighted; however, most respondents (81%) stated that numerous barriers impede them from doing so. The most widely reported barriers and needs were the need for training to communicate effectively about climate change and health (96%) and guidance on creating sustainable workplaces (94%), followed by the need for lifelong training and education programs on climate and health, and the lack of time (73%). These survey findings would be valuable to policymakers in Sierra Leone and the broader African regions towards mitigating and adapting to climate change threats to human health. Full article
Show Figures

Figure 1

29 pages, 5051 KiB  
Article
Evolution of Bioclimatic Belts in Spain and the Balearic Islands (1953–2022)
by Christian Lorente, David Corell, María José Estrela, Juan Javier Miró and David Orgambides-García
Climate 2024, 12(12), 215; https://doi.org/10.3390/cli12120215 - 10 Dec 2024
Cited by 1 | Viewed by 1158
Abstract
This study examines the spatio-temporal evolution of bioclimatic belts in peninsular Spain and the Balearic Islands from 1953 to 2022 using the World Bioclimatic Classification System and data from 3668 meteorological stations. Findings indicate a shift toward warmer and more arid conditions, with [...] Read more.
This study examines the spatio-temporal evolution of bioclimatic belts in peninsular Spain and the Balearic Islands from 1953 to 2022 using the World Bioclimatic Classification System and data from 3668 meteorological stations. Findings indicate a shift toward warmer and more arid conditions, with thermotypes showing an increase in mesomediterranean and thermomediterranean types and a decrease in mesotemperate and supratemperate types. Ombrotype analysis revealed a rise in semiarid types and a decline in humid and hyperhumid types. Significant changes occurred in climate transition zones and mountainous regions, where a process of “Mediterraneanisation”—a process characterised by the expansion of warmer and drier conditions typical of Mediterranean climates into previously temperate areas and/or an altitudinal rise in thermotypes—has been observed. The spatial variability of changes in ombrotypes was greater than that in thermotypes, with regions showing opposite trends to the general one. These results highlight the need for adaptive conservation strategies, particularly in mountainous and climate transition areas, where endemic species may face increased vulnerability due to habitat loss and fragmentation. The results of this study provide insight into how climate change is affecting bioclimatological conditions in the Iberian Peninsula and the Balearic Islands. Full article
(This article belongs to the Special Issue Climate Variability in the Mediterranean Region)
Show Figures

Figure 1

17 pages, 2031 KiB  
Article
Resilience of Chinese Ports to Tropical Cyclones: Operational Efficiency and Strategic Importance
by Mark Ching-Pong Poo, Wen Zhang, Leila Kamalian, Tianni Wang, Yui-yip Lau and Tina Ziting Xu
Climate 2024, 12(12), 214; https://doi.org/10.3390/cli12120214 - 9 Dec 2024
Cited by 3 | Viewed by 1717
Abstract
This study evaluated the resilience of five major Chinese ports—Shanghai, Tsingtao, Shenzhen, Xiamen, and Qinzhou—against the impacts of tropical cyclones. These ports, as integral global maritime supply chain nodes, face rising vulnerabilities from climate-related disruptions such as typhoons, sea-level rise, and extreme temperature [...] Read more.
This study evaluated the resilience of five major Chinese ports—Shanghai, Tsingtao, Shenzhen, Xiamen, and Qinzhou—against the impacts of tropical cyclones. These ports, as integral global maritime supply chain nodes, face rising vulnerabilities from climate-related disruptions such as typhoons, sea-level rise, and extreme temperature fluctuations. Employing a resilience assessment framework, this study integrated climate and operational data to gauge how cyclone-induced events affect port performance, infrastructure, and economic stability. Multi-centrality analysis and the Borda count method were applied to assess each port’s strategic importance and operational efficiency under cyclone exposure. The findings highlight variations in resilience across the ports, with Shanghai and Tsingtao showing heightened risk due to their critical roles within international logistics networks. This study suggests strategies like strengthening infrastructure, improving emergency responses, and adopting climate-resilient policies to make China’s ports more sustainable and resilient to climate threats. This research offers actionable insights for policymakers and port authorities, contributing to a more climate-resilient maritime logistics framework. Full article
Show Figures

Figure 1

13 pages, 865 KiB  
Article
The Role of Psychological Capital on Climate Change Adaptation Among Smallholder Farmers in the uMkhanyakude District of KwaZulu-Natal, South Africa
by Mbongeni Maziya, Lelethu Mdoda and Lungile Pearl Sindiswa Mvelase
Climate 2024, 12(12), 213; https://doi.org/10.3390/cli12120213 - 8 Dec 2024
Cited by 2 | Viewed by 1490
Abstract
Climate change and variability pose a challenge to the livelihoods of smallholder farmers. Previous studies on climate change in the context of smallholder farming have mainly focused on the influence of socio-economic factors in understanding farmers’ responses to climate change. However, little is [...] Read more.
Climate change and variability pose a challenge to the livelihoods of smallholder farmers. Previous studies on climate change in the context of smallholder farming have mainly focused on the influence of socio-economic factors in understanding farmers’ responses to climate change. However, little is known about the effect of psychological capital on climate change adaptation. There are calls for better empirical models and transdisciplinary approaches to understand the underlying drivers of climate change adaptation in smallholder farming systems. This study draws from behavioural decision research to assess psychological factors influencing climate change adaptation in the uMkhanyakude district of KwaZulu-Natal. This study adopted the Theory of Planned Behaviour to understand the effect of psychological capital on climate change adaptation. Data were collected from a sample of 400 smallholder farmers who were randomly selected from the uMkhanyakude district. Survey data were analysed using a multivariate probit regression model. The results of the multivariate probit regression model indicated that psychological capital (attitudes towards climate change, subjective norms, and trust) played an important role in influencing climate change adaptation. Climate change adaptation is also influenced by the gender of the farmer, education level, household size, and Tropical Livestock Units. These findings underscore the role of psychological capital in shaping climate change adaptation. This study recommends using transdisciplinary approaches (i.e., combining economics and psychology) in evaluating farmers’ responses to climate change. Full article
Show Figures

Figure 1

20 pages, 2850 KiB  
Article
Decoding Carbon Footprints: How U.S. Climate Zones Shape Building Emissions
by Ali Nouri and Ming Hu
Climate 2024, 12(12), 212; https://doi.org/10.3390/cli12120212 - 6 Dec 2024
Cited by 2 | Viewed by 1262
Abstract
The construction industry accounts for over 40% of carbon emissions in the United States, with embodied carbon—emissions associated with building materials and construction processes—remaining underexplored, particularly regarding the impact of location and climate. This study addresses this gap by investigating the influence of [...] Read more.
The construction industry accounts for over 40% of carbon emissions in the United States, with embodied carbon—emissions associated with building materials and construction processes—remaining underexplored, particularly regarding the impact of location and climate. This study addresses this gap by investigating the influence of different climate zones on the embodied carbon emissions of residential buildings. Using Building Information Modeling (BIM), 3D models were developed based on the 2021 International Energy Conservation Code (IECC) and International Residential Code (IRC). A lifecycle assessment (LCA) was conducted using Environmental Product Declarations (EPDs) to evaluate the embodied carbon of building materials during the product stage. The findings reveal that buildings in colder climates exhibit higher embodied carbon emissions, ranging from 25,768 kgCO2e in Zone 1 to 40,129 kgCO2e in Zone 8, due to increased insulation requirements. Exterior walls and roofs were identified as significant contributors, comprising up to 34% of total emissions. Sensitivity analysis further indicates that the window-to-wall ratio and interior wall design substantially affect embodied carbon, with baseline emissions around 170 kgCO2e/m2 in warm areas and 255 kgCO2e/m2 in cold areas. These results establish a baseline for lifecycle embodied carbon values across different climate zones in the United States and align with international standards. This study provides valuable insights for policymakers and designers, offering data to inform effective carbon reduction strategies and optimize building designs for sustainability. Full article
(This article belongs to the Section Climate and Environment)
Show Figures

Figure 1

24 pages, 6036 KiB  
Article
Projected Changes in Dry and Wet Spells over West Africa during Monsoon Season Using Markov Chain Approach
by Jules Basse, Moctar Camara, Ibrahima Diba and Arona Diedhiou
Climate 2024, 12(12), 211; https://doi.org/10.3390/cli12120211 - 6 Dec 2024
Cited by 1 | Viewed by 1192
Abstract
This study examines projected changes in dry and wet spell probabilities in West Africa during the July–August–September monsoon season using a Markov chain approach. Four simulations of regional climate models from the CORDEX-Africa program were used to analyze projected changes in intraseasonal variability. [...] Read more.
This study examines projected changes in dry and wet spell probabilities in West Africa during the July–August–September monsoon season using a Markov chain approach. Four simulations of regional climate models from the CORDEX-Africa program were used to analyze projected changes in intraseasonal variability. The results show an increase in the probability of having a dry day, a dry day preceding a wet day, and a dry day preceding a dry day, and a decrease in the probability of wet days in the Sahel region under anthropogenic forcing scenarios RCP4.5 and RCP8.5. The decrease in wet days is stronger in the far future and under the RCP8.5 scenario (up to −30%). The study also finds that the probability of consecutive dry days (lasting at least 7 days and 10 days) is expected to increase in western Sahel, central Sahel, and the Sudanian Area under both scenarios, with stronger increases in the RCP8.5 scenario. In contrast, a decrease is expected over the Guinea Coast, with the changes being more important under the RCP4.5. Dry spell probabilities increasing in the Sahel areas and in the northern Sudanian Area is linked to the increase in the very wet days (R95P) in the daily rainfall intensity index (SDII). These changes in dry and wet spell probabilities are important for water management decisions and risk reduction in the energy and agricultural sectors. This study also highlights the need for decision-makers to implement mitigation and adaptation policies to minimize the adverse effects of climate change. Full article
Show Figures

Figure 1

17 pages, 3385 KiB  
Article
Climatology and Long-Term Trends in Population Exposure to Urban Heat Stress Considering Variable Demographic and Thermo–Physiological Attributes
by Christos Giannaros, Elissavet Galanaki and Ilias Agathangelidis
Climate 2024, 12(12), 210; https://doi.org/10.3390/cli12120210 - 5 Dec 2024
Viewed by 1039
Abstract
Previous studies assessing population exposure to heat stress have focused primarily on environmental heat loads without accounting for variations in human thermo–physiological responses to heat. A novel 30-year (1991–2020) human thermal bioclimate dataset, consisting of hourly mPET (modified physiologically equivalent temperature) values for [...] Read more.
Previous studies assessing population exposure to heat stress have focused primarily on environmental heat loads without accounting for variations in human thermo–physiological responses to heat. A novel 30-year (1991–2020) human thermal bioclimate dataset, consisting of hourly mPET (modified physiologically equivalent temperature) values for diverse populations, was employed in the present study to assist in addressing this gap. Focusing on the Athens urban area (AUA), Greece, the climatology and long-term trends in acclimatization-based strong heat stress (accliSHS) experienced by average male and female adult and senior individuals during the warm period of the year (April–October) were investigated. Results showed that an average adult (senior) in AUA experienced, on average, approximately 13 (18) additional days with at least 1 h accliSHS in 2020 compared with 1991. The increasing rates per year were particularly pronounced for days with ≥6 h accliSHS, indicating a rise in the daily duration of heat stress in AUA from 1991 to 2020. Combining the variations in climate and demographics in AUA during the examined 30-year period, the long-term trends in ≥1 h accliSHS exposure for the study population types were further examined. This analysis revealed that seniors’ exposure to ≥1 h accliSHS in AUA increased by up to +153,000 person-days × year−1 from 1991 to 2020. Increasing population aging was the main driver of this outcome, highlighting the urgent need for heat–health action planning in Greece. Full article
Show Figures

Figure 1

19 pages, 3282 KiB  
Article
A Novel Index for Agricultural Drought Measurement: Soil Moisture and Evapotranspiration Revealed Drought Index (SERDI)
by Hushiar Hamarash, Azad Rasul and Rahel Hamad
Climate 2024, 12(12), 209; https://doi.org/10.3390/cli12120209 - 5 Dec 2024
Viewed by 1998
Abstract
Droughts are common across various climates, typically caused by prolonged decreases in rainfall. Several factors contribute to drought, including the temperature, wind speed, and relative humidity and the timing, amount, and intensity of rainfall during the growing season. This study introduces the Soil [...] Read more.
Droughts are common across various climates, typically caused by prolonged decreases in rainfall. Several factors contribute to drought, including the temperature, wind speed, and relative humidity and the timing, amount, and intensity of rainfall during the growing season. This study introduces the Soil Moisture and Evapotranspiration Revealed Drought Index (SERDI), a new index that combines soil moisture and evapotranspiration (calculated using the Penman–Monteith method) to enhance drought early warning systems. To validate the SERDI, we compared it with other established indices such as the Land Surface Temperature (LST), Vegetation Health Index (VHI), Normalized Difference Vegetation Index (NDVI), and Normalized Difference Water Index (NDWI), using metrics like the R-squared (R2), root mean square error (RMSE), mean absolute percentage error (MAPE), and p-value to assess the accuracy, data variability, and forecast conditions. The results showed a low RMSE and high R2 between the SERDI and the LST and VHI, indicating a strong correlation. However, weaker correlations were observed between the SERDI and NDVI/NDWI, as shown by the lower R2 and higher RMSE values in semi-arid areas. Regions across Iran, Iraq, Syria, Jordan, and Israel experienced mostly moderate to severe drought conditions, with a few areas in Iran and Syria showing normal conditions. The SERDI’s strong correlation with the LST and moderate correlation with the VHI can be attributed to the direct influence of the soil moisture and evapotranspiration on the surface temperature and vegetation health. On the other hand, the weaker correlation with the NDVI and NDWI is due to variability in the vegetation response, irrigation practices, and regional differences. This study concludes that the SERDI is an effective tool for the detection of drought based on soil moisture and evapotranspiration. Full article
Show Figures

Figure 1

18 pages, 5713 KiB  
Article
Comparative Trend Analysis of Precipitation Indices in Several Towns of the Sirba River Catchment (Burkina Faso) from CHIRPS and TAMSAT Rainfall Estimates
by Giorgio Cannella, Alessandro Pezzoli and Maurizio Tiepolo
Climate 2024, 12(12), 208; https://doi.org/10.3390/cli12120208 - 4 Dec 2024
Cited by 1 | Viewed by 1136
Abstract
The increasingly frequent pluvial flood of West African urban settlements indicates the need to investigate the drivers of local rainfall changes. However, meteorological stations are few, unevenly distributed, and work irregularly. Daily satellite rainfall datasets can be used. Nevertheless, these products often need [...] Read more.
The increasingly frequent pluvial flood of West African urban settlements indicates the need to investigate the drivers of local rainfall changes. However, meteorological stations are few, unevenly distributed, and work irregularly. Daily satellite rainfall datasets can be used. Nevertheless, these products often need to be more accurate due to sensor errors and limitations in retrieval algorithms. The problem is, therefore, how to characterize rainfall where there is a need for ground-based rainfall records or incomplete series. This study aims to characterize urban rainfall using two satellite datasets. The analysis was carried out in the Sirba river catchment, Burkina Faso, using the Climate Hazards Group InfraRed Precipitation with Station data (CHIRPS) and the Tropical Applications of Meteorology using SATellite and ground-based data (TAMSAT) datasets. Ten indices from the Expert Team on Climate Change Detection and Indices (ETCCDI) of precipitation were calculated, and their statistical trends were evaluated from 1983 to 2023. The study introduces two key innovations: a comparative analysis of precipitation trends using two satellite datasets and applying this analysis to towns within a previously understudied 39,138 km2 catchment area that is frequently flooded. Both datasets agree on the increase of (i) annual cumulative rainfall over all towns, (ii) five-day maximum rainfall over the town of Manni, (iii) rainfall due to very wet days in Gayéri, (iv) days of heavy rainfall in Bogandé, Manni and Yalgho, and (v) days of very heavy rainfall in Yalgho. These findings suggest the need for targeted pluvial flood prevention measures in towns with increasing trends in heavy rainfall. Full article
(This article belongs to the Special Issue Advances of Flood Risk Assessment and Management)
Show Figures

Figure 1

18 pages, 1469 KiB  
Systematic Review
Leadership and Climate Change Mitigation: A Systematic Literature Review
by Corey McPherson and Amelia Clarke
Climate 2024, 12(12), 207; https://doi.org/10.3390/cli12120207 - 3 Dec 2024
Cited by 1 | Viewed by 2750
Abstract
This systematic literature review (SLR) explores leadership and climate change mitigation in cities. In doing so, it investigates explicit meanings of leadership, enablers of leadership, and leadership similarities and differences across regions. The review utilized three databases on 8 March 2024—Scopus, ProQuest, and [...] Read more.
This systematic literature review (SLR) explores leadership and climate change mitigation in cities. In doing so, it investigates explicit meanings of leadership, enablers of leadership, and leadership similarities and differences across regions. The review utilized three databases on 8 March 2024—Scopus, ProQuest, and Web of Science—curating an initial 496 results, resulting in 30 studies in the final analysis, using a two-reviewer screening process to limit bias and ensure consistency of approach. Inclusion criteria included English-language peer-reviewed articles over a ten-year period. The timeframe used was limited to January 2014 to December 2023 (10 years) to focus on the lead up to and post-implementation of the Paris Agreement. Further, empirical and conceptual studies were included to provide readers of this review with a thorough understanding of leadership work completed since 2014. Exclusion criteria included any studies that focus on adaptation measures and forms of leadership where the focus is on the private business, state, or national level, including leadership and climate change mitigation outside the influence of the local government. The study highlights five distinct meanings of leadership using the Braun and Clarke method of thematic analysis. It found leadership themes related to people (e.g., mayors), policy (e.g., ambitious climate plans), ideas (e.g., new concepts), collective action (e.g., motivating others), and mobilizing power (e.g., through regulations). The enablers of leadership included polycentricity, social capital influences, co-creational and mayor leadership, climate governance, and multi-actor coordination. This review segments the studies based on the findings from the literature, which focus on three continents (North America, Europe, and Asia) with a distinct difference in the meaning and enablers of leadership based on region. The 30 articles shared similarities in content, such as strong mayoral influence, but also had some distinct differences, such as how leadership is enacted based on leveraging market mechanisms, policy, and horizontal and vertical coordination. Finally, research gaps were identified, such as the scant focus on leadership and climate change mitigation in the Global South, to enable future research. Limitations of this study include the utilization of three databases, a focus on only English-language peer-reviewed articles, and a strong climate change mitigation focus. Full article
Show Figures

Figure 1

23 pages, 3843 KiB  
Article
A Deeper Understanding of Climate Variability Improves Mitigation Efforts, Climate Services, Food Security, and Development Initiatives in Sub-Saharan Africa
by Shamseddin M. Ahmed, Hassan A. Dinnar, Adam E. Ahmed, Azharia A. Elbushra and Khalid G. Biro Turk
Climate 2024, 12(12), 206; https://doi.org/10.3390/cli12120206 - 2 Dec 2024
Cited by 1 | Viewed by 1391
Abstract
This research utilized the bagging machine learning algorithm along with the Thornthwaite moisture index (TMI) to enhance the understanding of climate variability and change, with the objective of identifying the most efficient climate service pathways in Sub-Saharan Africa (SSA). Monthly datasets at a [...] Read more.
This research utilized the bagging machine learning algorithm along with the Thornthwaite moisture index (TMI) to enhance the understanding of climate variability and change, with the objective of identifying the most efficient climate service pathways in Sub-Saharan Africa (SSA). Monthly datasets at a 0.5° resolution (1960–2020) were collected and analyzed using R 4.2.2 software and spreadsheets. The results indicate significant changes in climatic conditions in Sudan, with aridity escalation at a rate of 0.37% per year. The bagging algorithm illustrated that actual water use was mainly influenced by rainfall and runoff management, showing an inverse relationship with increasing air temperatures. Consequently, sustainable strategies focusing on runoff and temperature control, such as rainwater harvesting, agroforestry and plant breeding were identified as the most effective climate services to mitigate and adapt to climate variability in SSA. The findings suggest that runoff management (e.g., rainwater harvesting) could potentially offset up to 22% of the adverse impacts of climate variability, while temperature control strategies (e.g., agroforestry) could account for the remaining 78%. Without these interventions, climate variability will continue to pose serious challenges to food security, livelihood generations, and regional stability. The research calls for further in-depth studies on the attributions of climate variability using finer datasets. Full article
Show Figures

Figure 1

23 pages, 7393 KiB  
Article
Methodology for Obtaining ETo Data for Climate Change Studies: Quality Analysis and Calibration of the Hargreaves–Samani Equation
by Antónia Ferreira, Maria do Rosário Cameira and João Rolim
Climate 2024, 12(12), 205; https://doi.org/10.3390/cli12120205 - 2 Dec 2024
Cited by 1 | Viewed by 1322
Abstract
Reference evapotranspiration (ETo) is an important part of the water cycle, essential for climate studies, water resource management, and agricultural planning. However, accurate estimation of ETo is challenging when meteorological data are insufficient or of low quality. Furthermore, in climate [...] Read more.
Reference evapotranspiration (ETo) is an important part of the water cycle, essential for climate studies, water resource management, and agricultural planning. However, accurate estimation of ETo is challenging when meteorological data are insufficient or of low quality. Furthermore, in climate change studies where large amounts of data need to be managed, it is important to minimize the complexity of the ETo calculation. This study presents a comprehensive approach that integrates data quality analysis with two calibration methods—annual and cluster-based—to improve ETo estimates based solely on temperature data from a set of weather stations (WS). First, the quality and integrity of meteorological data from several WS were analyzed to reduce uncertainty. Second, the Hargreaves–Samani equation (HS) is site calibrated using two approaches: (a) annual calibration, where the radiation coefficient (kRs) is adjusted using a data set covering the entire year; (b) cluster-based calibration, where independent radiation coefficients are adjusted for clusters of years and months. The methodology was evaluated for the Alentejo region in Southern Portugal, using data from 1996 to 2023. When using the original HS equation with a kRs = 0.17 °C−0.5, ETo was estimated with errors from 14.9% to 22.9% with bias ranging from −9.0% to 8.8%. The annual calibration resulted in kRs values between 0.157 and 0.165 °C−0.5 with estimation errors between 13.3% and 20.6% and bias ranging from −1.5% to 1.0% across the different weather stations. Calibration based on clusters of months and years produced unclear results. Dry season months showed better results using cluster-based calibration, while wet season months performed poorly regardless of the calibration approach. The results highlight the importance of meteorological data quality and site-specific calibration for refining temperature-based ETo estimation methods, and for the region studied, the gains do not justify the increased complexity of the cluster-based approach. Full article
Show Figures

Figure 1

13 pages, 408 KiB  
Article
It Is Normal: The Probability Distribution of Temperature Extremes
by Nir Y. Krakauer
Climate 2024, 12(12), 204; https://doi.org/10.3390/cli12120204 - 2 Dec 2024
Cited by 1 | Viewed by 2130
Abstract
The probability of heat extremes is often estimated using the non-stationary generalized extreme value distribution (GEVD) applied to time series of annual maximum temperature. Here, this practice was assessed using a global sample of temperature time series, from reanalysis (both at the grid [...] Read more.
The probability of heat extremes is often estimated using the non-stationary generalized extreme value distribution (GEVD) applied to time series of annual maximum temperature. Here, this practice was assessed using a global sample of temperature time series, from reanalysis (both at the grid point and the region scale) as well as station observations. This assessment used forecast negative log-likelihood as the main performance measure, which is particularly sensitive to the most extreme heat waves. It was found that the computationally simpler normal distribution outperforms the GEVD in providing probabilistic year-ahead forecasts of temperature extremes. Given these findings, it is suggested to consider alternatives to the GEVD for assessing the risk of extreme heat. Full article
(This article belongs to the Special Issue Extreme Weather Detection, Attribution and Adaptation Design)
Show Figures

Figure 1

19 pages, 444 KiB  
Review
Rethinking Climate Justice: Insights from Environmental Sociology
by Md Saidul Islam
Climate 2024, 12(12), 203; https://doi.org/10.3390/cli12120203 - 2 Dec 2024
Viewed by 4328
Abstract
This paper reexamines climate justice through the framework of environmental sociology, offering fresh perspectives on the intersection of social and ecological systems in the face of escalating global climate crises. It emphasizes that inequality lies at the heart of global climate politics, often [...] Read more.
This paper reexamines climate justice through the framework of environmental sociology, offering fresh perspectives on the intersection of social and ecological systems in the face of escalating global climate crises. It emphasizes that inequality lies at the heart of global climate politics, often obstructing pathways toward achieving a true climate solution. Drawing from established traditions within environmental sociology—such as the new ecological paradigm, the post-growth society, and the environmental justice paradigm—the paper advocates for profound systemic and structural reforms in political and economic systems to tackle entrenched inequalities. By integrating these frameworks, the paper proposes a comprehensive model of climate justice, encompassing material, procedural, compensatory, and transformative dimensions of justice. This holistic approach not only addresses environmental sustainability but also prioritizes social equity, ensuring that marginalized communities are included in the global response to climate change. The paper thus positions this model as a critical component of broader environmental and social transformation. Full article
Show Figures

Figure 1

14 pages, 542 KiB  
Article
Socio-Demographic Determinants of Climate-Smart Agriculture Adoption Among Smallholder Crop Producers in Bushbuckridge, Mpumalanga Province of South Africa
by Variety Nkateko Thabane, Isaac Azikiwe Agholor, Moses Zakhele Sithole, Mishal Trevor Morepje, Nomzamo Sharon Msweli and Lethu Inneth Mgwenya
Climate 2024, 12(12), 202; https://doi.org/10.3390/cli12120202 - 29 Nov 2024
Cited by 3 | Viewed by 1680
Abstract
Climate-smart agriculture (CSA) is a transformative approach to farming that aims to meet the demands of increasing food production under the growing pressures of climate change. CSA’s goals are to boost agricultural productivity, enhance resilience to climate impacts, and reduce greenhouse gas emissions. [...] Read more.
Climate-smart agriculture (CSA) is a transformative approach to farming that aims to meet the demands of increasing food production under the growing pressures of climate change. CSA’s goals are to boost agricultural productivity, enhance resilience to climate impacts, and reduce greenhouse gas emissions. Thus, the study explored farmers’ socio-demographic factors influencing the adoption of CSA in sustainable crop production. The study was carried out in Bushbuckridge, Mpumalanga province of South Africa, with a focus on smallholder crop producers in the area. The study surveyed 300 smallholder farmers and employed simple random sampling, structured questionnaires, and a binary logistic regression model for data analysis. The significant and positive socio-demographic variables relevant to the adoption of climate-smart practices were level of education (p < 0.014), household size (p < 0.007), farm experience (p < 0.053), and farmland fertility (p < 0.047). Therefore, for CSA practices to be adopted by smallholder crop producers, a targeted approach is needed to address this issue. Therefore, support and training are needed to bridge the literacy gap among smallholder crop producers with the overall aim of improving their understanding of climate change and CSA practices that can mitigate the effects of climate change. Full article
Show Figures

Figure 1

22 pages, 810 KiB  
Article
Assessing the Role of Climate Transition Bonds in Advancing Green Transformations in Japan
by Zhiying Zhao, Rong Huang, Yanwu Zhang, Yuki Shiga and Rajib Shaw
Climate 2024, 12(12), 201; https://doi.org/10.3390/cli12120201 - 27 Nov 2024
Cited by 1 | Viewed by 1377
Abstract
This study investigates the potential of Climate Transition Bonds as strategic financial instruments in promoting green transformations within Japan’s carbon-intensive sectors. Through a qualitative case study approach, we assess four prominent bond issuances—Japan Government Bonds, MUFG Bonds, TEPCO Bonds, and SMBC Bonds—focusing on [...] Read more.
This study investigates the potential of Climate Transition Bonds as strategic financial instruments in promoting green transformations within Japan’s carbon-intensive sectors. Through a qualitative case study approach, we assess four prominent bond issuances—Japan Government Bonds, MUFG Bonds, TEPCO Bonds, and SMBC Bonds—focusing on their contributions to emissions reduction, renewable energy expansion, and technological innovation. The analysis reveals that these bonds play a pivotal role in enabling Japan to advance its carbon neutrality goals by financing key decarbonization projects. However, significant challenges persist, including the limited scalability of emerging technologies, disparities in economic benefits across sectors, and governance inefficiencies that may hinder optimal outcomes. The findings underscore the necessity of refining collaborative governance frameworks to enhance transparency, stakeholder inclusivity and regulatory oversight in the deployment of these bonds. This paper contributes to the discourse on sustainable finance by elucidating the policy implications of climate transition bonds, proposing avenues for improved governance, and highlighting the structural adjustments required to align these financial mechanisms with Japan’s long-term sustainability objectives. Full article
Show Figures

Figure 1

14 pages, 3628 KiB  
Article
Estimation and Validation of Snowmelt Runoff Using Degree Day Method in Northwestern Himalayas
by Sunita, Vishakha Sood, Sartajvir Singh, Pardeep Kumar Gupta, Hemendra Singh Gusain, Reet Kamal Tiwari, Varun Khajuria and Daljit Singh
Climate 2024, 12(12), 200; https://doi.org/10.3390/cli12120200 - 26 Nov 2024
Viewed by 1065
Abstract
The rivers of the Himalayas heavily rely on the abundance of snow, which serves as a vital source of water to South Asian countries. However, its impact on the hydrological system of the region is mainly felt during the spring season. The melting [...] Read more.
The rivers of the Himalayas heavily rely on the abundance of snow, which serves as a vital source of water to South Asian countries. However, its impact on the hydrological system of the region is mainly felt during the spring season. The melting of snow and consequent base flow significantly contribute to the incoming streamflow. This article examines the evaluation of the proportionate contribution to the total streamflow of Beas River up to Pandoh Dam through the snow melt. To analyze the snow melt, the snowmelt runoff model (SRM) has been utilized via dividing the study area into seven different elevation zones within a range of 853–6582 m and computing the percentage of snow cover, ranging from 15% to 90% across the basin. To validate the accuracy of the model, several metrics, such as coefficient of determination (R2) and volume difference (VD), are utilized. The R2 reveals that over the span of ten years, the daily discharge simulations exhibited efficiency levels ranging from 0.704 to 0.795, with VD falling within the range of 1.47% to 20.68%. This study has revealed that a significant amount of streamflow originates during the summer and monsoon periods, with snowmelt ranging from 10% to 45%. This research provides crucial understanding of the impact of snowmelt on streamflow, supplying essential knowledge on freshwater supply in the area. Full article
Show Figures

Figure 1

16 pages, 6035 KiB  
Article
CO2 Emission from Caves by Temperature-Driven Air Circulation—Insights from Samograd Cave, Croatia
by Nenad Buzjak, Franci Gabrovšek, Aurel Perșoiu, Christos Pennos, Dalibor Paar and Neven Bočić
Climate 2024, 12(12), 199; https://doi.org/10.3390/cli12120199 - 26 Nov 2024
Viewed by 1795
Abstract
Opposite to atmospheric CO2 concentrations, which reach a minimum during the vegetation season (e.g., June–August in the Northern Hemisphere), soil CO2 reaches a maximum in the same period due to the root respiration. In karst areas, characterized by high rock porosity, [...] Read more.
Opposite to atmospheric CO2 concentrations, which reach a minimum during the vegetation season (e.g., June–August in the Northern Hemisphere), soil CO2 reaches a maximum in the same period due to the root respiration. In karst areas, characterized by high rock porosity, this excess CO2 seeps inside caves, locally increasing pCO2 values above 1%. To better understand the role of karst areas in the carbon cycle, it is essential to understand the mechanisms of CO2 dynamics in such regions. In this study, we present and discuss the spatial and temporal variability of air temperature and CO2 concentrations in Samograd Cave, Croatia, based on three years of monthly spot measurements. The cave consists of a single descending passage, resulting in a characteristic bimodal climate, with stable conditions during summer (i.e., stagnant air inside the cave) and a strong convective cell bringing in cold air during winter. This bimodality is reflected in both CO2 concentrations and air temperatures. In summer, the exchange of air through the cave’s main entrance is negligible, allowing the temperature and CO2 concentration to equilibrate with the surrounding rocks, resulting in high in-cave CO2 concentrations, sourced from enhanced root respiration. During cold periods, CO2 concentrations are low due to frequent intrusions of fresh external air, which effectively flush out CO2 from the cave. Both parameters show distinct spatial variability, highlighting the role of cave morphology in their dynamics. The CO2 concentrations and temperatures have increased over the observation period, in line with external changes. Our results highlight the role of caves in transferring large amounts of CO2 from soil to the atmosphere via caves, a process that could have a large impact on the global atmospheric CO2 budget, and thus, call for a more in-depth study of these mechanisms. Full article
Show Figures

Figure 1

20 pages, 5402 KiB  
Article
Estimating Surface Urban Heat Island Effects of Abeokuta Within the Context of Its Economic Development Cluster in Ogun State Nigeria: A Baseline Study Utilising Remote Sensing and Cloud-Based Computing Technologies
by Oluwafemi Michael Odunsi and Andreas Rienow
Climate 2024, 12(12), 198; https://doi.org/10.3390/cli12120198 - 26 Nov 2024
Cited by 3 | Viewed by 1749
Abstract
The demands for growth and prosperity in developing countries have prompted Ogun State to initiate six economic development clusters oriented around its urban areas. However, little attention has been given to the environmental impact of these clusters in relation to temperature change and [...] Read more.
The demands for growth and prosperity in developing countries have prompted Ogun State to initiate six economic development clusters oriented around its urban areas. However, little attention has been given to the environmental impact of these clusters in relation to temperature change and thermal consequences. Serving as a baseline study for the Abeokuta Cluster, whose implementation is still ongoing, this study analysed the surface urban heat island (SUHI) effects for 2003, 2013, and 2023 to determine whether variations in these effects exist over time. The study utilised satellite imagery from Landsat sensors and the cloud computing power of Google Earth Engine for data collection and analysis. Findings revealed that Abeokuta City experienced varying degrees of high SUHI effects, while the surrounding areas proposed for residential and industrial development in the Abeokuta Cluster showed low SUHI effects. The differences in SUHI effects within Abeokuta City across the years were found to be statistically significant (Fwithin = 3.158, p = 0.044; Fbetween = 5.065, p = 0.025), though this was not the case for the Abeokuta cluster as a whole. This study recommends urban planning strategies and policy interventions to combat SUHI effects in Abeokuta City, along with precautionary measures for the Abeokuta Cluster. Full article
(This article belongs to the Section Climate and Environment)
Show Figures

Figure 1

Previous Issue
Next Issue
Back to TopTop