Article

Decoding Carbon Footprints: How U.S. Climate Zones Shape Building Emissions

1
Department of Civil and Environmental Engineering and Earth Sciences, College of Engineering, University of Notre Dame, Notre Dame, IN 46556, USA
2
School of Architecture, University of Notre Dame, Notre Dame, IN 46556, USA
*
Author to whom correspondence should be addressed.
Climate 2024, 12(12), 212; https://doi.org/10.3390/cli12120212
Submission received: 10 November 2024 / Revised: 2 December 2024 / Accepted: 3 December 2024 / Published: 6 December 2024
(This article belongs to the Section Climate and Environment)

Abstract

The construction industry accounts for over 40% of carbon emissions in the United States, with embodied carbon—emissions associated with building materials and construction processes—remaining underexplored, particularly regarding the impact of location and climate. This study addresses this gap by investigating the influence of different climate zones on the embodied carbon emissions of residential buildings. Using Building Information Modeling (BIM), 3D models were developed based on the 2021 International Energy Conservation Code (IECC) and International Residential Code (IRC). A lifecycle assessment (LCA) was conducted using Environmental Product Declarations (EPDs) to evaluate the embodied carbon of building materials during the product stage. The findings reveal that buildings in colder climates exhibit higher embodied carbon emissions, ranging from 25,768 kgCO2e in Zone 1 to 40,129 kgCO2e in Zone 8, due to increased insulation requirements. Exterior walls and roofs were identified as significant contributors, comprising up to 34% of total emissions. Sensitivity analysis further indicates that the window-to-wall ratio and interior wall design substantially affect embodied carbon, with baseline emissions around 170 kgCO2e/m2 in warm areas and 255 kgCO2e/m2 in cold areas. These results establish a baseline for lifecycle embodied carbon values across different climate zones in the United States and align with international standards. This study provides valuable insights for policymakers and designers, offering data to inform effective carbon reduction strategies and optimize building designs for sustainability.

1. Background

The construction industry significantly contributes to global carbon emissions. In the United States, more than 40% of carbon emissions are attributed to this industry [1]. Previous studies showed that using different methods and materials can reduce CO2 emissions from construction and building operations by up to 90% [2]. Given the remarkable environmental impact of the construction industry, many studies have focused on operational and embodied carbon emissions of construction projects during their lifecycle, as well as the factors and methods to control and reduce these emissions [3,4,5,6]. Achieving energy-efficient and net-zero carbon buildings requires considerable attention to assess the impact of these factors on operational and embodied lifecycle carbon emissions.
Location significantly affects a building’s operational energy consumption and related carbon emissions. Studies show that the geographical location of buildings plays a crucial role in determining energy usage. For instance, buildings in different regions experience varied impacts of climate on heating and cooling energy use [7]. Relocating a building to Montreal resulted in a 39% reduction in energy consumption compared to the same building constructed in Vancouver [8]. The type of building and its location significantly influence energy consumption patterns. Residential building energy consumption depends on factors such as size, architectural design, and climate conditions [9].
Unlike the well-studied area of operational carbon, the understanding of embodied carbon and its variations due to location and climate is still evolving. Embodied carbon encompasses the greenhouse gas emissions linked to the extraction, production, transport, installation, upkeep, dismantling, and disposal of materials throughout a building’s lifecycle [10,11,12,13]. Recent studies indicate that as operational carbon decreases due to energy performance regulations, the share of embodied carbon may rise from the current 20–25% of lifecycle carbon emissions to 45–50% for highly energy-efficient buildings, and even surpass 90% in extreme cases, such as net-zero energy buildings [14,15].
To create effective policies and regulations for reducing embodied carbon emissions, it is crucial to understand the impact of location and climate conditions on embodied carbon. Additionally, establishing accurate baselines is critical for assessing the effectiveness of carbon reduction efforts and guiding the transformation toward a more sustainable built environment [16]. This study addresses this gap by conducting a lifecycle assessment to answer four research questions: (1) Do different climate zone conditions impact building lifecycle embodied carbon? (2) Which building components significantly affect the variation in embodied carbon? (3) What are the baseline lifecycle embodied carbon values for different climate zones? (4) How does the United States baseline compare to other countries? To address these inquiries, a structured research flow was devised to delineate the properties of the building prototypes and to create three-dimensional models for the quantification of materials. Subsequently, the product stage lifecycle assessment methodology was employed to evaluate the environmental impacts of buildings across various climate zones. Following this, statistical analysis was applied to establish a baseline for the assessment and comparison of building emissions.

2. Literature Review

2.1. Embodied and Operational Carbon Emissions of Buildings

According to previous studies, the construction industry plays an important role in greenhouse gas emissions and energy consumption. Carbon emissions, as a crucial subset of greenhouse gas emissions, need to be evaluated, controlled, and minimized to achieve sustainable development goals. Identifying the various types of carbon emissions, along with the processes and related sources throughout the lifecycle of construction projects, is a fundamental step in evaluating and controlling these emissions. Consequently, a plethora of research investigates various aspects of embodied and operational emissions throughout the lifecycle of construction projects [17,18]. Previous studies revealed that operational carbon represented 90% of the total lifecycle carbon, while embodied carbon accounted for 10%. They proposed a simulation model considering 16 envelope variables during the 20-year operation of a typical house to examine the effects of these variables. The results showed that the window-to-wall ratio (WWR) had the highest impact on operational carbon emissions. Additionally, the efficient block wall with marble contains 10.7% more embodied carbon compared to the base case [3].
In 2023, Gauch et al. conducted a comprehensive study to analyze a large set of design parameters that identify the sensitivity of operational heating and cooling loads, embodied carbon, and construction costs in multi-story residential and office buildings. Among the different design variables, they found that building compactness, using steel or timber instead of concrete frames, lowering the window-to-wall ratio, choosing the most suitable glazing, and employing mechanical ventilation with heat recovery are the most important measures to decrease embodied emissions. Although they analyzed the sensitivity of heating and cooling loads to design variables for different climates, they did not consider national differences in embodied carbon [19]. The study conducted by Fereidoni et al. in 2023 involved a parametric analysis using an Artificial Neural Network (ANN) to determine the effects of envelope design variables on the embodied and operational energy of a single-story residential building. According to Fereidoni’s results, an increase in the glazing ratio of the building will lead to higher total energy consumption, and selecting appropriate thermal insulation can result in a 4.4% reduction in total energy consumption [20].
In recent years, many researchers have focused specifically on building wall assembly and its impact on reducing embodied and operational carbon emissions. Many research studies have indicated that although improving the insulation level of wall systems will enhance the energy efficiency of buildings and reduce operational carbon emissions, embodied emissions will be increased due to more used materials in wall assembly [21,22,23]. In 2016, Rodrigues and Freire conducted a study to examine the thickness of thermal insulation to find the optimum insulation thickness for exterior walls and roofs and its impact on embodied and operational carbon emission for two different types of buildings. Their research has illustrated that embodied emissions account for 26–57% of the total lifecycle impact of a family-house building, and thermal insulation has no meaningful impact on operational impact for a thickness of more than 80 mm [24]. Their study validated that additional insulation causes increased embodied impacts, with no significant decrease in operational impacts, potentially resulting in higher overall lifecycle impacts. Mahlan et al. proposed an integrated process-based lifecycle assessment and energy simulation methodology to compare the wall system of residential buildings in two different countries, namely Australia and India [23].

2.2. Embodied Carbon Evaluation by BIM

In recent years, many studies have emphasized the application and significance of Building Information Modeling (BIM) in the sustainability of the construction industry [25]. BIM provides several tools that support sustainability and decision-making in construction projects. Features such as detailed visualization, clash detection, and scheduling enhance the efficiency of construction processes while minimizing waste and resource use [26,27,28]. Storing graphical information and data about building components and materials in a virtual environment makes BIM a valuable tool in integration with lifecycle assessment methodologies [29]. There are various approaches regarding the integration of LCA within the BIM environment that have been highlighted and categorized by previous studies [30,31]. In this context, BIM can be utilized to determine material quantities and export the result into third-party LCA software [32,33]. Additionally, BIM can provide a platform to develop plugins to perform LCA analysis directly within the BIM application. Tally is a prominent example of BIM and LCA integration that assesses the environmental impacts of building materials based on LCA methods by developing a plugin in Autodesk Revit [34].
A range of studies has explored the use of Building Information Modeling (BIM) for evaluating the embodied carbon of buildings. Research has demonstrated that BIM can be integrated with lifecycle assessment (LCA) tools to evaluate the embodied carbon of various structural materials and design options [35,36]. A study by Xu et al. in 2022 showed the advantages of the integration of BIM and LCA in assessing the embodied carbon of prefabricated buildings. They achieved a significant time reduction and around 90% efficiency improvement in the LCA process by enhancing the level of automation using BIM [37]. Mohamed (2023) proposed a parametric framework for automating embodied and operational carbon calculations within the BIM environment, aiming to enhance early decision-making. In their study, they developed a decision-making module to optimize the LCA and Data Envelopment Analysis by using Non-dominated Sorting Genetic Algorithm II [38]. Lee (2015) developed a green template for evaluating the embodied environmental impact of buildings using BIM, with a focus on substances discharged from concrete production. A BIM-based model was developed by Iddon and Firth in 2013 to estimate the embodied and operational carbon of a four-bedroom house for four construction scenarios in the UK. The results showed that operational carbon represents 74–80% of the total emissions of the building over a 60-year lifespan. Additionally, the significance of embodied carbon will become greater, as when operational carbon is reduced, the embodied carbon will increase as a proportion of the total life CO2e [39]. These studies collectively highlight the potential of BIM for improving the evaluation of embodied carbon in buildings.
Despite the potential benefits of integrating BIM and LCA from the onset of design, significant challenges remain. Data reliability is paramount, as the accuracy of LCA outcomes heavily relies on the completeness and quality of the information sourced from the BIM model [40]. In addition to the content provided by the BIM model, such as material quantities, further information is necessary for a thorough LCA analysis [31]. Consequently, methodologies must address inconsistencies and inaccuracies in data to ensure reliable assessments [41]. Furthermore, interoperability represents a major hurdle in integrating BIM with LCA [42]. The lack of standardized data formats and compatibility across different software applications hinders the efficient transfer of information needed for effective LCA [43,44]. Previous studies have shown that data and information can be lost during the conversion from BIM to external LCA software [45]. Lastly, many investigations have focused on a limited set of building components, resulting in incomplete evaluations. This limitation often leads to an underestimation of the total environmental impact of structures [46].

3. Methodology and Materials
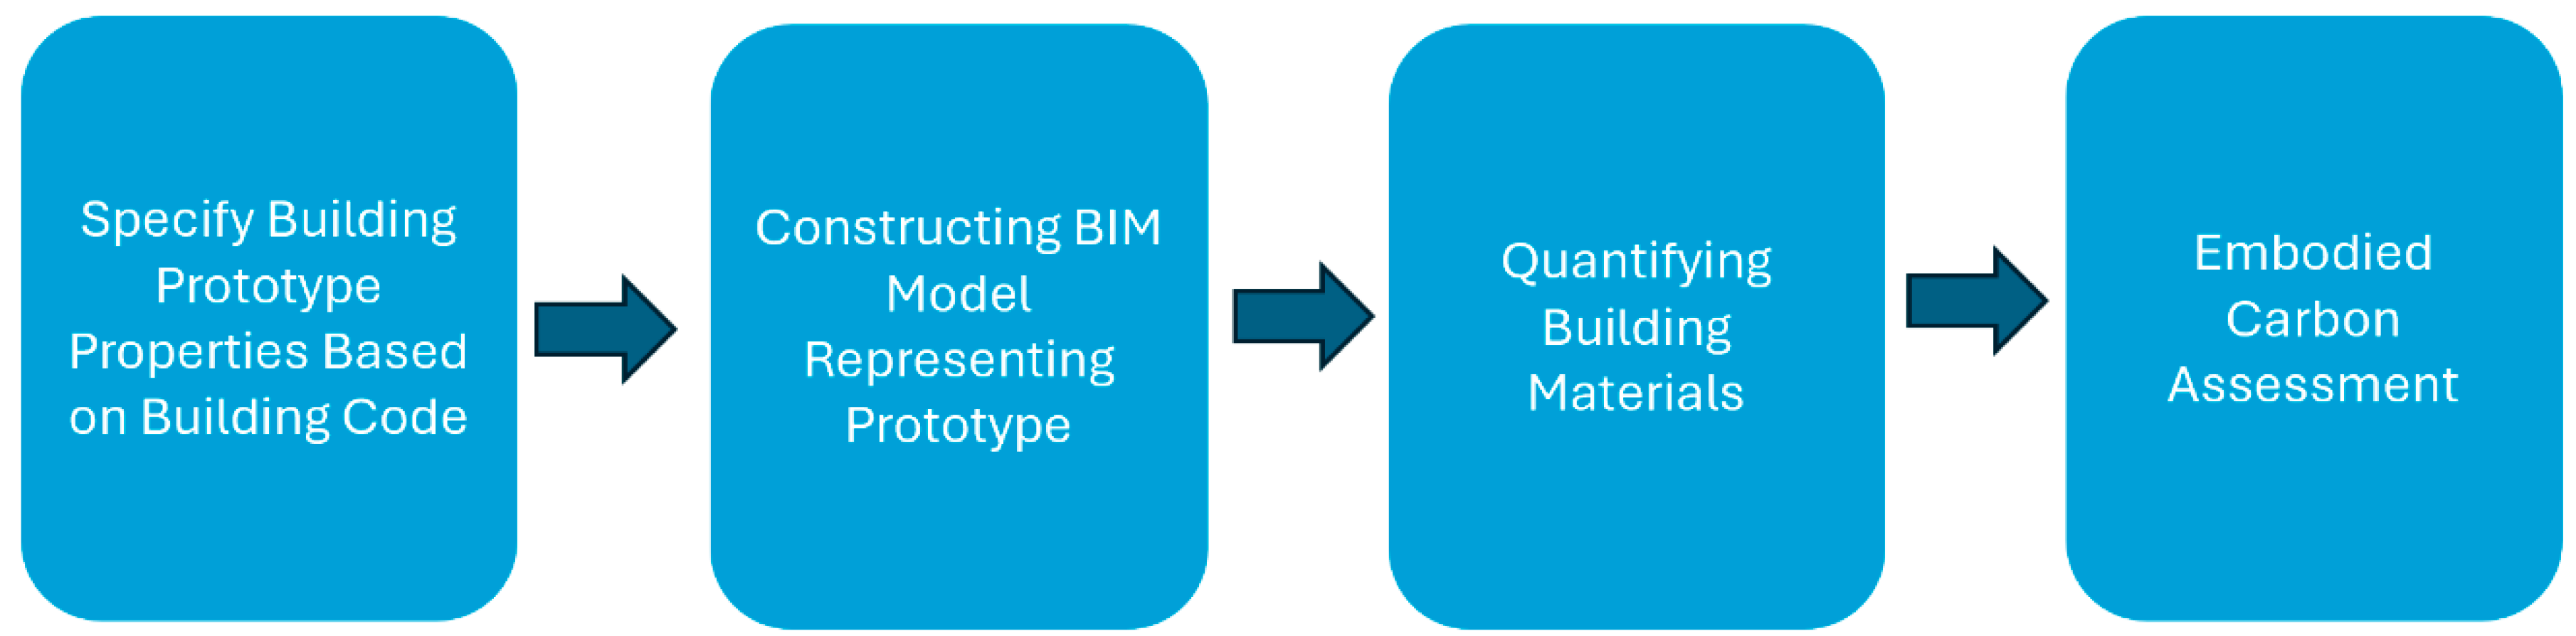
3.1. Research Flow

In this study, as illustrated in Figure 1, assessing the embodied carbon of residential buildings in different climate zones involves four main steps.
The first step of this study involves specifying the building components and assemblies used in prototype buildings within each climate zone. These prototype buildings are designed in accordance with the 2021 International Energy Conservation Code (IECC) and the 2021 International Residential Code (IRC) requirements [47]. The 2021 IECC, the most up-to-date building energy code for both commercial and residential buildings, represents significant energy efficiency gains compared to its previous version. Additionally, the IECC serves as the industry standard and forms the basis for laws and regulations throughout the United States. The 2021 IRC was established to provide a thorough and unified set of regulations specifically for the construction of single-family homes, duplexes, and multi-unit townhouse buildings. By focusing exclusively on residential construction, the IRC simplifies the regulatory process, allowing users to avoid sifting through unrelated code provisions. The IRC comprehensively addresses all aspects of residential buildings, including structural elements, fireplaces, chimneys, thermal insulation, mechanical systems, fuel gas systems, plumbing, and electrical systems. This ensures that all relevant components are covered under a single code [48]. The building components considered in this study include exterior walls, roofs, foundations, interior walls, and interior finishes. In the second step, 3D BIM models of buildings in each climate zone were developed in Revit 2023 based on the details specified in step 1. Following step 2, to evaluate the embodied carbon and conduct further analysis, the quantity of the materials used for each building was determined and stored in a comprehensive dataset. Finally, a lifecycle assessment approach has been adopted to assess the embodied carbon of buildings for various climate zones by using Environment Product Declaration documents for each specific material and quantity of used materials.

3.2. Specifications of Building Prototype Properties Based on Building Code

The first step in comparing the embodied emissions of buildings in different climate zones is to specify the envelope assemblies of buildings that meet the minimum requirements of the 2021 IECC and IRC. The R-value and U-factor are important measures to describe the thermal performance of building materials and components [47]. According to the IECC, the R-value is the inverse of the time rate of heat flow through a body from one bounding surface to another for a unit temperature difference between the two surfaces, and the U-factor is the coefficient of heat transmission through a building component or assembly. Additionally, the 2021 IRC was used to ensure that critical building elements, such as foundations, exterior walls, and roofs, are designed for structural integrity and meet the requirements. To assist builders in meeting these requirements, the Department of Energy designed the Climate-Specific Building Assemblies Tool, which provides drawings and case studies of assemblies that meet requirements for thermal efficiency and condensation control. In this study, the drawings and suggested sections for building components from DOE’s tools were used to ensure that the cross-sectional details of components meet the corresponding specifications [49].
Figure 2 presents a prototype building plan and a representative 3D model used to quantify the building materials. The total building area is 155 m2, with dimensions of 14 m by 11 m. As DOE provides different building component assemblies for each climate zone, in this study, the buildings feature concrete slab foundations on grade, and wooden exterior walls with advanced framing were selected. The same rigid insulation material was applied uniformly across all climate zones, with variations only in thickness and specific insulation details, as prescribed by the DOE building component assemblies for each climate zone. Utilizing drawings with similar foundation and exterior wall assemblies enables reliable and consistent comparisons across various climate zones. The difference across the climate zones is the thickness and insulation details. Moreover, the roof type and component details were designed according to the selected drawings for each respective climate zone. Buildings in Zones 1 and 2 feature flat roofs, while buildings in Zones 3 to 8 use sloped roofs. Notably, similar interior walls were designed for all buildings in this study.

3.3. Constructing BIM Model Representing Prototype

Building Information Modeling (BIM) is a modeling process involving the generation and management of digital representations of physical and functional characteristics of buildings. It is also understood as a digital platform that enables interoperability and data exchange [50] and has become the gold standard for modeling in the building and construction industry [51]. In addition to material selection, which significantly impacts GWP due to variations in manufacturing processes, transportation, and lifecycle emissions, the quantity of materials used for each building component also plays a crucial role in determining the embodied carbon of buildings. Therefore, a BIM tool, Revit 2023, was employed in this study to create comprehensive 3D models of buildings situated in various climate zones. Utilizing Revit enables the classification of materials based on building components, which is helpful in assessing the portion of the embodied carbon of each building part compared to total embodied carbon emissions [37]. Table 1 shows the prototype building setup for each climate zone.

3.4. Quantifying Building Materials

There are different tools to assess and extract the quantity of materials and building components from BIM models, including internal quantity takeoff (QTO) and external quantity takeoff tools [52]. In this project, the Revit internal QTO feature, named Schedules, was used to extract the quantities and properties of materials used, including their names, associated building components, area, volume, descriptions, and material findings. Following the preprocessing steps, the extracted data were stored in a Comma-Separated Values (CSV) format, which is a widely recognized standard for storing data in tabular form. This process was applied to each building across various climate zones, and finally, the compiled data were prepared for use in the next steps.

3.5. Embodied Carbon Assessment

The building components included in this study for embodied carbon assessment are the roof, exterior walls, interior walls, windows, doors, foundation, and interior finishes. The embodied emissions of mechanical and electrical systems are excluded from this study. Environmental Product Declarations (EPDs) are this study’s primary carbon data source. The use of EPDs to evaluate the embodied carbon of building components and materials is a well-established methodology in the building science literature, having been previously applied to glazing systems and insulation materials [53,54]. In this study, the total global warming potential (GWP) of buildings is the sum of the embodied carbon in building materials during the A1 to A3 stages, also known as cradle-to-gate stages. In order to assess the embodied carbon emissions of each building in different climate zones, the following equation can be used:
T = G × V
where T is the total embodied emission, G is the GWP obtained from EPD, and V is the volume/area of materials evaluated based on the quantity takeoff result.
EPDs are publicly accessible, standardized documents that provide detailed and quantified information about the environmental impact of products or systems. They are essential for gauging the environmental impact of products across their lifecycle (ISO, 2010). Table 2 shows the embodied carbon values extracted from EPDs used for all materials in this study. These EPDs and related GWP values were gathered from two sources: the International EPD Library and the Embodied Carbon in Construction Calculator (EC3) tool [55,56]. The EPDs used in this study adhered to ISO 14025 and EN 15804 standards, with their geographical scope confined to the global region or the United States. These EPDs were selected based on the materials specified for building components in accordance with the DOE guidelines and were restricted to those classified within the building product category. To ensure broader applicability and inclusivity in the analysis, no specific requirements or constraints were imposed on the End-of-Life (EoL) stage, thereby accommodating a wider range of products and processes. The GWP of each material was calculated as the average of all GWP values obtained from the relevant EPDs sourced from specified databases. The EC3 tool is an extensive EPD database and employs a published methodology for reporting the embodied carbon of the product stage (A1–A3) for different building materials.

4. Findings

4.1. Impact of Climate Zone Condition on Lifecycle Embodied Carbon

Table 3 and Figure 3 show the evaluated embodied carbon during the product stage for different climate zones, illustrating a relation between the embodied carbon and the severity of the climate conditions. Zone 1, characterized by a very hot and humid climate, has the lowest GWP at 25,768.81 KgCO2e. Zone 2 (hot humid and hot dry), with 28,287.68 KgCO2e, shows a 10% increase (2518.87 KgCO2) compared to Zone 1. Although buildings in Zones 1 and 2 have similar foundations and wall structures, the increase is primarily due to the thicker cavity and rigid insulation in the roofs of Zone 2, as detailed in Table 1.
In Zone 3, with warm, humid, dry, and marine conditions, the embodied carbon is 31,212.81 KgCO2e, a 10% increase compared to Zone 2. This increase is attributed to the change in the roof type and the use of rigid insulation for exterior walls. There is a notable jump in embodied carbon between Zone 3 and Zone 4, with an increase of 6745.13 KgCO2e. This rise is due to enlarged cavity insulation in the roof and exterior walls, as well as the implementation of concrete footing below frost depth, which increases the amount of concrete, consequently raising the GWP.
In general, higher embodied carbon values are observed in cold climate zones, specifically Zones 5 to 8. As shown in Table 3, there is a steady increase from 38,855.14 KgCO2e in Zone 5 to 40,129.60 KgCO2e in Zone 8, the highest GWP among all climate zones. According to the IECC 2021 and DOE tool, as shown in Table 1, this variation is due to differences in the R-values of rigid insulation in exterior walls, ranging from R-7.5 in Zone 5 to R-20 in Zone 8.

4.2. Building Components’ Contribution to Embodied Carbon

After understanding the overall climate zone correlation with embodied carbon, the analysis was focused on the building components of embodied carbon in all climate zones. As illustrated in Figure 4 and Table 4, in Zones 1, the exterior wall contributes the most to the embodied carbon (measured by KgCO2e), at 28%, followed by the exterior wall at 27%. In Zone 2, the foundation has the highest impact on the building’s embodied carbon, compromising 27%. Conversely, in Zone 3, the roof has the greatest contribution to embodied carbon at 34%, followed by the foundation, comprising 26% of the total embodied carbon of the building.
In mixed areas (Zone 4), due to different exterior wall envelopes and foundations, the most important building element is exterior walls at 30%, followed by roof and foundation at 28% and 26%, respectively. The influence of building components on embodied carbon for the buildings in cold zones is similar, as indicated in Figure 4. It is worth mentioning that the impact of foundations was almost the same in warm and cold climate zones at 27%. Upon comparing Zone 1 and Zone 8, which represent the hottest and coldest areas, it is noteworthy that the roof and exterior walls exhibited the most significant increases in embodied carbon, with increases of 89.5% and 76.3%, respectively.

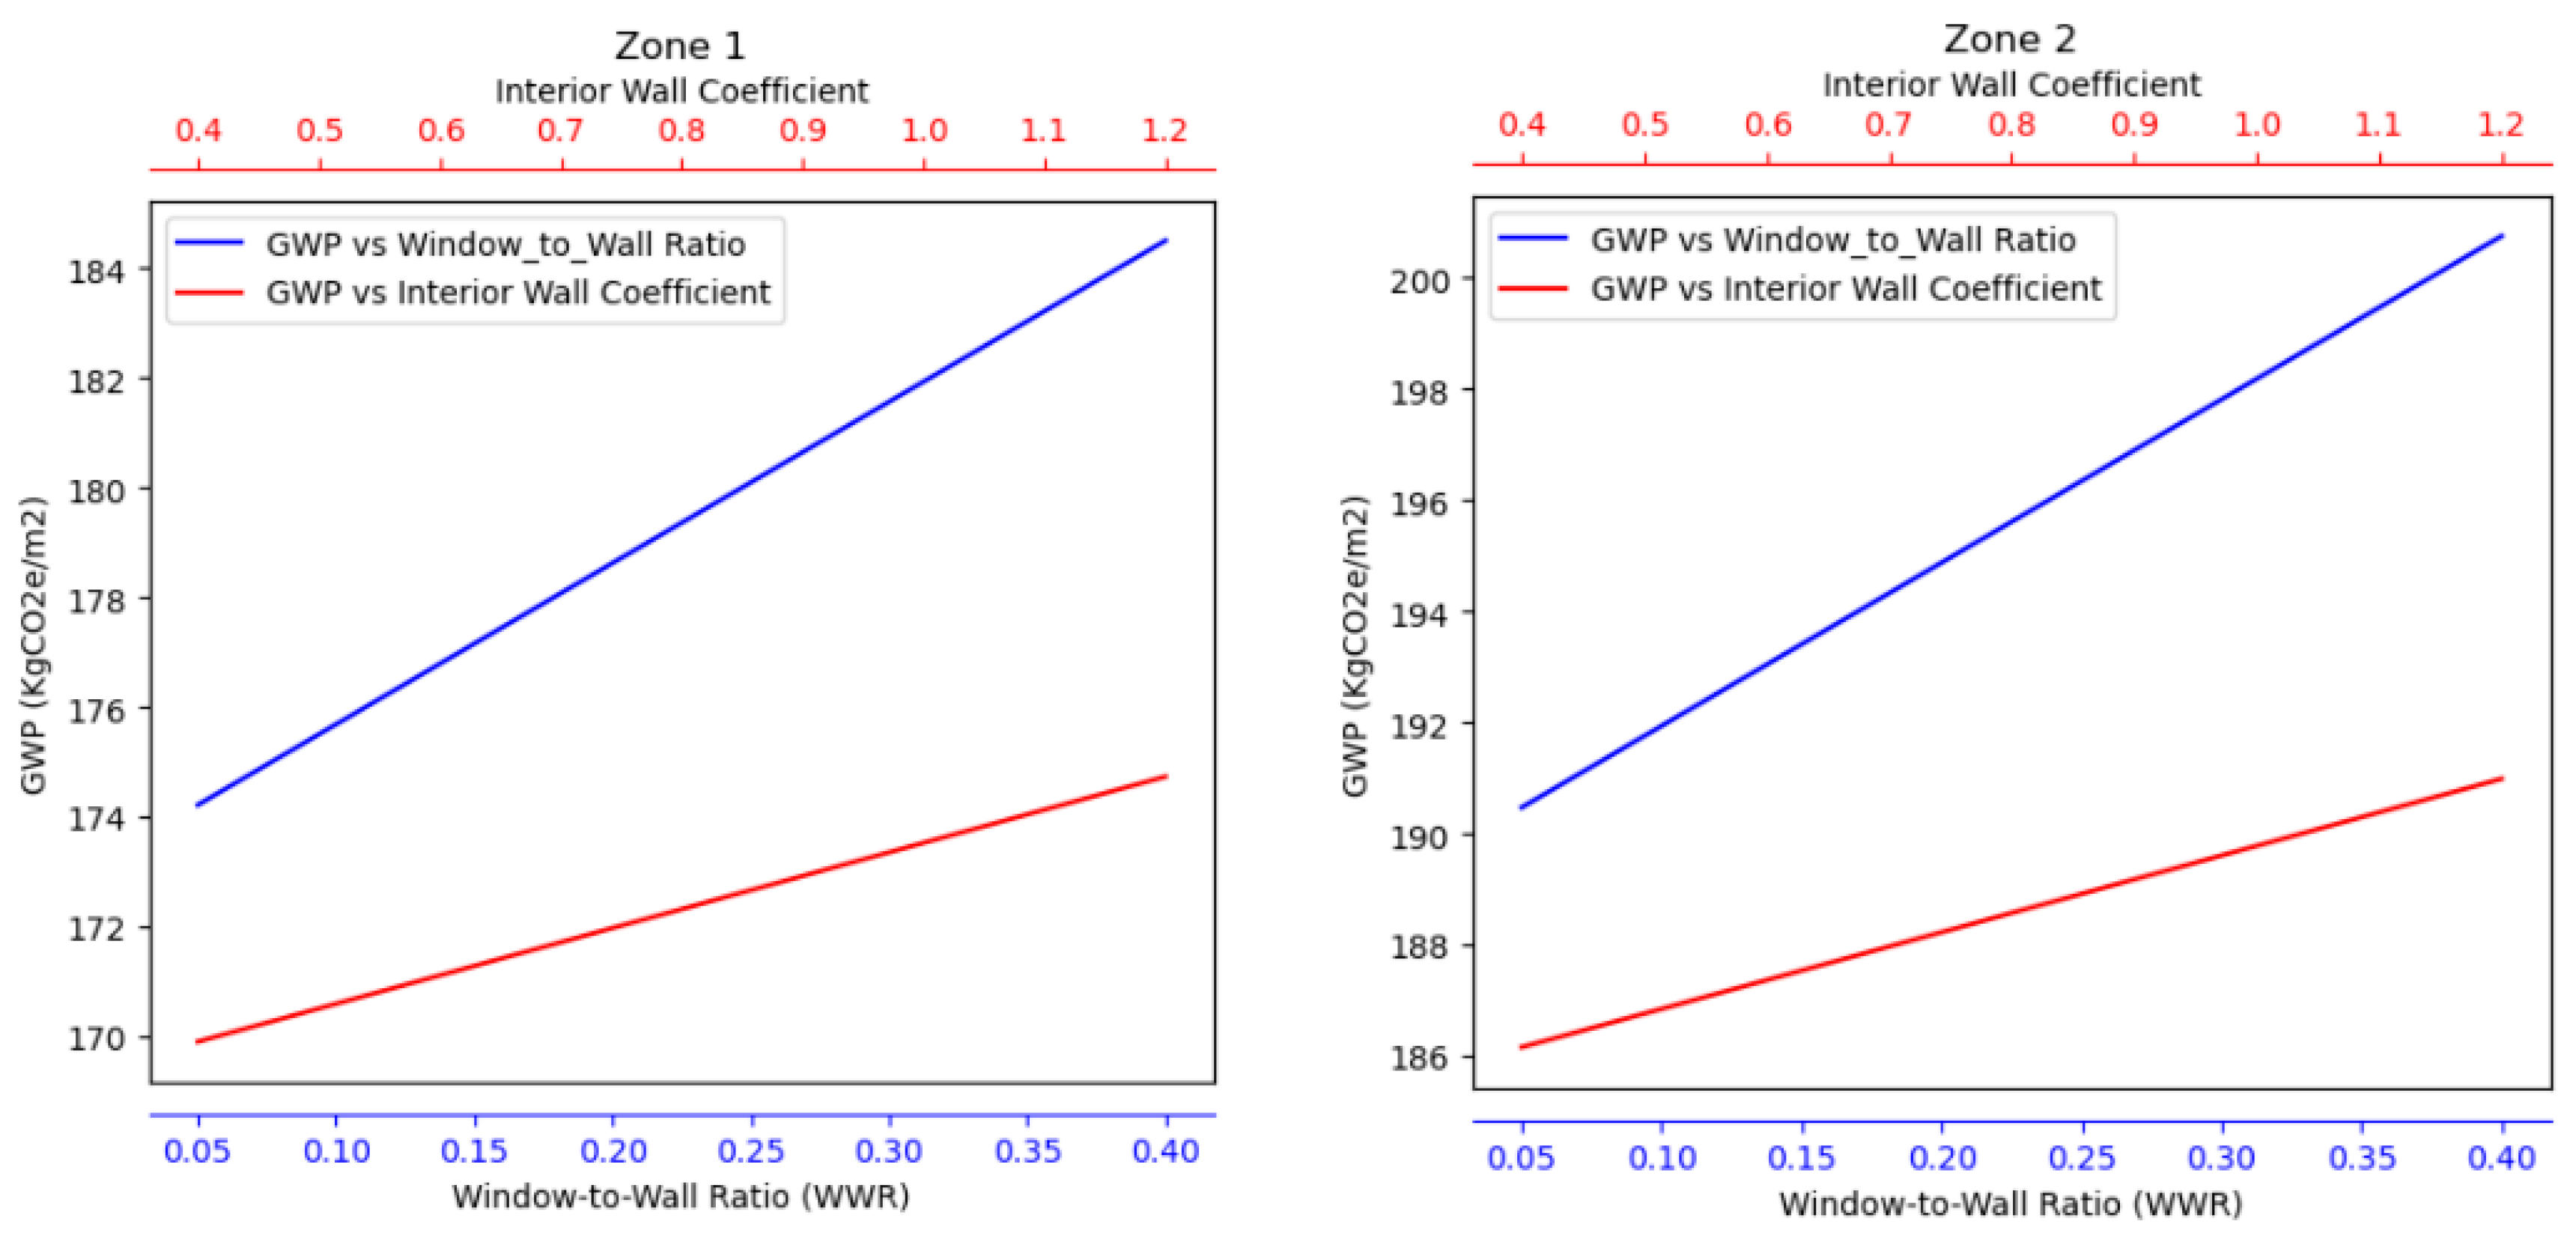
4.3. Sensitivity Analysis

Sensitivity analysis is conducted to evaluate the impact of input parameter variations on the assessment of embodied carbon of buildings across climate zones. Although the DOE tool and IECC 2021 provide the requirements and building component assemblies for each climate zone, there is flexibility in the selection input parameters, such as cavity and rigid insulation materials, window-to-wall ratios (WWRs), and interior wall assemblies. By utilizing the sensitivity analysis, the accuracy of performance evaluation can be improved by accounting for the uncertainty of these input parameters [57]. Furthermore, sensitivity analyses play a crucial role in assessing embodied carbon in various design and material selection scenarios, which can help to establish reliable baseline lifecycle embodied carbon values [58].
This study identifies several uncertainties related to design and material selection, focusing on three principal parameters that influence the accuracy of the embodied carbon assessment. The parameters chosen for the sensitivity analysis are based on their significant influence on embodied carbon and the flexibility provided by the Department of Energy (DOE) specifications. Research has highlighted the importance of design parameters, such as insulation materials and the window-to-wall ratio (WWR), in lifecycle carbon assessments [13,19]. The DOE guidelines offer flexibility in selecting materials for cavity and rigid insulation, as well as in the designs and thicknesses of interior walls. This latitude allows for a variety of material and design choices, enabling a thorough assessment of their impact on embodied carbon. To improve reproducibility, the parameters were systematically analyzed, incorporating variations within ranges based on DOE guidelines and literature findings. Moreover, the baseline model for each scenario was constructed according to the specifications outlined in Section 3.2, ensuring a reliable basis for comparison. The first critical parameter is the material used for cavity insulation in exterior walls. According to DEO guidelines, options include cellulose, fiberglass, mineral wool, and open-cell spray foam. Figure 5 shows the impact of different cavity insulation materials on the embodied carbon of buildings. The second factor is the rigid insulation material of exterior walls. As the DEO guideline mentioned, three different materials can be utilized for rigid insulation: mineral wool, extruded polystyrene, and foil-faced polyisocyanurate. The sensitivity analysis of various rigid wall insulation materials is illustrated in Figure 6. The third factor is the window-to-wall ratio (WWR) of the building, which significantly impacts lifecycle embodied and operational carbon emissions [54]. In this project, the sensitivity analysis was conducted based on the WWR range from 0.02 to 0.4. The final factor is interior wall design, specifically material thickness. Variations in embodied carbon across different designs were measured using the interior wall coefficient, which quantifies the ratio of embodied carbon in the new design to that in the prototype design, with values ranging from 0.4 to 1.2.
Figure 7 shows the impact of variation in input parameters (WWR and interior wall design) on the lifecycle embodied carbon of buildings across different climate zones based on the results of the sensitivity analysis. A comparison of sensitivity analysis between climate zones indicates that the WWR and interior wall design have important effects on embodied carbon emissions. As illustrated in Figure 7, a higher interior wall coefficient value correlates with increased embodied carbon in all climate zones. Conversely, the influence of the WWR on GWP varies across climate zones. In Zones 1 to 4, there is a positive correlation, where an increase in the WWR is associated with higher embodied carbon. In Zone 5, the impact of the WWR is insignificant. On the other hand, Zones 6 to 8 exhibit a negative relationship, suggesting that higher WWR values are correlated with a decrease in embodied carbon.

4.4. Baseline Lifecycle Embodied Carbon Values for Different Climate Zones

The baseline lifecycle embodied carbon values for different climate zones were established through a systematic analysis of 1200 scenarios. These scenarios were generated by varying key input parameters, including cavity and rigid insulation materials, window-to-wall ratios (WWRs), and interior wall designs, across all eight climate zones in the United States. Cavity insulation options such as cellulose, fiberglass, mineral wool, and open-cell spray foam were chosen based on their widespread use and carbon performance, while rigid insulation materials included mineral wool, extruded polystyrene, and foil-faced polyisocyanurate. The WWR was varied from 0.02 to 0.4 to capture a wide range of design configurations, and interior wall designs were modeled using a coefficient ranging from 0.4 to 1.2, representing variations in material thickness and embodied carbon intensity. The scenarios comprehensively reflect the diversity of material choices and construction practices while adhering to the requirements of the 2021 International Energy Conservation Code (IECC) and International Residential Code (IRC).
The results were normalized to a functional unit of kilograms of CO2 equivalent per square meter of building floor area (kgCO2e/m2) to enable comparability across climate zones. Normalization involved calculating the total embodied carbon emissions for each scenario, using the prototype building model as a consistent baseline, and dividing by the total floor area of 155 m2. Statistical measures, including the median, interquartile range, and whisker values, were computed to represent the range and central tendency of embodied carbon values within each zone. Median values ranged from 169.52 kgCO2e/m2 in Zone 1 (hot and humid) to 256.49 kgCO2e/m2 in Zone 8 (subarctic), reflecting the influence of climate-driven insulation requirements. Cold climate zones exhibited higher embodied carbon values due to increased material quantities needed for insulation and robust building assemblies, whereas warmer zones benefited from reduced insulation demands.
The sensitivity analysis highlighted the significant influence of certain parameters on embodied carbon outcomes. Insulation materials, particularly rigid insulation in colder climates, demonstrated the largest impact, with mineral wool consistently yielding lower embodied carbon compared to extruded polystyrene. WWR variations revealed a contrasting pattern, with higher WWRs increasing embodied carbon in warm climates (Zones 1–4) due to the carbon intensity of glazing systems, while in cold climates (Zones 6–8), larger WWRs reduced embodied carbon by offsetting the use of more intensive wall materials. Interior wall thickness also had a consistent effect, with thicker walls leading to higher embodied carbon across all zones. These findings provide actionable benchmarks for optimizing building designs and material selection to align with sustainability objectives and can inform the development of climate-specific embodied carbon limits in building codes. Table 5 and Figure 8 illustrate the calculated lifecycle embodied baseline in each climate zone. In addition, the result is normalized based on the area of buildings.

5. Discussion

This study’s findings indicate that buildings in colder climates exhibit higher embodied carbon emissions due to increased insulation requirements, with exterior walls and roof systems contributing significantly to the total carbon footprint. These results are consistent with previous research, which attributes the demand for higher insulation levels in cold climates to the need to minimize heat loss during winter months [59,60]. Notably, the sensitivity analysis revealed that the window-to-wall ratio (WWR) impacts embodied carbon differently across climates: a higher WWR increased embodied carbon in hot and warm climates but decreased it in colder climates. These findings should be considered when developing strategies and decision-making processes to enhance energy efficiency and sustainable performance. The results of this study present multiple practical implications for stakeholders in the construction industry. The baseline lifecycle embodied carbon values established for each climate zone can assist designers and architects in selecting materials and design elements that align with regional sustainability objectives. Regulatory agencies can leverage these findings to formulate building codes that set maximum embodied carbon limits tailored to specific climate zones, utilizing the study’s data as a benchmark. Moreover, providing incentives such as tax benefits or financial aid for employing low-carbon materials can promote sustainable practices. Construction professionals have the opportunity to minimize emissions by making informed choices by using lifecycle assessment tools like BIM-LCA in their procurement processes, enabling them to pinpoint materials that have a significant environmental impact. These actionable recommendations contribute to overarching sustainability ambitions and aid in lowering carbon emissions in construction and infrastructure projects.
This study aims to address the question, “How does the United States baseline compare to other countries?”. As of 2023, there are 186 embodied carbon-related policies across 20 countries, according to the Carbon Leadership Forum’s Embodied Carbon Policy Toolkit. However, only a few of these countries have established national baselines for limiting the allowable lifecycle embodied carbon of buildings. For example, on 1 January 2023, an addendum to the Danish Building Regulations mandated that all new buildings must undergo a lifecycle assessment to calculate their environmental impact. It also introduced a maximum global warming potential (GWP) threshold of 12 kg CO2 equivalent per square meter per year for buildings larger than 1000 m2 [61]. Given a building lifespan of 50 years, this results in a lifecycle embodied carbon limit of 600 kg CO2e/m2. Table 6 lists the countries and cities with such baseline requirements, which, for residential buildings, range from 250 to 800 kg CO2e/m2 over a 50-year lifespan.
Unlike Denmark and France, which have established nationwide embodied carbon limits, the United States currently lacks a federal requirement for such limits. However, as indicated in Section 4.4 and Table 5, the lifecycle embodied carbon for buildings in the U.S. ranges from 169.52 to 256.49 kgCO2e/m2. When accounting for an additional 30% embodied carbon contribution from other building service systems, such as mechanical systems, the total lifecycle carbon ranges from 220 to 333 kgCO2e/m2. This outcome aligns with the embodied carbon targets set by other countries, as shown in Figure 9. These findings suggest that future buildings constructed in accordance with the latest energy codes in the U.S. are likely to meet international embodied carbon standards. To align more closely with global standards, the U.S. could consider implementing restrictions on embodied carbon at either the federal or state level. This initiative may involve requiring lifecycle assessments for new construction projects and establishing specific GWP thresholds to encourage reductions in embodied carbon emissions. Furthermore, offering incentives for using low-carbon materials and integrating embodied carbon criteria into procurement practices could enhance these efforts. By collaborating with state governments and industry stakeholders to develop voluntary benchmarks, broader federal implementation may be achieved. Future research should investigate the feasibility of such policies in the U.S., considering both economic and regulatory implications.
It is important to mention that this study focuses on the embodied carbon of structural and architectural elements, excluding mechanical and electrical (M&E) systems from its scope. While this approach aligns with the study’s objectives, it may result in an underestimation of total embodied carbon, particularly for buildings where M&E systems contribute significantly to overall emissions. Consequently, the study’s findings are primarily applicable to the structural and architectural aspects of buildings and should be interpreted within this limited context. To provide a more comprehensive assessment of embodied carbon and enhance the generalizability of results across various building typologies, future research should endeavor to incorporate M&E systems in lifecycle analyses. Subsequent research should prioritize the identification of the underlying factors contributing to discrepancies in embodied carbon baselines between the United States and other nations. Gaining a deeper understanding of these variations will enhance our comprehension of global dynamics and facilitate the alignment of U.S. practices with established international standards.

6. Conclusions

The construction industry significantly contributes to the emission of carbon into the environment. Previous research has highlighted the importance of location on the carbon emissions of buildings, particularly with regard to embodied carbon emissions, which are less explored. This study aimed to (1) assess the embodied carbon emissions of buildings in eight climate zones across the United States and investigate the effect of location on the GWP of the entire building, (2) evaluate the impact of different building components on embodied carbon emissions and identify the components that have the most significant influence, and (3) provide a baseline of lifecycle carbon emissions for different climate zones. To achieve these objectives, this study utilized Revit to model the buildings based on the IECC 2021 and IRC and evaluated the quantities of materials. The EPD-based lifecycle assessment method was used to estimate the product stage embodied carbon of materials.
The findings revealed three significant insights. Firstly, buildings in colder climates exhibit higher embodied carbon, with total embodied carbon during the product stage for buildings with the same plan in hot versus cold climates varying by more than 55%. Secondly, the component analysis highlights that exterior walls, roofs, and foundations are the primary contributors to embodied carbon across most climate zones, with exterior walls accounting for up to 31% in cold areas and foundations consistently contributing around 27% across warm and cold zones. Additionally, roof embodied carbon increased by 89.5% from Zone 1 to Zone 8, accompanied by a 76.3% rise in exterior wall emissions. Thirdly, the sensitivity analyses demonstrate differing patterns of input factors, particularly the impact of WWRs on embodied carbon, across various climate zones.
This research adds to the existing body of studies in the literature in two key areas. Firstly, it examines the impact of location and climate conditions on a building’s embodied carbon through a lifecycle assessment based on EPD data. Secondly, this study establishes a baseline for the lifecycle embodied carbon emissions of buildings in different locations. This addresses a significant gap in the current literature by assessing emissions based on building design scenarios that meet the requirements of building and energy codes, such as IECC and IRC for climate zones. This study provides practical insights for reducing embodied carbon, including using baseline data to guide material selection, integrating carbon thresholds into building codes, and adopting lifecycle assessment tools to inform sustainable design and construction practices.

Author Contributions

M.H. designed and developed the theoretical framework; A.N. performed the data collection, modeling, and analysis; A.N. wrote the initial article with input from all M.H. All authors have read and agreed to the published version of the manuscript.

Funding

This work was supported by the National Science Foundation Grant Award #2317971, #2430623 and Department of Energy Subaward #23-1007. The authors thank colleagues in our university research group, three reviewers, and the journal editor for constructive feedback that has helped improve the article.

Data Availability Statement

The data that support the findings of this study are available on request from the corresponding author, M.H. The data are not publicly available because they contain information that could compromise the privacy of building owners.

Acknowledgments

We thank all faculty and staff, and students in the School of Architecture, College of Engineering, Department of Civil and Environmental Engineering and Earth Science at the University of Notre Dame for their support of this project. The authors thank colleagues in our university research group, paper reviewers, and the journal editor for constructive feedback that has helped improve the article.

Conflicts of Interest

The authors declare no conflict of interest.

References

  1. Kwok, K.Y.G.; Kim, J.; Chong, W.K.O.; Ariaratnam, S.T. Structuring a Comprehensive Carbon-Emission Framework for the Whole Lifecycle of Building, Operation, and Construction. J. Archit. Eng. 2016, 22, 04016006. [Google Scholar] [CrossRef]
  2. Sizirici, B.; Fseha, Y.; Cho, C.-S.; Yildiz, I.; Byon, Y.-J. A Review of Carbon Footprint Reduction in Construction Industry, from Design to Operation. Materials 2021, 14, 6094. [Google Scholar] [CrossRef] [PubMed]
  3. Hamida, A.; Alsudairi, A.; Alshaibani, K.; Alshamrani, O. Parametric study of the impact of building envelope systems on embodied and operational carbon of residential buildings. Int. J. Build. Pathol. Adapt. 2021, 40, 753–774. [Google Scholar] [CrossRef]
  4. Joseph, V.R.; Mustaffa, N.K. Carbon emissions management in construction operations: A systematic review. Eng. Constr. Archit. Manag. 2023, 30, 1271–1299. [Google Scholar] [CrossRef]
  5. Kumar, D.; Kamran, M.; Zhang, C.; Wang, L.; Zhai, H.; Demirkesen, S. Evaluating the Impact of Contracting and Procurement Methods on Energy and Carbon Emissions Reduction in the Public Construction Sector. Am. Soc. Civ. Eng. 2023, 886–894. [Google Scholar]
  6. Wu, P.; Song, Y.; Zhu, J.; Chang, R. Analyzing the influence factors of the carbon emissions from China’s building and construction industry from 2000 to 2015. J. Clean. Prod. 2019, 221, 552–566. [Google Scholar] [CrossRef]
  7. Wang, H.; Chen, Q. Impact of climate change heating and cooling energy use in buildings in the United States. Energy Build. 2014, 82, 428–436. [Google Scholar] [CrossRef]
  8. Charles, A.; Maref, W.; Ouellet-Plamondon, C.M. Case study of the upgrade of an existing office building for low energy consumption and low carbon emissions. Energy Build. 2019, 183, 151–160. [Google Scholar] [CrossRef]
  9. Kalua, A. Urban Residential Building Energy Consumption by End-Use in Malawi. Buildings 2020, 10, 31. [Google Scholar] [CrossRef]
  10. Stephan, A.; Crawford, R.H. A comprehensive life cycle water analysis framework for residential buildings. Build. Res. Inf. 2014, 42, 685–695. [Google Scholar] [CrossRef]
  11. Hu, M. Embodied Carbon Emissions of the Residential Building Stock in the United States and the Effectiveness of Mitigation Strategies. Climate 2022, 10, 135. [Google Scholar] [CrossRef]
  12. Vilches, A.; Garcia-Martinez, A.; Sanchez-Montañes, B. Life cycle assessment (LCA) of building refurbishment: A literature review. Energy Build. 2017, 135, 286–301. [Google Scholar]
  13. Chen, W.; Yang, S.; Zhang, X.; Jordan, N.D.; Huang, J. Embodied energy and carbon emissions of building materials in China. Build. Environ. 2022, 207, 108434. [Google Scholar] [CrossRef]
  14. Röck, M.; Saade, M.R.M.; Balouktsi, M.; Rasmussen, F.N.; Birgisdottir, H.; Frischknecht, R.; Habert, G.; Lützkendorf, T.; Passer, A. Embodied GHG emissions of buildings—The hidden challenge for effective climate change mitigation. Appl. Energy 2020, 258, 114107. [Google Scholar]
  15. Pomponi, F.; Piroozfar, P.A.E.; Southall, R.; Ashton, P.; Farr, E.R.P. Energy performance of Double-Skin Façades in temperate climates: A systematic review and meta-analysis. Renew. Sustain. Energy Rev. 2016, 54, 1525–1536. [Google Scholar]
  16. Simonen, K.; Rodriguez, B.X.; De Wolf, C. Benchmarking the Embodied Carbon of Buildings. Technol.|Archit. + Des. 2017, 1, 208–218. [Google Scholar]
  17. Fenner, A.E.; Kibert, C.J.; Li, J.; Razkenari, M.A.; Hakim, H.; Lu, X.; Kouhirostami, M.; Sam, M. Embodied, operation, and commuting emissions: A case study comparing the carbon hotspots of an educational building. J. Clean. Prod. 2020, 268, 122081. [Google Scholar]
  18. Hu, M.; Ghorbany, S. Building Stock Models for Embodied Carbon Emissions—A Review of a Nascent Field. Sustainability 2024, 16, 2089. [Google Scholar] [CrossRef]
  19. Gauch, H.L.; Dunant, C.F.; Hawkins, W.; Cabrera Serrenho, A. What really matters in multi-storey building design? A simultaneous sensitivity study of embodied carbon, construction cost, and operational energy. Appl. Energy 2023, 333, 120585. [Google Scholar]
  20. Fereidoni, S.; Nabisi, M.; Fereidooni, L.; Javidmehr, M.; Zirak, N.; Kasaeian, A. An assessment of the impact of building envelope design on the tradeoff between embodied and operating energy. Energy Build. 2023, 298, 113542. [Google Scholar] [CrossRef]
  21. Crawford, R.H.; Bartak, E.L.; Stephan, A.; Jensen, C.A. Evaluating the life cycle energy benefits of energy efficiency regulations for buildings. Renew. Sustain. Energy Rev. 2016, 63, 435–451. [Google Scholar] [CrossRef]
  22. Gregory, K.; Moghtaderi, B.; Sugo, H.; Page, A. Effect of thermal mass on the thermal performance of various Australian residential constructions systems. Energy Build. 2008, 40, 459–465. [Google Scholar] [CrossRef]
  23. Mahlan, S.; Francis, A.; Thumuganti, V.; Thomas, A.; Sadick, A.-M.; Tokede, O. An integrated life cycle assessment and energy simulation framework for residential building walling systems. Build. Environ. 2024, 257, 111542. [Google Scholar] [CrossRef]
  24. Rodrigues, C.; Freire, F. Environmental impact trade-offs in building envelope retrofit strategies. Int. J. Life Cycle Assess. 2017, 22, 557–570. [Google Scholar] [CrossRef]
  25. Wong, K.; Fan, Q. Building information modelling (BIM) for sustainable building design. Facilities 2013, 31, 138–157. [Google Scholar]
  26. Migilinskas, D.; Popov, V.; Juocevicius, V.; Ustinovichius, L. The Benefits, Obstacles and Problems of Practical Bim Implementation. Procedia Eng. 2013, 57, 767–774. [Google Scholar] [CrossRef]
  27. Olawumi, T.O.; Chan, D.W.M. Identifying and prioritizing the benefits of integrating BIM and sustainability practices in construction projects: A Delphi survey of international experts. Sustain. Cities Soc. 2018, 40, 16–27. [Google Scholar] [CrossRef]
  28. Tamanaeifar, M.H.; Shahosseini, V.; Nouri, A.; Salimi, M.H. Determining the optimal path of Water Distribution System using AHP based on integrated GIS and BIM model. Sharif J. Civ. Eng. 2021, 37, 23–32. [Google Scholar]
  29. Llatas, C.; Soust-Verdaguer, B.; Passer, A. Implementing Life Cycle Sustainability Assessment during design stages in Building Information Modelling: From systematic literature review to a methodological approach. Build. Environ. 2020, 182, 107164. [Google Scholar] [CrossRef]
  30. Potrč Obrecht, T.; Röck, M.; Hoxha, E.; Passer, A. BIM and LCA Integration: A Systematic Literature Review. Sustainability 2020, 12, 5534. [Google Scholar] [CrossRef]
  31. Soust-Verdaguer, B.; Llatas, C.; García-Martínez, A. Critical review of bim-based LCA method to buildings. Energy Build. 2017, 136, 110–120. [Google Scholar] [CrossRef]
  32. Lu, Y.; Le, V.H.; Song, X. Beyond Boundaries: A Global Use of Life Cycle Inventories for Construction Materials. J. Clean. Prod. 2017, 156, 876–887. [Google Scholar] [CrossRef]
  33. Soust-Verdaguer, B.; Llatas, C.; García-Martínez, A.; Gómez de Cózar, J.C. BIM-Based LCA Method to Analyze Envelope Alternatives of Single-Family Houses: Case Study in Uruguay. J. Archit. Eng. 2018, 24, 05018002. [Google Scholar] [CrossRef]
  34. KT Innovations Tally. Available online: https://choosetally.com/ (accessed on 30 June 2024).
  35. Crippa, J.; Boeing, L.C.; Caparelli, A.P.A.; da Costa, M.d.R.d.M.M.; Scheer, S.; Araujo, A.M.F.; Bem, D. A BIM–LCA integration technique to embodied carbon estimation applied on wall systems in Brazil. Built Environ. Proj. Asset Manag. 2018, 8, 491–503. [Google Scholar] [CrossRef]
  36. Shafiq, N.; Nurrudin, M.F.; Gardezi, S.S.S.; Kamaruzzaman, A.B. Carbon footprint assessment of a typical low rise office building in Malaysia using building information modelling (BIM). Int. J. Sustain. Build. Technol. Urban Dev. 2015, 6, 157–172. [Google Scholar]
  37. Xu, J.; Teng, Y.; Pan, W.; Zhang, Y. BIM-integrated LCA to automate embodied carbon assessment of prefabricated buildings. J. Clean. Prod. 2022, 374, 133894. [Google Scholar] [CrossRef]
  38. Mowafy, N.; El Zayat, M.; Marzouk, M. Parametric BIM-based life cycle assessment framework for optimal sustainable design. J. Build. Eng. 2023, 75, 106898. [Google Scholar] [CrossRef]
  39. Iddon, C.R.; Firth, S.K. Embodied and operational energy for new-build housing: A case study of construction methods in the UK. Energy Build. 2013, 67, 479–488. [Google Scholar] [CrossRef]
  40. Shin, Y.; Cho, K. BIM Application to Select Appropriate Design Alternative with Consideration of LCA and LCCA. Math. Probl. Eng. 2015, 2015, 281640. [Google Scholar] [CrossRef]
  41. Bueno, C.; Fabricio, M.M. Comparative analysis between a complete LCA study and results from a BIM-LCA plug-in. Autom. Constr. 2018, 90, 188–200. [Google Scholar]
  42. Ullah, K.; Lill, I.; Witt, E. An Overview of BIM Adoption in the Construction Industry: Benefits and Barriers. In 10th Nordic Conference on Construction Economics and Organization; Emerald Publishing Limited: Bradford, UK, 2019; pp. 297–303. Available online: https://www.emerald.com/insight/content/doi/10.1108/s2516-285320190000002052/full/html (accessed on 1 December 2024).
  43. Miettinen, R.; Paavola, S. Beyond the BIM utopia: Approaches to the development and implementation of building information modeling. Autom. Constr. 2014, 43, 84–91. [Google Scholar] [CrossRef]
  44. Safari, K.; AzariJafari, H. Challenges and opportunities for integrating BIM and LCA: Methodological choices and framework development. Sustain. Cities Soc. 2021, 67, 102728. [Google Scholar] [CrossRef]
  45. Lu, K.; Jiang, X.; Tam, V.W.Y.; Li, M.; Wang, H.; Xia, B.; Chen, Q. Development of a Carbon Emissions Analysis Framework Using Building Information Modeling and Life Cycle Assessment for the Construction of Hospital Projects. Sustainability 2019, 11, 6274. [Google Scholar] [CrossRef]
  46. Yang, X.; Hu, M.; Wu, J.; Zhao, B. Building-information-modeling enabled life cycle assessment, a case study on carbon footprint accounting for a residential building in China. J. Clean. Prod. 2018, 183, 729–743. [Google Scholar] [CrossRef]
  47. International Energy Conservation Code (IECC). Available online: https://codes.iccsafe.org/content/IECC2021P1 (accessed on 1 November 2024).
  48. International Residential Code (IRC). Available online: https://codes.iccsafe.org/content/IRC2021P2 (accessed on 1 November 2024).
  49. DOE Building America Climate-Specific Guidance. Available online: https://www.energy.gov/eere/buildings/building-america-climate-specific-guidance (accessed on 1 November 2024).
  50. Kiviniemi, A.; Karlshøj, J.; Tarandi, V.; Bell, H.; Karud, O.J. Review of the Development and Implementation of IFC Compatible BIM. 2008. Available online: https://orbit.dtu.dk/files/131997343/Untitled.pdf (accessed on 22 July 2024).
  51. Hu, M. Optimal renovation strategies for education buildings—A novel BIM–BPM–BEM framework. Sustainability 2018, 10, 3287. [Google Scholar] [CrossRef]
  52. Monteiro, A.; Poças Martins, J. A survey on modeling guidelines for quantity takeoff-oriented BIM-based design. Autom. Constr. 2013, 35, 238–253. [Google Scholar] [CrossRef]
  53. Hill, C.; Norton, A.; Dibdiakova, J. A comparison of the environmental impacts of different categories of insulation materials. Energy Build. 2018, 162, 12–20. [Google Scholar] [CrossRef]
  54. Méndez Echenagucia, T.; Moroseos, T.; Meek, C. On the tradeoffs between embodied and operational carbon in building envelope design: The impact of local climates and energy grids. Energy Build. 2023, 278, 112589. [Google Scholar] [CrossRef]
  55. Embodied Carbon in Construction Calculator. Available online: https://www.buildingtransparency.org/ (accessed on 1 November 2024).
  56. International EPD Library. Available online: https://www.environdec.com/library (accessed on 1 November 2024).
  57. Mastrucci, A.; Pérez-López, P.; Benetto, E.; Leopold, U.; Blanc, I. Global sensitivity analysis as a support for the generation of simplified building stock energy models. Energy Build. 2017, 149, 368–383. [Google Scholar] [CrossRef]
  58. Meneghelli, A. Whole-building embodied carbon of a North American LEED-certified library: Sensitivity analysis of the environmental impact of buildings materials. Build. Environ. 2018, 134, 230–241. [Google Scholar] [CrossRef]
  59. Röck, M.; Pristerá, G.; Ramon, D.; Van De Moortel, E.; Mouton, L.; Kockat, J.; Toth, Z.; Allacker, K. Science for Policy: Insights from Supporting an EU Roadmap for the Reduction of Whole Life Carbon of Buildings. IOP Conf. Ser. Earth Environ. Sci. 2024, 1363, 012008. [Google Scholar] [CrossRef]
  60. Mirabella, N.; Röck, M.; Ruschi Mendes Saade, M.; Spirinckx, C.; Bosmans, M.; Allacker, K.; Passer, A. Strategies to Improve the Energy Performance of Buildings: A Review of Their Life Cycle Impact. Buildings 2018, 8, 105. [Google Scholar] [CrossRef]
  61. Mandatory New Requirements for Sustainable Construction. 2023. Available online: https://global.eg.dk/news/2023/april/mandatory-new-requirements-for-sustainable-construction/ (accessed on 23 May 2024).
Figure 1. Framework for embodied carbon assessment, including prototype specification, BIM model construction, material quantification, and lifecycle carbon evaluation.
Climate 12 00212 g001
Figure 2. (a) A 3D model of buildings in Zone 1 and 2, (b) a 3D model of buildings in Zone 3 to 8, and (c) a plan view of the prototype model.
Climate 12 00212 g002
Figure 3. The result of total embodied carbon during the product stage for baseline building models across climate zones.
Climate 12 00212 g003
Figure 4. Building components’ impact on entire building embodied carbon in different climate zones.
Climate 12 00212 g004
Figure 5. The impact of various cavity insulation materials on the lifecycle embodied carbon of buildings during the product stage across climate zones based on sensitivity analysis results.
Climate 12 00212 g005
Figure 6. The impact of various rigid insulation materials on the lifecycle embodied carbon of buildings during the product stage across climate zones based on sensitivity analysis results.
Climate 12 00212 g006
Figure 7. The impact of input parameters’ variation (WWR and interior wall design) on the lifecycle embodied carbon of buildings during the product stage across climate zones based on sensitivity analysis results.
Climate 12 00212 g007aClimate 12 00212 g007b
Figure 8. Baseline lifecycle embodied carbon values for different climate zones.
Climate 12 00212 g008
Figure 9. A comparison of baseline results to the requirements of other countries.
Climate 12 00212 g009
Table 1. Building component specifications for prototype models across different climate zones.
Climate ZoneRoofExterior WallFoundationInterior Walls
StructureCavity InsulationRigid InsulationAdvanced FramingCavity InsulationRigid InsulationSlabFoundation WallFootingRigid Insulation
Zone 1Flat RoofR-25R-52 × 6 @246″None4″12″NoneNone4 7/8″ Partition
Zone 2Flat RoofR-40R-102 × 6 @246″None4″12″NoneNone4 7/8″ Partition
Zone 3Sloped RoofR-49R-102 × 6 @246″R-54″12″NoneR-104 7/8″ Partition
Zone 4Sloped RoofR-50R-102 × 6 @246″R-54″12″14″R-104 7/8″ Partition
Zone 5Sloped RoofR-50R-102 × 6 @246″R-7.54″14″14″R-104 7/8″ Partition
Zone 6Sloped RoofR-50R-102 × 6 @246″R-11.254″16″14″R-104 7/8″ Partition
Zone 7Sloped RoofR-50R-102 × 6 @246″R-154″16″14″R-104 7/8″ Partition
Zone 8Sloped RoofR-50R-102 × 6 @246″R-204″16″14″R-104 7/8″ Partition
Table 2. Embodied carbon values of building materials extracted based on EPDs.
MaterialEmbodied Carbon (KgCO2e)Declaration Unit
Ready-Mix Concrete332m3
Mineral Wool68.7m3
Timber133.75m3
Gypsum3.11m2
Plywood219.32m3
Water Control Layer0.615m2
Drainage Mat1.15m2
Extruded Polystyrene185m3
Roofing Membrane4.71m2
Carpet10.9m2
Carpet Padding1.33m2
Asphalt Shingle1.6m2
Underlayment1.76m2
Wood/Aluminum Door65.6m2
Wood/Aluminum Window174m2
Table 3. The result of total GWP and variation in embodied carbon during the product stage for building models across climate zones.
ZoneConditionGWP (KgCO2e)Change in Embodied Carbon (KgCO2e)
1
  • Very Hot Humid
25,768.81-
2
  • Hot Humid
  • Hot Dry
28,287.682518.87
3
  • Warm Humid
  • Warm Dry
  • Warm Marine
31,212.812925.12
4
  • Mixed Humid
  • Mixed Dry
  • Mixed Marine
37,957.946745.13
5
  • Cool Humid
  • Cool Dry
  • Cool Marine
38,855.14897.20
6
  • Cold Humid
  • Cold Dry
39,278.91423.77
7
  • Very Cold
39,597.47318.55
8
  • Subarctic
40,129.60532.13
Table 4. Building components’ embodied carbon emission (KgCO2e) during the product stage in different climate zones.
Zone 1Zone 2Zone 3Zone 4Zone 5Zone 6Zone 7Zone 8
Foundation6854.077616.358206.849912.0010,522.4510,580.3710,623.9010,696.64
Ext Wall7127.497127.496210.4111,240.6811,504.7811,857.7112,123.0212,566.24
Int Wall1407.691407.691407.691407.691407.691407.691407.691407.69
Roof5675.457432.0510,683.7610,693.4710,716.1110,729.0510,738.7510,754.93
Door652.10652.10652.10652.10652.10652.10652.10652.10
Window442.74442.74442.74442.74442.74442.74442.74442.74
Finish3609.273609.273609.273609.273609.273609.273609.273609.27
Sum25,768.8128,287.6831,212.8137,957.9438,855.1439,278.9139,597.4740,129.60
Table 5. Baseline lifecycle embodied carbon values for different climate zones (kgCO2e/m2).
Climate ZonesMedianQ1Q3Whisker LowWhisker High
Zone 1169.52165.39173.42157.19181.05
Zone 2185.77181.64189.67173.44197.31
Zone 3207.21202.54211.77192.41222.13
Zone 4244.22241.91246.56235.38253.35
Zone 5249.69247.41251.98241.14258.52
Zone 6251.92249.74254.17243.84260.40
Zone 7253.66251.50255.88245.86261.82
Zone 8256.49254.40258.71249.25264.18
Table 6. List of the countries and cities with baseline requirements of embodied carbon.
CountryCityEmbodied Carbon Limit (kgCO2e/m2)
SwitzerlandZurich425 (residential)
DenmarkNation-wide600
FranceNation-wide415 (residential)
UKLondon970 (office)
800 (residential)
675 (school)
690 (retail)
CanadaVancouver400
Toronto250–350 (mid–high-rise and non-residential)
<250 (low-rise residential)
<350 (city-owned facility)
Disclaimer/Publisher’s Note: The statements, opinions and data contained in all publications are solely those of the individual author(s) and contributor(s) and not of MDPI and/or the editor(s). MDPI and/or the editor(s) disclaim responsibility for any injury to people or property resulting from any ideas, methods, instructions or products referred to in the content.

