Article

Projected Changes in Dry and Wet Spells over West Africa during Monsoon Season Using Markov Chain Approach

1
Laboratoire d’Océanographie, des Sciences de l’Environnement et du Climat (LOSEC), Université Assane SECK de Ziguinchor, Ziguinchor BP 523, Senegal
2
IRD, CNRS, Grenoble INP, IGE, Université Grenoble Alpes, F-38000 Grenoble, France
*
Author to whom correspondence should be addressed.
Climate 2024, 12(12), 211; https://doi.org/10.3390/cli12120211
Submission received: 17 May 2024 / Revised: 22 July 2024 / Accepted: 29 July 2024 / Published: 6 December 2024

Abstract

:
This study examines projected changes in dry and wet spell probabilities in West Africa during the July–August–September monsoon season using a Markov chain approach. Four simulations of regional climate models from the CORDEX-Africa program were used to analyze projected changes in intraseasonal variability. The results show an increase in the probability of having a dry day, a dry day preceding a wet day, and a dry day preceding a dry day, and a decrease in the probability of wet days in the Sahel region under anthropogenic forcing scenarios RCP4.5 and RCP8.5. The decrease in wet days is stronger in the far future and under the RCP8.5 scenario (up to −30%). The study also finds that the probability of consecutive dry days (lasting at least 7 days and 10 days) is expected to increase in western Sahel, central Sahel, and the Sudanian Area under both scenarios, with stronger increases in the RCP8.5 scenario. In contrast, a decrease is expected over the Guinea Coast, with the changes being more important under the RCP4.5. Dry spell probabilities increasing in the Sahel areas and in the northern Sudanian Area is linked to the increase in the very wet days (R95P) in the daily rainfall intensity index (SDII). These changes in dry and wet spell probabilities are important for water management decisions and risk reduction in the energy and agricultural sectors. This study also highlights the need for decision-makers to implement mitigation and adaptation policies to minimize the adverse effects of climate change.

1. Introduction

The Intergovernmental Panel on Climate Change (IPCC, 2013) has scientifically confirmed that global warming is due to the increase in human-induced greenhouse gas (GHG) emissions in the world’s climate. According to [1], climate change constitutes a great challenge to modern society because of its major implications with regard to environmental, agricultural, natural resource, ecosystem, and socio-economic aspects. In the past few decades, seasonal changes in Western Africa have been influenced by an increase in average annual precipitation, due to both an increase in the number of wet days and an increase in the average intensity and number of extreme events, particularly in the southern parts of Western Africa [2]. In this region, water resources and agricultural production are highly dependent on climate variability, especially in semi-arid Sahel. Rainfall is one of the most commonly used meteorological parameters for determining climate variability in West Africa. According to [3], its measurement is a major consideration in the tropics as it contributes significantly to hydrological and climate studies. In addition, future trends and changes in weather and climate extremes have been studied in West Africa [4,5,6,7,8]. These studies mainly used indices including dry and wet spells defined by the Expert Team on Climate Change Detection and Indices (ETCCDI) to study the spatiotemporal evolution of temperature and precipitation extremes [9]. Wet and dry spells are known to affect food security and water management; however, they have been less studied in the West African region [10,11,12]. Sen [13] showed that natural disasters induced by wet and dry spells have increased in recent decades owing to global warming.
While these dry and wet spells are useful for the quantitative description of drought, flood, and flash flood occurrence assessments [11], studies on future changes in the probability of occurrence of these high-impact events in West Africa are nascent.
The Markov chain process is a useful tool for determining the beginning and end of the rainy season, as well as dry and wet spells, which largely determine the success of rainfed agriculture and the availability of water resources [14,15,16]. This study’s purpose is to assess future changes in the dry and wet day probabilities over West Africa during the monsoon season (July to September) using the Markov chain process under the RCP4.5 and RCP8.5 scenarios of the simulations of regional climate models from the CORDEX–Africa program [17,18,19,20]. The remainder of this paper is organized as follows. Section 2 discusses the data and methods used in this study. In Section 3, the results are analyzed and discussed. Section 4 presents the summary and future outlook.

2. Data and Methods

2.1. Data

Daily rainfall data from four (04) regional climate models (RCMs) involved in the Coordinated Regional Climate Downscaling Experiment (CORDEX) [17,18,19,20] were analyzed in this study. CORDEX aims to produce numerical simulations to better characterize fundamental regional and local climate features, their variability, and changes using regional climate models [21]. Table 1 summarizes the climate model data with the forcing global climate model (GCM), the institute, the RCM, the historical period (1976–2005), and the two future times: the near future (2021–2050) and the far future (2071–2100). The choice of these RCMs is motivated by their capacity to simulate the general features of the African climate, particularly in Western Africa [22,23,24]. These data have a horizontal resolution of 0.44° × 0.44° and a daily time step for different Representative Concentration Pathway (RCP) scenarios. The scenario RCP4.5 is a trajectory that describes a radiative forcing of ~4.5 W.m−2 with stabilization after 2100, corresponding to policies close to the mitigation efforts proposed by governments at Paris COP21 [25]. RCP8.5 refers to a radiative forcing above 8.5 W.m−2 in 2100. RCMs taken individually show strong biases. However, the biases are smaller when the ensemble mean of the models is considered, as in [26]. In this study, the ensemble mean of four regional climate models (arithmetic mean) was computed and analyzed.

2.2. Methods

The probabilities of occurrence of the dry and wet days were determined using daily rainfall data processed with a Markov chain during the rainy season (July–August–September monsoon season). A day is classified as dry (wet) if the daily rainfall is less than 1 mm (above or equal to 1 mm) [10,27,28]. The Markov chain probability model has been shown to be suitable for describing the long-term frequency behavior of wet and dry periods. The first-order Markov chain is the most basic and extensively used in academic publications. It is characterized by a Markovian property, where the current state relies solely on the preceding state [16,29].
The process of occurrence of a binary first-order Markov chain is defined as:
P i j = P r ( X t = j X t 1 = i , X t 2 = i t 1 ,   ,   X 1 = i 1 )   =   P r ( X t = j X t 1 = i )
where, i ,   j , i 1 …, i t 1 ∈ {0, 1} and P r and P i j represent, respectively, the probability and the transition probabilities from state i (dry and wet) to state j (dry and wet).
Consider the transition matrix as:
P d d P d w P w d P w w
where P d d , P d w , P w d , and P w w represent, respectively, the conditional probabilities of having a dry day preceded by a dry day, a wet day preceded by a dry day, a dry day preceded by a wet day, and a wet day preceded by a wet day.
Thus, P d d + P d w = 1 and P w d + P w w = 1 .
The initial probabilities of having a dry day and a wet day are noted P d and P w , respectively.
These different probabilities used are calculated as follows [16,29]:
Initial probabilities
P d = N d N
P w = N w N
Transition probabilities
P d d = N d d N d
P w w = N w w N w
P d w = 1 P d d
P w d = 1 P w w
where N d , N w , N d d , and N w w represent, respectively, the number of the dry days, the number of the wet days, the number of the dry days preceded by the dry days, and the number of the wet days preceded by the wet days.
Then, the probabilities of a dry and wet period lasting n-days are shown in Equations (8) and (9), respectively [11,16].
P D = n = P d d n 1 ( 1 P d d )
P W = n = P w w n 1 ( 1 P w w )
The dry and wet spell probabilities were analyzed for diverse time intervals (i.e., 7– and 10–day durations) as in [16,28]. These durations were chosen to take into account various synoptic patterns in the rainy season African Easterly Waves [10] and this was motivated by the fact that longer dry spells in August over the Sudano-Sahelian regions is one of the factors explaining the yield reductions, as August is the heading phase when the plant needs enough water to develop [30].
In this study, the results are presented as the relative deviation (RD) between the two periods:
R D = 100 × P P H I S T H I S T
where P P represents the average summer projection period under the RCP scenarios, and H I S T represents the reference period (1976–2005).
Figure 1 shows the study area that covers 20° W–20° E longitude and 0–20° N latitude. The sub–regions (western Sahel, central Sahel, Sudanian Zone, and Guinea Coast) are also represented as in [10,16].

3. Results and Discussion

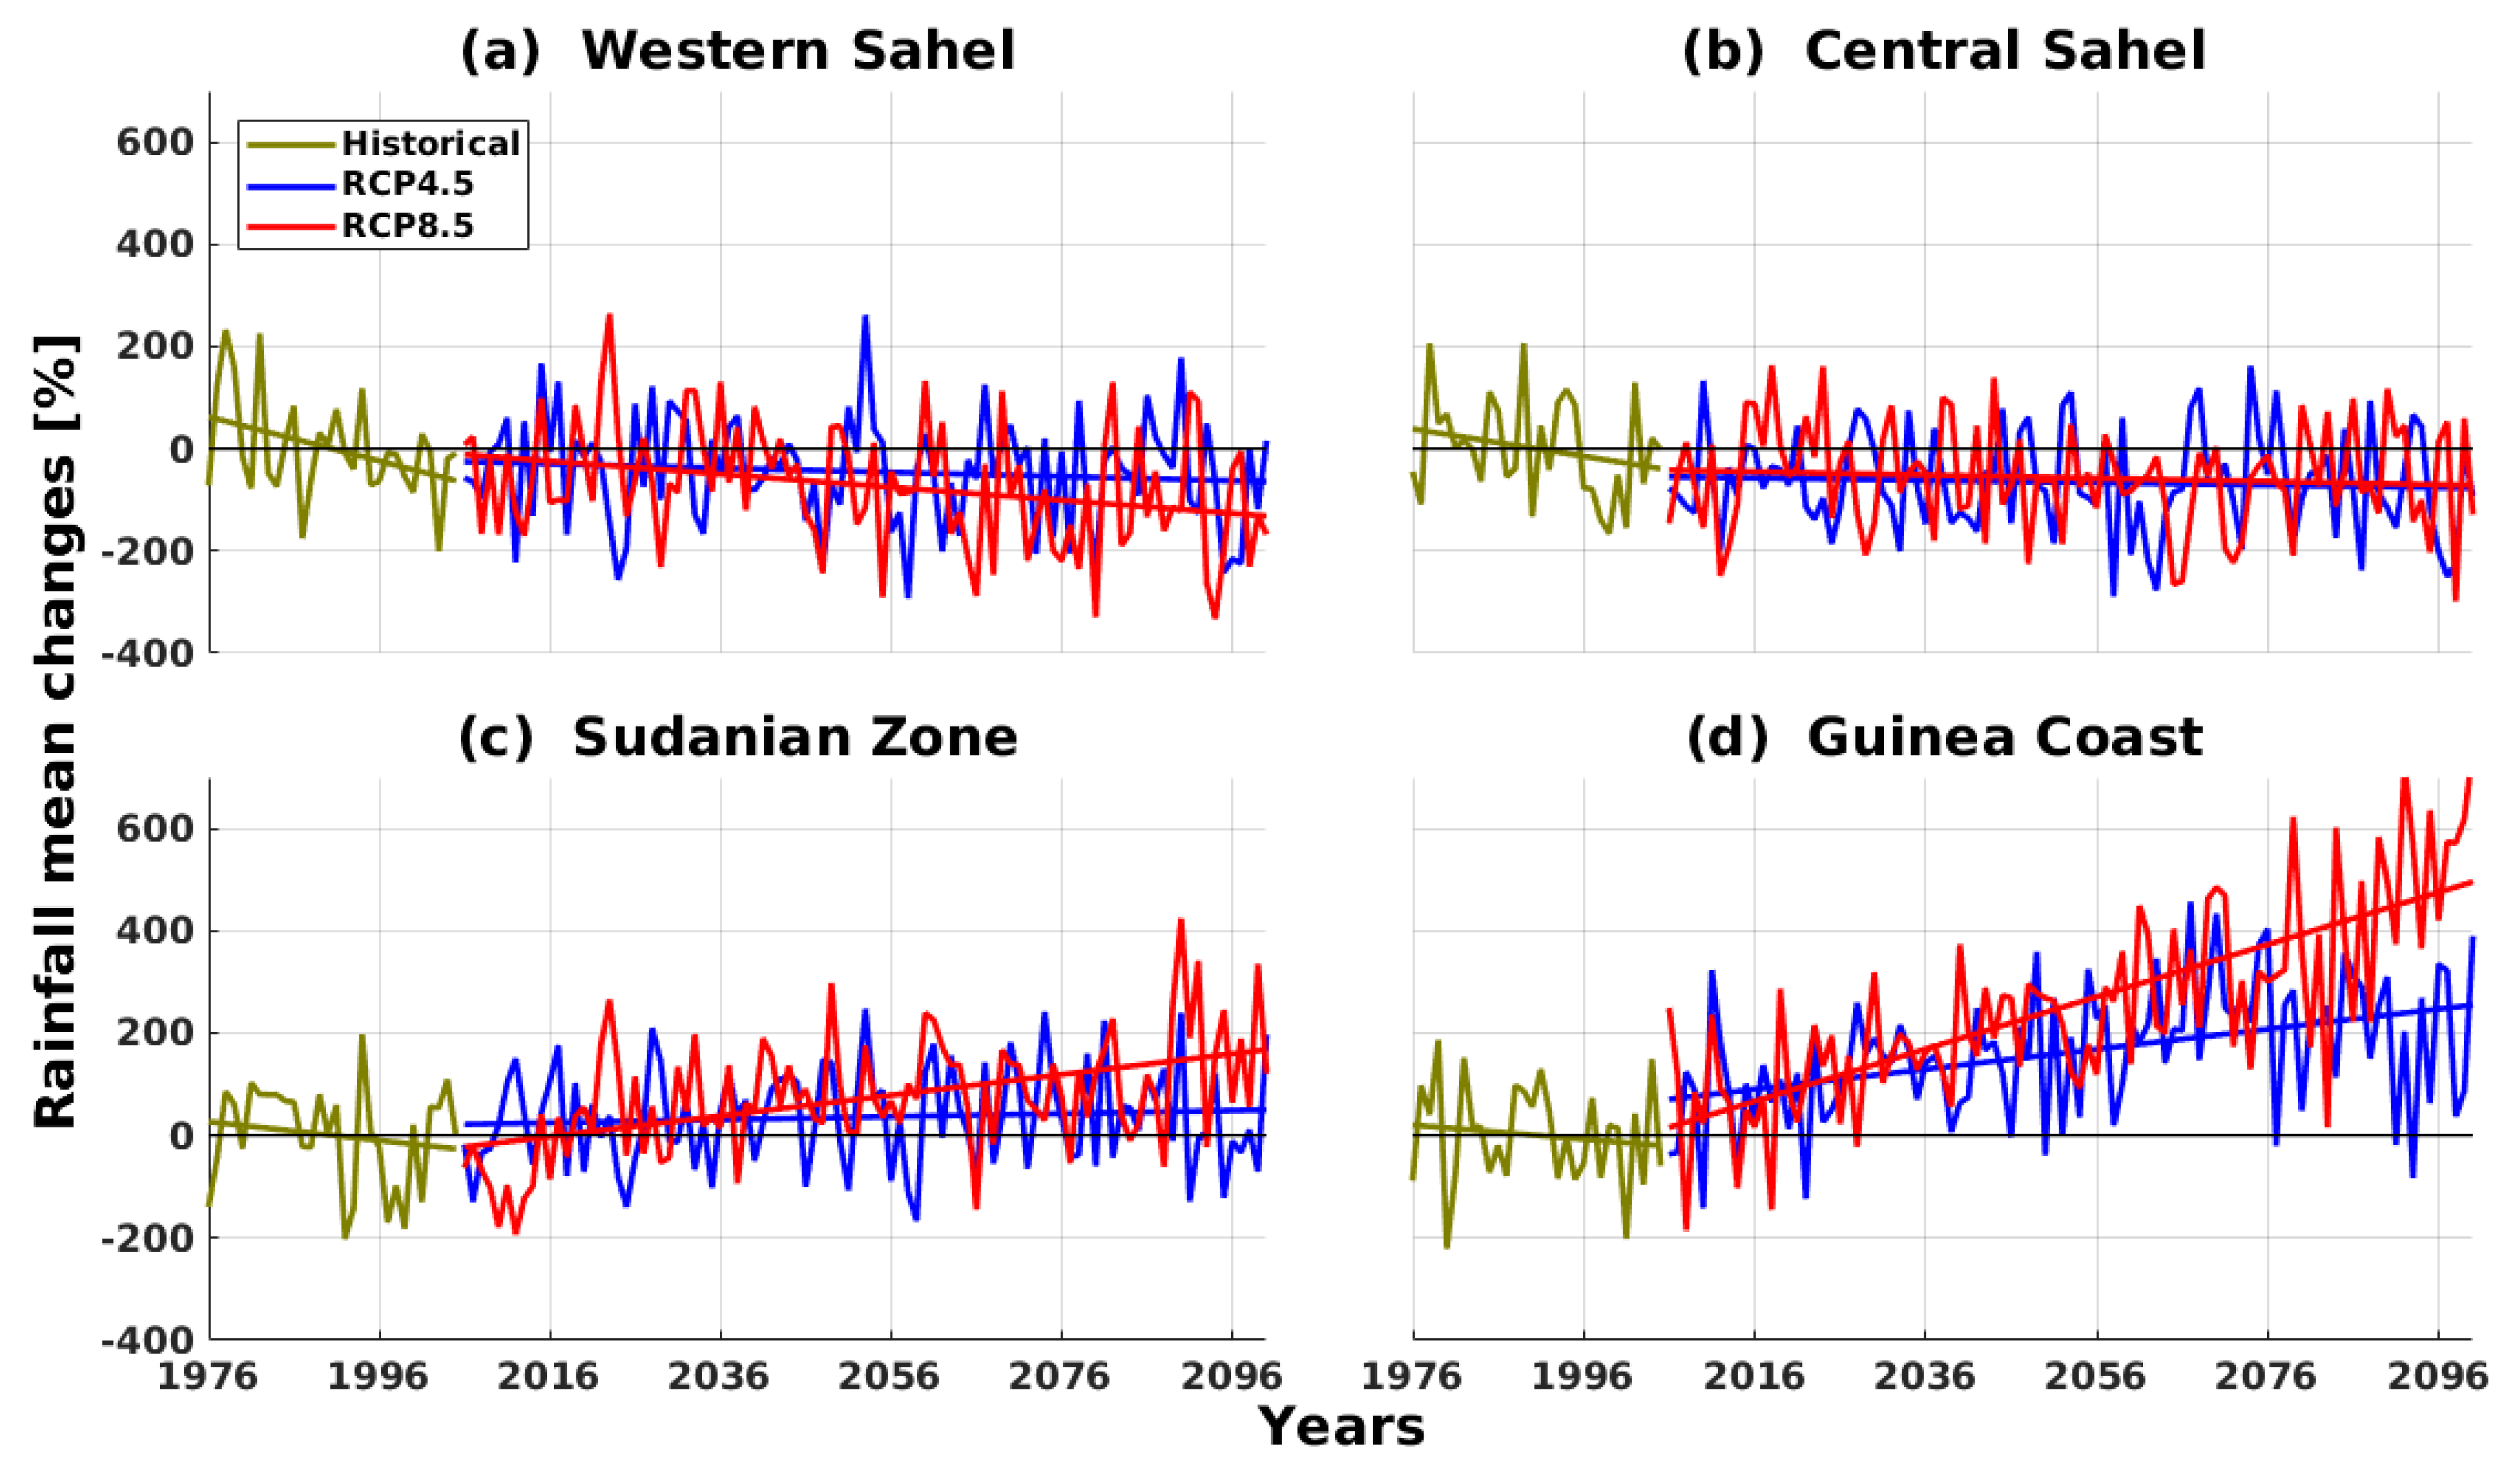
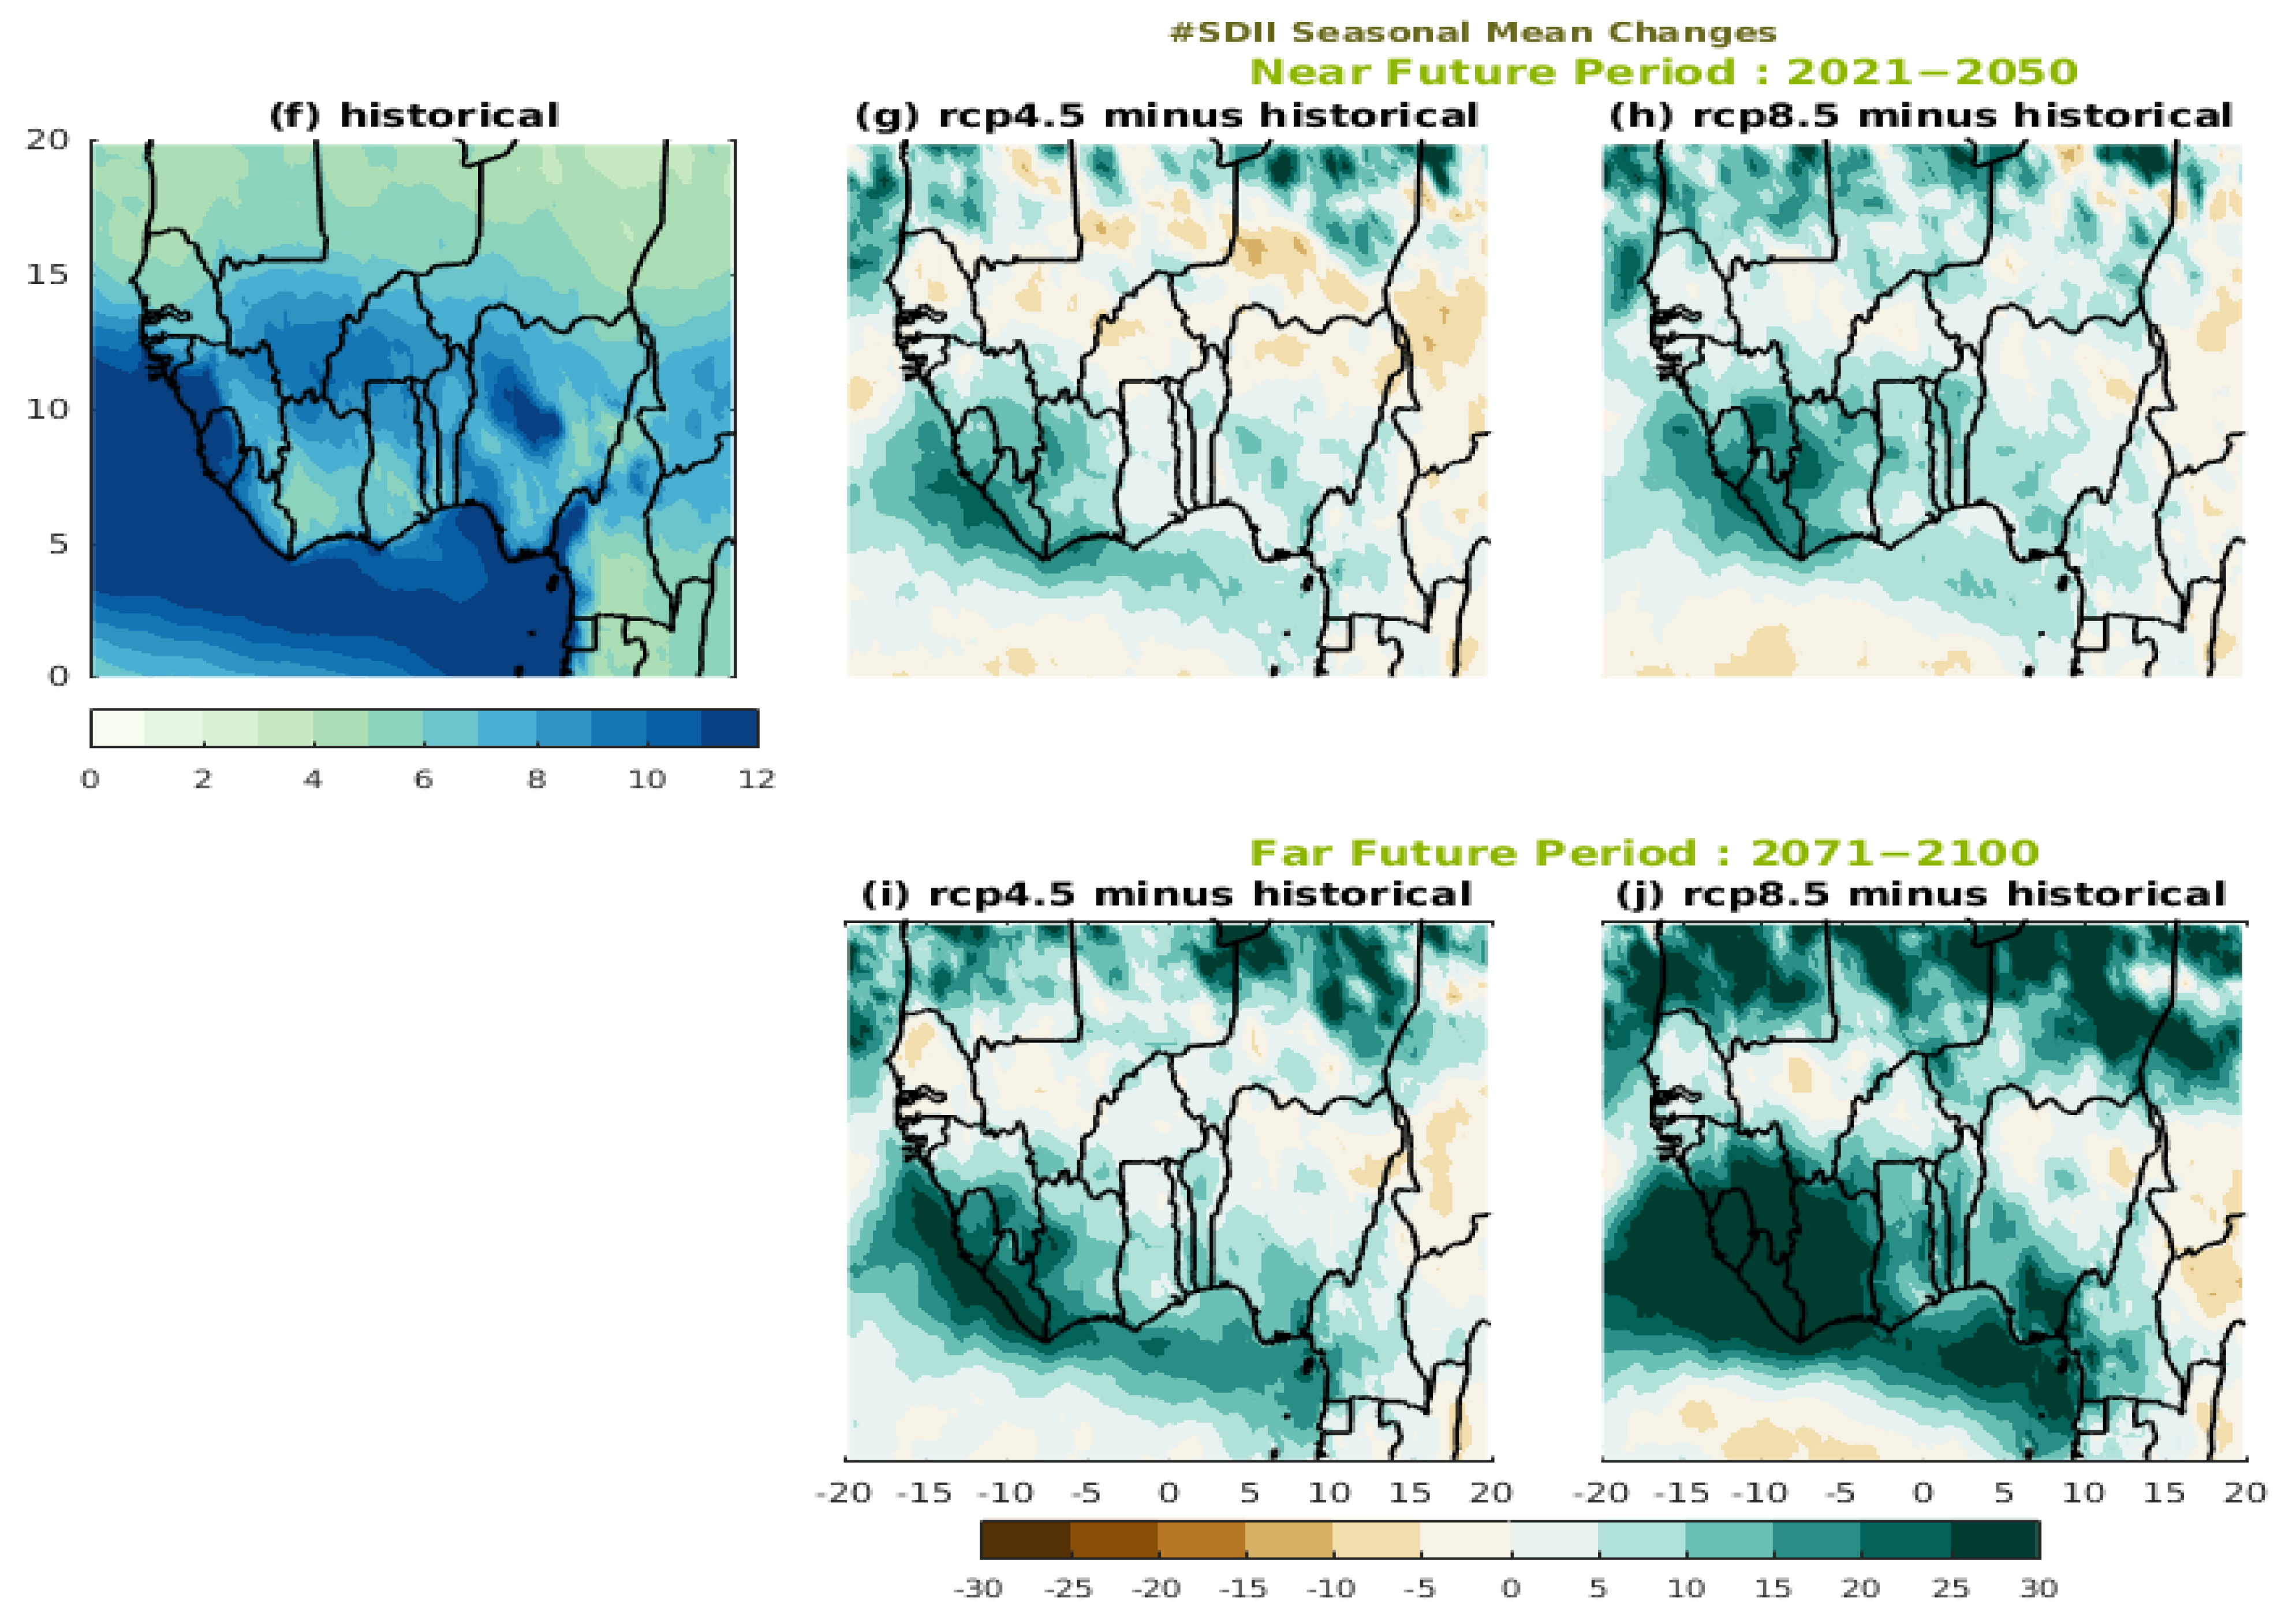
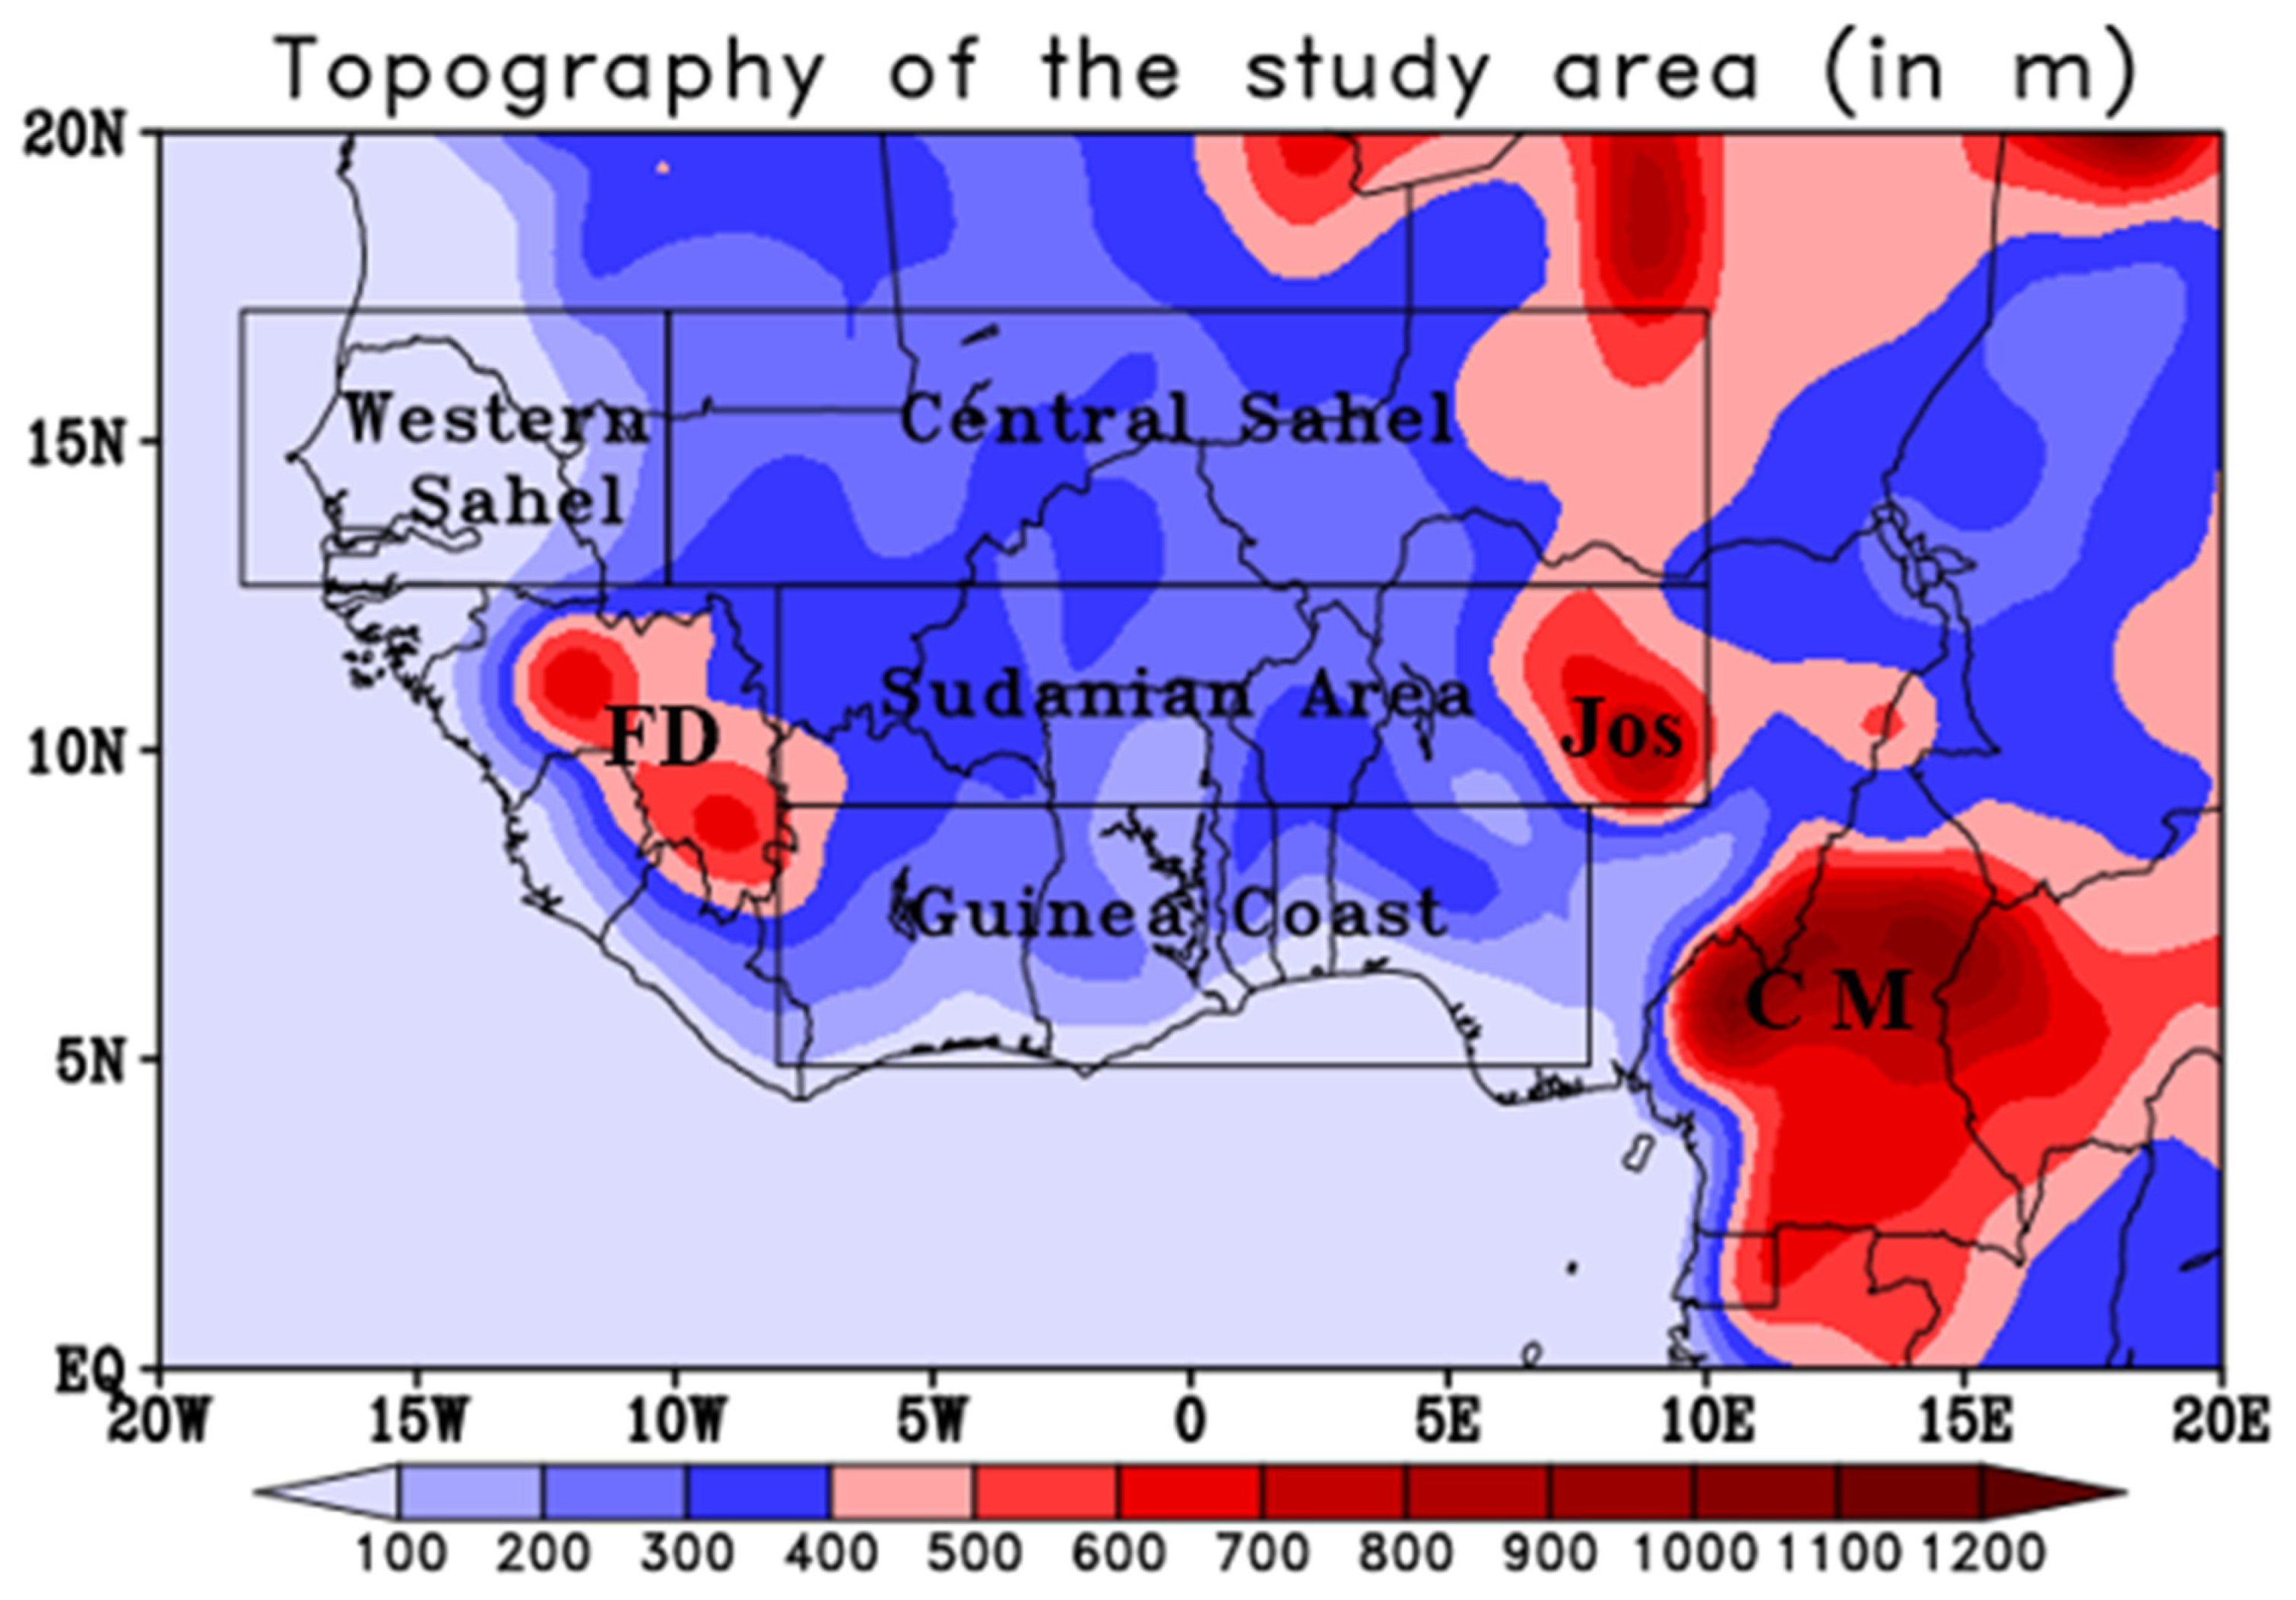
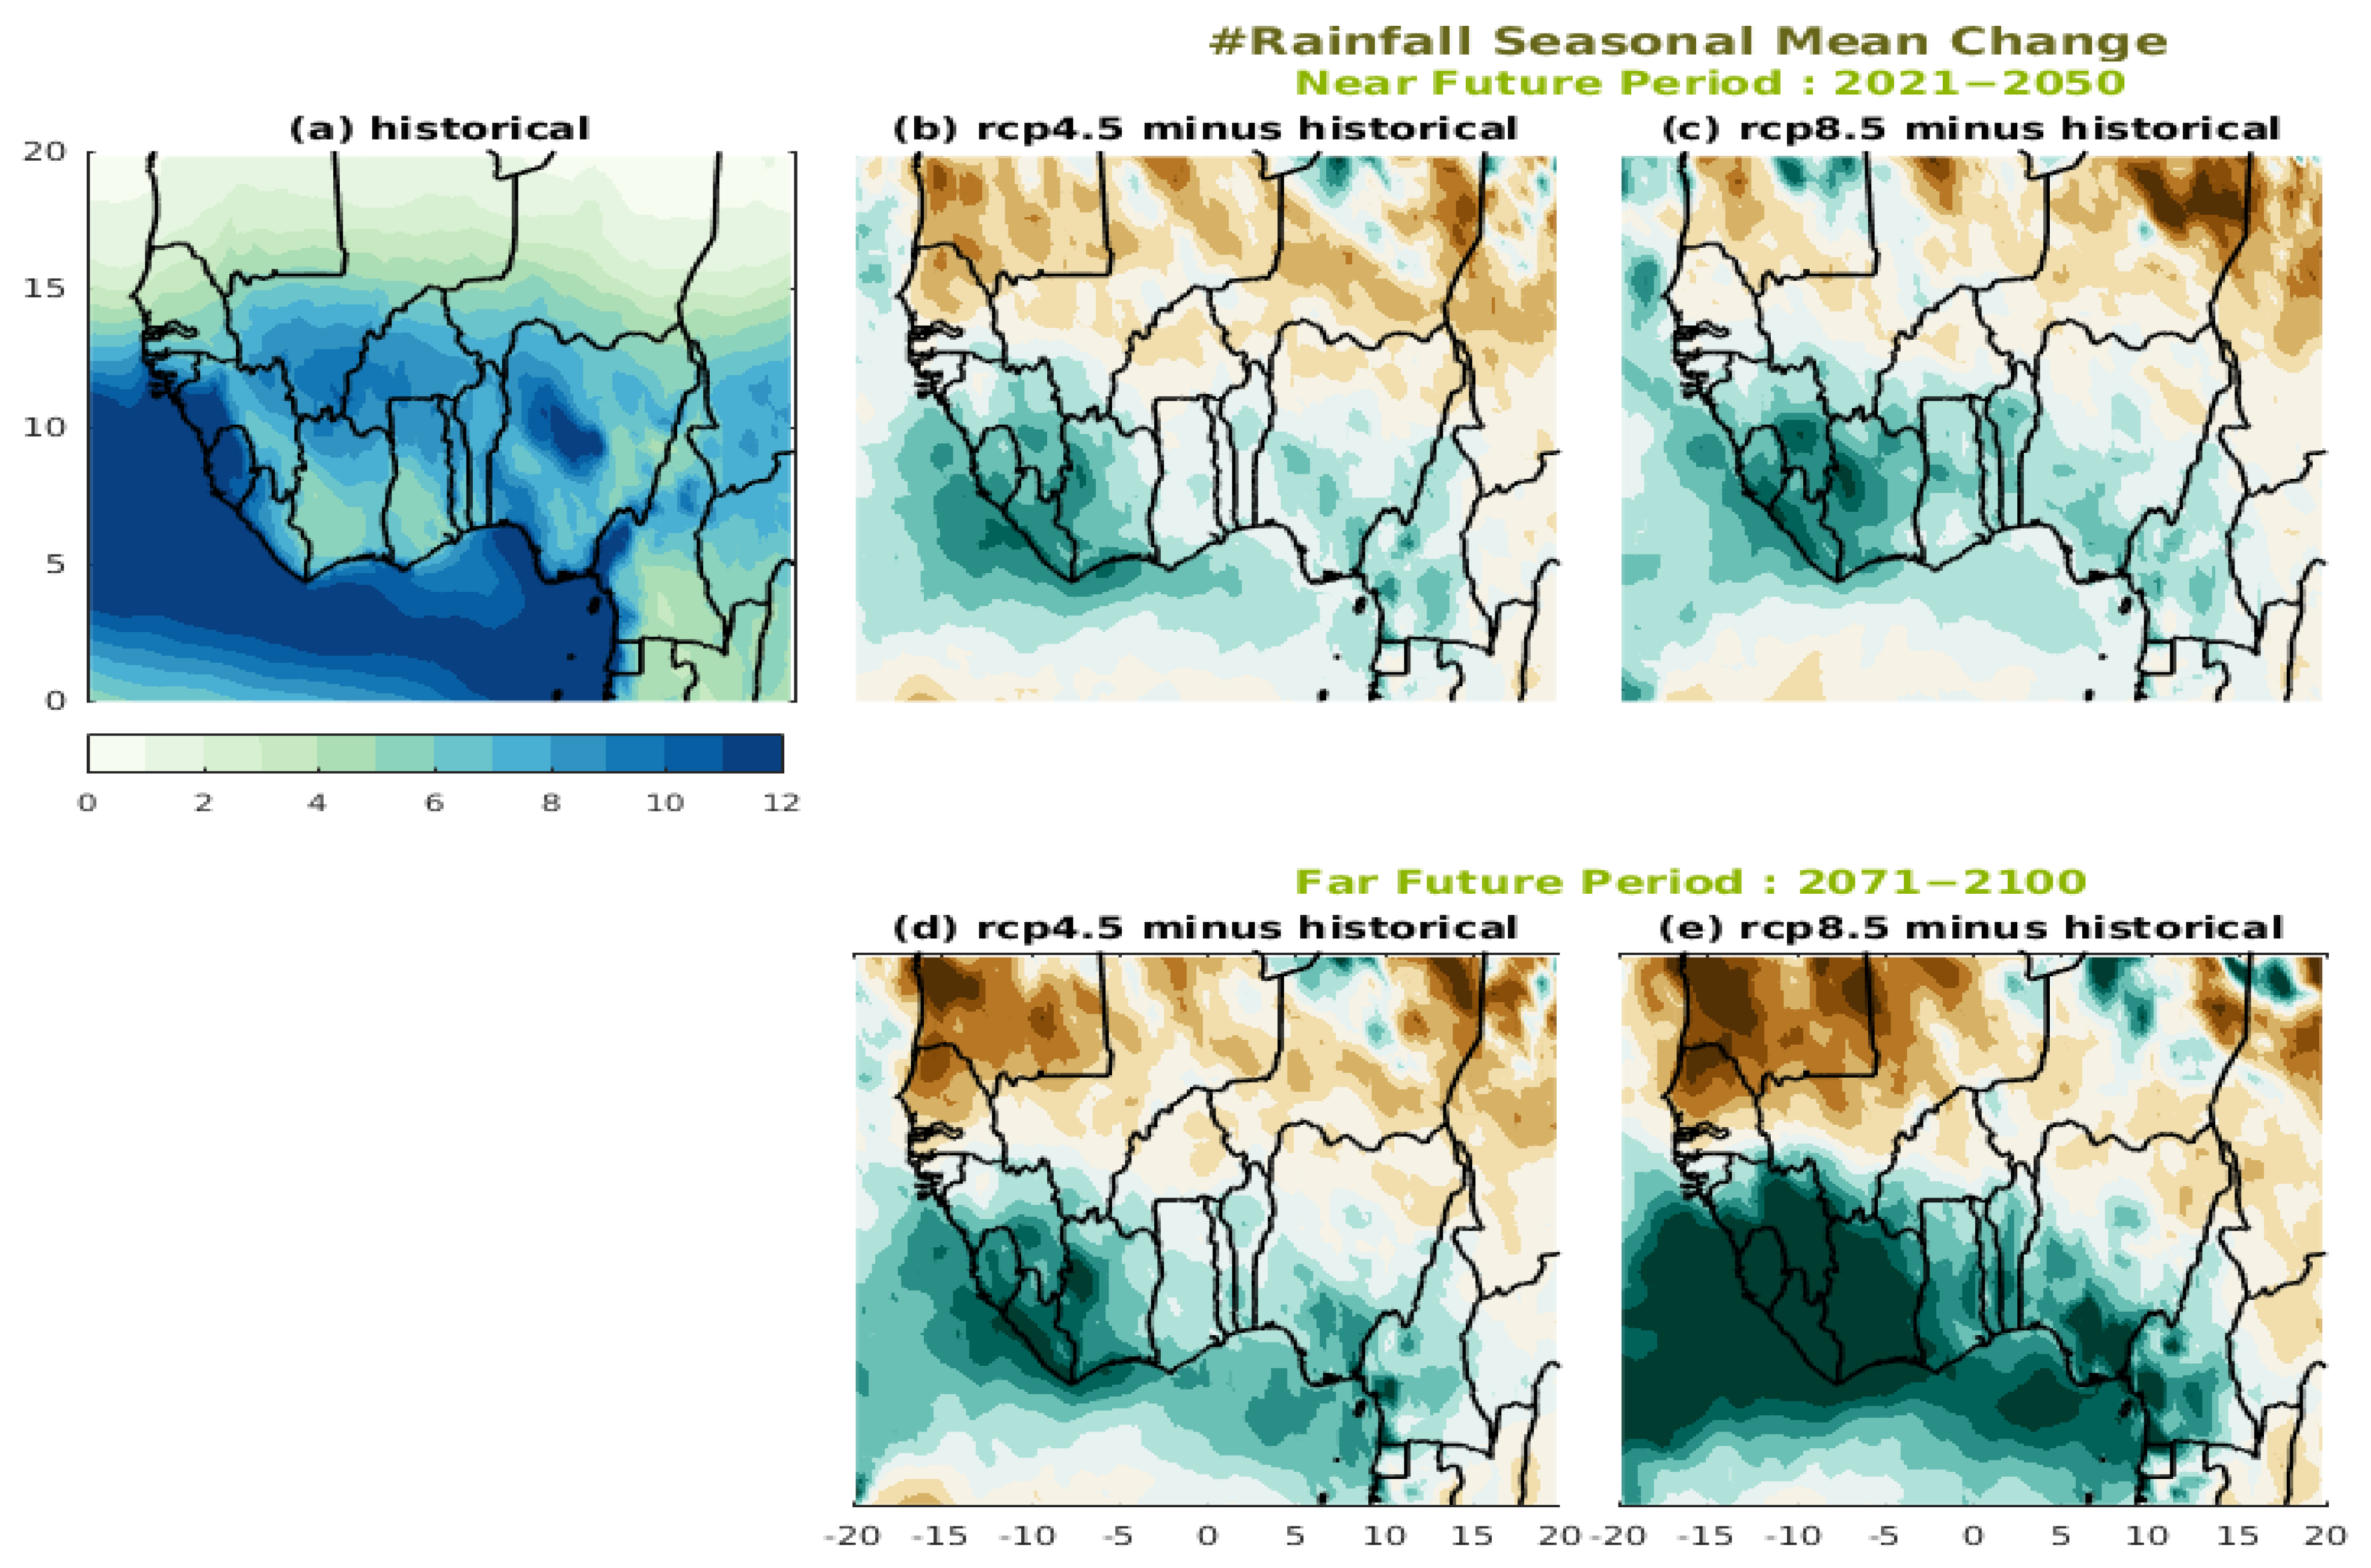
3.1. Spatial Variability of Summer Rainfall

The modeled summer period rainfall (July–September) changes in the near and far futures under the RCP4.5 and RCP8.5 scenarios are presented in Figure 2. The historical rainfall models’ ensemble mean (Figure 2a) presents a zonal distribution with higher values in the mountainous areas (the Fouta Djallon Mountains, Plateau of Jos, and Mountains of Cameroon). The ensemble mean of the models represents the summer rainfall realistically. This distribution corresponds to the findings of [26], who showed that regional climate models reproduce West African summer rainfall quite well. In the future, most Sahelian regions will experience a decrease in average rainfall of around −25% in the near future under both scenarios (Figure 2b,c) compared to the average value of the historical period. However, the Guinean regions are expected to experience an increase of approximately 30% under both scenarios. Changes in rainfall JAS mean in the far future (Figure 2d,e) show a generally larger decrease (increase) than in the near future in the Sahelian regions (more than 30% in the Guinean regions). These results for the Guinean areas are similar to those of [8] in Côte d’Ivoire. These studies showed an increase in the rainfall intensity (SDII) under climate change. Moreover, the decrease in mean rainfall in Sahel is in agreement with the results of [5]. When we consider the very wet days (i.e., annual total rainfall when threshold is greater than the 95th percentile (R95P)), the historical period (Figure 2f) is characterized by the zonal distribution, with the maximum values in the orographic areas (FD, Jos, and CM). In the future periods (Figure 2g–j), an increase in the very wet days (R95P) is projected in most parts of West Africa, except in certain areas such as Senegal, Mauritania, and northern Mali. The changes are more pronounced in the far future and following the RCP8.5 scenario. The mean changes are presented in Table 2 for the study sub–domains (western Sahel, central Sahel, the Sudanian Area, and the Guinea Coast). The most striking feature is the increase in the very wet days (R95P), which is associated with a decrease in average rainfall in central Sahel.

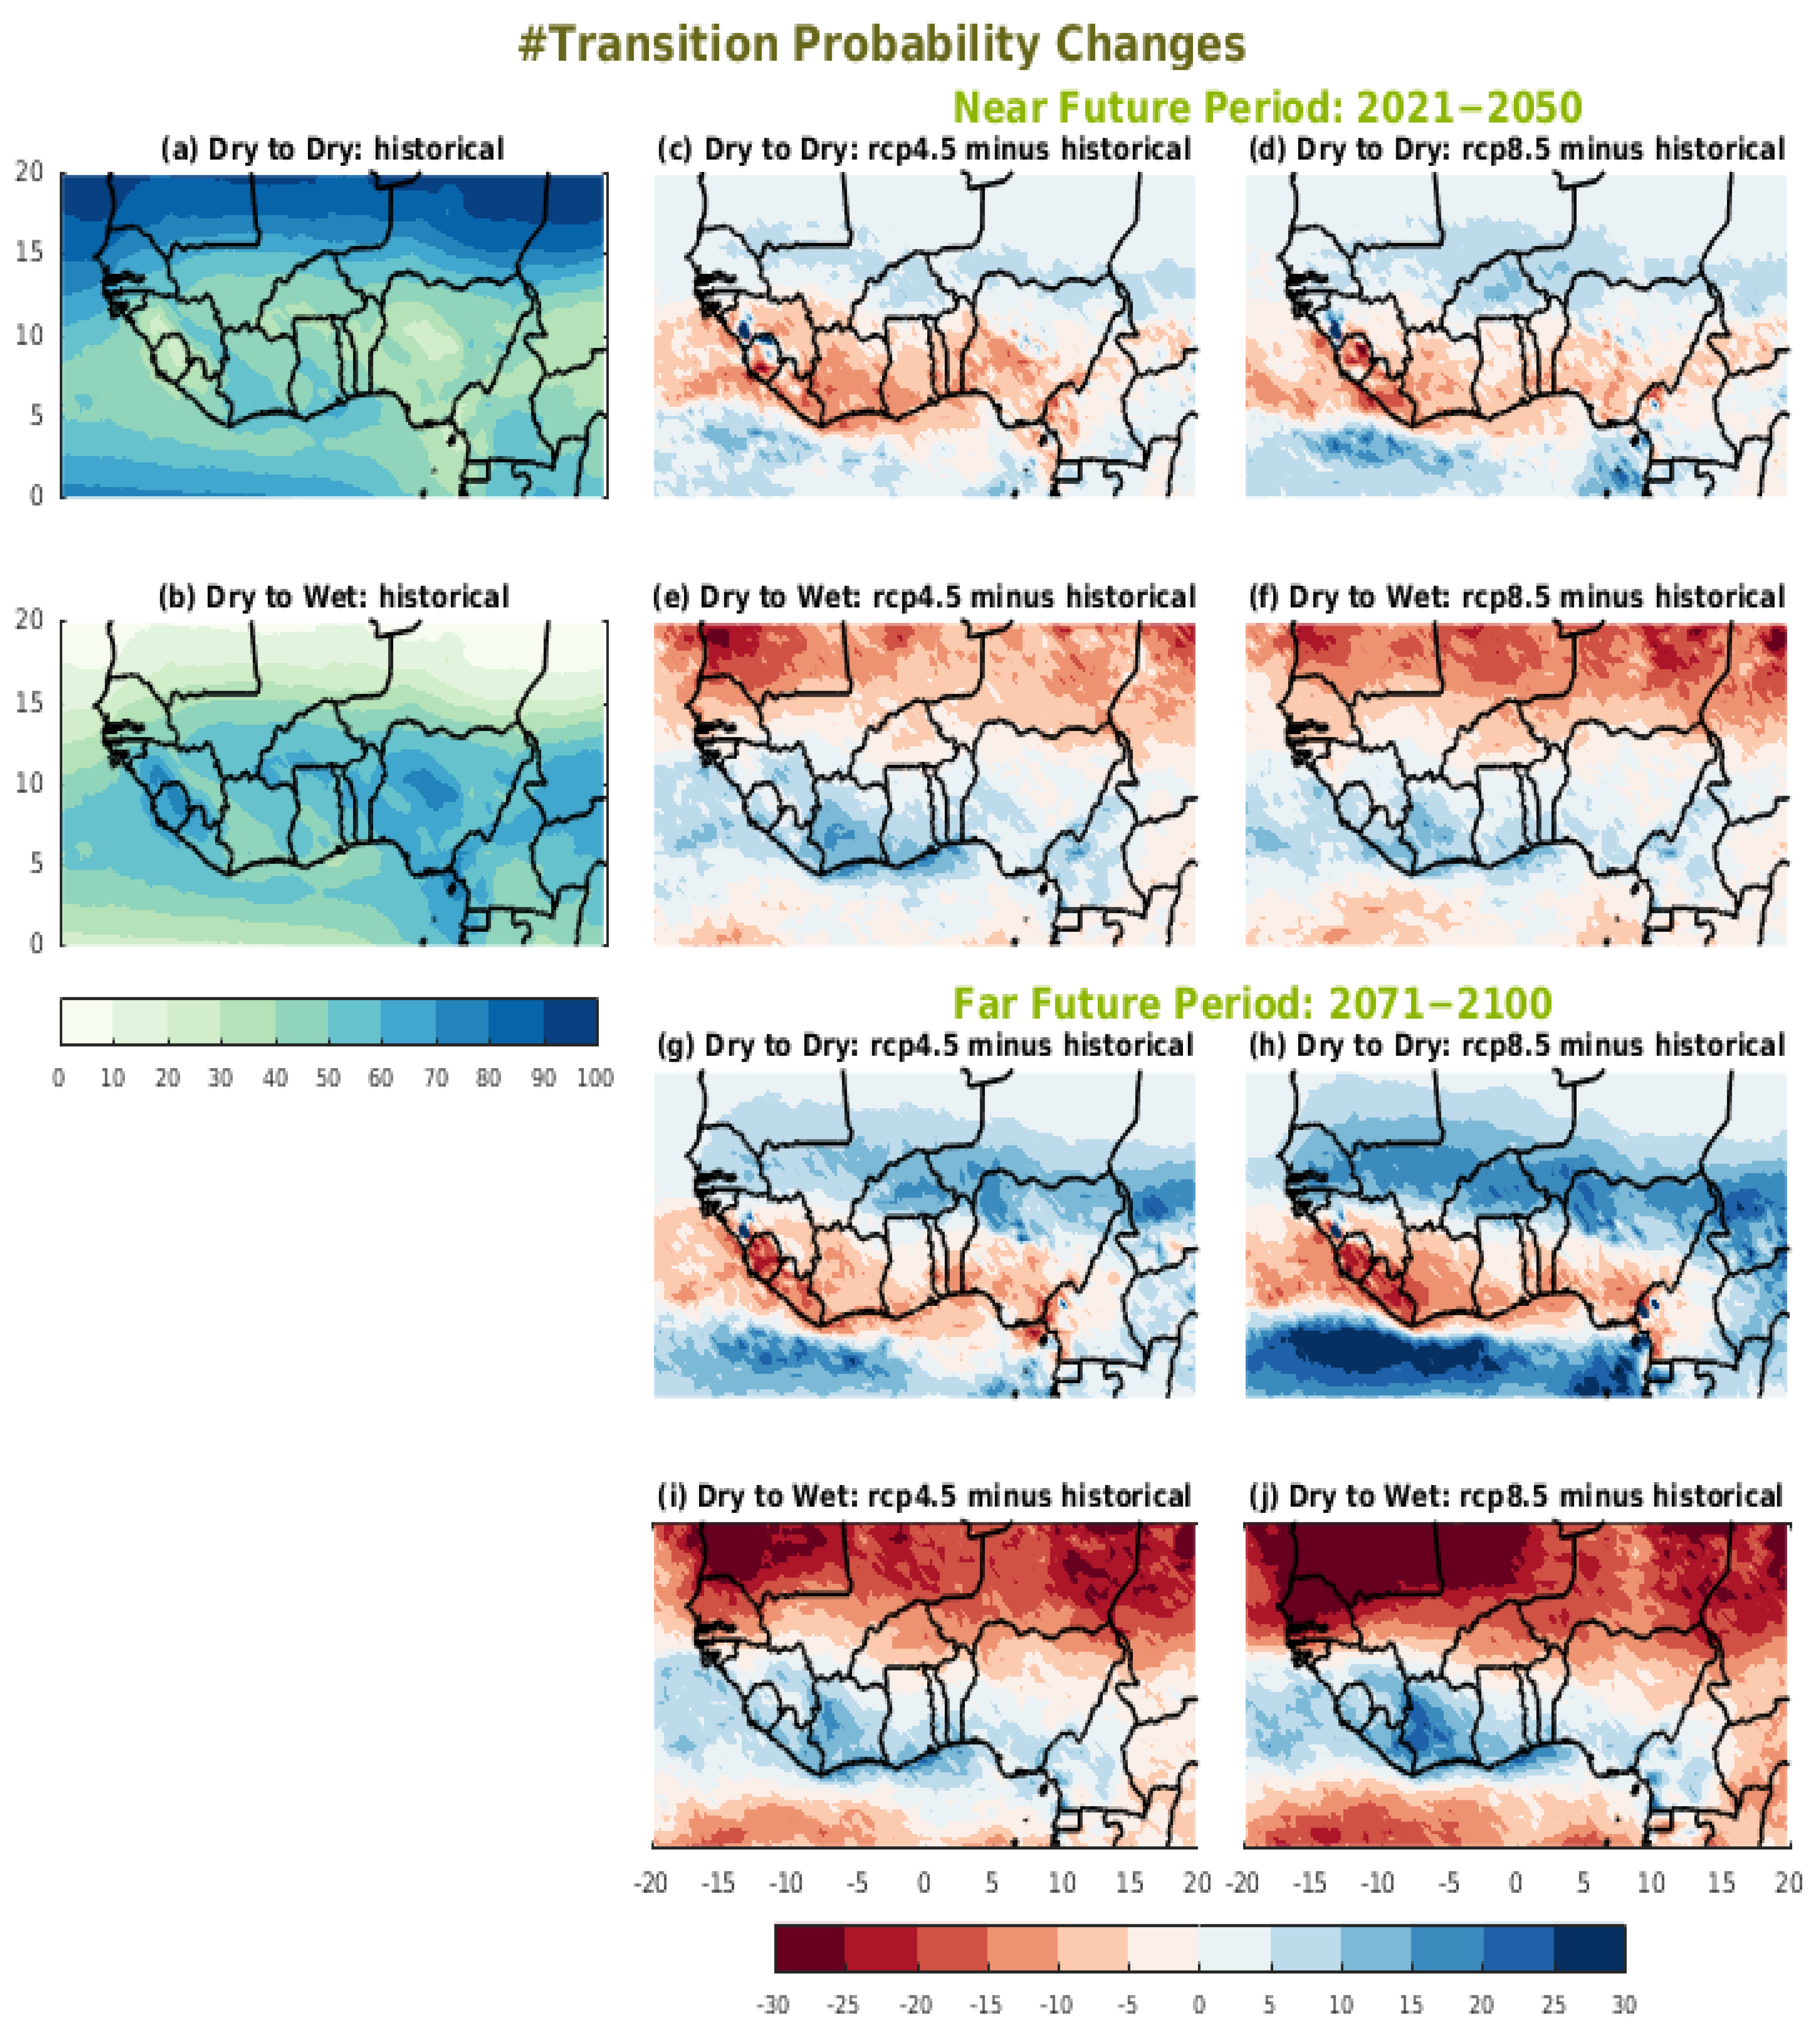
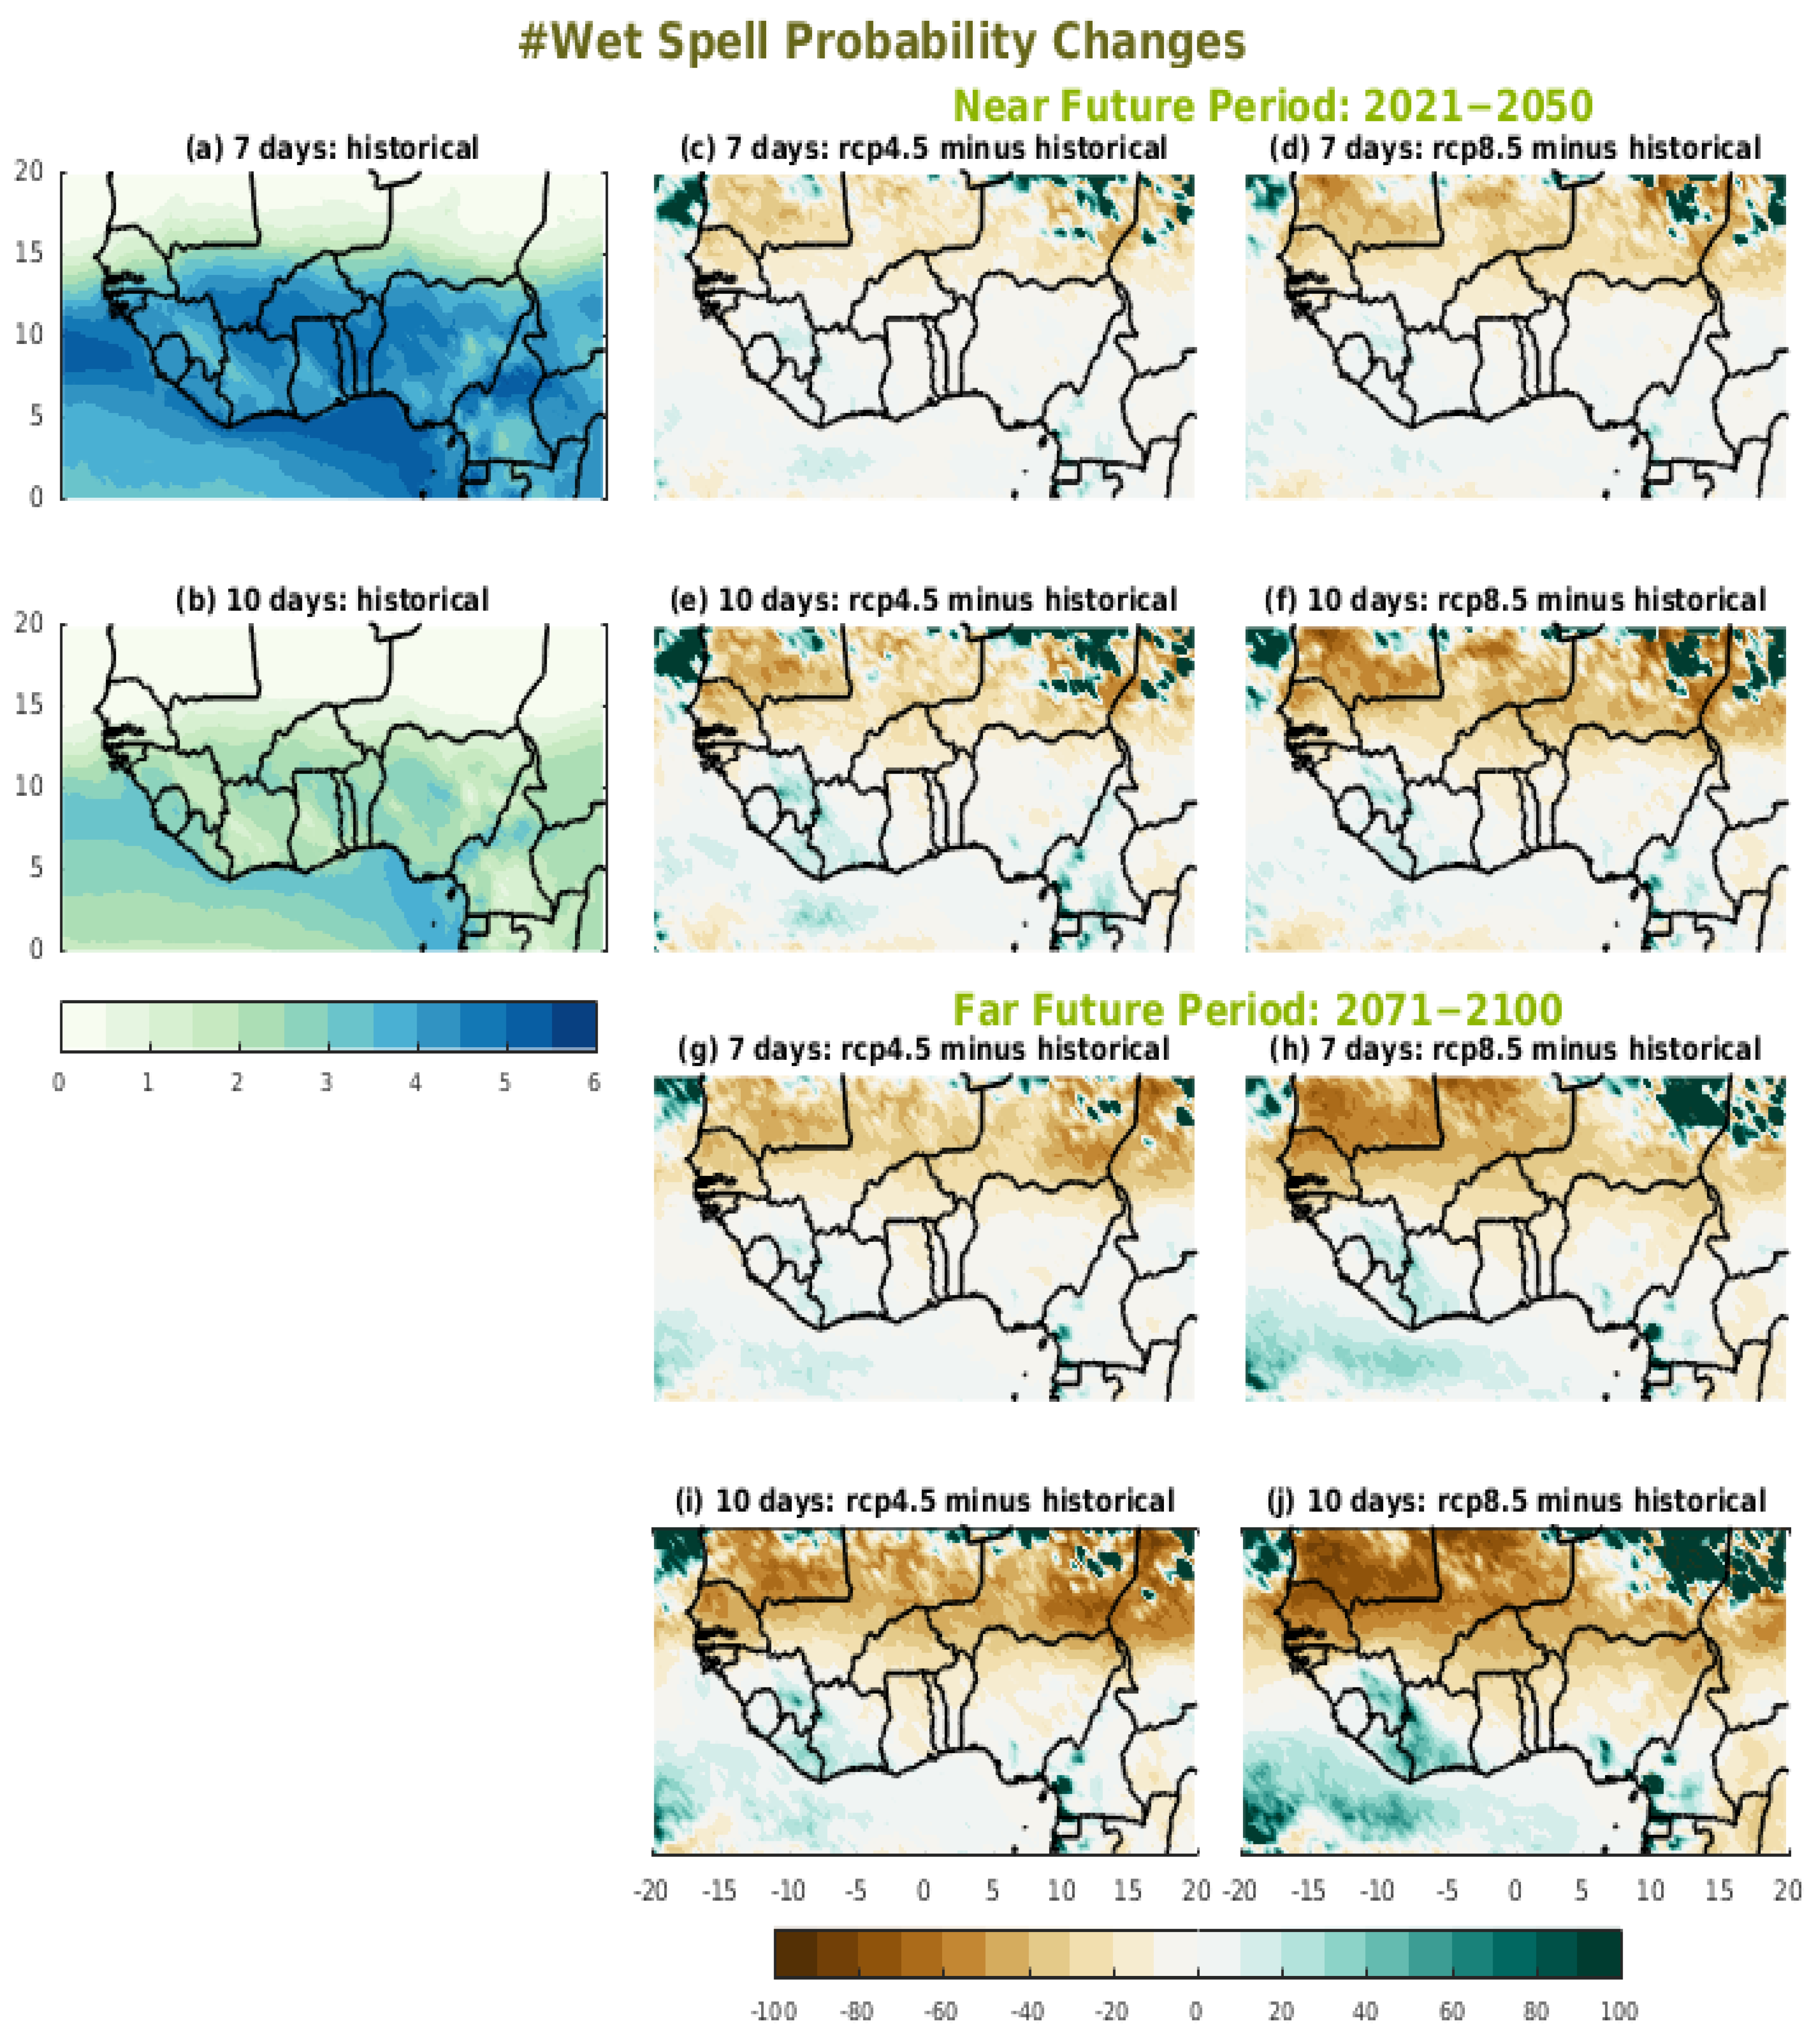
3.2. Spatial Variability of Summer Probabilities

The seasonal (JAS) probability changes in a dry day ( P d ) and a wet day ( P w ) in the near future and far future are presented in Figure 3. In the near future, the model ensemble average shows an increase in the P d probabilities over the Sahelian regions and a decrease over the Guinean regions under both scenarios (Figure 3c,d) compared with the historical period (1976–2005). This change is more pronounced under the RCP8.5 scenario (up to 15%) in Sahel and under the RCP4.5 scenario (up to −25%) in the Guinean Coast. For the P w probabilities (Figure 3e,f), a decrease was noted over the Sahelian regions, especially over the north for both scenarios. This decrease is more prominent in the RCP8.5 scenario (up to −25%), particularly in northern Senegal, Mauritania, and northern Mali. The changes in the P d probabilities in the far future (Figure 3g,h) generally exhibit a larger increase (decrease) than in the near future in the Sahelian regions (Guinea regions) by more than 30% (up to −25%) under RCP8.5. As in the case of the P d probabilities, the P w probabilities (Figure 3i,j) show a stronger decrease (increase) in the Sahelian regions (Guinea Coast) than in the near future. The increase in the P d probabilities over the Sahelian regions is due to a decrease in mean rainfall while the decrease in the P w probabilities over the Guinean coasts is due to an increase in mean rainfall.
The differences in the transition probabilities ( P d d , P d w ) between the historical and future periods are shown in Figure 4. In the near future, the model ensemble mean predicted an increase in the P d d probabilities in the northern parts of West Africa, particularly in the Sahelian regions, and a decrease in the south (i.e., Guinea Coast) under both scenarios (Figure 4c,d) compared to the reference period. The increase in the Sahelian regions is more important in RCP8.5, especially over central Sahel (up to 15%) and the decrease over the Guinea Coast is more remarkable under RCP4.5 (up to −30%). Considering the P d w probabilities, shown in Figure 4e,f, the model ensemble mean shows a decrease in the northern parts of West Africa under both scenarios compared to the historical period, more pronounced in the large part of the Sahel under the RCP8.5 scenario (up to −25%). However, an increase is diagnosed in the southern part of West Africa, especially over the Guinea Coast, under both scenarios, with larger changes under the RCP4.5 scenario (up to 25%). This picture is similar in the far future (Figure 4g–j), where the rainy season is associated with an increase in the P d d probabilities (Figure 4g,h) in the most parts of the Sahel (around 25%) and a decrease in the Guinea Coast (around −30%) under the RCP8.5 scenario. In contrast to the P d d probabilities, the P d w probabilities are characterized by an increase in Sahel and a decrease over the Guinea Coast (Figure 4i,j). However, the changes were more pronounced under the RCP8.5 scenario (up to −30% in the majority of Sahel and up to 25% in the Guinea Coast).
The probabilities P w w and P w d are shown in Figure 5. West Africa is characterized by high (low) P w w ( P w d ) probabilities in the study areas (i.e., western Sahel, central Sahel, the Sudanian Area, and the Guinea Coast), particularly in the mountainous regions (Figure 5a,b). These model-averaged findings are consistent with the results observed by [16] over the same areas. The changes in the P w w probabilities in the near future (Figure 5c,d) are characterized by a decrease in the northern parts of West Africa under both scenarios. The decrease is more pronounced under the RCP8.5 scenario (up to −20%). In contrast, a weak increase is projected under both scenarios in the southern part of West Africa (southern Conakry Guinea, Liberia, Sierra Leone, and Côte d’Ivoire). Regarding the P w d probabilities (Figure 5e,f), the model ensemble mean predicts an increase over the north and a decrease over the south of West Africa under both scenarios. The increase over the north is more pronounced following the RCP8.5 scenario (Figure 5f) and the decrease over the south following the RCP4.5 scenario (Figure 5e).
The changes in P w w probabilities in the far future are reported in Figure 5g,h for the two scenarios. In general, considering both scenarios, we observe a decrease in the P w w probabilities of up to −15% under the RCP4.5 scenario and of more than −25% under the RCP8.5 scenario in the northern parts of the West Africa region, except for the southern areas (Sierra Leone, Liberia, southern Conakry Guinea, southern Côte d’Ivoire, and southern Nigeria) where an increase of around 5% under the RCP4.5 and up to 10% under the RCP8.5 scenarios is observed. The changes in the P w w probabilities are larger in the far future than in the near future.
Regarding the P w d probabilities (Figure 5i,j), an inverse scenario is observed with respect to the P w w probabilities. An increase of up to 20% under the RCP4.5 scenario and more than 30% under the RCP8.5 scenario is expected over the northern part of West Africa. However, some parts in the south of West Africa will experience a decrease in the P w d probabilities under both scenarios and this is more pronounced under the RCP8.5 scenario (up to −30%).
The average changes in consecutive dry days of different durations from historical simulations (1970–2005) as well as changes in future periods are evaluated and the results are illustrated in Figure 6. As shown in Figure 6a, the West African region exhibits low probabilities of 7−day dry spells located in the study areas, particularly in the mountainous areas such as the high plateau of Fouta Djallon, the plateau of Jos, and the Mountains of Cameroon. The overall model mean probabilities of 10−day dry spells (Figure 6b) are similar to those of 7−day dry spells but with lower probabilities over most of West Africa. The changes in the probabilities of 7−day and 10−day dry spells in the near future under the RCP4.5 and RCP8.5 scenarios are shown in Figure 6c,d and Figure 6e,f, respectively. Under global warming, the models average shows an increase in the 7− and 10−day dry spell probabilities over the Sahelian regions under both scenarios, but the magnitude of the changes and their spatial extension are greater under RCP8.5 (up to 100% for 7−day and more than 100% for 10−day dry spell probabilities). However, a decrease of up to −50% in the 7−day dry spell probabilities occurs and a decrease of up to −75% in the 10−day dry spell probabilities occurs over the Guinea Coast for both global warming scenarios. The same is true in the far future (Figure 6g–j), where the rainy season is associated with a more important increase compared to the near future in the dry spell probabilities in Sahel and a decrease over the Guinea Coast. However, our results confirm those of [5], who predicted an increase in the occurrence of the maximum duration of dry spells over Sahel. The dry spell probabilities increasing is associated with the decrease in the number of wet days (R1mm) (Appendix A, Figure A7b–e) and the increase in the daily intensity index (SDII) (Appendix A, Figure A7g–j) in the Sahel regions and in the northern Sudanian Area. In addition, the increase in the dry spell probabilities is associated with the decrease in the very wet days (R95P). Furthermore, our results are also consistent with those of [8] over Côte d’Ivoire (Guinea Coast region) during the summer monsoon season (JAS).
Similar to the consecutive dry days, the ensemble mean of the consecutive wet day probabilities with varying lengths over the historical period is shown in Figure 7a,b. As shown in Figure 7a, the model ensemble mean shows higher probabilities for seven consecutive wet days located in the study areas and low probabilities in northern Sahel. The probabilities of consecutive wet days decrease with increasing duration (Figure 7b) and are noted in mountainous areas. These regions with higher probabilities of consecutive wet days are also characterized by a higher rainfall mean and higher intensity during the West African monsoon season [16].
Changes in the 7−day wet spell probabilities in the near future are shown in Figure 7c,d, following scenarios RCP4.5 and RCP8.5. A decrease in the 7−day wet spell probabilities is projected over the Sahelian regions under both scenarios. However, the decrease is more pronounced in the RCP8.5 scenario (up to −40%). These changes are also observed in the 10−day wet spell probabilities (Figure 7e,f) with a larger decrease (up to −60%) compared to the 7−day dry spell probabilities. In addition, a lower increase is expected in some areas of the Guinea Coast (Guinea Conakry, Liberia, and Côte d’Ivoire). Thus, the far-future changes in the 7−day wet spell (Figure 7g,h) and the 10–day wet spell (Figure 7i,j) probabilities show a generally larger decrease under RCP8.5 (up to −80% for the 7−day wet spell and more than −90% for the 10−day wet spell probabilities) in the Sahel sub-regions than in the near future. However, a weaker increase in the consecutive wet day probabilities appears across the Guinea Coast, particularly south of the regions such as Côte d’Ivoire, Guinea Conakry, and Liberia, and is more pronounced following the RCP8.5.

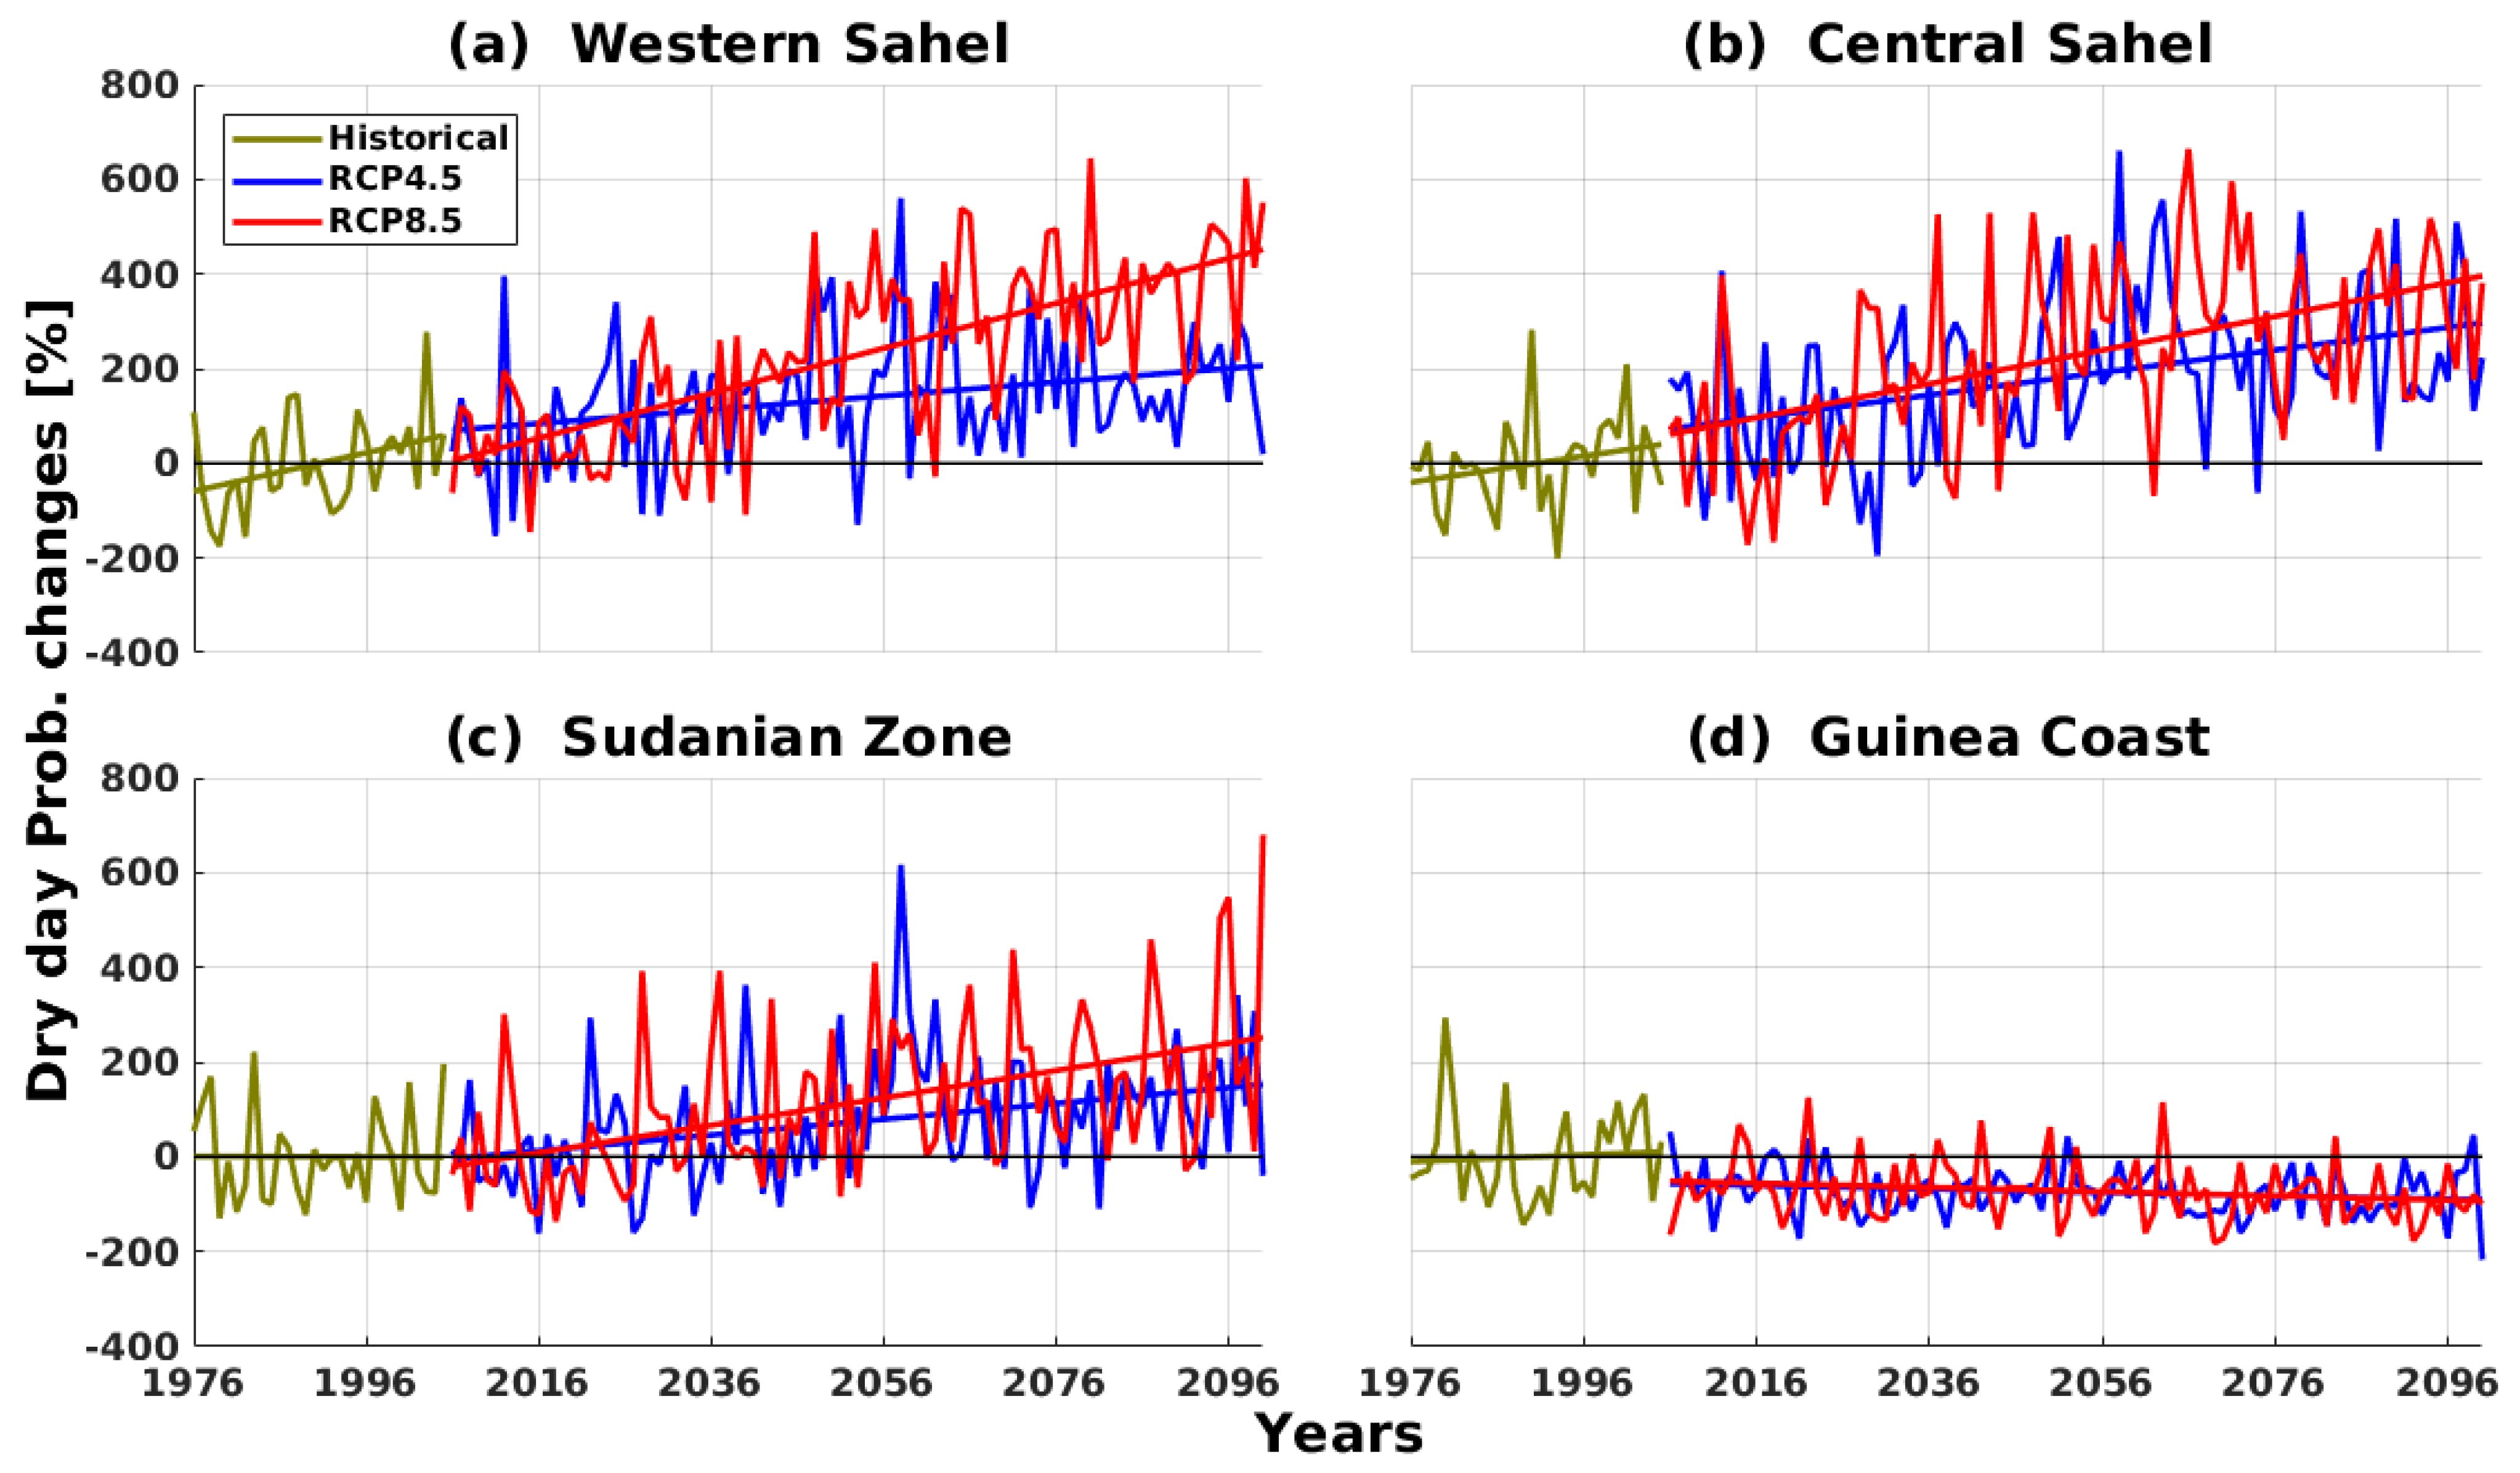
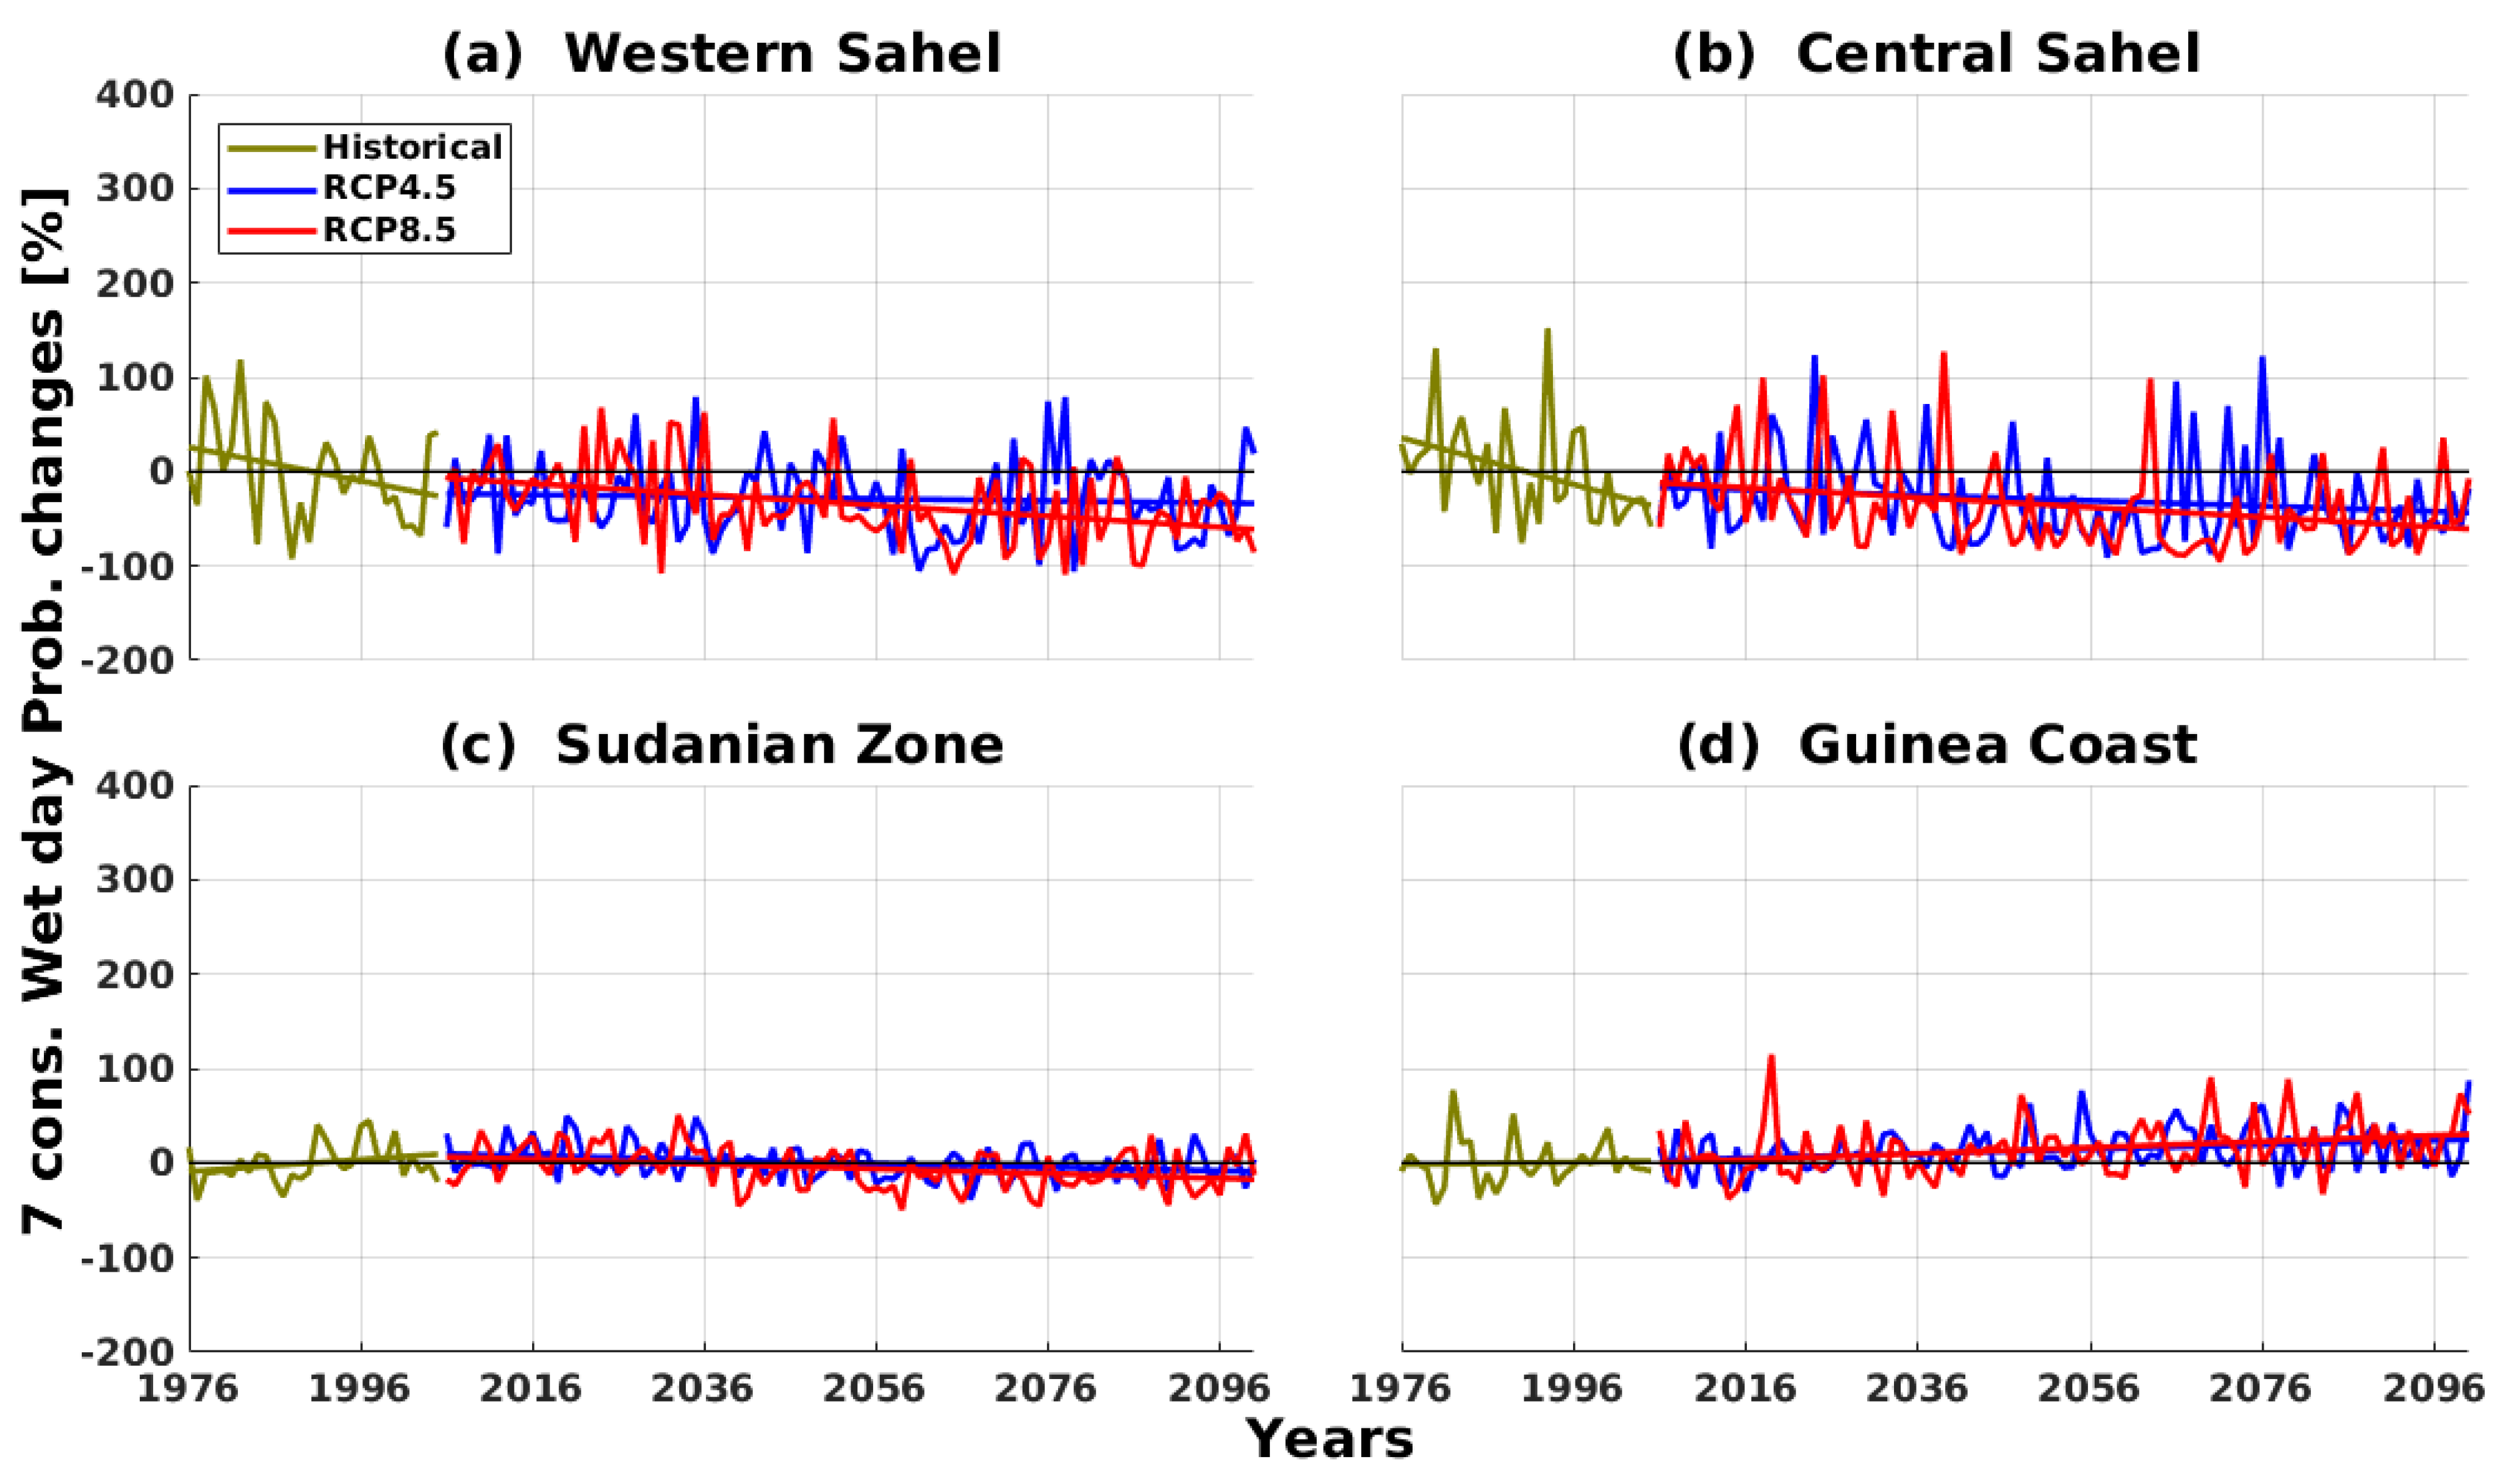
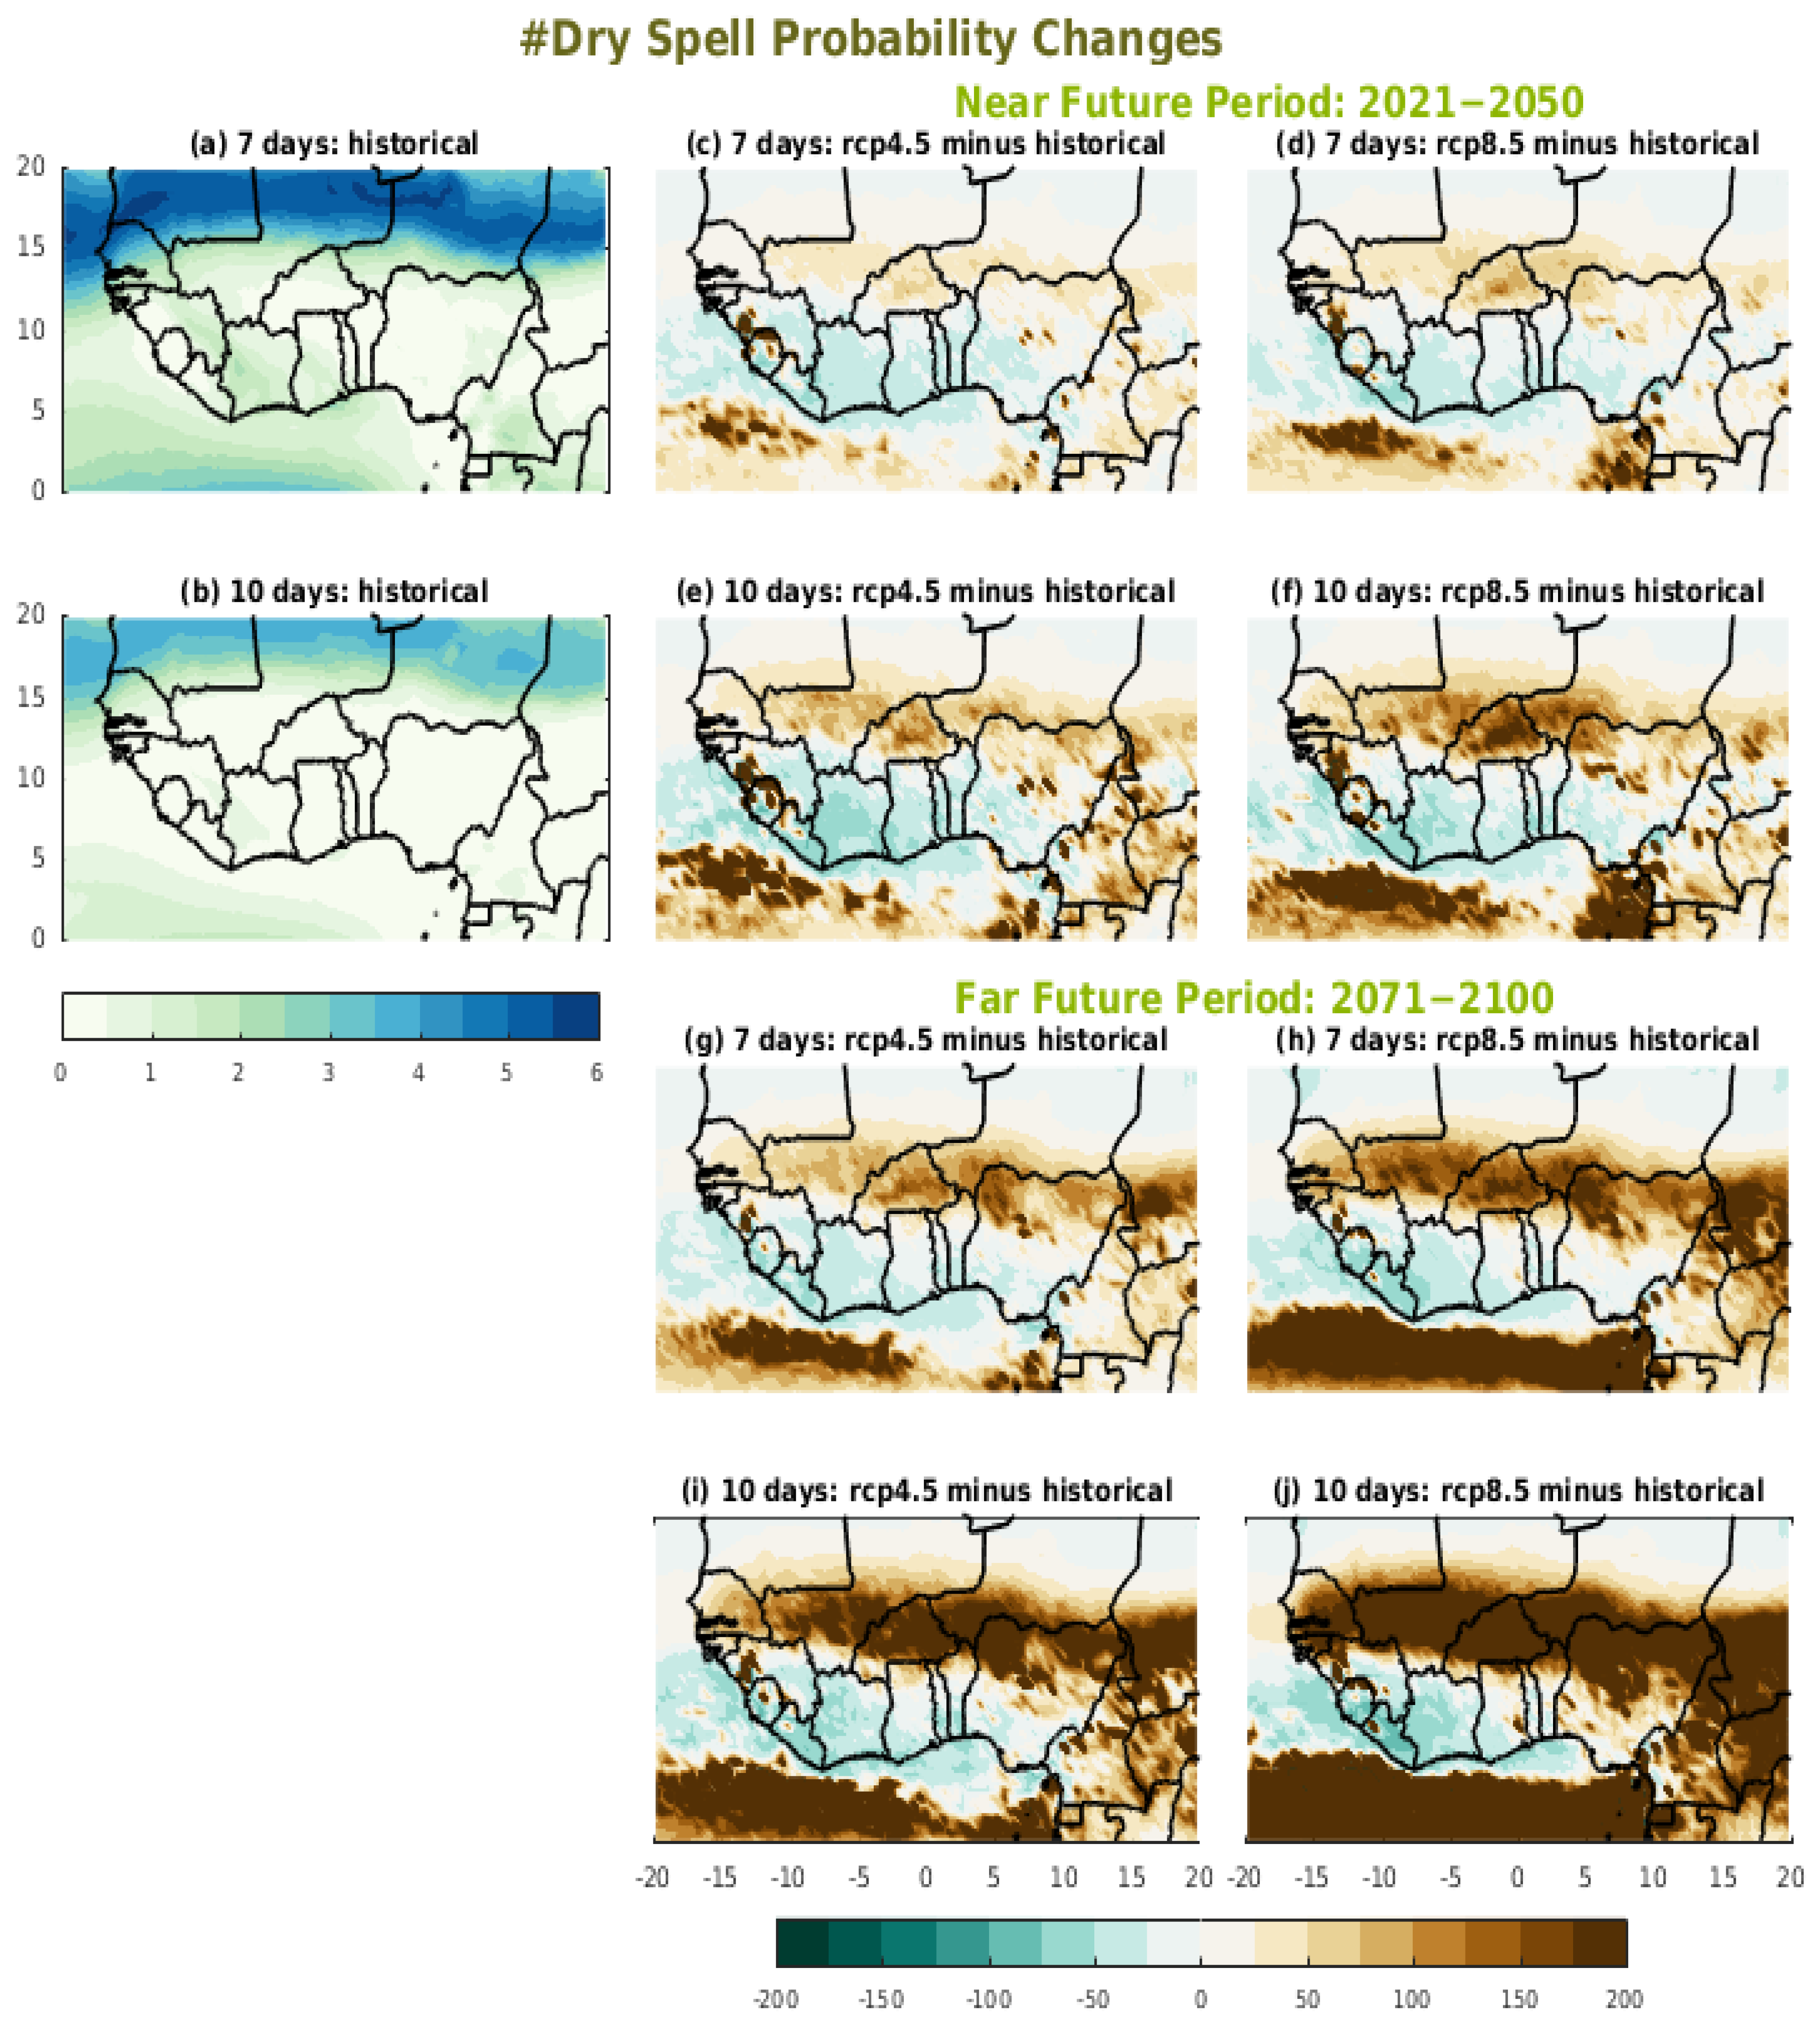
3.3. Mean Changes in Dry and Wet Spells

The quantitative values during the rainy season (JAS) over the four regions of West Africa (western Sahel, central Sahel, the Sudanian Area, and the Guinea Coast) are reported in Table 3 for the 7− and 10−day dry spell, and 7− and 10−day wet spell probabilities. As shown in Table 3, the models’ ensemble mean shows (on average) the dry spell probabilities increasing in western Sahel, central Sahel, and the Sudanian Area for all considered categories (i.e., 7− and 10−day durations). The maxima of the probabilities are observed in central Sahel (up to 82.35%, on average) when we consider the 7−day dry spell probabilities and in western Sahel (up to 223.04%, on average) in the case of the 10−day dry spell probabilities in the far future and following the RCP8.5 scenario. In contrast, a dry spell probability decrease is predicted over the Guinea Coast in the two future periods. However, the decrease is more important in the far future and under the RCP4.5 scenario, with probabilities of −27.42% for the 7−day dry spells and of −34.10% for the 10−day dry spells. In addition, a decrease in the probability of wet spells is predicted in western Sahel, central Sahel, and the Sudanian Area. This decrease in the 7 (10) −day wet spell probabilities reaches −35.51% (−47.22%) in central Sahel, −43.75% (−57.68%) in western Sahel, and −13.77% (−24.53%) in the Sudanian Area in the far future following the RCP8.5 scenario. Over the Guinea Coast, small changes are expected during the two periods and under both scenarios.

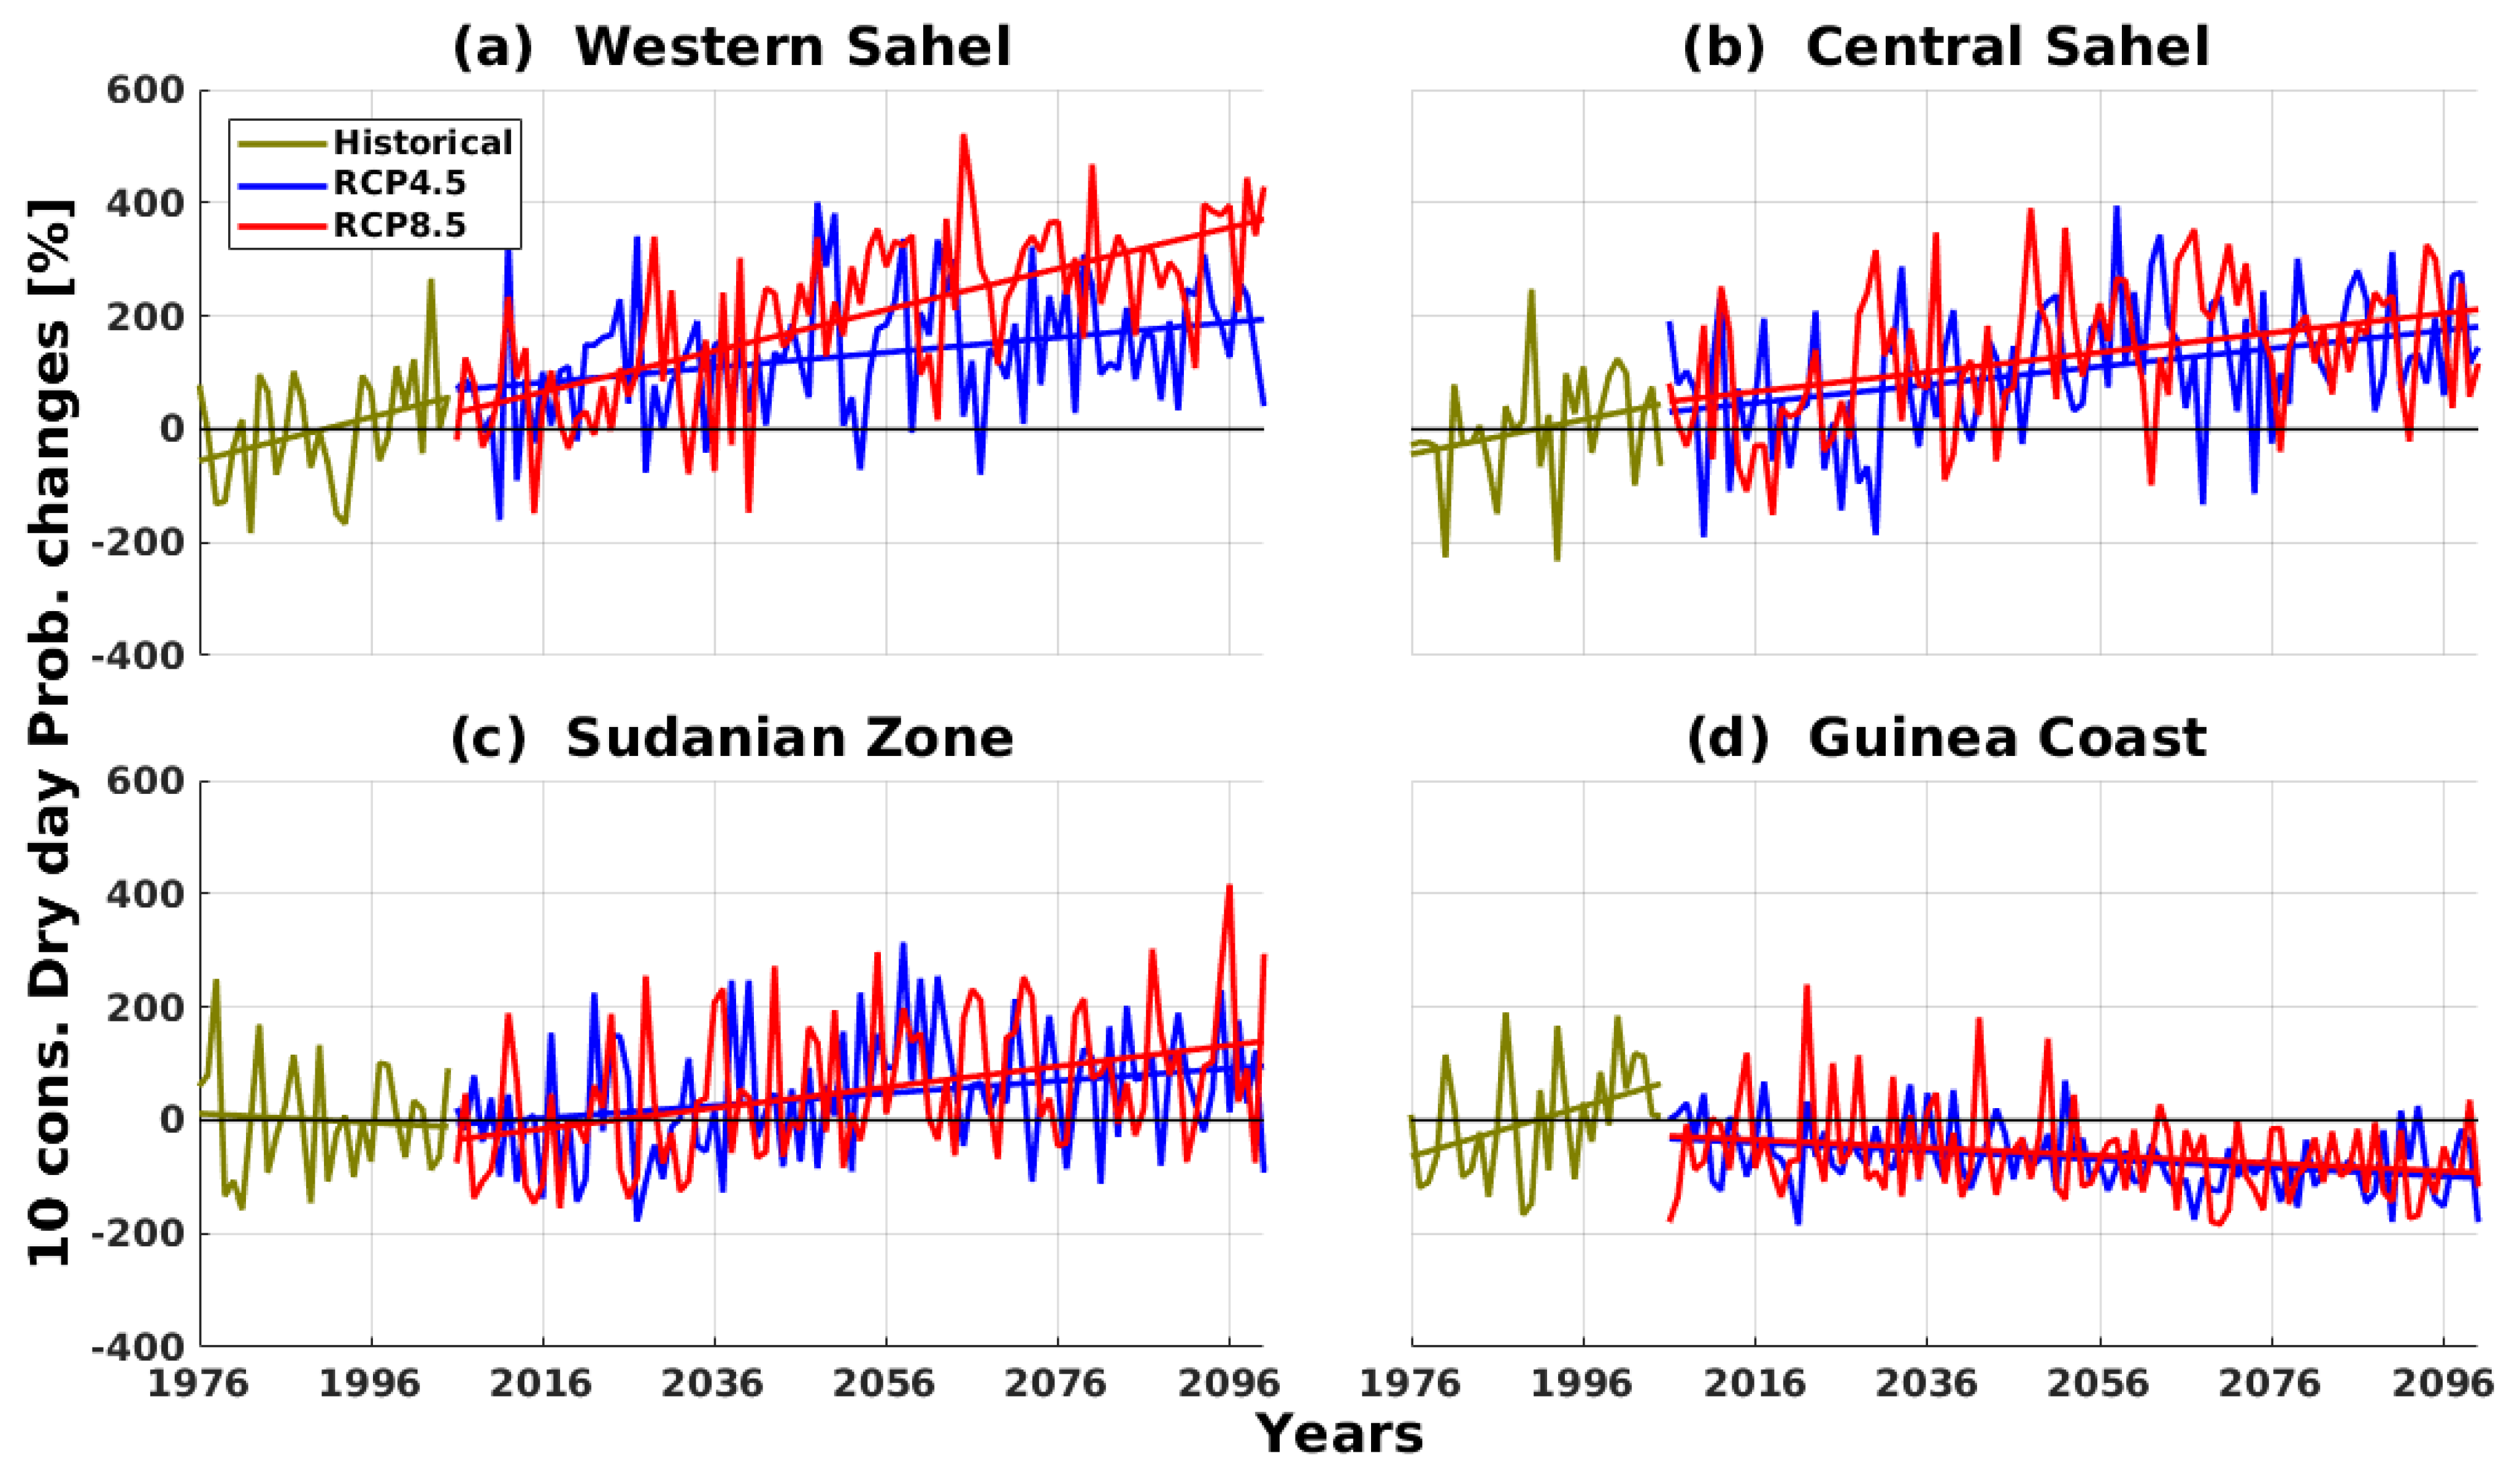
3.4. Interannual Variability of Probabilities

Temporal changes are analyzed during the rainy season (July–September) for different probabilities from the historical (1976–2005) (olive line) to the future horizon (2006–2100) following the RCP4.5 (blue line) and RCP8.5 (red line) scenarios. The future change compared to the historical period is performed for the four areas in West Africa (Figure 1).
The results of future projections of seasonal rainfall for the different West African subregions by 2100 are illustrated (Appendix A, Figure A1) and show an accentuation of rainfall variability. A slight downward trend is projected in western Sahel and central Sahel (Figure A1a,b, respectively) under both scenarios. In the Sudanian Area (Appendix A, Figure A1c) and over the Guinea Coast (Appendix A, Figure A1d), an increasing trend is projected under both scenarios. The RCP8.5 scenario is more alarming, with an increase of 4.5 mm in the Sudanian Area and approximately 7 mm over the Guinea Coast by 2100. This divergence between the scenarios over the Guinea Coast is not specific to our study because [8] showed this difference in the simple daily intensity index (SDII) in Côte d’Ivoire.
Future projections of the P d probability changes in the four West African areas (Appendix A, Figure A2) all show increasing trends following the RCP4.5 and RCP8.5 warming scenarios over all regions except the Guinea Coast (Appendix A, Figure A2d), where a slight decreasing trend is projected under both scenarios. The upward trend will initially follow a slight slope until 2050, when the increase in the P d probabilities will be higher under RCP8.5. The P d d probability changes (Appendix A, Figure A3) as well as the P w d probability changes (Appendix A, Figure A4) would increase over all regions, except the Guinea Coast where a decreasing trend is noted and is more prominent following the RCP8.5 scenario. The increase trend will be more accentuated under RCP8.5, especially in western Sahel by 2100. These results show that the dry days would be more frequent over the Sahelian regions, which are characterized by a decrease in rainfall in the future horizons.
The future projections of the 7–day and 10–day dry spell probability changes are shown in Figure 8 and Figure 9, respectively. As presented in Figure 8a,b, increasing trends of the 7–day dry spell probability changes are projected over the Sahelian regions in the future under both scenarios. The divergence between the scenarios is more visible in western Sahel than in central Sahel by 2100. In the Sudanian Area (Figure 8c), increasing trends are projected in the future for both scenarios. This increase is more accentuated under RCP8.5. Over the Guinea Coast (Figure 8d), a downward trend in the 7–day dry spell probability changes is expected in the future horizon following both scenarios. However, the two scenarios show little divergence by 2100. Similar trends to those of the 7–day dry spells are observed in the case of the 10–day dry spell probability changes (Figure 9) but with stronger amplitudes than the 7–day dry spells. Inverse trends are noted in the case of wet spells compared with dry spells. Trends towards a decrease in wet spells (7 and 10 days) are projected over the Sahelian regions (Appendix A, Figure A5a,b and Figure A6a,b) by 2100 according to the two scenarios, with greater amplitudes for 10–day wet spells. In the Sudanian zone (Appendix A, Figure A5c and Figure A6c), the future evolution of wet spells is almost normal. In the Guinea Coast (Appendix A, Figure A5d and Figure A6d), increasing trends in wet spells are observed in the future period, with slight differences between the two scenarios.

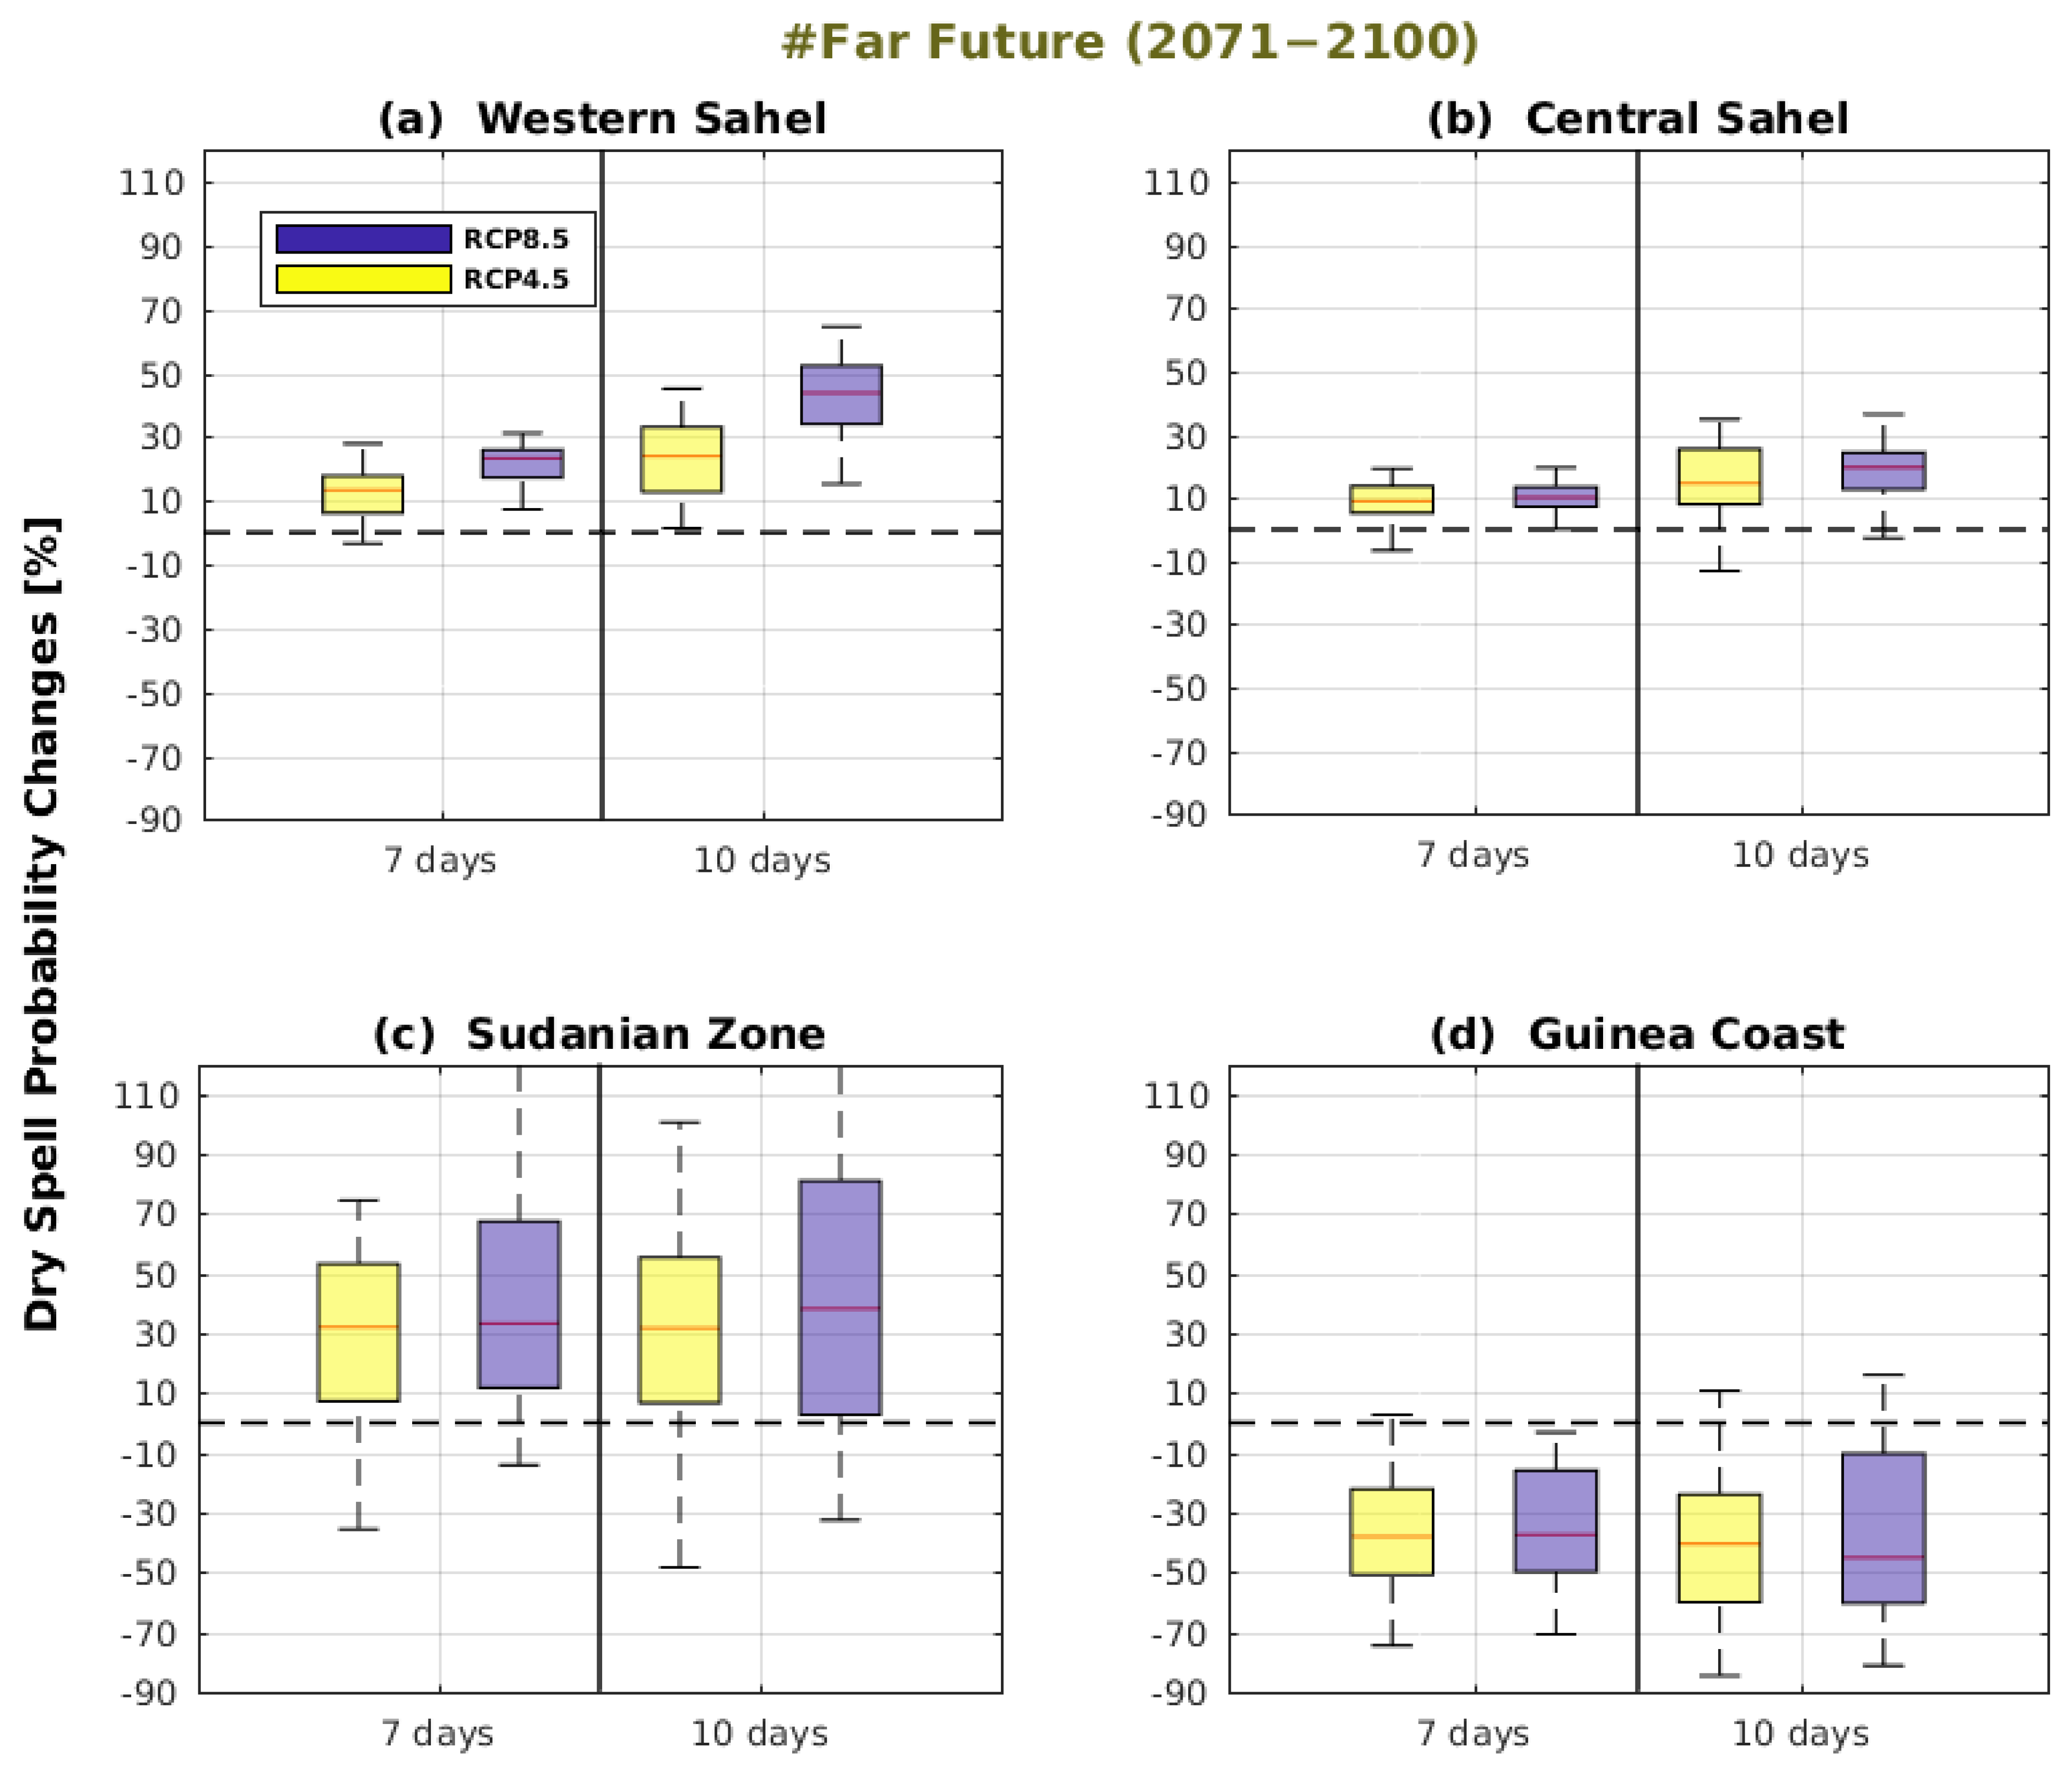
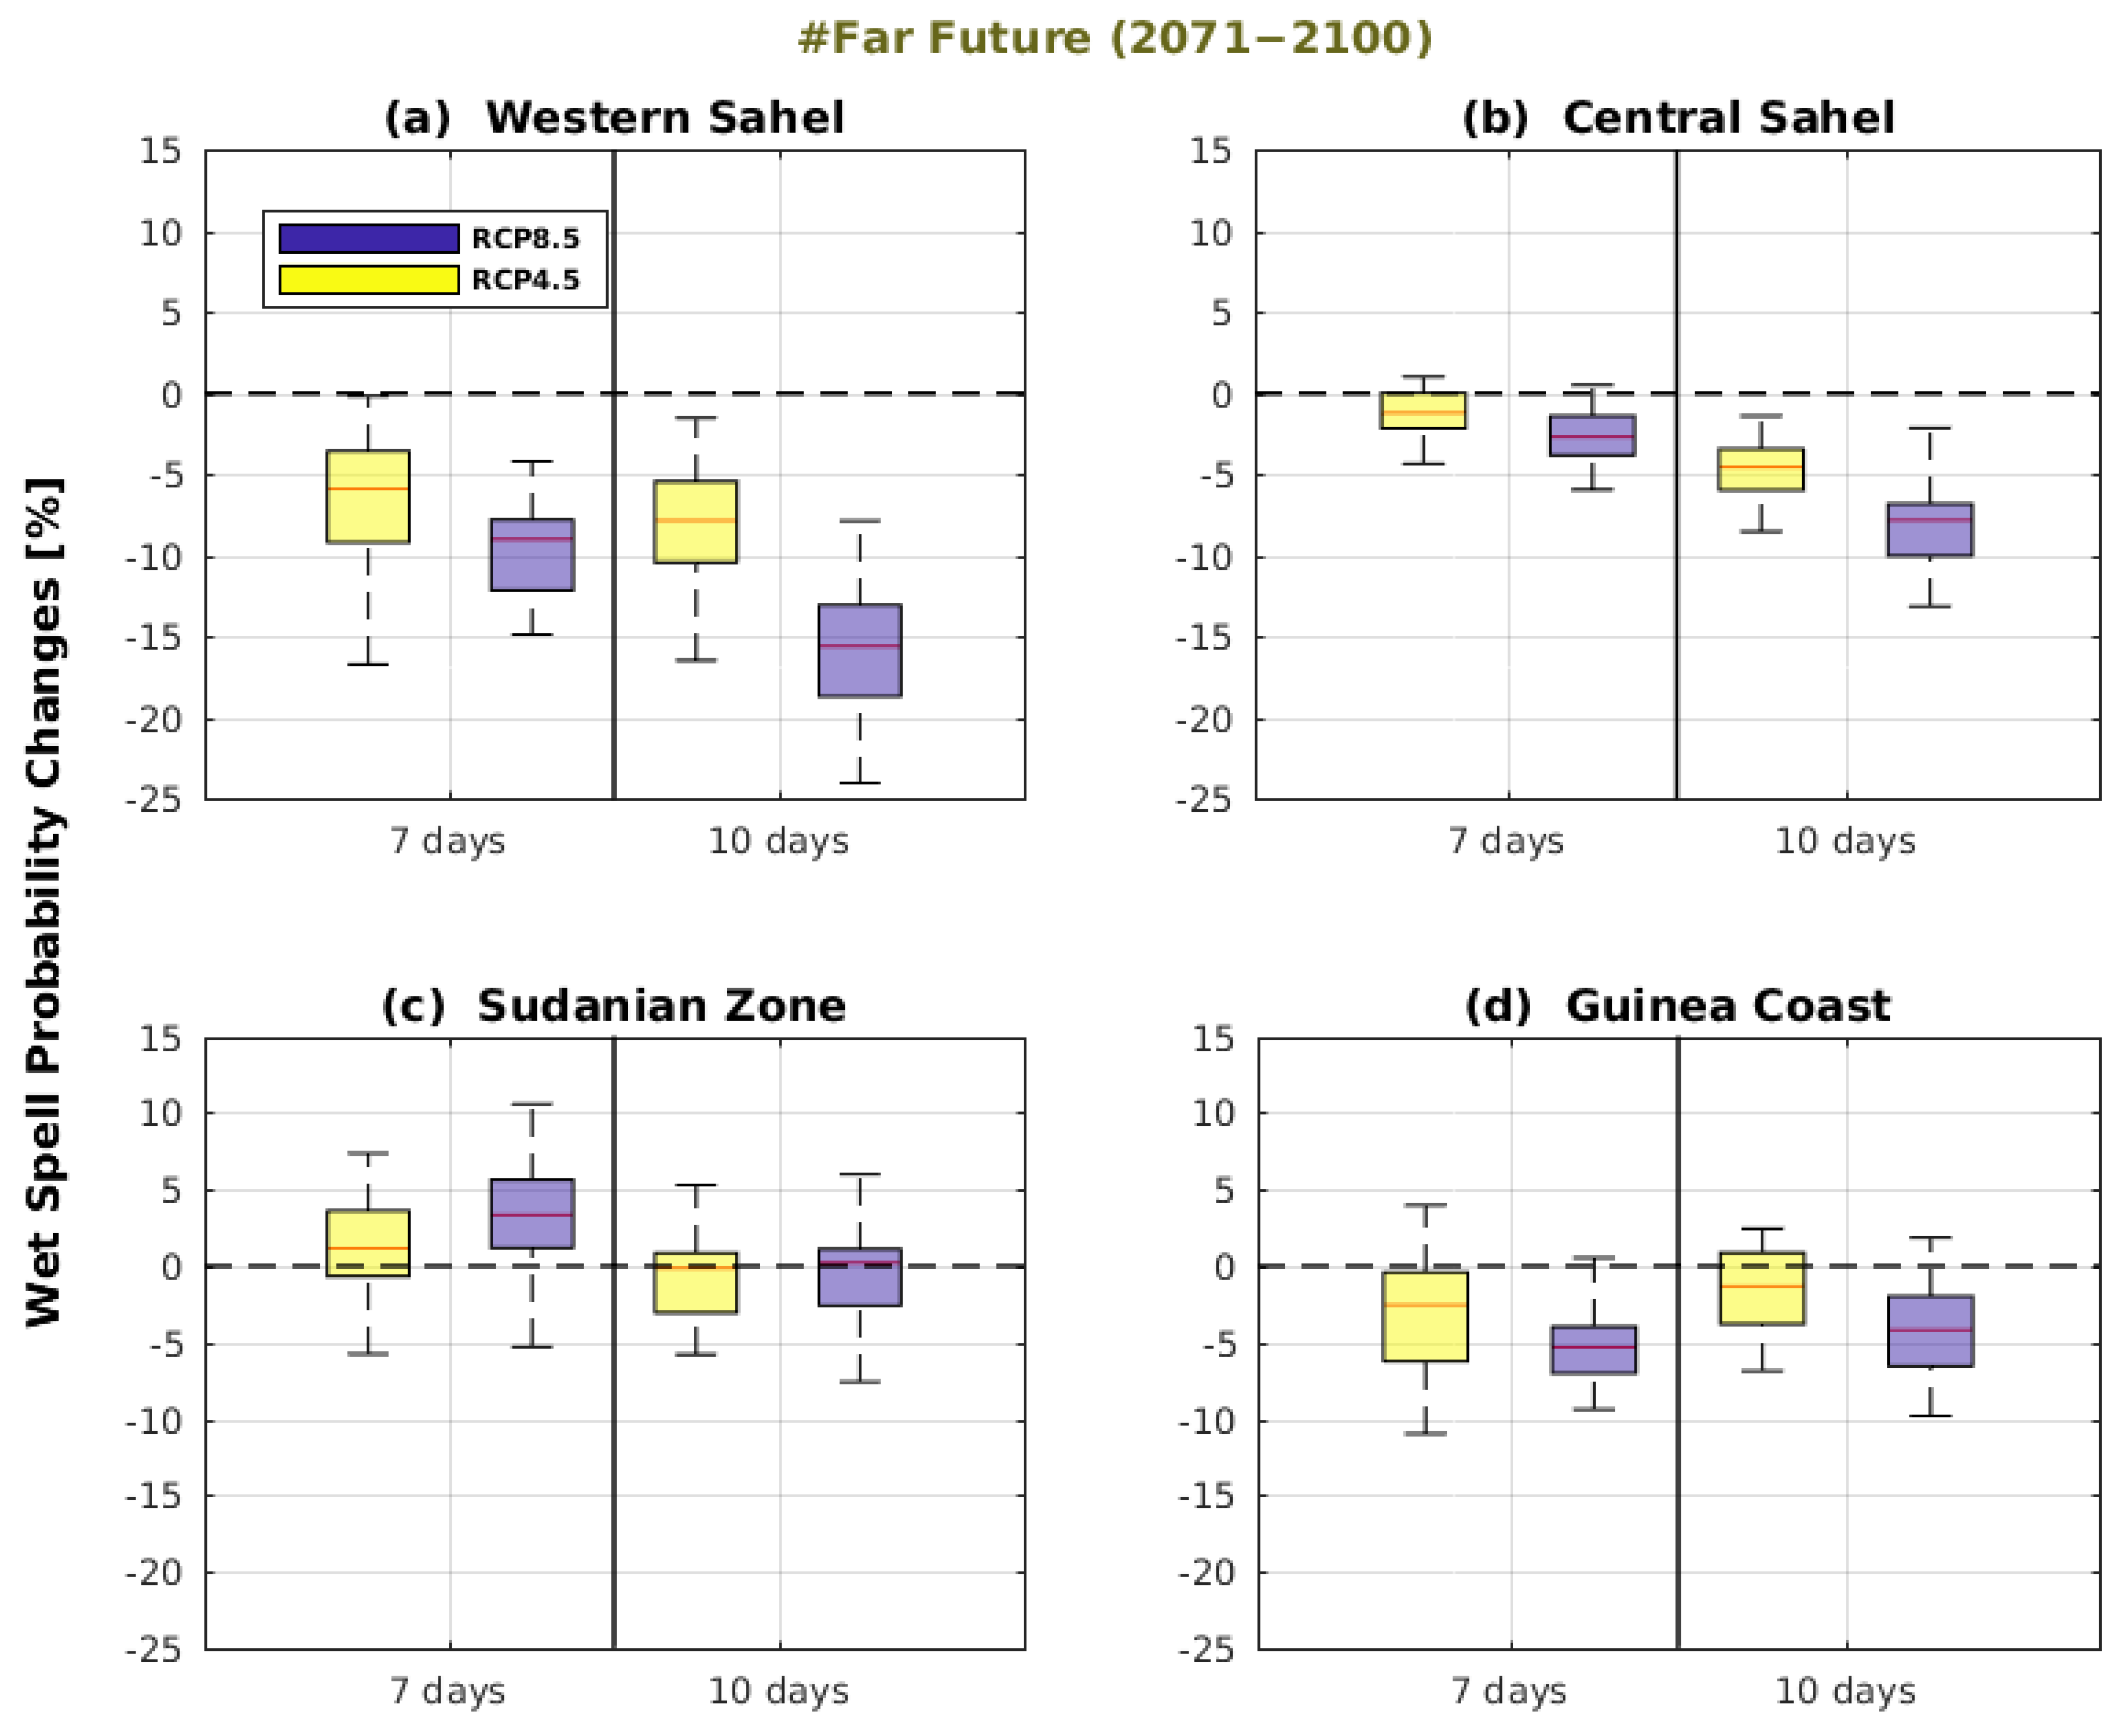
3.5. Dry and Wet Spell Probability Uncertainties in the West Africa Sub-Domains

For a more quantitative assessment, the mean seasonal changes for dry (Figure 10 and Figure 11) and wet (Figure 12 and Figure 13) spells are presented in the form of box–whisker plots for the two future periods (near and far future), according to the RCP4.5 and RCP8.5 sc–narios for each selected sub–domain (Figure 1).
Regarding the dry spell probabilities, the main characteristic is the expected increase across the Sahel areas (i.e., western and central Sahel) and the decrease in the Guinea Coast for both the near future (Figure 10) and the far future (Figure 11) and under RCP4.5 and RCP8.5 during the summer period. The extent of change is more marked in the far future than in the near future and under RCP8.5. Over the Sahel areas, the median, the 25th, and the 75th percentiles exhibit positive values, underscoring the robustness of the increase in the dry spell probabilities. Similarly, over the Guinea Coast, the median, the 25th, and the 75th percentiles are negative, suggesting that the decrease in the dry spell probabilities is also a consistent result. In the Sudanian Area, the changes during the summer season are considerably uncertain in the near future (Figure 10), because the interquartile interval covers negative and positive signs for both scenarios. In 2100 horizon (Figure 11), an increase in the probabilities of dry spells is projected under both scenarios.
For the wet spell probabilities, the most remarkable feature is the negative evolution expected in western Sahel in the 2050 horizon (Figure 12) and in the 2100 horizon (Figure 13) and following the two scenarios during the summer season. The changes are more significant in the far future and under RCP8.5. In addition, the median, interquartile ranges, 25th and 75th percentiles, and maximum and minimum are less than 0, which means that the predicted decrease in the wet spell probabilities is substantially important. In central Sahel, the wet spell probabilities are projected to decrease in both periods and under both scenarios, except for the 7–day wet spell probabilities in the near future and under both scenarios (Figure 12b), where the changes are rather uncertain because the interquartile interval covers negative and positive signs. The changes in the wet spell probabilities are also quite uncertain in the Sudanian Area, except for the 7–day wet spell probabilities by 2100 and following scenario RCP8.5 (Figure 13c). Over the Guinea Coast, the most notable feature is the decrease in wet spell probabilities by 2050, following the two scenarios (Figure 12d).

4. Conclusions

Future probability changes in dry and wet events during the July–August–September rainy season in West Africa (WA) are examined using an ensemble of four CORDEX-Africa RCMs and two forcing scenarios (RCP4.5 and RCP8.5). The predicted seasonal variability for initial, transition, and consecutive probability changes are evaluated by contrasting two future 30-year horizons (2021–2050 and 2071–2100) relative to the historical period (1976–2005) following the RCP4.5 and RCP8.5 scenarios. In addition, the time series of the interannual variability of the different probabilities are analyzed in the WA zones (western Sahel, central Sahel, the Sudanian Area, and the Guinea Coast). Finally, the uncertainties are assessed by quantifying the dispersion of changes over each zone. The results indicate that a decrease in rainfall is expected in most of the northern regions of WA and an increase in the southern regions following the two scenarios and the two horizons. The changes are much more pronounced on the 2100 horizon, following the RCP8.5 scenario (more than 30%). An increase in the P d probabilities, the P d d probabilities, and the P w d probabilities is predicted in the Sahelian regions under the RCP4.5 and RCP8.5 scenarios to around 20% by 2050 and more than 30% by 2100. However, a decrease in P w probabilities, P w w probabilities, and P d w probabilities is projected in the Sahelian regions under the RCP4.5 and RCP8.5 scenarios to around −20% by 2050 and more than −30% by 2100. Over the Guinea Coast, a decrease in the P d , P d d , and P w d probabilities and an increase in the P w , P w w , and P d w probabilities are expected in the future and in the two scenarios.
Regarding the dry spell probabilities, an increase in Sahel is predicted during both periods and under both scenarios but the change magnitude and the spatial extension are more important on the 2100 horizon under RCP8.5. Moreover, a decrease in these spells is expected in the Guinean regions, up to −50% for the 7−day dry spell probabilities and up to −75% for the 10−day dry spell probabilities on the 2100 horizon under RCP8.5. When considering the probabilities of wet spells, a decrease of around −40% by 2050 and more than −60% by 2100 is projected in Sahel under the RCP8.5 scenario, for the 7−day wet spell probabilities. These changes are more important when considering the longer wet spells (i.e., 10−day wet spells). In addition, these characteristics are linked to a high variation in the various probabilities, with larger amplitudes of variability in the projected climate in the different subregions. For rainfall, a decreasing trend is observed in western and central Sahel over the whole period (1976–2100) and an increasing trend in the future over the Sudanian Area and over the Guinea Coast. The trends are more significant under RCP8.5. In addition, western and central Sahel also show the trends of increasing in the P d probabilities, P d d probabilities, P w d probabilities, and dry spells probabilities over the whole period, considered with discernible differences between the two scenarios. In the Sudanian Area, the historical period is characterized by a decreasing trend of the P d , P d d , and P w d probabilities while an increasing trend is observed in the future. In addition, the dry spell probabilities show quite normal trends in the historical period and an increasing trend in the future.
Over the Guinea Coast, P d and P w d probabilities show decreasing trends during the whole period. The P d d probabilities show low variability in the historical period and an increasing trend is observed in the future. For dry spell probabilities, the Guinea Coast is characterized by an increasing trend in the historical period and a decreasing trend in the future period. Furthermore, when assessing the projected changes in the dry spell probabilities, it appears that the most prominent feature is their increase in the two future horizons and following the two scenarios in western Sahel. This increase in the probabilities of dry spells associated with an increase in rainfall intensity strengthens the risk of natural catastrophes such as droughts and floods. This can have a substantial impact on agricultural production, which is mainly rainfed in West Africa. Furthermore, in West Africa, where rainfall indices (e.g., dry spells, wet spells, SDII, and R95P) determine water availability, different plantations could be affected differently. However, an increase in the dry spell probabilities can have negative consequences for agricultural yields, food security, and ecosystems, as reductions in water availability limit crop growth. For example, the Guinea Coast regions and northern Sudanian zone could be exposed to flood risks, while the Sahelian regions would be confronted with drought events, altering socio-economic stability. This study suggests that decision−makers should implement mitigation and adaptation policies to minimize the adverse effects of climate change. The results of this study on the dry and wet spell probabilities in West Africa could be helpful for water conservation and for cultivation and hydropower sectors. Moreover, [31] showed that if nothing changes, most West African countries will have to cope with longer periods of drought and more intense extreme rainfall. According to [32], at the end of the century (2071–2100) a decreasing trend in the intensity of heavy rain events is more likely in the western parts of West Africa (Senegal, Gambia, and western Mali). Following [33,34], there is a potential change in the seasonality of the Sahelian rainy season, with a later onset and the potential for a mid-season break period at the end of the twenty-first century.
This study focuses on the July, August, and September rainy season, when the West African monsoon is well developed in the region. While the other periods can be critical, as there is a high degree of variability in the start or cessation of the rainy season (false start or early or late cessation depending on the year), further investigations are needed to capture the full intraseasonal variability of the West African monsoon, including occurrences of wet and dry spells in the onset and the end of the rainy season.

Author Contributions

Design/conceptualization of the paper was carried out by J.B. and M.C. Data processing was performed by J.B. All authors collectively analyzed and discussed the results and made contributions to the manuscript. All authors have read and agreed to the published version of the manuscript.

Funding

The research leading to this study was co-funded by IRD (Institut de Recherche pour le Développement; France) grant number “UMR IGE Imputation 252RA5”, the RNER-CC (AFD-C2D) project implemented in the CNCCI (Côte d’Ivoire National Center of High Performance Computing) and FIRST/MESRI (Senegal). And The APC was funded by IRD (Institut de Recherche pour le Développement; France) grant number “UMR IGE Imputation 252RA5” and by RNER-CC (AFD-C2D) project implemented in the CNCCI (Côte d’Ivoire National Center of High Performance Computing).

Data Availability Statement

Data used in this study, are available at: https://esg-dn1.nsc.liu.se/projects/esgf-liu/ (accessed on 21 July 2024).

Acknowledgments

The authors express their gratitude to Assane SECK University of Ziguinchor and the “Fond d’Impulsion de la Recherche Scientifique et Technologique (FIRST)” program of MESRI-Senegal for their valuable support.

Conflicts of Interest

The authors declare no conflict of interest.

Appendix A

Figure A1. Temporal evolution of rainfall mean changes (in %): (a) western Sahel, (b) central Sahel, (c) Sudanian zone, and (d) Guinea Coast during the WAM (JAS) season under the RCP4.5 and RCP8.5 scenarios.
Climate 12 00211 g0a1
Figure A2. Same as Figure A1, but for the dry day probability changes.
Climate 12 00211 g0a2
Figure A3. Same as Figure A1, but for the dry day preceded by a dry day probability changes.
Climate 12 00211 g0a3
Figure A4. Same as Figure A1, but for the dry day preceded by a wet day probability changes.
Climate 12 00211 g0a4
Figure A5. Same as Figure A1, but for the 7−day wet spell probability changes.
Climate 12 00211 g0a5
Figure A6. Same as Figure A1, but for the 10−day wet spell probability changes.
Climate 12 00211 g0a6
Figure A7. Climate indices: the number of rainy days (R1mm) (top) for historical (a), the near future (b,c), and the far future (d,e); the daily intensity index (SDII) (bottom) for historical (f), the near future (g,h), and the far future (i,j) for the RCP4.5 (middle column) and the RCP8.5 (left column) scenarios.
Climate 12 00211 g0a7aClimate 12 00211 g0a7b

References

  1. Krishnan, R.; Sanjay, J. Climate Change over INDIA: An Interim Report; Centre for Climate Change Reseach (CCCR): Pune, India, 2017. [Google Scholar]
  2. Nkrumah, F.; Vischel, T.; Panthou, G.; Klutse, N.A.B.; Adukpo, D.C.; Diedhiou, A. Recent Trends in the Daily Rainfall Regime in Southern West Africa. Atmosphere 2019, 10, 741. [Google Scholar] [CrossRef]
  3. Ta, S.; Kouadio, K.Y.; Ali, K.E.; Toualy, E.; Aman, A.; Yoroba, F. West Africa Extreme Rainfall Events and Large-Scale Ocean Surface and Atmospheric Conditions in the Tropical Atlantic. Adv. Meteorol. 2016, 2016, 1940456. [Google Scholar] [CrossRef]
  4. Sylla, M.B.; Giorgi, F.; Pal, J.S.; Gibba, P.; Kebe, I.; Nikiema, M. Projected changes in the annual cycle of high intensity precipitation events over West Africa for the late 21st century. J. Clim. 2015, 28, 6475–6488. [Google Scholar] [CrossRef]
  5. Sarr, A.B.; Camara, M. Evolution des indices pluviométriques extrêmes par l’analyse de modèles climatiques régionaux du programme CORDEX: Les projections climatiques sur le Sénégal. Eur. Sci. J. 2017, 13, 26. [Google Scholar] [CrossRef]
  6. Diedhiou, A.; Bichet, A.; Wartenburger, R.; Seneviratne, S.I.; Rowell, D.P.; Sylla, M.B.; Diallo, I.; Todzo, S.; Touré, N.E.; Camara, M.; et al. Changes in climate extremes over West and Central Africa at 1.5 °C and 2 °C global warming. Environ. Res. Lett. 2018, 13, 065020. [Google Scholar] [CrossRef]
  7. Ogega, O.M.; Gyampoh, B.A.; Mistry, M.N. Intraseasonal Precipitation Variability over West Africa under 1.5 °C and 2.0 °C Global Warming Scenarios: Results from CORDEX RCMs. Climate 2020, 8, 143. [Google Scholar] [CrossRef]
  8. Yapo, A.L.M.; Diawara, A.; Kouassi, B.K.; Yoroba, F.; Sylla, M.B.; Kouadio, K.; Tiémoko, D.T.; Koné, D.I.; Akobé, E.Y.; Yao, K.P.A.T. Projected changes in extreme precipitation intensity and dry spell length in Côte d’Ivoire under future climates. Theor. Appl. Clim. 2020, 140, 871–889. [Google Scholar] [CrossRef]
  9. Klein Tank, A.M.G.; Zwiers, F.W.; Zhang, X. Guidelines on Analysis of Extremes in a Changing Climate in Support of Informed Decisions for Adaptation; Climate data and monitoring WCDMP-No. 72, WMO-TD No. 1500; WMO: Geneva, Switzerland, 2009; p. 56. [Google Scholar]
  10. Froidurot, S.; Diedhiou, A. Characteristics of wet and dry spells in the West African monsoon system. Atmos. Sci. Lett. 2017, 18, 125–131. [Google Scholar] [CrossRef]
  11. Biao, E.I.; Alamou, E.A. Stochastic Modelling of Daily Rainfall for Decision Making in Water Management in Benin (West Africa). Res. J. Adv. Environ. Sci. 2018, 1, 12–21. [Google Scholar]
  12. Ayanlade, A.; Radeny, M.; Morton, J.F.; Muchaba, T. Rainfall variability and drought characteristics in two agro-climatic zones: An assessment of climate change challenges in Africa. Sci. Total Environ. 2018, 630, 728–737. [Google Scholar] [CrossRef]
  13. Sen, Z. Regional Wet and Dry spell analysis with heterogeneous probability occurrences. J. Hydrol. Eng. 2015, 20, 04014094. [Google Scholar] [CrossRef]
  14. Pandarinath, N. Markov chain model probability of dry and wet weeks during monsoon periods over Andhra Pradesh. Mausam 1991, 42, 393–400. [Google Scholar] [CrossRef]
  15. Rockström, J.; Barron, J.; Fox, P. Rainwater management for increased productivity among small-holder farmers in drought prone environments. Phys. Chem. Earth 2002, 27, 949–959. [Google Scholar] [CrossRef]
  16. Basse, J.; Camara, M.; Diba, I.; Diedhiou, A. Probability of dry and wet spells over West Africa during the summer monsoon season. Sci. Res. Essays 2021, 16, 20–35. [Google Scholar] [CrossRef]
  17. Giorgi, F.; Jones, C.; Asrar, G.R. Addressing climate information needs at the regional level: The CORDEX framework. WMO Bull. 2009, 58, 175–183. [Google Scholar]
  18. Jones, C.G.; Giorgi, F.; Asrar, G. The Coordinated Regional Downscaling Experiment (CORDEX); An International Downscaling Link to CMIP5; CLIVAR Exchanges; International CLIVAR Project Office: Southampton, UK, 2011; pp. 34–39. [Google Scholar]
  19. Hewitson, B.C.; Lennard, C.; Nikulin, G.; Jones, C. CORDEX-Africa: A unique opportunity for science and capacity building. CLIVAR Exch. 2012, 17, 6–7. [Google Scholar]
  20. Nikulin, G.; Jones, C.; Giorgi, F.; Asrar, G.; Büchner, M.; Cerezo-Mota, R.; Christensen, O.B.; Déqué, M.; Fernandez, J.; Hänsler, A.; et al. Precipitation climatology in an ensemble of CORDEX-Africa regional climate simulations. J. Clim. 2012, 25, 6057–6078. [Google Scholar] [CrossRef]
  21. Mbaye MLSylla, M.B.; Tall, M. Impacts of 1.5 and 2.0 °C Global Warming on Water Balance Components over Senegal in West Africa. Atmosphere 2019, 10, 712. [Google Scholar] [CrossRef]
  22. Coulibaly, N.; Coulibaly, T.; Mpakama, Z.; Savané, I. The impact of climate change on water resource availability in a trans-boundary basin in West Africa: The case of Sassandra. Hydrology 2018, 5, 12. [Google Scholar] [CrossRef]
  23. Lawin, A.E.; Hounguè, R.; N’Tcha M’Po, Y.; Hounguè, N.R.; Attogouinon, A.; Afouda, A.A. Mid-century climate change impacts on Ouémé River discharge at bonou outlet (Benin). Hydrology 2019, 6, 72. [Google Scholar] [CrossRef]
  24. Koffi, B.; Brou, A.L.; Kouadio, K.J.O.; Ebodé, V.B.; N’guessan, K.J.Y.; Yangouliba, G.I.; Yaya, K.; Brou, D.; Kouassi, K.L. Impact of climate and land use/land cover change on Lobo reservoir inflow, West-Central of Côte d’Ivoire. J. Hydrol. Reg. Stud. 2023, 47, 101417. [Google Scholar] [CrossRef]
  25. Barredo, J.I.; Caudullo, G.; Mauri, A. Mediterranean Habitat Loss under RCP4.5 and RCP8.5 Climate Change Projections: Assessing Impacts on the Natura 2000 Protected Area Network; EUR 28547 EN; Publications Office of the European Union: Luxembourg, 2017. [Google Scholar]
  26. Diallo, I.; Sylla, M.B.; Giorgi, F.; Gaye, A.T.; Camara, M. Multimodel GCM-RCM ensemble-based projections of temperature and precipitation over West Africa for the early 21st century. Int. J. Geophys. 2012, 2012, 972896. [Google Scholar] [CrossRef]
  27. Bichet, A.; Diedhiou, A. West African Sahel has become wetter during the last 30 years but dry spells are shorter and more frequent. Clim. Res. 2018, 75, 155–162. [Google Scholar] [CrossRef]
  28. Fall, C.M.N.; Lavaysse, C.; Kerdiles, H.; Dramé, M.S.; Roudier, P.; Gaye, A.T. Performance of dry and wet spells combined with far sensing indicators for crop yield prediction in Senegal Stern. Nat. Hazards Earth Syst. Sci. 2021, 21, 1051–1069. [Google Scholar] [CrossRef]
  29. Ray, M.; Biswasi Sahoo Patro, H. A Markov Chain Approach for Wet and Dry Spell and Probability Analysis. Int. J. Curr. Microbiol. Appl. Sci. 2018, 6, 1005–1013. [Google Scholar]
  30. Ouédraogo, P.L.A.; Zorom, M.; Niang, D.; Fossi, S. Prédétermination des Séquences Sèches et Intérêt de L’information Climatique sur la Production Céréalière en Zone Sahélienne. Master’s Thesis, Institut International d’Ingénierie, Ouagadougou, Burkina Faso, 2013; 61p. [Google Scholar]
  31. Sylla, M.B.; Nikiema, P.M.; Gibba, P.; Kebe, I.; Klutse, N.A.B. Climate Change over West Africa: Recent Trends and Future Projections. In Adaptation to Climate Change and Variability in Rural West Africa; Yaro, J., Hesselberg, J., Eds.; Springer: Cham, Switzerland, 2016; pp. 25–40. [Google Scholar] [CrossRef]
  32. Saley, I.A.; Salack, S. Present and Future of Heavy Rain Events in the Sahel and West Africa. Atmosphere 2023, 14, 965. [Google Scholar] [CrossRef]
  33. Roudier, P.; Muller, B.; D’aquino, P.; Roncoli, C.; Soumaré, M.; Batté, L.; Sultan, B. The role of climate forecasts in smallholder agriculture: Lessons from participatory research in two communities in Senegal. Clim. Risk Manag. 2014, 2, 42–55. [Google Scholar] [CrossRef]
  34. Dunning, C.M.; Black, E.; Allan, R.P. Later Wet Seasons with More Intense Rainfall over Africa under Future Climate Change. J. Clim. 2018, 31, 9719–9738. [Google Scholar] [CrossRef]
Figure 1. Study area: West Africa. The four rectangles illustrate western Sahel, central Sahel, the Sudanian Area, and the Guinea Coast. The mountainous areas are also represented: the Fouta Djallon Mountains (FJ), Plateau of Jos (Jos), and Mountains of Cameroon (CMs).
Climate 12 00211 g001
Figure 2. Climate indices: The rainfall mean (top) for historical (a), the near future (b,c), and the far future (d,e); the very wet days (R95P) (bottom) for historical (f), the near future (g,h), and the far future (i,j) for the RCP4.5 (middle column) and the RCP8.5 (left column) scenarios.
Climate 12 00211 g002aClimate 12 00211 g002b
Figure 3. Probability changes (in %) in dry and wet days in July–August–September for the historical period (a,b), RCP4.5 (c,e,g,i), and RCP8.5 (d,f,h,j) scenarios with respect to the historical period in the near future (top) and far future (bottom).
Climate 12 00211 g003
Figure 4. Same as Figure 3, but for the dry−to−dry day probabilities and dry−to−wet day probabilities.
Climate 12 00211 g004
Figure 5. Same as Figure 3, but for the probabilities of wet−to−wet days and wet−to−dry days.
Climate 12 00211 g005
Figure 6. Same as Figure 3, but for the 7− and 10−day probabilities of dry spells.
Climate 12 00211 g006
Figure 7. Same as Figure 3, but for the probabilities of a wet spell of 7 and 10 days.
Climate 12 00211 g007
Figure 8. Temporal evolution of probabilities of 7–day dry spells (in %): (a) western Sahel, (b) central Sahel, (c) Sudanian zone, and (d) Guinea Coast during the JAS season under RCP4.5 and RCP8.5.
Climate 12 00211 g008
Figure 9. Same as Figure 8, but for the probabilities of having 10 consecutive dry days.
Climate 12 00211 g009
Figure 10. Boxplots of dry spell probability changes in the near future: (a) western Sahel, (b) central Sahel, (c) Sudanian Area, and (d) Guinea Coast.
Climate 12 00211 g010
Figure 11. Same as Figure 10, but for the far future.
Climate 12 00211 g011
Figure 12. Boxplots of wet spell probability change in the near future: (a) western Sahel, (b) central Sahel, (c) Sudanian Area, and (d) Guinea Coast.
Climate 12 00211 g012
Figure 13. Same as Figure 12, but for the far future.
Climate 12 00211 g013
Table 1. Climate models used with their characteristics (i.e., Global Climate Models (GCMs), institutes and Regional Climate Models (RCMs)) and simulation periods.
Driving GCMInstituteRCMHistorical PeriodProjection Periods
MPIREMO1976–20052021–2050; 2071–2100
ICHEC-EC-EARTHKNMIRACMO22T1976–20052021–2050; 2071–2100
DMIHIRHAM51976–20052021–2050; 2071–2100
CNRM-CERFACSCLMcomCCLM4-8-171976–20052021–2050; 2071–2100
Table 2. Rainfall mean and very wet day mean changes (in %) relative to the historical time (1976–2005) in the sub–regions of West Africa during the monsoon season (JAS period).
Periods2021–20502071–2100
ScenariosRCP4.5RCP8.5RCP4.5RCP8.5
Rainfall JAS mean
Western Sahel−5.71−1.44−10.04−13.22
Central Sahel−6.04−3.00−7.46−6.55
Sudanian Area1.715.673.138.28
Guinea Coast7.5110.9412.5826.07
Very wet days (R95P) JAS mean
Western Sahel−1.843.96−2.74−1.3
Central Sahel−3.92.360.895.43
Sudanian Area4.8812.619.9921.85
Guinea Coast7.8615.6316.7635.31
Table 3. Dry and wet spell mean changes (in %) relative to the historical time (1976–2005) in the sub-regions of West Africa during the monsoon season (JAS period).
Periods2021–20502071–2100
ScenariosRCP4.5RCP8.5RCP4.5RCP8.5
7–day dry spell probabilities
Western Sahel11.6315.5525.9047.17
Central Sahel24.4034.5256.6582.35
Sudanian Area2.6615.5249.7781.23
Guinea Coast−33.33−27.18−27.42−25.61
10–day dry spell probabilities
Western Sahel27.2434.7360.61126.53
Central Sahel51.1876.91133.91223.04
Sudanian Area19.7543.71120.10215.20
Guinea Coast−40.93−35.03−34.10−20.60
7–day wet spell probabilities
Western Sahel−14.64−23.23−29.33−43.75
Central Sahel−14.54−24.01−28.36−35.51
Sudanian Area−3.41−5.92−8.22−13.77
Guinea Coast0.37−0.25−0.151.43
10–day wet spell probabilities
Western Sahel−17.90−31.50−40.49−57.68
Central Sahel−20.54−34.68−41.31−47.22
Sudanian Area−6.07−11.01−15.33−24.53
Guinea Coast3.160.711.946.38
Disclaimer/Publisher’s Note: The statements, opinions and data contained in all publications are solely those of the individual author(s) and contributor(s) and not of MDPI and/or the editor(s). MDPI and/or the editor(s) disclaim responsibility for any injury to people or property resulting from any ideas, methods, instructions or products referred to in the content.

