Abstract
Previous studies assessing population exposure to heat stress have focused primarily on environmental heat loads without accounting for variations in human thermo–physiological responses to heat. A novel 30-year (1991–2020) human thermal bioclimate dataset, consisting of hourly mPET (modified physiologically equivalent temperature) values for diverse populations, was employed in the present study to assist in addressing this gap. Focusing on the Athens urban area (AUA), Greece, the climatology and long-term trends in acclimatization-based strong heat stress (accliSHS) experienced by average male and female adult and senior individuals during the warm period of the year (April–October) were investigated. Results showed that an average adult (senior) in AUA experienced, on average, approximately 13 (18) additional days with at least 1 h accliSHS in 2020 compared with 1991. The increasing rates per year were particularly pronounced for days with ≥6 h accliSHS, indicating a rise in the daily duration of heat stress in AUA from 1991 to 2020. Combining the variations in climate and demographics in AUA during the examined 30-year period, the long-term trends in ≥1 h accliSHS exposure for the study population types were further examined. This analysis revealed that seniors’ exposure to ≥1 h accliSHS in AUA increased by up to +153,000 person-days year−1 from 1991 to 2020. Increasing population aging was the main driver of this outcome, highlighting the urgent need for heat–health action planning in Greece.
1. Introduction
Anthropogenic-driven global warming and the consequent intensification of weather and climate extremes induce severe impacts on humans []. One of the most important climate-related threats is related to the thermal environment. Population exposure to elevated heat conditions endangers human livability and survivability, as hot weather and heatwaves are associated with adverse birth outcomes [,], worsened mental health [] and sleep quality [], limited ability to exercise, play, and work [,,,], and increased morbidity and mortality, primarily due to cardiorespiratory diseases [,]. These heat-related issues in turn cause a substantial economic burden on healthcare systems and various labor sectors, especially those heavily relying on an outdoor workforce [,].
The spatiotemporal assessment of heat stress exposure patterns in the recent past [,,,,,,,,] and future [,,,,,,,,,] can provide essential guidance for targeted adaptation and action aimed at alleviating the above impacts, such as the development of early warning systems. However, previous relevant studies have not accounted for exposure to heat stress within a human–biometeorological and health-related context. Single meteorological variables (e.g., air temperature []) or simple composite indices (e.g., heat index (HI) []) were primarily used in these studies, even though the comprehensive assessment of heat stress requires considering the collective impact of all heat-related environmental drivers (i.e., temperature, humidity, wind speed, and radiation loads). Most importantly, it requires solving the human energy balance equation, integrating anthropometric data (e.g., age), clothing, and activity in addition to the above environmental variables [,,,]. Thus, even with the employment of more advanced direct indices such as outdoor wet-bulb globe temperature (WBGT; e.g., []), the existing literature on the topic has ignored the thermo–physiological basis of the human thermal environment.
In this article, to assist in addressing this research gap, we expand the concept of heat stress exposure assessment to account for the thermo–physiological responses of different population groups. To that end, we employed a novel 30-year (1991–2020) human thermal bioclimate dataset consisting of hourly mPET (modified physiologically equivalent temperature) values to characterize heat stress levels for diverse population types []. The study area was the Athens urban area (AUA) in Greece, situated in the Eastern Mediterranean. Initially, we analyzed the long-term trends in acclimatization-based strong heat stress (accliSHS) experienced by average male and female adults and senior individuals in five regional units in AUA during the warm period of the year (April–October). Emphasis was placed on accliSHS duration, which is of paramount importance in relation to adverse health outcomes [,,]. Then, we computed accliSHS exposure and assessed its long-term trends for each examined demographic type and regional unit by combining the mPET estimates with population data. Contributions arising from changes in climate and population sizes were determined; these are discussed, emphasizing the differences between the targeted demographic groups and regional units in AUA.
2. Materials and Methods
2.1. Study Urban Area
AUA is situated in south Greece (Figure 1), characterized by a Mediterranean climate with hot summers. It consists of five regional units, namely North Athens, West Athens; Central Athens, Piraeus, and South Athens (Figure 1), which accommodate around three million inhabitants in total []. Central and West Athens feature compact built-up areas characterized by narrow streets and flat-roofed, light-colored buildings. These areas are also marked by a lack of green spaces. This urban setting description holds for much of Piraeus as well, whereas regions with a more dispersed built-up environment and an abundance of greenery are primarily located in South and North Athens [,]. These urban characteristics contribute to the development of prominent overheating, particularly in Central and West Athens and Piraeus []. The urban heat island (UHI) effect in these areas is particularly intense during the night (>4 °C; []), while high spatial variability characterizes the entire AUA in terms of responsiveness to heat stress [].
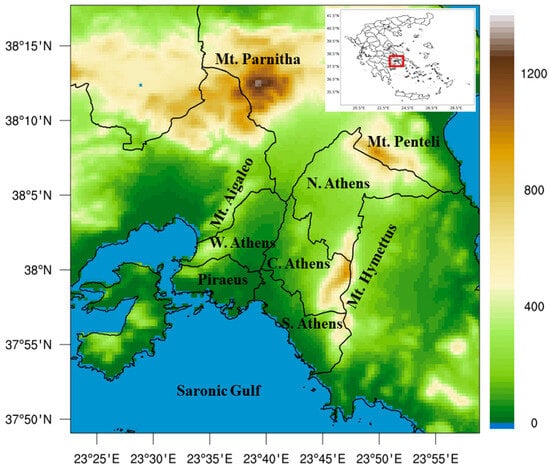
Figure 1.
AUA topography (elevation in meters) based on SRTM (Shuttle Radar Topography Mission) data [] with identification of main geomorphological features. The black boundaries indicate the five AUA regional units (N. Athens: North Athens; W. Athens: West Athens; C. Athens: Central Athens; Piraeus; S. Athens: South Athens), while the red square in the nested map of Greece shows the wider study area.
Moreover, in recent decades, the climatic features of AUA have been significantly altered due to anthropogenic climate change. Specifically, increasing trends in the duration, frequency, and intensity of heat extremes have been evident, notably since 1990 [,,,], with a lengthening of the “hot extremes season” also apparent [,]. These changes contribute to the establishment of more stressful human bioclimatic conditions in the area [,,,,]. Thus, significant challenges in relation to public health arise in AUA, especially when considering that the population exposed to these stressful conditions is increasingly aging [].
2.2. Human Bioclimate and Population Data
The human bioclimate data used in the current study consisted of hourly, population-weighted mPET index values for average male and female adult and senior individuals. They spanned from 1991 to 2020 in the five regional units in AUA and focused on the warm period (April–October).
Briefly, mPET is an advanced human-biometeorological index that is intimately related to human thermal perception and stress. It is computed based on human energy balance modeling that incorporates both the environmental (air and radiant temperature, humidity, and wind speed) and personal/thermo–physiological (sex, age, height, weight, metabolic activity, and clothing coverage) factors that affect the human thermal environment [,]. Furthermore, the mPET thermoregulation model can be applied for different demographic and thermo-physiological attributes that correspond to the characteristics of average individuals within population sub-groups. Thus, compared with other thermal stress metrics, mPET assesses heat stress in a thermo–physiologically significant way while allowing consideration of population-wide variability in heat stress [,]. This means that given the same environmental conditions in each AUA regional unit, different mPET values and corresponding heat stress levels were estimated for each average individual within each targeted population type. The dataset used to extract the mPET data for the study area and populations is publicly available (https://zenodo.org/records/10893914; accessed on 1 September 2024) and has been described in more detail by Giannaros et al. [].
The population data for each AUA regional unit were retrieved from the Hellenic Statistical Authority and Eurostat. They correspond to the 1991, 2001, 2011, and 2021 censuses, grouped by sex and age. Thus, to estimate group-specific populations for each day from 1 January 1991 to 31 December 2020, linear interpolation was applied to the censuses population counts for each targeted demographic group and AUA regional unit. Considering the relatively limited data points and the impact of the immigration outflow following the 2009 financial crisis in Greece, linear interpolation was considered to provide more robust and reliable estimates than alternative methods such as exponential or multivariate approaches []
2.3. Exposure Estimations and Trend Analysis
The methods used in the existing literature to define heat stress exposure are characterized by significant diversity. For example, Tuholske et al. used fixed thresholds to identify extreme heat episodes [], whereas Dong et al. applied percentile-based criteria to define humid heatwaves []. Here, we focused on days with strong heat stress (SHS), following previous epidemiological (e.g., [,,]) and thermo–physiological (e.g., [,]) evidence showing that heat-related health risks are associated with SHS exposure.
Specifically, we considered accliSHS days to account for population- and location-specific short-term acclimatization effects. The definition of accliSHS was based on variable mPET thresholds derived from adjusting the fixed SHS mPET threshold (i.e., 35 °C; []) according to the thermal stress conditions prevailing in the 30 days previous, specific to each population and regional unit. This was carried out through the application of a Gaussian filter with 30 significant weights, reflecting a thermo–physiologically relevant short-term (30 days) adaptation to SHS exposure []. This process used a formula based on the HeRATE (Health-Related Assessment of the Thermal Environment) approach [], applied to the population-and location-specific mPET estimates (see Section 2.2). Further details, including the applied formula, can be found in Giannaros et al. []. Accounting for different exposure hours within a given day, we computed the annual number of days when population- and location-specific mPET values exceeded the accliSHS mPET thresholds for at least 1 h and 6 h during the warm period of the year (April–October), for each year from 1991 to 2020. Following previous studies [,], long-term (1991–2020) trends in the annual number of days with ≥1 h and ≥6 accliSHS for each examined population type and regional unit were assessed using an ordinary least squares (OLS) regression model. The statistical significance of trends was computed based on Student’s t-test at 95% significance level (p-value ≤ 0.05) [,]. Further, changes in population- and location-based multi-year numbers of days with ≥1 h and ≥ 6 accliSHS were computed. Concerning accliSHS exposure, the location- and population-specific ≥ 1 h accliSHS exposure per year was quantified in person-days year−1, based on Tuholske et al. []. In particular, for each year between 1991 and 2020 and for each AUA regional unit, we multiplied the annual number of days with ≥1 h accliSHS and the population size of each targeted demographic type. We then applied OLS regression to assess the long-term (1991–2020) trends in population- and location-specific ≥1 h accliSHS exposure. Finally, we referred to Tuholske et al. [] to estimate the relative contribution shares (%) in the exposure trends arising from climate- and demographic-related changes. In more detail, the climate-related contributions were assessed in person-days year−1 by multiplying the annual number of days with ≥1 h accliSHS by the corresponding population size fixed in 1991, while the contributions of demographics were assessed in person-days year−1 by multiplying the annual number of days with ≥1h accliSHS by the corresponding annual population change since 1991. The rates of changes in these contributions were estimated by applying OLS regression. These rates were subsequently used to compute an index ([−1, 1]) indicating the relative shares (%) of the ≥1 h accliSHS exposure trends from changes in climate and population size from 1991 to 2020 (100% dominated by climate-related changes versus 100% dominated by demographic-related changes) [].
3. Results
3.1. Trends in Annual accliSHS Days
Figure 2 illustrates the rate of change in numbers of days annually with at least one 1 h accliSHS, expressed in days year−1, for each examined population type in AUA from 1991 to 2020. Overall, an increasing trend was evident, ranging from +0.22 (for an average male adult in West Athens) to +0.78 (for an average male senior in South Athens) days year−1 with ≥1 h accliSHS, across AUA. These results were statistically significant at a 95% confidence level in all regional units, expect for the average male and female adult individuals in West Athens. For all population types, South and Central Athens demonstrated the highest increasing trends (>+0.5 days year−1), while North Athens and Piraeus were characterized by increasing trends that spanned from +0.37 to +0.55 days year−1 (Figure 2).
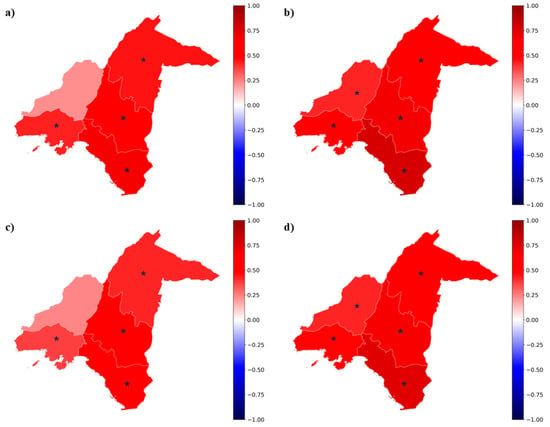
Figure 2.
Trends (1991–2020) in numbers of annual days with ≥1 h accliSHS in days year−1 for a (a) male adult, (b) male senior, (c) female adult, and (d) female senior individual in AUA. Asterisks indicate statistical significance at the 95% confidence level.
Regarding age-related differences, the average seniors were characterized by overall higher increasing trends in the number of days per year with ≥1 h accliSHS compared with average adults, throughout AUA. For example, the increasing trend for the average male adult in South Athens was equal to +0.67 days year−1, whereas it was equal to +0.78 days year−1 for the average male senior in the same regional unit. Similarly, the average female senior in North Athens (+0.55 days year−1) experienced a higher increase in ≥1 h accliSHS compared with the average female adult (+0.42 days year−1) by +0.13 days/year−1. Sex-related differences were less evident, as the trends in increase were approximately the same for the average male and female individuals, both adults and seniors, in all AUA regional units (Figure 2).
The trends described above denote that, on average, the annual days with ≥1 h accliSHS for an average adult and senior in AUA increased by ~13 and ~18 days, respectively, within the 30-year study period (1991–2020). Specifically, the increase in the average annual number of days with ≥1 h accliSHS from early 1990s to late 2020s ranged from 4 days for an average female adult in West Athens to 12 days for the same population type in South Athens, as shown in Table 1, corresponding to percentage increases ranging from 3.2% to 11.8%. Similar findings were evident for an average male adult, whereas the average number of days per year with accliSHS for at least 1 h increased by 7.7% (7.6%) for an average male (female) senior in West Athens and by 21% (19.2%) in South Athens from the early 1990s to the late 2010s (Table 1).

Table 1.
Five-year average numbers of days with ≥1 h accliSHS for the examined population types in AUA regional units in early 1990s (1999–1995) and late 2010s (2016–2020).
The patterns of increase in the trends outlined earlier (Figure 1) were similarly observed when focusing on annual days with ≥6 h accliSHS, as shown in Figure A1. As such, a significant contribution to the rise in the annual number of days with ≥1 h accliSHS seems to have arisen from the increased numbers of days with more than 6 h accliSHS. This indicates that AUA experienced an increase in the daily duration of accliSHS, in addition to the increase in the number of annual days with at least 1 h accliSHS, during the examined 30-year period (1991–2020). The related evidence of this became more apparent when comparing the percentage increases in the average numbers of days with ≥1 h and ≥6 h accliSHS, as shown in Table 1 and Table A1, respectively. Indicatively, these increases ranged from 5.7% (female adult) to 13.2% (male senior) for ≥1 h accliSHS in Pireaus, whereas they ranged from 42.3% (average female adult) to 87.7% (average male senior) for ≥6 h accliSHS in the same regional unit (Table 1 and Table A1).
3.2. Trends in Annual accliSHS Exposure
Figure 3, Figure 4, Figure A2 and Figure A3 show the 1991–2020 trends in ≥1 h accliSHS exposure and in climate- and demographic-related changes for the examined demographic types in the five AUA regional units. The warming referenced in the first column of plots refers to the increasing trend in annual ≥ 1 h accliSHS person-days year−1, similar to the growing numbers of annual ≥ 1 h accliSHS days per year documented in Section 3.1. The population sizes stated in the second column of plots may be associated with an increasing or decreasing trend, expressed in person-days year−1 (Figure 3, Figure 4, Figure A2 and Figure A3). The warming and population size trends both contribute to the population- and location-specific ≥ 1 h accliSHS exposure trends, illustrated in person-days year−1 in the third column of plots in Figure 3, Figure 4, Figure A2 and Figure A3. For adults (Figure 3 and Figure A2), the demographic changes exhibit parabolic shapes due to the population increase from 1991 to 2000 and the subsequent population decrease since 2000, which was particularly pronounced after 2010. As such, the population size trends in Figure 3 and Figure A2 indicate the general direction of the demographic shifts from 1991 to 2020, indicating an overall decrease in the AUA adult population, except in North Athens, during the examined 30-year period. This overall decreasing trajectory in population size was more noticeable in Central Athens, as indicated by the steeper trend slopes (−462,000 person-days year−1 for male adults and −620,000 person-days year−1 for female adults). As a result, the ≥1 h accliSHS exposure of adults in this regional unit was reduced (−253,000 person-days year−1 for male adults and −396,000 person-days year−1 for female adults), despite the significant warming the Central Athens experienced (+209,000 person-days year−1 for male adults and +224,000 person-days year−1 for female adults). On the other hand, the overall decline in the adult population in the other AUA regional units after 2000 was less evident. This fact, combined with warming in these areas (see also Section 3.1), resulted primarily in increases in ≥1 h accliSHS exposure for adults, ranging from +21,000 person-days year−1 (West Athens) to +139,000 person-days year−1 (North Athens) for female adults and from +23,000 person-days year−1 (Piraeus) to +75,000 person-days year−1 (North Athens) for male adults (Figure 3 and Figure A2).
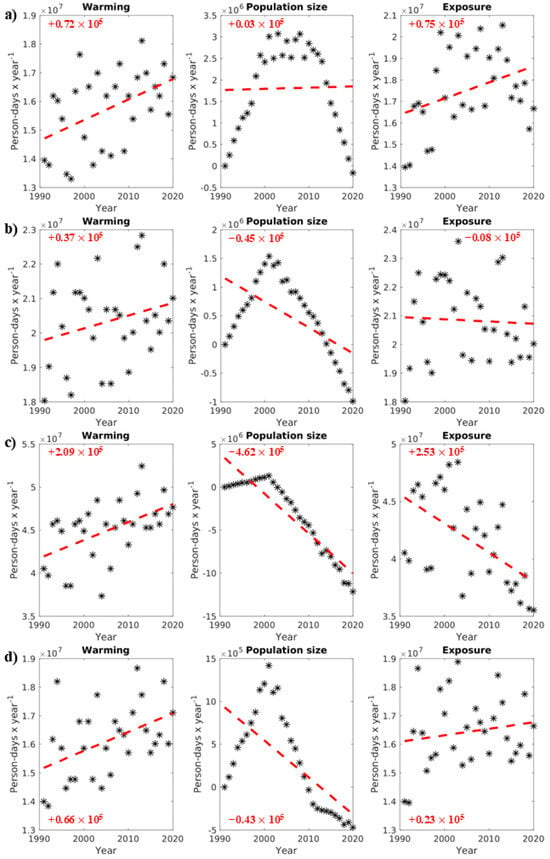
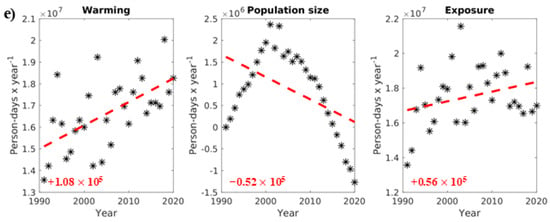
Figure 3.
Warming and population size evolution for male adults (person-days year−1) contributing to their exposure (person-days year−1) to ≥1 h accliSHS, from 1991 to 2020 (*) in (a) North Athens, (b) West Athens, (c) Central Athens, (d) Piraeus, and (e) South Athens. The red text and dotted lines in the plots indicate the trends in changes in the presented variables in person-days year−1.
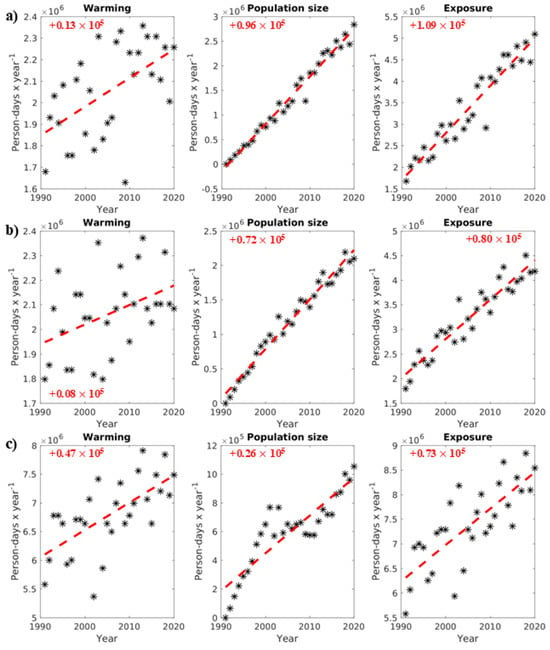
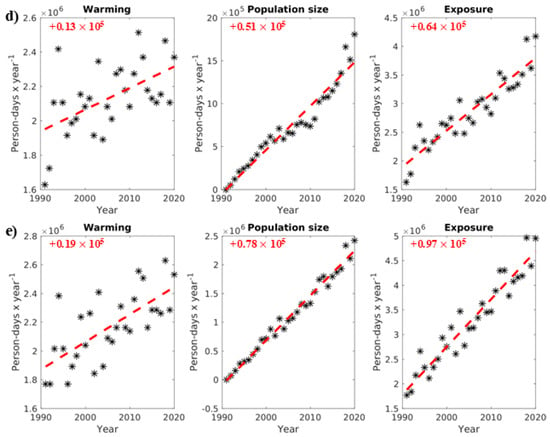
Figure 4.
Warming and population size evolution for male seniors (person-days year−1) contributing to their exposure (person-days year−1) to ≥1 h accliSHS, from 1991 to 2020 (*) in (a) North Athens, (b) West Athens, (c) Central Athens, (d) Piraeus, and (e) South Athens. The red text and dotted lines in the plots indicate the trends in changes in the presented variables in person-days year−1.
For seniors, the results of the present analysis are clearer. All AUA regional units experienced warming (see also Section 3.1). Additionally, all examined areas were characterized by an increasingly elderly population, including both males and females, although this increase was less evident in Central Athens. Combined, these trends led to significant increases in seniors’ exposure to ≥1 h accliSHS across the AUA. These values ranged from +64,000 person-days year−1 (Piraeus) to +109,000 person-days year−1 (North Athens) for male seniors, while the highest increase in exposure was evident for female seniors, surpassing +100,000 person-days year−1 in most regional units and reaching up to +153,000 person-days year−1 in North Athens. This outcome was primarily driven by greater increases in the elderly female population compared with elderly males. Indicatively, the exposure of female and male adults in South Athens to at least 1 h accliSHS grew by +136,000 person-days year−1 and +97,000 person-days year−1, respectively. Warming contributed almost equally to these trends for both sexes (+19,000 person-days year−1 for females and +25,000 person-days year−1 for males), whereas population size changes contributed by +111,000 person-days year−1 and +78,000 person-days year−1 for females and males, respectively (Figure 4 and Figure A3).
The above contributions are summarized in Figure 5, which illustrates the relative contribution shares (%) in the 30-year (1991–2020) trends in exposure to ≥1 h accliSHS for the examined populations in AUA. Specifically, the decreasing trends in exposure for male and female adults in Central Athens (Figure 3 and Figure A2) were driven by the population decline by ~37.7% and ~46.9%, respectively (Figure 5a,c). In contrast, the increase in exposure for male adults in North and South Athens and Piraeus and for female adults in North, West, and South Athens was attributed primarily to warming (Figure 3 and Figure A2), with relative contribution shares ranging from ~20.9% in Piraeus to ~92.2% in North Athens for female adults and from ~8.1% in North Athens to ~78.3% in South Athens for male adults (Figure 5a,c). For seniors, the increase in the size of their population contributed more than 60% to the exposure of both males and females in North, West, and South Athens and Piraeus to at least 1 h accliSHS. The highest value in these relative contribution shares (~82.9%) was found for female seniors in West Athens (Figure 4, Figure 5b,d, and Figure A3). On the other hand, warming primarily drove the exposure of seniors in Central Athens to ≥1 h accliSHS (Figure 5b,d), as an outcome of the less pronounced increase in the elderly population in this area (Figure 4 and Figure A3). Indicatively, warming contributed by ~28.8% to the increase in ≥1 h accliSHS exposure for male seniors in Central Athens (Figure 5b,d).
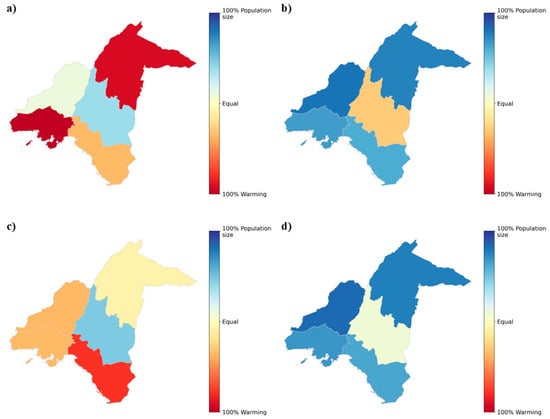
Figure 5.
The relative contribution shares (%) of climate- and demographic-related changes in ≥1 h accliSHS exposure trends (1991–2020) for (a) male adults, (b) male seniors, (c) female adults, and (d) female seniors in AUA.
4. Discussion
In the present study, we assessed the climatology and long-term (1991–2020) trends in population exposure to heat stress, considering population-wide variability in heat stress and short-term acclimatization effects. This was achieved by employing a novel human thermal bioclimate dataset containing hourly values of an advanced human-biometeorological index, namely mPET, for diverse demographic types []. We specifically focused on acclimatization-based SHS experienced by average male and female adult and senior individuals living in AUA, Greece, which is of particular interest with respect to heat-related issues due to the dangerous confluence of accelerated warming [] and increased population ageing [] in the region. The definition of aclliSHS was based on variable mPET thresholds, thus accounting for population- and location-specific short-term thermo–physiological adaptation to heat, which is critical with respect to the occurrence of heat-related health effects [].
The first-stage climatological analysis showed that days with at least 1 h aclliSHS constitute a common feature during the warm period of the year (April–October) in the study area. This was expected because of the hot summers in the Mediterranean climate of AUA []. An average adult in particular, may have been exposed to around 100 days with ≥1 h accliSHS in the early 1990s (Table 1). For an average senior, the number of days with ≥1 h accliSHS were lower overall (~85 in early 1990s; Table 1), because of the reduced physical activity assumed in the mPET computations for this population [,], consistent with the metabolic activity rates of elderly people under hot environmental conditions [,]. However, it is interesting that higher increasing trends (1991–2020) in days with ≥1 h accliSHS were documented for the average senior compared with the average adult across AUA (Figure 1). Given the significant warming and other thermal-related changes between 1991 and 2020 in the greater study area (e.g., [,,,]), this outcome indicates that thermo–physiologically it is more difficult for seniors to cope with the increasing heat stress conditions induced by climate change. Indeed, the human body’s capacity to dissipate heat decreases as age increases [].
Overall, the upward trends observed in our study in relation to the annual numbers of days with at least 1 h accliSHS in AUA are in accordance with previous similar studies in the area [,,,]. Regional differences in these trends are driven by geomorphological features and background atmospheric circulations that affect the thermal environment in AUA []. Furthermore, high rates of increase were particularly evident for days when mPET values for the examined demographic types exceeded the accliSHS threshold by more than 6 h, indicating a rise from 1991 to 2020 in the daily duration of heat stress in AUA, in agreement with previous research []. We focused on ≥ 6 h accliSHS because prolonged exposure to strong heat stress during the day is an important determinant for adverse health outcomes []. Thus, the increase greater than 8% in the average annual number of days with ≥6 h accliSHS (over 40% for an average senior; Table A1) is a particularly concerning outcome.
The significance of this outcome is heightened when it is considered alongside the increase in the elderly population from 1991 to 2020 (Figure 3, Figure 4, Figure A2 and Figure A3). This combination resulted in increases in seniors’ exposure to ≥1 h accliSHS across AUA that reached up to +153,000 person-days year−1 for female seniors in North Athens (Figure A3). The relevant outcomes for adults were more varied (Figure 3 and Figure 4), driven by population decline in Central Athens and primarily by warming in the rest of the examined AUA regional units (Figure 5). These varying contributions to the trends in ≥1 h accliSHS exposure reflect the urban and population expansion in suburban areas, particularly in North Athens [], as well as the immigration wave associated with the outbreak of the financial crisis in Greece in 2009 [].
5. Concluding Remarks
In this study, we expanded on existing heat stress exposure research by incorporating thermo–physiological principles through the use of an advanced human-biometeorological index, namely mPET. This approach allowed us to account for the variability in human thermoregulation responses, including those related to short-term acclimatization. As a result, we were able to provide a more nuanced and realistic assessment of the heat stress experienced by different population sub-groups. We demonstrated this novel technique in AUA, Greece, focusing on accliSHS. This research revealed increases in annual accliSHS days in the study area from 1991 to 2020 (i.e., warming). These trends, which were particularly pronounced for prolonged accliSHS exposure exceeding 6 h, pose significant thermo–physiological challenges for senior individuals. Furthermore, combined with the increase in size of the elderly population in AUA, these trends have led to a substantial and concerning increase in seniors’ accliSHS exposure over the past 30 years (1991–2020). Changes in population size linked to socioeconomic factors, such as urban expansion in northern AUA suburbs and the 2009 financial crisis in Greece, also contributed to the accliSHS exposure trends for adults, which showed both increases and decreases from 1991 to 2020. These findings underscore the multi-faceted nature of heat stress exposure, influenced by both climate change and demographic shifts [,,,,]. Given the significant health risks associated with heat stress exposure, the current study’s findings also underscore the urgent need for heat–health action planning [,,], as it is likely that continuation or intensification of the presented increasing trends in accliSHS in AUA, particularly for seniors, will amplify the burden on Greece’s healthcare system.
Author Contributions
Conceptualization, C.G. and E.G.; methodology, C.G, E.G. and I.A.; software, C.G., E.G. and I.A.; validation, C.G., E.G. and I.A.; formal analysis, C.G., E.G. and I.A.; investigation, C.G., E.G. and I.A.; resources, C.G., E.G. and I.A.; data curation, C.G., E.G. and I.A.; writing—original draft preparation, C.G.; writing—review and editing, C.G., E.G. and I.A.; visualization, E.G.; supervision, C.G.; funding acquisition, C.G. All authors have read and agreed to the published version of the manuscript.
Funding
This research is funded by the Hellenic Foundation for Research and Innovation (H.F.R.I.) under the “3d Call for H.F.R.I. Research Projects to support Post-Doctoral Researchers” (Project Number: 06885).
Data Availability Statement
The human-biometeorological data used in the present study are publicly available at the Zenodo repository: https://zenodo.org/records/10893914 (accessed on 1 September 2024). The population data used in the current study were retrieved from the Hellenic Statistical Authority (https://www.statistics.gr/en/; accessed on 1 September 2024) and Eurostat (https://ec.europa.eu/eurostat; accessed on 1 September 2024).
Conflicts of Interest
The authors declare no conflicts of interest.
Appendix A
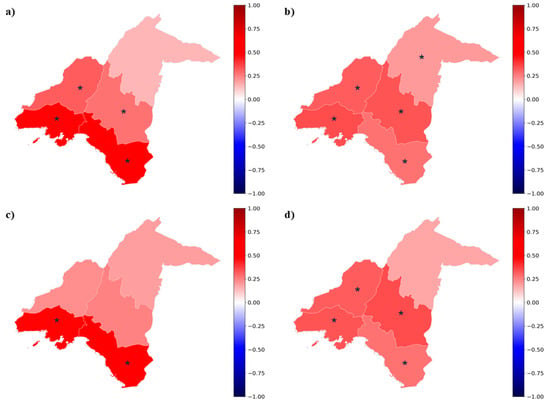
Figure A1.
Trends (1991–2020) in numbers of annual days with ≥6 h accliSHS in days year−1 for a (a) male adult, (b) male senior, (c) female adult, and (d) female senior individual in AUA. Asterisks indicate statistical significance at the 95% confidence level.

Table A1.
Five-year average numbers of days with ≥6 h accliSHS for the examined population types in AUA regional units in early 1990s (1999–1995) and late 2010s (2016–2020).
Table A1.
Five-year average numbers of days with ≥6 h accliSHS for the examined population types in AUA regional units in early 1990s (1999–1995) and late 2010s (2016–2020).
| Demographic Type | ||||
|---|---|---|---|---|
| AUA Regional Unit | Male Adult | Male Senior | Female Adult | Female Senior |
| North Athens | early 1990s: 20 late 2020s: 23 | early 1990s: 11 late 2020s: 16 | early 1990s: 22 late 2020s: 27 | early 1990s: 12 late 2020s: 17 |
| West Athens | early 1990s: 33 late 2020s: 38 | early 1990s: 19 late 2020s: 27 | early 1990s: 38 late 2020s: 41 | early 1990s: 20 late 2020s: 28 |
| Central Athens | early 1990s: 27 late 2020s: 33 | early 1990s: 15 late 2020s: 23 | early 1990s: 30 late 2020s: 35 | early 1990s: 16 late 2020s: 25 |
| Piraeus | early 1990s: 23 late 2020s: 34 | early 1990s: 11 late 2020s: 21 | early 1990s: 26 late 2020s: 37 | early 1990s: 13 late 2020s: 22 |
| South Athens | early 1990s: 21 late 2020s: 34 | early 1990s: 13 late 2020s: 21 | early 1990s: 24 late 2020s: 37 | early 1990s: 13 late 2020s: 21 |
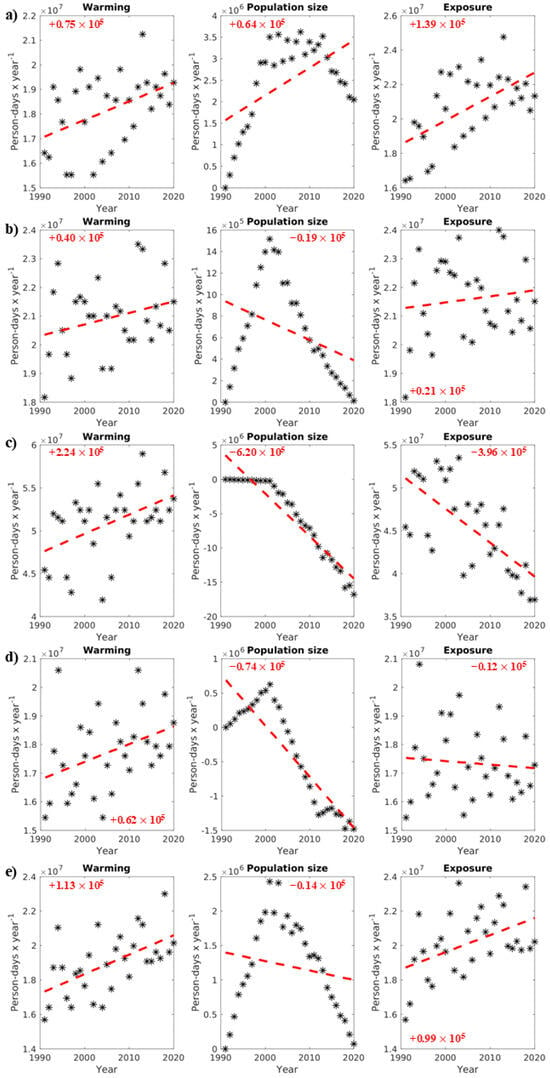
Figure A2.
Warming and population size evolution for female adults (person-days year−1) contributing to their exposure (person-days year−1) to ≥1 h accliSHS from 1991 to 2020 (*) in (a) North Athens, (b) West Athens, (c) Central Athens, (d) Piraeus, and (e) South Athens. The red text and dotted lines in the plots indicate the trends in changes in the presented variables in person-days year−1.
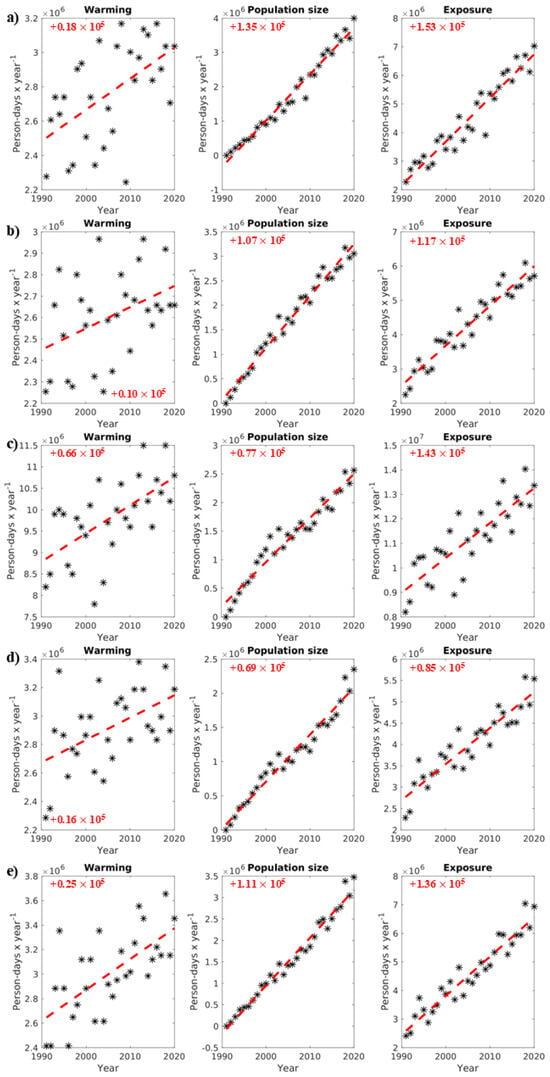
Figure A3.
Warming and population size evolution for female seniors (person-days year−1) contributing to their exposure (person-days year−1) to ≥1 h accliSHS from 1991 to 2020 (*) in (a) North Athens, (b) West Athens, (c) Central Athens, (d) Piraeus, and (e) South Athens. The red text and dotted lines in the plots indicate the trends in changes in the presented variables in person-days year−1.
References
- Seneviratne, S.I.; Zhang, X.; Adnan, M.; Badi, W.; Dereczynski, C.; Di Luca, A.; Ghosh, S.; Iskandar, I.; Kossin, J.; Lewis, S.; et al. Weather and Climate Extreme Events in a Changing Climate. In Climate Change 2021: The Physical Science Basis; Contribution of Working Group I to the Sixth Assessment Report of the Intergovernmental Panel on Climate, Change; Masson-Delmotte, V., Zhai, P., Pirani, A., Connors, S.L., Péan, C., Berger, S., Caud, N., Chen, Y., Goldfarb, L., Gomis, M.I., et al., Eds.; Cambridge University Press: Cambridge, UK; New York, NY, USA, 2023; pp. 1513–1766. [Google Scholar] [CrossRef]
- Zhang, Y.; Yu, C.; Wang, L. Temperature Exposure during Pregnancy and Birth Outcomes: An Updated Systematic Review of Epidemiological Evidence. Environ. Pollut. 2017, 225, 700–712. [Google Scholar] [CrossRef] [PubMed]
- McElroy, S.; Ilango, S.; Dimitrova, A.; Gershunov, A.; Benmarhnia, T. Extreme Heat, Preterm Birth, and Stillbirth: A Global Analysis across 14 Lower-Middle Income Countries. Environ. Int. 2022, 158, 106902. [Google Scholar] [CrossRef] [PubMed]
- Liu, J.; Varghese, B.M.; Hansen, A.; Xiang, J.; Zhang, Y.; Dear, K.; Gourley, M.; Driscoll, T.; Morgan, G.; Capon, A.; et al. Is There an Association between Hot Weather and Poor Mental Health Outcomes? A Systematic Review and Meta-Analysis. Environ. Int. 2021, 153, 106533. [Google Scholar] [CrossRef]
- Minor, K.; Bjerre-Nielsen, A.; Jonasdottir, S.S.; Lehmann, S.; Obradovich, N. Rising Temperatures Erode Human Sleep Globally. One Earth 2022, 5, 534–549. [Google Scholar] [CrossRef]
- Bernard, P.; Chevance, G.; Kingsbury, C.; Baillot, A.; Romain, A.-J.; Molinier, V.; Gadais, T.; Dancause, K.N. Climate Change, Physical Activity and Sport: A Systematic Review. Sports Med. 2021, 51, 1041–1059. [Google Scholar] [CrossRef]
- Wallenberg, N.; Lindberg, F.; Thorsson, S.; Jungmalm, J.; Fröberg, A.; Raustorp, A.; Rayner, D. The Effects of Warm Weather on Children’s Outdoor Heat Stress and Physical Activity in a Preschool Yard in Gothenburg, Sweden. Int. J. Biometeorol. 2023, 67, 1927–1940. [Google Scholar] [CrossRef]
- Nazarian, N.; Liu, S.; Kohler, M.; Lee, J.K.W.; Miller, C.; Chow, W.T.L.; Alhadad, S.B.; Martilli, A.; Quintana, M.; Sunden, L.; et al. Project Coolbit: Can Your Watch Predict Heat Stress and Thermal Comfort Sensation? Environ. Res. Lett. 2021, 16, 34031. [Google Scholar] [CrossRef]
- Flouris, A.D.; Dinas, P.C.; Ioannou, L.G.; Nybo, L.; Havenith, G.; Kenny, G.P.; Kjellstrom, T. Workers’ Health and Productivity under Occupational Heat Strain: A Systematic Review and Meta-Analysis. Lancet Planet. Health 2018, 2, e521–e531. [Google Scholar] [CrossRef]
- Cheng, J.; Xu, Z.; Bambrick, H.; Prescott, V.; Wang, N.; Zhang, Y.; Su, H.; Tong, S.; Hu, W. Cardiorespiratory Effects of Heatwaves: A Systematic Review and Meta-Analysis of Global Epidemiological Evidence. Environ. Res. 2019, 177, 108610. [Google Scholar] [CrossRef]
- Parliari, D.; Cheristanidis, S.; Giannaros, C.; Keppas, S.C.; Papadogiannaki, S.; de’Donato, F.; Sarras, C.; Melas, D. Short-Term Effects of Apparent Temperature on Cause-Specific Mortality in the Urban Area of Thessaloniki, Greece. Atmosphere 2022, 13, 852. [Google Scholar] [CrossRef]
- Wondmagegn, B.Y.; Xiang, J.; Williams, S.; Pisaniello, D.; Bi, P. What Do We Know about the Healthcare Costs of Extreme Heat Exposure? A Comprehensive Literature Review. Sci. Total Environ. 2019, 657, 608–618. [Google Scholar] [CrossRef] [PubMed]
- Parsons, L.A.; Masuda, Y.J.; Kroeger, T.; Shindell, D.; Wolff, N.H.; Spector, J.T. Global Labor Loss due to Humid Heat Exposure Underestimated for Outdoor Workers. Environ. Res. Lett. 2022, 17, 14050. [Google Scholar] [CrossRef]
- De Perez, E.C.; Van Aalst, M.; Bischiniotis, K.; Mason, S.; Nissan, H.; Pappenberger, F.; Stephens, E.; Zsoter, E.; Van Den Hurk, B. Global Predictability of Temperature Extremes. Environ. Res. Lett. 2018, 13, 054017. [Google Scholar] [CrossRef]
- Chambers, J. Global and Cross-Country Analysis of Exposure of Vulnerable Populations to Heatwaves from 1980 to 2018. Clim. Chang. 2020, 163, 539–558. [Google Scholar] [CrossRef]
- Li, L.; Zha, Y. Population Exposure to Extreme Heat in China: Frequency, Intensity, Duration and Temporal Trends. Sustain. Cities Soc. 2020, 60, 102282. [Google Scholar] [CrossRef]
- Tuholske, C.; Caylor, K.; Funk, C.; Verdin, A.; Sweeney, S.; Grace, K.; Peterson, P.; Evans, T. Global Urban Population Exposure to Extreme Heat. Proc. Natl. Acad. Sci. USA 2021, 118, e2024792118. [Google Scholar] [CrossRef] [PubMed]
- Alizadeh, M.R.; Abatzoglou, J.T.; Adamowski, J.F.; Prestemon, J.P.; Chittoori, B.; Akbari Asanjan, A.; Sadegh, M. Increasing Heat-Stress Inequality in a Warming Climate. Earth’s Future 2022, 10, e2021EF002488. [Google Scholar] [CrossRef]
- Romanello, M.; di Napoli, C.; Green, C.; Kennard, H.; Lampard, P.; Scamman, D.; Walawender, M.; Ali, Z.; Ameli, N.; Ayeb-Karlsson, S.; et al. The 2023 Report of the Lancet Countdown on Health and Climate Change: The Imperative for a Health-Centred Response in a World Facing Irreversible Harms. Lancet 2023, 402, 2346–2394. [Google Scholar] [CrossRef]
- Kyaw, A.K.; Hamed, M.M.; Kamruzzaman, M.; Shahid, S. Spatiotemporal Changes in Population Exposure to Heat Stress in South Asia. Sustain. Cities Soc. 2023, 93, 104544. [Google Scholar] [CrossRef]
- Dong, D.; Tao, H.; Zhang, Z. Historic Evolution of Population Exposure to Heatwaves in Xinjiang Uygur Autonomous Region, China. Sci. Rep. 2023, 13, 7401. [Google Scholar] [CrossRef]
- Dong, J.; Hu, T.; Liu, Y.; Peng, J. Urban-Rural Differences in the Local Human Exposure to Humid Heatwaves in the Northern Hemisphere. Sustain. Cities Soc. 2024, 107, 105415. [Google Scholar] [CrossRef]
- Liu, Z.; Anderson, B.; Yan, K.; Dong, W.; Liao, H.; Shi, P. Global and Regional Changes in Exposure to Extreme Heat and the Relative Contributions of Climate and Population Change. Sci. Rep. 2017, 7, 43909. [Google Scholar] [CrossRef] [PubMed]
- Coffel, E.D.; Horton, R.M.; De Sherbinin, A. Temperature and Humidity Based Projections of a Rapid Rise in Global Heat Stress Exposure during the 21st Century. Environ. Res. Lett. 2018, 13, 014001. [Google Scholar] [CrossRef] [PubMed]
- Jones, B.; Tebaldi, C.; O’Neill, B.C.; Oleson, K.; Gao, J. Avoiding Population Exposure to Heat-Related Extremes: Demographic Change vs Climate Change. Clim. Chang. 2018, 146, 423–437. [Google Scholar] [CrossRef]
- Rohat, G.; Flacke, J.; Dosio, A.; Pedde, S.; Dao, H.; van Maarseveen, M. Influence of Changes in Socioeconomic and Climatic Conditions on Future Heat-Related Health Challenges in Europe. Glob. Planet. Chang. 2019, 172, 45–59. [Google Scholar] [CrossRef]
- Broadbent, A.M.; Krayenhoff, E.S.; Georgescu, M. The Motley Drivers of Heat and Cold Exposure in 21st Century US Cities. Proc. Natl. Acad. Sci. USA 2020, 117, 21108–21117. [Google Scholar] [CrossRef]
- Iyakaremye, V.; Zeng, G.; Yang, X.; Zhang, G.; Ullah, I.; Gahigi, A.; Vuguziga, F.; Asfaw, T.G.; Ayugi, B. Increased High-Temperature Extremes and Associated Population Exposure in Africa by the Mid-21st Century. Sci. Total Environ. 2021, 790, 148162. [Google Scholar] [CrossRef]
- Chen, H.; He, W.; Sun, J.; Chen, L. Increases of Extreme Heat-Humidity Days Endanger Future Populations Living in China. Environ. Res. Lett. 2022, 17, 064013. [Google Scholar] [CrossRef]
- Freychet, N.; Hegerl, G.C.; Lord, N.S.; Lo, Y.T.E.; Mitchell, D.; Collins, M. Robust Increase in Population Exposure to Heat Stress with Increasing Global Warming. Environ. Res. Lett. 2022, 17, 064049. [Google Scholar] [CrossRef]
- Lei, Y.; Wang, Z.; Zhang, X.; Che, H.; Yue, X.; Tian, C.; Zhong, J.; Guo, L.; Li, L.; Zhou, H. Avoided Population Exposure to Extreme Heat under Two Scenarios of Global Carbon Neutrality by 2050 and 2060. Environ. Res. Lett. 2022, 17, 094041. [Google Scholar] [CrossRef]
- Nishant, N.; Ji, F.; Guo, Y.; Herold, N.; Green, D.; Di Virgilio, G.; Beyer, K.; Riley, M.L.; Perkins-Kirkpatrick, S. Future Population Exposure to Australian Heatwaves. Environ. Res. Lett. 2022, 17, 064030. [Google Scholar] [CrossRef]
- Vanos, J.K.; Warland, J.S.; Gillespie, T.J.; Kenny, N.A. Review of the Physiology of Human Thermal Comfort While Exercising in Urban Landscapes and Implications for Bioclimatic Design. Int. J. Biometeorol. 2010, 54, 319–334. [Google Scholar] [CrossRef] [PubMed]
- McGregor, G.R.; Vanos, J.K. Heat: A Primer for Public Health Researchers. Public Health 2018, 161, 138–146. [Google Scholar] [CrossRef] [PubMed]
- Matzarakis, A. Curiosities about Thermal Indices Estimation and Application. Atmosphere 2021, 12, 721. [Google Scholar] [CrossRef]
- Giannaros, C.; Agathangelidis, I.; Galanaki, E.; Cartalis, C.; Kotroni, V.; Lagouvardos, K.; Giannaros, T.M.; Matzarakis, A. Hourly Values of an Advanced Human-Biometeorological Index for Diverse Populations from 1991 to 2020 in Greece. Sci. Data 2024, 11, 76. [Google Scholar] [CrossRef]
- Matzarakis, A. A Note on the Assessment of the Effect of Atmospheric Factors and Components on Humans. Atmosphere 2020, 11, 1283. [Google Scholar] [CrossRef]
- Vanos, J.K.; Baldwin, J.W.; Jay, O.; Ebi, K.L. Simplicity Lacks Robustness When Projecting Heat-Health Outcomes in a Changing Climate. Nat. Commun. 2020, 11, 6079. [Google Scholar] [CrossRef]
- Giannaros, C.; Economou, T.; Parliari, D.; Galanaki, E.; Kotroni, V.; Lagouvardos, K.; Matzarakis, A. A Thermo-Physiologically Consistent Approach for Studying the Heat-Health Nexus with Hierarchical Generalized Additive Modelling: Application in Athens Urban Area (Greece). Urban Clim. 2024, 58, 102206. [Google Scholar] [CrossRef]
- Giannaros, C.; Agathangelidis, I.; Papavasileiou, G.; Galanaki, E.; Kotroni, V.; Lagouvardos, K.; Giannaros, T.M.; Cartalis, C.; Matzarakis, A. The Extreme Heat Wave of July–August 2021 in the Athens Urban Area (Greece): Atmospheric and Human-Biometeorological Analysis Exploiting Ultra-High Resolution Numerical Modeling and the Local Climate Zone Framework. Sci. Total Environ. 2023, 857, 159300. [Google Scholar] [CrossRef]
- Agathangelidis, I.; Cartalis, C.; Santamouris, M. Integrating Urban Form, Function, and Energy Fluxes in a Heat Exposure Indicator in View of Intra-Urban Heat Island Assessment and Climate Change Adaptation. Climate 2019, 7, 75. [Google Scholar] [CrossRef]
- Giannaros, T.M.; Melas, D.; Daglis, I.A.; Keramitsoglou, I.; Kourtidis, K. Numerical Study of the Urban Heat Island over Athens (Greece) with the WRF Model. Atmos. Environ. 2013, 73, 103–111. [Google Scholar] [CrossRef]
- Founda, D.; Pierros, F.; Katavoutas, G.; Keramitsoglou, I. Observed Trends in Thermal Stress at European Cities with Different Background Climates. Atmosphere 2019, 10, 436. [Google Scholar] [CrossRef]
- Katavoutas, G.; Founda, D. Response of Urban Heat Stress to Heatwaves in Athens (1960–2017). Atmosphere 2019, 10, 483. [Google Scholar] [CrossRef]
- Founda, D.; Katavoutas, G.; Pierros, F.; Mihalopoulos, N. Centennial Changes in Heat Waves Characteristics in Athens (Greece) from Multiple Definitions Based on Climatic and Bioclimatic Indices. Glob. Planet. Chang. 2022, 212, 103807. [Google Scholar] [CrossRef]
- Galanaki, E.; Giannaros, C.; Kotroni, V.; Lagouvardos, K.; Papavasileiou, G. Spatio-Temporal Analysis of Heatwaves Characteristics in Greece from 1950 to 2020. Climate 2023, 11, 5. [Google Scholar] [CrossRef]
- Matzarakis, A.; Nastos, P.T. Human-Biometeorological Assessment of Heat Waves in Athens. Theor. Appl. Climatol. 2011, 105, 99–106. [Google Scholar] [CrossRef]
- Giannaros, T.M.; Kotroni, V.; Lagouvardos, K.; Matzarakis, A. Climatology and Trends of the Euro-Mediterranean Thermal Bioclimate. Int. J. Climatol. 2018, 38, 3290–3308. [Google Scholar] [CrossRef]
- Katavoutas, G.; Founda, D. Intensification of Thermal Risk in Mediterranean Climates: Evidence from the Comparison of Rational and Simple Indices. Int. J. Biometeorol. 2019, 63, 1251–1264. [Google Scholar] [CrossRef]
- Lamnisos, D.; Giannakou, K.; Jakovljevic, M. (Michael) Demographic Forecasting of Population Aging in Greece and Cyprus: One Big Challenge for the Mediterranean Health and Social System Long-Term Sustainability. Health Res. Policy Syst. 2021, 19, 21. [Google Scholar] [CrossRef]
- Chen, Y.; Matzarakis, A. Modified Physiologically Equivalent Temperature—Basics and Applications for Western European Climate. Theor. Appl. Climatol. 2018, 132, 1275–1289. [Google Scholar] [CrossRef]
- Chen, Y.-C.; Chen, W.-N.; Chou, C.C.-K.; Matzarakis, A. Concepts and New Implements for Modified Physiologically Equivalent Temperature. Atmosphere 2020, 11, 694. [Google Scholar] [CrossRef]
- Fukuda, K. Interpolation and Forecasting of Population Census Data. J. Popul. Res. 2010, 27, 1–13. [Google Scholar] [CrossRef]
- Matzarakis, A.; Muthers, S.; Koch, E. Human Biometeorological Evaluation of Heat-Related Mortality in Vienna. Theor. Appl. Climatol. 2011, 105, 1–10. [Google Scholar] [CrossRef]
- Kuchcik, M. Mortality and Thermal Environment (UTCI) in Poland—Long-Term, Multi-City Study. Int. J. Biometeorol. 2021, 65, 1529–1541. [Google Scholar] [CrossRef] [PubMed]
- Bouchama, A.; Abuyassin, B.; Lehe, C.; Laitano, O.; Jay, O.; O’Connor, F.G.; Leon, L.R. Classic and Exertional Heatstroke. Nat. Rev. Dis. Prim. 2022, 8, 8. [Google Scholar] [CrossRef]
- Cramer, M.N.; Jay, O. Biophysical Aspects of Human Thermoregulation during Heat Stress. Auton. Neurosci. Basic Clin. 2016, 196, 3–13. [Google Scholar] [CrossRef]
- Matzarakis, A.; Mayer, H.; Iziomon, M.G. Applications of a Universal Thermal Index: Physiological Equivalent Temperature. Int. J. Biometeorol. 1999, 43, 76–84. [Google Scholar] [CrossRef]
- Koppe, C.; Jendritzky, G. Inclusion of Short-Term Adaptation to Thermal Stresses in a Heat Load Warning Procedure. Meteorol. Z. 2005, 14, 271–278. [Google Scholar] [CrossRef]
- Giannaros, C.; Kotroni, V.; Lagouvardos, K.; Oikonomou, C.; Haralambous, H.; Papagiannaki, K. Hydrometeorological and Socio-Economic Impact Assessment of Stream Flooding in Southeast Mediterranean: The Case of Rafina Catchment (Attica, Greece). Water 2020, 12, 2426. [Google Scholar] [CrossRef]
- Urdiales-Flores, D.; Zittis, G.; Hadjinicolaou, P.; Osipov, S.; Klingmüller, K.; Mihalopoulos, N.; Kanakidou, M.; Economou, T.; Lelieveld, J. Drivers of Accelerated Warming in Mediterranean Climate-Type Regions. NPJ Clim. Atmos. Sci. 2023, 6, 97. [Google Scholar] [CrossRef]
- Matzarakis, A.; Laschewski, G.; Muthers, S. The Heat Health Warning System in Germany—Application and Warnings for 2005 to 2019. Atmosphere 2020, 11, 170. [Google Scholar] [CrossRef]
- Tony Wolf, S.; Cottle, R.M.; Fisher, K.G.; Vecellio, D.J.; Larry Kenney, W. Heat Stress Vulnerability and Critical Environmental Limits for Older Adults. Commun. Earth Environ. 2023, 4, 486. [Google Scholar] [CrossRef]
- Galanaki, E.; Emmanouil, G.; Lagouvardos, K.; Kotroni, V. Long-Term Patterns and Trends of Shortwave Global Irradiance over the Euro-Mediterranean Region. Atmosphere 2021, 12, 1431. [Google Scholar] [CrossRef]
- Lagouvardos, K.; Dafis, S.; Kotroni, V.; Kyros, G.; Giannaros, C. Exploring Recent (1991–2020) Trends of Essential Climate Variables in Greece. Atmosphere 2024, 15, 1104. [Google Scholar] [CrossRef]
- Zyrichidou, I.; Balis, D.; Koukouli, M.E.; Drosoglou, T.; Bais, A.; Gratsea, M.; Gerasopoulos, E.; Liora, N.; Poupkou, A.; Giannaros, C.; et al. Adverse Results of the Economic Crisis: A Study on the Emergence of Enhanced Formaldehyde (HCHO) Levels Seen from Satellites over Greek Urban Sites. Atmos. Res. 2019, 224, 42–51. [Google Scholar] [CrossRef]
- Martinez, G.S.; Kendrovski, V.; Salazar, M.A.; de’Donato, F.; Boeckmann, M. Heat-Health Action Planning in the WHO European Region: Status and Policy Implications. Environ. Res. 2022, 214, 113709. [Google Scholar] [CrossRef] [PubMed]
- Matzarakis, A. Communication Aspects about Heat in an Era of Global Warming –The Lessons Learnt by Germany and Beyond. Atmosphere 2022, 13, 226. [Google Scholar] [CrossRef]
- Winklmayr, C.; Matthies-Wiesler, F.; Muthers, S.; Buchien, S.; Kuch, B.; an der Heiden, M.; Mücke, H.-G. Heat in Germany: Health Risks and Preventive Measures. J. Health Monit. 2023, 8, 3–32. [Google Scholar] [CrossRef]
Disclaimer/Publisher’s Note: The statements, opinions and data contained in all publications are solely those of the individual author(s) and contributor(s) and not of MDPI and/or the editor(s). MDPI and/or the editor(s) disclaim responsibility for any injury to people or property resulting from any ideas, methods, instructions or products referred to in the content. |
© 2024 by the authors. Licensee MDPI, Basel, Switzerland. This article is an open access article distributed under the terms and conditions of the Creative Commons Attribution (CC BY) license (https://creativecommons.org/licenses/by/4.0/).