


Evolution of Bioclimatic Belts in Spain and the Balearic Islands (1953–2022)

 , ,
, ,
Abstract
1. Introduction
2. Materials and Methods
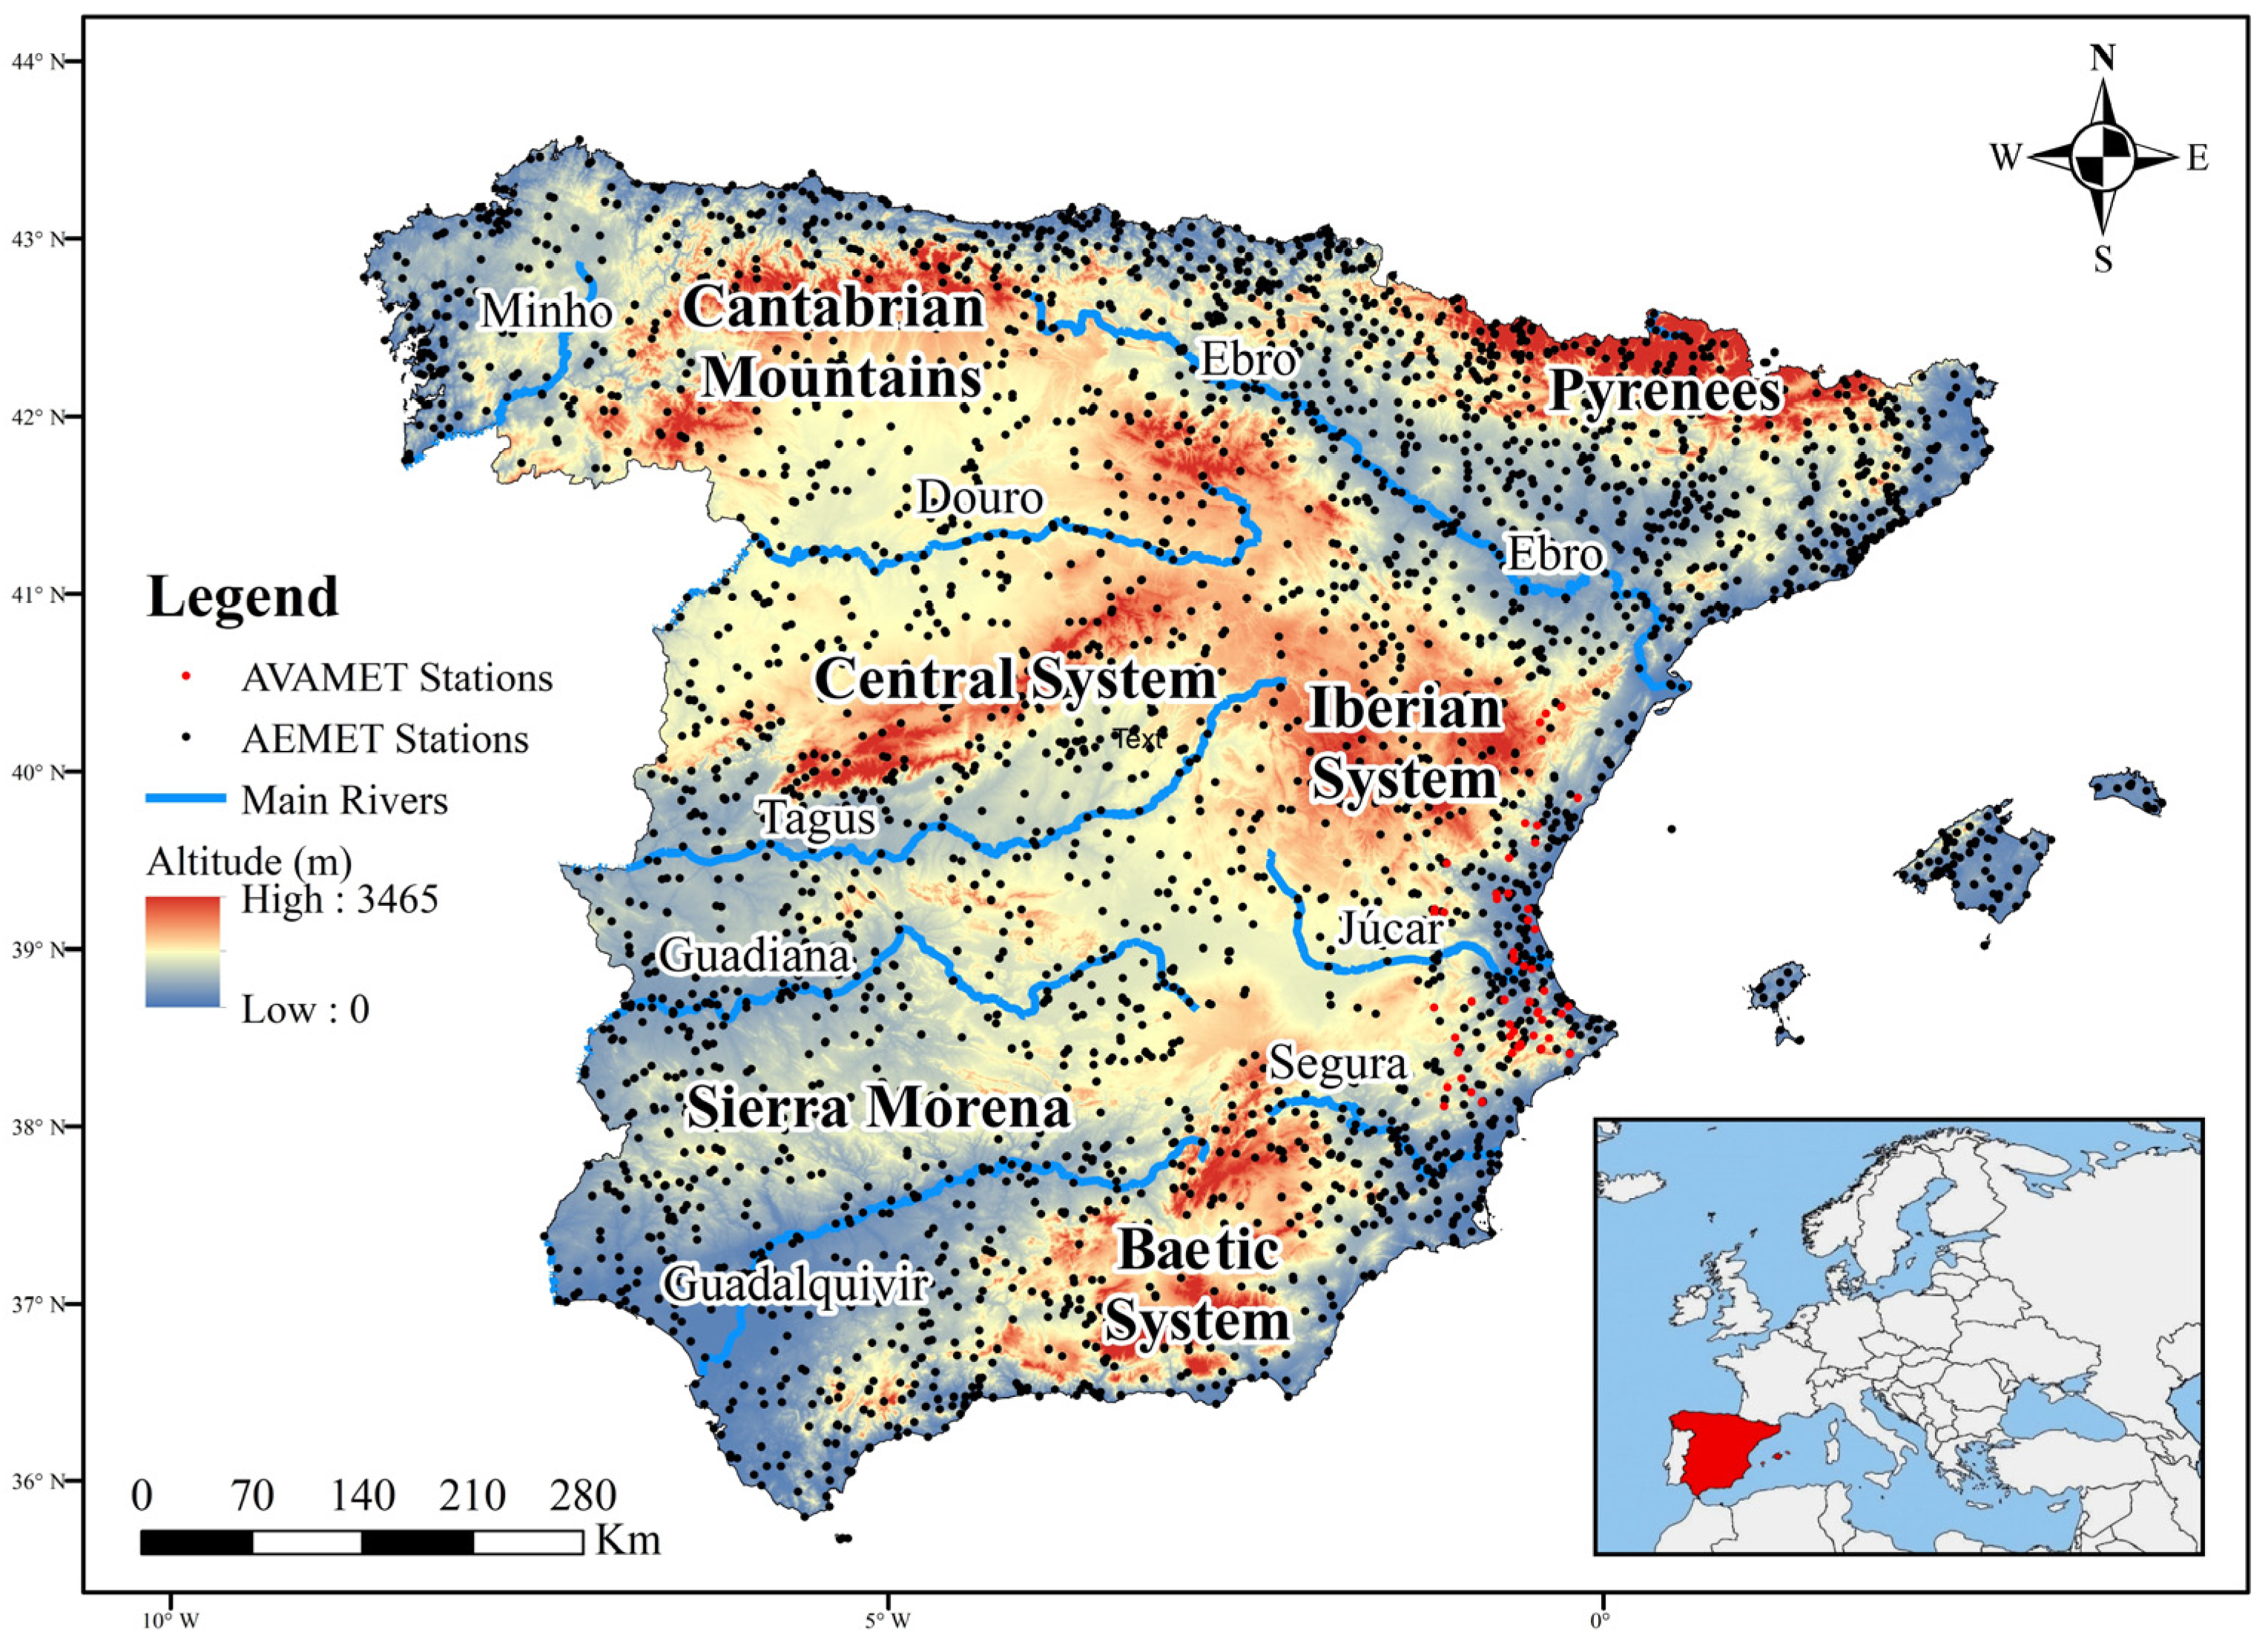
2.1. Study Area
2.2. Database: Processing and Analysis
2.3. Methodology
3. Results
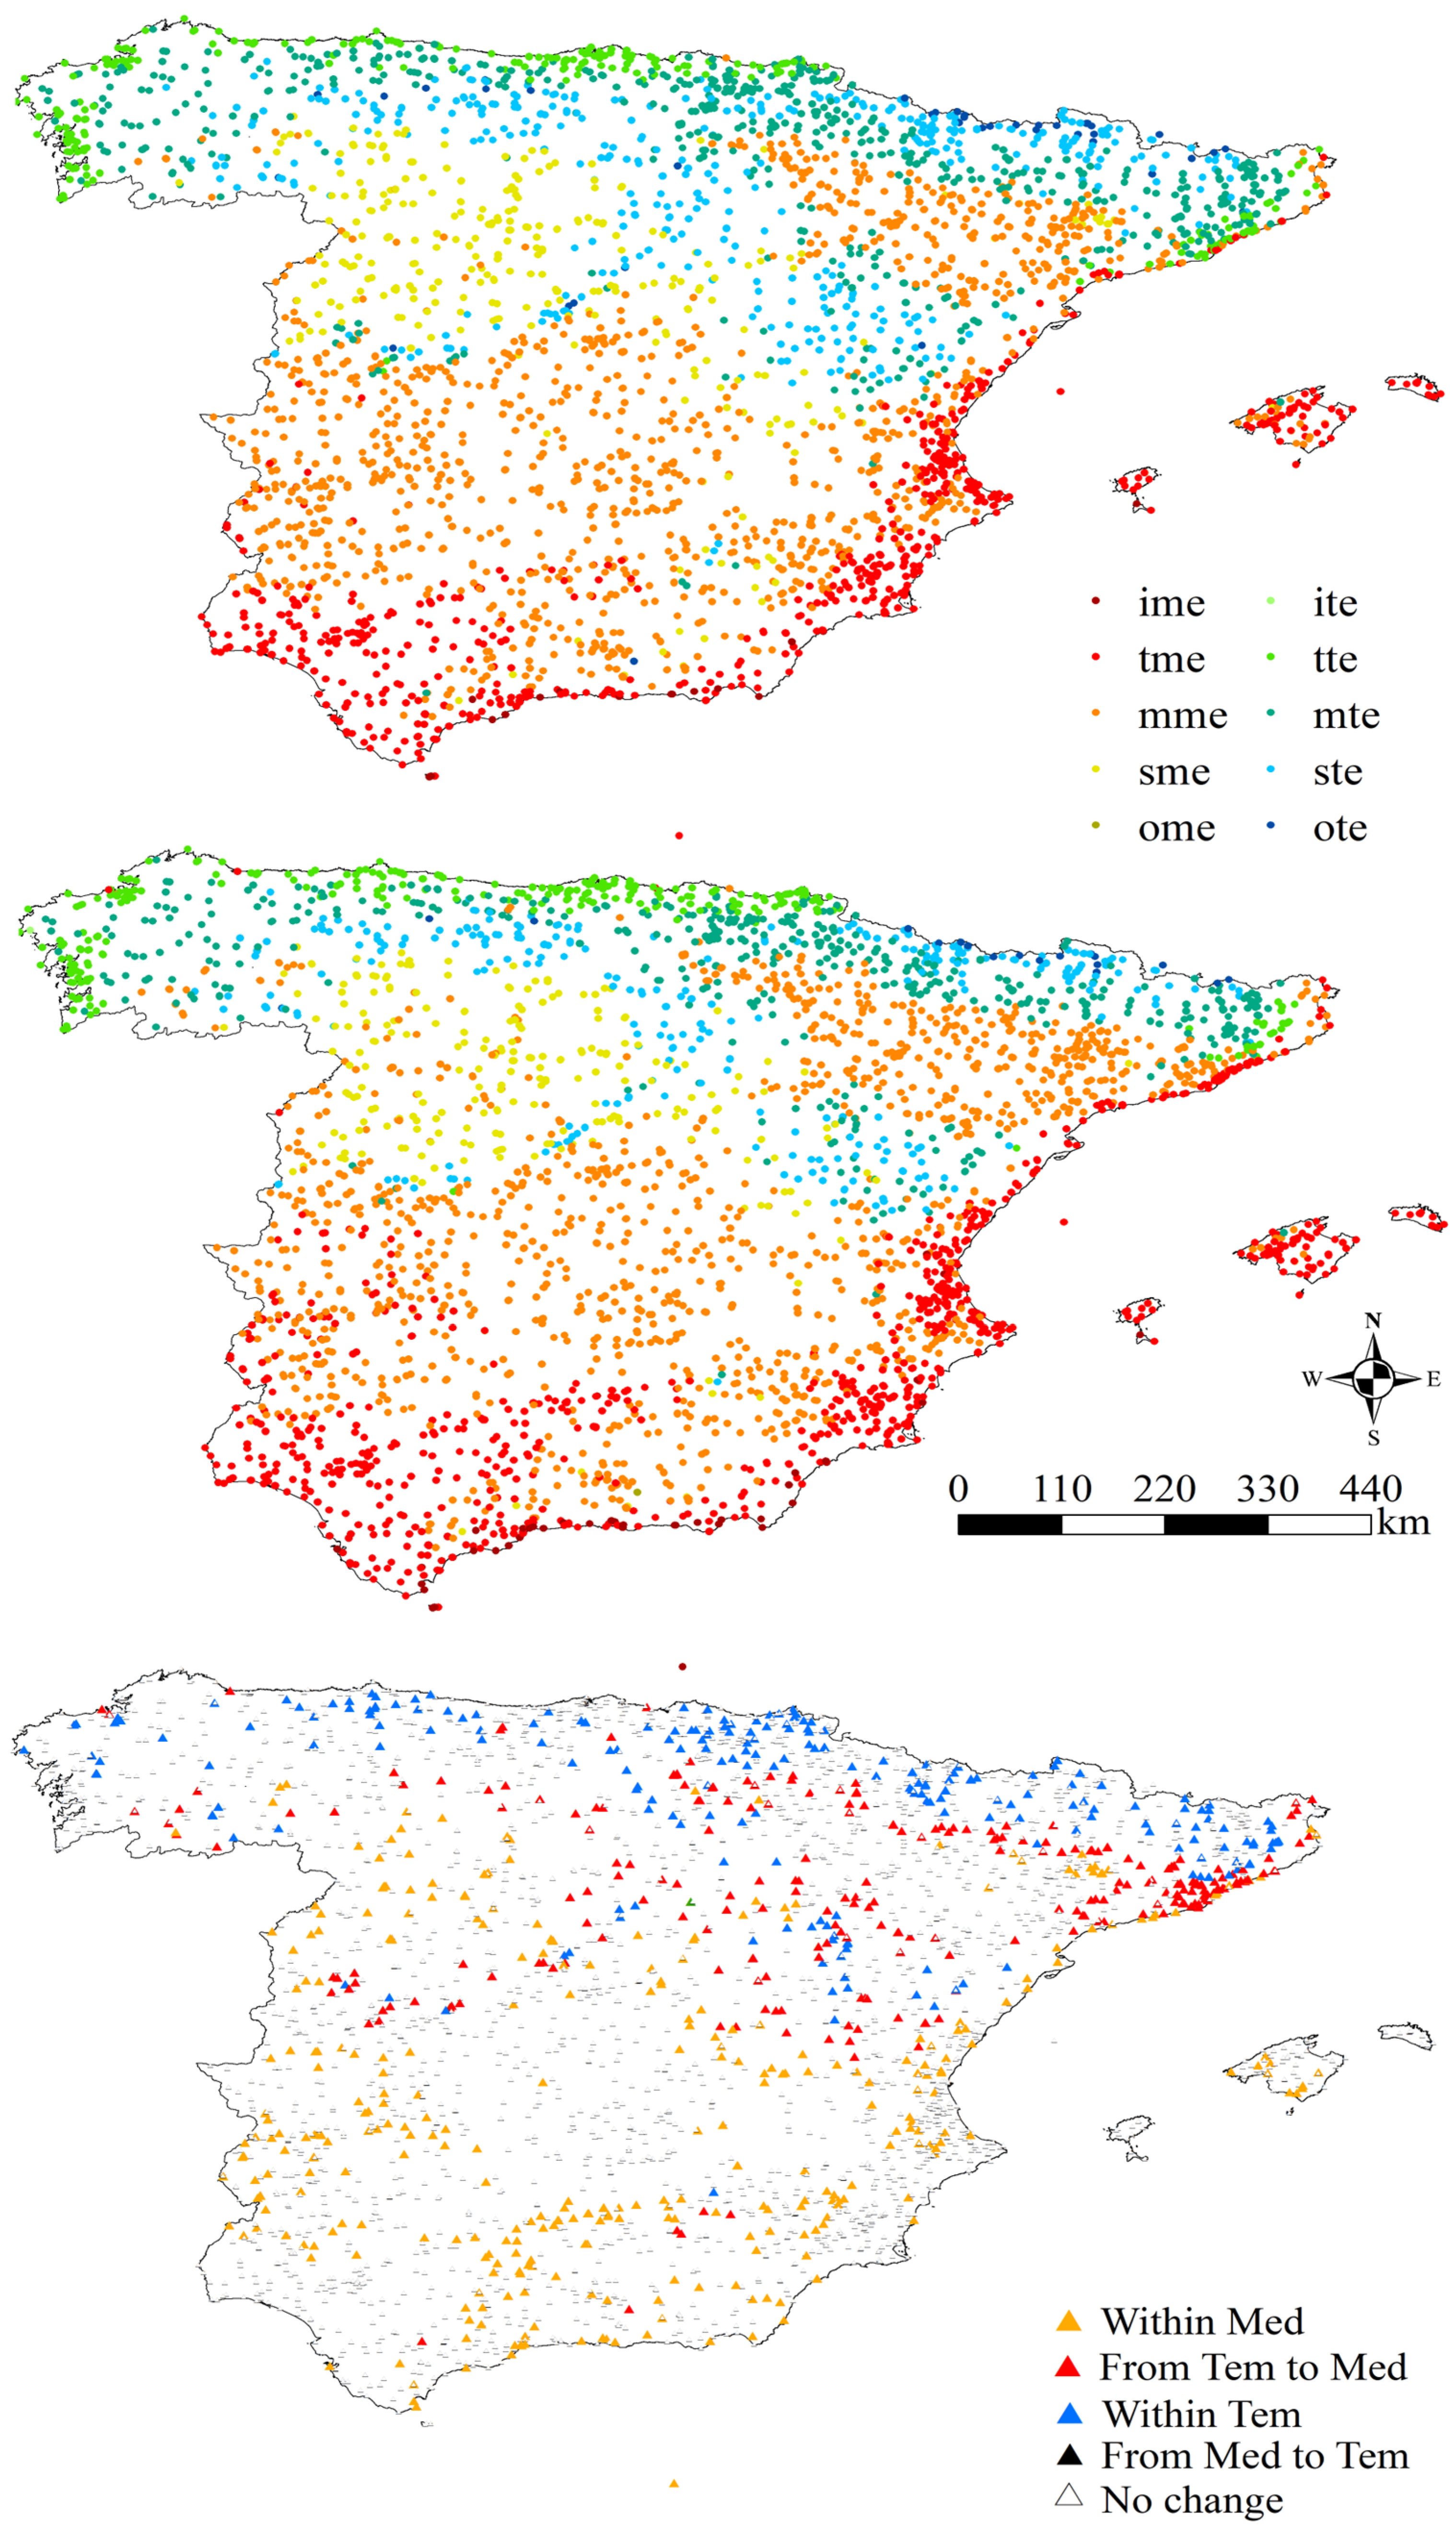
3.1. Thermotypes
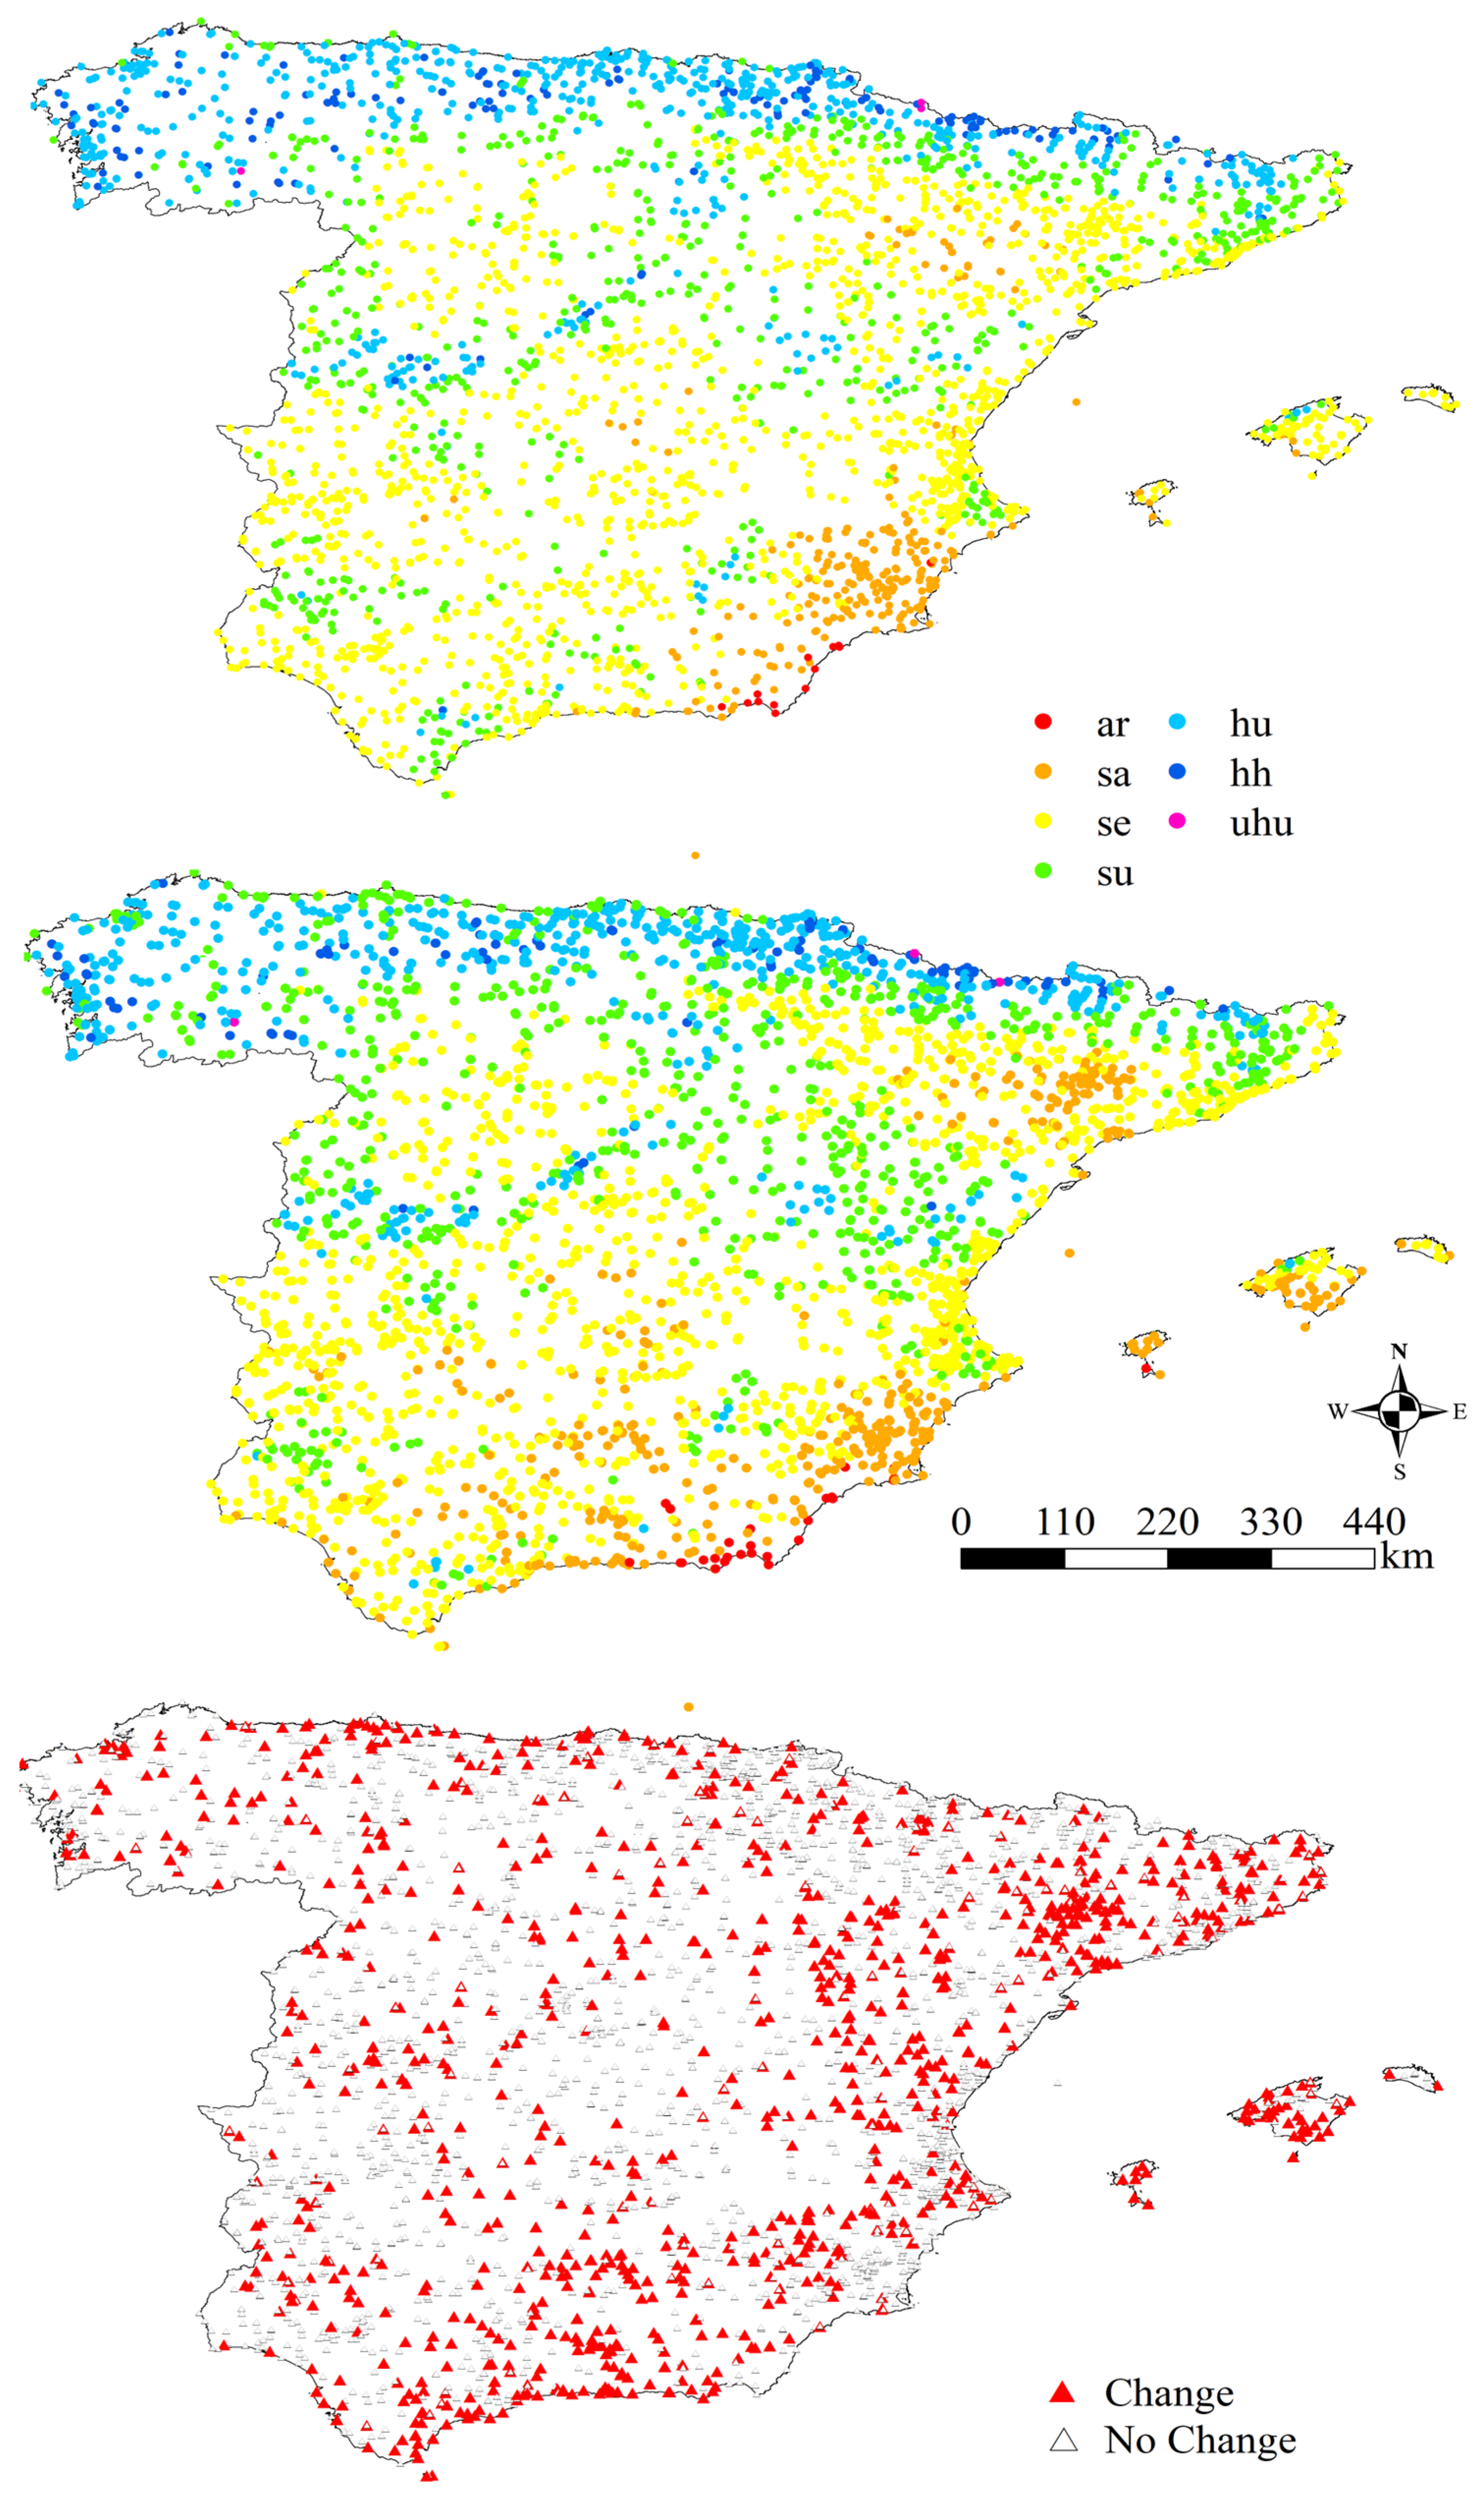
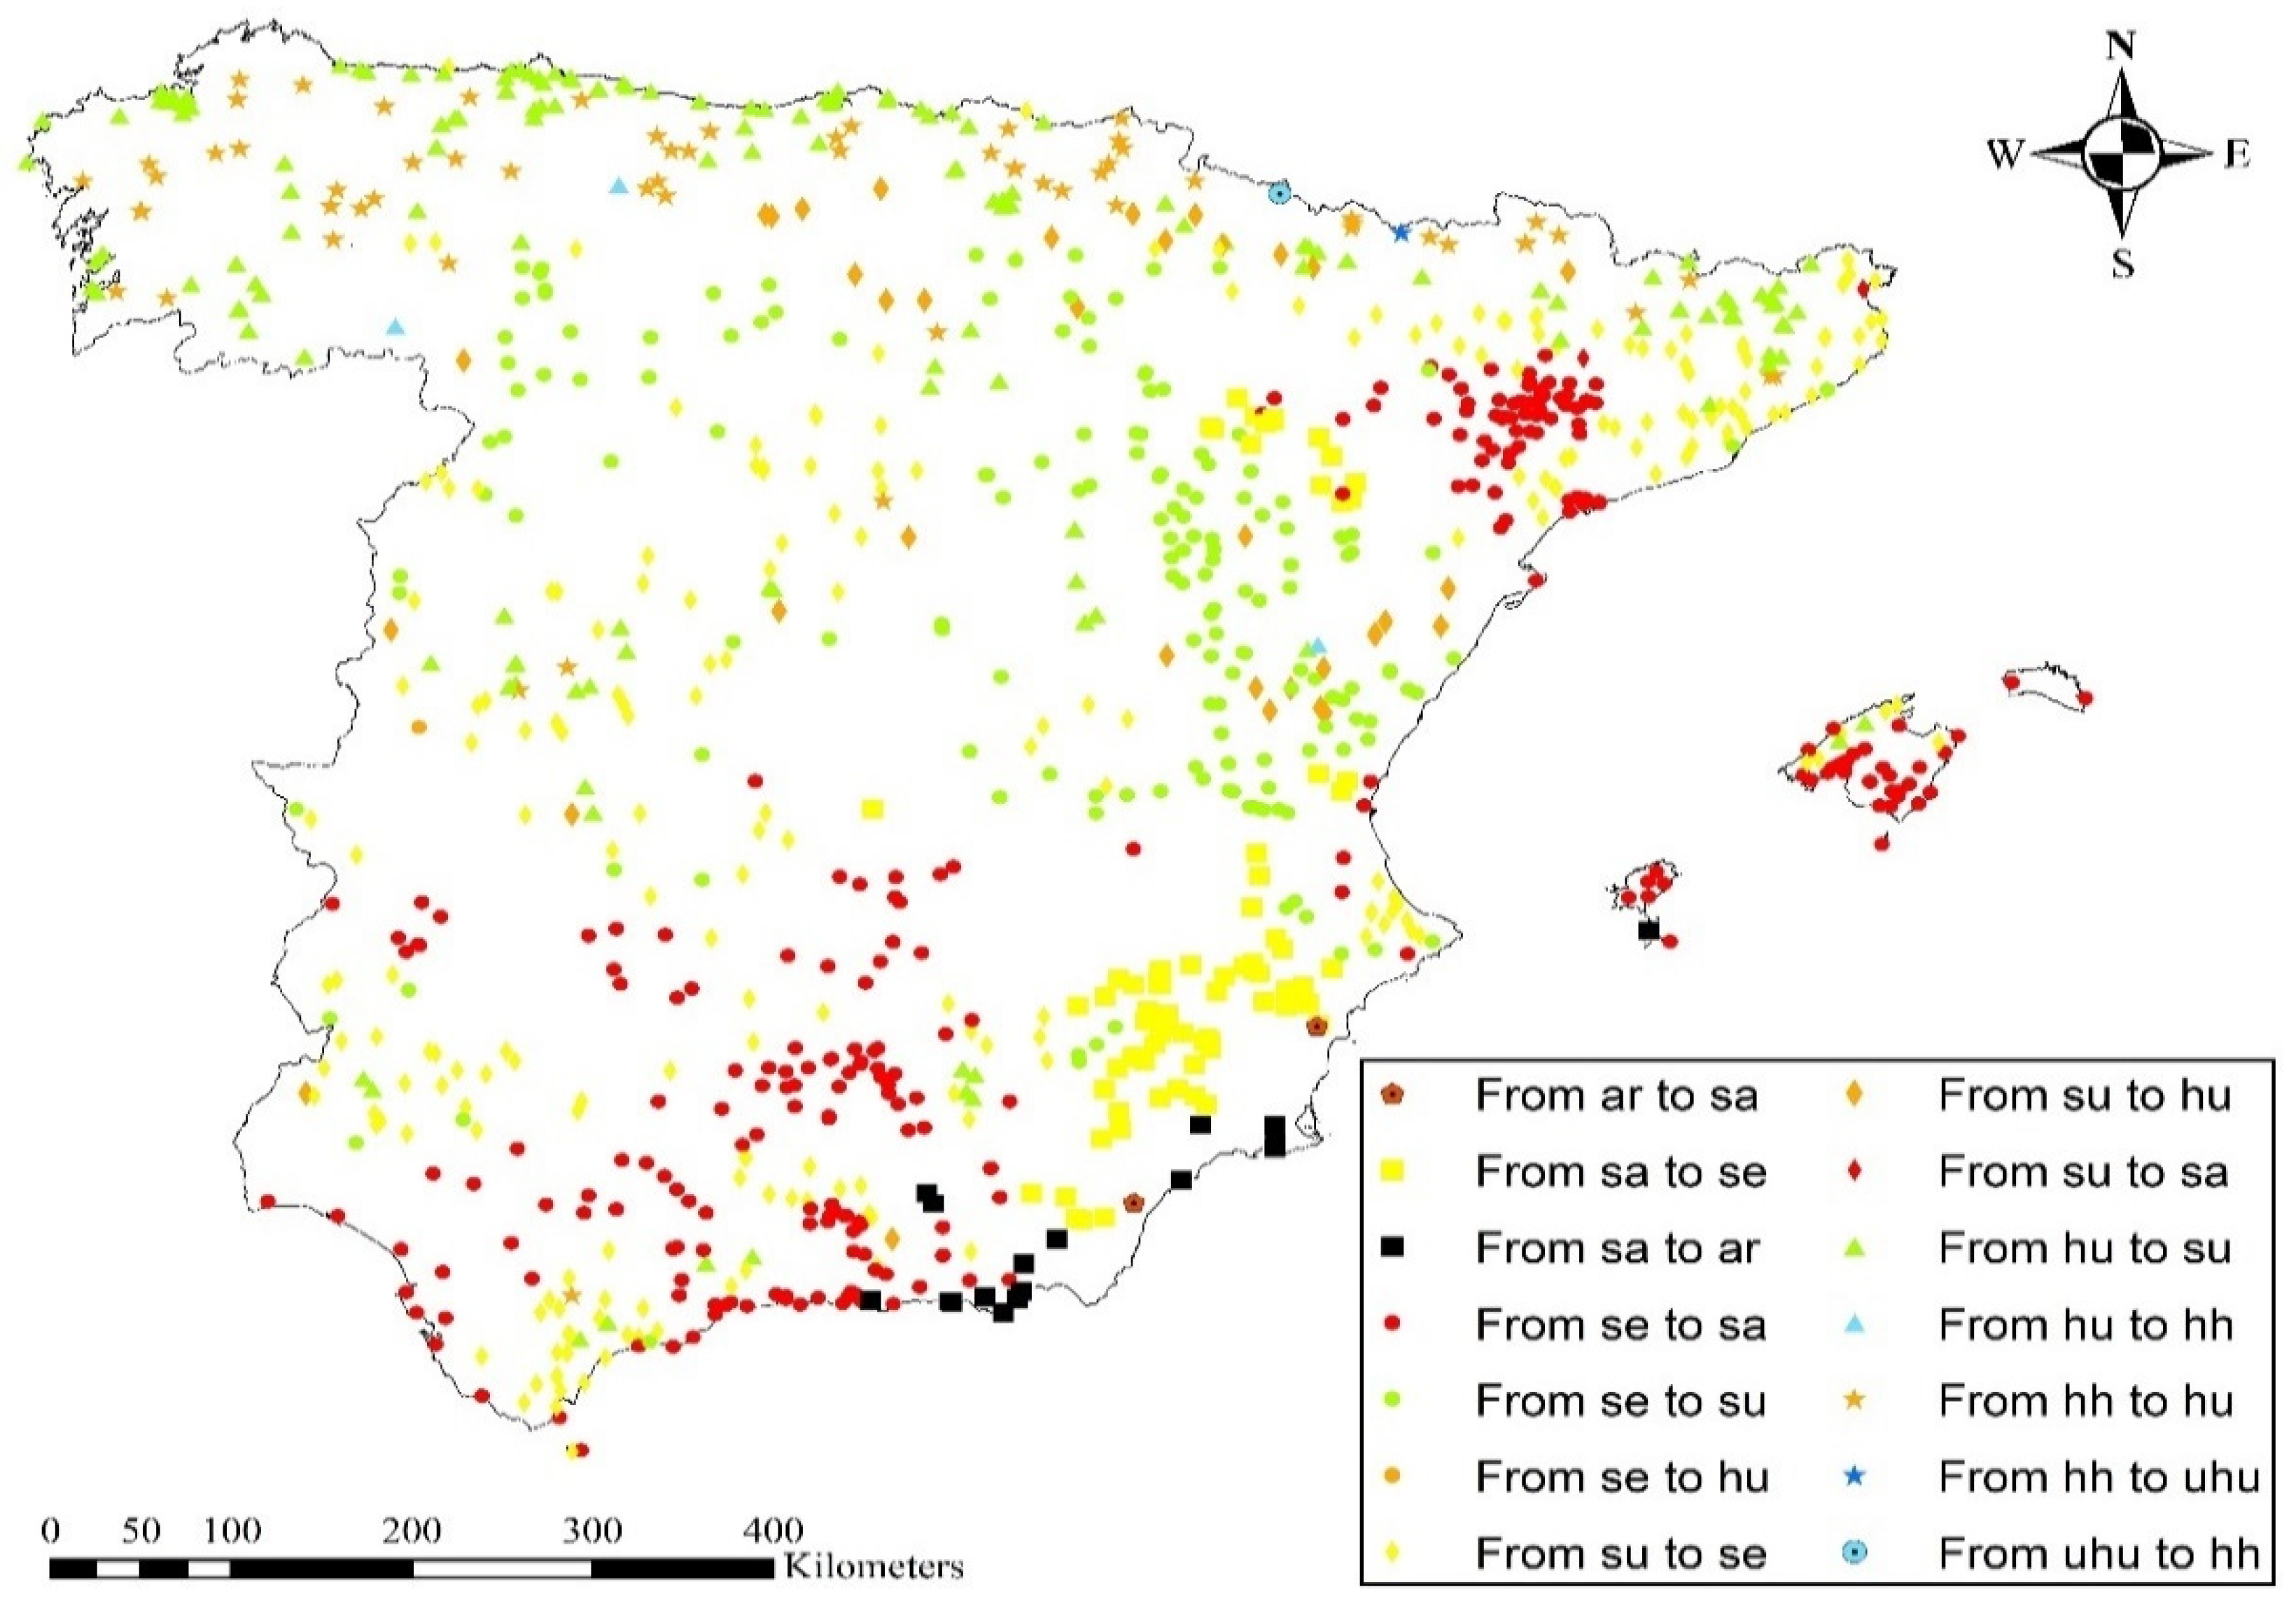
3.2. Ombrotypes
4. Discussion
4.1. Thermotypes
4.2. Ombrotypes
4.3. Ecosystem Protection Management Implications and Study Contributions
4.4. Limits of the Study
4.5. Future Lines of Research
5. Conclusions
Author Contributions
Funding
Data Availability Statement
Conflicts of Interest
References
- Seneviratne, S.I.; Zhang, X.; Adnan, M.; Badi, W.; Dereczynski, C.; Di Luca, A.; Ghosh, S.; Iskandar, I.; Kossin, J.; Lewis, S.; et al. Weather and Climate Extreme Events in a Changing Climate. In Climate Change 2021: The Physical Science Basis. Contribution of Working Group I to the Sixth Assessment Report of the Intergovernmental Panel on Climate Change; Masson-Delmotte, V., Zhai, P., Pirani, A., Connors, S.L., Péan, C., Berger, S., Caud, N., Chen, Y., Goldfarb, L., Gomis, M.I., et al., Eds.; Cambridge University Press: Cambridge, UK; New York, NY, USA, 2021; pp. 1513–1766. [Google Scholar]
- Tol, R. The Economic Impacts of Climate Change. Rev. Environ. Econ. Policy. 2018, 12, 4–25. [Google Scholar] [CrossRef]
- Kummu, M.; Heino, M.; Taka, M.; Varis, O.; Viviroli, D. Climate change risks pushing one-third of global food production outside the safe climatic space. One Earth. 2021, 4, 720–729. [Google Scholar] [CrossRef] [PubMed]
- Turco, M.; Rosa-Cánovas, J.J.; Bedia, J.; Jerez, S.; Montávez, J.P.; Llasat, M.C.; Provenzale, A.; Trigo, R.M. Exacerbated fires in Mediterranean Europe due to anthropogenic warming projected with non-stationary climate-fire models. Nat. Commun. 2018, 9, 3821. [Google Scholar] [CrossRef]
- European Environment Agency (EEA). Responding to Climate Change Impacts on Human Health in Europe: Focus on Floods, Droughts and Water Quality; EEA Report No. 3/2024; Publications Office of the European Union: Luxembourg, 2024. [Google Scholar] [CrossRef]
- Wu, W.; Lo, M.; Wada, Y.; Famiglietti, J.; Reager, J.; Yeh, P.; Ducharne, A.; Yang, Z. Divergent effects of climate change on future groundwater availability in key mid-latitude aquifers. Nat. Commun. 2020, 11, 3710. [Google Scholar] [CrossRef] [PubMed]
- Abbass, K.; Qasim, M.Z.; Song, H.; Murshed, M.; Younis, I.; Mahmood, H. A review of the global climate change impacts, adaptation, and sustainable mitigation measures. Environ. Sci. Pollut. Res. 2022, 29, 42539–42559. [Google Scholar] [CrossRef]
- Pecl, G.T.; Araújo, M.B.; Bell, J.D.; Blanchard, J.; Bonebrake, T.C.; Chen, I.C.; Clark, T.D.; Colwell, R.K.; Danielsen, F.; Evengård, B.; et al. Biodiversity redistribution under climate change: Impacts on ecosystems and human well-being. Science 2017, 355, eaai9214. [Google Scholar] [CrossRef]
- MedECC. Summary for Policymakers. In Climate and Environmental Change in the Mediterranean Basin—Current Situation and Risks for the Future. First Mediterranean Assessment Report; Cramer, W., Guiot, J., Marini, K., Eds.; Union for the Mediterranean, Plan Bleu, UNEP/MAP: Marseille, France, 2020; pp. 11–40. [Google Scholar] [CrossRef]
- Diffenbaugh, N.S.; Giorgi, F. Climate change hotspots in the CMIP5 global climate model ensemble. Clim. Change 2012, 114, 813–822. [Google Scholar] [CrossRef] [PubMed]
- Rivas-Martínez, S.; Penas, Á.; Díaz González, T.E.; Canto, P.; del Río, S.; Costa, J.C.; Herrero, L.; Molero, J. Biogeographic units of the Iberian Peninsula and Balearic Islands to district level. In The Vegetation of the Iberian Peninsula; Loidi, J., Ed.; Springer: Cham, Switzerland, 2017; Volume 2, pp. 131–188. [Google Scholar] [CrossRef]
- Cabos, W.; de la Vara, A.; Álvarez-García, F.J.; Sánchez, E.; Sieck, K.; Pérez-Sanz, J.I.; Limareva, N.; Sein, D.V. Impact of ocean-atmosphere coupling on regional climate: The Iberian Peninsula case. Clim. Dyn. 2020, 54, 4441–4467. [Google Scholar] [CrossRef]
- Llorens, L.; Gil, L. The Balearic Islands. In The Vegetation of the Iberian Peninsula; Loidi, J., Ed.; Springer: Cham, Switzerland, 2017; Volume 2, pp. 3–33. [Google Scholar] [CrossRef]
- Guardiola, M.; Sáez, L. Are Mediterranean island mountains hotspots of taxonomic and phylogenetic biodiversity? The case of the endemic flora of the Balearic Islands. Plants 2023, 12, 2640. [Google Scholar] [CrossRef]
- Rivas-Martínez, S.; Rivas Sáenz, S.; Penas, A. Worldwide bioclimatic classification system. Glob. Geobot. 2011, 1, 1–634. [Google Scholar] [CrossRef]
- Torregrosa, A.; Taylor, M.; Flint, L.; Flint, A. Present, future, and novel bioclimates of the San Francisco, California region. PLoS ONE 2013, 8, e58450. [Google Scholar] [CrossRef] [PubMed]
- Jeschke, J.M.; Strayer, D.L. Usefulness of bioclimatic models for studying climate change and invasive species. Ann. N.Y. Acad. Sci. 2008, 1134, 1–24. [Google Scholar] [CrossRef] [PubMed]
- Rivas-Martínez, S.; Penas, A.; del Río, S.; Díaz González, T.; Rivas-Sáenz, S. Bioclimatology of the Iberian Peninsula and the Balearic Islands. In The Vegetation of the Iberian Peninsula; Loidi, J., Ed.; Springer: Cham, Switzerland, 2017; Volume 2, pp. 29–80. [Google Scholar] [CrossRef]
- Pham, T.M.; Dang, G.T.H.; Dinh, H.T.; Pham, T.A.; Nguyen, H.C.; Nguyen, V.K.; Pham, H.H.; Nguyen, N.T. Application of the Worldwide Bioclimatic Classification System to determine bioclimatic features and potential natural vegetation distribution in Van Chan district, Vietnam. Trop. Ecol. 2023, 64, 765–780. [Google Scholar] [CrossRef]
- Serrano-Notivoli, R.; Beguería, S.; Saz, M.Á.; De Luis, M. Recent trends reveal decreasing intensity of daily precipitation in Spain. Int. J. Climatol. 2018, 38, 4211–4224. [Google Scholar] [CrossRef]
- Sandonis, L.; González-Hidalgo, J.C.; Peña-Angulo, D.; Beguería, S. Mean temperature evolution on the Spanish mainland 1916–2015. Clim. Res. 2021, 82, 177–189. [Google Scholar] [CrossRef]
- Martínez, M.D.; Serra, C.; Burgueño, A.; Lana, X. Time trends of daily maximum and minimum temperatures in Catalonia (NE Spain) for the period 1975–2004. Int. J. Climatol. 2010, 30, 267–290. [Google Scholar] [CrossRef]
- Kenawy, A.; López-Moreno, J.I.; Serrano, S.M. Trend and variability of surface air temperature in northeastern Spain (1920–2006): Linkage to atmospheric circulation. Atmos. Res. 2012, 106, 159–180. [Google Scholar] [CrossRef]
- Miró, J.J.; Estrela, M.J.; Caselles, V.; Olcina-Cantos, J. Fine-scale estimations of bioclimatic change in the Valencia region, Spain. Atmos. Res. 2016, 180, 150–164. [Google Scholar] [CrossRef]
- Estrela, M.J.; Corell, D.; Miró, J.J.; Niclós, R. Analysis of precipitation and drought in the main southeastern Iberian river headwaters (1952–2021). Atmosphere 2024, 15, 166. [Google Scholar] [CrossRef]
- Jump, A.S.; Mátyás, C.; Peñuelas, J. The altitude-for-latitude disparity in the range retractions of woody species. Trends Ecol. Evol. 2009, 24, 694–701. [Google Scholar] [CrossRef]
- Lamprecht, A.; Molero Mesa, J.; Pauli, H.; Steinbauer, K.; Fernández Calzado, M.R.; Winkler, M.; Lorite, J. Changes in plant diversity in a water-limited and isolated high-mountain range (Sierra Nevada, Spain). Alp. Bot. 2021, 131, 27–39. [Google Scholar] [CrossRef]
- Bertrand, R.; Lenoir, J.; Piedallu, C.; Riofrío-Dillon, G.; de Ruffray, P.; Vidal, C.; Pierrat, J.-C.; Gégout, J.-C. Changes in plant community composition lag behind climate warming in lowland forests. Nature 2011, 479, 517–520. [Google Scholar] [CrossRef] [PubMed]
- Escaravage, N.; Cambecèdes, J.; Largier, G.; Pornon, A. Conservation genetics of the rare Pyreneo-Cantabrian endemic Aster pyrenaeus (Asteraceae). AoB Plants 2011, 2011, plr029. [Google Scholar] [CrossRef] [PubMed]
- Mestre Barceló, A.; De Cara García, J.A. Impactos del cambio climático en los ecosistemas forestales ibéricos. In Predicciones de Cambio Climático y Vegetación: 1er Seminario WCRP-Diversitas; Universitat de Valencia: Valencia, Spain, 2009; pp. 139–166. [Google Scholar]
- Machar, I.; Vlckova, V.; Bucek, A.; Vozenilek, V.; Salek, L.; Jerabkova, L. Modelling of Climate Conditions in Forest Vegetation Zones as a Support Tool for Forest Management Strategy in European Beech Dominated Forests. Forests 2017, 8, 82. [Google Scholar] [CrossRef]
- Del Río, S.; Álvarez-Esteban, R.; Cano, E.; Pinto-Gomes, C.; Penas, Á. Potential impacts of climate change on habitat suitability of Fagus sylvatica L. forests in Spain. Plant Biosyst. 2018, 152, 1205–1213. [Google Scholar] [CrossRef]
- Benito, M.; de Dios, R.D.; Ollero, H. Effects of climate change on the distribution of Iberian tree species. Ecol. Soc. Am. 2008, 11, 169–178. [Google Scholar] [CrossRef]
- Mrekaj, I.; Lukasová, V.; Rozkošný, J.; Onderka, M. Significant phenological response of forest tree species to climate change in the Western Carpathians. Cent. Eur. For. J. 2024, 70, 107–121. [Google Scholar] [CrossRef]
- Del Río, S.; González-Pérez, A.; Álvarez-Esteban, R.; Penas, A.; Alonso-Redondo, R.; Álvarez, R.; Rodríguez-Fernández, M.P. Applications of bioclimatology to assess effects of climate change on viticultural suitability in the DO León (Spain). Theor. Appl. Climatol. 2024, 155, 3387–3404. [Google Scholar] [CrossRef]
- López-Fernández, M.L.; Peña-Angulo, D.; Marco, R.; López-Fernández, M.S.; González-Hidalgo, J.C. Variaciones entre Isobioclimas (1951–1980 y 1981–2010) en la España peninsular. In X Congreso Internacional AEC: Clima, sociedad, riesgos y ordenación del territorio; Universidad de Alicante: Alicante, Spain, 2016. [Google Scholar] [CrossRef]
- López, M.L.; Peña-Angulo, D.; Marco, R.; López, M.S.; González-Hidalgo, J.C. Variaciones espaciales y temporales de las condiciones bioclimáticas en la España peninsular (1951–2010). Estud. Geogr. 2017, 78, 553–577. [Google Scholar] [CrossRef]
- Andrade, C.; Contente, J. Climate change projections for the Worldwide Bioclimatic Classification System in the Iberian Peninsula until 2070. Int. J. Climatol. 2020, 40, 5863–5886. [Google Scholar] [CrossRef]
- López-Fernández, M.L.L.; Zhumabayev, D.; Marco Garcia, R.; Baigarin, K.; Lopez Fernandez, M.S.; Baisholanov, S. Assessment of bioclimatic change in Kazakhstan, end 20th—Middle 21st centuries, according to the PRECIS prediction. PLoS ONE 2020, 15, e0239514. [Google Scholar] [CrossRef] [PubMed]
- Zomer, R.; Trabucco, A.; Metzger, M.; Wang, M.; Oli, K.; Xu, J. Projected climate change impacts on spatial distribution of bioclimatic zones and ecoregions within the Kailash Sacred Landscape of China, India, Nepal. Clim. Change 2014, 125, 445–460. [Google Scholar] [CrossRef]
- Gopar-Merino, L.; Velázquez, A.; Azcárate, J.G.D. Bioclimatic mapping as a new method to assess effects of climatic change. Ecosphere 2015, 6, 1–12. [Google Scholar] [CrossRef]
- Shaemi Barzoki, A. Evaluation of Change in Bioclimatic Indices in South of Iran Under Climate Change Conditions. Desert Ecosystem Eng. J. 2018, 7, 23–32. [Google Scholar]
- Miró, J.J.; Caselles, V.; Estrela, M.J. Multiple imputation of rainfall missing data in the Iberian Mediterranean context. Atmos. Res. 2017, 197, 313–330. [Google Scholar] [CrossRef]
- Ilin, A.; Raiko, T. Matlab Package for PCA for Datasets with Missing Values. 2010. Available online: https://users.ics.aalto.fi/alexilin/software/ (accessed on 22 April 2024).
- Scholz, M. Validation of Nonlinear PCA. Neural Process Lett. 2012, 36, 21–30. [Google Scholar] [CrossRef]
- Miró, J.J.; Estrela, M.J.; Caselles, V.; Gómez, I. Spatial and temporal rainfall changes in the Júcar and Segura basins (1955–2016): Finescale trends. Int. J. Climatol. 2018, 3, 4699–4722. [Google Scholar] [CrossRef]
- Miró, J.J.; Lemus Canovas, M.; Serrano Notivoli, R.; Olcina Cantos, J.; Estrela, M.J.; Martin Vide, J.; Sarricolea, P.; Meseguer Ruiz, O. A component based approximation for trend detection of intense rainfall in the Spanish Mediterranean coast. Weather Clim. Extrem. 2022, 38, 100513. [Google Scholar] [CrossRef]
- Miró, J.J.; Estrela, M.J.; Corell, D.; Gómez, I.; Luna, M.Y. Precipitation and drought trends (1952–2021) in a key hydrological recharge area of the eastern Iberian Peninsula. Atmos. Res. 2023, 286, 106695. [Google Scholar] [CrossRef]
- Domonkos, P. The ACMANT2 software package. In Proceedings of the Eighth Seminar for Homogenization and Quality Control in Climatological Databases and Third Conference on Spatial Interpolation Techniques in Climatology and Meteorology, Budapest, Hungary, 12–16 May 2014; World Meteorological Organization (WMO): Geneva, Switzerland, 2014; pp. 46–72. [Google Scholar]
- Domonkos, P. Homogenization of precipitation time series with ACMANT. Theor. Appl. Climatol. 2015, 122, 303–314. [Google Scholar] [CrossRef]
- González-Pérez, A.; Álvarez-Esteban, R.; Penas, Á.; del Río, S. Bioclimatic characterisation of specific native Californian Pinales and their future suitability under climate change. Plants 2023, 12, 1966. [Google Scholar] [CrossRef] [PubMed]
- Lorente, C.; Corell, D.; Estrela, M.J.; Miró, J.J.; Orgambides-García, D. Impact of climate change on the bioclimatological conditions evolution of peninsular and Balearic Spain during the 1953–2022 period. Climate 2024, 12, 183. [Google Scholar] [CrossRef]
- Agencia Estatal de Meteorología (AEMET). Informe Sobre el Estado del Clima de España 2020; Ministerio para la Transición Ecológica y el Reto Demográfico: Madrid, Spain, 2020; Available online: https://adaptecca.es/sites/default/files/documentos/informe_clima_2020_aemet-comprimido.pdf (accessed on 10 September 2024).
- Thomas, C.D.; Cameron, A.; Green, R.E.; Bakkenes, M.; Beaumont, L.J.; Collingham, Y.C.; Erasmus, B.F.N.; de Siqueira, M.F.; Grainger, A.; Hannah, L.; et al. Extinction risk from climate change. Nature 2004, 427, 145–148. [Google Scholar] [CrossRef] [PubMed]
- Nogués-Bravo, D.; Araújo, M.B.; Errea, M.P.; Martínez-Rica, J.P. Exposure of global mountain systems to climate warming during the 21st century. Glob. Environ. Change 2007, 17, 420–428. [Google Scholar] [CrossRef]
- Pauli, H.; Gottfried, M.; Dullinger, S.; Abdaladze, O.; Akhalkatsi, M.; Alonso, J.L.B.; Grabherr, G.; Dick, J.; Erschbamer, B.; Calzado, R.F.; et al. Recent Plant Diversity Changes on Europe’s Mountain Summits. Science 2012, 336, 353–355. [Google Scholar] [CrossRef]
- Walther, G.-R.; Roques, A.; Hulme, P.E.; Sykes, M.T.; Pyšek, P.; Kühn, I.; Zobel, M.; Bacher, S.; Botta-Dukát, Z.; Bugmann, H.; et al. Alien species in a warmer world: Risks and opportunities. Trends Ecol. Evol. 2009, 24, 686–693. [Google Scholar] [CrossRef] [PubMed]
- Thuiller, W.; Lavorel, S.; Araújo, M.B.; Sykes, M.T.; Prentice, I.C. Climate change threats to plant diversity in Europe. Proc. Natl. Acad. Sci. USA 2005, 102, 8245–8250. [Google Scholar] [CrossRef]
- Walther, G.-R.; Post, E.; Convey, P.; Menzel, A.; Parmesan, C.; Beebee, T.J.C.; Fromentin, J.-M.; Hoegh-Guldberg, O.; Bairlein, F. Ecological responses to recent climate change. Nature 2002, 416, 389–395. [Google Scholar] [CrossRef] [PubMed]
- Lionello, P.; Malanotte-Rizzoli, P.; Boscolo, R. (Eds.) Mediterranean Climate Variability; Elsevier: Amsterdam, The Netherlands, 2006. [Google Scholar]
- Corlett, R.T.; Westcott, D.A. Will plant movements keep up with climate change? Trends Ecol. Evol. 2013, 28, 482–488. [Google Scholar] [CrossRef]
- Memmott, J.; Craze, P.G.; Waser, N.M.; Price, M.V. Global warming and the disruption of plant-pollinator interactions. Ecol. Lett. 2007, 10, 710–717. [Google Scholar] [CrossRef]
- Llinares, J.V.; Llorens-Molina, J.A.; Mulet, J.; Vacas, S. Soil parameters and bioclimatic characteristics affecting essential oil composition of leaves of Pistacia lentiscus L. from València (Spain). Span. J. Soil Sci. 2021, 11, 72–85. [Google Scholar] [CrossRef]
- Schlutow, A.; Schröder, W. Rule-based classification and mapping of ecosystem services with data on the integrity of forest ecosystems. Environ. Sci. Eur. 2021, 33, 1–34. [Google Scholar] [CrossRef]
- Ashcroft, M.B. Identifying refugia from climate change. J. Biogeogr. 2010, 37, 1407–1413. [Google Scholar] [CrossRef]
- Chen, I.C.; Hill, J.K.; Ohlemüller, R.; Roy, D.B.; Thomas, C.D. Rapid range shifts of species associated with high levels of climate warming. Science 2011, 333, 1024–1026. [Google Scholar] [CrossRef] [PubMed]
- Hobbs, R.J.; Higgs, E.; Harris, J.A. Novel ecosystems: Implications for conservation and restoration. Trends Ecol. Evol. 2009, 24, 599–605. [Google Scholar] [CrossRef]
- Williams, J.W.; Jackson, S.T. Novel climates, no-analog communities, and ecological surprises. Front. Ecol. Environ. 2007, 5, 475–482. [Google Scholar] [CrossRef]
- Morse, N.B.; Pellissier, P.A.; Cianciola, E.N.; Brereton, R.L.; Sullivan, M.M.; Shonka, N.K.; Wheeler, T.B.; McDowell, W.H. Novel ecosystems in the Anthropocene: A revision of the novel ecosystem concept for pragmatic applications. Ecol. Soc. 2014, 19, 12. [Google Scholar] [CrossRef]
- Garcia, R.A.; Cabeza, M.; Rahbek, C.; Araújo, M.B. Multiple dimensions of climate change and their implications for biodiversity. Science 2014, 344, 1247579. [Google Scholar] [CrossRef] [PubMed]
- Pacifici, M.; Foden, W.B.; Visconti, P.; Watson, J.E.M.; Butchart, S.H.M.; Kovacs, K.M.; Scheffers, B.R.; Hole, D.G.; Martin, T.G.; Akçakaya, H.R.; et al. Assessing species vulnerability to climate change. Nat. Clim. Change 2015, 5, 215–224. [Google Scholar] [CrossRef]
- Early, R.; Bradley, B.A.; Dukes, J.S.; Lawler, J.J.; Olden, J.D.; Blumenthal, D.M.; Gonzalez, P.; Grosholz, E.D.; Ibañez, I.; Miller, L.P.; et al. Global threats from invasive alien species in the twenty-first century and national response capacities. Nat. Commun. 2016, 7, 12485. [Google Scholar] [CrossRef]
- Stein, B.A.; Staudt, A.; Cross, M.S.; Dubois, N.S.; Enquist, C.; Griffis, R.; Hansen, L.J.; Hellmann, J.J.; Lawler, J.J.; Nelson, E.J.; et al. Preparing for and managing change: Climate adaptation for biodiversity and ecosystems. Front. Ecol. Environ. 2013, 11, 502–510. [Google Scholar] [CrossRef]
- Morecroft, M.D.; Duffield, S.; Harley, M.; Pearce-Higgins, J.W.; Stevens, N.; Watts, O.; Whitaker, J. Measuring the success of climate change adaptation and mitigation in terrestrial ecosystems. Science 2019, 366, eaaw9256. [Google Scholar] [CrossRef] [PubMed]
- Reyer, C.P.O.; Brouwers, N.; Rammig, A.; Brook, B.W.; Epila, J.; Grant, R.F.; Holmgren, M.; Langerwisch, F.; Leuzinger, S.; Lucht, W.; et al. Forest resilience and tipping points at different spatio-temporal scales: Approaches and challenges. J. Ecol. 2015, 103, 5–15. [Google Scholar] [CrossRef]
- Trumbore, S.; Brando, P.; Hartmann, H. Forest health and global change. Science 2015, 349, 814–818. [Google Scholar] [CrossRef]
- Nakashizuka, T.; Shimazaki, M.; Sasaki, T.; Tanaka, T.; Kurokawa, H.; Hikosaka, K. Influences of Climate Change on the Distribution and Population Dynamics of Subalpine Coniferous Forest in the Hakkoda Mountains, Northern Japan. In Structure and Function of Mountain Ecosystems in Japan; Kudo, G., Ed.; Ecological Research Monographs; Springer: Tokyo, Japan, 2016. [Google Scholar]
- Michalet, R.; Schöb, C.; Lortie, C.J.; Brooker, R.W.; Callaway, R.M. Partitioning net interactions among plants along altitudinal gradients to study community responses to climate change. Funct. Ecol. 2013, 27, 1377–1384. [Google Scholar] [CrossRef]
- Martin, G.; Devictor, V.; Motard, E.; Machon, N.; Porcher, E. Short-term climate-induced change in French plant communities. Biol. Lett. 2019, 15, 20190280. [Google Scholar] [CrossRef]
- Liu, D.T.; Chen, J.Y.; Sun, W.B. Distributional responses to climate change of two maple species in southern China. Ecol. Evol. 2023, 13, e10490. [Google Scholar] [CrossRef]
- Lenoir, J.; Gégout, J.C.; Marquet, P.A.; de Ruffray, P.; Brisse, H. A significant upward shift in plant species optimum elevation during the 20th century. Science 2008, 320, 1768–1771. [Google Scholar] [CrossRef]
- Cunze, S.; Heydel, F.; Tackenberg, O. Are plant species able to keep pace with the rapidly changing climate? PLoS ONE 2013, 8, e67909. [Google Scholar] [CrossRef]
- Colangelo, M.; Camarero, J.J.; Gazol, A.; Piovesan, G.; Borghetti, M.; Baliva, M.; Tognetti, R.; Ripullone, F. Mediterranean old-growth forests exhibit resistance to climate warming. Sci. Total Environ. 2021, 801, 149684. [Google Scholar] [CrossRef]
- Neilson, R.P.; Pitelka, L.F.; Solomon, A.M.; Nathan, R.; Midgley, G.F.; Fragoso, J.M.V.; Lischke, H.; Thompson, K. Forecasting regional to global plant migration in response to climate change. BioScience 2005, 55, 749–760. [Google Scholar] [CrossRef]
- Dullinger, S.; Gattringer, A.; Thuiller, W.; Moser, D.; Zimmermann, N.E.; Guisan, A.; Willner, W.; Plutzar, C.; Leitner, M.; Mang, T.; et al. Extinction debt of high-mountain plants under twenty-first-century climate change. Nat. Clim. Change 2012, 2, 619–622. [Google Scholar] [CrossRef]
- Médail, F.; Quézel, P. Biodiversity hotspots in the Mediterranean Basin: Setting global conservation priorities. Conserv. Biol. 1999, 13, 1510–1513. [Google Scholar] [CrossRef]
- Cramer, W.; Guiot, J.; Fader, M.; Garrabou, J.; Gattuso, J.-P.; Iglesias, A.; Lange, M.A.; Lionello, P.; Llasat, M.C.; Paz, S.; et al. Climate change and interconnected risks to sustainable development in the Mediterranean. Nat. Clim. Change 2018, 8, 972–980. [Google Scholar] [CrossRef]
- Carvalho, D.; Pereira, S.C.; Silva, R.; Rocha, A. Aridity and desertification in the Mediterranean under EURO-CORDEX future climate change scenarios. Clim. Change 2022, 174, 28. [Google Scholar] [CrossRef]
- Giménez-Alfaro, B.; Granda, E.; Camarero, J.J.; Esteve-Selma, M.A. Climate change accelerates vegetation dynamics in Mediterranean ecosystems: A case study of Chamaerops humilis L. in southeastern Spain. Glob. Change Biol. 2016, 22, 3642–3656. [Google Scholar] [CrossRef]
- Ponti, L.; Gutierrez, A.P.; Basso, B.; Neteler, M.; Ruti, P.M. Phenological changes and climate warming in grapevine in Europe. Glob. Change Biol. 2014, 20, 3009–3022. [Google Scholar] [CrossRef]
- Ruffault, J.; Curt, T.; Moron, V.; Trigo, R.M.; Mouillot, F.; Koutsias, N. Increased likelihood of heat-induced large wildfires in the Mediterranean Basin. Sci. Rep. 2020, 10, 13790. [Google Scholar] [CrossRef]
- Olcina Cantos, J. Turismo y cambio climático: Una actividad vulnerable que debe adaptarse. Investig. Turísticas 2012, 4, 1–34. [Google Scholar] [CrossRef]
- Páscoa, P.; Russo, A.; Gouveia, C.; Soares, P.; Cardoso, R.; Careto, J.; Ribeiro, A. A high-resolution view of the recent drought trends over the Iberian Peninsula. Weather Clim. Extrem. 2021, 32, 100320. [Google Scholar] [CrossRef]
- Claro, A.M.; Fonseca, A.; Fraga, H.; Santos, J.A. Susceptibility of Iberia to extreme precipitation and aridity: A new high-resolution analysis over an extended historical period. Water 2023, 15, 3840. [Google Scholar] [CrossRef]
- Beguería, S.; Peña-Angulo, D.; Trullenque-Blanco, V.; González-Hidalgo, C. MOPREDAScentury: A long-term monthly precipitation grid for the Spanish mainland. Earth Syst. Sci. Data 2023, 15, 2547–2575. [Google Scholar] [CrossRef]
- Guiot, J.; Cramer, W. Climate change: The 2015 Paris Agreement thresholds and Mediterranean basin ecosystems. Science 2016, 354, 465–468. [Google Scholar] [CrossRef]
- Drobinski, P.; Silva, N.; Bastin, S.; Mailler, S.; Muller, C.; Ahrens, B.; Christensen, O.; Lionello, P. How warmer and drier will the Mediterranean region be at the end of the twenty-first century? Reg. Environ. Change 2020, 20, 78. [Google Scholar] [CrossRef]
- Ajjur, S.; Al-Ghamdi, S. Evapotranspiration and water availability response to climate change in the Middle East and North Africa. Clim. Change 2021, 166, 28. [Google Scholar] [CrossRef]
- Engler, R.; Randin, C.; Thuiller, W.; Dullinger, S.; Zimmermann, N.; Araújo, M.; Pearman, P.; Lay, G.; Piedallu, C.; Albert, C.; et al. 21st century climate change threatens mountain flora unequally across Europe. Glob. Change Biol. 2011, 17, 2330–2341. [Google Scholar] [CrossRef]
- Andrade, C.; Corte-Real, J. Preliminary assessment of aridity conditions in the Iberian Peninsula. AIP Conf. Proc. 2016, 1738, 060003. [Google Scholar] [CrossRef]
- Páscoa, P.; Gouveia, C.; Russo, A.; Trigo, R. Drought Trends in the Iberian Peninsula over the Last 112 Years. Adv. Meteorol. 2017, 2017, 1–13. [Google Scholar] [CrossRef]
- Andrade, C.; Contente, J.; Santos, J.A. Climate change projections of aridity conditions in the Iberian Peninsula. Water 2021, 13, 2035. [Google Scholar] [CrossRef]
- Vicente-Serrano, S.M.; Lopez-Moreno, J.I.; Beguería, S.; Lorenzo-Lacruz, J.; Sanchez-Lorenzo, A.; García-Ruiz, J.M.; Azorin-Molina, C.; Morán-Tejeda, E.; Revuelto, J.; Trigo, R.; et al. Evidence of increasing drought severity caused by temperature rise in southern Europe. Environ. Res. Lett. 2014, 9, 044001. [Google Scholar] [CrossRef]
- Lastrada, E.; Garzón-Roca, J.; Cobos, G.; Torrijo, F.J. A Decrease in the Regulatory Effect of Snow-Related Phenomena in Spanish Mountain Areas Due to Climate Change. Water 2021, 13, 1550. [Google Scholar] [CrossRef]
- Bonsoms, J.; López-Moreno, J.I.; Alonso-González, E. Snow sensitivity to temperature and precipitation change during compound cold–hot and wet–dry seasons in the Pyrenees. Cryosphere 2023, 17, 1307–1326. [Google Scholar] [CrossRef]
- Sigro, J.; Cisneros, M.; Perez-Luque, A.J.; Perez-Martinez, C.; Vegas-Vilarrubia, T. Trends in temperature and precipitation at high and low elevations in the main mountain ranges of the Iberian Peninsula (1894–2020): The Sierra Nevada and the Pyrenees. Int. J. Climatol. 2024, 44, 2897–2920. [Google Scholar] [CrossRef]
- López-Moreno, J.I.; Vicente-Serrano, S.M.; Morán-Tejeda, E.; Lorenzo-Lacruz, J.; Kenawy, A.; Beniston, M. Effects of the North Atlantic Oscillation (NAO) on combined temperature and precipitation winter modes in the Mediterranean mountains: Observed relationships and projections for the 21st century. Glob. Planet. Change 2011, 77, 62–76. [Google Scholar] [CrossRef]
- Martínez-González, L.; Herrera, S.; Llasat, M.C.; Fernández, J. Projected changes in precipitation indicators for the Pyrenees using bias-adjusted regional climate model data. Int. J. Climatol. 2023, 43, 2835–2853. [Google Scholar] [CrossRef]
- De Luis, M.; Longares, L.A.; Stepanek, P.; González-Hidalgo, J.C. Tendencias estacionales de la precipitación en la cuenca del Ebro 1951–2000. Geographicalia 2007, 52, 53–78. [Google Scholar] [CrossRef]
- Skvareninova, J.; Sitko, R.; Vido, J.; Snopková, Z.; Skvarenina, J. Phenological response of European beech (Fagus sylvatica L.) to climate change in the Western Carpathian climatic-geographical zones. Front. Plant Sci. 2024, 15, 1242695. [Google Scholar] [CrossRef]
- Panu, U.S.; Sharma, T.C. Challenges in drought research: Some perspectives and future directions. Hydrol. Sci. J. 2002, 47, S19–S30. [Google Scholar] [CrossRef]
- Lloret, F.; Peñuelas, J.; Prieto, P.; Llorens, L.; Estiarte, M. Plant community changes induced by experimental climate change: Seedling and adult species composition. Perspect. Plant Ecol. Evol. Syst. 2009, 11, 53–63. [Google Scholar] [CrossRef]
- Amer, W.; Elshayeb, N.; Hegazy, A.; Abbas, M.; Soliman, A.; Wahab, M. Species diversity and climate: An intimate relationship over the last decades in the Mediterranean region—The case study of Sallum Sector, Egypt. Flora Mediterr. 2020, 30, 65–79. [Google Scholar] [CrossRef]
- Gordo, O.; Sanz, J.J. Impact of climate change on plant phenology in Mediterranean ecosystems. Glob. Change Biol. 2010, 16, 1082–1106. [Google Scholar] [CrossRef]


| Thermotype | Itc * | Tp ** |
|---|---|---|
| Inframediterrenean (ime) | 450–580 | >2400 |
| Thermomediterrenean (tme) | 350–450 | 2100–2400 |
| Mesomediterrenean (mme) | 220–350 | 1500–2100 |
| Supramediterrenean (sme) | <220 | 900–1500 |
| Oromediterrenean (ome) | - | 450–900 |
| Crioromediterreneano (cme) | - | 1–450 |
| Gelid | - | 0 |
| Thermotype | Itc | Tp |
|---|---|---|
| Infratemperate (ite) | >410 | >2350 |
| Thermotemperate (tte) | 290–410 | 2000–2350 |
| Mesotemperate (mte) | 190–290 | 1400–2000 |
| Supratemperate (ste) | <190 | 800–1400 |
| Orotemperate (ote) | - | 380–800 |
| Criorotemperate (cte) | - | 1–380 |
| Gelid | - | 0 |
| Ombrotypes | Io * |
|---|---|
| Ultrahyperarid (uha) | 0.0–0.2 |
| Hyperarid (ha) | 0.2–0.4 |
| Arid (ar) | 0.4–1.0 |
| Semiarid (sa) | 1.0–2.0 |
| Dry (se) | 2.0–3.6 |
| Subhumid (su) | 3.6–6.0 |
| Humid (hu) | 6.0–12.0 |
| Hyperhumid (hh) | 12.0–24.0 |
| Ultrahyperhumid (uhu) | >24.0 |
| Initial Thermotype | Stations (1953–1987) | Stations (1988–2022) | Percentage of Change Between Both Periods | Transition | Number of Stations in Which This Transition Has Taken Place | Percentage with Respect to the Total Number of Stations in the Study Area |
|---|---|---|---|---|---|---|
| ime | 18 | 46 | 155.56% | - | - | - |
| tme | 653 | 847 | 29.71% | From tme to ime From tme to mme | 28 5 | 0.76 0.14 |
| mme | 1315 | 1407 | 7.00% | From mme to tme | 199 | 5.43 |
| sme | 304 | 243 | −20.07% | From sme to mme From sme to mte | 118 1 | 3.22 0.03 |
| ome | 0 | 1 | - | - | - | - |
| ite | 0 | 1 | - | - | - | - |
| tte | 256 | 292 | 14.06% | From tte to tme From tte to mme From tte to ite | 28 24 1 | 0.76 0.65 0.03 |
| mte | 617 | 498 | −19.29% | From mte to mme From mte to sme From mte to tte From mte to ste | 142 9 89 1 | 3.87 0.25 2.43 0.03 |
| ste | 463 | 314 | −32.18% | From ste to mte From ste to sme From ste to mme | 121 49 2 | 3.30 1.34 0.05 |
| ote | 42 | 19 | −54.76% | From ote to ste From ote to ome | 22 1 | 0.60 0.03 |
| Total | 3668 | 3668 | - | 17 | 840 | 22.90% |
| Initial Ombrotype | Stations (1953–1987) | Stations (1988–2022) | Percentage of Change Between Both Periods | Transition | Number of Stations in Which This Transition Has Taken Place | Percentage with Respect to the Total Number of Stations in the Study Area |
|---|---|---|---|---|---|---|
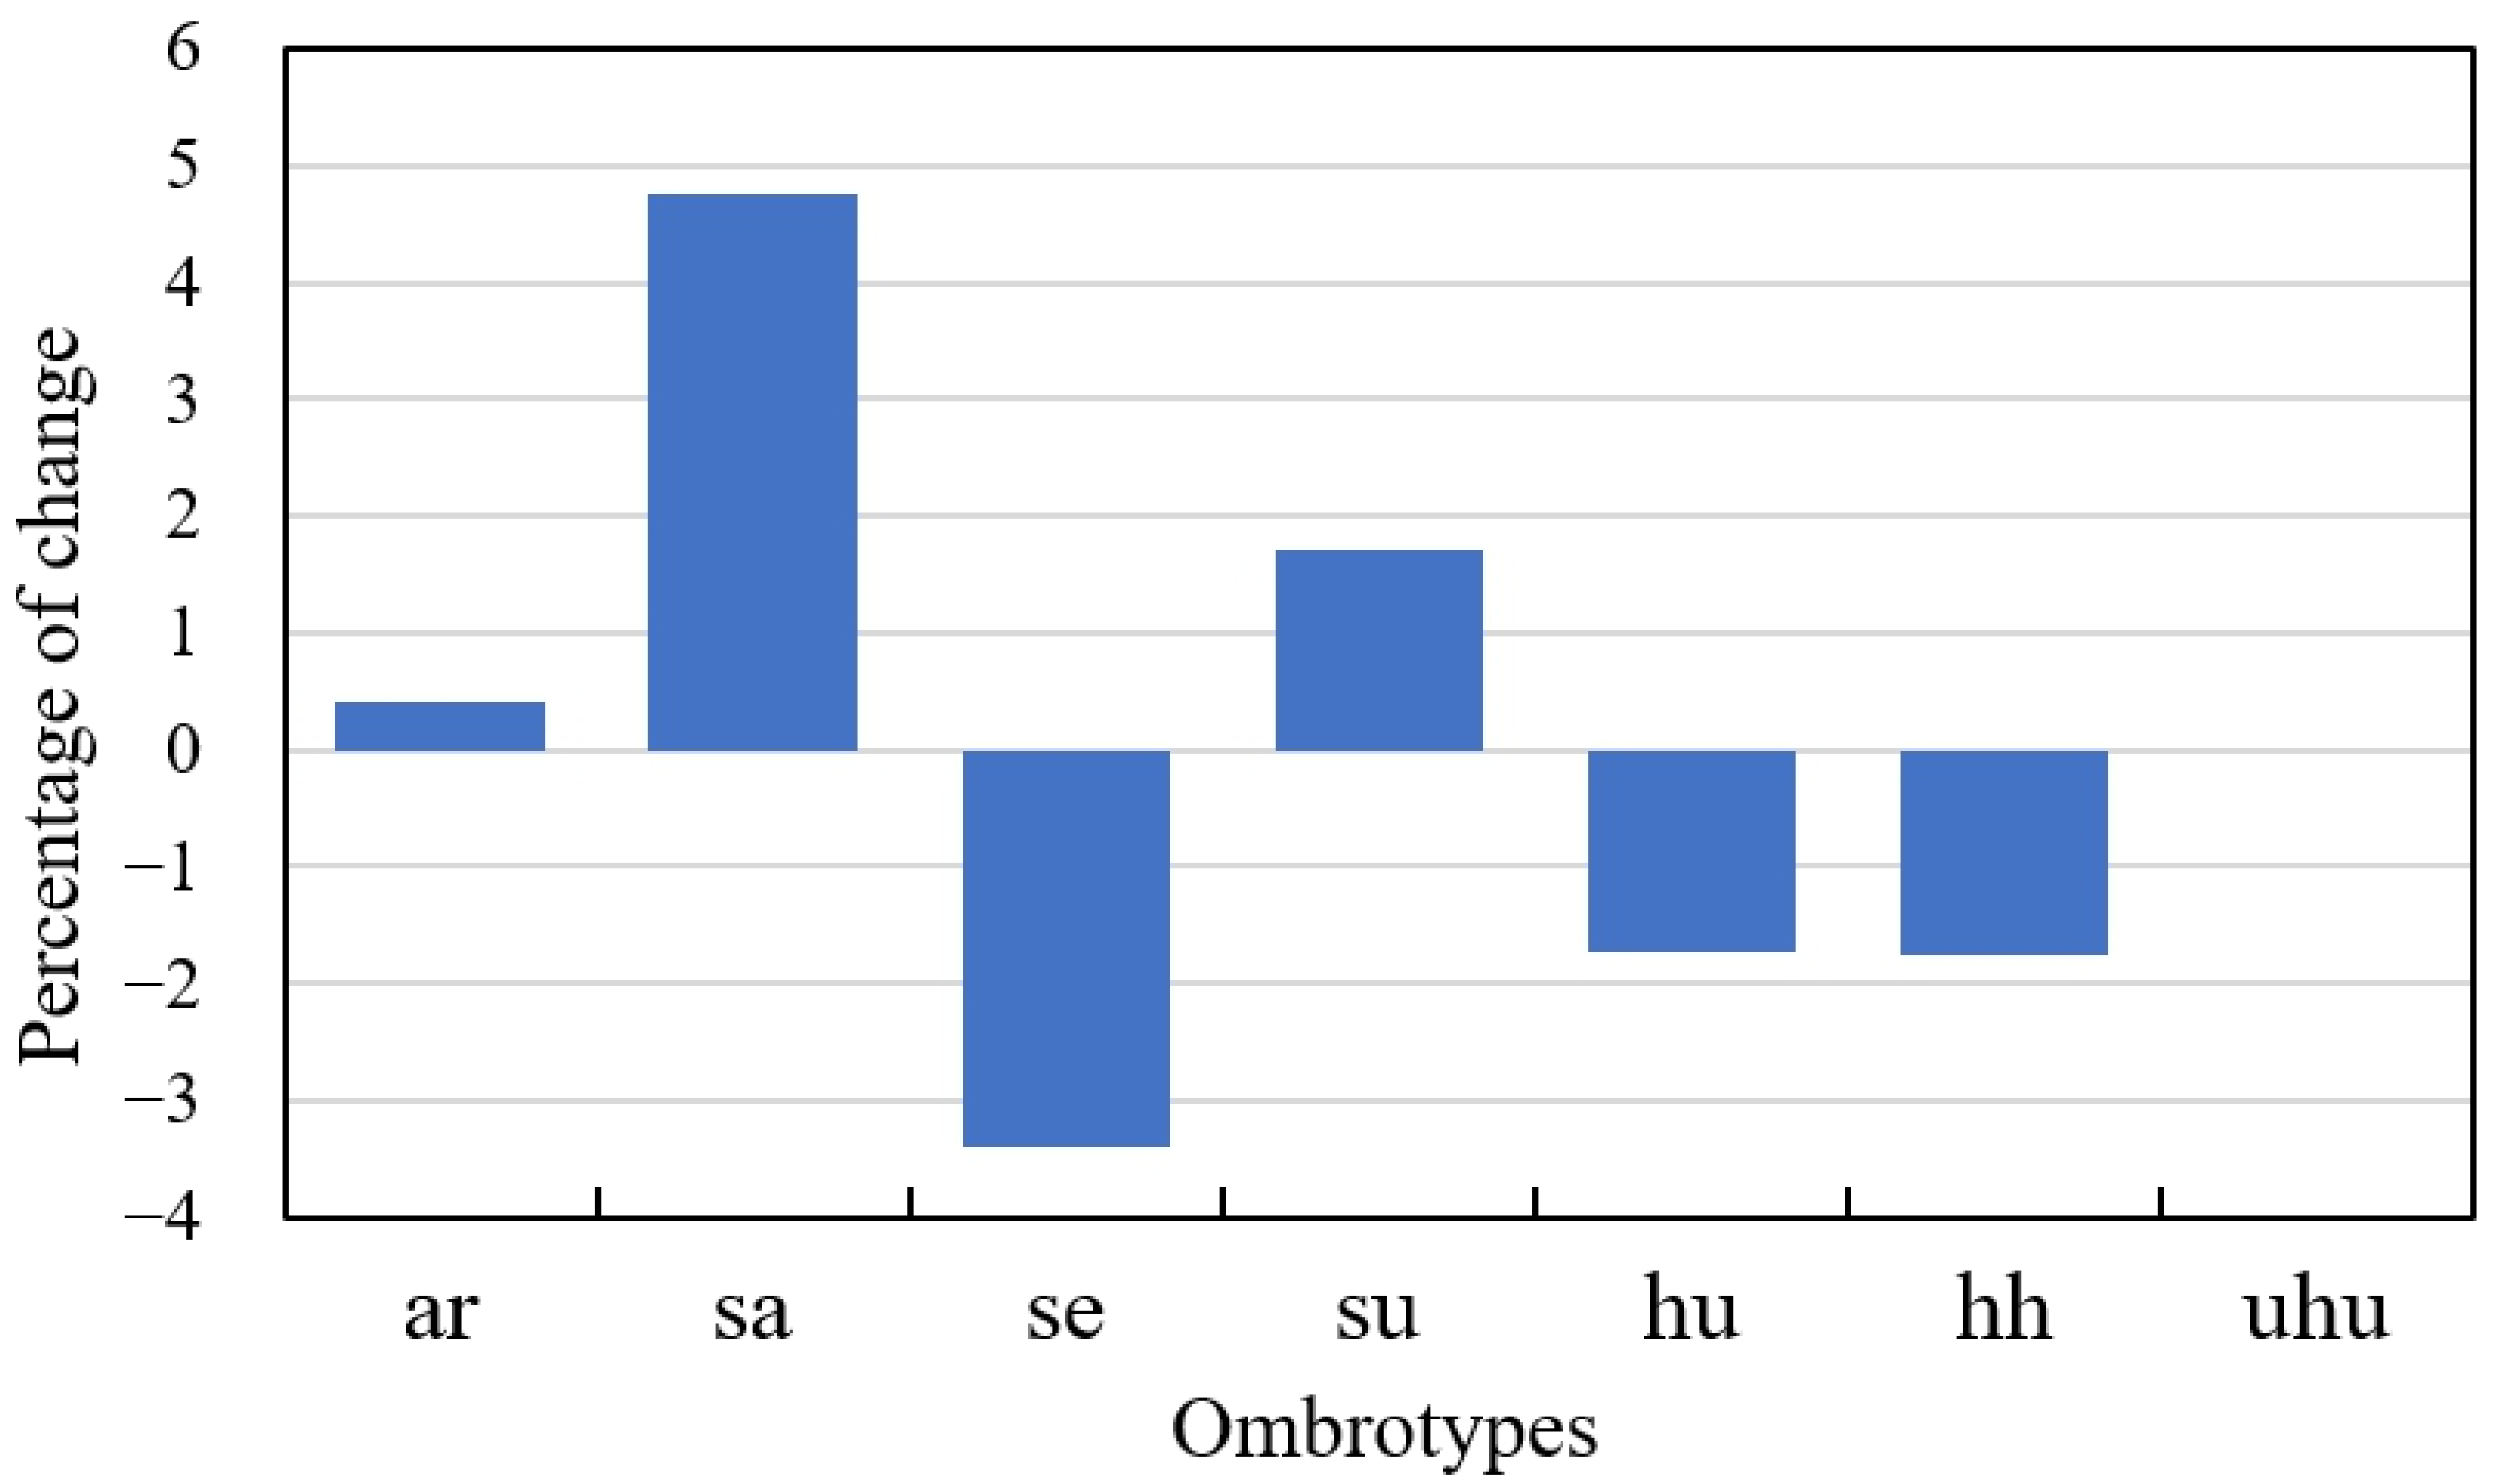
| ar | 15 | 30 | 100% | From ar to sa | 2 | 0.07 |
| sa | 290 | 465 | 60.34% | From sa to se From sa to ar | 83 17 | 2.71 0.55 |
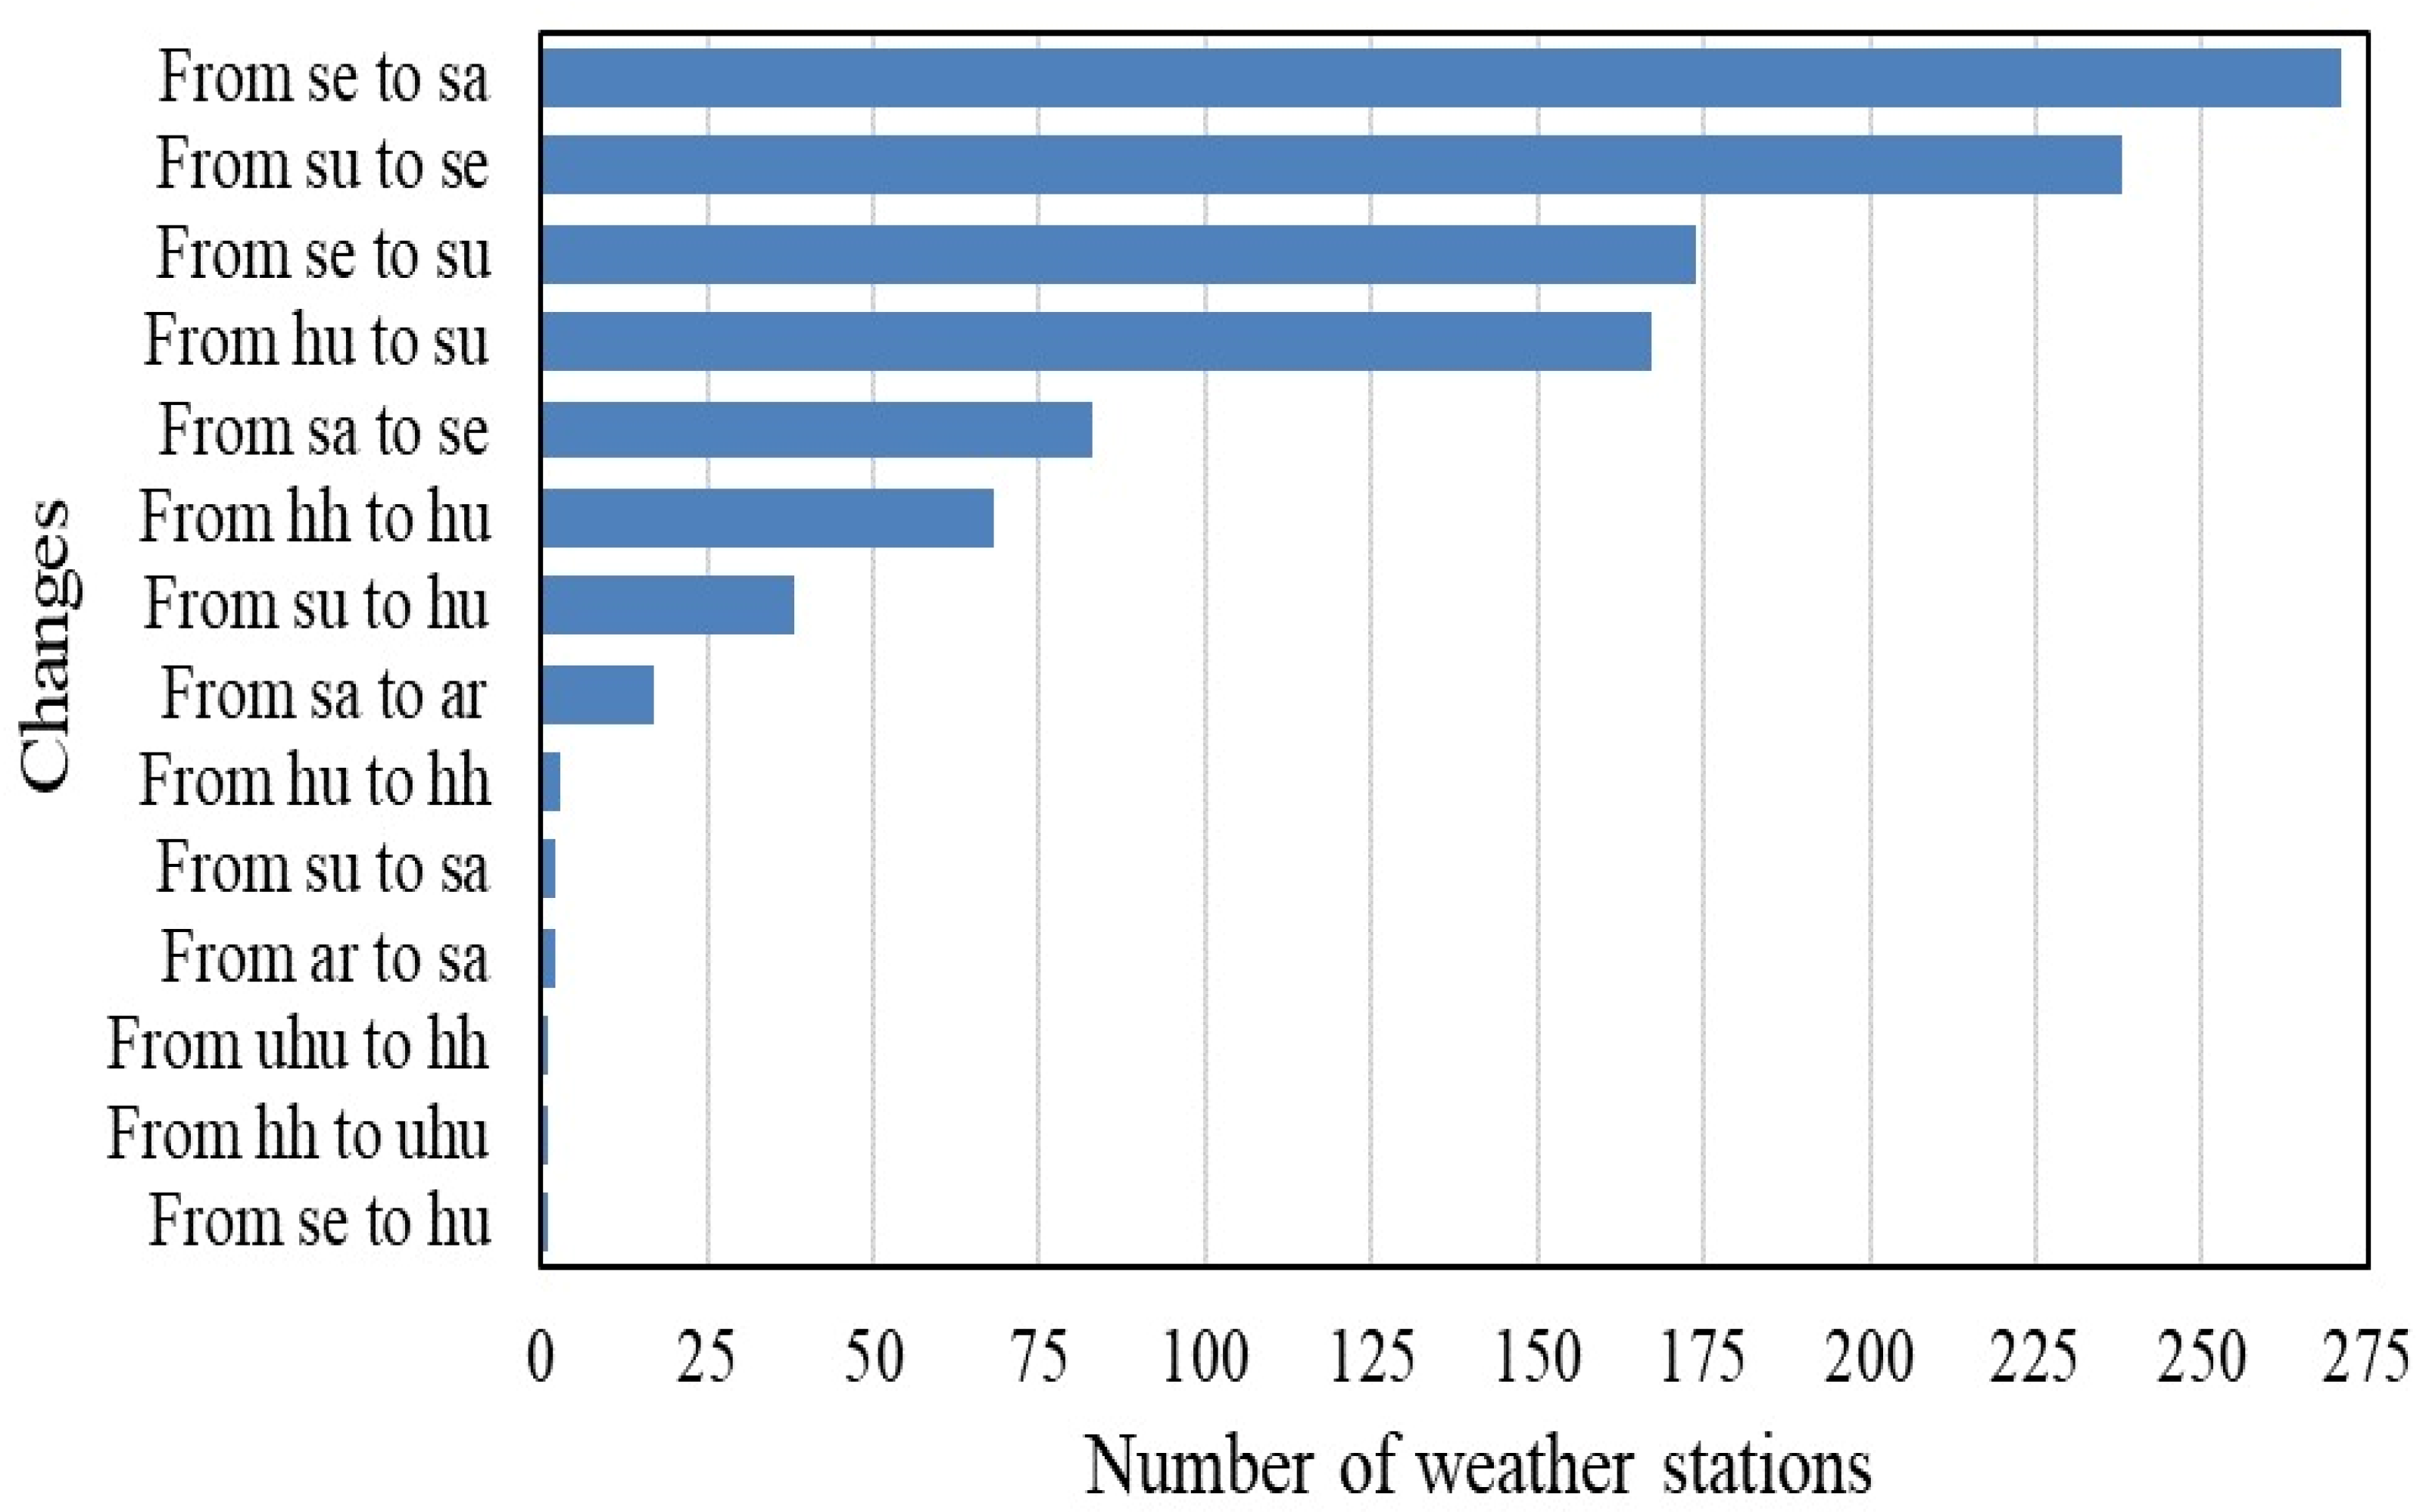
| se | 1733 | 1608 | −7.21% | From se to sa From se to su From se to hu | 271 174 1 | 8.84 5.68 0.03 |
| su | 769 | 832 | 8.19% | From su to se From su to hu From su to sa | 238 38 2 | 7.76 1.24 0.07 |
| hu | 692 | 629 | −9.10% | From hu to su From hu to hh | 167 3 | 5.45 0.10 |
| hh | 166 | 101 | −39.16% | From hh to hu From hh to uhu | 68 1 | 2.22 0.03 |
| uhu | 3 | 3 | 0.00% | From uhu to hh | 1 | 0.03 |
| Total | 3668 | 3668 | - | 14 | 1066 | 34.78% |
Disclaimer/Publisher’s Note: The statements, opinions and data contained in all publications are solely those of the individual author(s) and contributor(s) and not of MDPI and/or the editor(s). MDPI and/or the editor(s) disclaim responsibility for any injury to people or property resulting from any ideas, methods, instructions or products referred to in the content. |
© 2024 by the authors. Licensee MDPI, Basel, Switzerland. This article is an open access article distributed under the terms and conditions of the Creative Commons Attribution (CC BY) license (https://creativecommons.org/licenses/by/4.0/).
Share and Cite
Lorente, C.; Corell, D.; Estrela, M.J.; Miró, J.J.; Orgambides-García, D. Evolution of Bioclimatic Belts in Spain and the Balearic Islands (1953–2022). Climate 2024, 12, 215. https://doi.org/10.3390/cli12120215
Lorente C, Corell D, Estrela MJ, Miró JJ, Orgambides-García D. Evolution of Bioclimatic Belts in Spain and the Balearic Islands (1953–2022). Climate. 2024; 12(12):215. https://doi.org/10.3390/cli12120215
Chicago/Turabian StyleLorente, Christian, David Corell, María José Estrela, Juan Javier Miró, and David Orgambides-García. 2024. "Evolution of Bioclimatic Belts in Spain and the Balearic Islands (1953–2022)" Climate 12, no. 12: 215. https://doi.org/10.3390/cli12120215
APA StyleLorente, C., Corell, D., Estrela, M. J., Miró, J. J., & Orgambides-García, D. (2024). Evolution of Bioclimatic Belts in Spain and the Balearic Islands (1953–2022). Climate, 12(12), 215. https://doi.org/10.3390/cli12120215