Article

A Deeper Understanding of Climate Variability Improves Mitigation Efforts, Climate Services, Food Security, and Development Initiatives in Sub-Saharan Africa

by
Shamseddin M. Ahmed
1,*,
Hassan A. Dinnar
2,
Adam E. Ahmed
3,
Azharia A. Elbushra
3 and
Khalid G. Biro Turk
4
1
Institute of Studies and Consultations, King Faisal University, Al-Ahsa 31982, Saudi Arabia
2
Date Palm Research Center of Excellence, King Faisal University, Al-Ahsa 31982, Saudi Arabia
3
Department of Agribusiness and Consumer Sciences, College of Agricultural and Food Sciences, King Faisal University, Al-Ahsa 31982, Saudi Arabia
4
Water and Environmental Studies Center, King Faisal University, Al-Ahsa 31982, Saudi Arabia
*
Author to whom correspondence should be addressed.
Climate 2024, 12(12), 206; https://doi.org/10.3390/cli12120206
Submission received: 2 October 2024 / Revised: 22 November 2024 / Accepted: 27 November 2024 / Published: 2 December 2024

Abstract

:
This research utilized the bagging machine learning algorithm along with the Thornthwaite moisture index (TMI) to enhance the understanding of climate variability and change, with the objective of identifying the most efficient climate service pathways in Sub-Saharan Africa (SSA). Monthly datasets at a 0.5° resolution (1960–2020) were collected and analyzed using R 4.2.2 software and spreadsheets. The results indicate significant changes in climatic conditions in Sudan, with aridity escalation at a rate of 0.37% per year. The bagging algorithm illustrated that actual water use was mainly influenced by rainfall and runoff management, showing an inverse relationship with increasing air temperatures. Consequently, sustainable strategies focusing on runoff and temperature control, such as rainwater harvesting, agroforestry and plant breeding were identified as the most effective climate services to mitigate and adapt to climate variability in SSA. The findings suggest that runoff management (e.g., rainwater harvesting) could potentially offset up to 22% of the adverse impacts of climate variability, while temperature control strategies (e.g., agroforestry) could account for the remaining 78%. Without these interventions, climate variability will continue to pose serious challenges to food security, livelihood generations, and regional stability. The research calls for further in-depth studies on the attributions of climate variability using finer datasets.

1. Introduction

Climate variability and change continue to be critical areas of research in Sub-Saharan Africa (SSA), necessitating in-depth research to understand their impacts and root causes [1,2,3,4,5]. This variability is responsible for 30–90% of the variations in floods across SSA [4].
The impacts of climate variability on SSA remain a hotspot research issue. Omotoso et al. [6] documented that the true extent of climate variability and change and their impacts on agriculture in SSA remains significantly uncertain. However, there is general agreement that the nations within the SSA region will be the most affected, with detrimental impacts on agricultural infrastructure due to climate-induced extreme events [7]. Despite this evident impact, the adaptive strategies available to the impacted populations in the region remain significantly limited [2]. The reliance on rainfed agriculture makes SSA particularly vulnerable to climate variability and change. This directly affects food security, as rainfed crop yields exhibit strong positive correlations with the quantity and distribution of annual rainfall [6,8]. Shamseddin et al. [8] stated that crops across several countries in SSA exhibited heightened sensitivity to climate variability, significantly diminishing the likelihood of optimal crop yields, estimated to be between 18% and 56%. Furthermore, this climate variability is responsible for a substantial basin-wide reduction of USD 35 million in agricultural contributions to the gross domestic product (GDP).
Understanding the mechanisms driving climate variability in SSA that involve dynamic and thermodynamic processes [9,10] is crucial for effective sustainable planning, mitigation, and adaptation, particularly concerning water resources [3,11]. The observed and projected increases in drought events in SSA underscore the importance of enhancing our understanding of climate variability, given the substantial adaptation costs estimated at USD 30–50 billion per year [11,12,13].
Machine learning algorithms have recently gained much popularity in the study of complex hydrological processes, aiming to overcome traditional statistical challenges and improve the understanding and interpretation of the results. Several studies [14,15] have utilized these algorithms to address various internal and external factors affecting hydrology and earth systems, among others. Lalika et al. [16] successfully predicted drought conditions at a catchment scale using machine learning algorithms and monthly rainfall datasets in Tanzania. Zhao et al. [17] monitored drought conditions without relying on ground-truth datasets by employing the random forest algorithm and remote sensing techniques. Mosaffa et al. [18] demonstrated enhanced flood prediction capabilities compared to traditional methods.
Ensemble techniques, such as bagging, have been effectively used in managing uncertainty and enhancing the quality of regional climate models’ signals across SSA [1,19]. By integrating multiple statistical analyses conducted on the same dataset, a unified outcome known as an ensemble or consensus estimator can be derived [20]. The bagging algorithm is particularly adept at managing outliers and addressing issues of uncertainty and overfitting [20]. Recent studies [8,9] have successfully employed the bagging algorithm to understand the interrelationships among climate variability, crop yields, and the contributions of agriculture to GDP in SSA.
Fundamentally, machine learning algorithms disaggregate the relevant dependent variable using decision trees and a sub-setting process, employing bootstrap sampling to fit it with the most important independent variables at each detected node [21]. Additional techniques, such as random forest and bagging algorithms, have been used to address issues of uncertainty and overfitting through resampling methods. Lu et al. [9] have attributed the variability in water–vegetation sensitivity in the Sahel region to fluctuations in CO2, surface air temperature, radiation, and precipitation based on the random forest machine learning algorithm.
Despite their proven effectiveness, machine learning algorithms have not been widely utilized in comprehending climate variability in SSA. Agriculture (encompassing forestry and livestock) is pivotal for food security and financial generation. The heavy dependence on rainfed agriculture renders countries susceptible to climate variability and food insecurity [6]. The repercussions of climate variability are evident in Sudan, as seen in the Darfur conflict, often labeled as the first climate change conflict [22,23].
Therefore, understanding climate variability is imperative for executing sustainable adaptation approaches and optimizing climate services. This research adopts a comprehensive interpretation of climate service, defined as “the provision of climate science data, information, and tools to facilitate adaptation to climate variability and change. These services address climate and societal challenges, enhance the capacity to manage climate and other risks, and involve systemic actions. The goal is to yield substantial benefits while expanding the scope of expertise and resources required to tackle these challenges effectively” [24].
This research employs the bagging machine learning algorithm along with the Thornthwaite moisture index (TMI) to enhance our understanding of climate variability and change. The objective is to identify the most efficient climate service pathways and adaptation measures in Sub-Saharan Africa (SSA).

2. Materials and Methods

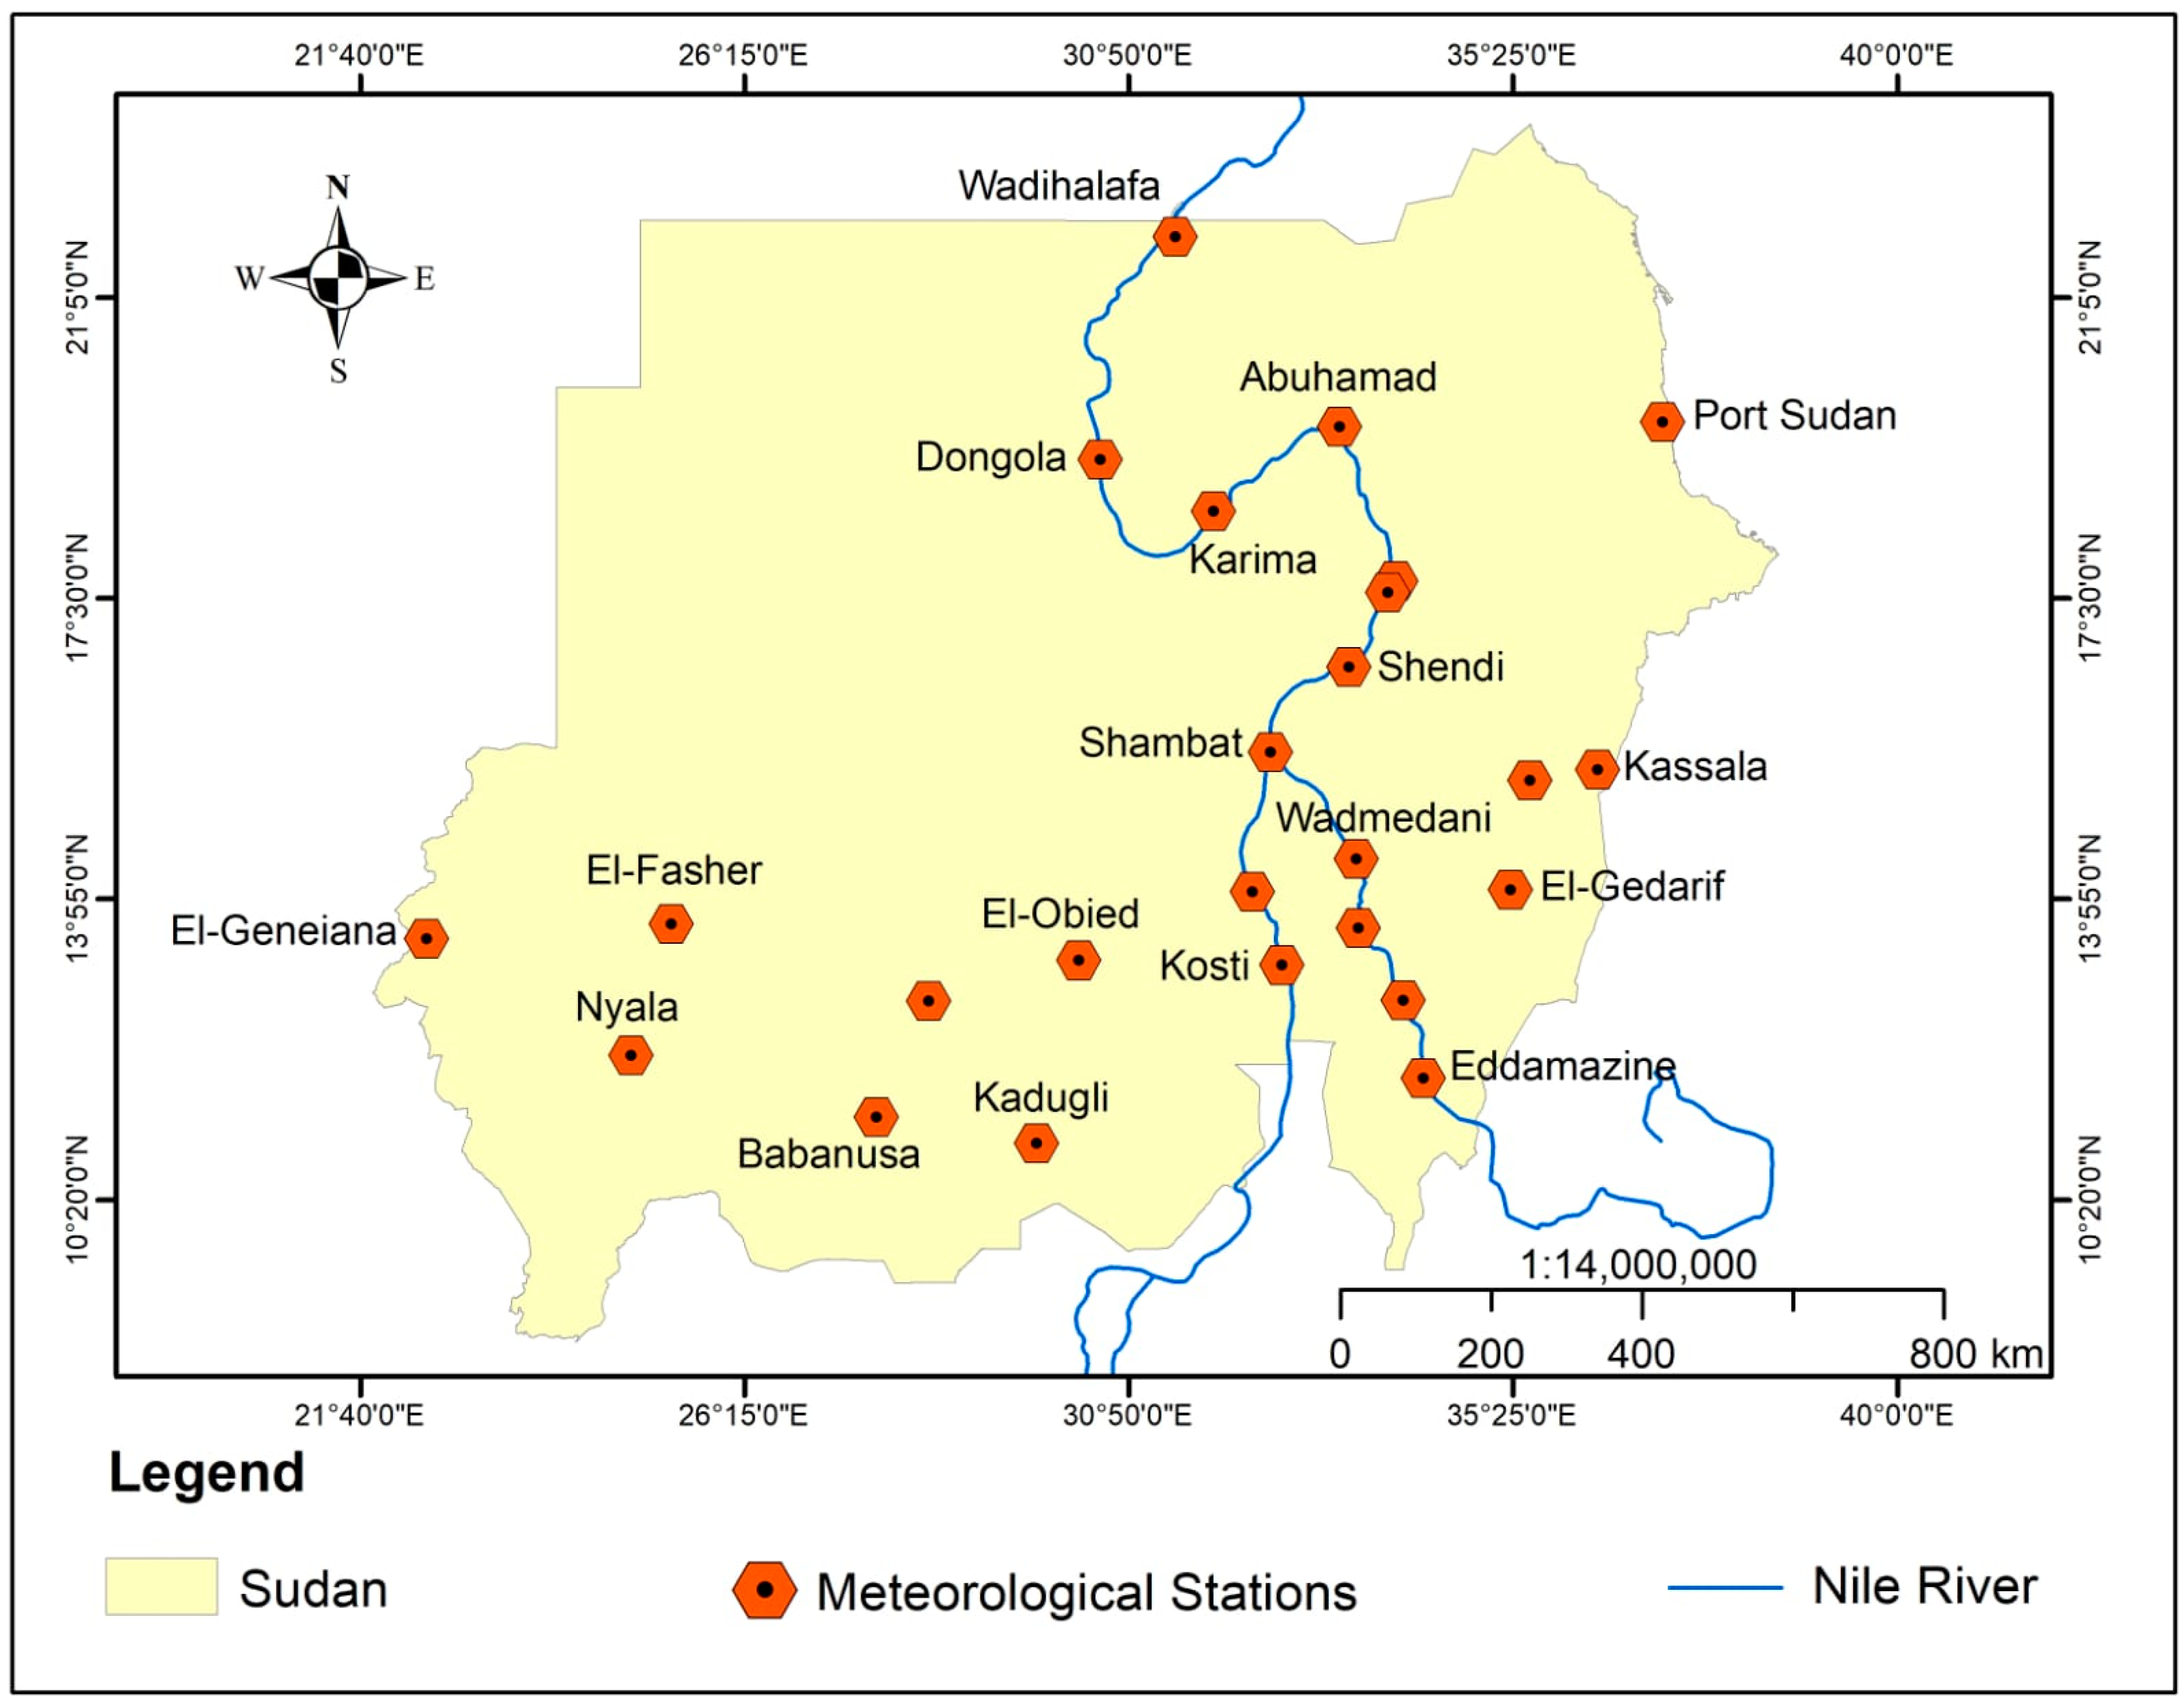
2.1. Data Collection

Monthly CRU TS v.4.06 climatic datasets, with a resolution of 0.5°, for the period of 1960–2020 were extracted using the web processing service (WPS) from the Climate Research Unit (CRU). These datasets included: rainfall (P, mm month−1), minimum and maximum surface air temperatures, mean air temperature, diurnal range of air temperature (°C), potential evapotranspiration (PET, mm day−1), and vapor pressure (Vp, hPa). The quality and reliability of these datasets were extensively discussed in the study by Harris et al. [25]. Monthly soil moisture datasets (mm), at a resolution of 0.5°, were obtained from the Climate Prediction Centre (CPC). These soil moisture datasets were estimated using a one-layer bucket model [26]. The one-layer bucket model utilizes recorded precipitation and temperature data to compute the soil moisture, evaporation, and runoff. Specifically, the soil moisture was derived from the water balance within the soil profile (2 m in depth). The water balance components included precipitation, evaporation, runoff (or streamflow divergence), and groundwater depletion (rendered to zero, as the groundwater table is at least 10 m in the study area). The potential evaporation was derived from observed temperature readings. Accurately estimating the soil moisture and potential evapotranspiration continues to pose significant challenges, particularly in arid and semi-arid environments [27].
d w t d t = P t E t R t G t
R t = S t + B t
S t = P t ( w t w m a x ) m
B t = α 1 + μ w t
G t = α μ 1 + μ w t
E t = E p w w m a x
where w is the soil moisture, P is the precipitation, E is evapotranspiration, R is the total runoff, G is the deep percolation, S is the surface runoff, and B is the base flow, all at time t. wmax is the measure of the soil capacity to hold moisture; α, μ, and m are parameters; EP is the potential evapotranspiration rate, estimated using the adjusted Thornthwaite model (ATM), which outperforms the Penman–Monteith (PM) in arid areas [28].

2.2. Data Analysis

The analysis was carried out using R 4.2.2 software (a free-license software) and spreadsheets.

2.2.1. TMI Calculation

The Thornthwaite moisture index (TMI) serves as a significant tool for climate classification, integrating both precipitation and potential evapotranspiration. Its adoption within the scientific community has led to its recognition as a reliable climate classification metric. For instance, areas exhibiting TMI values ranging from −20 to −40 are designated as semi-arid, while those with TMI values below −40 are classified as arid [29]. The TMI was estimated using the following sequence [30]:
S = S i S i 1 ( 4 )
A E T = P E T ; P > P E T
A E T = S + P E T ; P < P E T
D = P E T A E T
R = P S A E T
I a = D P E T   *   100
I h = R P E T   *   100
T M I = I h 0.6 I a
where ΔS is the change in soil moisture between two consecutive months (i − 1 and i), AET is the actual evapotranspiration, P is the precipitation, D is the soil moisture deficit, R is the runoff, Ia is the aridity index, and Ih is the humidity index. Datasets of the main meteorological stations were extracted (Figure 1).

2.2.2. Trend Detection

Trends were detected using the Theil–Sen slope estimator at a significance level of 0.05. One of the merits of this test is that it is unaffected by outliers and missing data [3,31].

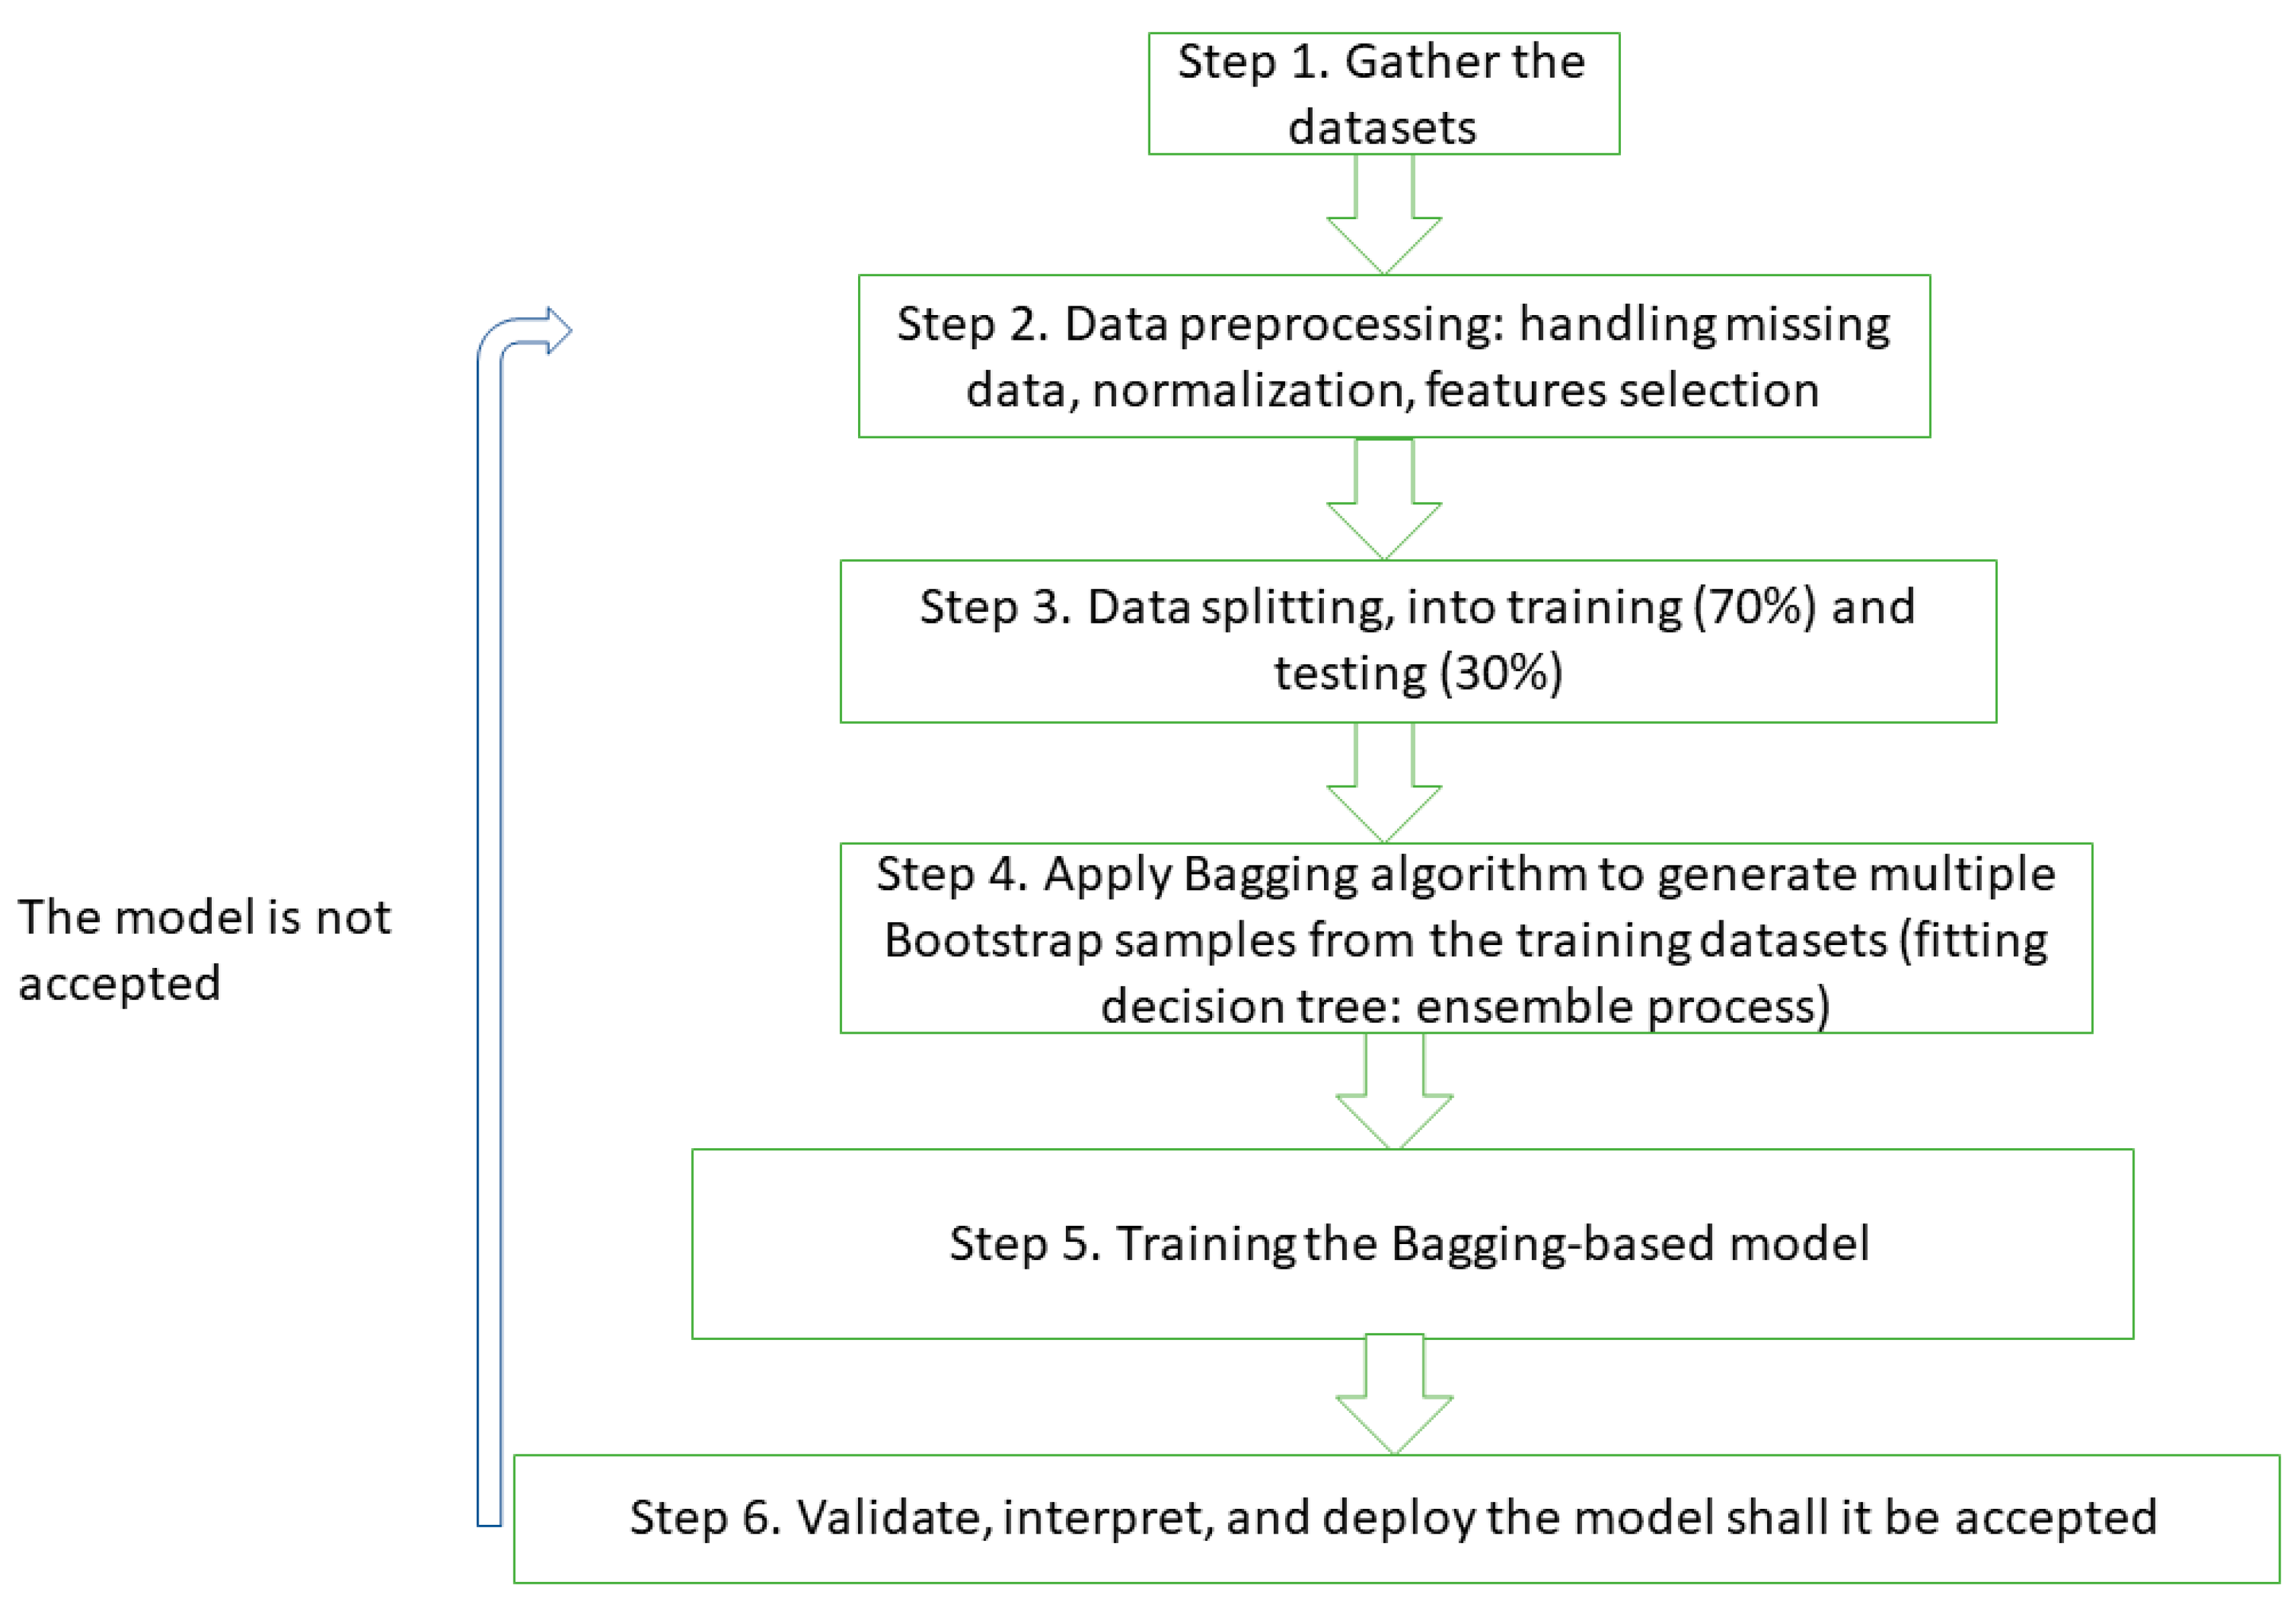
2.2.3. Bagging Machine Learning Algorithm

In the realm of machine learning, ensemble methods continue to be among the most widely utilized and effective strategies. Numerous ensemble algorithms have been developed, each incorporating diverse classification and prediction techniques. Notably, bagging and boosting methods have garnered significant interest from researchers in the field [32]. These algorithms primarily employ ensemble decision trees to evaluate and categorize pertinent variables. This is accomplished by partitioning the datasets into smaller groups and applying the most precise regression or classification model at each node, which aids in minimizing variance and enhances the comprehension of temporal fluctuations [8]. Moreover, this methodology facilitates the ranking of the significance of each variable within the optimal regression model at every level [21]. This process may result in overfitting. To mitigate this risk, variance reduction techniques are utilized, such as bagging. This study chose to focus on the bagging algorithm due to its straightforward nature and its effectiveness in managing outliers and missing data within datasets.
In our study, the bagging algorithm was employed mainly as a method for attribution (enhancing understanding), as shown in Figure 2. The bagging machine learning algorithm (the “ANOVA” method) was run mainly via the “rpart” package along with accompanying packages, e.g., rsample, and caret. The TMI served as the dependent variable, while the independent variables included rainfall, minimum and maximum surface air temperatures, mean surface air temperature, diurnal range of surface air temperatures, vapor pressure, and potential evapotranspiration. The collected monthly time series data were divided into 70% for training the model and 30% for testing it. The predictive model for the TMI was constructed using the following equation:
T M I i = R i 1 + m i n T i 1 + m a x T i 1 + m e a n T i 1 + D T i 1 + P E T i 1 + V P i 1
where TMI is the Thornthwaite moisture index in the current year, R is the rainfall in the preceding year, minT is the minimum air temperature in the preceding year, maxT is the maximum air temperature in the preceding year, meanT is the mean air temperature in the preceding year, DT is the diurnal range of air temperature in the preceding year, PET is the potential evapotranspiration in the preceding year, and VP is the vapor pressure in the preceding year. The bagging algorithm was then applied to generate an ensemble mean from 10 cross-validated models (i.e., resampling with 10 replacements). The performance of the developed models was validated based on the root mean square error (RMSE).

2.2.4. Uncertainty

The method used to calculate the TMI introduced a reasonable degree of uncertainty, particularly concerning the soil moisture data. Runoff, which includes surface runoff, base flow, and drainage to groundwater, was parameterized based on the rainfall and soil moisture, as shown in Equation (2). This approach allowed runoff to function as an adjusting factor, creating negative feedback to anomalies in the soil moisture and thus minimizing its impact on the overall uncertainty [33]. A comparison was conducted between the soil moisture content values estimated by the Climate Prediction Center (CPC) and the experimentally measured values by Mohamed et al. [34], under rainfed semi-arid conditions enhanced with rainwater harvesting (14.18° N–33. 1° E) in Sudan during the period of 2020–2021. The relationship was poor (R2 = 0.36). The CPC’s one-layer hydrological model overestimated the soil moisture by approximately 6–106%, depending on the time of year, with the largest discrepancies occurring at the end of the rainy season (October). This could be attributed to several factors. The difference in the temporal and spatial resolution between the model and local conditions is significant; the semi-arid region of Sudan experiences highly variable rainfall patterns, which can significantly influence the soil moisture content. The model’s ability to accurately simulate these patterns and their interaction with local soil characteristics (e.g., texture, and infiltration rates) plays a crucial role in determining the soil moisture content. Any inaccuracies in representing these factors can contribute to the observed discrepancies. The enhancement of soil moisture through rainwater harvesting practices, as measured values, might not be adequately represented in the model. These practices can lead to localized increases in soil moisture that the model may not account for, resulting in overestimation.
There remains substantial uncertainty in the estimates of PET [27]. CRU TS v.4.06 provides synthetic estimates of PET using the Penman–Monteith (PM) equation, which incorporates gridded values of the mean temperature, vapor pressure, cloud cover, and static average wind field values from 1961 to 1990 [25]. Station-based comparisons revealed that CRU underestimates PET by 6.6–36.6%, varying by station. From a water balance perspective, the underestimated PET might counterbalance the overestimated soil moisture contents.
However, the ensemble method using the bagging machine learning algorithm is expected to further reduce the uncertainty in the generated TMI values. This ensemble approach integrates multiple models, thereby averaging out errors and increasing the reliability of the results.

3. Results

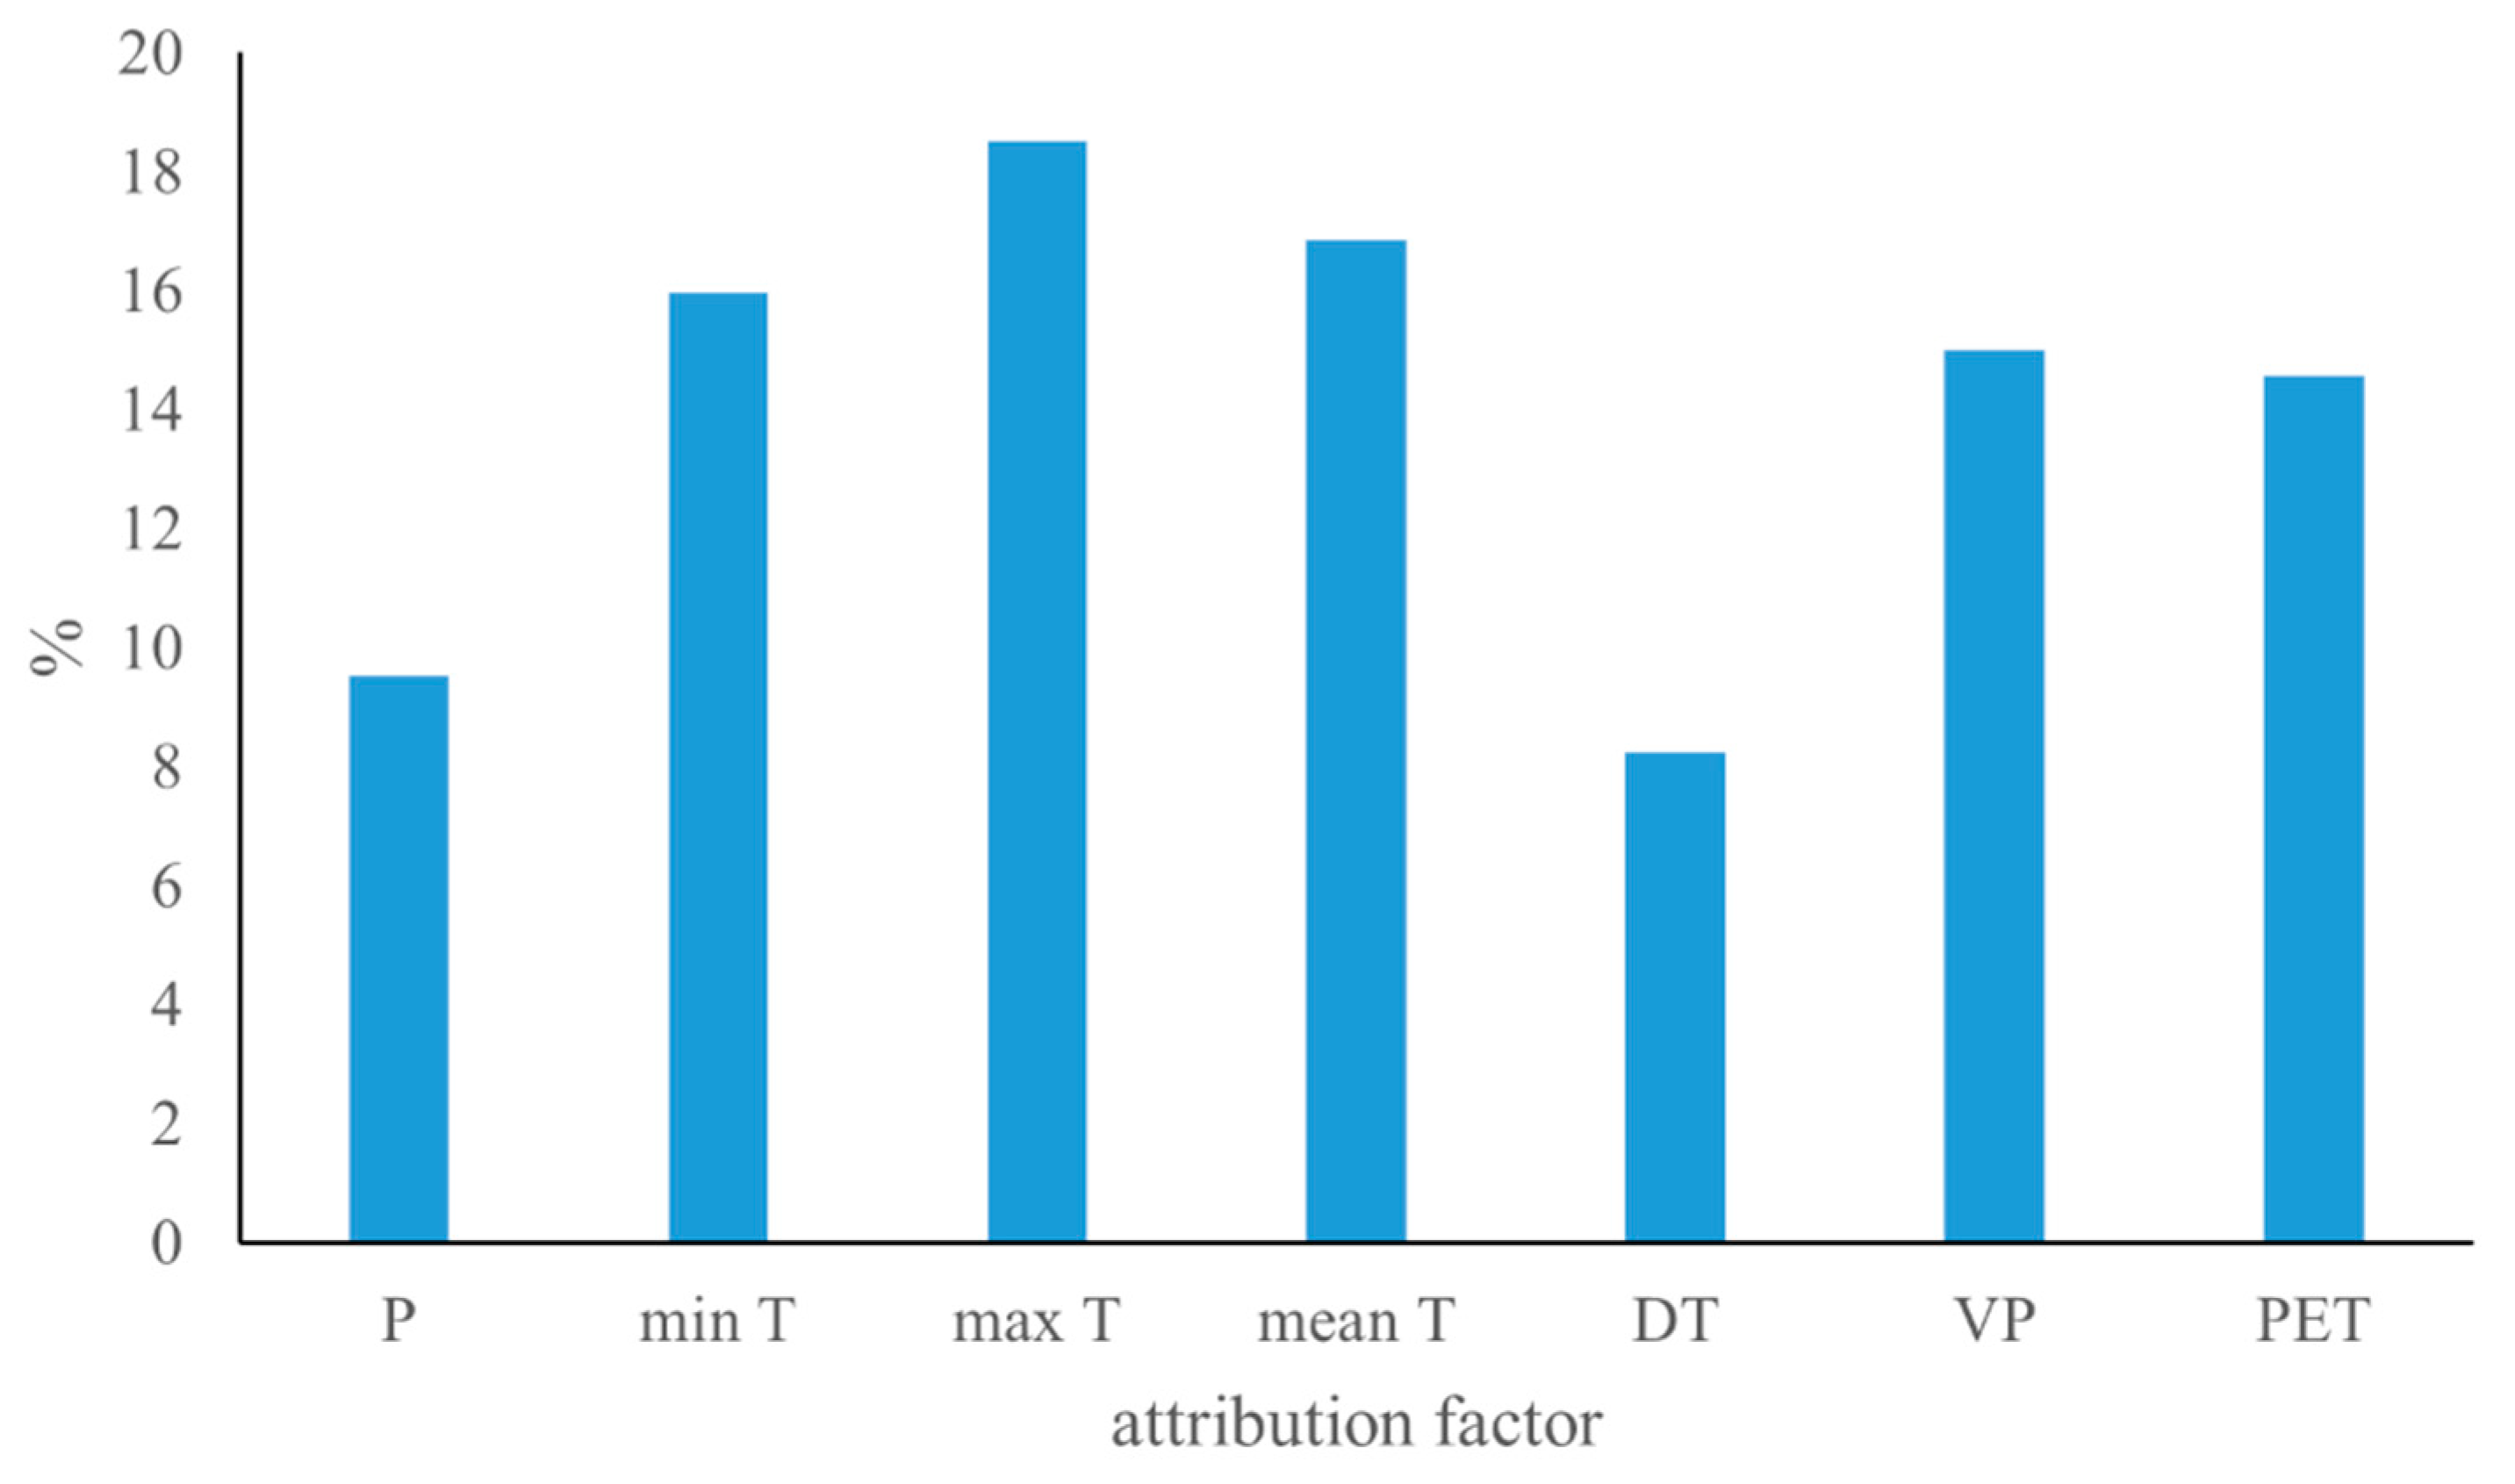
3.1. Factors Influencing Climate Variability and Trend

The data presented in the Supplementary Material Table S2 provide the annual averages of the studied climatic parameters in Sudan. These include an annual rainfall ranging from 1.1 mm to 758 mm, 17.7–23.8 °C for minimum air temperatures, 34.0–37.5 °C for maximum air temperatures, 9.1–22.6 hPa for vapor pressure, 0.0–49 mm for runoff, 2.6–791 mm for actual evapotranspiration (AET), and 106.9–179.8 mm for potential evapotranspiration (PET). Starr and Alam [35] calculated the annual runoff in the woodland savanna (central Sudan) to be 0.0–145 mm during the period of 1960–1990. This estimate is 204% higher than the current estimation, taking into account the spatial and temporal variations between the two studies.
The trends in the selected climate variables over the 60-year period are summarized in Figure 3. The annual rainfall exhibited varying spatial trends, with decreases of −0.4% yr−1 in some areas to increases of 0.3% yr−1 in others. However, significant changes (p = 0.05) were only observed in less than 10% of the country’s area, specifically in Kadugli and Babanusa, where rainfall starts earlier (March). These trends align with findings of regional studies [36], which identified two distinct spatiotemporal patterns in annual rainfall across East Africa, including Sudan. Declines in rainfall (0.65–2.95 mm per season per year) were observed in countries with two rainy seasons near the equator (e.g., Kenya), while increases (1.44 to 2.36 mm per season per year) were noted in countries with a more limited rainy season (October to December), such as Sudan. Regions around Lake Victoria (Uganda) and Lake Tanganyika (Tanzania) exhibited upward trends in the precipitation concentration degree metric across both annual and seasonal time frames [37].
Locally, the estimated rainfall trends in Sudan are lower than the regional 20-year trend of approximately ±3% yr−1 [38]. This indicates the importance of local factors in rainfall variability in Sudan. This supports the findings of Kotikot et al. [39], which indicate that climate variability exhibits a localized nature in SSA. However, Palmer et al. [36] elucidated that the primary drivers of rainfall variability in East Africa are the El Niño–Southern Oscillation and the Indian Ocean Dipole. The increasing trend in annual rainfall is consistent with the projected 5–10% increase in annual rainfall in the central region of Sudan, East Africa, and SSA by the end of this century [1,31]. Therefore, understanding precipitation patterns in Sudan requires examining regional, seasonal, and local factors.
The minimum and maximum surface air temperatures showed significant increases averaging 0.036 °C yr−1 and 0.028 °C yr−1, respectively; the rise in the minimum temperature was faster than that of the maximum. Consequently, the mean temperature, radiative forcing, and risk of extreme weather events are expected to increase due to the increase in the surface air temperature. Approximately 84% of Sudan’s area has experienced significant increasing trends of 0.05% yr−1 in climatic water demands (PET), while the remaining 16% (specifically the Darfur region) showed insignificant increasing trends. Similar increasing trends in PET were observed at the continental and regional levels [40,41]. However, actual water use (AET) has witnessed a decreasing trend at a rate of −0.2% yr−1 since 1960. This situation may be attributed to the repeated drought events. This AET reduction could also be linked to anthropogenic activities (e.g., irrigation). Marshall et al. [31] reported a similar decreasing trend in the annual ET across much of SSA (estimated at > −5 mm yr−1 in Sudan), claiming that any reduction in ET and latent heat transfer in SSA could lead to increased sensible heating and higher surface temperatures, potentially creating a positive feedback loop between evapotranspiration and surface temperature [31]. The observed reduction in AET could potentially signal a serious decline in vegetation cover; Gadallah et al. [42] estimated a 14% decrease in forest cover since 1988 in Sudan. This stands in contrast to studies suggesting that vegetation cover in SSA has recovered after the severe droughts of the 1970s and 1980s [9]. It is important to recall that in SSA, the total water storage and vegetation cover, i.e., the normalized difference vegetation index (NDVI), have exhibited a positive correlation, while the opposite holds for AET and the water balance [43].
Analyzing the relationships among climatic variables allows for a better understanding of the spatial differences in climate. Table 1 presents the annual bivariate correlations among the chosen variables, providing insights into their relationships. The analysis reveals that in 80% of the Sudan region, there has been a significant increase in potential evapotranspiration (PET), ranging from 0.03% to 0.16% per year. This indicates a consistent increase in PET for the majority of the area, highlighting the region’s growing aridity and potential implications for water resources and agriculture. Meanwhile, in the remaining 20% of the region, no significant change in PET was observed. This suggests that certain areas may be less affected by the factors driving PET increases, potentially due to localized climatic or geographic conditions.
All temperature nomenclatures significantly affect PET, with the exception of the diurnal range of air temperature (DT), which also demonstrates insignificant correlations with the tested climatic variables. Accordingly, DT will have a negligible influence in statistically explaining climate variability. Trends in PET contradict the findings of Ogou et al. [43], who reported a decreasing trend in PET in SSA during the period of 2002–2016. Also, the datasets in Table 1 indicate that AET is significantly correlated with rainfall and runoff, with rainfall and PET showing linear and inverse relationships with AET, respectively. In line with this, rainfall and its management appear to be the primary determinants, particularly when accounting for the direct impact of precipitation on both runoff and PET. Marshall et al. [31] attributed the divergence among AET, precipitation, and PET relationships in SSA to temperature–moisture feedbacks in areas with higher AET values, where vegetation growth is highly constrained by moisture. Similarly, Kumar et al. [44] found an increasing trend in AET, whereas PET has been experiencing a decrease across the northwestern Himalayan region, i.e., a negative relationship. These contrasting trajectories of AET and PET highlight the critical role that the biological characteristics of vegetation cover play in their response to water in SSA.
The bagging-based attribution also states that the second most influential factor on AET is runoff, which is significantly correlated with air temperature, PET, and vapor pressure. Additionally, the negative correlations of AET with air temperature, PET, and vapor pressure are highlighted in Table 1. Consequently, the declining trend in AET will lead to higher air temperatures and an increase in climatic water demand (PET), ultimately limiting the available water resources. Marshall et al. [31] also reported analogous results on a regional level in SSA. Lu et al. [9] indicated that the presence of vegetation cover in the Sahel–Sudan region is reliant on water availability, with different sensitivities depending on the location (rainfall amounts), as determined by the random forest learning algorithm during the period of 1984–2014. The research further determined that an increase in drought intensity was correlated with a heightened sensitivity of water–vegetation dynamics in the Sahel region [9]. Therefore, it could be claimed that the utilization of rainwater harvesting technologies is an effective strategy that could enhance AET and consequently reduce the rate of warming. The results also underline that the runoff collection projects/initiatives (availing more rainwater to plants) would have considerable hydrological consequences at a sub-regional level. This remains true regardless of the scope of such initiatives, underscoring the value of rainwater harvesting technologies as viable methods for augmenting AET and subsequently reducing the surface air temperature. This also holds for the generated benefits of green structures under urban conditions.
Despite the declining trend in actual water use (AET), which ranged from −0.6% yr−1 to 0.1% yr−1), this actual use in Sudan remained 28 mm yr−1 higher than the annual received rainfall, on average. This deficit indicates a negative water balance, as the actual water use exceeded the supply of water from rainfall. In the context of crop production, this negative balance is typically addressed through irrigation methods that depend on the Nile River or groundwater sources. However, this reliance on irrigation becomes particularly critical during periods of hydrological drought, as rainfed agriculture and natural stands are unable to meet their optimum water requirements and consequently suffer. As a result of this ongoing water deficit, there will be a heavy reliance on groundwater to compensate. Mohamed et al. [45] reported that the storage capacity of the Nubian aquifer (the largest aquifer in Sudan) decreased by about 13 km3 yr−1 during the period of 2006–2008. This result aligns with the findings of Ogou et al. [43], who estimated a substantial decline in the total water storage of over 45% in SSA. It is important to note that SSA experienced severe drought events in the 1970s, 1980s, 1990s, and 2000s [1,46]. Although fully utilizing the annual runoff (5.9 mm) in Sudan would be beneficial, it would only offset approximately 22% of the deficit in AET. This finding assumes that the runoff amounts have remained stable across 72% of the region, while the remaining 28% of the area has experienced a significant annual increase of approximately 2%. Therefore, there is a pressing need to significantly improve water use efficiency to address the 78% gap in actual water use in Sudan.
Figure 4 presents the estimated values of the Thornthwaite moisture index (TMI) values. These estimates range from–7.0 to −59.1, effectively delineating three distinct climatic zones, as outlined in the Supplementary Material. Namely, the TMI values identify arid zones, comprising 40% of the region; semi-arid zones, covering 48% of the area; and dry sub-humid zones, accounting for the remaining 12% of the area. Despite 56% of the stations being associated with increasing trends in rainfall, the average TMI has shifted toward drier conditions by 0.37% yr−1 on average. This aligns with the findings of Sylla et al. [47], who suggested a shift in climate zones in West Africa, based on the TMI. This implies that the TMI is particularly responsive to fluctuations in air temperature compared to rainfall, signifying the localized nature of the prevailing climate conditions in Sudan. Eltahir [48] raised doubts about the autonomy of the rainfall patterns in central Sudan, suggesting a very limited influence. Therefore, large-scale temperature-related interventions (reforestation, rehabilitation, etc.) could play a crucial role in addressing climate change. Additionally, Figure 4 highlights that the year 2020 was exceptional (TMI = 0.1). This anomaly could be attributed to the extensive and persistent rainfall during September 2020 in Sudan, which led to a catastrophic flood. This flood affected 17 of the 18 Sudanese states [49] and is considered one of the most severe floods documented in the region, resulting in the highest number of casualties [50,51]. The significance of this flood event underscores the sensitivity of the TMI in detecting extreme hydrological events, such as droughts and floods. The TMI’s ability to accurately reflect such anomalies demonstrates its usefulness as a critical indicator for monitoring and responding to climatic variations and extreme weather events. This sensitivity is crucial for early warning systems and for developing effective adaptation and mitigation strategies to cope with climate variability and change.

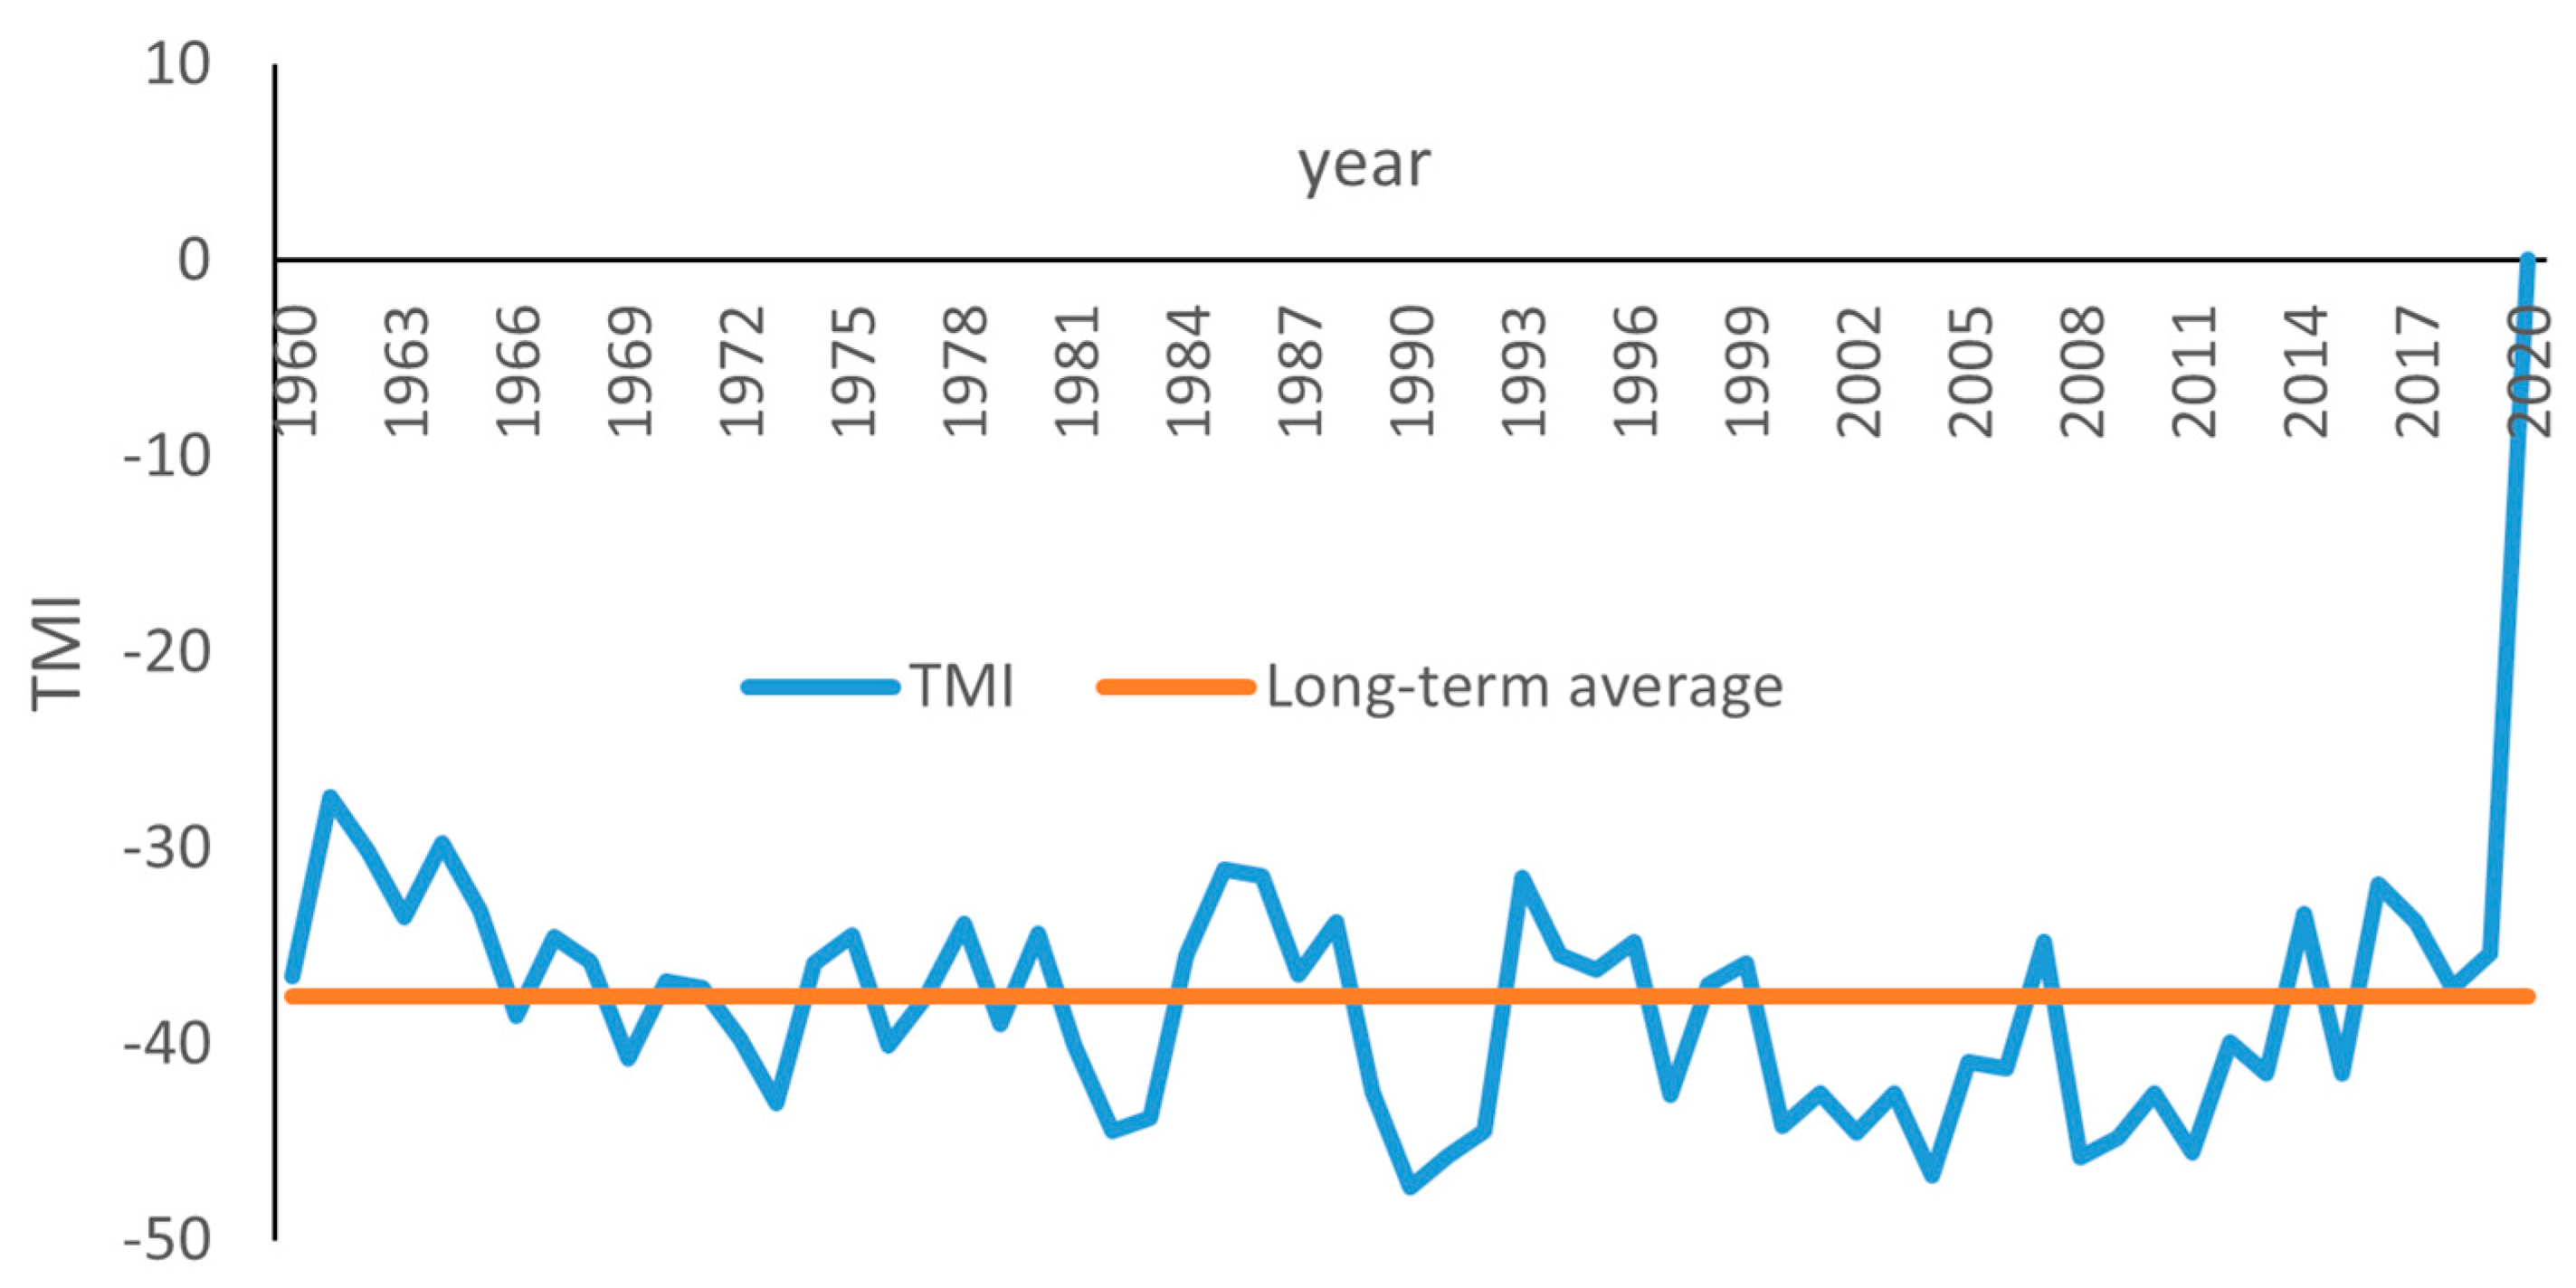
3.2. Drought Detection and TMI Modeling

The Thornthwaite moisture index (TMI) in Sudan exhibits an annual variability of 18%. The TMI results demonstrate that the period from 2000 to 2010 was the driest, with 32% of this timeframe classified as experiencing drought conditions, i.e., the TMI for those years fell below the long-term average (Figure 3 and Figure 4 above). Furthermore, since the 1960s, the incidence of drought has escalated by 100% to 350%. This finding aligns with the results of Ekulo et al. [3], who reported an increase in the frequency, intensity, and duration of drought events in SSA from the early 1960s to the late 1990s. Kotikot et al. [39] documented a significant increase in rainfall variability after 2013 in Kenya.
Figure 5 illustrates the Thornthwaite moisture index (TMI) generated by the bagging machine learning algorithm in a drought-affected region (El-Fasher station). The developed decision tree indicates that the area is characterized by a long-term average TMI of −31, primarily influenced by annual rainfall and vapor pressure, i.e., the key variables explaining the annual variability in the TMI. The figure shows that if the annual rainfall of the previous year is less than 405 mm, a dry condition (the left branch of the tree) is predicted for the next season, resulting in an average TMI of −33 with a probability of 79%. The most severe dry conditions (TMI ≤ −40, with an exceedance probability of 17%) occur when the annual rainfall is less than 405 mm, coupled with a minimum air temperature of <21.3 °C, maximum air temperature of >35.1 °C, vapor pressure of ≥ 13.0 hPa, and a diurnal range of air temperature of >14.05 °C. On the other hand, the right branch of the tree in Figure 5 indicates wet conditions with a TMI ≥ −24 (probability = 21%).
Figure 6 presents the ranking of variable importance in elucidating the variance in the TMI in Sudan based on the bagging machine learning algorithm. Remarkably, the surface air temperature descriptors, particularly the maximum temperature, collectively account for approximately 60% of the annual variability in the TMI, whereas rainfall only contributes to 10% of the variability in the TMI (Figure 6). Nevertheless, it is crucial to acknowledge that the significance of the variables is contingent on the spatial factors, exhibiting spatial variations in the TMI from one station to another (CV, coefficient of variation = 63% and standard deviations of 6.9). The developed TMI prediction model demonstrates a reasonable RMSE of 20.97, which generally escalates with increasing rainfall, reaching the highest RMSE of 49.3 at the Eddamazine station (Supplementary Materials, Table S3).

4. Discussion

4.1. Climate Variability

The CRU data used in this study are from a high-resolution, quality-controlled dataset derived from interpolated monthly climate data [25]. However, discontinuities in station data due to the conflict in Sudan and the use of established climatological data to fill gaps may lead to trend artifacts [25]. Despite providing a solid climate evaluation for SSA, CRU data’s interpolation and potential underestimation pose challenges for direct application in climate service projects. Therefore, integrating in situ climate information is crucial for effective climate services. The Trans-African Hydro-Meteorological Observatory project aims to deploy 20,000 weather stations across SSA, enhancing climate service initiatives [52]. Digital technologies for real-time weather monitoring can improve decision-making and agricultural productivity [7]. Where local observations are unavailable, CRU TS datasets remain a viable option.
The results indicate significant changes in rainfall, temperature, PET, and soil moisture in SSA, especially in Sudan. Some findings differed from regional studies, highlighting the impact of local conditions and introducing uncertainty. Incorporating this uncertainty can enhance regional climate models, necessitating bias correction even in advanced models [1]. Climate variability and change are expected to negatively impact agriculture, food security, and economic stability in SSA, with reduced suitable areas for agriculture, shorter growing seasons and lower yields [6]. Our findings suggest a shift in Sudan’s climate regime, with increased winter rainfall affecting traditional summer crops like sorghum, groundnuts, and cotton. This change underscores the need to consider altered rainfall patterns in agricultural planning across SSA.
Soil moisture is crucial in regulating the interactions between land and the atmosphere. Nevertheless, the spatial and temporal variability in soil moisture content poses significant challenges for studies on water balance and climate variability [53]. This issue is reflected in the weak correlation observed between actual and predicted soil moisture datasets (CPC datasets). The observed discrepancies highlight the importance of validating and calibrating hydrological models with local data to improve their accuracy. For effective water resource management and agricultural planning in semi-arid regions, it is crucial to have reliable soil moisture estimates. Therefore, integrating in situ measurements, such as those provided by Mohamed et al. [34], with model simulations can enhance the understanding of soil moisture dynamics and inform better decision-making. Additionally, the acquisition of soil moisture data through remote sensing techniques presents a valuable opportunity to address this challenge; however, further research is still required.
There is still significant uncertainty in estimating potential evapotranspiration (PET) [27]. The one-layer hydrological model in this research utilizes the adjusted Thornthwaite model, which Pereira and Pruitt [28] found to perform better than the Penman–Monteith (PM) model in arid regions. However, Nooni et al. [54] noted discrepancies in drought severity characterization in SSA due to different PET measurement methods. Thus, the country-wide reduction in AET by 28 mm should be interpreted with caution. Despite these uncertainties, the identified decreasing trend in AET remains plausible and warrants further consideration.
The findings of this study revealed a significant rise in temperature, which is expected to have considerable hydrological consequences, particularly regarding the supply and demand for water resources. The bagging machine learning algorithm used in this study indicates that the rise in potential evapotranspiration (PET) can be directly attributed to the increased temperatures. This situation will have a direct impact on interconnected sectors, such as energy. In Sudan, the majority of irrigation systems depend on dual-purpose dams that serve both irrigation and hydropower generation. During periods of water scarcity, these facilities prioritize hydropower production due to its higher financial returns. This prioritization leads to a reduction in water availability for irrigation, consequently reducing crop yields and exacerbating food security issues. This scenario negatively affects the efficiency of large irrigation schemes, which already exhibit suboptimal performance in Sub-Saharan Africa (SSA) [55]. For instance, the poor performance of the Gezira scheme in Sudan, the largest irrigation scheme worldwide (0.88 million ha), is attributed to the mismanagement of irrigation water [1]. The interplay between rising temperatures, increased PET, and the prioritization of hydropower over irrigation highlights the need for comprehensive water resource management strategies. These strategies should aim to balance the competing demands of different sectors to ensure sustainable agricultural productivity and energy generation.
The finding that actual water use (AET) in Sudan remains 28 mm per year higher than the annual received rainfall emphasizes the reliance on irrigation to compensate for insufficient rainfall. Irrigation represents the predominant consumer of water resources in SSA, encompassing an area exceeding 6 million hectares, mha [56]. The misuse of irrigation water will ultimately end with the excessive use of irrigation water in SSA exacerbating the depletion of vital water resources, including aquifers and river systems, e.g., the Nubian aquifer in Sudan has experienced significant storage depletion. Shamseddin [1] highlighted significant water mismanagement within the Gezira scheme (0.88 mha), leading to poor performance outcomes. According to You [56], around 1 mha hectares across SSA require urgent rehabilitation, with Sudan being particularly disadvantaged; over 60% of its 1.9 mha of irrigation-equipped land is in urgent need of rehabilitation. Given the persistent negative water balance, irrigation will continue to be crucial for maintaining agricultural productivity in Sudan and SSA. Shamseddin [1] reviewed the plans to expand irrigation areas in the Eastern Nile basin, which will lead to crop water requirements amounting to 50 km3. This water volume is nearly equivalent to the annual discharge of the Blue Nile.
Rainfed agriculture is crucial for ensuring food security and generating income in Sub-Saharan Africa (SSA). The region is particularly susceptible to the adverse effects of climate change due to its heavy dependence on rainfed agricultural systems [6]. Our research indicates that, although there has been an increase in rainfall in several areas, there are increased aridity and significant alterations in climatic zones, as indicated by the TMI. This suggests that the land climatologically suitable for rainfed agriculture is likely to diminish considerably. Consequently, there will be a marked increase in the reliance on irrigation. Such a shift could have profound implications for regional stability, especially in areas where irrigation resources are transboundary, as seen in the current tension among Ethiopia, Sudan, and Egypt due to the construction of the Greater Ethiopian Renaissance Dam.
The exceptional TMI value in 2020 not only highlights the intensity of the flood event but also emphasizes the importance of continuous monitoring and analysis of climatic data. By doing so, decision-makers/stakeholders can better understand and anticipate the impacts of such extreme events, ultimately enhancing the resilience and preparedness of affected communities.
The necessity for adaptation to climate variability has become increasingly critical in SSA. Yesuf et al. [57] determined that climate change and the implementation of adaptation strategies significantly influence agricultural productivity in Ethiopia. Machine learning algorithms, such as bagging, enhance our comprehension of the underlying causes of climate variability and change, thereby facilitating appropriate adaptation measures. According to Kusangaya et al. [58], the region’s limited adaptive capacity, pervasive poverty, and insufficient technological adoption intensify vulnerability to climate variability and change in SSA. Brullo et al. [59] documented that the understanding of climate change adaptation practices is gradually evolving from an emphasis on barriers and limitations to a focus on the factors that facilitate adaptation. They also noted that certain elements consistently emerge as more critical than others, such as financial resources, awareness of climate-related risks and responses, effective leadership, social capital (both bridging and bonding), and the backing of higher-level institutions. All these factors should, therefore, be well assessed and understood. The subsequent section outlines the developmental implications of adapting to climate variability, drawing on the findings of this research.

4.2. Climate Services

Climate is a critical determinant of food security and economic stability in Sudan, SSA. The findings of this research indicate significant alterations in temperature and precipitation patterns, accompanied by a significant depletion in actual water use and a serious transition toward more arid climatic zones. Consequently, global warming is anticipated to have severe repercussions for Sudan. Shamseddin [60] highlighted that the cultivation of wheat in central Sudan is becoming increasingly untenable due to rising air temperatures, which will expedite the accumulation of growing degree days. Furthermore, Mangani et al. [61] observed that lower temperatures correlate well with higher yields of grass dry matter. While increased actual evapotranspiration is associated with a slower rise in air temperature, air temperature itself remains a crucial element influencing climate variability in Sudan, as indicated by the TMI. In this context, rainwater harvesting emerges as a vital strategy for mitigating and adapting to climate change in Sudan, i.e., availing more water, increasing AET, increasing plant yields, and in the long-term, decreasing the increasing rate in temperature. However, rainwater harvesting effectiveness is limited and insufficient to fully address the observed decline in soil moisture. To enhance this approach, it is essential to implement a variety of temperature adaptation strategies, which may include transforming agricultural practices into integrated systems, such as agroforestry [62], as well as engaging in crop breeding and adopting straightforward on-farm techniques, like mulching [63]. Legally, rainfed farms are required to allocate 10% of their land to forestation in Sudan; enforcing this regulation could significantly benefit the environment and, consequently, agricultural productivity, thereby promoting sustainable intensification. Wanderley et al. [64] modeled that a 25% increase in non-forest areas leads to a temperature rise of 1 °C. Zeratsion et al. [65] indicated that smallholder farmers in Ethiopia are actively adapting to the effects of climate change under semi-arid conditions by implementing strategic modifications in the selection of crop varieties, livestock breeds, and tree species.

4.2.1. Runoff Management in SSA

Sub-Saharan Africa (SSA) is acknowledged as a region that has historically faced significant climate variability issues, especially repeated episodes of drought. This variability presents serious challenges to achieving sustainable development goals (SDGs), particularly those aimed at eradicating hunger and poverty. Additionally, the region is characterized by a rapidly growing population; according to World Bank data, the population in SSA has surged from approximately 228 million in 1960 to around 1.3 billion in 2023. Fjelde and von Uexkull [66] documented that the considerable declines in rainfall have been associated with a heightened risk of communal conflict in SSA. Accordingly, low-cost techniques that sustain water supply, like rainwater harvesting, have gained considerable traction in SSA [34,67].
The practice of rainwater harvesting can be traced back to 560 BC [68]. Rainwater harvesting (RWH) technologies can be classified into two main categories in SSA: micro and macro systems. Microsystems simply enhance the infiltration of rainwater within the same cultivated area through techniques such as ridging, terracing, mulching, contouring, and Zai. In contrast, macro systems focus on increasing infiltrated water by capturing runoff from areas outside the cultivated land, utilizing methods such as spreading dams, check dams, and Haffirs.
Both RWH systems support vegetation cover, forestation, and crop production [69]. While there is a debate on the precipitation–forest link, recently, the focus has shifted away from this contentious relationship. Instead, there is now an emphasis on prioritizing the hydrological and climate-moderating benefits provided by trees and forests. This perspective treats forests as “biotic pumps” that enhance the overall water balance within a given region [70]. On the other hand, deforestation on a large scale significantly impacts water availability by directly influencing runoff generation and through indirect mechanisms related to forest–climate interactions [71]. These indirect effects, which are prevalent in over 63% of deforested regions, result from diminished precipitation and heightened potential evapotranspiration. This complexity in runoff responses underscores the importance of comprehending the interactions between forests and climate [71]. On the other hand, RWH practices have a crucial role in the preservation of soil quality. Tefera et al. [72] indicated that in situ RWH systems enhance soil moisture retention by 59% while simultaneously decreasing runoff by 53% and soil erosion by 58.66%. These findings underscore the significant advantages of such practices for water and soil conservation in SSA. In addition, rainwater harvesting, by altering soil moisture regimes, has the potential to drive changes in land use and land cover, which in turn have profoundly impacted regional climate patterns globally. Simulations indicate that irrigation practices may suppress rainfall in the Gezira Scheme of Sudan. This phenomenon occurs as irrigation leads to a reduction in surface air temperature, resulting in atmospheric subsidence over the areas that are irrigated [73]; likewise, the intensification of RWH projects within a given area will probably introduce similar impacts. However, further studies are required.
Figure 7 indicates that rainwater harvesting could significantly improve crop yields in semi-arid environments by providing increased soil moisture for plants, especially during dry-spell events (frequent days with less than 1 mm of rainfall). The findings by Chiturike et al. [74] indicated that agricultural fields utilizing rainwater harvesting techniques produced greater yields than those employing conventional contour farming methods. Specifically, the average yields of maize were about 2200 kg for tied contours and 1800 kg for infiltration pits, representing increases of 88% and 52% over the standard contour yield of 1200 kg, respectively [74].
However, the rate of adoption of rainwater harvesting practices, particularly in the agricultural sector, remains relatively low in SSA [33]. Bessah et al. [75] documented that only 38% of maize farmers engage in rainwater harvesting in Ghana; also, gender, education, farm size, experience, and accessibility to weather information are the main determinants of adopting rainwater harvesting. For instance, older farmers, those with restricted access to extension services and weather information exhibit a reduced likelihood of utilizing rainwater for maize cultivation in Ghana. The examination of datasets collected from 148 farmers in the Darfur region revealed that larger family sizes, specifically those exceeding nine members, coupled with higher educational attainment, serve to alleviate the negative impacts of illiteracy and the increased distance to agricultural land. Furthermore, the careful selection of optimal rainwater harvesting techniques is crucial, as practices such as terracing, along with a combined strategy of terracing, mulching, and deep tillage, have been identified as particularly labor-intensive and unsustainable, especially when the distance to the farm surpasses five kilometers in Darfur. Aligned with this finding, Nonvide [76] argued that tree planting and the adoption of improved varieties are the single adaptation strategies that enhance the yield of smallholder farmers in Benin. Nevertheless, when these strategies are implemented alongside others, the impact of tree planting diminishes, whereas the benefits of using improved varieties are amplified [76].
Nzeyimana et al. [76] employed transformation theory to identify the primary factors influencing improved water management, which is essential for fostering effective drought resilience in SSA. This transformation requires the establishment of adequate preconditions across practical, political, and personal domains. While significant progress has been achieved in the practical domain, the political domain has seen only moderate advancements, and the personal domain has experienced the least development. Engaging local stakeholders and empowering smallholder farmers are regarded as vital elements in this transformative process within SSA [77]. Barry et al. [78] asserted that the effective out-scaling of rainwater harvesting technologies, e.g., Zai, within the Sahelian region of West Africa ought to be grounded in the principles and methodologies of adult tutoring, experimentation led by farmers, peer-to-peer extension communication among farmers, and the management of local organizations.

4.2.2. Agroforestry

Food security in SSA is significantly reliant on the prevailing climatic conditions. Under limited water availability, enhancing crop yields continues to pose a challenge, often addressed in SSA by expanding cultivated land at the expense of native vegetation, especially forested areas. The implementation of agroforestry systems (alley cropping, forest farming, etc.) presents a viable and sustainable approach to reconcile the competing demands of food security and climate mitigation in SSA. The agricultural and eco-friendly benefits of agroforestry systems have been largely documented worldwide [79]. Additionally, these systems sustain agricultural inputs through the commercialization of agroforest-derived products, such as timber and honey, which contribute positively to increasing crop yields.
Agroforestry is technically defined as “the integration of trees into an agricultural landscape” [80]. Consequently, agroforestry systems play a crucial role in enhancing climatic conditions in SSA, particularly by providing shade through planted trees, which mitigates the high surface temperatures prevalent in the region. This integration of trees into agricultural landscapes improves the interaction between water and vegetation, leading to better nutrient availability and absorption [81], and ultimately resulting in increased yields of cultivated crops and planted fruits.
Quandt et al. [80] argued that the implementation of agroforestry in Kenya has significantly bolstered livelihood resilience by offering essential benefits such as shade and fruit production. Farmers engaged in agroforestry have experienced advantages over those who do not practice it, with both on-farm and off-farm diversification contributing to improved livelihood capitals. In Ethiopia, indigenous agroforestry has been ranked as the third most preferred strategy for climate change adaptation among smallholder farmers under semi-arid conditions. This practice not only provides wood and livestock fodder but also sustains essential ecosystem services, particularly during climate-related disturbances, thereby alleviating pressure on nearby natural forests [65]. Agroforestry systems have been shown to positively impact crop yields, household income, and the overall capacity to adapt to climate change. Notably, these systems contribute significantly to rural household incomes, accounting for approximately 34% of various agroecological zones across Ethiopia [65].
However, the adoption rate of agroforestry systems is still behind the potential in SSA. Tranchina et al. [82] identified 31 obstacles facing the adoption of agroforestry worldwide, aggregated into agronomic–technical, policy, and socioeconomic perspectives. Kpoviwanou et al. [83] highlighted several significant obstacles confronting agroforestry systems in Africa, including pest infestations, land access issues, insufficient knowledge and skills, inadequate financial resources, and a scarcity of certified seeds. To enhance the uptake of agroforestry technologies across the continent, it is essential to implement these technologies with a focus on the local context, the unique requirements of farmers, and the prevailing socio-economic conditions. Initiatives should encompass comprehensive training and educational programs, accessible financial options, suitable land tenure reforms, and efficient support systems for seed access and integrated pest management [83]. In their analysis of 86 peer-reviewed articles on agroforestry in Sub-Saharan Africa, Muthee et al. [84] asserted that a significant portion of these studies, accounting for 36%, are characterized as undefined in nature. They observed that the nature of agroforestry research has evolved moderately over time, with journal articles representing the predominant study type at 59%. Additionally, the majority of these studies, approximately 57%, are classified as scientific. The findings further indicated that income generation emerged as the primary provisioning service at 31%, while greenhouse gas emission reduction was identified as the principal regulatory service, also at 31%. Soil fertility management was recognized as an essential support service. Accordingly, the potential of agroforestry systems (research for development and practical domains alike) has not been fully attained in SSA.
Grovemann et al. [85] indicated that access to extension services and participation in training programs enhance awareness regarding agroforestry-based soil fertility management in SSA. Furthermore, information disseminated by public extension services, non-governmental organizations, and community members is significantly linked to increased levels of adoption intensity [85]. However, Duffy et al. [86] asserted the effectiveness of traditional extension methods like nongovernmental organizations’ trainers and farmer associations in enhancing the knowledge of agroforestry among both male and female farmers with a remarkable disparity in knowledge gains, with female farmers benefiting less from these initiatives. The involvement of lead farmers, who are key community members trained to educate others, significantly improves the knowledge acquisition of female farmers. Nonetheless, the potential impact of lead farmers is hindered by their limited mobility and availability. Duffy et al. [86] suggested a need for innovative agroforestry approaches, e.g., climate-smart agriculture extension, that take into account the unique needs and preferences of female farmers. The research emphasizes that excluding women from the design phase of agroforestry programs can lead to missed opportunities for addressing societal challenges, resulting in nominal participation and uneven outcomes among farmers. This underscores the importance of inclusive practices in agricultural extension to ensure equitable benefits for all participants.

4.2.3. Filling Technical and Reliable Data Gaps

The expanded notion of sustainable climate services encompasses risk management, which depends on having reliable climate information [24]. Climate variability, especially drought, is a main challenge in SSA. The operational assessment of drought involves various dimensions, utilizing a range of indices and products, including the standardized precipitation index (SPI), precipitation anomalies (PA) and the Standardized Precipitation and Evapotranspiration Index (SPEI). These instruments are commonly used in national and regional platforms to monitor both short-term aridity and extended drought situations [87].
The role of soil in the interactions between the atmospheric boundary layer and land surface is of paramount importance. Alterations in soil characteristics can introduce variability into these interactions. McCabe and Wolock [88] indicated that temperature and precipitation under doubled CO2 conditions will cause the Thornthwaite moisture index to decrease, implying significantly drier conditions. The effects of atmospheric boundary layer interactions on soil dynamics have often been linked to the temperature–moisture index (TMI), as noted by Karim et al. [29]. Furthermore, Marshall et al. [31] identified that the discrepancies observed among AET, precipitation, and PET in SSA can be attributed to temperature–moisture feedback mechanisms, particularly in regions exhibiting elevated AET levels. Drought is inherently a stochastic event that is directly affected by the interplay between water supply, primarily through rainfall, and water demand, as represented by evapotranspiration (ET). The temperature moisture index (TMI) serves as an important metric for assessing the balance between water supply and demand in a specific region [88]. Consequently, the TMI is recognized as a significant indicator of drought conditions.
Lamptey et al. [89] identified several primary challenges that hinder the establishment of an effective early warning system in Africa, including scientific gaps, deficiencies in data and access, forecasting inadequacies, the need for capacity building, and issues related to knowledge management and communication. The TMI model developed in this context is instrumental to improving an efficient climate service early warning system, facilitating timely interventions and informed decision-making, particularly as climate conditions have a profound impact on food security in Sub-Saharan Africa (SSA). The TMI estimation incorporates several critical climatic variables, such as actual and potential evapotranspiration, precipitation, runoff, and soil moisture, among others (Equations (4)–(14)). The real-time accessibility of these datasets in Sub-Saharan Africa is notably constrained. Nevertheless, the Trans-African Hydro-Meteorological Observatory initiative, along with advancements in remote sensing technologies, presents significant opportunities.

5. Conclusions

This research employed the bagging machine learning algorithm to analyze climate variability in Sudan, a country located in Sub-Saharan Africa. Additionally, the study applied the Thornthwaite moisture index (TMI) to predict drought conditions, based on routinely measured climatic variables, e.g., rainfall and air temperature. The findings derived from both the bagging method and the TMI facilitate the adoption of sustainable evidence-based adaptation actions within the broader framework of climate services. This study reveals significant changes in temperature, rainfall, potential evapotranspiration (PET, and soil moisture in Sub-Saharan Africa (SSA), particularly in Sudan. Despite the quality of CRU data, data discontinuities and interpolation artifacts highlight the need for in situ measurements to improve hydrological models. Rising temperatures directly increase PET, and strain water resources, thus worsening food insecurity. This study underscores the necessity of efficient water use and adaptive strategies to mitigate these impacts. The shift in rainfall patterns and decreased actual evapotranspiration (AET) call for adaptive agricultural planning. The exceptional TMI value in 2020 emphasizes the importance of continuous climate monitoring for preparedness and resilience. Overall, the integration of advanced modeling, in situ data, and innovative technologies is essential for building an effective climate service in SSA. The significant correlations among actual water use, rainfall, and runoff signify the importance of effective water management strategies, such as rainwater harvesting, to adapt and mitigate the adverse impacts of climate variability and change. As the majority (60%) of climate variability can be attributed to fluctuations in temperature metrics, including minimum, maximum, mean, and diurnal range, the adoption of temperature adaptation strategies, such as agroforestry, plant breeding, and greenhouse technology, is essential. This study highlights the urgent need for more in-depth research into the factors contributing to climate variability, utilizing finer datasets, such as those with daily and seasonal resolutions. This calls for improving the routine measurements of local climate datasets, including the soil moisture content.

Supplementary Materials

The following supporting information can be downloaded at: https://www.mdpi.com/article/10.3390/cli12120206/s1, Table S1: Trends in selected climatic element in Sudan, based on Theil–Sen slope (1960–2020). P stands for rainfall, T for air temperature, R for runoff, VP for vapor pressure, PET for potential evapotranspiration, TMI for Thornthwaite moisture index, AET for actual evapotranspiration. Figures in bold indicate significant changes (p = 0.05). Table S2. Annual means of selected climatic variables, Sudan (1960–2020). Min T and Max T stand for minimum and maximum temperature, respectively, Vp for vapor pressure, AET for actual evapotranspiration, PET for potential evapotranspiration, TMI for Thornthwaite moisture index. Table S3. The contribution of climatic variables (expressed as %) to the annual variability of the Thornthwaite moisture index at selected meteorological stations in Sudan (1960–2020), based on the bagging machine learning algorithm. For instance, the maximum air temperature is the most significant climatic variable in explaining the annual variability in the TMI at Port Sudan station, as 28% of it can be explained by the variability in the maximum temperature, followed by that in the mean temperature. P stands for rainfall, T for air temperature, D for diurnal range of air temperature, VP for vapor pressure, PET for potential evapotranspiration, and RMSE for root mean square error. Bold figures indicate the most important variable at each station.

Author Contributions

Conceptualization, S.M.A. and H.A.D.; methodology, all the authors; software and analysis, S.M.A. and K.G.B.T.; validation A.E.A. and A.A.E.; writing—original draft preparation, S.M.A. and H.A.D.; writing—review and editing, all the authors. All authors have read and agreed to the published version of the manuscript.

Funding

This research did not receive any specific grant from funding agencies in the public, commercial, or not-for-profit sectors.

Data Availability Statement

The original data presented in the study are openly available in (https://crudata.uea.ac.uk/cru/data/) and (https://iridl.ldeo.columbia.edu/SOURCES/.NOAA/.NCEP/.CPC/) (accessed on 22 November 2024). The generated dataset will be available upon request.

Conflicts of Interest

The authors declare no conflicts of interest.

References

  1. Shamseddin, M.A. Impacts of drought, food security policy and Climate change on performance of irrigation schemes in Sub-Saharan Africa: The case of Sudan. Agric. Water Manag. 2020, 232, 106064. [Google Scholar] [CrossRef]
  2. Ayansina, A.; Abimbola, O.; Oluwatoyin, S.; Marion, B.; Harald, S.; Patrick, S.; Margaret, O.; Lemlem, F.; Adefunke, F. Extreme climate events in sub-Saharan Africa: A call for improving agricultural technology transfer to enhance adaptive capacity. Clim. Serv. 2022, 27, 100311. [Google Scholar] [CrossRef]
  3. Ekolu, J.; Bastien, D.; Moussa, S.; Jonathan, M.; Yves, T.; Gabriele, V.; Dhais, P.; Gil, M.; Jean-Emmanuel, P.; Charles, O.; et al. Long-term variability in hydrological droughts and floods in sub-Saharan Africa: New perspectives from a 65-year daily streamflow dataset. J. Hydrol. 2022, 613, 128359. [Google Scholar] [CrossRef]
  4. Ekolu, J.; Bastien, D.; Yves, T.; Gabriele, V.; Louise, J.; Gil, M.; Jean-Emmanuel, P.; Jonathan, M.; Simon, M.; Moussa, S.; et al. Variability in flood frequency in sub-Saharan Africa: The role of large-scale climate modes of variability and their future impacts. J. Hydrol. 2024, 640, 131679. [Google Scholar] [CrossRef]
  5. Lefe, Y.; Peter, A.; Aloysius, M.; Jonah, K.; Rejoice, R. Does climate variability matter in achieving food security in Sub-Saharan Africa? Environ. Chall. 2024, 15, 100870. [Google Scholar] [CrossRef]
  6. Omotoso, A.; Simon, L.; Kehinde, O.; Christopher, S.; Abiodun, O. Climate change and variability in sub-Saharan Africa: A systematic review of trends and impacts on agriculture. J. Clean. Prod. 2023, 414, 137487. [Google Scholar] [CrossRef]
  7. Zenda, M.; Rudolph, M.; Harley, C. The Impact of Climate Variability on the Livelihoods of Smallholder Farmers in an Agricultural Village in the Wider Belfast Area, Mpumalanga Province, South Africa. Atmosphere 2024, 15, 1353. [Google Scholar] [CrossRef]
  8. Shamseddin, M.A.; Elbushra, A.A.; Ahmed, A.E.; Elmesski, A.; Osman, K. Climate variability impacts on crop yields and agriculture contributions to gross domestic products in the Nile basin (1961–2016): What did deep machine learning algorithms tell us? Theor. Appl. Clim. 2024, 155, 3951–3968. [Google Scholar] [CrossRef]
  9. Lu, T.; Wenmin, Z.; Christin, A.; Stéphanie, H.; Martin, B.; Ke, H.; Rasmus, F. Changes in vegetation-water response in the Sahel-Sudan during recent decades. J. Hydrol. Reg. Stud. 2024, 52, 101672. [Google Scholar] [CrossRef] [PubMed]
  10. Tefera, A.S.; Siyum, Z.G.; Berhe, D.H.; Gebru, B. Impact of climate variability and environmental policies on vegetation dynamics in the semi-arid Tigray. Discov. Environ. 2024, 2, 6. [Google Scholar] [CrossRef]
  11. IPCC. Climate Change 2022: Impacts, Adaptation, and Vulnerability; Contribution of Working Group II to the Sixth Assessment Report of the Intergovernmental Panel on Climate Change; Pörtner, H.-O., Roberts, D.C., Tignor, M., Poloczanska, E.S., Mintenbeck, K., Alegría, A., Craig, M., Langsdorf, S., Löschke, S., Möller, V., et al., Eds.; Cambridge University Press: Cambridge, UK; New York, NY, USA, 2022; 3056p. [Google Scholar] [CrossRef]
  12. Bhaga, T.; Dube, T.; Shekede, M.D.; Shoko, C. Impacts of Climate Variability and Drought on Surface Water Resources in Sub-Saharan Africa Using Remote Sensing: A Review. Remote Sens. 2020, 12, 4184. [Google Scholar] [CrossRef]
  13. WMO. State of the Climate in Africa 2020 WMO-No 1275; World Meteorological Organization: Geneva, Switzerland, 2021; Available online: https://library.wmo.int/idurl/4/57682 (accessed on 26 November 2024).
  14. Shen, C.; Chen, X.; Laloy, E. Editorial: Broadening the Use of Machine Learning in Hydrology. Front. Water 2021, 3. [Google Scholar] [CrossRef]
  15. Molina, M.; O’Brian, T.; Anderson, G.; Ashfaq, M.; Bennett, K.; Collins, W.; Dagon, K.; Juan, M.; Ullrich, P. A Review of Recent and Emerging Machine Learning Applications for Climate Variability and Weather Phenomena. Artif. Intell. Earth Syst. 2023, 2. [Google Scholar] [CrossRef]
  16. Lalika, C.; Aziz, M.; Mturi, J.; Makarius, C. Machine learning algorithms for the prediction of drought conditions in the Wami River sub-catchment, Tanzania. J. Hydrol. Reg. Stud. 2024, 53, 101794. [Google Scholar] [CrossRef]
  17. Zhao, Y.; Zhang, J.; Bai, Y.; Zhang, S.; Yang, S.; Henchiri, M.; Seka, A.M.; Nanzad, L. Drought Monitoring and Performance Evaluation Based on Machine Learning Fusion of Multi-Source Remote Sensing Drought Factors. Remote Sens. 2022, 14, 6398. [Google Scholar] [CrossRef]
  18. Mosaffa, H.; Mojtaba, S.; Iman, M.; Mojtaba, N.; Jahromi, H. Application of machine learning algorithms in hydrology. In Computers in Earth and Environmental Sciences; Elsevier: Amsterdam, The Netherlands, 2022; pp. 585–591. [Google Scholar] [CrossRef]
  19. Kim, Y.-T.; Yu, J.-U.; Kim, T.-W.; Kwon, H.-H. A novel approach to a multi-model ensemble for climate change models: Perspectives on the representation of natural variability and historical and future climate. Weather Clim. Extrem. 2024, 44, 100688. [Google Scholar] [CrossRef]
  20. Altman, N.; Krzywinski, M. Ensemble methods: Bagging and random forests. Nat. Methods 2017, 14, 933–934. [Google Scholar] [CrossRef]
  21. Leng, G.; Hall, J. Predicting spatial and temporal variability in crop yields: An inter-comparison of machine learning, regression and process-based models. Environ. Res. Lett. 2020, 15, 044027. [Google Scholar] [CrossRef] [PubMed]
  22. Frohlich, C. Water: Reason for Conflict or Catalyst for Peace? The Case of the Middle East. Dans L’Europe en Formation 2012/3 (n° 365). Eur. Form. 2012, 3, 139–161. [Google Scholar] [CrossRef]
  23. Bromwich, B. Nexus meets crisis: A review of conflict, natural resources and the humanitarian response in Darfur with reference to the water–energy–food nexus. Int. J. Water Res. Dev. 2015, 31, 375–392. [Google Scholar] [CrossRef]
  24. Jacobs, K.; Street, R. The next generation of climate services. Clim. Serv. 2020, 20, 100199. [Google Scholar] [CrossRef]
  25. Harris, I.; Osborn, T.; Jones, P.; Lister, D. Version 4 of the CRU TS monthly high-resolution gridded multivariate climate dataset. Sci. Data 2020, 7, 109. [Google Scholar] [CrossRef]
  26. Huang, J.; Dool, H.; Georgarakos, K. Analysis of Model-Calculated Soil Moisture over the United States (1931–1993) and Applications to Long-Range Temperature Forecasts. J. Clim. 1996, 9, 1350–1362. [Google Scholar] [CrossRef]
  27. Sha, Z.; Yu, B. Physical basis of the potential evapotranspiration and its estimation over land. J. Hydrol. 2024, 641, 131825. [Google Scholar] [CrossRef]
  28. Pereira, A.R.; Pruitt, W.O. Adaptation of the Thornthwaite scheme for estimating daily reference evapotranspiration. Agric. Water Manag. 2004, 66, 251–257. [Google Scholar] [CrossRef]
  29. Karim, M.; Bikash, D.; Md Mizanur, R.; Nguyen, H. Thornthwaite moisture index and depth of suction change under current and future climate—An Australian study. J. Rock Mech. Geotech. Eng. 2024, 16, 1761–1775. [Google Scholar] [CrossRef]
  30. Karunarathne, A.; Gad, E.; Disfani, M.; Sivagnanasundram, S.; Wilson, J. Review of calculation procedures of Thornthwaite moisture index and its impact on footing design. Aust. Geomech. 2016, 51, 85–95. [Google Scholar]
  31. Marshall, M.; Funk, C.; Michaelsen, J. Examining evapotranspiration trends in Africa. Clim. Dyn. 2012, 38, 1849–1865. [Google Scholar] [CrossRef]
  32. González, S.; Salvador, G.; Javier, D.; Lior, R.; Francisco, H. A practical tutorial on bagging and boosting based ensembles for machine learning: Algorithms, software tools, performance study, practical perspectives and opportunities. Inf. Fusion 2020, 64, 205–237. [Google Scholar] [CrossRef]
  33. Fan, Y.; Dool, H. Climate Prediction Center global monthly soil moisture data set at 05° resolution for 1948 to present. J. Geophys. Res. Atmos. 2004, 109. [Google Scholar] [CrossRef]
  34. Mohamed, I.H.; Shamseddin, M.A.; Adil, D.M. Rainfed-based production of Megathyrsus maximus in sub-Saharan Africa: The case of the semi-arid environment of Sudan African. J. Range Forage Sci. 2022, 40, 247–256. [Google Scholar] [CrossRef]
  35. Starr, M.; Alam, S.A. Water balance of the Sudanese savannah woodland region. Hydrol. Sci. J. 2015, 60, 706–722. [Google Scholar] [CrossRef]
  36. Palmer, P.I.; Wainwright, C.M.; Dong, B.; Maidment, R.; Wheeler, K.; Gedney, N.; Hickman, J.; Madani, N.; Folwell, S.; Abdo, G.; et al. Drivers and impacts of Eastern African rainfall variability. Nat. Rev. Earth Environ. 2023, 4, 254–270. [Google Scholar] [CrossRef]
  37. Babaousmail, H.; Ayugi, B.O.; Onyutha, C.; Kebacho, L.L.; Ojara, M.; Ongoma, V. Analysis of Changes in Rainfall Concentration over East Africa. Atmosphere 2023, 14, 1679. [Google Scholar] [CrossRef]
  38. Conway, D.; Persechino, A.; Ardoin-Bardin, S.; Hamandawana, H.; Dieulin, C.; Mahé, G. Rainfall and Water Resources Variability in Sub-Saharan Africa during the Twentieth Century. J. Hydrometeorol. 2009, 10, 41–59. [Google Scholar] [CrossRef]
  39. Kotikot, S.M.; Smithwick, E.; Greatrex, H. Observations of enhanced rainfall variability in Kenya, East Africa. Sci. Rep. 2024, 14, 12915. [Google Scholar] [CrossRef]
  40. Onyutha, C. Trends and variability of temperature and evaporation over the African continent: Relationships with precipitation. Atmósfera 2021, 34, 267–287. [Google Scholar] [CrossRef]
  41. Abiye, O.; Mathew, O.J.; Summonu, L.; Babatunde, O. Potential evapotranspiration trends in West Africa from 1906 to 2015. SN Appl. Sci. 2019, 1, 1434. [Google Scholar] [CrossRef]
  42. Gadallah, N.A.; Taha, I.S.; Hano, A.I.; Siddig, A.; Bo, H. Integrated Approach for Assessment and Monitoring of Forests Conditions in the Drylands of Sudan. Arid. Ecosyst. 2022, 12, 142–153. [Google Scholar] [CrossRef]
  43. Ogou, F.K.; Ojeh, V.N.; Naabil, E.; Mbah, C. Hydro-climatic and Water Availability Changes and its Relationship with NDVI in Northern Sub-Saharan Africa. Earth Syst. Environ. 2022, 6, 681–696. [Google Scholar] [CrossRef]
  44. Kumar, P.; Deka, D.; Yadav, A.; Kumar, M.; Das, J.; Singh, A.; Gurjar, A. Potential and actual evapotranspiration and Landsat derived indices. Glob. J. Environ. Sci. Manag. 2024, 10, 1227–1248. [Google Scholar] [CrossRef]
  45. Mohamed, A.; Alarifi, S.; Abdelrady, A. Sedimentary cover and structural trends affecting the groundwater flow in the Nubian Sandstone Aquifer System: Inferences from geophysical, field and geochemical data. Front. Earth Sci. 2023, 11, 1173569. [Google Scholar] [CrossRef]
  46. Lombe, P.; Elsa, C.; Paulo, R. Drought Dynamics in Sub-Saharan Africa: Impacts and Adaptation Strategies. Sustainability 2024, 16, 9902. [Google Scholar] [CrossRef]
  47. Sylla, M.B.; Elguindi, N.; Giorgi, F.; Wisser, D. Projected robust shift of climate zones over West Africa in response to anthropogenic climate change for the late 21st century. Clim. Change 2016, 134, 241–253. [Google Scholar] [CrossRef]
  48. Eltahir, E.A. A feedback mechanism in annual rainfall, Central Sudan. J. Hydrol. 1989, 110, 323–334. [Google Scholar] [CrossRef]
  49. Reliefweb. The Sudan: 2020 Flood Response Overview. 2020. Available online: https://www.google.com/url?sa=t&source=web&rct=j&opi=89978449&url=https://openknowledge.fao.org/server/api/core/bitstreams/0d0f41e0-ee2d-494c-9fa7-22792ba8b008/content&ved=2ahUKEwjXr5uV04iKAxXcwAIHHR9IAJkQFnoECB0QAQ&usg=AOvVaw3dONOyndD_Tn8VL_Z8ZBjy (accessed on 16 November 2024).
  50. Tambal, S.; Elsawahli, H.; Ibrahim, E.; Lumbroso, D. Increasing urban flood resilience through public participation: A case study of Tuti Island in Khartoum, Sudan. J. Flood Risk Manag. 2024, 17, e12966. [Google Scholar] [CrossRef]
  51. NASA. Record Flooding in Sudan. 2020. Available online: https://earthobservatory.nasa.gov/images/147288/record-flooding-in-sudan (accessed on 16 November 2024).
  52. Schunke, J.; Laux, P.; Bliefernicht, J.; Waongo, M.; Sawadogo, W.; Kunstmann, H. Exploring the Potential of the Cost-Efficient TAHMO Observation Data for Hydro-Meteorological Applications in Sub-Saharan Africa. Water 2021, 13, 3308. [Google Scholar] [CrossRef]
  53. Yang, Y.; Tong, X. Spatial variability and uncertainty associated with soil moisture content using INLA-SPDE combined with PyMC3 probability programming. Sci. Rep. 2024, 14, 23900. [Google Scholar] [CrossRef] [PubMed]
  54. Nooni, I.K.; Hagan, D.F.T.; Wang, G.; Ullah, W.; Li, S.; Lu, J.; Bhatti, A.S.; Shi, X.; Lou, D.; Prempeh, N.A.; et al. Spatiotemporal Characteristics and Trend Analysis of Two Evapotranspiration-Based Drought Products and Their Mechanisms in Sub-Saharan Africa. Remote. Sens. 2021, 13, 533. [Google Scholar] [CrossRef]
  55. Higginbottom, T.P.; Adhikari, R.; Dimova, R.; Redicker, S.; Foster, T. Performance of large-scale irrigation projects in sub-Saharan Africa. Nat. Sustain. 2021, 4, 501–508. [Google Scholar] [CrossRef]
  56. You, L. Africa infrastructure country diagonsitic. In Irrigation Investment Needs in Sub-Saharan Africa; The World Bank: Washington, DC, USA, 2008. [Google Scholar]
  57. Yesuf, M.; Salvatore, D.; Temesgen, D.; Claudia, R.; Gunnar, K. The Impact of Climate Change and Adaptation on Food Production in Low-Income Countries, Evidence from the Nile Basin, Ethiopia, IPFRI—Social Science. 2008. Available online: https://www.ifpri.org/publication/impact-climate-change-and-adaptation-food-production-low-income-countries (accessed on 26 November 2024).
  58. Kusangaya, S.; Michele, L.; Emma, A.; Graham, P. Impacts of climate change on water resources in southern Africa: A review. Phys. Chem. Earth Parts A/B/C 2014, 67–69, 47–54. [Google Scholar] [CrossRef]
  59. Brullo, T.; Barnett, J.; Waters, E.; Boulter, S. The enablers of adaptation: A systematic review. npj Clim. Action 2024, 3, 40. [Google Scholar] [CrossRef]
  60. Shamseddin, M.A. Climatic Change Impacts on Growing Degree Days and Climatologically Suitable Cropping Areas in the Eastern Nile Basin. Agric. Res. 2021, 10, 72–82. [Google Scholar] [CrossRef]
  61. Mangani, T.; Mangani, R.; Chirima, G.; Khomo, L.; Truter, W. Using mulching to reduce soil surface temperature to facilitate grass production. Heliyon 2022, 8, e12284. [Google Scholar] [CrossRef]
  62. Brown, S.; Miller, D.; Ordonez, P.; Baylis, K. Evidence for the impacts of agroforestry on agricultural productivity, ecosystem services, and human well-being in high-income countries: A systematic map protocol. Environ. Evid. 2018, 7, 24. [Google Scholar] [CrossRef]
  63. Iqbal, R.; Raza, M.; Valipour, M.; Saleem, M.; Zaheer, M.; Ahmad, S.; Toleikiene, M.; Haider, I.; Aslam, M.; Nazar, M. Potential agricultural and environmental benefits of mulches—A review. Bull. Natl. Res. Cent. 2020, 44, 75. [Google Scholar] [CrossRef]
  64. Wanderley, N.; Domingues, R.; Joly, C.A. Relationship between land surface temperature and fraction of anthropized area in the Atlantic forest region, Brazil. PLoS ONE 2019, 14, e0225443. [Google Scholar] [CrossRef] [PubMed]
  65. Zeratsion, B.T.; Manaye, A.; Gufi, Y.; Tesfayec, M.; Werku, A.; Anjulo, A. Agroforestry practices for climate change adaptation and livelihood resilience in drylands of Ethiopia. For. Sci. Technol. 2023, 20, 47–57. [Google Scholar] [CrossRef]
  66. Fjelde, H.; von Uexkull, N. Climate triggers: Rainfall anomalies, vulnerability and communal conflict in Sub-Saharan Africa. Political Geogr. 2012, 31, 444–453. [Google Scholar] [CrossRef]
  67. Andrew, T.; Letticia, K.; George, N.; Ronald, M. Evaluating effects of selected water conservation techniques and manure on sorghum yields and rainwater use efficiency in dry region of Zimbabwe. Heliyon 2024, 10, e33032. [Google Scholar] [CrossRef]
  68. Tolossa, T.; Abebe, F.; Girma, A.; Yildiz, F. Review: Rainwater harvesting technology practices and implication of climate change characteristics in Eastern Ethiopia. Cogent Food Agric. 2020, 6, 1724354. [Google Scholar] [CrossRef]
  69. Chipomho, J.; Moreblessing, C.; Makore, F.; Cosmas, P. Rainwater Harvesting Technologies and Soil Moisture Conservation in Marginalised Semi-Arid Soils of Southern Africa. In The Marginal Soils of Africa; Nciizah, A.D., Roopnarain, A., Ndaba, B., Malobane, M.E., Eds.; Springer: Cham, The Netherlands, 2024. [Google Scholar] [CrossRef]
  70. Bennett, B.M.; Barton, G.A. The enduring link between forest cover and rainfall: A historical perspective on science and policy discussions. For. Ecosyst. 2018, 5, 5. [Google Scholar] [CrossRef]
  71. Shuai, M.; Zhou, S.; Yu, B.; Song, J. Deforestation-induced runoff changes dominated by forest-climate. feedbacks. Sci. Adv. 2024, 10, 3964. [Google Scholar] [CrossRef]
  72. Tefera, M.; Giovanna, S.; Alberto, C. Traditional In Situ Water Harvesting Practices and Agricultural Sustainability in Sub-Saharan Africa—A Meta-Analysis. Sustainability 2024, 16, 6427. [Google Scholar] [CrossRef]
  73. Alter, R.; Im, E.S.; Eltahir, E. Rainfall consistently enhanced around the Gezira Scheme in East Africa due to irrigation. Nat. Geosci. 2015, 8, 763–767. [Google Scholar] [CrossRef]
  74. Chiturike, P.; Gotosa, J.; Nyakudya, W.; Madamombe, S.; Mandumbu, R.; Chirinda, N.; Kugedera, A.; Nyamadzawo, G. The effects of contour-based rainwater harvesting and integrated nutrient management on maize yields in semi-arid regions of Zimbabwe. CABI Agric. Biosci. 2024, 5, 41. [Google Scholar] [CrossRef]
  75. Bessah, E.; Donkor, E.; Raji, A.; Taiwo, O.; Ololade, O.; Strapasson, A.; Amponsah, S.; Agodzo, S. Factors affecting farmers’ decision to harvest rainwater for maize production in Ghana. Front. Water 2022, 4, 966966. [Google Scholar] [CrossRef]
  76. Nonvide, G. Exploring combined adaptation strategies to improve crop yield and smallholder farmers’ welfare. Clim. Dev. 2024, 1–13. [Google Scholar] [CrossRef]
  77. Nzeyimana, L.; Åsa, D.; Lotta, A.; Gyberg, V. Success and failure factors for increasing Sub-Saharan African smallholders’ resilience to drought through water management. Int. J. Water Resour. Dev. 2021, 39, 273–293. [Google Scholar] [CrossRef]
  78. Barry, B.; Olaleye, A.; Zougmoré, R.; Fatondji, D. Rainwater Harvesting Technologies in the Sahelian Zone of West Africa and the Potential for Outscaling; International Water Management Institute: Colombo, Sri Lanka, 2008; 40p. [Google Scholar]
  79. Ruticumugambi, J.A.; Kaplin, B.; Blondeel, H.; Mukuralinda, A.; Ndoli, A.; Verdoodt, A.; Rutebuka, J.; Imanirareba, E.; Uwizeyimana, V.; Gatesi, J.; et al. Diversity and composition of agroforestry species in two agro-ecological zones of Rwanda. Agrofor. Syst. 2024, 98, 1421–1443. [Google Scholar] [CrossRef]
  80. Quandt, A.; Neufeldt, H.; McCabe, T. Building livelihood resilience: What role does agroforestry play? Clim. Dev. 2018, 11, 485–500. [Google Scholar] [CrossRef]
  81. Octavia, D.; Murniati, S.; Hani, A.; Mindawati, N.; Suratman; Swestiani, D.; Junaedi, A.; Undaharata, N.; Santosa, P.; Wahyuningtyas, R.; et al. Smart agroforestry for sustaining soil fertility and community livelihood. For. Sci. Technol. 2023, 19, 315–328. [Google Scholar] [CrossRef]
  82. Tranchina, M.; Reubens, B.; Frey, M.; Mele, M.; Mantino, A. What challenges impede the adoption of agroforestry practices? A global perspective through a systematic literature review. Agrofor. Syst. 2024, 98, 1817–1837. [Google Scholar] [CrossRef]
  83. Kpoviwanou, M.; Bienvenue, S.; Christine, O. Challenges in adoption and wide use of agroforestry technologies in Africa and pathways for improvement: A systematic review. Trees For. People 2024, 17, 100642. [Google Scholar] [CrossRef]
  84. Muthee, K.; Duguma, L.; Majale, C.; Mucheru-Muna, M.; Wainaina, P.; Minang, P. A quantitative appraisal of selected agroforestry studies in the Sub-Saharan Africa. Heliyon 2022, 8, e10670. [Google Scholar] [CrossRef] [PubMed] [PubMed Central]
  85. Grovermann, C.; Rees, C.; Beye, A.; Wossen, T.; Abdoulaye, T.; Cicek, H. Uptake of agroforestry-based crop management in the semi-arid Sahel—Analysis of joint decisions and adoption determinants. Front. Sustain. Food Syst. 2023, 7. [Google Scholar] [CrossRef]
  86. Duffy, C.; Toth, G.; Cullinan, J.; Murray, U.; Spillane, C. Climate smart agriculture extension: Gender disparities in agroforestry knowledge acquisition. Clim. Dev. 2020, 13, 21–33. [Google Scholar] [CrossRef]
  87. Pavlidis, V.; Mahlatse, K.; Mxolisi, M.; Alexandridis, T.; Cherif, I.; Laneve, G.; Orsi, R.; Kartsios, S.; Chara Karypidou, M.; Sofiadis, I.; et al. A drought monitoring and early warning service for food security in South Africa. Clim. Serv. 2024, 34, 100463. [Google Scholar] [CrossRef]
  88. McCabe, G.J.; Wolock, D.M. Effects of climatic change and climatic variability on the Thornthwaite moisture index in the Delaware River basin. Clim. Change 1992, 20, 143–153. [Google Scholar] [CrossRef]
  89. Lamptey, B.; Sahabi Abed, S.; Gudoshava, M.; Mutemi, J.; Bopape, M.; Adefisan, E.; Igri, M.; Sanda, I.; Ndiaye, O.; Parker, D.; et al. Challenges and ways forward for sustainable weather and climate services in Africa. Nat. Commun. 2024, 15, 2664. [Google Scholar] [CrossRef] [PubMed]
Figure 1. The spatial coverage of climate datasets, showing the studied meteorological stations in Sudan (1960–2020).
Climate 12 00206 g001
Figure 2. This flowchart outlines the systematic steps taken to employ the bagging machine learning algorithm within R software for facilitating the attribution analysis of climate variability in Sudan, SSA.
Climate 12 00206 g002
Figure 3. Trends in selected climatic variables in Sudan, based on the Theil–Sens slope estimator for the period of 1960–2020. (a) Rainfall patterns exhibited both increasing and decreasing trends, varying by station. In contrast, all stations demonstrated consistent increasing trends in the (b) minimum temperature and (c) maximum temperature. (d) Runoff amounts generally showed no change, with only a few stations displaying increasing trends. Both (e) vapor pressure and (f) potential evapotranspiration experienced increasing trends. (g) The actual evapotranspiration (AET) displayed a decreasing trend. (h) The Thornthwaite moisture index (TMI) predominantly showed an increasing trend. The per-station datasets are also presented in the Supplementary Materials, Table S1.
Climate 12 00206 g003
Figure 4. The country-wide average of the Thornthwaite moisture index (TMI) in Sudan (1960–2020). The TMI values fluctuated between −20 and −50, except for the year 2020. The fluctuations observed in the annual TMI values suggest that climate variability is an inherent feature of Sudan’s climate. The year 2020 was exceptional due to heavy rainfall, which resulted in a severe flood.
Climate 12 00206 g004
Figure 5. The developed prediction model of Thornthwaite moisture index, TMI, for the El-Fasher station, Sudan, based on the bagging machine learning algorithm (1960–2020). The general average TMI for the El-Fasher station was −31. This shows that annual rainfall (mm) and vapor pressure, VP (hPa) are the most important variables for predicting the TMI. If the condition is true, go to the left. The probability is presented as percentages. For clarification, if the annual precipitation recorded in the preceding year is below 405 mm, there is a 79% likelihood that the subsequent season will experience arid conditions (as indicated by the left branch of the tree), accompanied by an average TMI of −33.
Climate 12 00206 g005
Figure 6. The importance of the variables in explaining the annual variability in the Thornthwaite moisture index (TMI) in Sudan (1960–2020). Only the average is presented. P stands for rainfall (standard deviations, SD = 237.8 mm), min T for minimum air temperature (SD = 1.6 °C), min T for maximum air temperature (SD = 1.3 °C), mean T for mean air temperature (SD = 1.2 °C), DT for diurnal range of air temperature (SD = 1.4 °C), VP for vapor pressure (SD = 3.3 hPa), and PET for potential evapotranspiration (SD = 16.2 mm). The maximum temperature accounts for approximately 19% of the variability observed in the TMI, with the mean temperature being the second most significant factor. In contrast, the diurnal range of temperature comprises the smallest contribution (8%).
Climate 12 00206 g006
Figure 7. The soil moisture contents measured in fields cultivated with Guinea grass under rainfed semi-arid conditions in Sudan enhanced with rainwater harvesting techniques (RWH). The implementation of in situ RWH, specifically terracing and ridging, resulted in significantly higher soil moisture content when compared to flat zero-tillage plots, which served as the control (control). (a) and (b) stand for the first (2021) and the second seasons (2022), respectively.
Climate 12 00206 g007
Table 1. The coefficients of correlation among the annual means of selected climate variables in Sudan based on Kendall’s tau test during the period of 1960–2020. A correlation coefficient value of 0 indicates no relationship, and 1 indicates a perfect relationship. PET stands for potential evapotranspiration; P for rainfall; Tmin, Tmax, and Tmean for the minimum, maximum, and mean air temperature, respectively; DT for the diurnal range of air temperature; Vp for vapor pressure; TMI for Thornthwaite moisture index; AET for actual evapotranspiration; and R for runoff. The TMI showed poor bivariate relationships with all climatic variables. The bold figures indicate that the correlation is significant (p = 0.05).
VariablePETPTminTmaxDTTmeanVpTMIAETR
PET1.0−0.20.80.900.80.70.0−0.10.2
P−0.21.0−0.2−0.20−0.2−0.20.00.20.1
Tmin0.8−0.21.00.8−0.10.90.90.00.00.2
Tmax0.9−0.20.81.00.10.90.80.0−0.10.2
DT0.00.0−0.10.11.00.0−0.10.1−0.10.0
Tmean0.8−0.20.90.90.01.00.80.0−0.10.2
Vp0.7−0.20.90.8−0.10.81.00.0−0.10.2
TMI0.00.00.00.00.10.00.01.00.00.0
AET−0.10.2−0.1−0.1−0.1−0.1−0.10.01.00.2
R0.20.00.20.20.00.20.20.00.21.0
Disclaimer/Publisher’s Note: The statements, opinions and data contained in all publications are solely those of the individual author(s) and contributor(s) and not of MDPI and/or the editor(s). MDPI and/or the editor(s) disclaim responsibility for any injury to people or property resulting from any ideas, methods, instructions or products referred to in the content.

