Article

Analysis of the Observed Trends in Rainfall and Temperature Patterns in North-Eastern Nigeria

by
Deborah Ishaku
1,2,*,
Emmanuel Tanko Umaru
1,3,
Abel Aderemi Adebayo
4,
Ralf Löwner
5 and
Appollonia Aimiosino Okhimamhe
1,6
1
West African Science Service Centre on Climate Change and Adapted Land Use (WASCAL), Doctoral Research Program on Climate Change and Human Habitat, Federal University of Technology Minna, P.M.B. 065, Minna 920101, Niger State, Nigeria
2
Department of General Studies, Gombe State Polytechnic Bajoga, P.M.B. 0190, Bajoga 762101, Gombe State, Nigeria
3
Department of Urban and Regional Planning, Federal University of Technology, Minna P.M.B. 065, Minna 920101, Niger State, Nigeria
4
Department of Geography, Modibbo Adama University of Technology, P.M.B. 2076, Yola 640231, Adamawa State, Nigeria
5
Department of Landscape Sciences and Geomatics, University of Applied Science, 17033 Neubrandenburg, Germany
6
Department of Geography, Federal University of Technology, Minna P.M.B. 065, Minna 920101, Niger State, Nigeria
*
Author to whom correspondence should be addressed.
Climate 2024, 12(12), 219; https://doi.org/10.3390/cli12120219
Submission received: 6 October 2024 / Revised: 28 October 2024 / Accepted: 13 November 2024 / Published: 11 December 2024

Abstract

:
The present study offers a comprehensive evaluation of the monthly rainfall and temperature patterns across nine stations and fifty-nine points in North-Eastern Nigeria using NASA’s Prediction of Worldwide Energy Resources data, spanning four decades (1981–2021). By employing the Mann–Kendall (MK) test and inverse distance weighting (IDW) interpolation, the researchers effectively detected and visualized trends in climate variables. The MK test results indicate contrasting rainfall trends, with notable decreases in Akko, Billiri, Maiduguri, Numan, and Yola, and increases in Gombe, Abadam, Biu, and Mubi. The trends in the maximum temperature were found to be statistically significant across all stations, showing a consistent increase, whereas the minimum temperature trends exhibited a slight but insignificant decrease. The application of the Theil–Sen slope estimator quantified these trends, providing nuanced insights into the magnitudes of changes in climate variables. The IDW results further corroborate the general trend of decreasing rainfall (z = −0.442), modest increases in the maximum temperature (z = 0.046), and a marginal decline in the minimum temperature (z = −0.005). This study makes an important contribution by advocating for the proactive dissemination of climate information. Given the evident climate shifts, particularly the increasing temperatures and fluctuating rainfall patterns, timely access to such information is crucial to enhancing climate resilience in the region. The rigorous statistical methods applied and the detailed spatial analysis strengthen the validity of these findings, making this study a valuable resource for both researchers and policymakers aiming to address climate variability in North-Eastern Nigeria. These research results may also be useful for understanding the climate variabilities in different parts of the world.

1. Introduction

The 2023 IPCC (Intergovernmental Panel on Climate Change) report emphasizes the urgent need for global cooperation to implement significantly more ambitious climate action plans to mitigate the impacts of climate change. It is imperative to substantially reduce greenhouse gas emissions into the atmosphere. Climatic factor variabilities, such as rainfall and temperature, have been widely empirically documented due to their profound impact on physical and biological systems, agriculture, and human society [1]. Climate change, defined as a long-term shift in global climate patterns, manifests differently across regions, leading to localized effects that can disrupt urban systems, economies, and communities over decades [2]. Consequently, it has become the most debated global issue. Temperature and rainfall are important climatic variables; little variation in these variables affects humans, the economy, and biodiversity, leading to increases in the frequency of erosion, floods, sandstorms, famine, water shortages, and changes in land use and land cover patterns. Rainfall patterns, which fluctuate seasonally and annually, may exhibit a downward or upward trend over time [3].
Recent studies have documented noticeable trends of increasing rainfall in India [4], North America, [5], Vietnam, [6], Delhi, [7], Western Germany [8], and Western Europe [9]. Similarly, many studies have indicated decreasing rainfall trends in the Mediterranean Region [10], Australia [11], Western United States [12], Malaysia, [13], and China [14]. Evidence of increasing temperature has been found in some studies in Europe [15], Eastern Africa [16], the Arctic [17], East Asia [18], and Africa [19]. In Ghana, rainfall is decreasing, while nighttime and daytime temperatures are increasing [20]. A study in Sothern Africa recorded an overall upward trend in annual and seasonal rainfall, except during the winter season, which showed a decreasing trend, with increases during the winter and spring seasons. There were general decreases in the maximum temperatures annually and during summer, autumn, and spring [21]. In India, Panda [22] observed that both the maximum and minimum temperatures exhibited an increasing trend, and the maximum and minimum temperatures during the monsoon season were decreasing. Rainfall showed a significant increasing trend during the JJAS (June to September) season, while the assessment of temperature variability in the Musanza district in Rwanda revealed both increasing maximum and minimum temperatures, indicating continuous warming in the area. There was a general decrease in rainfall, particularly in Nyange, which had a consistent downward trend across all seasons (December–February, September–November, June–August, and March–May) [23]. A study in northern Nigeria found that the least variable rainfall occurs in August and July, while the highest rainfall variability is in February and March. The wet season runs from June to September, while the dry season spans from October to May [24]. Hassan et al. [25] showed that long-term (1949–2014) and early short-term (1949–1981) periods indicate a decreasing trend in the annual total rainfall, and a positive trend in rainfall was observed in the recent short-term period (1982–2014). There was a consistent increasing trend in temperature across all three periods, with the most significant rise during the long-term period (1949–2014).
Researchers have used different tests, both parametric and non-parametric, to detect trends in rainfall and temperature. Globally, the Mann–Kendall test method is frequently used to analyze trends [26,27,28,29,30]. In a study on precipitation behavior in the Swat River Basin [31], where the Mann–Kendall and Spearman’s rho tests were employed on data from thirteen stations, a mixture of increasing and decreasing trends was found. The Mann–Kendall test and Sen’s innovative trend analysis were used to analyze rainfall trends in a study by Praveen et al. [32]. Their results showed significant declining trends at most of the stations studied, while a few stations had positive increases in trends. Gündüz and Zeybekoğlu [33] analyzed the temperature and precipitation series of the Hirfanli Dam Basin using the Mann–Kendall and Spearman’s rho tests and innovative trend analysis, showing an increasing temperature trend and a decreasing rainfall trend.
Rainfall variability, a critical climatic factor in northeastern Nigeria, directly affects water availability, agricultural productivity, and ecosystem stability. The region’s agricultural output, which is the backbone of its economy and the nation’s food security, is closely linked to rainfall and temperature patterns. Small-scale farmers rely on rain-fed agriculture. Therefore, slight shifts in the duration or amount of rainfall can lead to devastating crop failures, food insecurity, and economic hardship [3]. Recent studies have highlighted that rainfall in Nigeria is becoming increasingly erratic, with longer dry periods and inconsistent intense but short bursts of rain, complicating agricultural planning and water resource management and leading to a range of socio-economic challenges, including heightened conflict over scarce resources. There is a general decrease in rainfall trends across some parts of Nigeria [34,35,36,37,38,39,40,41,42]. Obubu [43] emphasized the declining trends in rainfall over the past few decades, which are a result of natural variability and anthropogenic pressures, such as deforestation and land degradation. Given the region’s reliance on rain-fed agriculture, this decreasing rainfall trend could have long-term implications for security and livelihoods, particularly in rural areas. Since the industrial revolution, there has been a steady increase in the emissions of greenhouse gasses (chlorofluorocarbons, methane, carbon dioxide, and nitrous oxide) into the atmosphere, ultimately influencing rainfall and evident in the rising temperatures in North-Eastern Nigeria. The rate of emissions has been increasing, and the earth’s systems cannot simulate the recent warming without anthropogenic causes being included [25]. Other factors include Nigeria’s geographical location (the Sudano–Sahelian region), its proximity to the Sahara Desert, the movement of the Inter-Tropical Convergence Zone (ITCZ), the shrinking of Lake Chad, the harmattan winds, and its flat topography. These factors combine to create a semi-arid climate with limited and variable rainfall and extreme temperature fluctuations [44,45].
The rise in temperatures, especially maximum temperatures, has been a defining characteristic of climate change in North-Eastern Nigeria. Studies indicate a statistically significant upward trend in temperature over recent decades, with projections suggesting that this trend will continue to intensify. This increase in temperature is not only a local phenomenon but part of a broader global warming trend [46]. Studies report how some locations across Nigeria experienced a marked rise in maximum temperatures, which now regularly exceed historical averages [24,47,48,49,50]. The consequence of these higher temperatures is severe; heat stress on crops reduces agricultural productivity, while increased evaporation rates exacerbate water shortages. Rising temperatures also pose direct health risks to human populations, particularly in urban centers where the urban heat island effect amplifies the warming [51,52]. The cumulative effect of these temperature increases contributes to desertification through the loss of flora, which is rapidly encroaching on fertile lands and further constraining agricultural potentials [53]. All the studies earlier mentioned dealt with the trend analysis of rainfall and temperature in different parts of the world and Nigeria. However, information and analysis of the trend of both rainfall and temperature together for the Northeastern region of Nigeria are very few and limited concerning the specific temporal and spatial trend of such climate variables. The limited information cannot support any intervention and systemic approach to regional and catchment management for sustainable agriculture, rural development, and livelihoods in the face of climate change.
Therefore, the study aims to explore region-specific impacts of climate variability on socio-economic activities seeing recent outcomes of events like drought, flooding, and other environmental problems that affect agriculture, livelihoods, and security, especially with the already politically unstable status of North-Eastern Nigeria in the form of conflict and displacement. This will help policymakers and stakeholders create localized adaptation strategies for the region’s unique challenges—such as food insecurity, migration, and infrastructural resilience—that are not addressed adequately in earlier research. It will greatly assist on-time preparation of the negative impact of any variation and the provision of climate information for use in decision-making, sustainable development, effective policy, and practice in addressing the challenges posed by climate variability and change [54,55].

2. Material and Methods

2.1. Study Area

This study was conducted in the vast and ecologically diverse North-Eastern Nigeria, covering approximately 279,203 km2. The region, located between Latitudes 6°30′ and 14°00′ N and Longitudes 8°30′ and 15°00′ E (Figure 1), is home to nearly 19 million people. Its tropical climate is marked by two sharply contrasting seasons: a wet season from May to October, and a dry season from November to April [56]. The annual rainfall varies dramatically across the region, from as little as 300 mm in the northern arid zones to over 2000 mm in the southern, more humid areas. The temperature remains consistently high throughout the year, reflecting the harsh climatic conditions typical of the region. The topography, largely flat with gentle hill ranges, gives way to a gradient of vegetation types, from the lush Guinea savanna in the south to the more arid Sudan and Sahel savannas in the north [57]. This study focuses on Adamawa, Borno, and Gombe states, Nigeria, representing the ecological and climatic diversity that defines this region [36,58,59].

2.2. Data Sources and Analysis

Monthly rainfall and temperature (maximum and minimum) data with a spatial resolution of 0.05 × 0.05 degree was obtained for nine selected stations—(Akko, Billiri, Gombe, Abadam, Biu, Maiduguri, Mubi, Numan, and Yola) and fifty-nine points in the study location which was used for Mann–Kendall test and IDW interpolation, respectively. The study is only limited to the use of NASA’s Prediction of Worldwide Energy Resources Data (NASA POWER) for the period spanning 41 years from 1981 to 2021. This represents the air temperature at a height of 2 m above the ground level. Firstly, Annual rainfall and temperature (minimum and maximum) for each station were determined and were analyzed using various R programming packages, such as bayesforecast, mmkh, tidyverse, GGally, gridExtra, ggpubr, readxl, ggsci, ggrepel, ggforce, gplots, and ggplot2. Secondly, the mean annual rainfall and mean annual maximum/minimum temperature were calculated for the years between—a: 1981–1990, b: 1991–2000, c: 2001–2010, and d: 2011–2021. These datasets were then interpolated from their native grids onto 0.05 × 0.05 degree matching with the grid of the observed dataset. The inverse Distance Weighting (IDW) interpolation method was used to determine the spatial distribution of mean annual rainfall, mean annual maximum, and minimum temperature in the study area. It was performed by Arc GIS 10.8. The Sen’s slope value for each of the grid locations was calculated to determine the change (decrease or increase) in each climate variable over the years using Microsoft Excel. The Mann–Kendall test, IDW interpolation, and Sen’s slope value were adopted due to their simplicity, adaptability, and high level of accuracy in similar studies in areas of the same climatic, topographic, and vegetation characteristics in Nigeria [35,36,37,38].

2.3. Mann-Kendell Test

We tested for the trend in rainfall and temperature using the Mann–Kendall test. The Mann–Kendall trend test is a non-parametric statistical test that is often for trend detection in hydroclimatic analyses, this is because it considers outliers due to the very large amount of time series data. The trend of the climatic variables can be increasing, decreasing, or flat-that is, no trend. The Mann–Kendall test is carried out using the equation below [40,60]: See also Supplementary S1
S = j = k + 1 n sgn x j x k

2.4. Sen’s Slope Estimator (SSE)

Sen’s slope estimator is used in calculating the degree of trends in time series data. The technique is preferred as compared to a simple linear regression because it provides a better estimation of the trend. It is often used for estimating the significant linear trends in the time series data which is used in research studies. The slope   T i between two points of time series x calculated by Equation (2):
T i = x j x k j k   for   i =   1 ,   2 ,   3         n
k = 1 to n − 1, j = 2 ton, as well as x j   and   x k are data values at a time j and k (j > k), respectively. If the time series x has n point observations, there will be N = n (n − 1)/2 slope values. Sen’s method estimates the slope as median N values of Q [61]. The Q as slope estimator can be calculated by Equation (3):
Q =   T N + 1 2 , N   o d d T N 2 + T N + 2 2 2 ,   N   e v e n

2.5. Auto-Correlation Test

Prior to trend analysis, in this paper, a test for the existence of autocorrelation or serial correlation in the rainfall and temperature dataset was performed using the Autocorrelation Function ACF in R Studio. The autocorrelation represents the degree of correlation of the same variables between two successive time intervals. Serial correlation, if present, modifies the estimate of the Mann–Kendall statistics [62].

2.6. Sen Innovative Trend Analysis (Sen_ITA)

Sen_ITA yields more reliable results by complementing the Mann–Kendall trend test with the Sen_ITA method. Serial correlation does not affect the Sen_ITA method, and this robust property is attempted to be implanted into the Kendall test. The method of Sen Slope Estimator—SSE is adopted for improving the Mann–Kendall test by computing the trend matrix based on the median value. It decreases the impact of the outliers on the trend component [63]. Equation (4) represents the slope of the trend, sITA, in which n is the length of the principal time-series data, and x ¯ y ¯ is the average of the first (second) half-time series. The trend line can be derived from Equation (5). The Confidence Limit (CL) for Sen_ITA can be estimated by using the trend slope. Standard Deviation (SD) of two half series, given that ( σ x = σ y = σ∕√n), where σ is the SD of the parent time series, the sITA expectation provided by (E(sITA) = 0) for no trend. Equation (6) provides the SD of the slope of the trend σ s where ρ x y ¯ is the cross-correlation coefficient between the first and second phases. Equation (7) provides CL. In that direction, scri = standardized time series critical standard deviation at 95% and 90% significance levels (α) at ±1.96 and 1.65, respectively [64].
ITA s = 2 x ¯ y ¯ n
y = x + s ,  
σ s = 2 2 n n σ 1 ρ   x y ¯ ,
C L 1 = 0 ± s c r i σ s ,

2.7. Modified Mann–Kendall Test

The effect of serial correlation can be excluded from a given time series through pre-whitening, variance correction, or over-whitening processes as contained in the modified Mann–Kendall procedure. Note that the pre-whitening process removes some of the current trends together with the serial correlation. In the present study, the modified Mann–Kendall technique is augmented with the Sen innovative trend analysis instead of using Sen’s slope estimator. First, the trend is calculated with the help of the Sen slope estimator Equation (8), which is subtracted from the time series according to Equations (9) and (10). Then, the lag-1 autocorrelation coefficient is estimated and subtracted from the trendless time series (Equation (11)), where the trend is added to the independent time series (Equations (12) and (13)), while the trend of the independent time series is calculated by the Mann–Kendall method. sSSE and sITA are the trend values calculated by using SSE and Sen_ITA methods, respectively [64]. Z SSE d and   Z ITA d   show the time series with no trend. Z i indicates the independent time series, whose correlation effect is removed. The Z SSE t and Z ITA t indicates independent time series that the trend values are analyzed, according to the SSE and Sen_ITA methods.
SSE s = m e d i a n   ( Z j   Z i j i ) for   j   >   i   :   i   =   1   :   n     1   and   j   =   2   :   n ,
Z SSE d = Z k SSE s .   k ; for   k = 1 : n ,
Z ITA d = Z k ITA s .   k ,
Z i = Z k 1 p .   Z k 1
Z SSE t = z k i + SSE s .   k ,
Z ITA t = z k i ITA s .   k ,

2.8. Inverse Distance Weighting Interpolation of Rainfall and Maximum/Minimum Temperature for Adamawa, Borno and Gombe States

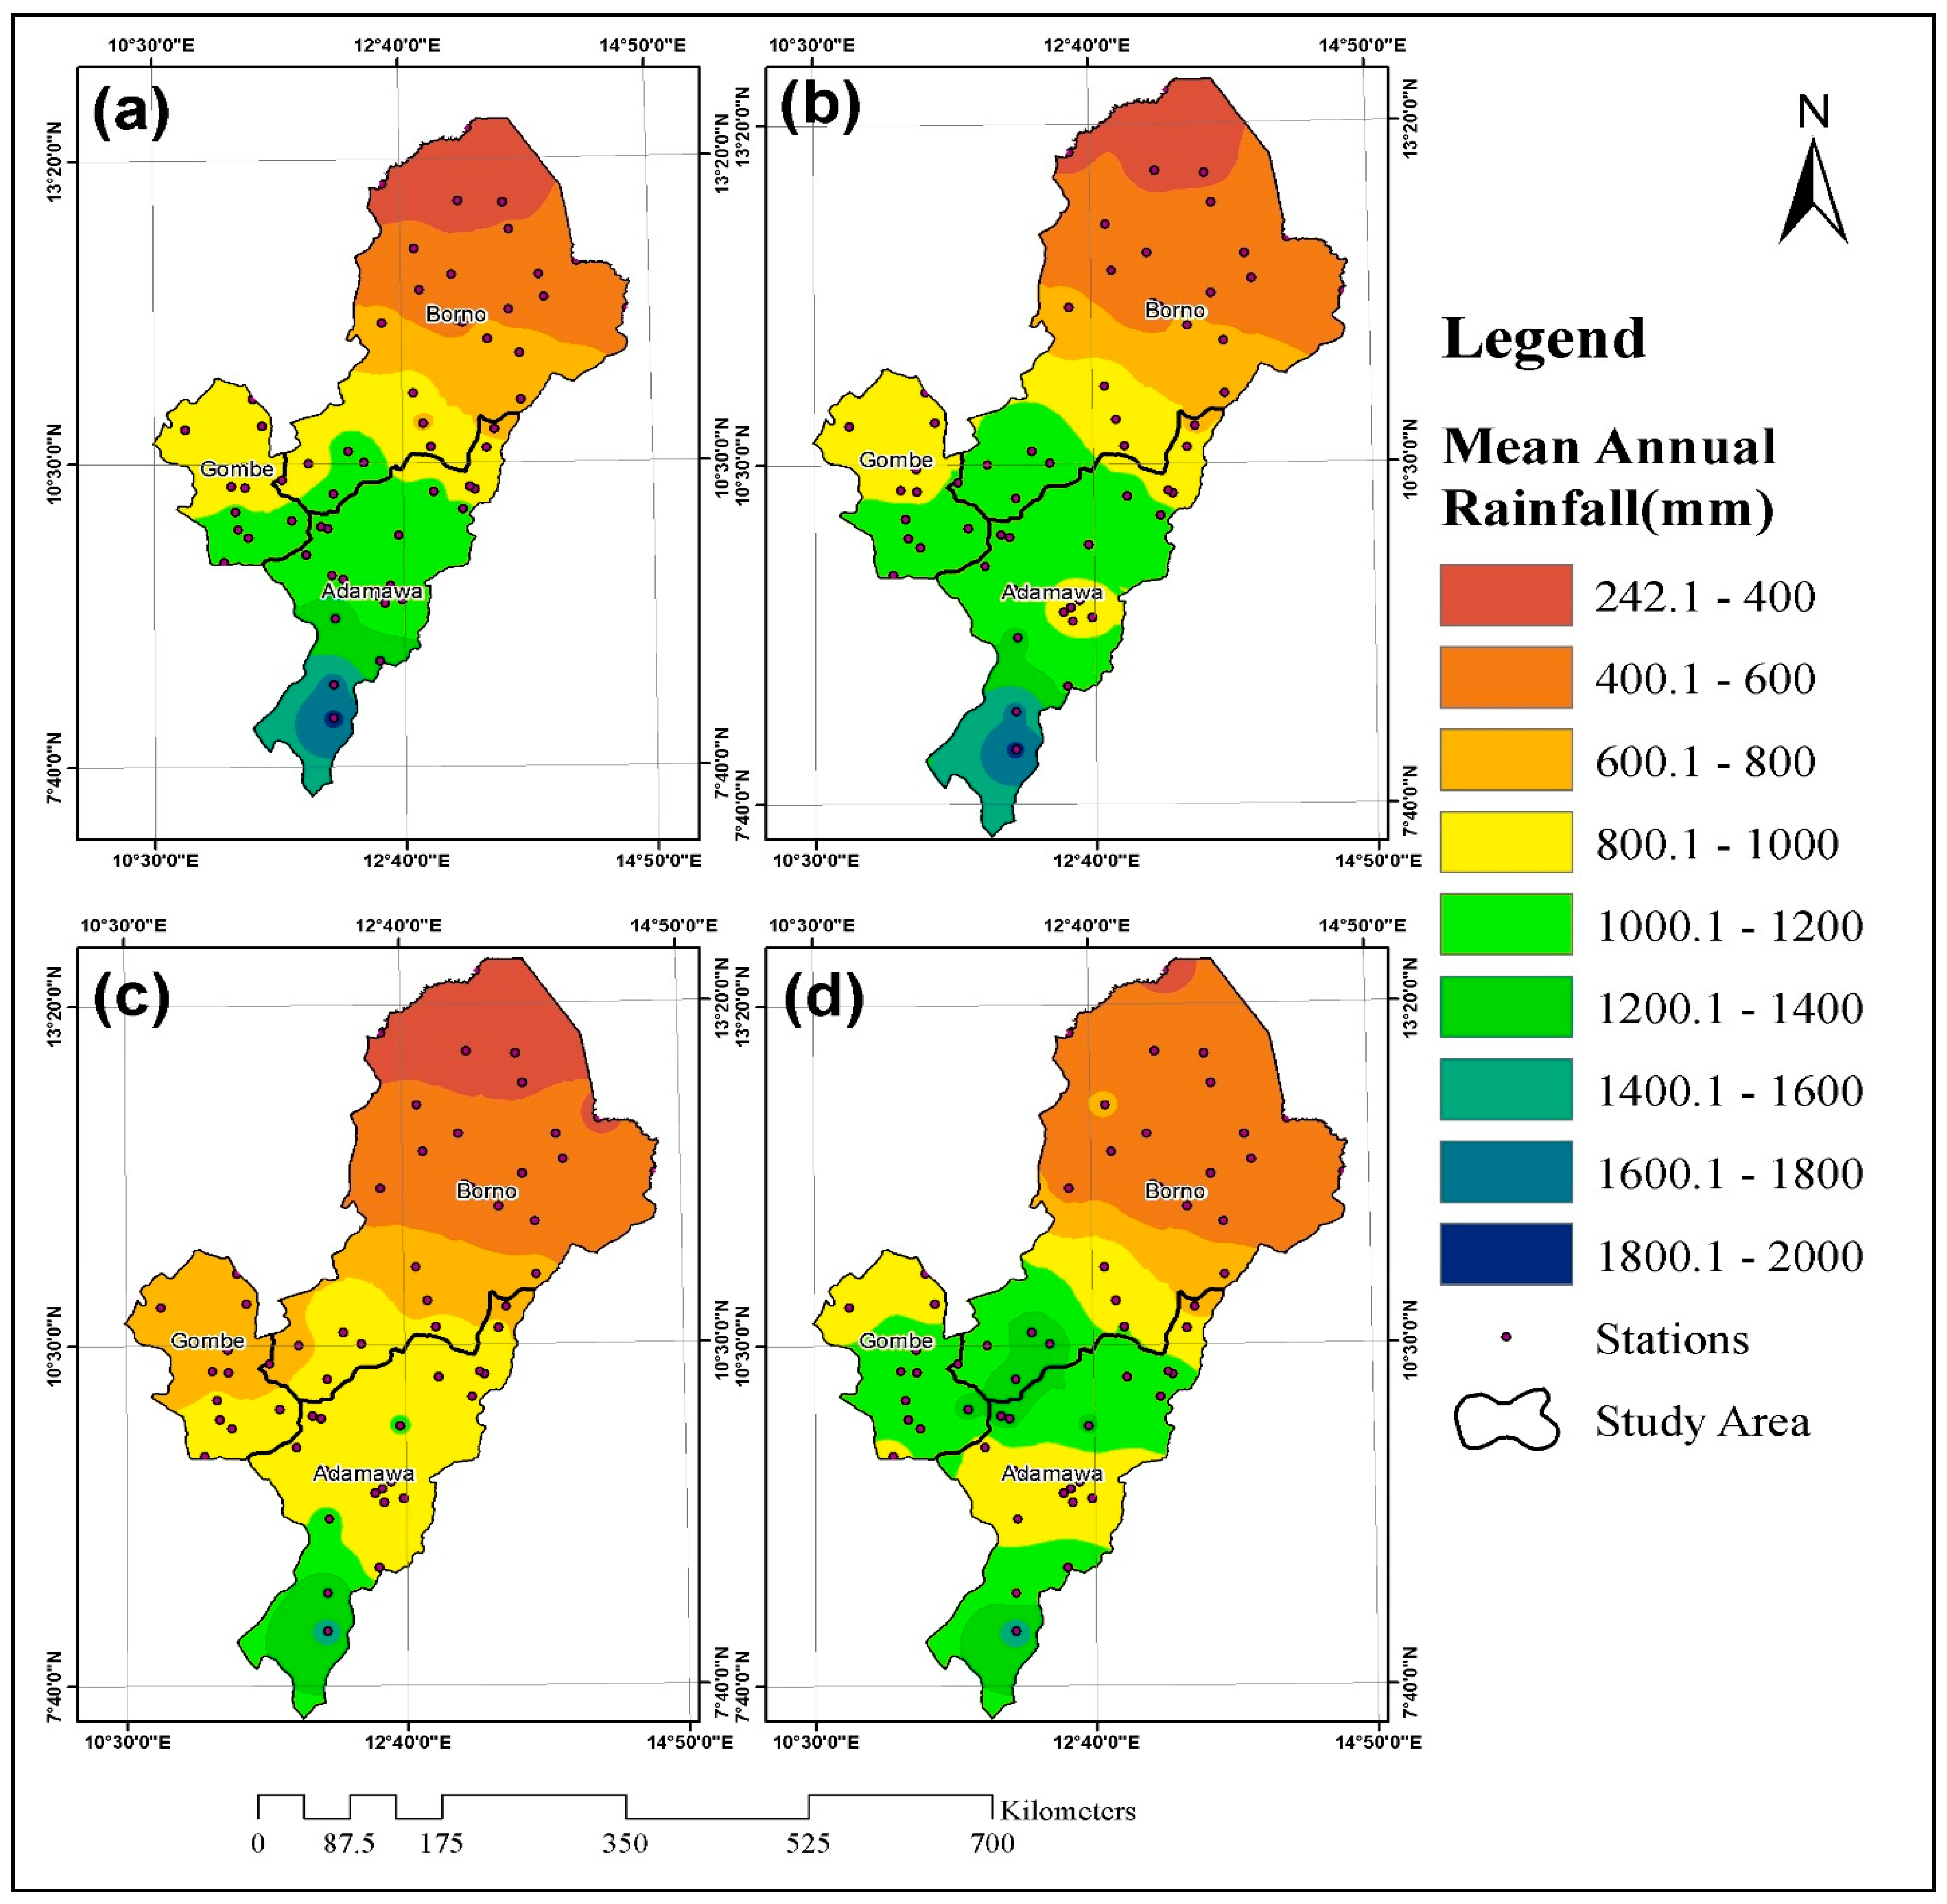
We first calculated the mean annual rainfall and mean annual maximum/minimum temperatures for four distinct periods: (a) 1981–1990, (b) 1991–2000, (c) 2001–2010, and (d) 2011–2021. These datasets were then interpolated from their native grids onto a 0.05° × 0.05° resolution, aligning with the grid of the observed data. To map the spatial distribution of mean annual rainfall, as well as mean annual maximum and minimum temperatures across the study area, we employed the Inverse Distance Weighting (IDW) interpolation method using ArcGIS 10.8. This method allowed us to generate spatial estimates of climate variables, highlighting localized trends. The Sen’s slope value was then calculated for each grid point to quantify the rate of change (increase or decrease) in these climatic variables over the study period.
IDW, a deterministic interpolation method, estimates the value at unknown locations by applying a weighted average of known values from nearby locations. The technique assumes that values closer to each other are more likely to be similar than those farther apart [65,66]. IDW interpolation has proven effective, but there is no universal preferred method. The choice of interpolation depends largely on the dataset’s characteristics, the required level of precision, and the available resources [67].

3. Results

3.1. Result of Autocorrelation Test

The outcome of this test showed that there is a serial correlation in the total annual rainfall, maximum and minimum temperature series as all the vertical bars tend beyond the upper and lower limits, thus making the dataset viable for Modified Mann–Kendall trend analysis. Modified Mann–Kendall (MMK) is recommended to correct the effects of autocorrelation in a given time series [64]. The time gap is called Lag. The value of the time gap is given by k. A lag 1 autocorrelation (i.e., k = 1) is the correlation between values that are one time period apart (See Supplementary S2 Figures S1–S3).

3.2. Rainfall Trend in Some Selected Stations in Northeast, Nigeria

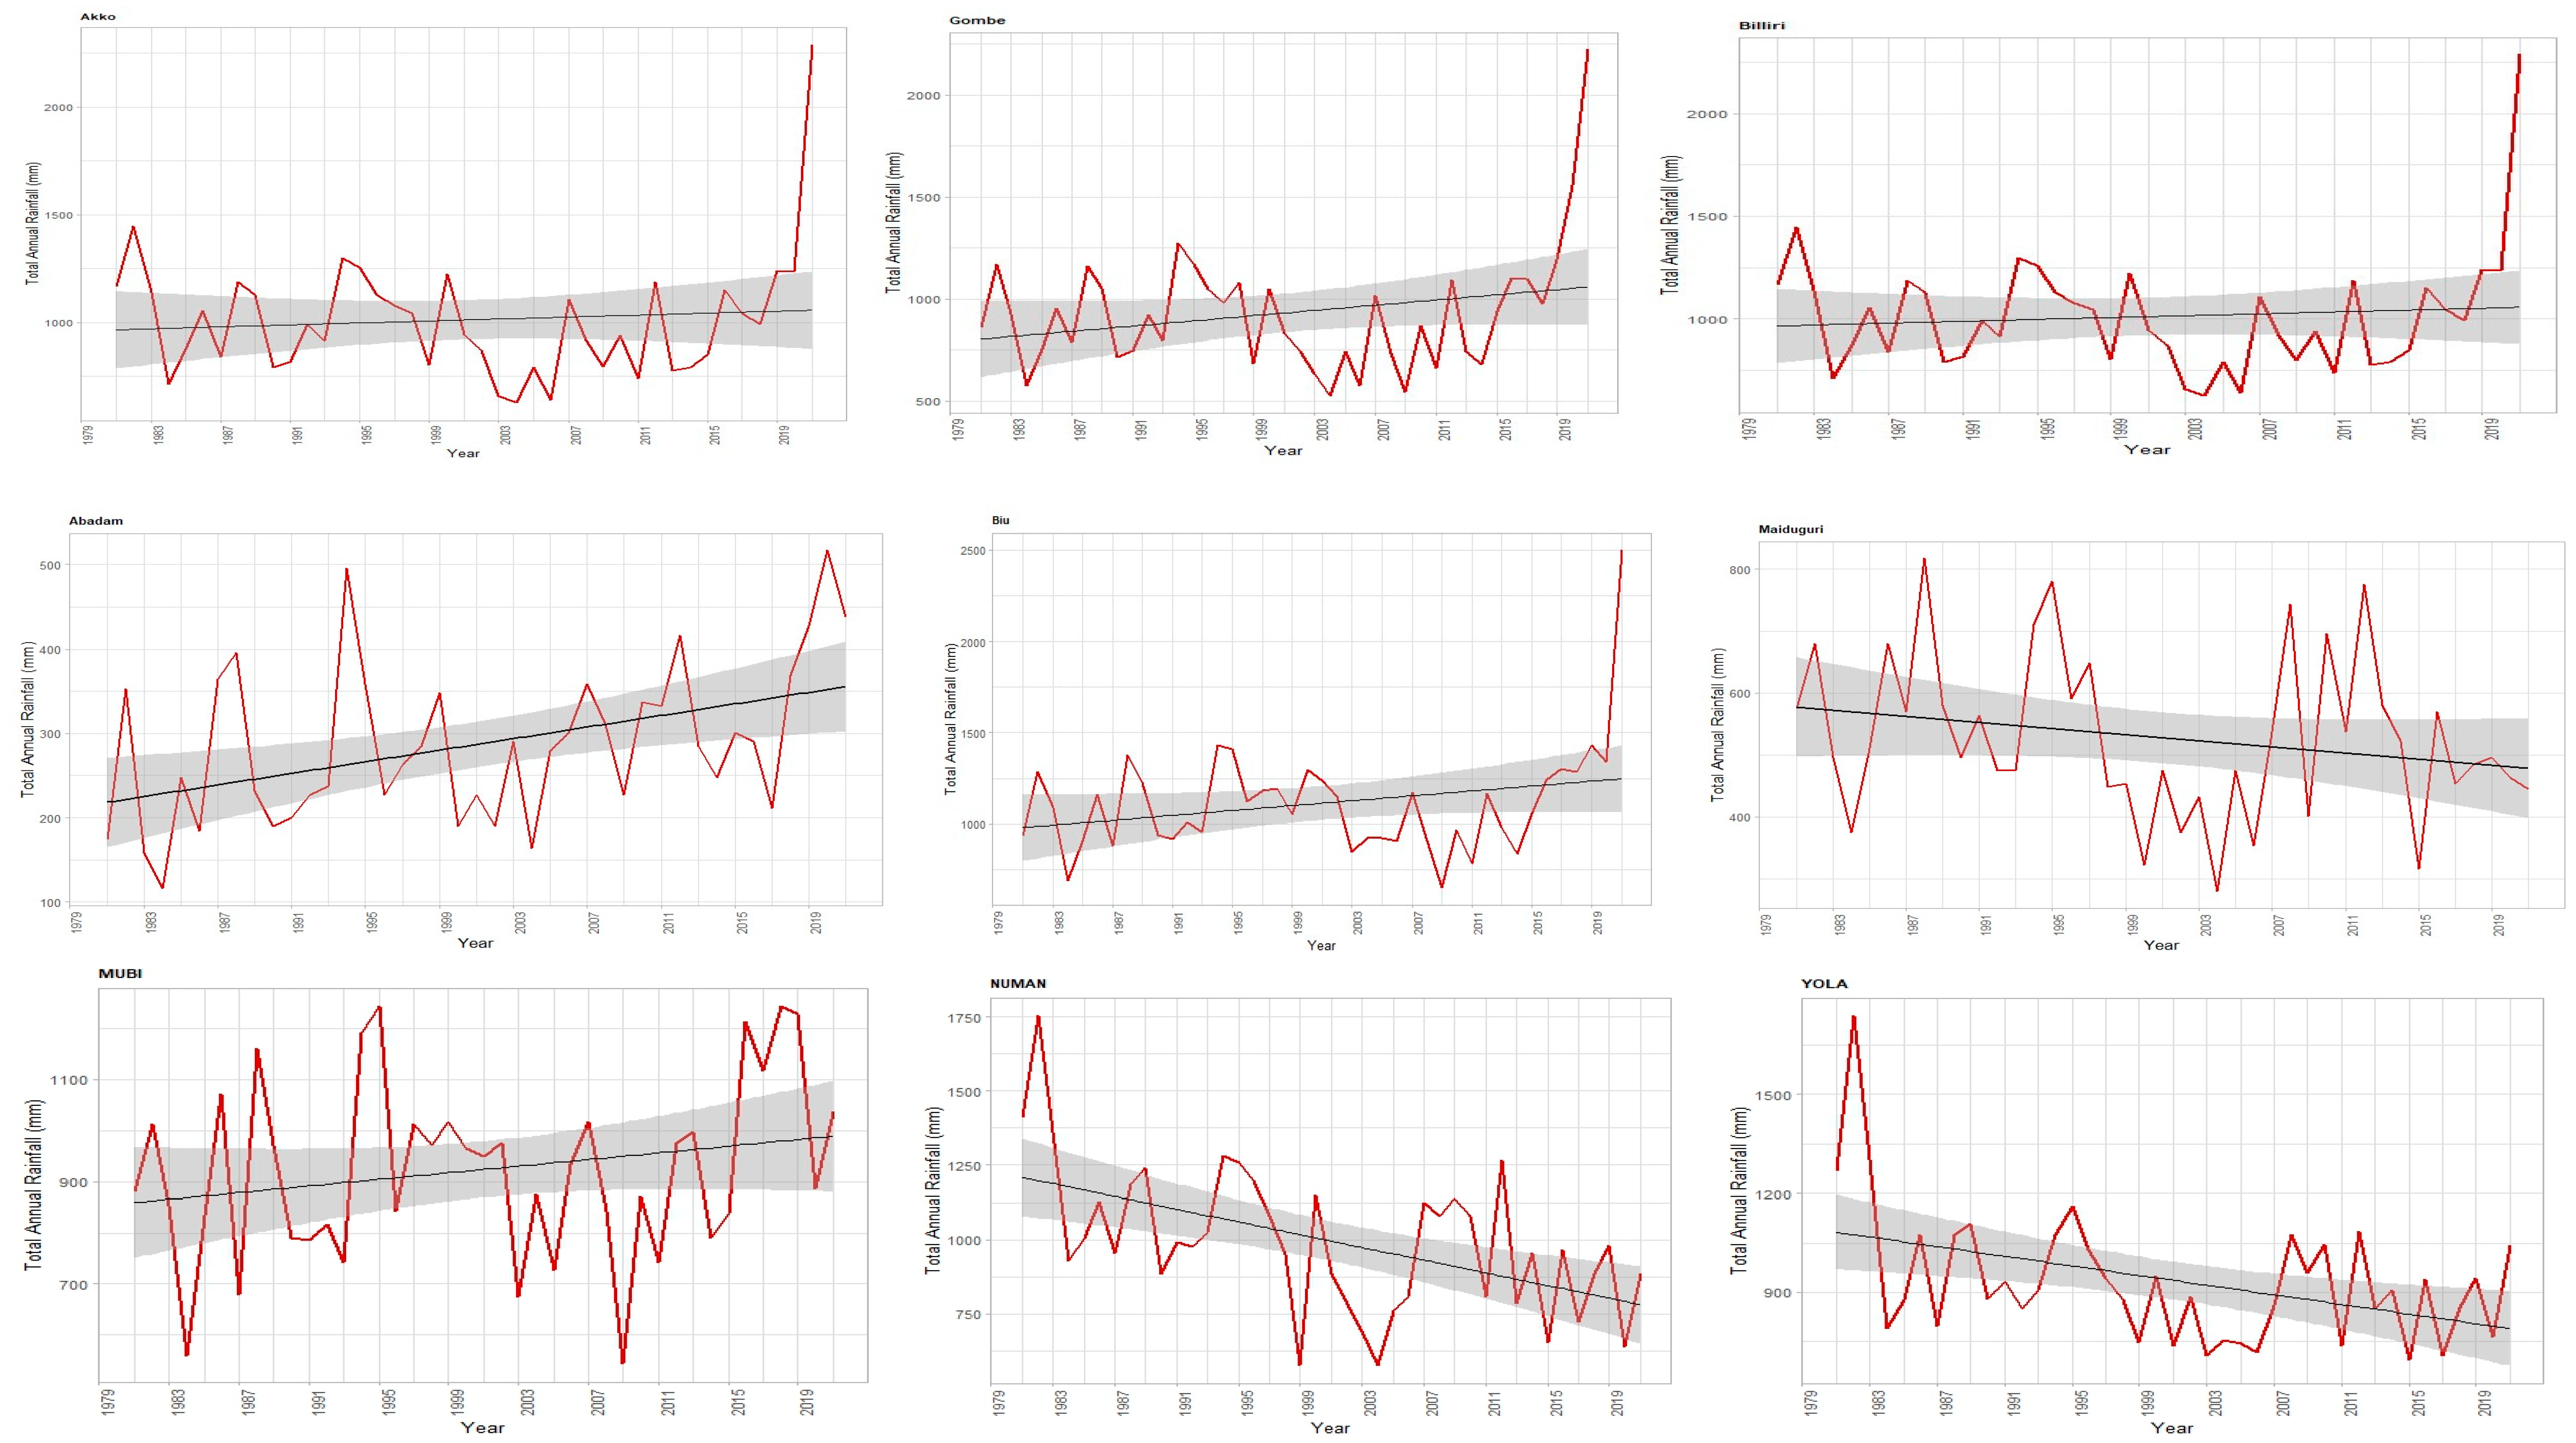
The result of the Modified Mann–Kendall test and Sen’s innovative trend analysis for the rainfall in all stations presented in Table 1 and Supplementary S3 Table S1 than five (5) stations, namely Akko, Billiri, Maiduguri, Numan, and Yola with Sen’s slope value (−0.96658333, −0.96658333, −2.542410, −10.280865, and −5.273333, respectively) show a decreasing trend. The decreasing trend is statistically significant with a p-value less than 0.05 in Numan, Maiduguri, and Yola and not significant in Akko and Billiri. The result also shows an increasing rainfall trend in Gombe, Abadam, Biu, and Mubi with Sen’s slope value (2.3618717, 4.102222, 3.695524, and 2.9016787). The rising trend is statistically significant in Abadam and not significant in Gombe, Biu, and Mubi. From the result above, in Gombe state (i.e., Akko, Billiri, and Gombe) rainfall trend is decreasing in Akko and Billiri while in Gombe it is increasing, In Borno state (Abadam, Biu, and Maiduguri) rainfall was found to be decreasing in Maiduguri and increasing in Abadam and Biu. In Adamawa state (Numan, Mubi, and Yola), rainfall trend is decreasing in Numan and Yola, while in Mubi it is increasing (Figure 2).

3.3. Maximum Temperature Trend in Some Selected Stations in Northeast, Nigeria

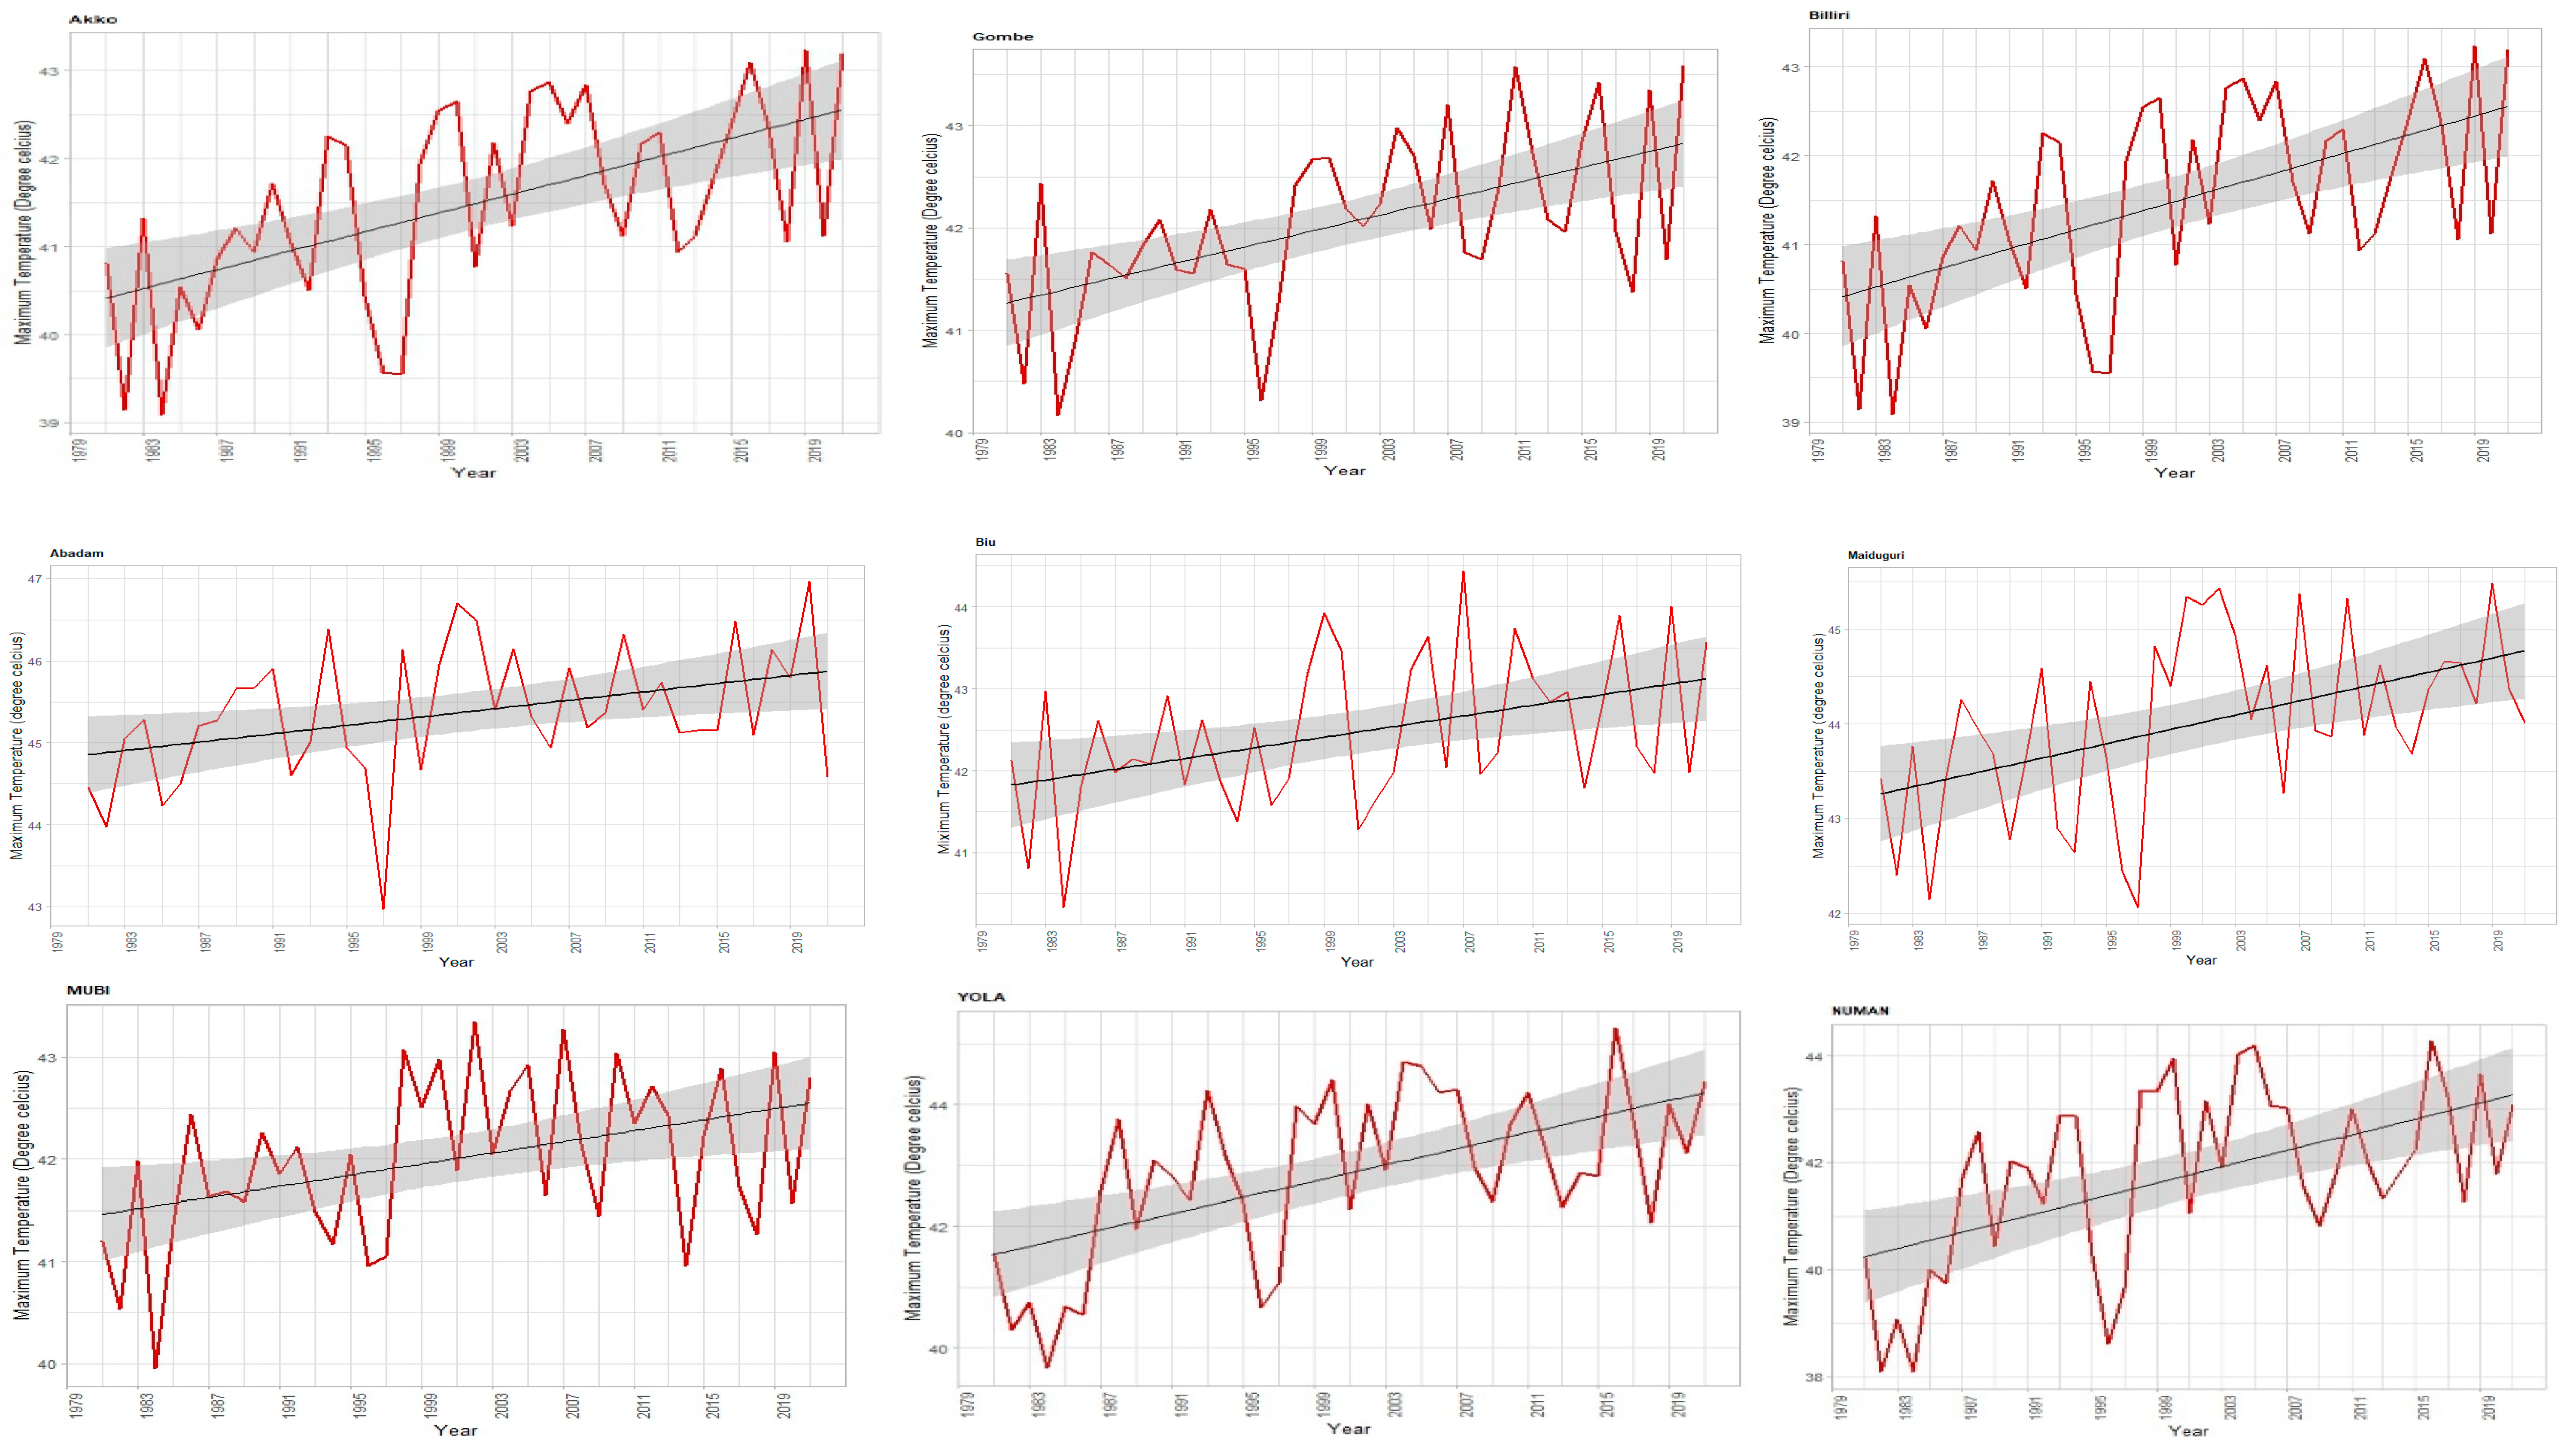
We found out (Table 2 and Supplementary S3 Table S2) that the results of Modified Mann–Kendall’s test and Sen’s innovative trend analysis for the maximum temperature in all stations show a statistically significant increasing trend in all stations (Figure 3).

3.4. Minimum Temperature Trend in Some Selected Stations in Northeast, Nigeria

We found out from the Modified Mann–Kendall test and Sen’s innovative trend analysis for the minimum temperature in all stations as presented in Table 3 and Supplementary S3 Table S3 that there is a statistically insignificant increasing trend in three stations and a statistically insignificant decreasing trend in six stations (Figure 4).

4. Result of Inverse Distance Weighting Interpolation of Rainfall and Maximum/Minimum Temperature for Adamawa, Borno and Gombe States

4.1. Mean Annual Rainfall

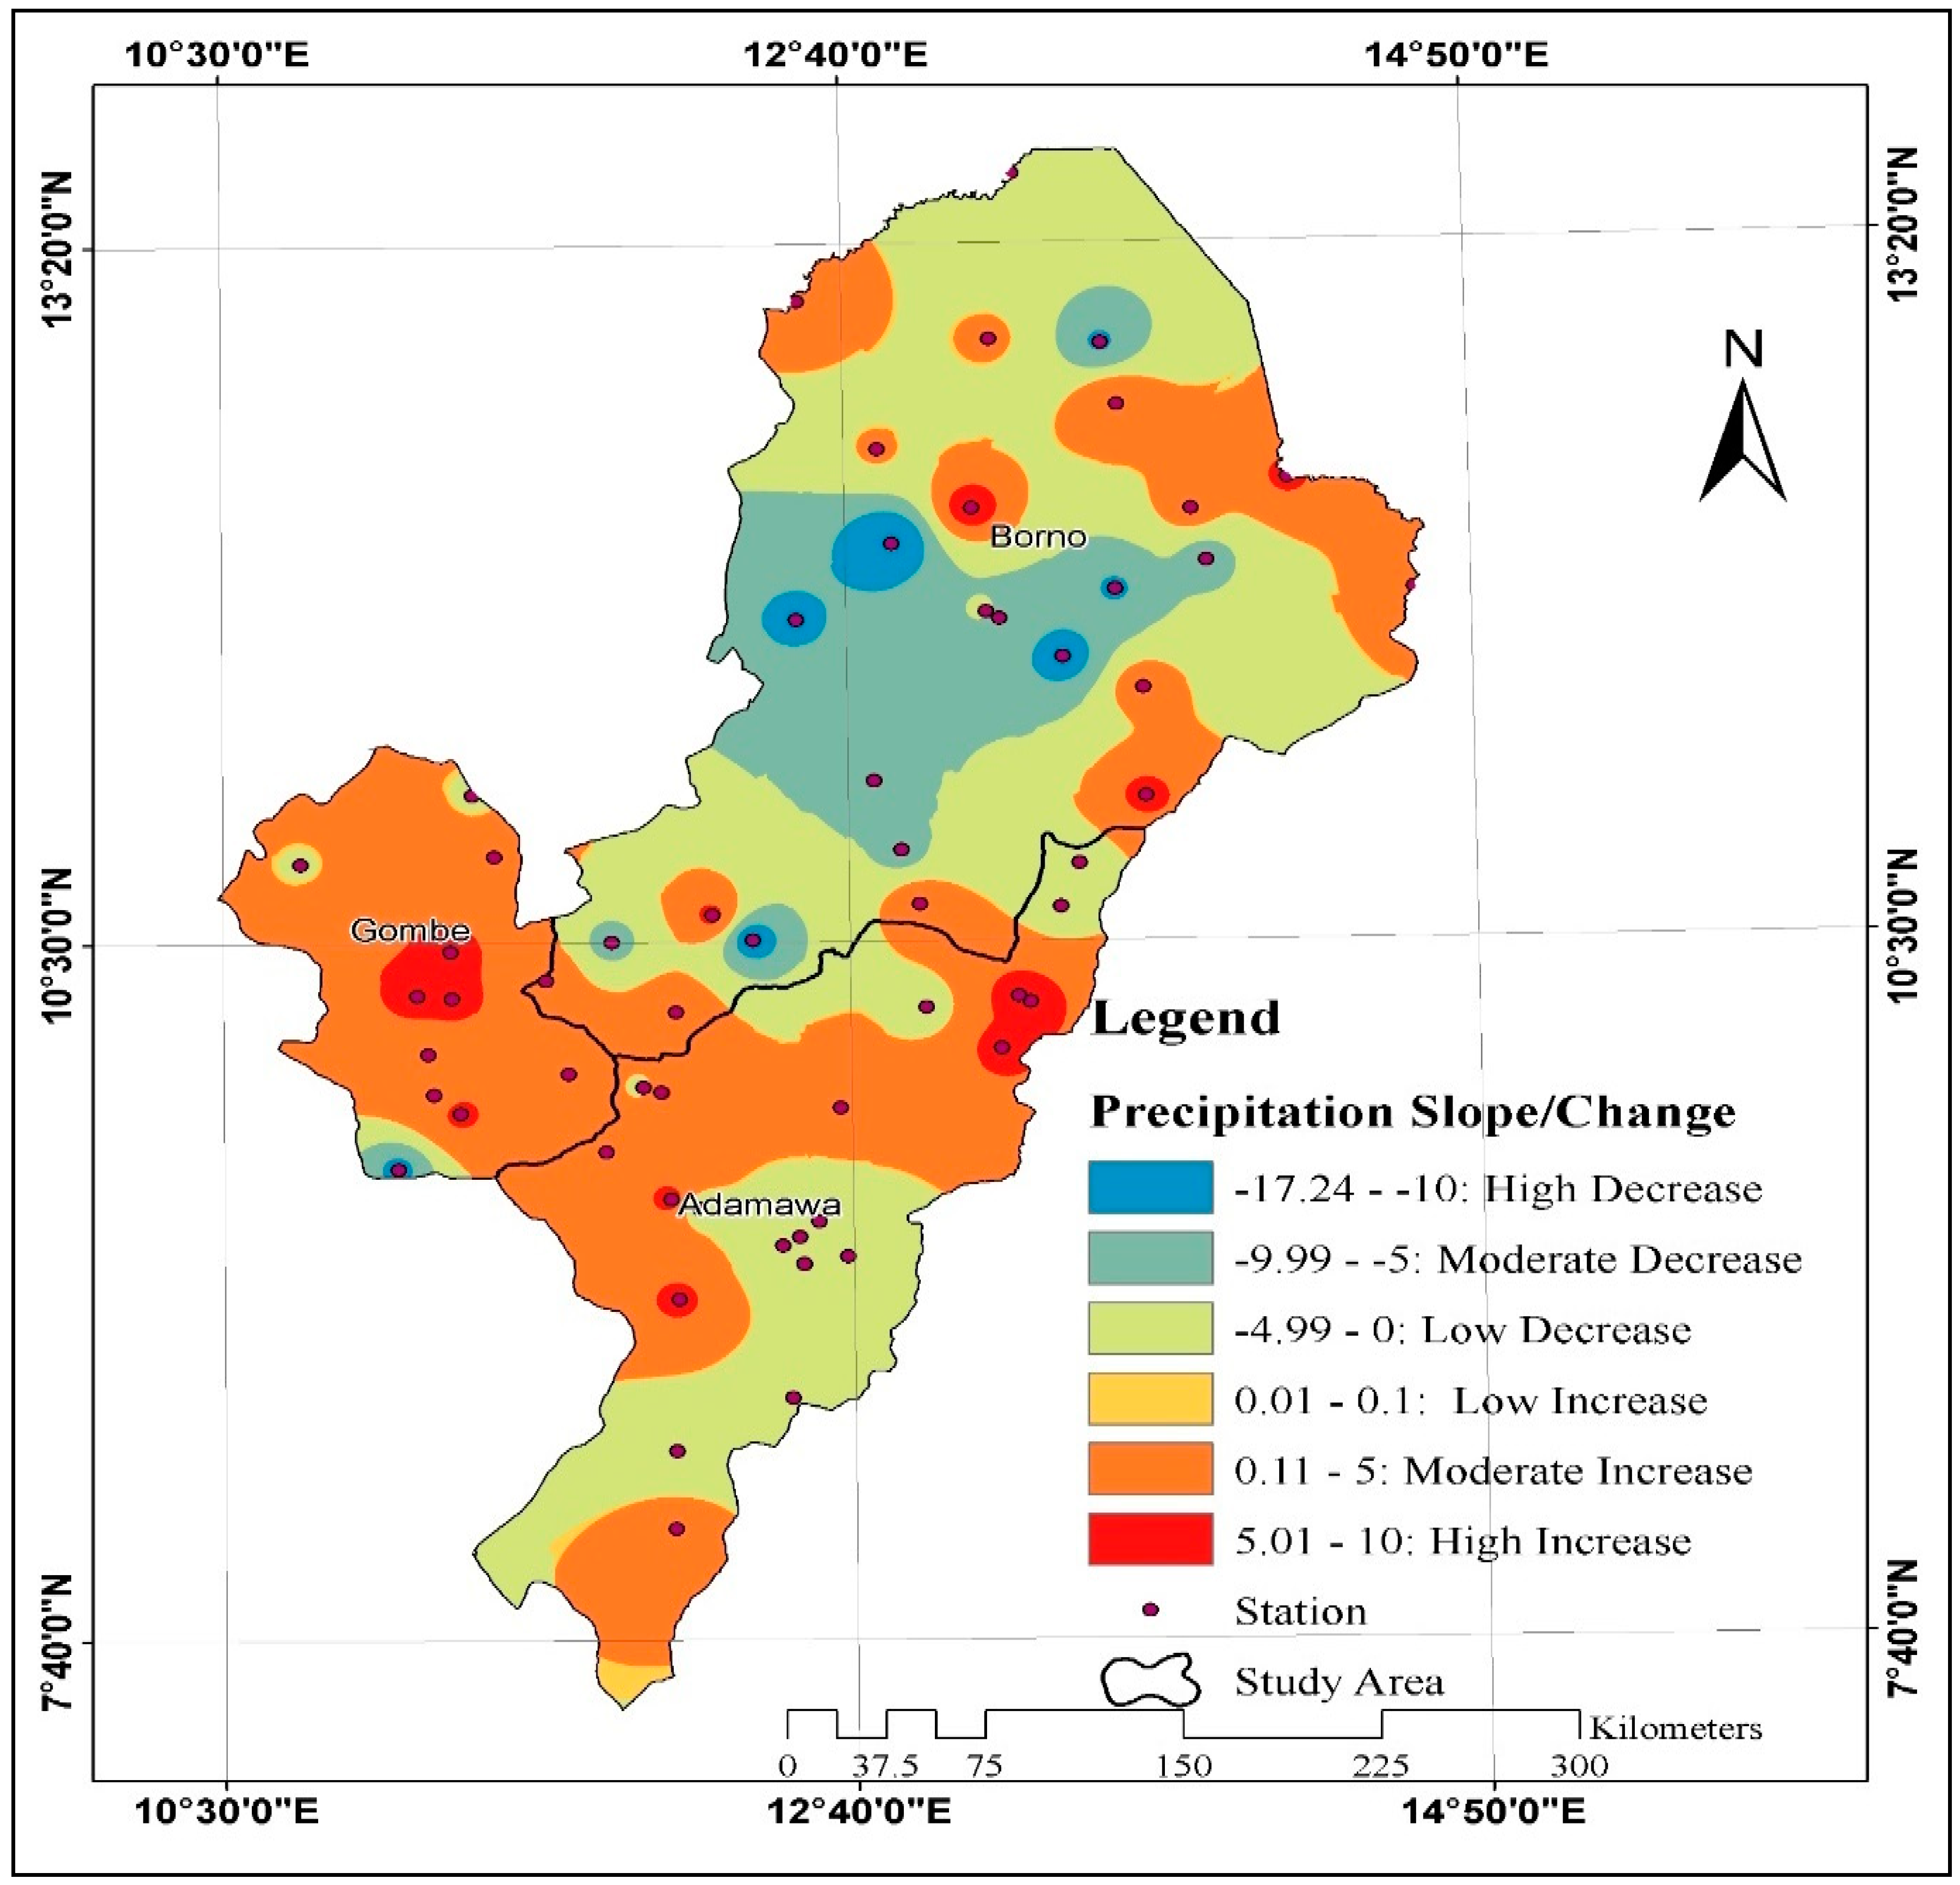
We found the results of the mean annual rainfall between 1981 and 1990, 1991 and 2000, 2001 and 2010, as well as 2010 and 2021 (see also Figure 5), together with the Sens slope estimation value for the years 1981 to 2021 in each of the states in the study location (see Figure 6). The Sens slope value for Adamawa state (0.853) signifies a moderate increase in rainfall over the years because its value is positive, while Borno state has a Sens slope value of (−2.401), which signifies a low decrease in rainfall; finally, Gombe state with Sens slope value of 1.896 signifies a moderate increase in rainfall. The mean total of the Sens slope estimation for the three states (−0.442) shows that generally in the three states there is a low decrease in rainfall (See Supplementary S4 Table S1).

4.2. Mean Annual Maximum Temperature

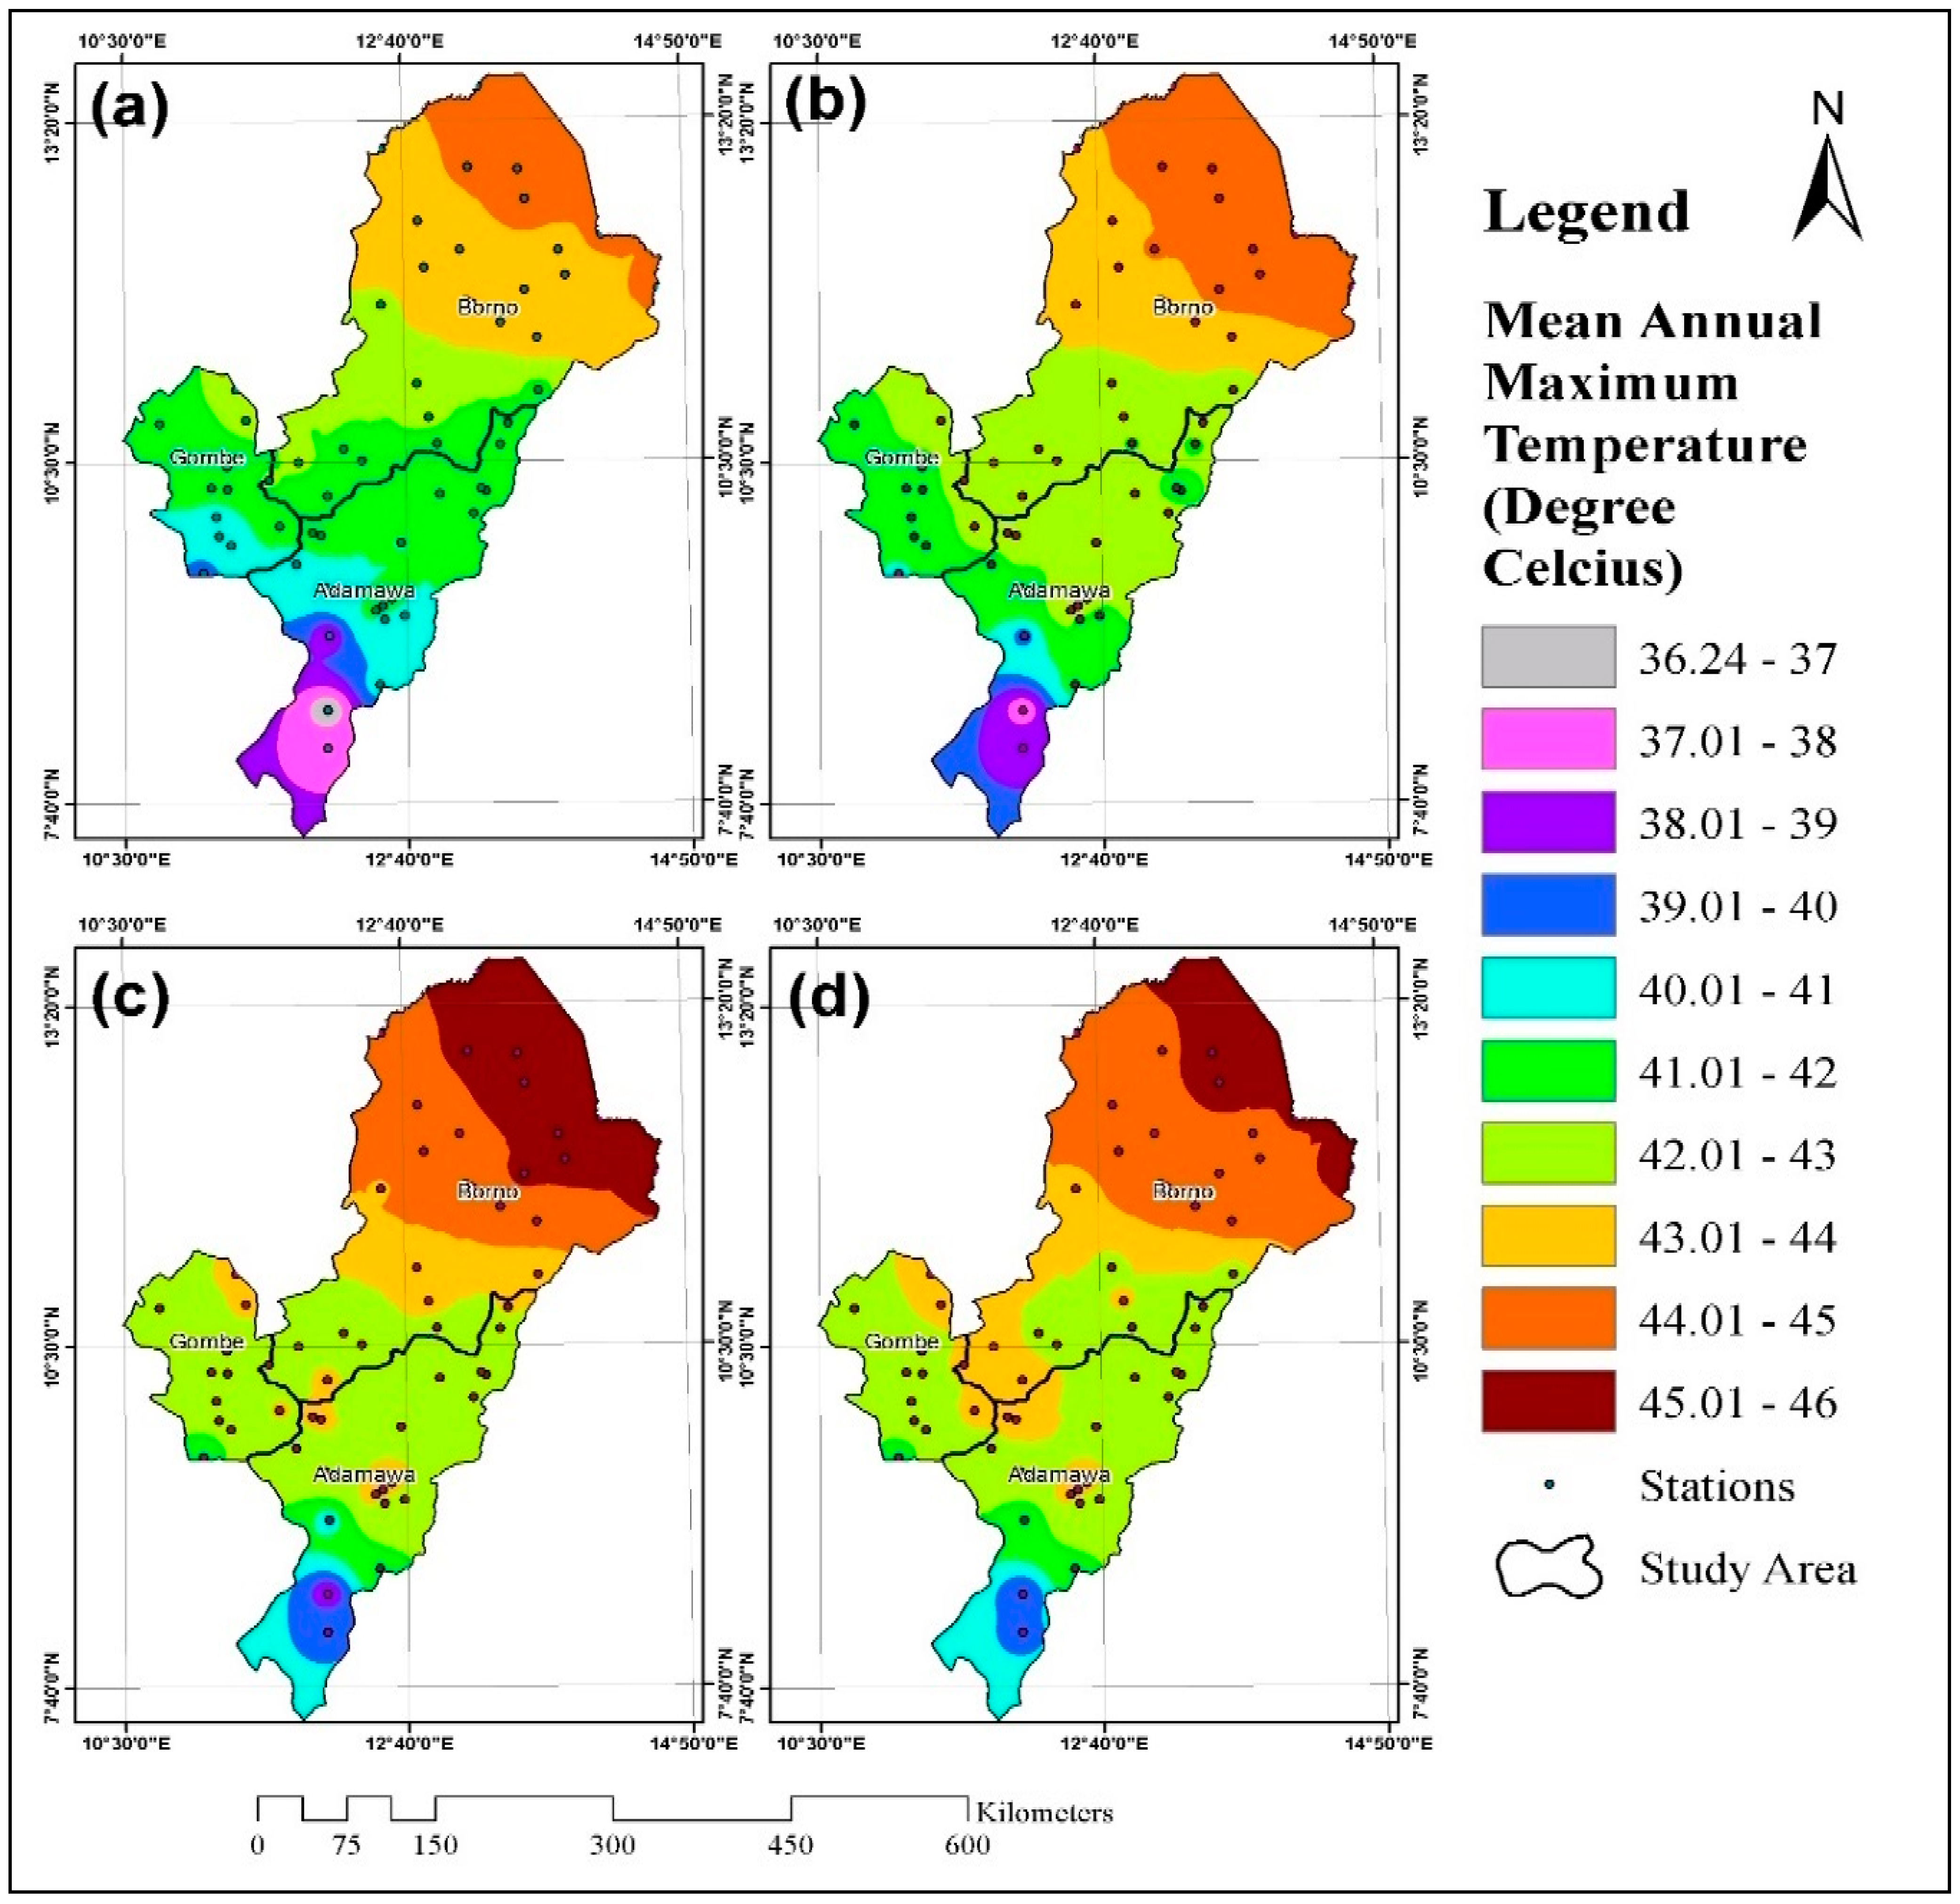
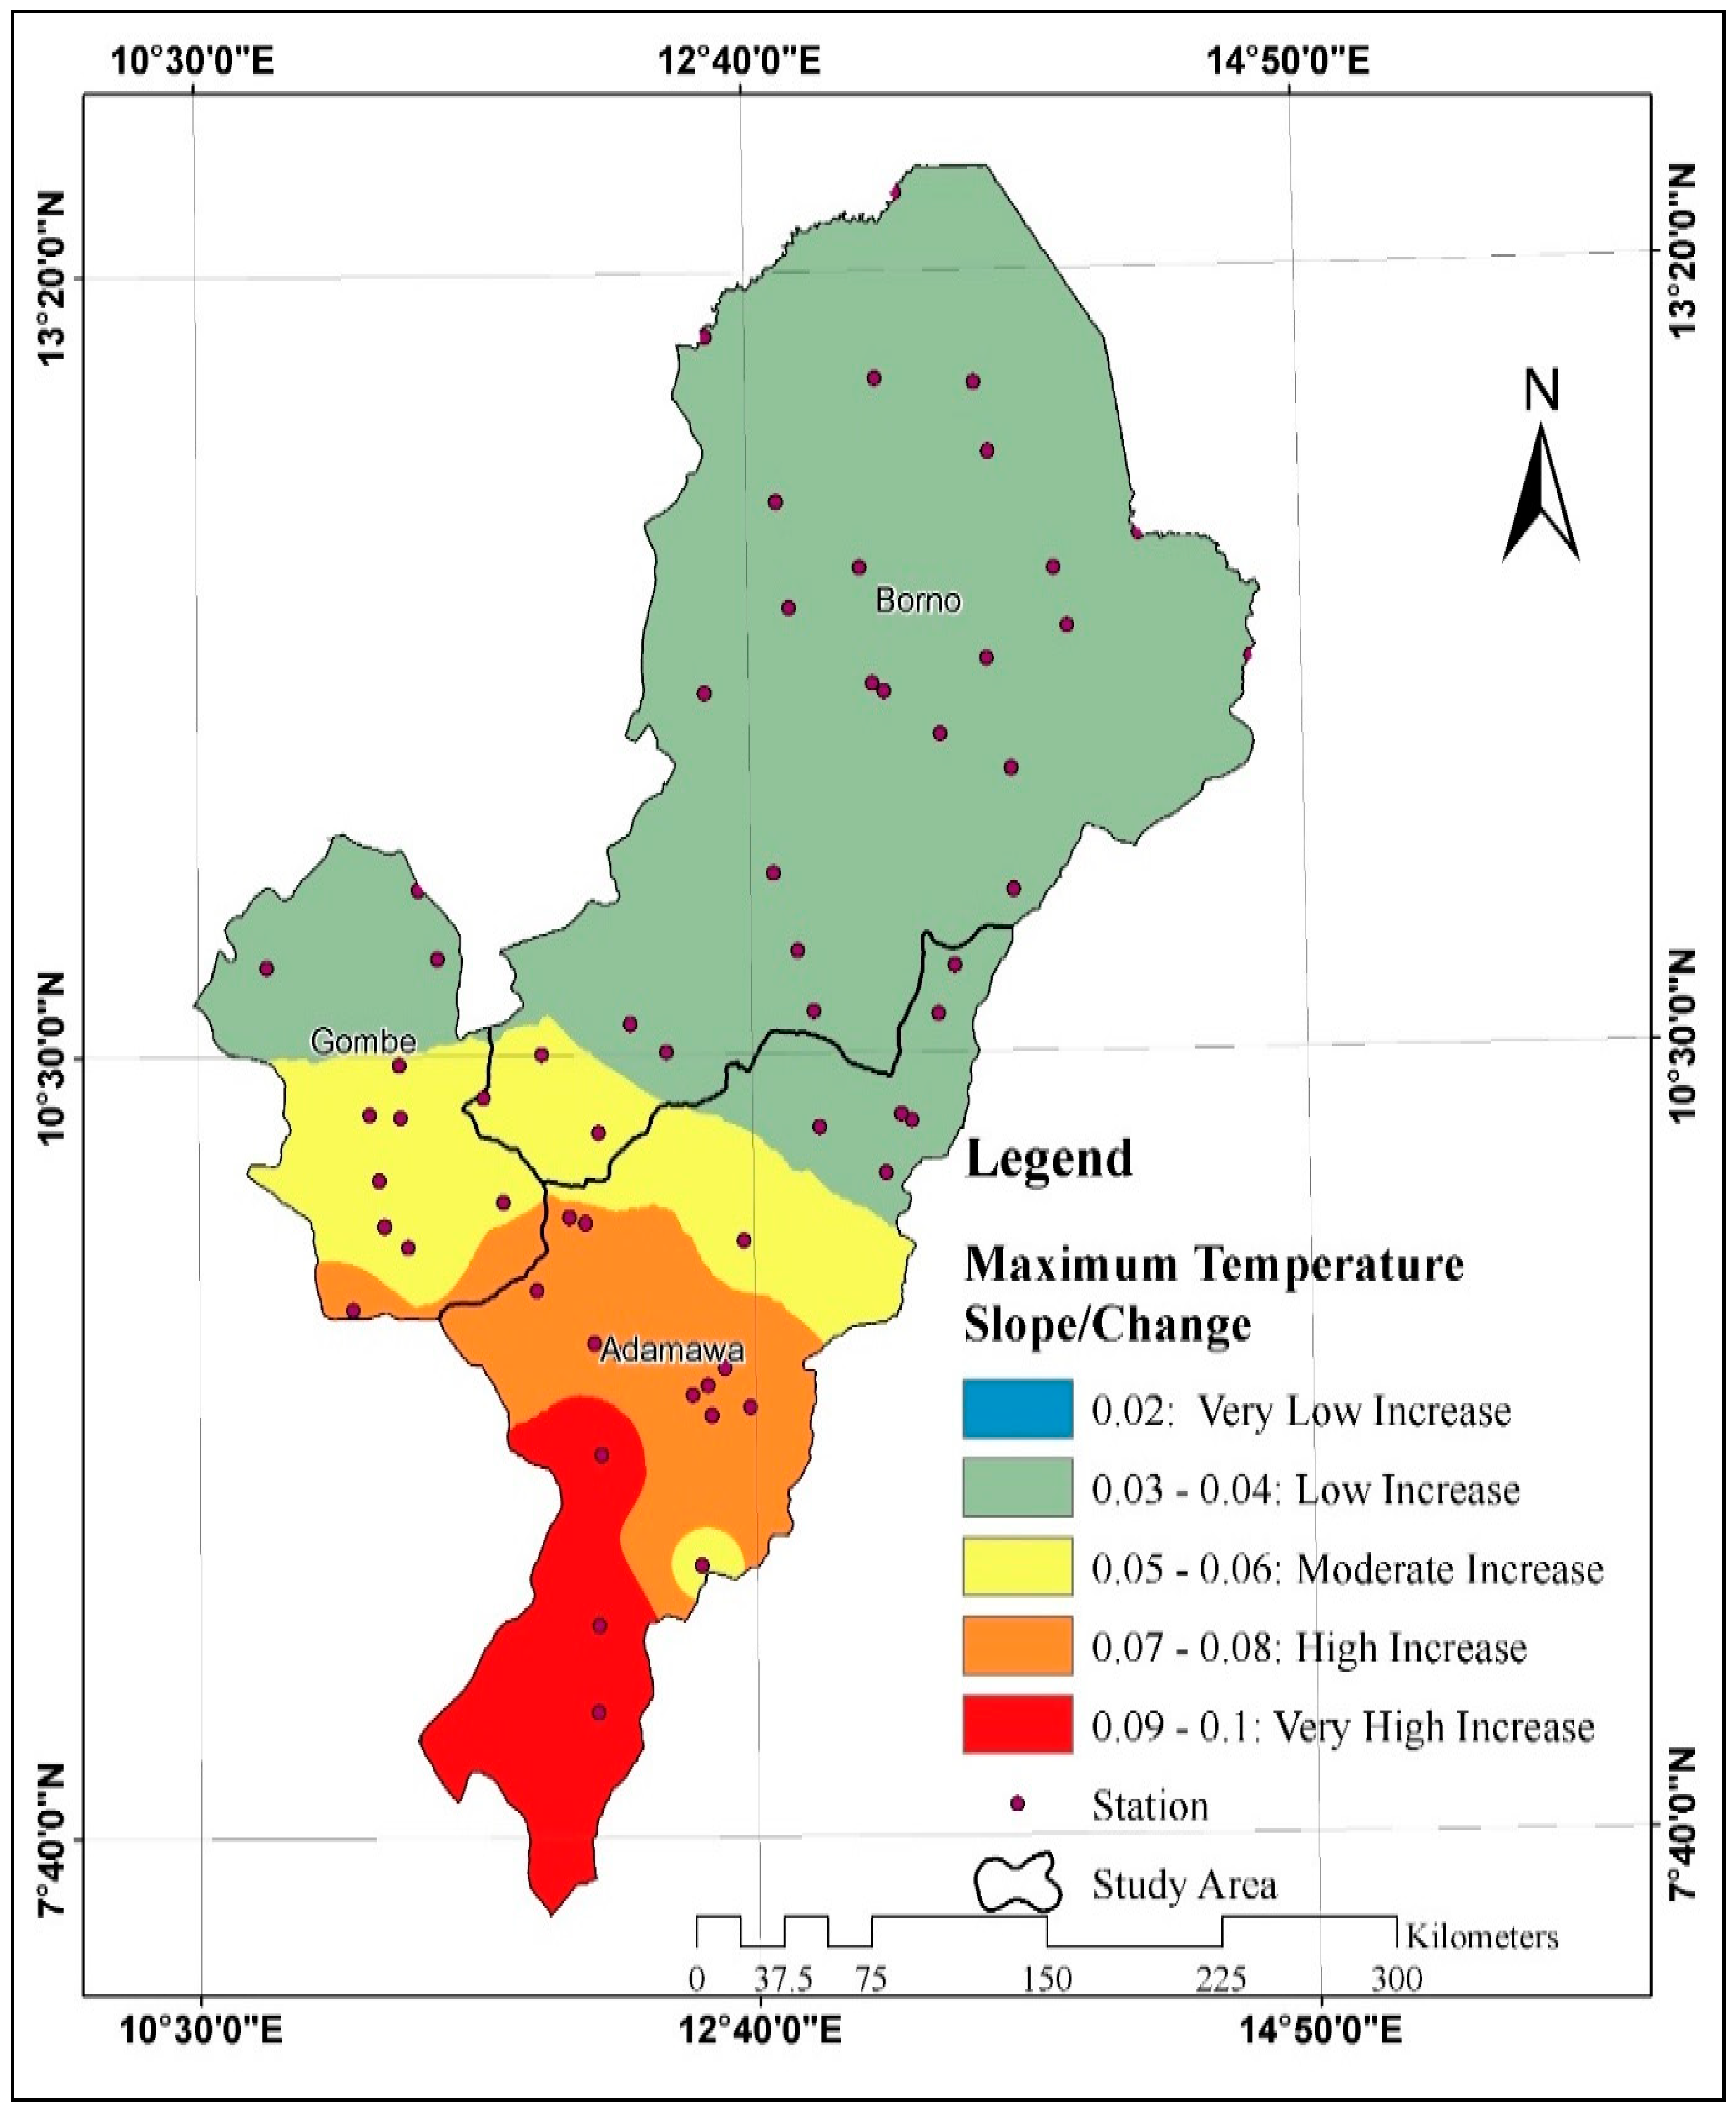
We found the results of the mean annual maximum temperature between 1981 and 1990, 1991 and 2000, 2001 and 2010, as well as 2011 and 2021 (Figure 7), together with the Sens slope estimation value for the years 1981 to 2021 in each of the states in the study location (Figure 8). The Sens slope value for Adamawa state (0.060) signifies a moderate increase in maximum temperature over the years because its value is positive, while Borno state has a Sens slope value of (0.035), which signifies that maximum temperature has a low decrease; finally, Gombe state with Sens slope value of 0.046 signifies a low increase in maximum temperature. The mean total of the Sens slope estimation for the three states (0.046) shows that generally in the three states there is a low increase in maximum temperature (Supplementary S4 Table S2).

4.3. Mean Annual Minimum Temperature

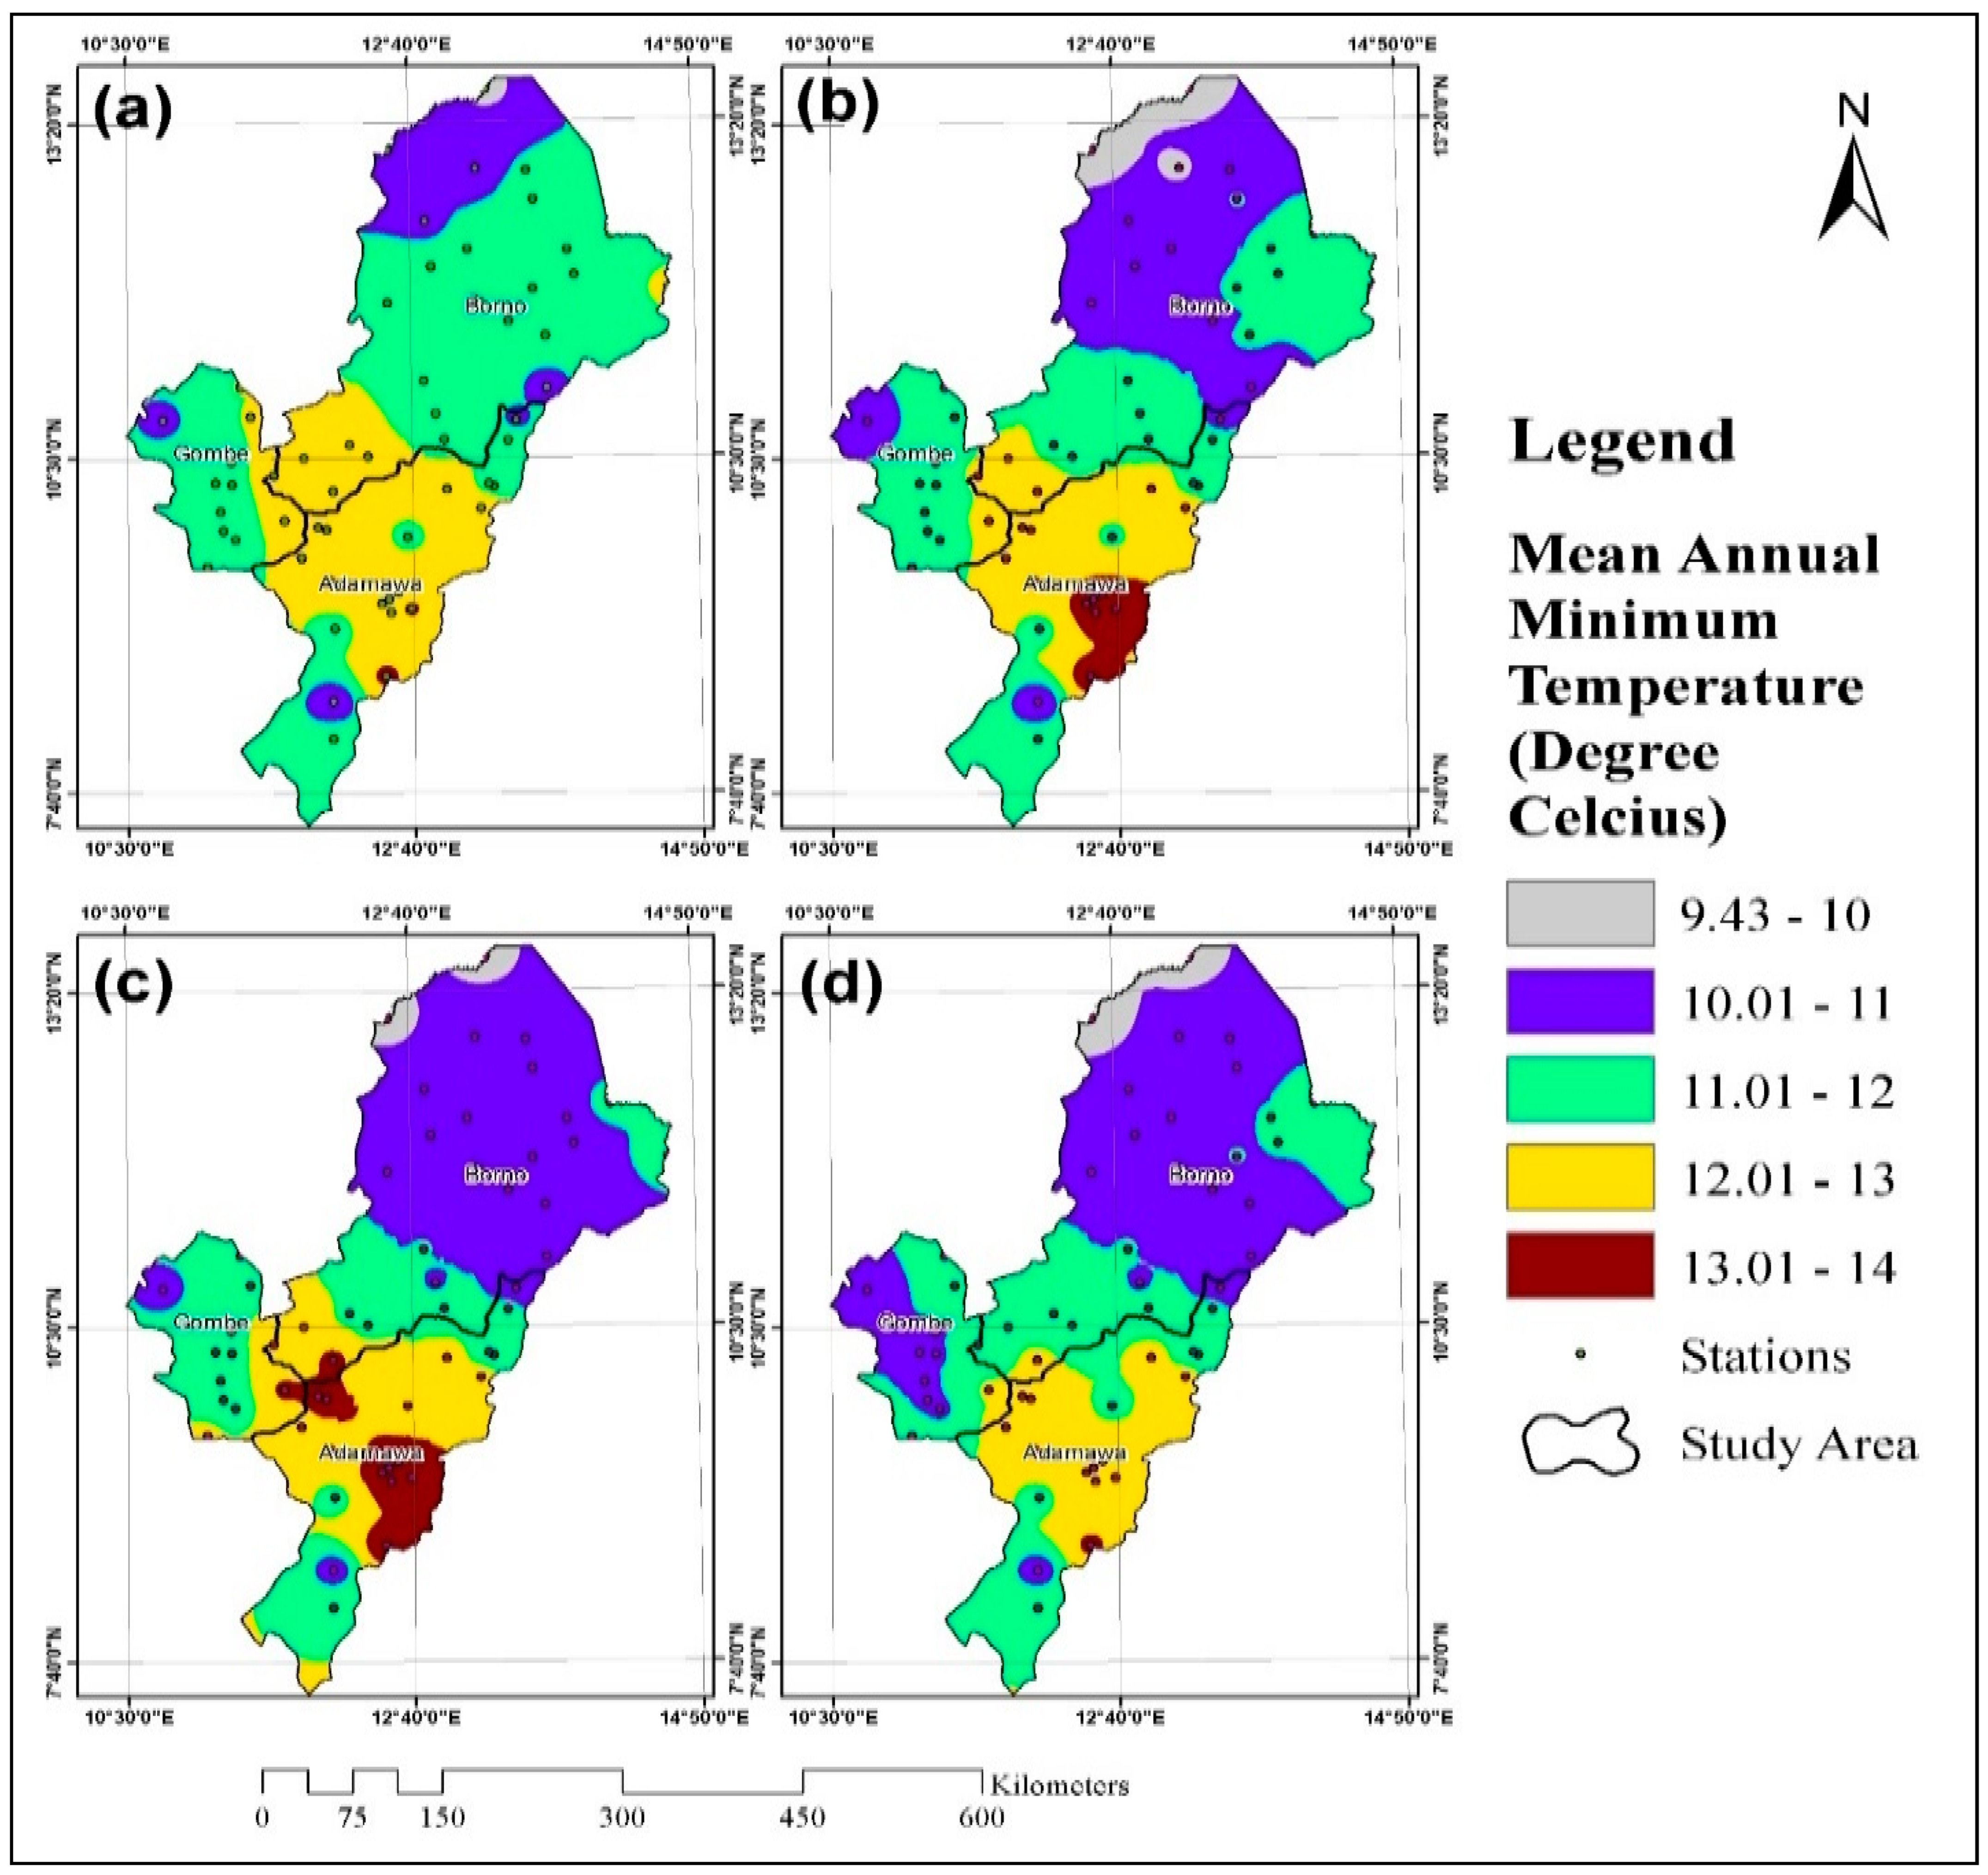
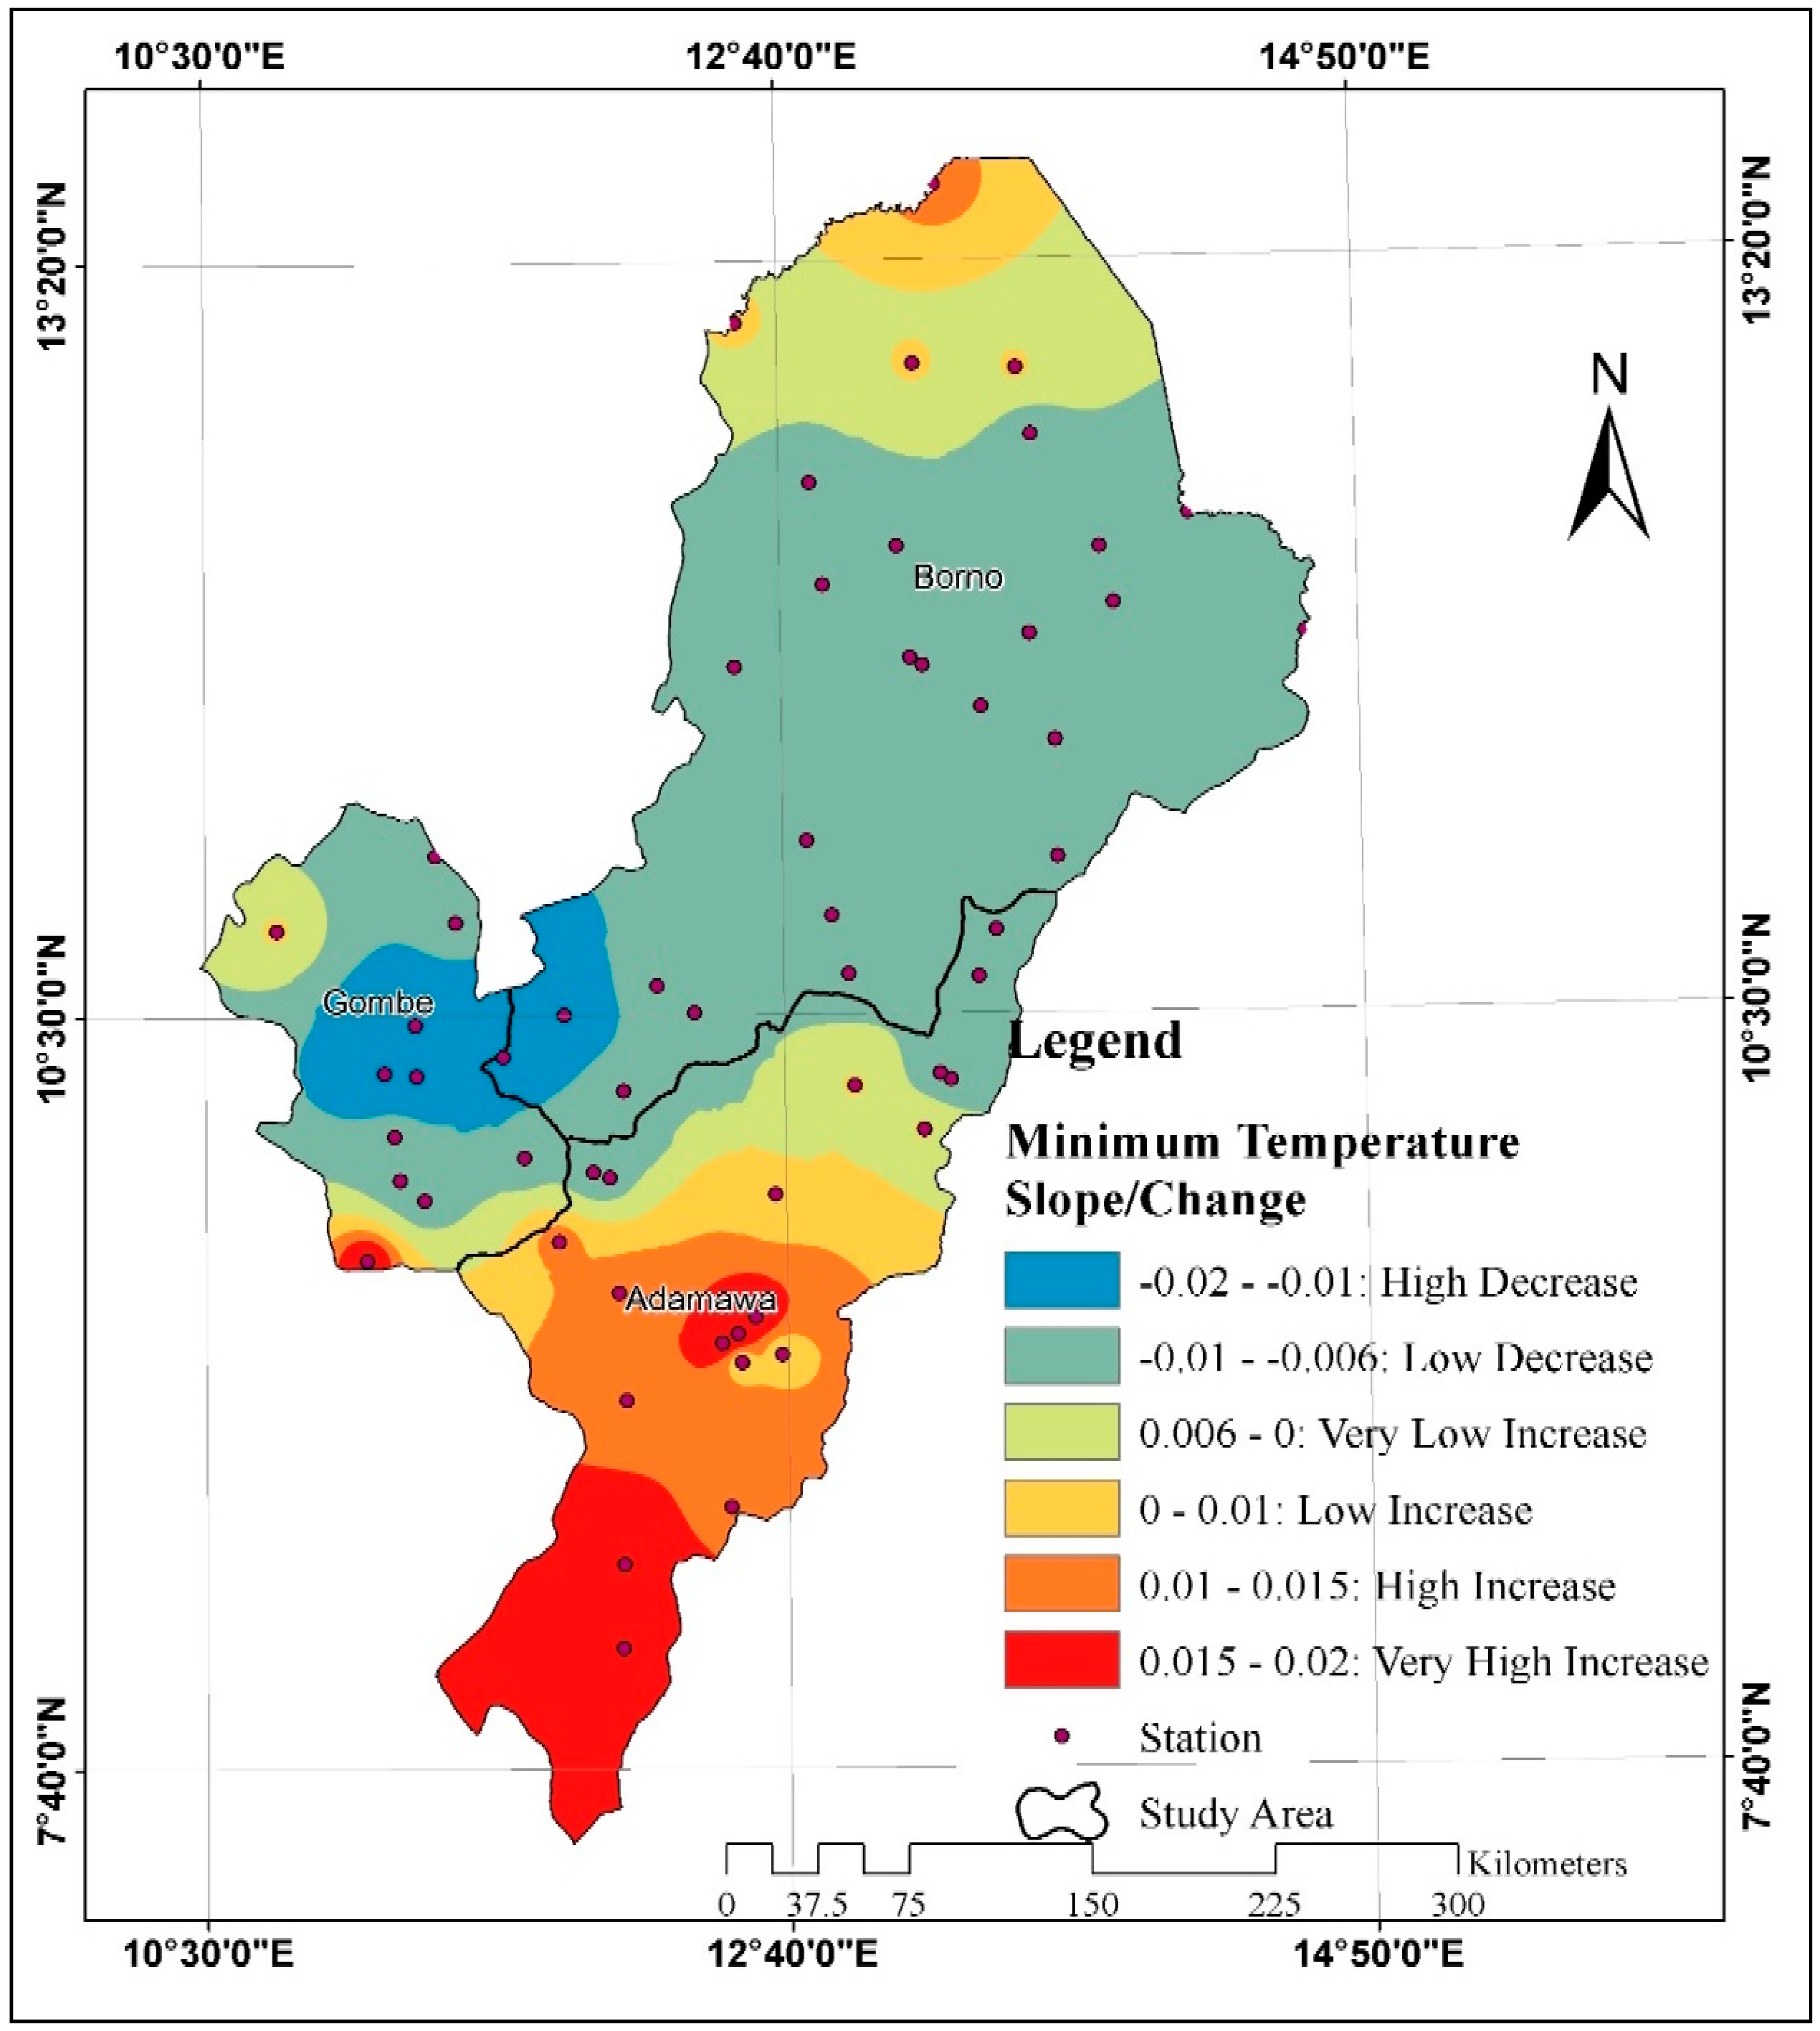
We found the results of the mean annual minimum temperature between 1981 and 1990, 1991 and 2000, 2001 and 2010, as well as 2011 and 2021 (Figure 9), together with the Sens slope estimation value for the years 1981 to 2021 in each of the states in the study location (Figure 10). The Sens slope value for the Adamawa state (0.005) signifies a low increase in minimum temperature over the years because its value is positive, while the Borno state has a Sens slope value of (−0.010), which signifies that minimum temperature has a very low decrease; finally, Gombe state with Sens slope value of −0.008 signifies a low decrease in minimum temperature. The mean total of the Sens slope estimation for the three states (−0.005) shows that generally in the three states there is a low decrease in minimum temperature (Supplementary S4 Table S3).

5. Discussion

Between 1981 and 2021 the rainfall trend in the study area shows a slight decrease as seen in Sen’s slope value of −0.0442 (S4), which calculated the mean annual rainfall. The result aligns with the findings of Bello et al., Abe et al., and Ikusemoran et al. [59,68,69], which observed declining rainfall in both the southern and northern regions of Gombe State, while the central region experienced an increase. See also the result of the Modified Mann–Kendall trend and Sen’s innovative trend result in Table 1 and Table S3.
Similar decreasing trends are also identified in Adamawa State [70]. Earlier studies [71,72] report an increasing trend in rainfall in Borno and Adamawa between 1970 and 2015. However, the decrease in rainfall from 2015 to date could be attributed to the issues of insecurity that have led to terrorism, banditry, insurgency, conflict, and communal clashes within the North-Eastern region, which has disrupted socio-economic activities and environmental stability in North-Eastern Nigeria. For further validation, refer to the modified Mann–Kendall trend and Sen’s innovative trend results in Table 1 and Table S3.
The mean annual maximum temperature shows a Sen’s slope value of 0.046, indicating a low increase (S4). This is consistent with Alhaji et al., Bello et al., and Ikusemoran et al. [50,59,69], which discovered a statistically significant increase in maximum temperature in Gombe State. Similarly, studies by Akindawa et al., Adedeji et al., and Adebayo et al. [70,71,73] note increasing maximum temperatures in Adamawa State, while a similar trend was documented in Borno State [74]. The Modified Mann–Kendall trend and Sen’s innovative trend results (Table 2 and Table S3) substantiate these findings.
Findings reveal a Sen’s slope value of −0.005, indicating a slight decline in the mean annual minimum temperature (S4). While previous studies [50,69] observed increasing minimum temperatures in Gombe, these increases were not statistically significant. Similarly, research in Adamawa [75] and Borno [74] reveals increasing minimum temperature. However, the decline observed in this study contrasts with those findings, suggesting regional variations or more localized influences on temperature trends. These discrepancies are also supported by the Modified Mann–Kendall trend and Sen’s innovative trend results in Table 3 and Table S3.
Decreasing rainfall patterns and rising temperatures in North-Eastern Nigeria have severe consequences, making the region vulnerable to global warming and environmental challenges, such as drought, which in turn affects agricultural productivity and food security. The disruption of ecosystems due to changing climate patterns further contributes to habitat loss, migration, and potential extinction of flora and fauna. In addition, climate-induced changes exacerbate the spread of diseases [76,77,78]. Agriculture, which is the major economic activity in the region, is heavily reliant on consistent rainfall, while the adverse effects of climate change can intensify ongoing social conflicts, communal clashes, and terrorism, worsening the situation.
It should be noted that researchers have observed that solar activity affects precipitation patterns and temperature cycles through mechanisms like the Sun’s magnetic field and its influence on Earth’s atmosphere. These interactions appear to contribute to variations in climate over decadal timescales, resembling cyclic patterns similar to the ~20-year oscillations seen in temperature and rainfall distribution maps [79].
The limitation of this study is that the observed “trends” are based on a relatively short 41-year period, which is insufficient to fully capture long-term climate changes. This brief timeframe may not adequately reflect true climate-scale variations, as climate trends typically require longer intervals for reliable analysis.

6. Conclusions

The results of Modified Mann–Kendall and Sen’s innovative trend analysis for annual time series on individual stations show that the number of statistically significant negative trends is greater than the statistically significant positive trends in rainfall. Similarly, the number of statistically significant positive trends is greater than the statistically significant negative trends in temperature indicating the decreasing trend in rainfall and increasing trend in maximum and minimum temperature. In the same vein, Sen’s slope estimator result of the trend analysis from the IDW interpolation shows that rainfall is on a low decrease, maximum temperature is on a low increase, and minimum temperature is on a low decrease in the study location. Therefore, the study recommends accurate and timely weather and climate information for planning proactive measures to mitigate and build resilience, by promoting sustainable practices in agriculture, water management, and urban planning to reduce and prevent rainfall and temperature extremes from becoming disasters and threats to livelihood in the study location.

Supplementary Materials

The following supporting information can be downloaded at: https://www.mdpi.com/article/10.3390/cli12120219/s1, Supplementary S1: Mann-Kendall Test; Supplementary S2 Figure S1: Test for serial autocorrelation in total annual rainfall; Supplementary S2 Figure S2: Test for serial autocorrelation in maximum temperature; Supplementary S2 Figure S3: Test for serial autocorrelation in minimum temperature; Supplementary S3 Table S1: Sen’s innovative trend analysis for Rainfall; Supplementary S3 Table S2: Sen’s innovative trend analysis for Maximum Temperature; Supplementary S3 Table S3: Sen’s innovative trend analysis for Minimum temperature; Supplementary S4 Table S1: Mean Annual Rainfall; Supplementary S4 Table S2: Mean Annual Maximum Temperature; Supplementary S4 Table S3: Mean Annual Minimum Temperature.

Author Contributions

Conceptualization D.I., E.T.U. and A.A.O.; methodology, D.I. and A.A.A.; visualization, D.I. and R.L.; funding acquisition, D.I. and A.A.O.; supervision and writing (review and editing), E.T.U., A.A.A. and R.L.; resources, formal analysis, software, and writing (original draft), D.I. All authors have read and agreed to the published version of the manuscript.

Funding

This work is part of the doctoral research program of the West African Science Service Center on Climate Change and Adapted Land Use (WASCAL), funded by the Federal Ministry of Education and Research (BMBF) Germany (www.wascal.org).

Data Availability Statement

The data presented in this study are under the copyright of the West African Science Service Centre on Climate Change and Adapted Land Use (WASCAL) and can be made available on request from the corresponding author.

Acknowledgments

The authors acknowledge and appreciate the German Federal Ministry of Education and Research (BMBF) for sponsoring this study. We also recognize the contributions of the management and staff of the West African Science Service Centre on Climate Change and Human Habitat (WASCAL), the Federal University of Technology, Minna, Niger State, Nigeria, and the University of Applied Science Neubrandenburg, Germany.

Conflicts of Interest

The authors declare no conflicts of interest.

References

  1. Megersa, B.; Markemann, A.; Angassa, A.; Ogutu, J.O.; Piepho, H.P.; Zaráte, A.V. Impacts of Climate Change and Variability on Cattle Production in Southern Ethiopia: Perceptions and Empirical Evidence. Agric. Syst. 2014, 130, 23–34. [Google Scholar] [CrossRef]
  2. Boudiaf, B.; Dabanli, I.; Sen, Z. Temperature and Precipitation Risk Assessment under Climate Change Effect in Northeast Algeria. Earth Syst. Environ. 2020, 4, 1–14. [Google Scholar] [CrossRef]
  3. Adeola, O.A.; Adeyemi, O.; Onyemaenu, V. Rainfall-Runoff in Conterminous Tropical River Basins of Southwestern Nigeria. Afr. Geogr. Rev. 2021, 42, 14–28. [Google Scholar] [CrossRef]
  4. Maharana, P.; Agnihotri, R.; Dimri, A.P. Changing Indian Monsoon Rainfall Patterns under the Recent Warming Period 2001–2018. Clim. Dyn. 2021, 57, 2581–2593. [Google Scholar] [CrossRef]
  5. Williams, M.R.; King, K.W. Changing rainfall patterns over the Western Lake Erie Basin (1975–2017): Effects on tributary discharge and phosphorus load. Water Resour. Res. 2020, 56, e2019WR025985. [Google Scholar] [CrossRef]
  6. Mu, D.; Luo, P.; Lyu, J.; Zhou, M.; Huo, A.; Duan, W.; Nover, D.; He, B.; Zhao, X. Impact of Temporal Rainfall Patterns on Flash Floods in Hue City, Vietnam. J. Flood Risk Manag. 2021, 14, e12668. [Google Scholar] [CrossRef]
  7. Shahfahad Talukdar, S.; Islam, A.R.M.T.; Das, T.; Naikoo, M.W.; Mallick, J.; Rahman, A. Application of advanced trend analysis techniques with clustering approach for analyzing rainfall trend and identification of homogenous rainfall regions in Delhi metropolitan city. Environ. Sci. Pollut. Res. 2023, 30, 106898–106916. [Google Scholar] [CrossRef]
  8. Eingrüber, N.; Korres, W. Climate Change Simulation and Trend Analysis of Extreme Precipitation and Floods in the Mesoscale Rur Catchment in Western Germany until 2099 Using Statistical Downscaling Model (SDSM) and the Soil & Water Assessment Tool (SWAT Model). Sci. Total Environ. 2022, 838, 155775. [Google Scholar]
  9. Ibebuchi, C.C. Patterns of Atmospheric Circulation in Western Europe Linked to Heavy Rainfall in Germany: Preliminary Analysis into the 2021 Heavy Rainfall Episode. Theor. Appl. Climatol. 2022, 148, 269–283. [Google Scholar] [CrossRef]
  10. Zittis, G.; Bruggeman, A.; Lelieveld, J. Revisiting future extreme precipitation trends in the Mediterranean. Weather. Clim. Extrem. 2021, 34, 100380. [Google Scholar] [CrossRef]
  11. McKay, R.C.; Boschat, G.; Rudeva, I.; Pepler, A.; Purich, A.; Dowdy, A.; Hope, P.; Gillett, Z.E.; Rauniyar, S. Can southern Australian rainfall decline be explained? A review of possible drivers. Wiley Interdiscip. Rev. Clim. Chang. 2023, 14, e820. [Google Scholar] [CrossRef]
  12. Zhang, F.; Biederman, J.A.; Dannenberg, M.P.; Yan, D.; Reed, S.C.; Smith, W.K. Five decades of observed daily precipitation reveal longer and more variable drought events across much of the western United States. Geophys. Res. Lett. 2021, 48, e2020GL092293. [Google Scholar] [CrossRef]
  13. Hanif, M.F.; Mustafa, M.R.U.; Liaqat, M.U.; Hashim, A.M.; Yusof, K.W. Evaluation of long-term trends of rainfall in Perak, Malaysia. Climate 2022, 10, 44. [Google Scholar] [CrossRef]
  14. Gao, F.; Wang, Y.; Chen, X.; Yang, W. Trend analysis of rainfall time series in Shanxi Province, Northern China (1957–2019). Water 2020, 12, 2335. [Google Scholar] [CrossRef]
  15. Twardosz, R.; Walanus, A.; Guzik, I. Warming in Europe: Recent trends in annual and seasonal temperatures. Pure Appl. Geophys. 2021, 178, 4021–4032. [Google Scholar] [CrossRef]
  16. Kew, S.F.; Philip, S.Y.; Hauser, M.; Hobbins, M.; Wanders, N.; Van Oldenborgh, G.J.; van der Wiel, K.; Veldkamp, T.I.E.; Kimutai, J.; Funk, C.; et al. Impact of precipitation and increasing temperatures on drought trends in eastern Africa. Earth Syst. Dyn. 2021, 12, 17–35. [Google Scholar] [CrossRef]
  17. Descals, A.; Gaveau, D.L.; Verger, A.; Sheil, D.; Naito, D.; Peñuelas, J. Unprecedented fire activity above the Arctic Circle linked to rising temperatures. Science 2022, 378, 532–537. [Google Scholar] [CrossRef]
  18. Allabakash, S.; Lim, S. Anthropogenic influence of temperature changes across East Asia using CMIP6 simulations. Sci. Rep. 2022, 12, 11896. [Google Scholar] [CrossRef] [PubMed]
  19. Iyakaremye, V.; Zeng, G.; Yang, X.; Zhang, G.; Ullah, I.; Gahigi, A.; Vuguziga, F.; Asfaw, T.G.; Ayugi, B. Increased high-temperature extremes and associated population exposure in Africa by the mid-21st century. Sci. Total Environ. 2021, 790, 148162. [Google Scholar] [CrossRef]
  20. Issahaku, A.R.; Campion, B.B.; Edziyie, R. Rainfall and temperature changes and variability in the Upper East Region of Ghana. Earth Space Sci. 2016, 3, 284–294. [Google Scholar] [CrossRef]
  21. Mosase, E.; Ahiablame, L. Rainfall and temperature in the Limpopo-river basin, Southern Africa: Means, variations, and trends from 1979 to 2013. Water 2018, 10, 364. [Google Scholar] [CrossRef]
  22. Panda, A.; Sahu, N. Trend analysis of seasonal rainfall and temperature pattern in Kalahandi, Bolangir and Koraput districts of Odisha, India. Atmos. Sci. Lett. 2019, 20, e932. [Google Scholar] [CrossRef]
  23. Twahirwa, A.; Oludhe, C.; Omondi, P.; Rwanyiziri, G.; Sebaziga Ndakize, J. Assessing variability and trends of rainfall and temperature for the district of Musanze in Rwanda. Adv. Meteorol. 2023, 2023, 7177776. [Google Scholar] [CrossRef]
  24. Edokpa, D.O.; Ede, P.N.; Diagi, B.E.; Ajiere, S.I. Rainfall and temperature variations in a dry tropical environment of Nigeria. J. Atmos. Sci. Res. 2023, 6, 50–57. [Google Scholar] [CrossRef]
  25. Hassan, S.F.; El-Tantawi, A.M.; Hashida, U.S. Trends of rainfall and temperature over northeastern Nigeria. J. Environ. Sci. Toxicol. Food Technol. 2017, 11, 1–9. [Google Scholar]
  26. Deumlich, D.; Gericke, A. Frequency trend analysis of heavy rainfall days for Germany. Water 2020, 12, 1950. [Google Scholar] [CrossRef]
  27. Wang, F.; Shao, W.; Yu, H.; Kan, G.; He, X.; Zhang, D.; Ren, M.; Wang, G. Re-evaluation of the power of the Mann-Kendall test for detecting monotonic trends in hydrometeorological time series. Front. Earth Sci. 2020, 8, 14. [Google Scholar] [CrossRef]
  28. Mallick, J.; Talukdar, S.; Alsubih, M.; Salam, R.; Ahmed, M.; Kahla, N.B.; Shamimuzzaman, M. Analysing the trend of rainfall in Asir region of Saudi Arabia using the family of Mann-Kendall tests, innovative trend analysis, and detrended fluctuation analysis. Theor. Appl. Climatol. 2021, 143, 823–841. [Google Scholar] [CrossRef]
  29. Pandey, V.; Pandey, P.K.; Chakma, B.; Ranjan, P. Influence of short-and long-term persistence on identification of rainfall temporal trends using different versions of the Mann-Kendall test in Mizoram, Northeast India. Environ. Sci. Pollut. Res. 2024, 31, 10359–10378. [Google Scholar] [CrossRef]
  30. Muia, V.K.; Opere, A.O.; Ndunda, E.; Amwata, D.A. Rainfall and Temperature Trend Analysis using Mann-Kendall and Sen’s Slope Estimator Test in Makueni County, Kenya. J. Mater. Environ. Sci. 2024, 15, 349–367. [Google Scholar]
  31. Ahmad, I.; Tang, D.; Wang, T.; Wang, M.; Wagan, B. Precipitation trends over time using Mann-Kendall and spearman’s rho tests in swat river basin, Pakistan. Adv. Meteorol. 2015, 2015, 431860. [Google Scholar] [CrossRef]
  32. Praveen, B.; Talukdar, S.; Shahfahad Mahato, S.; Mondal, J.; Sharma, P.; Islam, A.R.M.T.; Rahman, A. Analyzing trend and forecasting of rainfall changes in India using non-parametrical and machine learning approaches. Sci. Rep. 2020, 10, 10342. [Google Scholar] [CrossRef] [PubMed]
  33. Gündüz, F.; Zeybekoğlu, U. Analysis of temperature and precipitation series of Hirfanli Dam Basin by Mann Kendall, Spearman’s Rho and Innovative Trend Analysis. Turk. J. Eng. 2024, 8, 11–19. [Google Scholar] [CrossRef]
  34. Ferijal, T.; Batelaan, O.; Shanafield, M.; Alfahmi, F. Determination of rainy season onset and cessation based on a flexible driest period. Theor. Appl. Climatol. 2022, 148, 91–104. [Google Scholar] [CrossRef]
  35. Abatcha, I.; Mustapha, A.; Barkindo, A. Comprehensive Analysis of Rainfall Variability in Urban Maiduguri, Nigeria: Implications for Climate Resilience and Sustainable Development. Int. J. Environ. Clim. Chang. 2024, 14, 149–159. [Google Scholar] [CrossRef]
  36. Abel, J.; Amachigh, D.M. Climate Change, Rainfall Trends and Variation in Yola, Adamawa State Nigeria. Asian Res. J. Curr. Sci. 2024, 6, 86–95. [Google Scholar]
  37. Ariko, J.D.; Elisha, I.; Sawa, B.A. Analysis of Rainfall Trend and its Relationship with Sorghum Yield in Sudan Savanna Region of Nigeria. Int. J. Sci. Res. Multidiscip. Stud. 2024, 10, 34–44. [Google Scholar]
  38. Abaje, I.B.; Sunday, C.; Bello, Y.; Oyatayo, K.T. Evidence of Climate Change in the Northeastern Part of Nigeria from Statistical Analysis of Rainfall Data. Bokkos J. Appl. Sci. Rep. 2023, 2, 18–32. [Google Scholar]
  39. Obateru, R.O.; Adeyefa, A.O.; Fashae, O.A. Drought assessment and rainfall trend analysis in southwestern Nigeria. World Water Policy 2023, 9, 254–273. [Google Scholar] [CrossRef]
  40. Ugwu, E.B.I.; Ugbor, D.O.; Agbo, J.U.; Alfa, A. Analyzing rainfall trend and drought occurrences in Sudan Savanna of Nigeria. Sci. Afr. 2023, 20, e01670. [Google Scholar]
  41. Chinago, A.B. Analysis of rainfall trend, fluctuation and pattern over Port Harcourt, Niger Delta coastal environment of Nigeria. Biodivers. Int. J. 2020, 4, 1–8. [Google Scholar] [CrossRef]
  42. Ogunrinde, A.T.; Oguntunde, P.G.; Akinwumiju, A.S.; Fasinmirin, J.T. Analysis of recent changes in rainfall and drought indices in Nigeria, 1981–2015. Hydrol. Sci. J. 2019, 64, 1755–1768. [Google Scholar] [CrossRef]
  43. Obubu, J.P.; Mengistou, S.; Fetahi, T.; Alamirew, T.; Odong, R.; Ekwacu, S. Recent climate change in the Lake Kyoga basin, Uganda: An analysis using short-term and long-term data with standardized precipitation and anomaly indexes. Climate 2021, 9, 179. [Google Scholar] [CrossRef]
  44. Gamoyo, M.; Reason, C.; Obura, D. Rainfall variability over the East African coast. Theor. Appl. Climatol. 2015, 120, 311–322. [Google Scholar] [CrossRef]
  45. Palmer, P.I.; Wainwright, C.M.; Dong, B.; Maidment, R.I.; Wheeler, K.G.; Gedney, N.; Hickman, J.E.; Madani, N.; Folwell, S.S.; Abdo, G.; et al. Drivers and impacts of Eastern African rainfall variability. Nat. Rev. Earth Environ. 2023, 4, 254–270. [Google Scholar] [CrossRef]
  46. Shiru, M.S.; Shahid, S.; Dewan, A.; Chung, E.S.; Alias, N.; Ahmed, K.; Hassan, Q.K. Projection of meteorological droughts in Nigeria during growing seasons under climate change scenarios. Sci. Rep. 2020, 10, 10107. [Google Scholar] [CrossRef]
  47. Yahaya, O.M.; Ogolo, E.O.; Agele, S.O.; Olanrewaju, A.V. Monitoring Climate Extreme Events Trend in Nigeria Using Climpact2 Software. Fudma J. Sci. 2024, 8, 143–160. [Google Scholar] [CrossRef]
  48. Okoduwa, A.K.; Amaechi, C.F. Spatial Distribution of Climate Change Variables (Rainfall and Temperature): Case Study of Delta State, Nigeria. Research Square 2024. [Google Scholar] [CrossRef]
  49. Akinbile, C.O.; Ogunmola, O.O.; Abolude, A.T.; Akande, S.O. Trends and spatial analysis of temperature and rainfall patterns on rice yields in Nigeria. Atmos. Sci. Lett. 2020, 21, e944. [Google Scholar] [CrossRef]
  50. Alhaji, U.U.; Yusuf, A.S.; Edet, C.O.; Oche, C.O.; Agbo, E.P. Trend analysis of temperature in Gombe State using Mann-Kendall trend test. J. Sci. Res. Rep. 2018, 20, 1–9. [Google Scholar] [CrossRef]
  51. Jones, P.G.; Thornton, P.K. The potential impacts of climate change on maize production in Africa and Latin America in 2055. Glob. Environ. Chang. 2003, 13, 51–59. [Google Scholar] [CrossRef]
  52. World Health Organization. Ending the Neglect to Attain the Sustainable Development Goals: A Rationale for Continued Investment in Tackling Neglected Tropical Diseases 2021–2030; World Health Organization: Geneva, Switzerland, 2022. [Google Scholar]
  53. Yahaya, I.I.; Wang, Y.; Zhang, Z.; Inuwa, A.Y.; Zhao, Y.; You, Y.; Basiru, H.A.; Ochege, F.U.; Na, Z.; Ogbue, C.P.; et al. Assessing desertification vulnerability and mitigation strategies in northern Nigeria: A comprehensive approach. Heliyon 2024, 10, e31167. [Google Scholar] [CrossRef]
  54. Hewitt, C.D.; Stone, R. Climate services for managing societal risks and opportunities. Clim. Serv. 2021, 23, 100240. [Google Scholar] [CrossRef]
  55. Madhuri. How Do Climate Information Services (CIS) Affect Farmers’ Adaptation Strategies? A Systematic Review. Clim. Serv. 2023, 32, 100416. [Google Scholar] [CrossRef]
  56. Tukur, A.L. Tragedy Beyond the Commons: Livelihoods and Environmental Challenges in the Northeast, Nigeria; Paraclete Publishers: Brewster, MA, USA, 2015. [Google Scholar]
  57. Bello, Y.; Msheliza, D.S. Smallholder Farmers’ Adaptation and Constraints to Climate Change in Gombe State, Nigeria. Fudma Int. J. Soc. Sci. 2019, 1, 123–136. [Google Scholar]
  58. Idi, S.A.; Jibrin, S.A.; Bulama, Y.M.; Guruna, A.M. Effect of Climate Change on Poultry Production in Maiduguri Metropolis, Borno State, Nigeria. J. Agric. Environ. Resour. Manag. 2024, 6, 50–60. [Google Scholar]
  59. Bello, Y.; Adebayo, A.A.; Abubakar, B. Analysis of rainfall and temperature changes in Gombe State, Nigeria. FUDMA J. Sci. 2020, 4, 632–646. [Google Scholar]
  60. Jin, J.; Wang, G.; Zhang, J.; Yang, Q.; Liu, C.; Liu, Y.; He, R. Impacts of climate change on hydrology in the Yellow River source region, China. J. Water Clim. Change 2018, 11, 916–930. [Google Scholar] [CrossRef]
  61. Sen, P.K. Estimates of the regression coefficient based on Kendall’s tau. J. Am. Stat. Assoc. 1963, 63, 1379–1389. [Google Scholar] [CrossRef]
  62. Yue, S.; Pilon, P.; Phinney, B.; Cavadias, G. The influence of autocorrelation on the ability to detect trend in hydrological series. Hydrol. Process. 2002, 16, 1807–1829. [Google Scholar] [CrossRef]
  63. Şen, Z. Innovative Trend Analysis Methodology. J. Hydrol. Eng. 2012, 17, 10421046. [Google Scholar] [CrossRef]
  64. Alashan, S. Combination of modified Mann-Kendall method and Şen innovative trend analysis. Eng. Rep. 2020, 2, e12131. [Google Scholar] [CrossRef]
  65. Abdulkadir, Y. Analysis of climate data using spatial techniques to estimate rainfall in the northwest of Nigeria. FUDMA J. Sci. 2021, 5, 174–181. [Google Scholar] [CrossRef]
  66. Hossain, M.M.; Garg, N.; Anwar, A.F.; Prakash, M. Comparing spatial interpolation methods for CMIP5 monthly precipitation at catchment scale. In Sustainable Water Resources Development and Management; Excel India Publishers: Aurangabad, India, 2021; Volume 285. [Google Scholar]
  67. Ozelkan, E.; Bagis, S.; Ozelkan, E.C.; Ustundag, B.B.; Yucel, M.; Ormeci, C. Spatial interpolation of climatic variables using land surface temperature and modified inverse distance weighting. Int. J. Remote Sens. 2015, 36, 1000–1025. [Google Scholar] [CrossRef]
  68. Abe, A.O.; Adeniji, Q.A.; Rabiu, J.A.; Adegboyega, O.; Raheem, I.O.; Rasaki, M.G.; Sada, S.M.; Fidelis, L. Statistical analysis and forecasting of rainfall patterns and trends in Gombe North-Eastern Nigeria. Iraqi J. Phys. 2022, 20, 64–77. [Google Scholar]
  69. Ikusemoran, M.; Andrew, E.; Bello, Y. Geospatial Techniques for Mapping and Analysis of Climatic Variables in Gombe State, North-East Nigeria. FUDMA J. Agric. Agric. Technol. 2023, 9, 153–170. [Google Scholar] [CrossRef]
  70. Ankindawa, B.A.; Bitrus, B.; Vanke, I.; Seli, A.B. Hydro-Meteorological Drought Assessment in Adamawa State, North-Eastern Nigeria. Niger. J. Eng. Sci. Technol. Res. 2023, 9, 129–143. [Google Scholar]
  71. Adedeji, T.; Utah, E.U.; Sombo, T.E. Monthly variation and annual trends of rainfall across major climatic zones in Nigeria. IOSR J. Appl. Phys. 2018, 10, 15–28. [Google Scholar]
  72. Bose, M.M.; Abdullahi, A.M.; Kasim, I.; Haruna, R.; Mande, K.H.; Abdullahi, A.C. Rainfall Trend Detection in Northern Nigeria over the period of 1970–2012. J. Environ. Earth Sci. 2015, 5, 94. [Google Scholar]
  73. Adebayo, A.A.; Zemba, A.A.; Ray, H.H.; Dayya, S.V. Climate change in Adamawa state, Nigeria: Evidence from Agro climatic Parameters. Adamawa State Univ. J. Sci. Res. 2012, 2, 2–19. [Google Scholar]
  74. John, P.H.; Ojeh, V.N.; Felix, N.N. Estimating the Impact of Climate Change on Desertification in Northern Borno: A Geo-Spatial Approach. Clim. Chang. 2018, 4, 144–155. [Google Scholar]
  75. Ezra, A.; Istifanus, V.; Musa, I.; Buba, S.; Jennifer, H.H. Effects of climatic elements on surface water in Yola north LGA, Adamawa state, Nigeria. Ethiop. J. Environ. Stud. Manag. 2021, 14, 880–894. [Google Scholar]
  76. Taddese, N. The Cause of Rural-Urban Migration to Addis Ababa and Its Implication on Migrants and Their Phases of Origin (A Case Study On Migrants Working On Some Selected Construction Sites in Addis Ababa, Ethiopia). Ph.D. Thesis, St. Mary’s University, San Antonio, TX, USA, 2017. [Google Scholar]
  77. Abdullahi, M.A.; Mahadi, A.A.; Kyari, M.B. Geographical Study of Rural-Urban Migration in Damaturu. Afr. Sch. J. Env. Des. Constr. Mgt. 2019, 15, 343–360. [Google Scholar]
  78. Kanayochukwu, E.C.; Dogo, B. Profiling the Characteristics of Karu Slum, Nasarawa State, Nigeria. J. Serv. Sci. Manag. 2019, 12, 605–619. [Google Scholar] [CrossRef]
  79. Turner, T.E.; Swindles, G.T.; Charman, D.J.; Langdon, P.G.; Morris, P.J.; Booth, R.K.; Parry, L.E.; Nichols, J.E. Solar cycles or random processes? Evaluating solar variability in Holocene climate records. Sci. Rep. 2016, 6, 23961. [Google Scholar] [CrossRef]
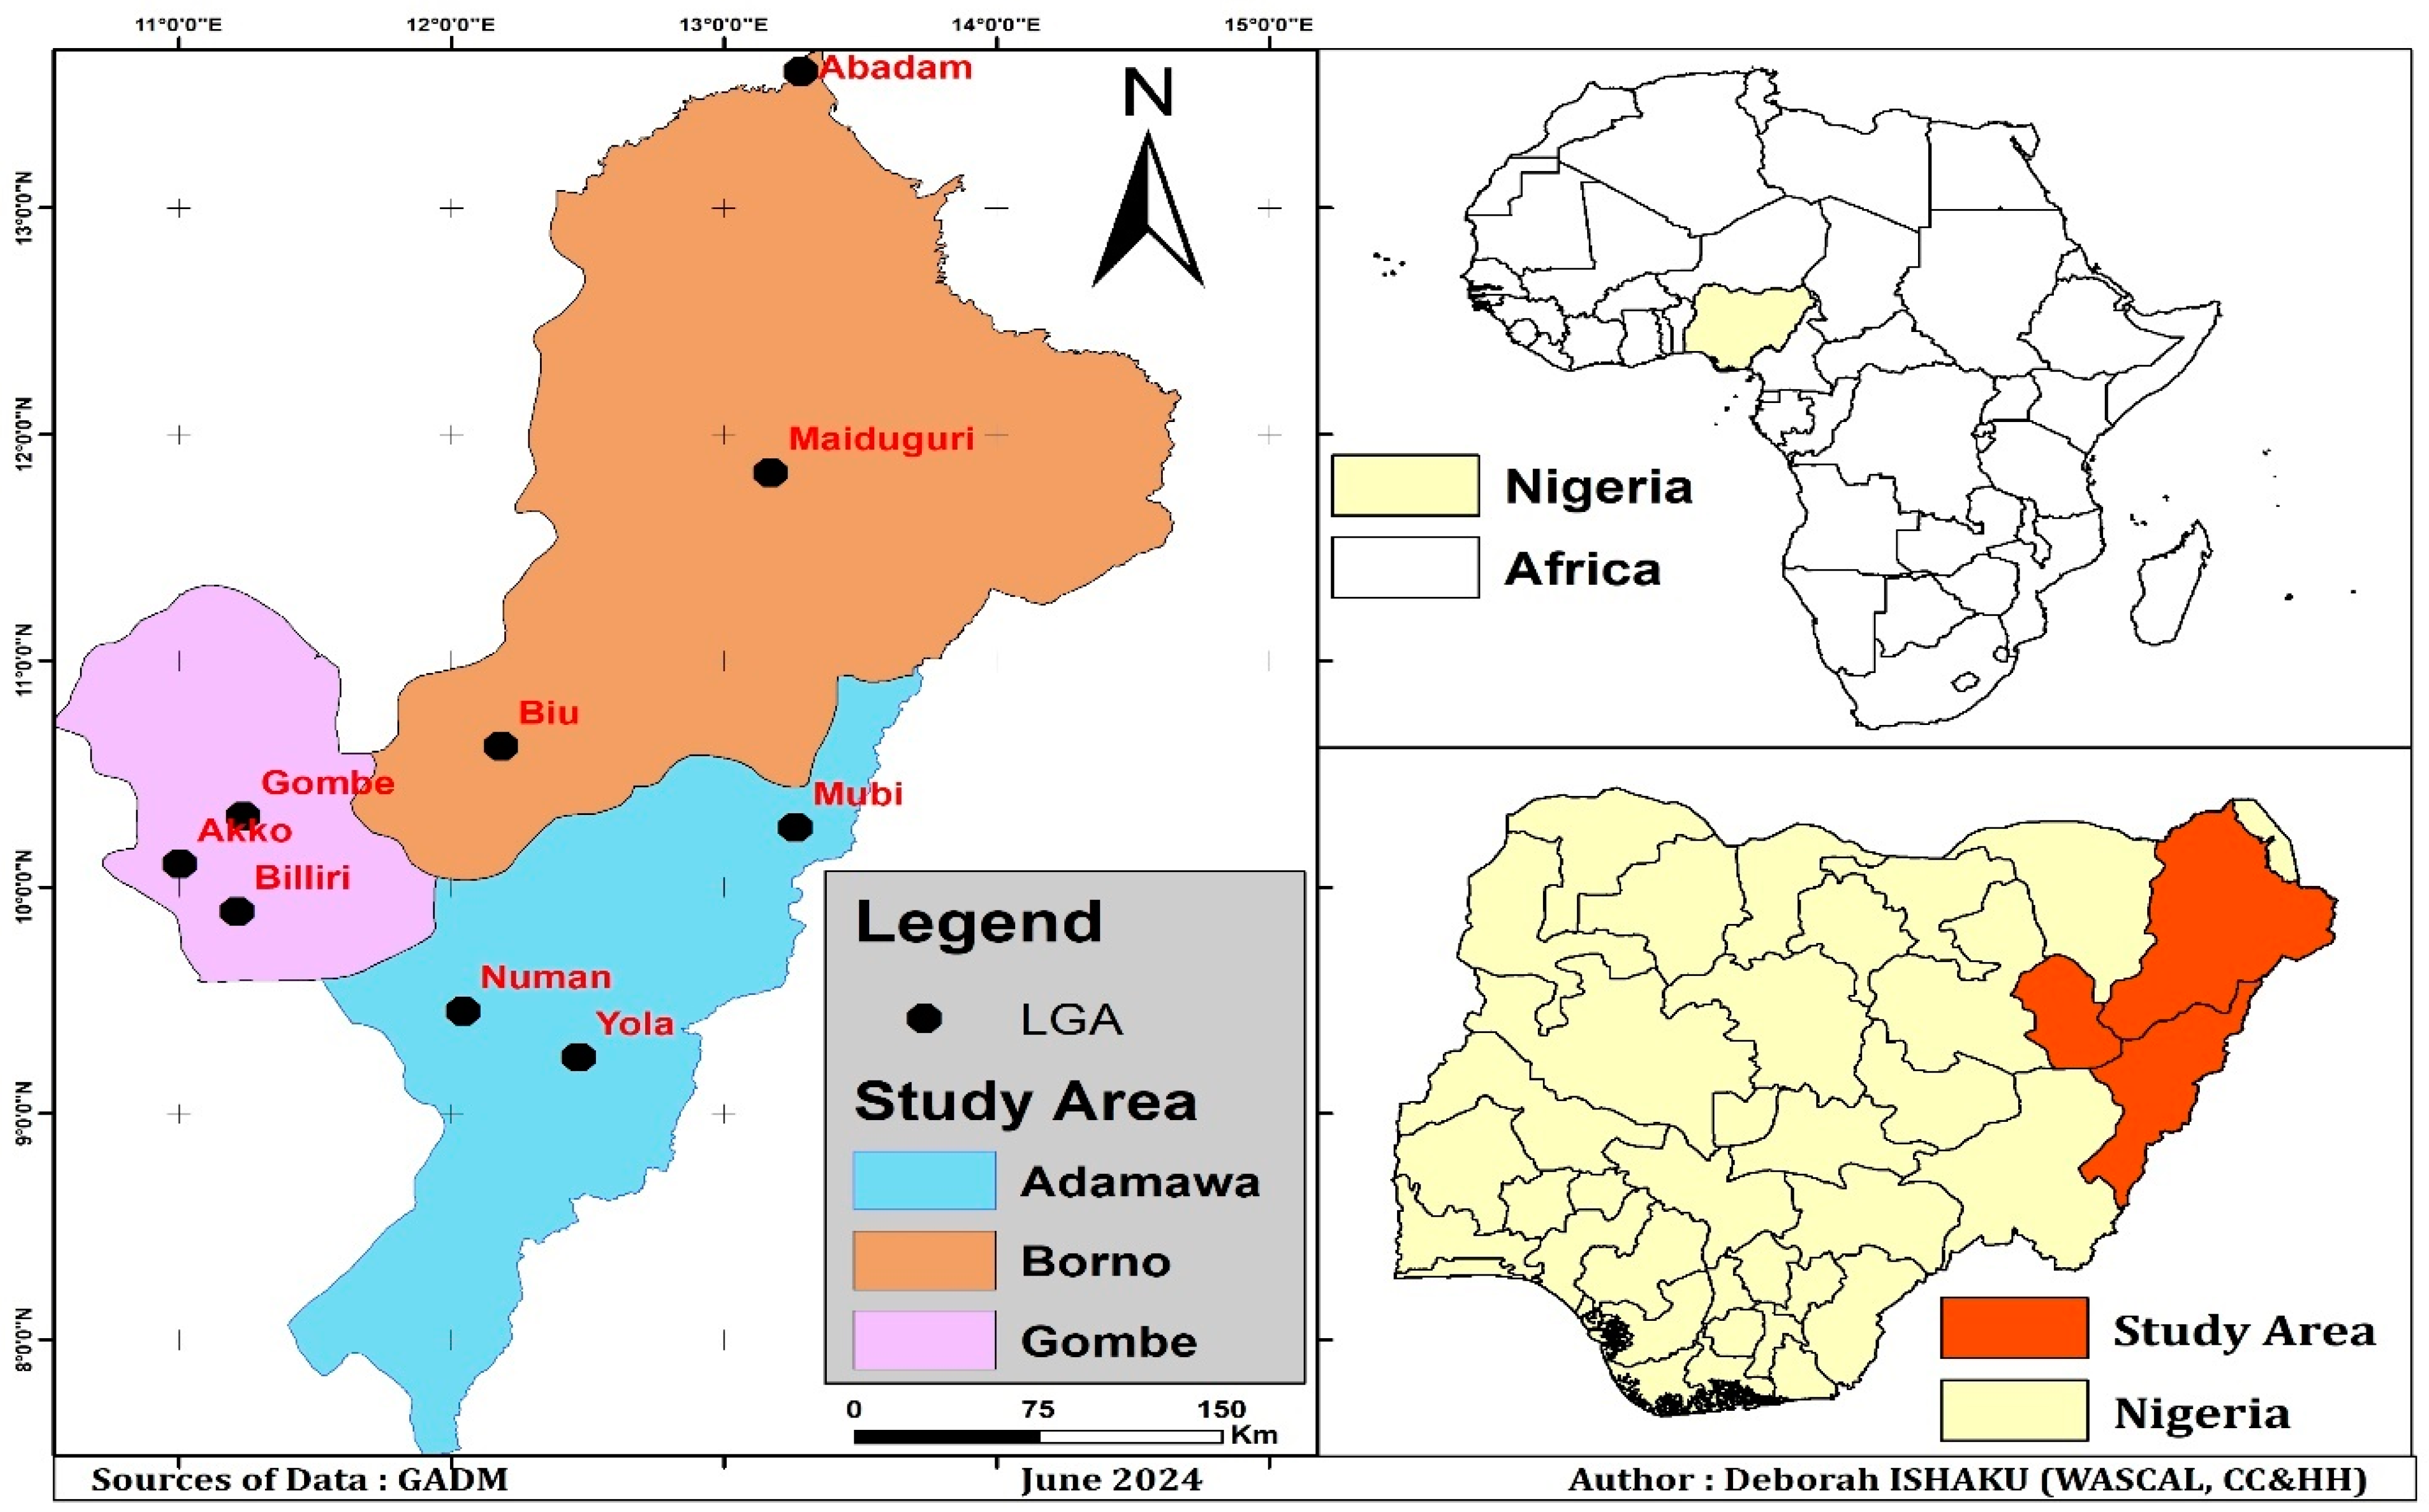
Figure 1. Map of the study area showing nine (9) selected points of data collection represented as Local Government Areas (LGA).
Climate 12 00219 g001
Figure 2. Total annual rainfall between 1991 and 2021 in the study area.
Climate 12 00219 g002
Figure 3. Maximum temperature between 1991 and 2021 in the study.
Climate 12 00219 g003
Figure 4. Minimum temperature between 1991 and 2021 in the study area.
Climate 12 00219 g004
Figure 5. Mean annual rainfall—(a) 1981–1990, (b) 1991–2000, (c) 2001–2010, (d) 2011–2021.
Climate 12 00219 g005
Figure 6. Precipitation change over the years (1981 to 2021).
Climate 12 00219 g006
Figure 7. Mean annual maximum temperature—(a) 1981–1990, (b) 1991–2000, (c) 2001–2010, (d) 2011–2021.
Climate 12 00219 g007
Figure 8. Maximum temperature changes over the years (1981 to 2021).
Climate 12 00219 g008
Figure 9. Mean annual minimum temperature (a) 1981–1990, (b) 1991–2000, (c) 2001–2010, (d) 2011–2021.
Climate 12 00219 g009
Figure 10. Minimum temperature change over the years (1981 to 2021).
Climate 12 00219 g010
Table 1. Modified Mann–Kendall trend for rainfall.
StationKendall’s TauZp-ValueA
Akko−0.03780−0.33710.7883 **0.05
Gombe0.06820.61800.6266 **0.05
Billiri−0.0378−0.33710.7883 **0.05
Abadam0.33173.04720.0023 *0.05
Biu0.13171.20230.2865 **0.05
Maiduguri−0.1817−1.66430.0528 **0.05
Mubi0.13901.269850.2041 **0.05
Numan−0.3475−5.41390.0000 *0.05
Yola−0.2512−2.30460.0211 *0.05
* Significant at p-value < 0.05. ** Insignificant at p-value > 0.05.
Table 2. Modified Mann–Kendall trend for maximum temperature.
StationKendall’s TauZp-ValueA
Akko0.40853.55130.0003 *0.05
Gombe0.39513.62920.0002 *0.05
Billiri0.40853.55130.0003 *0.05
Abadam0.25603.30950.0009 *0.05
Biu0.25972.15630.0310 *0.05
Maiduguri0.31953.79810.0001 *0.05
Mubi0.25602.11920.0340 *0.05
Numan0.35242.54760.0108 *0.05
Yola0.35732.66590.0076 *0.05
* Significant at p-value < 0.05.
Table 3. Modified Mann–Kendall trend for minimum temperature.
StationKendall’s TauZp-ValueA
Akko−0.0609−0.55030.5820 **0.05
Gombe0.1658−1.51630.1294 **0.05
Billiri−0.0609−0.55030.5820 **0.05
Abadam0.12561.69960.0892 **0.05
Biu−0.1134−1.65550.0978 **0.05
Maiduguri−0.0646−0.58410.5591 **0.05
Mubi−0.0926−0.84250.3995 **0.05
Numan0.04260.38190.7024 **0.05
Yola0.03530.31450.7531 **0.05
** Not significant at p-value > 0.05.
Disclaimer/Publisher’s Note: The statements, opinions and data contained in all publications are solely those of the individual author(s) and contributor(s) and not of MDPI and/or the editor(s). MDPI and/or the editor(s) disclaim responsibility for any injury to people or property resulting from any ideas, methods, instructions or products referred to in the content.