Article

CO2 Emission from Caves by Temperature-Driven Air Circulation—Insights from Samograd Cave, Croatia

1
Department of Geography, Faculty of Science, University of Zagreb, 10000 Zagreb, Croatia
2
Emil Racoviță Institute of Speleology, Romanian Academy, 400006 Cluj-Napoca, Romania
3
Karst Research Institute ZRC SAZU, 6230 Postojna, Slovenia
4
Stable Isotope Laboratory, Ștefan cel Mare University, 720229 Suceava, Romania
5
School of Geology, Department of Physical Geography, Aristotle University of Thessaloniki, 54636-GR Thessaloniki, Greece
6
Department of Physics, Faculty of Science, University of Zagreb, 10000 Zagreb, Croatia
*
Author to whom correspondence should be addressed.
Climate 2024, 12(12), 199; https://doi.org/10.3390/cli12120199
Submission received: 8 October 2024 / Revised: 11 November 2024 / Accepted: 25 November 2024 / Published: 26 November 2024

Abstract

:
Opposite to atmospheric CO2 concentrations, which reach a minimum during the vegetation season (e.g., June–August in the Northern Hemisphere), soil CO2 reaches a maximum in the same period due to the root respiration. In karst areas, characterized by high rock porosity, this excess CO2 seeps inside caves, locally increasing pCO2 values above 1%. To better understand the role of karst areas in the carbon cycle, it is essential to understand the mechanisms of CO2 dynamics in such regions. In this study, we present and discuss the spatial and temporal variability of air temperature and CO2 concentrations in Samograd Cave, Croatia, based on three years of monthly spot measurements. The cave consists of a single descending passage, resulting in a characteristic bimodal climate, with stable conditions during summer (i.e., stagnant air inside the cave) and a strong convective cell bringing in cold air during winter. This bimodality is reflected in both CO2 concentrations and air temperatures. In summer, the exchange of air through the cave’s main entrance is negligible, allowing the temperature and CO2 concentration to equilibrate with the surrounding rocks, resulting in high in-cave CO2 concentrations, sourced from enhanced root respiration. During cold periods, CO2 concentrations are low due to frequent intrusions of fresh external air, which effectively flush out CO2 from the cave. Both parameters show distinct spatial variability, highlighting the role of cave morphology in their dynamics. The CO2 concentrations and temperatures have increased over the observation period, in line with external changes. Our results highlight the role of caves in transferring large amounts of CO2 from soil to the atmosphere via caves, a process that could have a large impact on the global atmospheric CO2 budget, and thus, call for a more in-depth study of these mechanisms.

1. Introduction

The year 2023 was the 12th consecutive year of global atmospheric CO2 increase by at least 2 parts per million (ppm) per year, and this trend continues in 2024 [1,2]. This increase is resulting from continuously increasing fossil CO2 emissions that outpace the reduction in land use, land-use change, and forestry emissions (although the uncertainties for this reduction are too large to be considered robust [1]) and ocean uptake. The anthropogenic emissions linked to burning fossil fuels and land-use changes occur additionally due to natural sources in the atmosphere, hydrosphere, and biosphere [3]. While our conceptual understanding of the mechanisms behind natural CO2 release to the atmosphere is adequate, large uncertainties remain, especially linked to the amount of CO2 released by root respiration and stored as ground air in the unsaturated zone of karst aquifers [4]. These aquifers occur in regions with carbonate and other evaporative rocks, which cover about 20% of the Earth’s ice-free continental area.
Ground air in limestone rocks has long been known to be an important reservoir of CO2, although the source of the gas and its interactions with the various reservoirs (soil CO2, microbial-produced CO2, degassing from water, precipitation of secondary calcite, etc.) are only partly understood [4,5,6,7,8]. These sources result in cave atmospheres accumulating large amounts of high concentrations of CO2, where values up to several thousands of ppm are common [9,10,11,12,13,14], and, in particular cases, even up to tens of thousands ppm CO2. The exact source of this CO2 is unclear, with soil CO2 [7] and ground air [5] being the most important ones. Monitoring studies in caves located in different climates have added important new information to our understanding of CO2 dynamics in caves [15,16,17,18] and the links with external atmospheres. Daily to yearly variations in pCO2 have been observed, linked to seasonal changes in soil CO2 production, the influence of cave biota, cave ventilation regimes, and visitors’ influence. No study demonstrated a clear link between the long-term growth of atmospheric CO2 concentrations and similar dynamics in caves. Such a link is difficult to observe, as the various sources of cave CO2 and the large values observed in caves (see above) potentially mask the external signal. Additionally, the internal cave environment is highly diverse, shaped by cave morphology, sediments, and hydrology not only in large conduits, but also in dense networks of impassable fissures. These fissures, though inaccessible to humans, contribute significantly to the cave’s atmospheric dynamics [6,14,19,20]. Furthermore, the complex cave morphology creates substantial differences between cave sections, making accurate measurements even more challenging due to the technical limitations of current measuring equipment.
Disentangling the complex interactions between CO2 sinks and sources in caves and karst areas requires long term observations that are not readily available. Especially missing are data linking CO2 dynamics with climatic parameters that would help to understand the “export” of CO2 from caves, a yet poorly understood mechanism. Here, we provide a large dataset of cave climate and CO2 concentrations (pCO2) from Samograd Cave (Croatia) and discuss their long- and short-term variations. We show that complex interactions between cave morphology and microclimatic conditions lead to large quantities of CO2 being exported from karst areas, a yet poorly constrained but potentially important source of CO2 adding to the global atmospheric carbon budget.

2. Materials and Methods

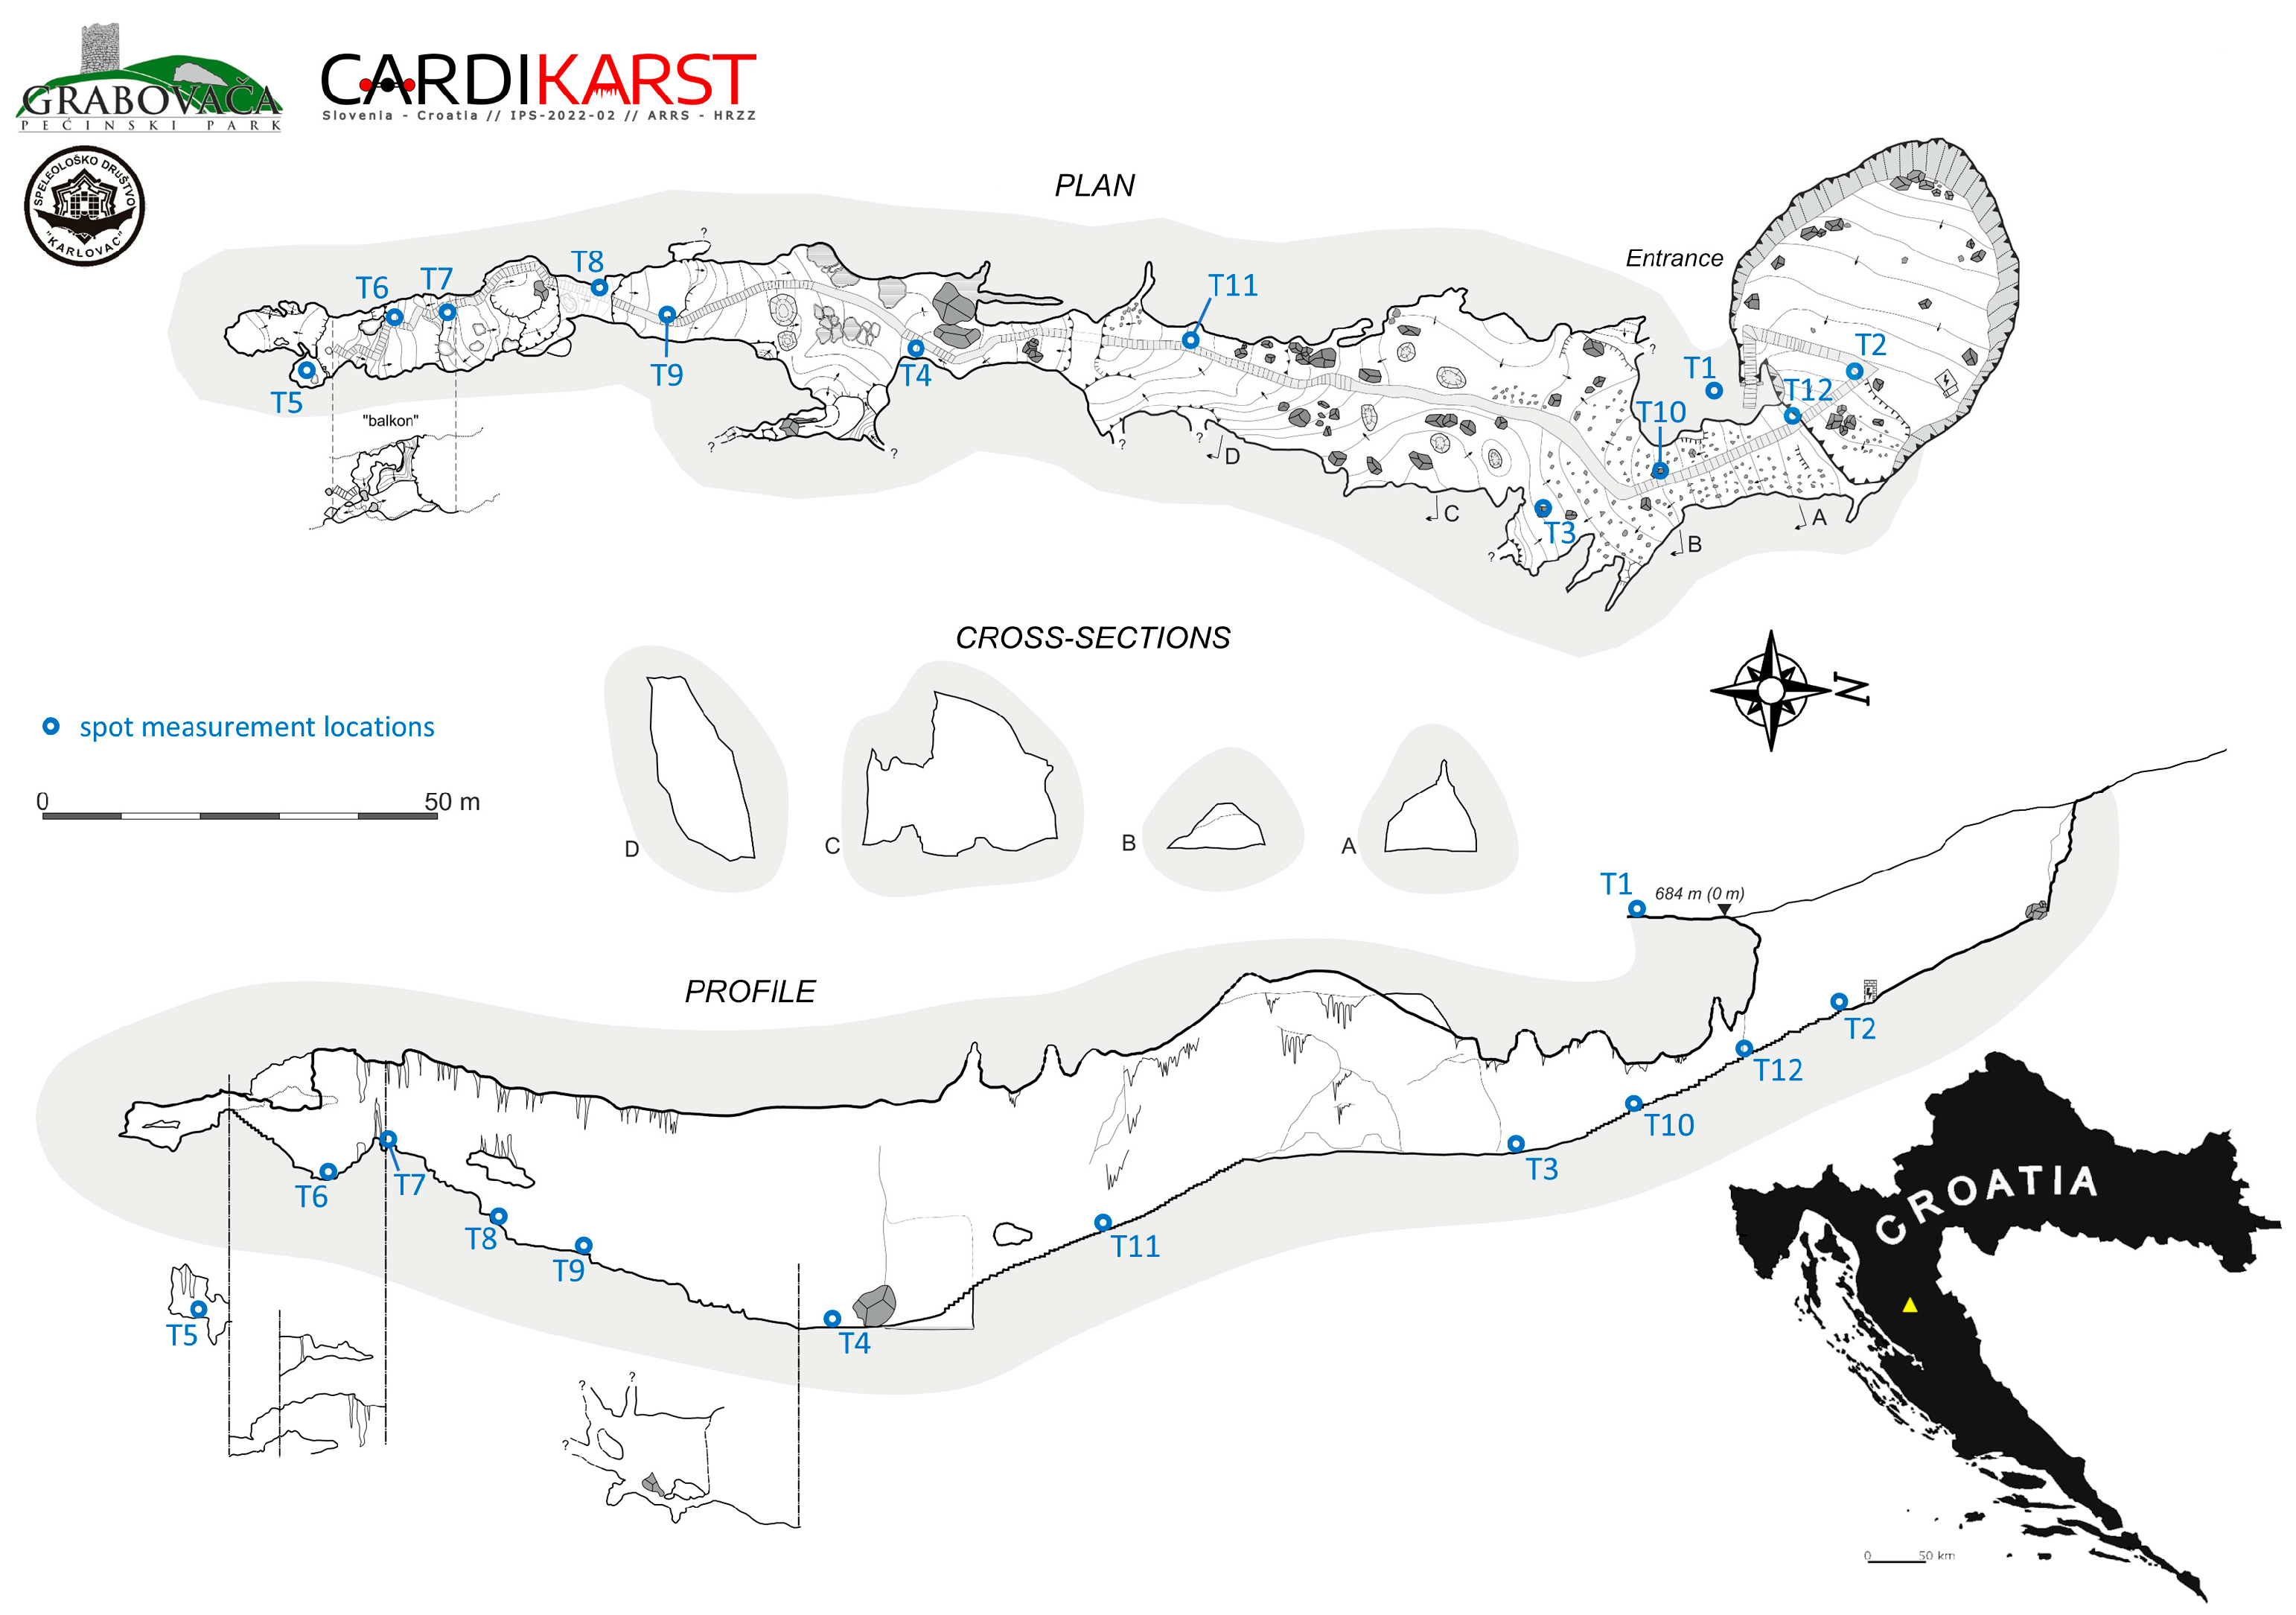
2.1. Cave Description

Samograd Cave is located on Grabovača hill in Perušić (Cave Park Grabovača, Lika region, Croatia, Figure 1), where the entrance elevation is 684 m above sea level (asl).
The cave features a simple morphology with a single entrance and a unique 346 m long passage, up to 32 m high and 25 m wide. The deepest point of the cave is 52.7 m below the surface; alternatively, if measured from the entrance of the cave itself, at the bottom of the doline (spot measuring point T2 in Figure 1), the cave depth is 40.5 m. Beyond the entrance, the main cave passage (8–17 m wide and 3–11.5 m high) is steeply descending. The bottom of this passage is covered by debris, limestone blocks, and soil derived from the bottom of the entrance doline. The ceiling has a complex topography due to the dense network of collapse and dissolution features (e.g., chimneys, and half tubes). This entrance section is followed by a large (18–33 m wide and 11–22 m high) but short (35 m long) SSW-oriented passage, with a flat to slightly inclined floor, covered by rock debris, while further inside the cave, there are flowstones and large dome-shaped speleothems. The ceiling is characterized by a complex topography controlled by a fault zone, giving the gallery a characteristic A-shaped cross section. The gallery then narrows slightly and slopes steeply towards the lowest point, but the ceiling maintains a similar height with a similar topography (as in previous part), featuring numerous chimneys as well as flat rock surfaces. There are also several fracture zones through which, after heavy rain or snowmelt, a significant amount of percolating water accumulates into the passage, forming small streams on the ground. The passage width at the lowest part of the cave is 11.5–16.5 m, with a maximum height of 32 m. From this flat area, the passage continues towards the next section along an ascending passage, up to 10 m wide and up to 22.7 m high. The ceiling also ascends parallel to the bottom, somewhat milder slope. This section is characterized by partially human-made flat terraces covered with sinter and rock debris. After a narrow section, the cave continues, reaching a widened part (up to 10 m wide and 16.5 m high) which is shaped like a dome (the 4th along the cave, see Figure 1). The final 40 m of the gallery consists of a narrow and steep passage rich in speleothems.

2.2. Methods

Air temperature (Tair) and CO2 concentration were recorded at ground level at 12 stations (Figure 1 and Table 1) with a handheld AZ 77525 multimeter (AZ Instrument Corp., Taiwan) monthly between March 2021 and February 2024.
The multimeter is equipped with Non-Dispersive Infrared Sensor (NDIR) that is calibrated at 400 parts per million (ppm) in open air. The CO2 measuring range is 0–9999 ppm with 1 ppm resolution and ±50 ppm accuracy. Air temperature resolution is 0.1 °C and the accuracy is ±0.6 °C. Measurements were performed on a monthly basis at 12 stations on a longitudinal profile from the entrance to the end of the cave as follows (Figure 1): one location at the surface above the cave (T1), one location at the bottom of the collapse doline in front of the entrance (T2), and 10 locations from the entrance towards the end of the cave. All measurements of CO2 and air temperature were performed at ground level on various surfaces as follows: bare soil (T1), soil covered with sparse vegetation (T2), rock debris, and flowstone (all other locations). Measurements outside the cave (T1 and T2) were always conducted in the shade.

3. Results

The results of the air temperature and CO2 measurements in Samograd Cave are presented in Figure 2 and summarized below.

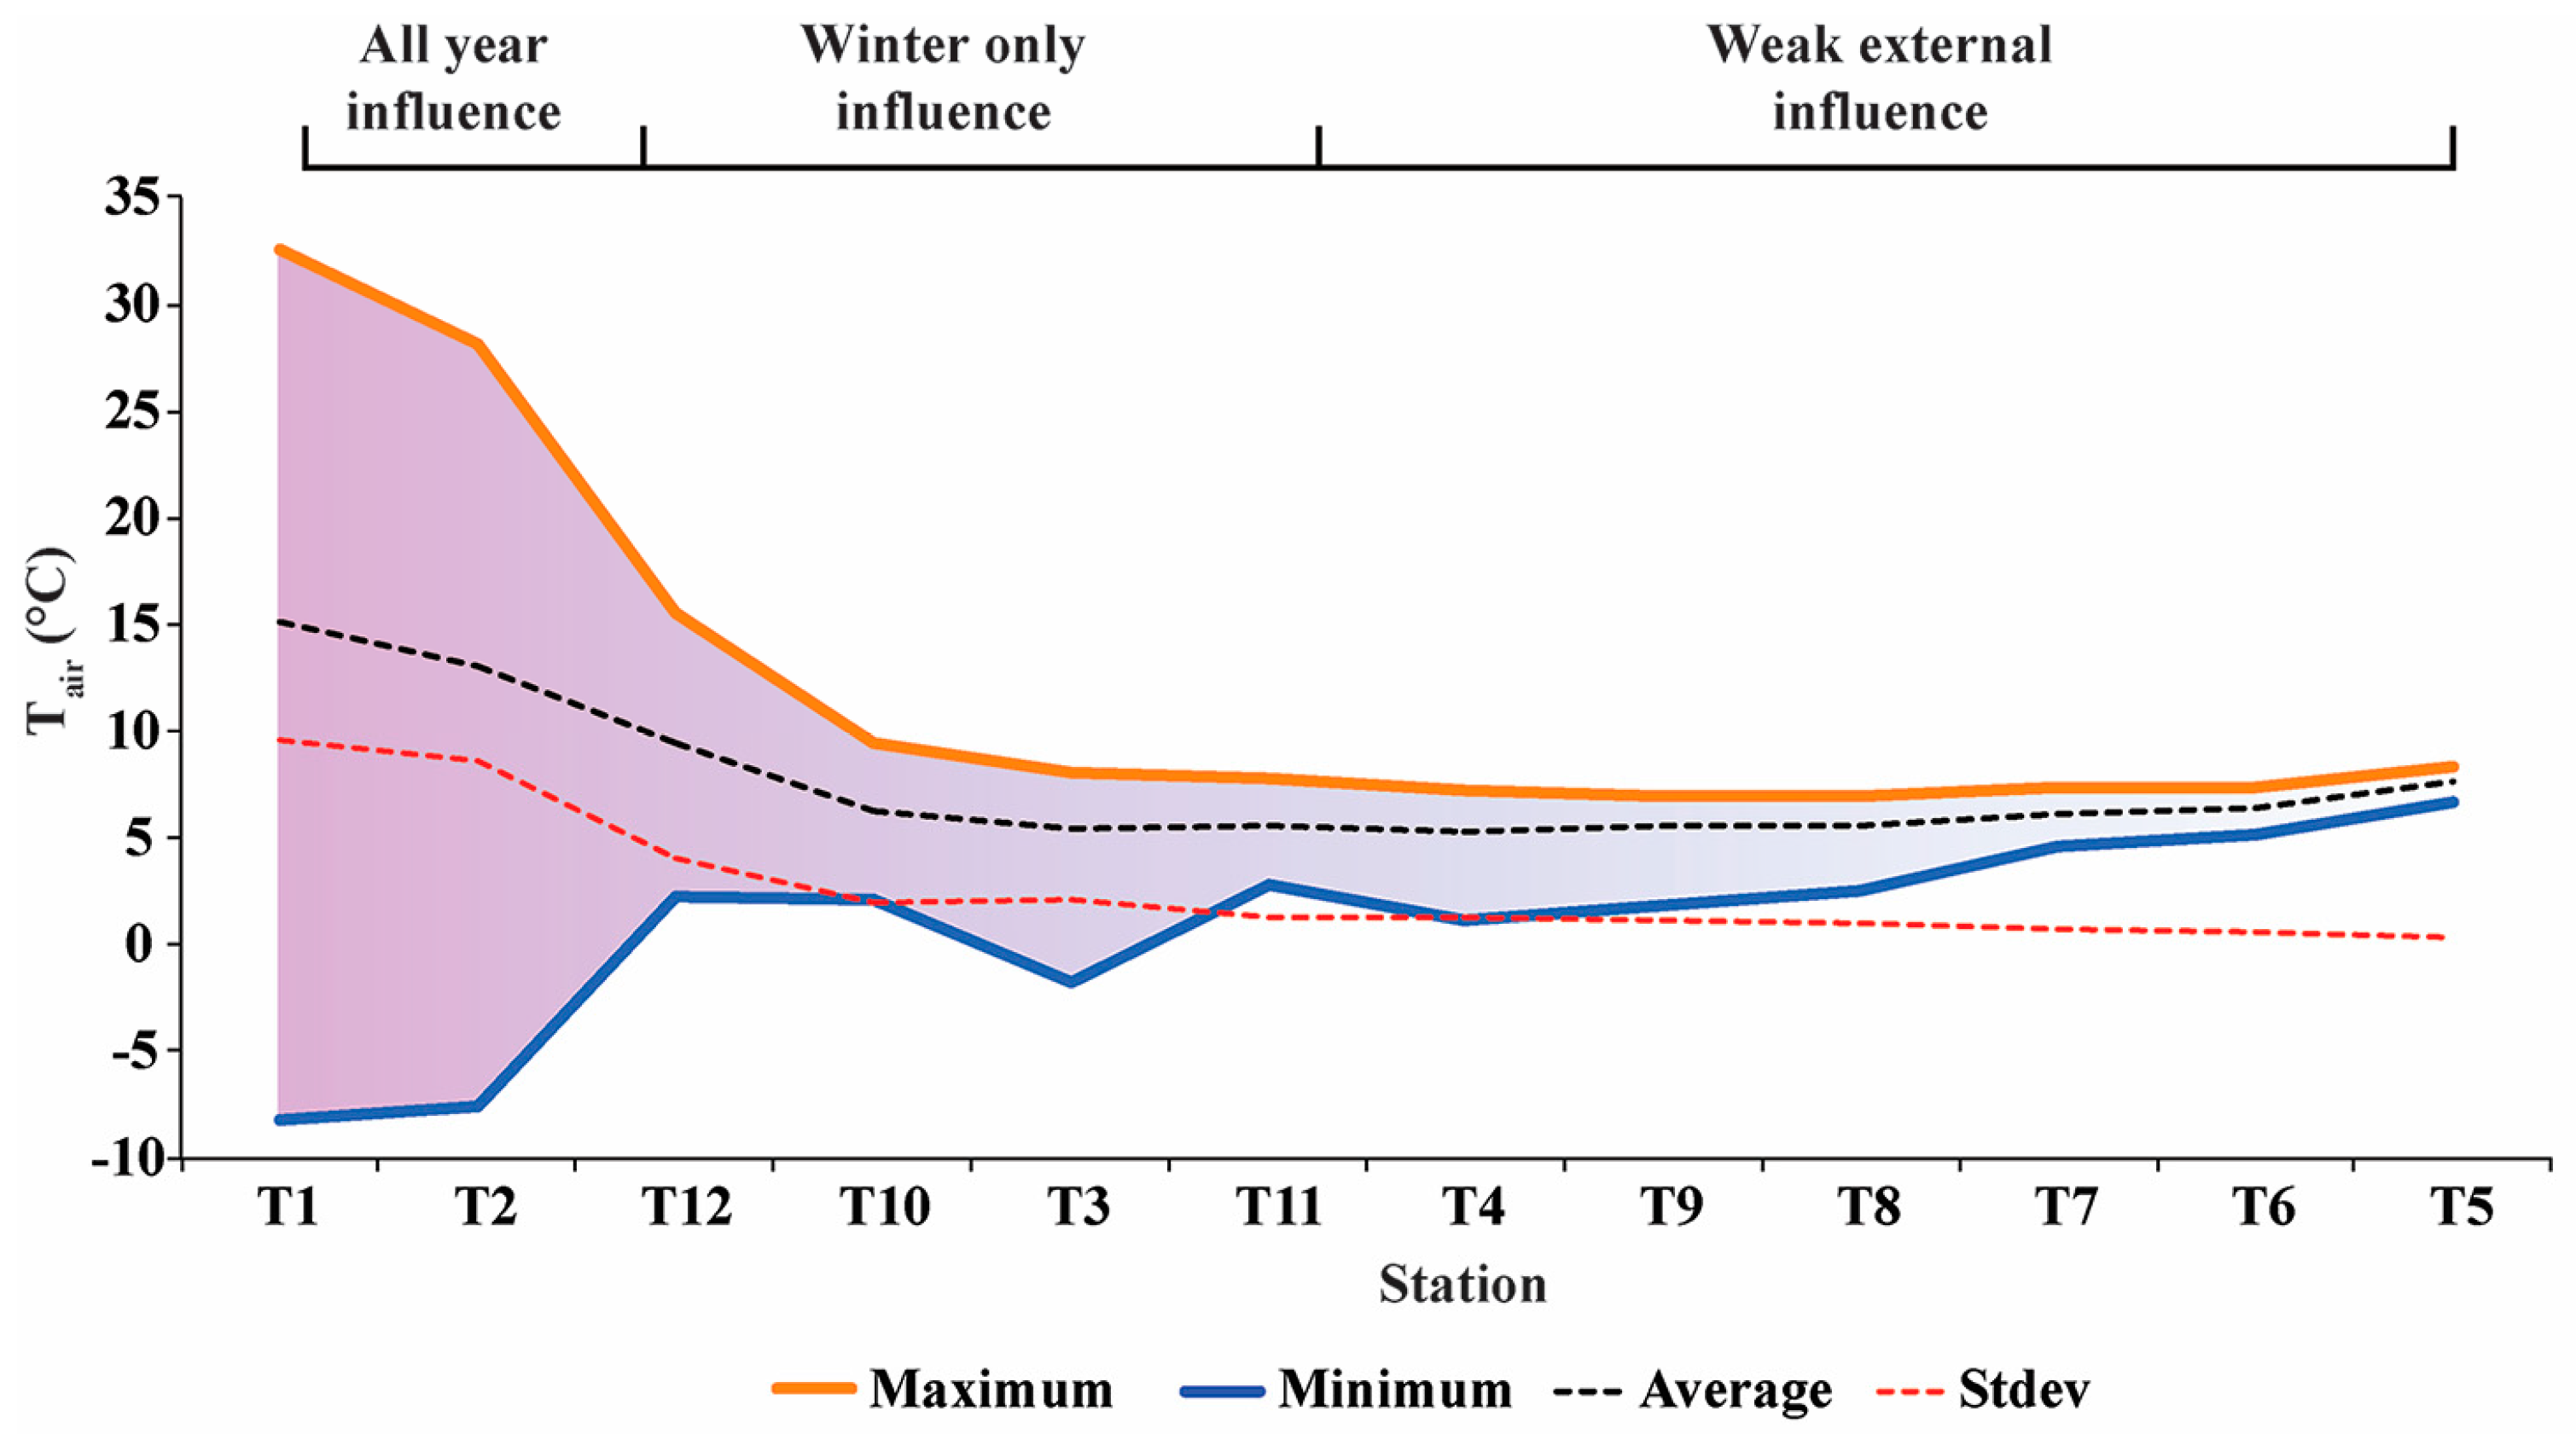
3.1. Air Temperature
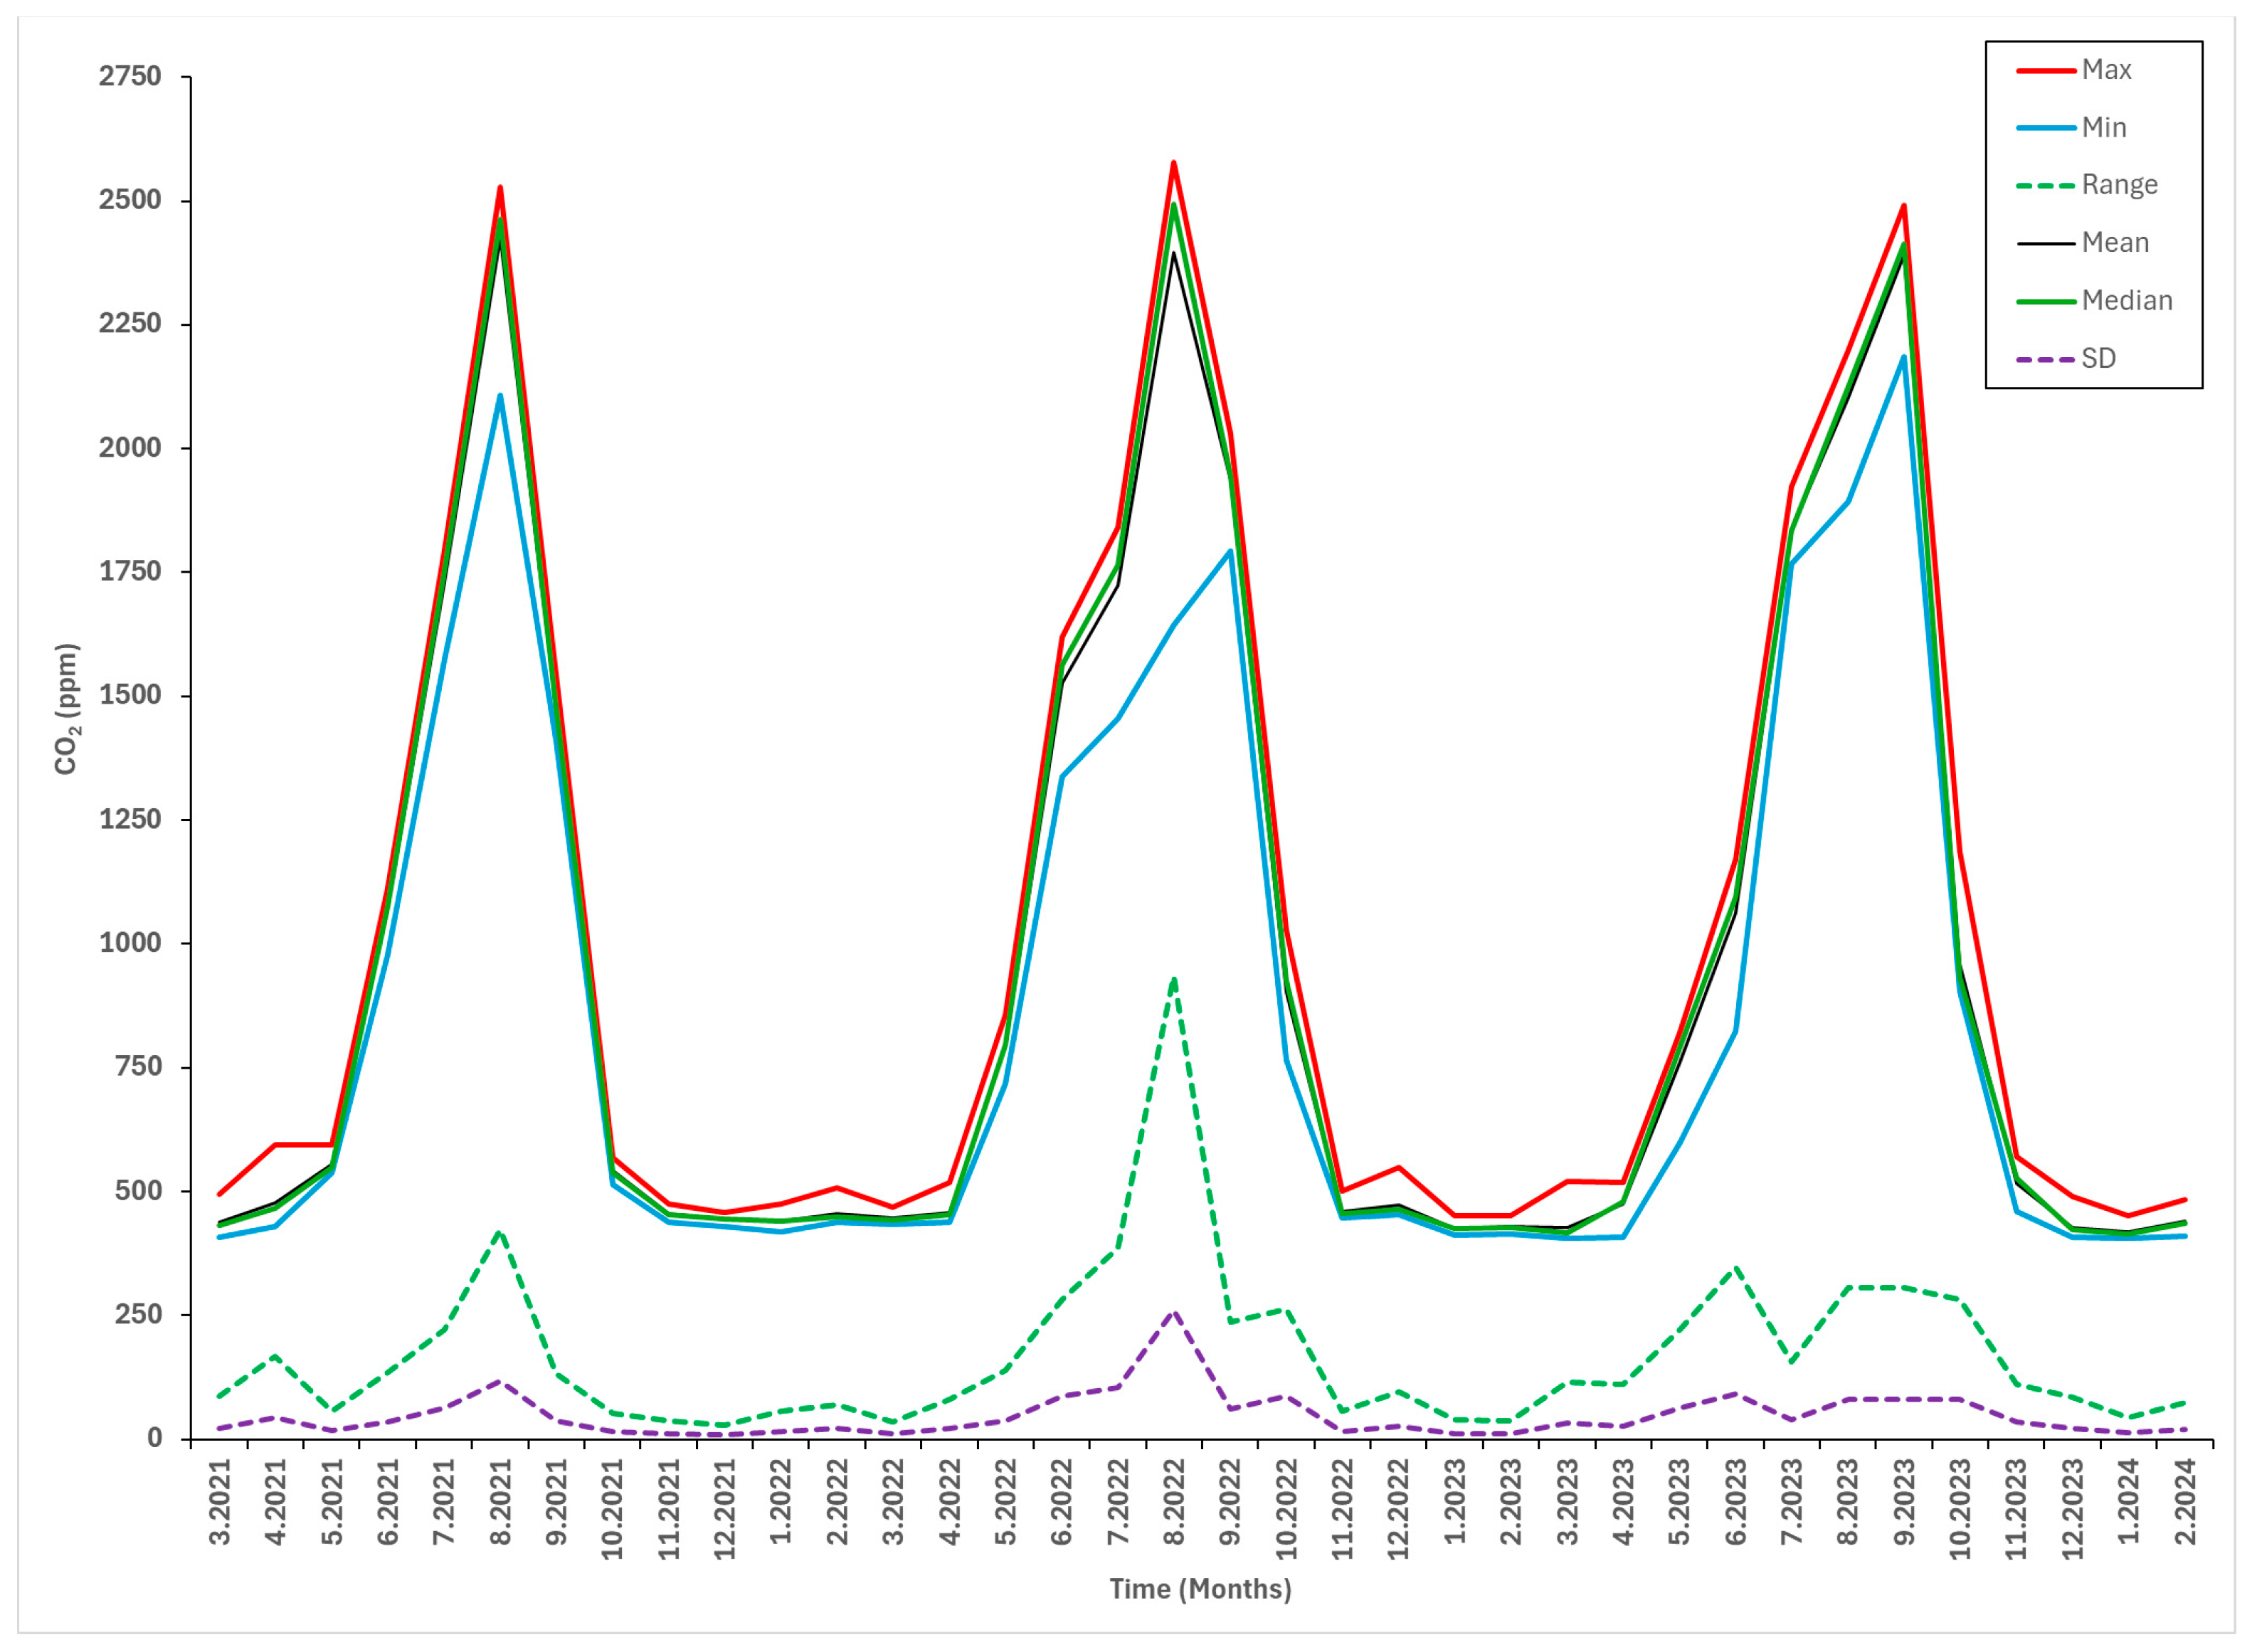
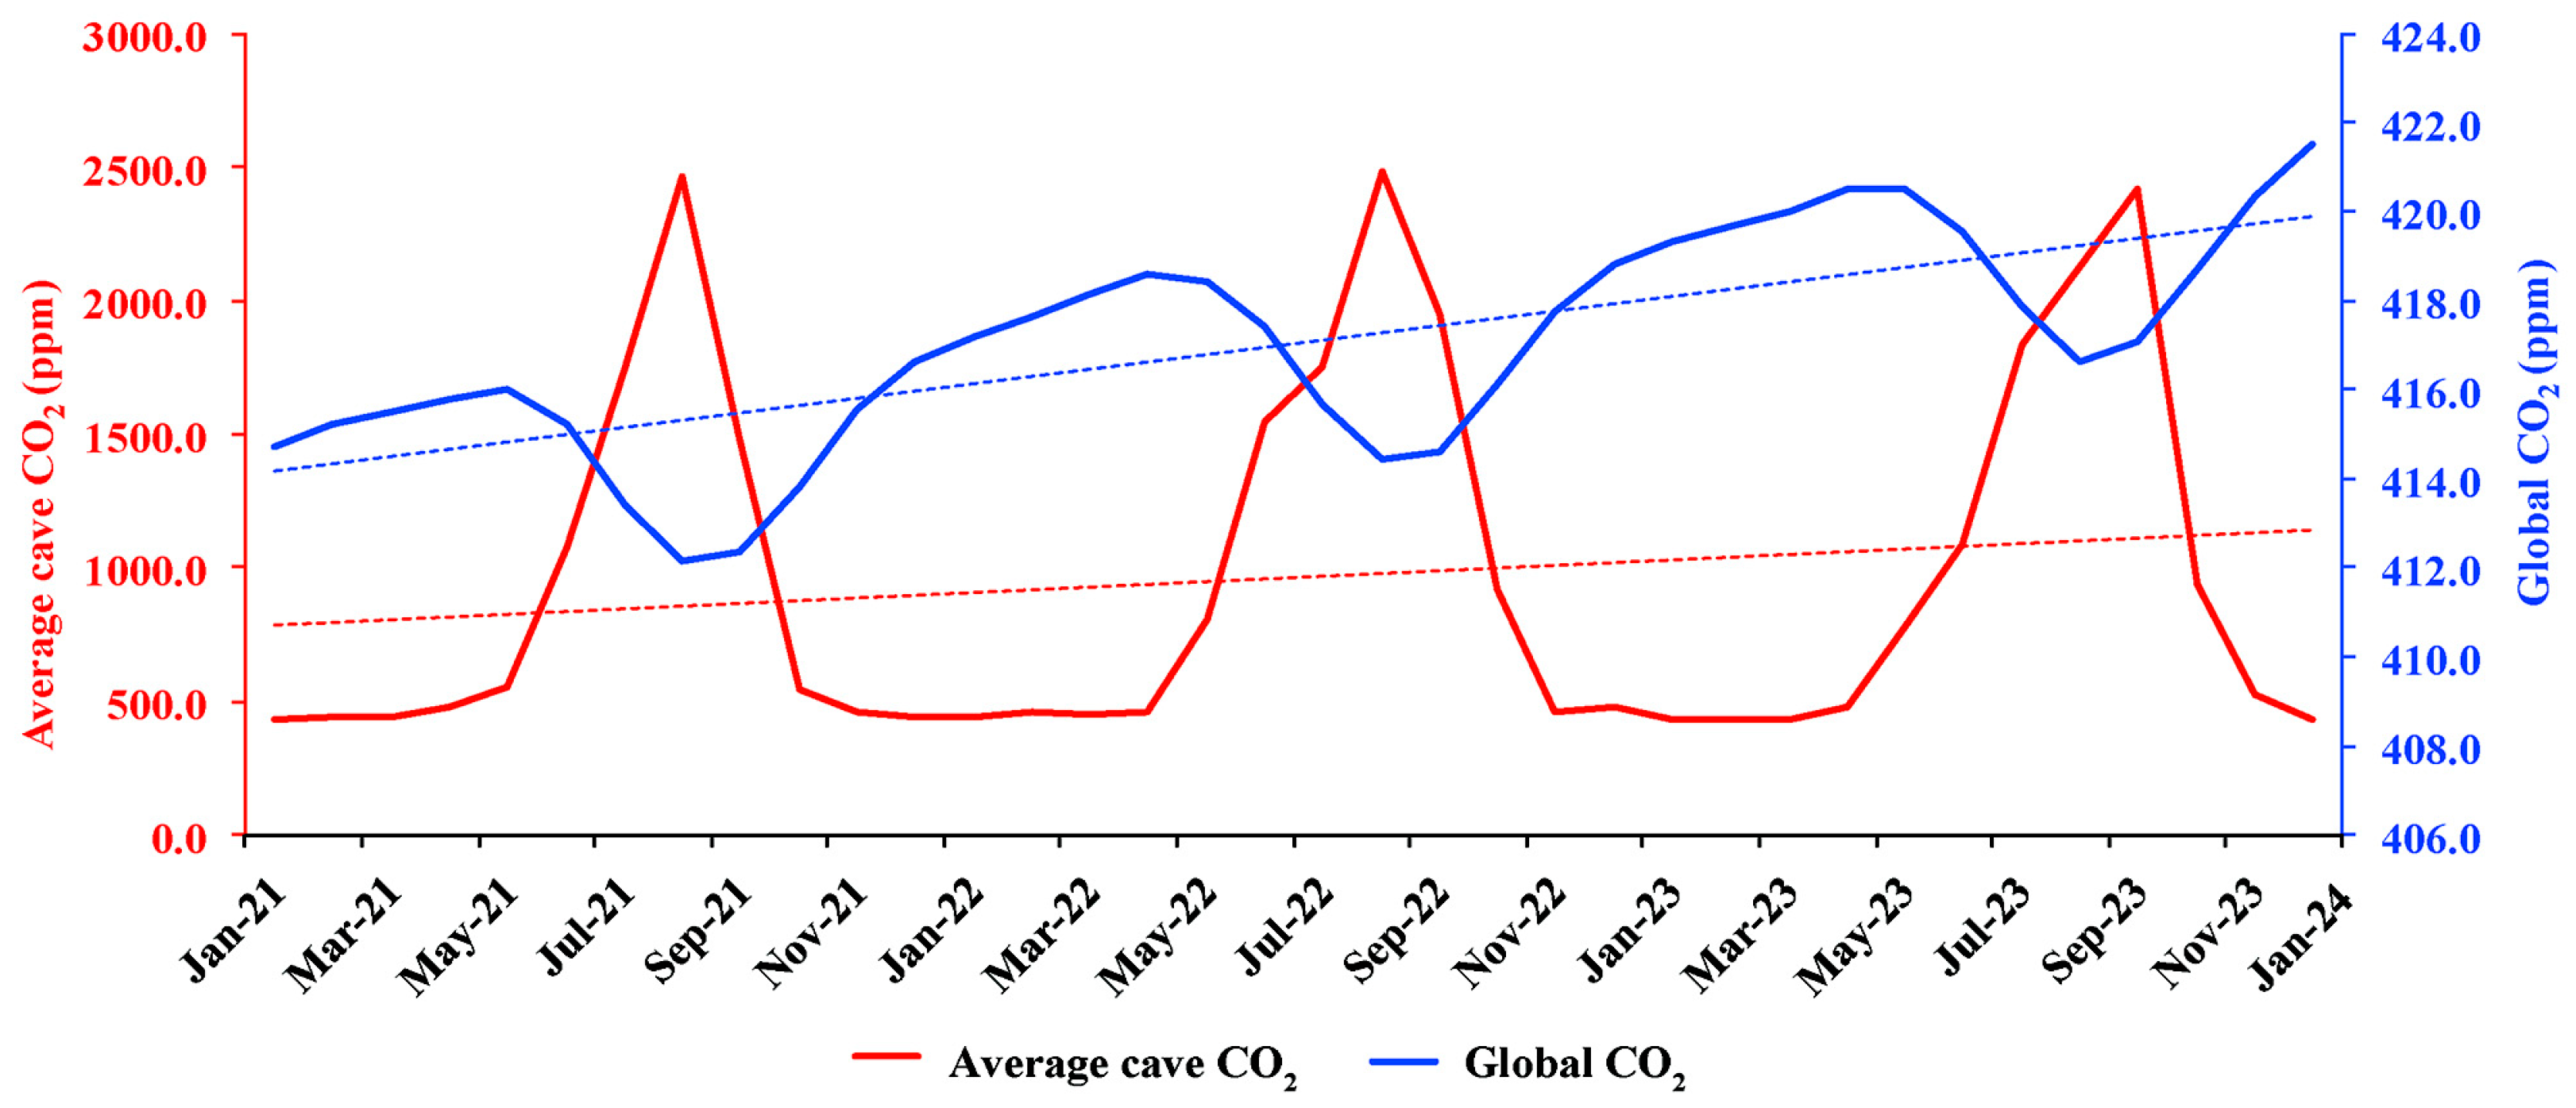
Air temperature (Tair) dynamics follows a clear annual cycle (Figure 2) outside the cave and at the bottom of the entrance doline, which rapidly decreases in amplitude (Figure 3) with increasing distance from the entrance, being hardly apparent at the final station of the cave.
The maximum Tair values were recorded yearly in July and August outside the cave (T1 and T2), while inside, they were recorded randomly between July and November, but always after the external ones. Notably, in 2023, the cave maxima Tair was registered with an increasing delay with increased distance from the entrance, reaching the most distant locations in November. The minima were recorded in January 2021 and 2022 and February 2023 and occurred simultaneously throughout the cave. The maxima and minima follow opposite trends along the cave, decreasing and increasing, respectively, from the entrance towards the inner parts of the cave, although the minima does show a very slight increasing tendency towards the very final station (Figure 3). These trends are mirrored by the overall temperature amplitude, which decreases with increasing distance from the entrance (Figure 3).
At two stations (T3 and T4), the increasing tendencies of winter temperatures are reversed (Figure 2 and Figure 3), likely as the result of cold air accumulation in topographic depressions along the cave’s floor (Figure 1, see “Discussions” for further details).

3.2. Carbon Dioxide

Carbon dioxide values range between 400 ppm (February and March 2021) and 449 ppm (July 2023) outside the cave and between 400 ppm (March 2021) and 2578 ppm (August 2022) inside the cave. The amplitude of CO2 concentration (Figure 4) follows a tendency opposed to that of the air temperature, increasing sharply at the first cave station (T12) and continuously rising throughout the cave. Notably, this large amplitude in CO2 concentrations is the result of very high summer values (Figure 2), while winter values are stable at generally low values close to those outside the cave.
CO2 concentrations in the atmosphere outside the cave (station T1) are variable, likely due to local influences (e.g., anomalies of the weather systems reaching the cave site). At station T2, located near the bottom of the collapsed doline and still strongly influenced by outside climatic conditions, the CO2 concentrations have large variations, with maxima exceeding 800 ppm in summer 2021 and 2022. Starting with station T12 (near the cave’s entrance), CO2 concentrations show a clear bimodal distribution, with low values between November and April and high values between May and October, peaking in August–September (Figure 2). The values start to increase in April, peak in August (2021 and 2022) and September (2023), and decrease abruptly, reaching background values by November. The average values at each cave station increase with distance from the cave entrance, with the highest values recorded at station T5. Minimum pCO2 values are almost constant for every station (standard deviation (1σ) of 13.38 ppm), while the maxima are more variable, as also indicated by the higher standard deviation (682.85 ppm at 1σ).

4. Discussion

4.1. Cave Climate

The mean air temperature within the cave exhibits a clear seasonal trend, increasing during the warmer months and decreasing during the colder months, which aligns with typical seasonal temperature variations (Figure 2 and Figure 5) in caves [19,20]. Minimum and maximum values also follow a similar pattern, but the standard deviations (Figure 5) are higher during summers than winters, indicating more uniform conditions between the different parts of cave during winter months. The temperature range tends to be larger during the warmer months, indicating larger differences between distinct parts of the cave. During the colder months, the temperature range narrows, reflecting more uniform conditions. These seasonal contrasts are common in caves with similar morphology, where outside influences are transmitted mainly through a single “entry point”, as opposed to caves with multiple entrances and/or complex morphologies, where air circulation patterns tend to be more variable, thus complicating cave air temperature dynamics.
Downsloping caves with a single entrance typically experience convection cells during winter. In this process, cold outside air enters the cave along the floor, warms up as it moves inward, and then ascends along the upper part of the passage towards the entrance [19,20]. Such convection cells can also be observed in Samograd during cold periods when the outside temperature falls below 7 °C. The extent of the cell varies with temperature and has not yet been determined. However, ice formations can be observed on the floor below the entrance. Additionally, cryoclasts are observed along most of the cave, indicating even deeper freezing in the past. During warm months, the convective cell is inactive, and temperatures throughout the cave stabilize, with a distinct thermocline near the entrance. The strength and spatial extent of the convective cells vary in time, as indicated by the correlation coefficients (Figure 6) between external air temperature (station T1) and cave temperatures (stations T2–T12). The correlation is stronger during the late autumn, winter, and early spring months for stations located closer to the entrance, and it quickly diminishes with increasing distance from the entrance as the inflowing cold air quickly warms in contact with the warmer cave surfaces, e.g., [20]. In summer, the correlation completely breaks down, as the cave’s atmosphere is decoupled from the exterior (Figure 6). Notably, Tair changes at the locations located furthest from the cave’s entrances (stations T5–T7) that are not linked to those outside the cave further support the occurrence of stable cave conditions.

4.2. Temporal Variability of pCO2 Values

pCO2 values in the cave follow a clear annual cycle, with the minima occurring in winter and the maxima occurring in late summer through early autumn (Figure 2 and Figure 7). The average cave maxima occur yearly in September and the minima between January and March, in contrast to the global values (Figure 7). The closest atmospheric CO2 monitoring station is at Hegyhátsál (Hungary, ~300 km to the NNE). At this station, atmospheric CO2 values follow a clear annual cycle, with an annual maximum in December and minimum in August [21]. The minima is linked to vegetation development starting in April, acting as a strong atmospheric CO2 sink. Interestingly, atmospheric CO2 concentrations start to decrease in January already, likely as a result of mixing between near-surface CO2-rich air with CO2-depleted free tropospheric air [21]. The development of vegetation starting in March–April in the area above the cave likely results in a similar depletion of atmospheric CO2, but drives up soil CO2 concentrations (via root respiration), thus providing the source of CO2 seeping in the cave, driving values up to their maxima (Figure 2 and Figure 4). As vegetation activity decreases in September, root respiration and soil CO2 values start to decrease, reaching a minimum in winter months, leading to clear seasonal differences inside the cave. These seasonal differences are also likely linked to the dynamic behavior of the cave. During cold periods, the influx of cold external air continuously mixes with the cave atmosphere and dilutes the CO2 within it. Additionally, CO2 production in the soil and epikarst is minimal in winter months, leading to the depletion of the surrounding massif’s CO2 reservoir. As a result, the CO2 input from the massif is also minimal [5,6,12,13,22,23].
Intriguingly, the average cave CO2 concentrations, calculated for stations T10 through T5 (Figure 7), exhibit a slight increasing trend throughout the monitoring period, loosely following the global increase, but, due to the short observation period, no definitive conclusions can be drawn. The increasing trend is almost similar for all cave stations except station T2, indicating that despite potential uncertainties induced by our methods, the observation is robust.
pCO2 values reach maxima throughout the cave with a delay of about two months with respect to Tair maxima (Figure 2), a process we suggest occurs via the following two mechanisms: (1) soil pCO2 reaching maximum in late summer/early autumn [24,25,26,27], and (2) a potential delay in the transfer of CO2 from soil to the cave via water [28,29,30]. The increase in pCO2 values in the cave starts yearly in April, but this increase is slow until June, when values “jump” by several hundreds ppm (Figure 2). The high pCO2 values are maintained until late September each year, abruptly dropping in late September/early October, and continuing to decrease until January/December. The slow increase in cave pCO2 in early spring is noticeable mostly in the inner parts of the cave (Figure 1 and Figure 2) and are likely related to the slow release of CO2 from the rock matrix and cessation of air circulation and the subsequent flushing of the cave with cold, dry, and low pCO2 air. Likely, these high pCO2 values result from a large reservoir of ground air rich in CO2, stored in the limestone matrix above the cave [4,7,31]. It is very likely that, in the absence of cold air inflow during winter, the entire cave would have higher atmospheric pCO2 values throughout the year.
The primary source of CO2 in the cave, as supported by the temporal and spatial dynamics of pCO2, is high soil microbial activity and plant root respiration [8,15], as well as microbial activity in the vadose zone above the cave [4,11,15,32]. CO2 migrates downward to the vadose zone through advection and diffusion. Maximum values of pCO2 in the soil and vadose zone occur in late summer/early autumn.
A secondary potential source of high pCO2 values could be related to CO2 released by tourists visiting the cave. The number of tourists visiting the cave peaked in August 2021, June 2022, and May 2023, while pCO2 values peaked in August 2021, August 2022, and September 2023, respectively. The correlation analysis between pCO2 values and the number of visitors shows low correlation, with no clear link between the two. A positive correlation between the visitor numbers on pCO2 values has been observed in caves with thousands of visitors per day for extended periods of time, e.g., [18,33], but any increase in pCO2 values is temporary (hours) and does not impact the long-term (monthly) values [18,33,34,35,36,37]. Given the very low number of visitors in Samograd Cave (monthly maximum below 2200 people), their influence on the cave pCO2 values is negligible, at best.
Degassing from cave waters, either direct or due to calcite precipitation, a known source of CO2 in caves, can only provide low amounts of CO2 in Samograd Cave as no permanent water bodies or abundant calcite precipitating streams are found in the cave. Another potential source of CO2 in caves is in-cave microbial activity. CO2 production in caves requires the decay of organic matter transported to the cave from the outside, e.g., [4,5]. However, organic matter is found in small amounts in Samograd Cave (near the entrance area), so we can safely rule out this source as a potential contributor to the overall CO2 balance in the cave.

4.3. Spatial Distribution of pCO2 Values

The spatial distribution of pCO2 follows a clear pattern of increasing values from the entrance to the end of the cave, albeit with notable differences between summer and winter (Figure 8).
Both winter and summer pCO2 values are low near the cave entrance and progressively increase towards the end of the cave; however, winter values are limited to well below 500 ppm (with the exception of February 2021; pCO2 542 ppm), while summer values rise above 2500 ppm. The summer maxima are registered yearly in the station at the end of the cave (T5), but the winter maxima occur more randomly between station T4 and T5 (Figure 1). The high summer pCO2 values registered throughout the cave support a source of CO2 from the soil and, possibly, ground air, an inference further supported by the high values registered towards the end of the cave in winter (Figure 8). The cave’s morphology and related air circulation patterns (described above) are very likely responsible for this distribution. Cold air inflow in winter, which effectively cascades e.g., [38,39] down towards the lowest parts of the cave (T4 in Figure 1), dilutes the high CO2 concentration air (Figure 7). There is an inflow of CO2 from the surrounding massif into the cave (also indicated by higher values at T7–T9), which is subsequently flushed from the cave once it reaches the active convection cell.
The maximum CO2 concentration varies across locations, with higher values observed at the inner locations (e.g., T5). This indicates that certain areas of the cave experience periods when CO2 levels spike significantly, potentially due to less ventilation or other localized factors. The minimum CO2 concentrations are fairly uniform across locations, indicating a consistent baseline level of CO2 throughout the cave. The range of CO2 concentrations (difference between max and min) increases slightly towards the interior of the cave. This suggests that while baseline CO2 levels are consistent, the variability or fluctuation in the CO2 levels increases in some locations, particularly deeper into the cave. The spread of CO2 concentrations around the mean is relatively consistent across locations, with a slight increase toward the more interior locations. Higher standard deviation values towards T5 indicate that the CO2 levels are more variable in these areas.
The comparison of variability between CO2 and air temperature was conducted using the Coefficient of Variation (CV, representing the ratio of standard deviation to the mean), calculated from a dataset comprising monthly spot observations for the CO2 concentration and air temperature between March 2021 and February 2024. The CV was chosen as a measure of variation instead of the standard deviation (SD) because it allows for a comparison of relative variability between variables with different units or scales, providing a normalized measure of dispersion relative to the mean. When comparing the CV calculated from all available data for the CO2 concentration (N = 360) and air temperature (N = 360) at cave locations (T12 to T5, excluding T1 on the surface and T2 at the collapse doline bottom), the air temperature exhibits a higher range of relative variability (40.8979) than the CO2 concentration (4.2792, Table 2).
The maximum CV for Tair is lower than that of CO2, but still indicates substantial variability relative to the mean temperature. This suggests that air temperature can fluctuate considerably under certain circumstances. The minimum CV for Tair indicates that there are conditions within the cave where the air temperature is relatively stable. The range of the CV for Tair is large, indicating a significant difference in relative variability under different conditions or at different locations within the cave.
Generally, CO2 tends to have a higher CV across most locations within the cave, suggesting that CO2 levels are more variable relative to their mean. This suggests that CO2 concentrations are more sensitive to changes in environmental factors such as ventilation, biological activity, or other microclimatic conditions. The CV for air temperature is typically lower than that for CO2, reflecting the greater stability in temperature across the cave measuring stations. In the most distant cave locations, where ventilation might be reduced, the CV for CO2 is likely to be higher. This indicates more significant fluctuations in CO2 concentrations, possibly due to limited air exchange, leading to the accumulation or depletion of CO2 in response to localized activities or seasonal changes. Locations closer to the cave entrance or areas with more consistent airflow may show a lower CV for CO2, reflecting more stable CO2 levels due to regular ventilation. However, even in these areas, the CV for CO2 might still be higher than that for Tair, indicating that CO2 is inherently more variable.
The seasonal pattern of high summer and low winter pCO2 values was further confirmed by performing a regression analysis using surface air temperature as the independent variable and CO2 levels in cave locations as dependent variables. The regression analysis showed a strong relationship, indicating that the surface air temperature significantly influences CO2 levels within the cave but only in the winter months. As the surface air temperature decreases, enhanced ventilation occurs, leading to lower CO2 concentrations. Conversely, higher surface temperatures correspond to reduced ventilation and higher CO2 levels.
When analyzing the CO2 concentrations across different cave locations (Figure 8), we observe that CO2 levels and variability tend to increase towards the interior sections of the cave, particularly around station T5 (Figure 1). This spatial trend can also be understood in the context of the cave’s ventilation patterns.
During colder months, the inflow of fresh air from the surface provides ventilation that reaches the outer sections of the cave more effectively, helping to maintain lower and more stable CO2 levels. However, further into the cave, particularly in the more enclosed sections, this ventilation effect diminishes, leading to higher CO2 concentrations and greater variability. In the summer, when this ventilation is absent, CO2 levels rise more significantly, especially in the interior locations, resulting in the observed higher concentrations and increased variability.
The regression analysis between surface air temperatures and CO2 concentrations at different cave locations further supports this interpretation. It demonstrates that the cave’s natural ventilation system, driven by temperature differences between the cave interior and the surface, plays a critical role in regulating CO2 concentrations. In colder months, this ventilation is more effective in reducing CO2 levels, especially in the outer cave sections, while in warmer months, the lack of ventilation leads to CO2 accumulation, particularly in the cave’s interior.
In both the temporal and spatial analyses, the variations in CO2 levels within the cave can be largely explained by changes in ventilation driven by the external air temperature. This natural ventilation system is more active during colder months, leading to lower and more stable CO2 levels, while during warmer months, the absence of ventilation results in higher CO2 concentrations and greater variability, particularly in the cave’s interior locations.
A further implication of our study is for the wider scientific community studying past climate variability using δ18O and δ13C values of speleothem calcite as proxies of past climate variables [14,40]. One important prerequisite of such studies is to determine when (during the year) the calcite is precipitated, as this would lead to the knowledge of what climate variable the stable isotopes in the speleothem calcite are registering, e.g., [41]. The high variability of pCO2 in the cave atmospheres, as shown in this article, results in calcite being potentially precipitated at different times during a year in different parts of the cave. Consequently, the stable isotopic composition of the calcite will register different climate variables in different parts of the cave. Any potential study using these proxies should thus consider the spatial and temporal pCO2 variability in the targeted cave before embarking on past climate reconstructions. Previous studies analyzing the stable isotopic composition of cave CO2 have generally focused on understanding what the δ13C value in speleothems is actually registering in terms of climate information. The rapid inflow of outside air was linked to an increase in the calcite precipitation rate and a drop in δ13C [42], but other studies [15] have shown that such changes do not occur if the pCO2 variability is low, thus calling for similar analyses to be performed in every particular case. These could also result in a better understanding of CO2 fluxes, as shown by Yidong et al. [18]. These authors have used δ13C of CO2 in order to disentangle between the different sources and fluxes in a cave in central China, and their data indicate a clear separation (in terms of stable isotopic composition) of atmospheric and soil air (i.e., −8 ‰VPDB vs. −25 ‰VPDB). Consequently, δ13C values of CO2 could be used to track the CO2 fluxes in and out of caves through their entrances (during ventilation events like the ones described by us), as well as from soil air through the vadose zone through gravitational settling.

5. Conclusions

This study focuses on the variations in pCO2 and air temperature within a cave system that functions as a convective cell. Measurements were conducted from March 2021 to February 2024 via spot measurements. During winter, cold surface air flows into the cave, lowering the air temperature throughout much of the cave and decreasing CO2 concentrations. In contrast, during the summer, the cave maintains a cold air pool trapped in its lower part due to the cave’s morphology, leading to equilibrium conditions. The seasonal variability is attributed to the cave air dynamics, where cold air inflow during winter effectively displaces CO2, and high summer pCO2 levels result from CO2 production in the soil and its subsequent seepage into the cave atmosphere through a network of fractures (Figure 9).
The observed delay in the pCO2 maxima relative to air temperature peaks suggests a complex interaction between soil CO2 production and its transfer to the cave, potentially involving both air flow and degassing from seeping water. The gradual increase in cave pCO2 starting in early spring and the significant jump in values by June highlights the influence of the ground CO2 reservoir within the limestone matrix.
Our data show an increasing trend in both atmospheric (outside the cave) and cave pCO2 levels from 2021 to 2024. While tempting to strongly emphasize this observation, the uncertainties in measurements could potentially hinder such an approach. The time series is only three years long, but monitoring continues, and we are following this increase as it unfolds. Increasing average global air temperatures with prolonged warm seasons will reduce the number of days with an active convection cell, thus potentially reducing CO2 export from caves via dynamic processes but increasing in-cave values (also aided by higher biological activity and the production of CO2 in the soil). This dataset reflects processes in a specific cave; however, many caves with similar geometry exhibit comparable airflow patterns and CO2 dynamics. In caves where other ventilation mechanisms, such as the chimney or barometric effect, are predominant, different behaviors may be observed. Generally, when external air flows through a karst massif, it mixes with “ground air” and exits enriched with CO2. Thus, caves act as primary ventilation pathways, allowing some of the CO2 from the karst massif to be released back to the surface. Additionally, CO2-depleted air within caves promotes calcite precipitation, leading to CO2 outgassing that can also return to the surface. While these mechanisms are well recognized, they remain somewhat poorly quantified, requiring long-term observations across diverse settings to refine the data. CO2 from the vadose zone can be intercepted by groundwater and carried to karst springs, where it may be released into the atmosphere through direct degassing, tufa formation, or uptake by aquatic organisms. This segment of the carbon pathway is also insufficiently understood, highlighting the need for continued monitoring and modeling.
In conclusion, we hypothesize that caves developed in the vadose zone function as conveyor belts, moving CO2 generated in soil by root respiration to the free atmosphere, potentially affecting our understanding of CO2 dynamics and also possibly accounting for some missing sources [1]. As atmospheric CO2 reaches a minima during the vegetation season (August in the Northern Hemisphere), the CO2 generated in the soil is conveyed to the global atmosphere via caves. As karst areas cover a large fraction of the earth’s surface, our findings could help better understand the yet poorly accounted for CO2 fluxes from the underground to the atmosphere. Similar studies should be deployed in caves located in karst areas located in different climates and with different hydrologic conditions to test our hypotheses described above.

Author Contributions

Conceptualization, N.B. (Nenad Buzjak), F.G. and A.P.; methodology, N.B. (Nenad Buzjak); software, N.B. (Nenad Buzjak), F.G., A.P. and C.P.; formal analysis, N.B. (Nenad Buzjak), F.G., A.P. and C.P.; fieldwork, N.B. (Nenad Buzjak) and D.P.; writing—original draft preparation, A.P., N.B. (Nenad Buzjak) and F.G.; writing—review and editing, A.P., N.B. (Nenad Buzjak), F.G., C.P., D.P. and N.B. (Neven Bočić); visualization, A.P., N.B. (Nenad Buzjak), F.G. and C.P.; supervision, N.B. (Nenad Buzjak) and F.G.; project administration, N.B. (Nenad Buzjak) and F.G.; funding acquisition, N.B. (Nenad Buzjak) and F.G. All authors have read and agreed to the published version of the manuscript.

Funding

This work has been supported by Croatian Science Foundation under the project “Dynamics and distribution of CO2 in karst vadose and epiphreatic zone (CARDIKARST)” (IPS-2022-02-2260).

Data Availability Statement

All data can be obtained from the corresponding author upon request.

Acknowledgments

We gratefully acknowledge the unwavering support provided by Cave Park Grabovača (Perušić, Croatia) for logistics and fieldwork. Our deepest thanks go to Park Director Jelena Milković and the entire Park staff for their invaluable assistance in facilitating our work, with special mention to Tomislav Špehar, Marko Danilović, Mario Paral, and Marko Kasumović for their exceptional contributions. We extend our heartfelt gratitude to Suzana Buzjak for her indispensable help during fieldwork. Additionally, we wish to thank Ivana Živković, Iztok Miklavčič, and the Caving Club Samobor for their occasional support in the field and measurements, as well as Helena Varga for her assistance with data collection and archiving. Vasile Ersek (Northumbria University, UK) and Vanessa Johnston (Karst Research Institute ZRC SAZU, Slovenia) polished the English language.

Conflicts of Interest

The authors declare no conflicts of interest.

References

  1. Friedlingstein, P.; O’Sullivan, M.; Jones, M.W.; Andrew, R.M.; Bakker, D.C.E.; Hauck, J.; Landschützer, P.; Le Quéré, C.; Luijkx, I.T.; Peters, G.P.; et al. Global carbon budget 2023. Earth Syst. Sci. Data 2023, 15, 5301–5369. [Google Scholar] [CrossRef]
  2. Lan, X.; Tans, P.; Thoning, K.W. Trends in Globally-Averaged CO2 Determined from NOAA Global Monitoring Laboratory Measurements, version 2024-08; Global Monitoring Laboratory: Boulder, CO, USA, 2024. [Google Scholar] [CrossRef]
  3. Archer, D.; Eby, M.; Brovkin, V.; Ridgwell, A.; Cao, L.; Mikolajewicz, U.; Caldeira, K.; Matsumoto, K.; Munhoven, G.; Montenegro, A.; et al. Atmospheric lifetime of fossil fuel carbon dioxide. Annu. Rev. Earth Planet. Sci. 2009, 37, 117–134. [Google Scholar] [CrossRef]
  4. Baldini, J.U.; Bertram, R.A.; Ridley, H.E. Ground air: A first approximation of the Earth’s second largest reservoir of carbon dioxide gas. Sci. Total Environ. 2018, 616–617, 1007–1013. [Google Scholar] [CrossRef] [PubMed]
  5. Atkinson, T.C. Carbon dioxide in the atmosphere of the unsaturated zone: An important control of groundwater hardness in limestones. J. Hydrol. 1977, 35, 111–123. [Google Scholar] [CrossRef]
  6. Kukuljan, L.; Gabrovšek, F.; Covington, M.D.; Johnston, V.E. CO2 dynamics and heterogeneity in a cave atmosphere: Role of ventilation patterns and airflow pathways. Theor. Appl. Climatol. 2021, 146, 91–109. [Google Scholar] [CrossRef]
  7. Covington, M.D. The importance of advection for CO2 dynamics in the karst critical zone: An approach from dimensional analysis. In Caves and Karst Across Time Special Paper 516; Feinberg, J.M., Gao, Y., Alexander, E.C., Jr., Eds.; Geological Society of America: Boulder, CO, USA, 2016. [Google Scholar] [CrossRef]
  8. Hendry, M.J.; Wassenaar, L.I. Origin and migration of dissolved organic carbon fractions in a clay-rich aquitard: 14C and δ13C evidence. Water Resour. Res. 2005, 41, W02021. [Google Scholar] [CrossRef]
  9. James, J.M. Carbon dioxide in the cave atmospshere. Trans. Brit. Cave Res. Assoc. 1977, 4, 417–429. [Google Scholar]
  10. Baldini, J.U.L. Cave atmosphere controls on stalagmite growth rate and paleoclimate records. In Tufas and Speleothems: Unravelling the Microbial and Physical Controls; Pedley, H.M., Rogerson, M., Eds.; Geological Society of London: London, UK, 2010; pp. 283–294. [Google Scholar]
  11. Mattey, D.P.; Atkinson, T.C.; Barker, J.A.; Fisher, R.; Latin, J.P.; Durrell, R.; Ainsworth, M. Carbon dioxide, ground air and carbon cycling in Gibraltar karst. Geochim. Cosmochim. Acta 2016, 184, 88–113. [Google Scholar] [CrossRef]
  12. Mattey, D.; Atkinson, T.C.; Hoffmann, D.L.; Boyd, M.; Ainsworth, M.; Durell, R.; Latin, J.P. External controls on CO2 in Gibraltar cave air and ground air: Implications for interpretation of δ13C in speleothems. Sci. Total Environ. 2021, 777, 146096. [Google Scholar] [CrossRef]
  13. Milanolo, S.; Gabrovšek, F. Estimation of carbon dioxide flux degassing from percolating waters in a karst cave: Case study from Bijambare cave, Bosnia and Herzegovina. Geochemistry 2015, 75, 465–474. [Google Scholar] [CrossRef]
  14. Fairchild, I.J.; Baker, A. Speleothem Science: From Process to Paste Environment; Wiley-Blackwell: Chichester, UK, 2012; p. 450. [Google Scholar]
  15. Riechelmann, S.; Breitenbach, S.F.M.; Schröder-Ritzrau, A.; Mangini, A.; Immenhauser, A. Ventilation and cave air PCO2 in the Bunker-Emst cave system (NW Germany): Implications for speleothem proxy data. J. Cave Karst Stud. 2019, 81, 98–112. [Google Scholar] [CrossRef]
  16. Spotl, C.; Fairchild, I.J.; Tooth, A.F. Cave air control on dripwater geochemistry, Obir Caves (Austria): Implications for speleothem deposition in dynamically ventilated caves. Geochim. Cosmochim. Acta 2005, 69, 2451–2468. [Google Scholar] [CrossRef]
  17. Peyraube, N.; Lastennet, R.; Denis, A.; Malaurent, P. Estimation of epikarst air PCO2 using measurements of water δ13CTDIC, cave air PCO2 and δ13CCO2. Geochim. Cosmochim. Acta 2013, 118, 1–17. [Google Scholar] [CrossRef]
  18. Li, Y.; Yang, Y.; Wang, X.; Luo, W.; Zhao, J.; Sun, Z.; Ye, Z.; Chen, X.; Shi, X.; Xu, Y.; et al. Sources and transport of CO2 in the karst system of Jiguan Cave, Funiu Mountains, China. Sci. Total Environ. 2024, 918, 170507. [Google Scholar] [CrossRef] [PubMed]
  19. Badino, G. Underground meteorology—“What’s the weather underground”? Acta Carsologica 2010, 39, 427–448. [Google Scholar] [CrossRef]
  20. Gabrovšek, F. How do caves breathe: The airflow patterns in karst underground. PLoS ONE 2023, 18, e0283767. [Google Scholar] [CrossRef]
  21. Haszpra, L. Multi-decadal atmospheric carbon dioxide measurements in Hungary, central Europe. Atmos. Meas. Tech. 2024, 17, 4629–4647. [Google Scholar] [CrossRef]
  22. Faimon, J.; Ličbinská, M. Carbon dioxide in the soils and adjacent caves of the moravian karst. Acta Carsologica 2010, 39, 463–475. [Google Scholar] [CrossRef]
  23. Bourges, F.; Genty, D.; Perrier, F.; Lartiges, B.; Regnier, E.; Francois, A.; Leplat, J.; Touron, S.; Bousta, F.; Maasault, M.; et al. Hydrogeological control on carbon dioxide input into the atmosphere of the Chauvet-Pont d’Arc cave. Sci. Total Environ. 2020, 716, 136844. [Google Scholar] [CrossRef]
  24. Almagro, M.; Lopez, J.; Querejeta, J.I.; Martinez-Mena, M. Temperature dependence of soil CO2 efflux is strongly modulated by seasonal patterns of moisture availability in a Mediterranean ecosystem. Soil. Biol. Biochem. 2009, 41, 594–605. [Google Scholar] [CrossRef]
  25. Jin, M.S.; Mullens, T.A. Study of the Relations between soil moisture, soil temperatures and surface temperatures using ARM observations and offline CLM4 Simulations. Climate 2014, 2, 279–295. [Google Scholar] [CrossRef]
  26. Noormets, A. Phenology of Ecosystem Processes: Application in Global Change Research; Springer: Dordrecht, The Netherlands; Berlin/Heidelberg, Germany; London, UK; New York, NY, USA, 2009; p. 275. [Google Scholar] [CrossRef]
  27. Risk, D.; Kellman, L.; Beltrami, H. Carbon dioxide in soil profiles: Production and temperature dependence. Geophys. Res. Lett. 2002, 29, 1087. [Google Scholar] [CrossRef]
  28. Ford, D.; Williams, P.D. Karst Hydrogeology and Geomorphology; John Wiley & Sons: Chichester, UK, 2007; p. 562. [Google Scholar]
  29. Williams, P.W. The role of the epikarst in karst and cave hydrogeology: A review. Int. J. Speleol. 2008, 37, 4687. [Google Scholar] [CrossRef]
  30. Feher, R.; Bădăluță, C.-A.; Brad, T.; Drăgan, C.; Drăgușin, V.; Măntoiu, D.Ș.; Perșoiu, A.; Tîrlă, M.-L. Stable isotope hydrology of karst groundwaters in Romania. Water 2024, 16, 1489. [Google Scholar] [CrossRef]
  31. Lang, M.; Faimon, J.; Godissart, J.; Ek, C. Carbon dioxide seasonality in dynamically ventilated caves: The role of advective fluxes. Theor. Appl. Climatol. 2017, 129, 1355–1372. [Google Scholar] [CrossRef]
  32. Ek, C.; Godissart, J. Carbon dioxide in cave air and soil air in some karstic areas of Belgium. A prospective view. Geol. Belg. 2014, 17, 102–106. [Google Scholar]
  33. Šebela, S.; Prelovšek, M.; Turk, J. Impact of peak period visits on the Postojna Cave (Slovenia) microclimate. Theor. Appl. Climatol. 2013, 111, 51–64. [Google Scholar] [CrossRef]
  34. Baker, A.; Genty, D. Environmental pressures on conserving cave speleothems: Effects of changing surface land use and increased cave tourism. J. Environ. Manag. 1998, 12, 165–175. [Google Scholar] [CrossRef]
  35. Dragovich, D.; Grose, J. Impact of tourists on carbon dioxide levels at Jenolan Caves, Australia: An examination of microclimatic constraints on tourist cave management. Geoforum 2010, 21, 111–120. [Google Scholar] [CrossRef]
  36. Faimon, J.; Štelcl, J.; Sas, D. Anthropogenic CO2 flux into cave atmosphere and its environmental impact: A case study in the Císařská Cave (Moravian karst, Czech Republic). Sci. Total Environ. 2006, 369, 231–245. [Google Scholar] [CrossRef]
  37. Lang, M.; Faimon, J.; Ek, C. The relationship between carbon dioxide concentration and visitor, numbers in the homothermic zone of the Balcarka Cave (Moravian Karst) during a period of limited ventilation. Int. J. Speleol. 2015, 44, 167–176. [Google Scholar] [CrossRef]
  38. Perrier, F.; Le Mouel, J.L.; Kossobokov, V.; Crouzeix, C.; Morat, P.; Richon, P. Properties of turbulent air avalanches in a vertical pit. Eur. Phys. J. B 2005, 46, 563–579. [Google Scholar] [CrossRef]
  39. Perşoiu, A.; Onac, B.P.; Perşoiu, I. The interplay between air temperature and ice dynamics in Scărişoara Ice Cave, Romania. Acta Carsologica 2011, 40, 445–456. [Google Scholar] [CrossRef]
  40. McDermott, F.; Schwarcz, H.P.; Rowe, P.J. Isotopes in speleothems. In Isotopes in Palaeoenvironmental Research; Leng, M., Ed.; Springer: Dordrecht, The Netherlands, 2005; pp. 185–226. [Google Scholar]
  41. Kwiecien, O.; Braun, T.; Brunello, C.F.; Faulkner, P.; Hausmann, N.; Helle, G.; Hoggarth, J.A.; Ionita, M.; Jazwa, C.; Kelmelisj, S.; et al. What we talk about when we talk about seasonality—A transdisciplinary review. Earth-Sci. Rev. 2022, 225, 103843. [Google Scholar] [CrossRef]
  42. Baldini, J.U.L.; Baldini, L.M.; McDermott, F.; Clipson, N. Carbon dioxide sources, sinks, and spatial variability in shallow temperate zone caves: Evidence from Ballynamintra Cave, Ireland. J. Cave Karst Stud. 2006, 68, 4–11. [Google Scholar]
Figure 1. Samograd Cave location map and cave map with spot measurement locations (blue). Survey: Neven Bočić and Dinko Stopić, 2011.
Climate 12 00199 g001
Figure 2. Monthly air temperature (lines; T1t–T12t) and pCO2 (vertical bars; T1–T12) variability in Samograd Cave (March 2021 to February 2024). The colors of the bars and lines are decreasing with increasing distance from cave entrance (dark colors) to cave interior (light colors).
Climate 12 00199 g002
Figure 3. Range of air temperature variability (purple) in Samograd Cave.
Climate 12 00199 g003
Figure 4. Statistics of pCO2 variability in Samograd Cave at locations T12 to T5 (external locations T1 and T2 excluded), described by maximum (Max), minimum (Min), range, mean, median, and standard deviation (SD) values.
Climate 12 00199 g004
Figure 5. Statistics of Tair variability in Samograd Cave at locations T12 to T5 (external locations T1 and T2 excluded), described by maximum (Max), minimum (Min), range, mean, median, and standard deviation (SD) values.
Climate 12 00199 g005
Figure 6. Correlation coefficients between external (T1) and in-cave air temperatures in Samograd Cave at locations T2–T5.
Climate 12 00199 g006
Figure 7. The 2021–2024 variability of global pCO2 vs. average cave pCO2 in Samograd Cave with trendlines (dashed).
Climate 12 00199 g007
Figure 8. Seasonal variations in the spatial distribution of Tair values and CO2 concentrations in Samograd Cave: A comparison of values between January and August 2023. Measurements were taken along the cave’s longitudinal profile, and the plan-view data were interpolated across the cave’s full width using the Inverse Distance Weighting (IDW) method in ArcGIS Pro 3.2 to demonstrate changes in Tair values and CO2 concentrations across both time and space. In the profile view, interpolation was restricted to a 2 m high buffer. The gray gradation, from light at the entrance zone to dark at the cave’s end, symbolically represents the diminishing influence of surface conditions, which substantially affect Tair and CO2.
Climate 12 00199 g008
Figure 9. Conceptual model of CO2 dynamics in Samograd Cave (pink color represents CO2). In summer (panel (a)), root respiration and soil microbial activity produces CO2 which fills the spaces inside the limestone, creating a CO2 reservoir that also fills the cave. In winter (panel (b)), cold air inflow pushes CO2 out of the cave. The resulting low pCO2 in the cave increases the transfer of CO2 from the ground reservoir to the cave’s atmosphere, being further exported via the temperature-driven air circulation.
Climate 12 00199 g009
Table 1. Spot measurement location distance and vertical distance from the entrance level.
LocationDistance (m)Horizontal
Distance (m)
Vertical
Distance (m)
Note
T1---Outside point
T20.00.00.0Collapsed doline bottom
T1212.811.45.6
T1028.325.312.8
T344.840.818.4
T1187.682.928.4
T4132.6126.340.5Lowest point in the cave
T9159.7156.432.5
T8170.6168.626.2
T7180.6179.817.3
T6187.0185.721.7
T5202.9202.512.6
Table 2. Coefficients of variability for CO2 and air temperature.
CO2 (ppm)Tair (°C)
Max CV71.429744.8979
Min CV67.15044.0119
Range CV4.279240.8860
Disclaimer/Publisher’s Note: The statements, opinions and data contained in all publications are solely those of the individual author(s) and contributor(s) and not of MDPI and/or the editor(s). MDPI and/or the editor(s) disclaim responsibility for any injury to people or property resulting from any ideas, methods, instructions or products referred to in the content.

