Article

It Is Normal: The Probability Distribution of Temperature Extremes

by
Nir Y. Krakauer
1,2
1
Department of Civil Engineering and NOAA-CESSRST, City College of New York, New York, NY 10031, USA
2
Earth and Environmental Sciences, City University of New York Graduate Center, New York, NY 10016, USA
Climate 2024, 12(12), 204; https://doi.org/10.3390/cli12120204
Submission received: 3 October 2024 / Revised: 17 November 2024 / Accepted: 29 November 2024 / Published: 2 December 2024
(This article belongs to the Special Issue Extreme Weather Detection, Attribution and Adaptation Design)

Abstract

:
The probability of heat extremes is often estimated using the non-stationary generalized extreme value distribution (GEVD) applied to time series of annual maximum temperature. Here, this practice was assessed using a global sample of temperature time series, from reanalysis (both at the grid point and the region scale) as well as station observations. This assessment used forecast negative log-likelihood as the main performance measure, which is particularly sensitive to the most extreme heat waves. It was found that the computationally simpler normal distribution outperforms the GEVD in providing probabilistic year-ahead forecasts of temperature extremes. Given these findings, it is suggested to consider alternatives to the GEVD for assessing the risk of extreme heat.

1. Introduction

Intensifying heat extremes, as evidenced by increasing numbers of record highs in temperature time series [1], damage human health, welfare, and infrastructure, as well as ecosystems more broadly [2,3]. The impacts of heat increase nonlinearly with temperature and other heat indices [4]. Therefore, it is important to accurately forecast the risk of heat extremes given information about current weather dynamics and ongoing climate change [5].
Often, temperature extremes are modeled using statistical extreme value theory, which asymptotically can describe the distribution of the most extreme values in large enough sets of quantities drawn from any of a broad range of probability distributions [6]. This is typically operationalized by working with the time series of annual maximum temperature (denoted as TXx [7]) from station observations or weather and climate model outputs. Based on extreme value theory, the TXx values are assumed to be generated from the generalized extreme value distribution (GEVD) [8]. After GEVD parameters are estimated from the TXx data using maximum likelihood or other suitable methods, the likelihood of temperatures exceeding any specified threshold in a future year can be estimated [9,10,11,12]. To account for the impact of climate change, the GEVD is typically considered non-stationary, with its location parameter modeled as a linear function of global mean temperature and potentially other covariates [13].
Temperature extremes have been modeled using a similar approach for attribution studies, which aim to quantify the anthropogenic elevation in risk of observed recent extreme heat waves [14,15,16,17]. The standard approach for such attribution studies, as developed by the World Weather Attribution collaboration, is to estimate the probability of the observed extreme heat, assuming that TXx or another temperature-based time series follows the GEVD with the location parameter as a linear function of global mean temperature. This probability is compared with that derived from the same statistical model when the global mean temperature is set at a preindustrial baseline, and the factor (probability ratio) by which anthropogenic warming has increased the likelihood of the observed extreme is calculated [18,19].
A complication noted in attribution studies is that some observed heat extremes were so far above the historical distribution that, even when allowing for global warming, the fitted GEVD suggested these events were very unlikely [20,21]. These implausible results from the GEVD have been explained in several ways, including pointing to selection bias from analyzing only the most extreme heat waves and difficulties in accurately estimating the GEVD’s right tail from short historical records [22]. Here, the alternative considered is that the GEVD is not actually the most suitable distribution for modeling temperature extremes. In particular, the performance of the GEVD is compared here with that of a non-stationary normal distribution, which is widely used for modeling the entire temperature probability distribution (not limited to extreme values) [23,24,25,26].
The remainder of this paper is structured as follows. First, I present the TXx series analyzed—from both station data and reanalysis—along with the probabilistic forecast methodology based on either the GEVD or the normal distribution, and the evaluation metrics for forecast quality. Next, I show the results comparing the two distributions, followed by a discussion of their implications and potential directions for future research aimed at improving forecasts of heat extremes.

2. Methods

2.1. Temperature Data

Compared to station observations, reanalyses provide spatially and temporally complete weather data that may be less affected by location-specific human and measurement errors. On the other hand, station observations have the advantage of being direct measurements, while reanalyses are subject to their own biases related to the setup of the underlying numerical weather model and inhomogeneity of the assimilated data streams, which may particularly affect the representation of extreme events [27,28]. Therefore, in order to robustly evaluate the probability distribution of temperature extremes, both reanalysis and station-based temperature series are considered.

2.1.1. Reanalysis

Reanalysis TXx values are extracted from the hourly 2-m air temperature field of the state-of-the-art 5th Generation European Center for Medium-Range Weather Forecasting Reanalysis (ERA5) [29]. ERA5 data were obtained from the National Center for Atmospheric Research for 1940–2023 at a spatial resolution of 0.25 degrees [30]. ERA5 data have been used in many studies of extreme heat [31,32,33,34,35].
TXx time series were evaluated for a globally distributed sample of grid cells in populated land areas. As previously described [36], 100 ERA5 grid cells were selected based on the highest population densities in 2020, using Version 4 of the Gridded Population of the World product [37,38]. To ensure broad spatial coverage and minimize correlation between the time series, cells were only included if they were at least 10 degrees distant from any previously included cells.
In addition to this grid point-based analysis, temperature extremes were also evaluated on the regional scale [3,39]. There is a hierarchical set of politically defined regions for the analysis of climate extremes, with each hierarchal level having a characteristic areal extent [40]. Grid-scale ERA5 TXx values were averaged over each of the 231 Level 4 land regions, each typically encompassing an area of around half a million square kilometers and collectively covering almost all land areas.

2.1.2. Station Observations

Stations were selected for broad temporal and spatial coverage from the Global Historical Climatology Network (GHCN) Daily dataset, which compiles openly available observations and applies quality control measures to ensure a uniform format [41,42,43]. Stations were selected in descending order, based on the number of years from 1850 to 2023, for which stations had complete temperature observations (needed for determining TXx). Stations were only included if they were at least 4 degrees distant from all previously included stations and had at least 31 complete years of observations, for a total of 310 selected stations, each with an average of 68 years of observations (range: 31–158 years).
Figure 1 shows the locations of the selected GHCN-Daily stations, along with the selected ERA5 grid cells and regions.

2.2. Temperature Probabilistic Forecasts

For simplicity, only temperature forecasts for the next year are evaluated here using the station and reanalysis data. This may be extended to n years ahead for n > 1 using similar methods.
For each TXx time series, a probability distribution (GEVD or normal) is fitted to the first 30 years of data (for the stations, these were not necessarily consecutive years), and used to forecast the 31st year. This is repeated for each available year after the 31st until the first N 1 years are used for fitting and to forecast the last year (where N 31 denotes the total number of years in the time series), for a total of 5400 ERA5 grid point year-ahead forecasts, 12,798 ERA5 region forecasts, and 11,677 station forecasts.

2.2.1. The Generalized Extreme Value Distribution

A variable, x, distributed according to the GEVD with a real shape parameter, ξ, real location parameter, μ, and positive scale parameter, σ, follows the cumulative distribution function (CDF), as follows:
F GEV ( s ) = exp e s if ξ = 0 exp 1 + ξ s 1 ξ if ξ 0 and ξ s > 1 0 if ξ > 0 and ξ s 1 1 if ξ < 0 and ξ s 1 ,
where s = x μ σ . Details about the GEVD and its derivation from extreme value theory are available in many references [6,44,45]. ξ = 0 denotes the Gumbel distribution (GEVD Type I), which has unbounded support. ξ > 0 denotes the Fréchet distribution (Type II), which is bounded below. ξ < 0 , which is usually the best fit for temperature data, is the reversed Weibull distribution (Type III) and is bounded above. Note that some sources reverse the sign for the shape parameter so that it is equivalent to ξ in the current notation.
As conducted by the World Weather Attribution collaboration and others, the GEVD fitted is one with a trend in the location parameter. That is, ξ and σ are taken to be the same across all years, but μ ( t ) = μ 0 + μ t T ( t ) , where T t denotes the mean annual global temperature, either from ERA5 (for reanalysis TXx time series) or from the BEST global mean temperature anomaly time series [46,47] (for station TXx time series). The maximum-likelihood parameter values θ ^ were found using the Broyden–Fletcher–Goldfarb–Shanno (BFGS) algorithm and the analytic gradient of the likelihood with respect to the parameter vector. The starting point for the likelihood optimization was chosen using the method of moments [48,49] with the trend coefficient μ t initialized at 0. At times, maximum likelihood returned a degenerate set of parameters with very negative ξ, for which the gradient of the likelihood was not close to zero, which relates to the known non-regularity of likelihood as a function of GEVD parameters when ξ 0.5 [50,51]; in such cases, inspired by previous treatments of this sort of problem [52,53], the optimization was redone with a penalty term proportional to ξ2, which was progressively increased until the gradient indicated convergence to a likelihood maximum.
Probabilistic forecasts were obtained by considering the GEVD with maximum likelihood parameter values as well as the full posterior distribution of GEVD parameters [54,55]. Assuming standard uninformative prior distributions of the parameters, this involves calculating the following:
p ( x | t f ) = p ( x | t f , θ ) p ( θ | x ) d θ .
Here, x denotes the temperature being forecast, t f denotes the forecast year, θ denotes the vector of distribution parameters (ξ, σ, μ 0 , μ t ), and x denotes the TXx time series from previous years used for fitting. The integration is performed over all admissible values of θ (here, a four-dimensional space). Since, for the GEVD, this integral does not have an analytic solution, it was approximated by drawing 1000 parameter samples from the multivariate normal distribution centered at the maximum likelihood value and with covariance matrix given by the inverse of the analytic second derivative matrix of the likelihood at that point. These samples were then weighted following the importance sampling methodology [56]. The resulting approximation for the posterior predictive density was as follows:
p ( x | t f ) Σ i = 1 n s w i p ( x | t f , θ i ) ,
where n s denotes the number of samples (1000), p ( x | t f , θ i ) denotes the GEVD density for each sampled set of parameter values, and w i denotes the non-negative importance-sampling weights, which sum to 1. In some cases, the probability density of the observation was exactly zero under all 1000 samples. For these instances, sampling was repeated with a wider dispersion for the shape parameter than what was implied by the second derivative of the likelihood. This allowed the inclusion of unlikely parameter sets with less negative shape parameters under which the observation had nonzero probability.

2.2.2. The Normal Distribution

The normal distribution has one fewer parameter than the GEVD since the shape is fixed. The location parameter is the distribution mean, and the scale parameter is the distribution standard deviation. As with the GEVD, the location parameter is assumed to linearly depend on temperature, while the scale parameter is time-invariant. For the normal distribution with noninformative priors, the integral (2) over all possible parameter combinations has an analytic solution, with the posterior p ( x | t f ) following a t distribution [26,57], so there was no need for numerical optimization or sampling parameter values from their posterior distribution.

2.2.3. Trend or Stationarity

To help evaluate the performance of the compared distributions (GEV or normal, both with trends in the location parameter) over a broader context, stationary versions of the GEV and normal distributions were also fitted and evaluated. These differed from the non-stationary models only in that there was no trend, μ t = 0 , resulting in one fewer parameter to be estimated from the observations.

2.3. Forecast Performance Metric

The main performance metric for the probabilistic forecasts, used to compare the GEVD and normal distribution approaches, was the mean negative log-likelihood (NLL) of the actual next-year temperature in the forecast distribution. The expression for NLL is of the form log p ( x ^ | t f ) , where p ( x | t f ) denotes the forecast probability distribution and x ^ denotes the actual maximum temperature during the forecast year. Lower NLL corresponds to the greater forecast probability density at the observed value and, therefore, a better forecast. NLL is closely connected to the expected information gain from the forecast system [58,59] and is the unique probability metric satisfying certain desirable properties [60]. Compared to other metrics used to evaluate probabilistic forecast performance, NLL is particularly sensitive to the probabilities assigned to the most unlikely observed values (here, typically the most extreme and impactful heat anomalies). In the extreme, assigning zero forecast probability to an event that was observed would result in infinite NLL [61].
Supplementary metrics that were also calculated included the Kolmogorov–Smirnov statistic and mean return period of the observed TXx in the forecast CDF. For a well-calibrated forecast, the distribution of the actual maximum temperatures x ^ in the forecast CDF should follow a uniform density between 0 and 1, with, e.g., close to 1% of observations found above the forecast 99th percentile, and close to 0.1% of observations above the forecast 99.9 percentile. The Kolmogorov–Smirnov statistic can be used to quantify overall closeness to the uniform distribution, with lower values suggesting better calibration [26]. In addition to good performance over all cases, decision-makers may well be especially interested in the calibration of predictions of the worst heat extremes. Thus, it is of particular importance to consider the frequency of observations at the highest quantiles, near 1, corresponding to heat extremes with long return periods (where the return period is a function of the quantile, q, with RP = 1 1 q ). The forecasted RP of the observations has an infinite expectation because the integral 0 1 1 1 q d q is infinite. However, it is possible to compare the mean value of a sublinear power RP k ( 0 < k < 1 ), which has the expected value of 1 / ( 1 k ) for a well-calibrated forecast. A higher-than-expected value indicates that the observations have values that are significantly more extreme than the forecast predicts, while a lower-than-expected value suggests that the forecast assigns greater probabilities to extreme events than are observed. Higher k values give greater prominence to the most extreme events. Therefore, the CDF (across forecasts) was plotted, and the mean RP k subtracted from its ideal value of 1 / ( 1 k ) was computed for k ranging from 0.1 to 0.9. Similar ideas have previously been used to evaluate probabilistic forecasts of temperature and precipitation extremes [62,63].

3. Results

The mean NLL was lower for the normal distribution forecasts compared to the GEVD forecasts across all three datasets (GHCN stations, ERA5 grid cells, and ERA5 regions) (Table 1), suggesting that, overall, the normal distribution outperforms the GEVD in forecasting the annual maximum temperature TXx. NLL was higher for ERA5 grid cells than for ERA5 regions, and the highest for individual stations, consistent with more erratic temperatures at smaller spatial scales.
Significance measures for the difference in mean NLL between GEVD and normal forecasts were estimated using 1000 bootstrap resamples [64] from the 5400 ERA5 grid forecasts (this dataset was chosen because the larger spacing between grid points minimized inter-forecast correlations, which were not accounted for in the bootstrap resampling). Based on these, the difference of 0.0195 nats in mean NLL between the two sets of forecasts (indicating that the normal distribution produced better forecasts on average than the GEVD) is greater than zero at the 0.999 confidence level, and has a 95% confidence interval of 0.0099 to 0.0311 nats.
The Kolmogorov–Smirnov statistic did not consistently favor one forecasting method over the other: It was lower for GEVD forecasts for the stations and grid cells, but lower for normal distribution forecasts for the regions (Table 1). This suggests that the reason for the normal forecasts outperforming the GEVD ones as measured by NLL is not their performance near the middle of the TXx probability distribution, to which the Kolmogorov–Smirnov statistic is the most sensitive, but due to the normal distribution better forecasting the more extreme TXx values. Indeed, if we look at the mean RP k , especially at higher k, such as 0.9, there are large differences between the two forecast probability distributions, resulting from some observations being highly unlikely (very large RP) on the GEVD forecasts, whereas the normal distribution forecasts of the most extreme observations are relatively well-calibrated.
The stationary normal and GEVD forecasts clearly performed worse in all respects compared with the non-stationary ones that were taken as the standards, consistent with the pronounced warming trend seen in all temperature datasets. As might be expected given this warming trend, the stationary forecasts particularly underestimate the likelihood of the hottest extremes observed in recent decades, as quantified by the large positive departures of RP moments from the values for a well-calibrated forecast. The stationary version of the GEVD tended to do slightly worse than the stationary version of the normal distribution (Table 1).
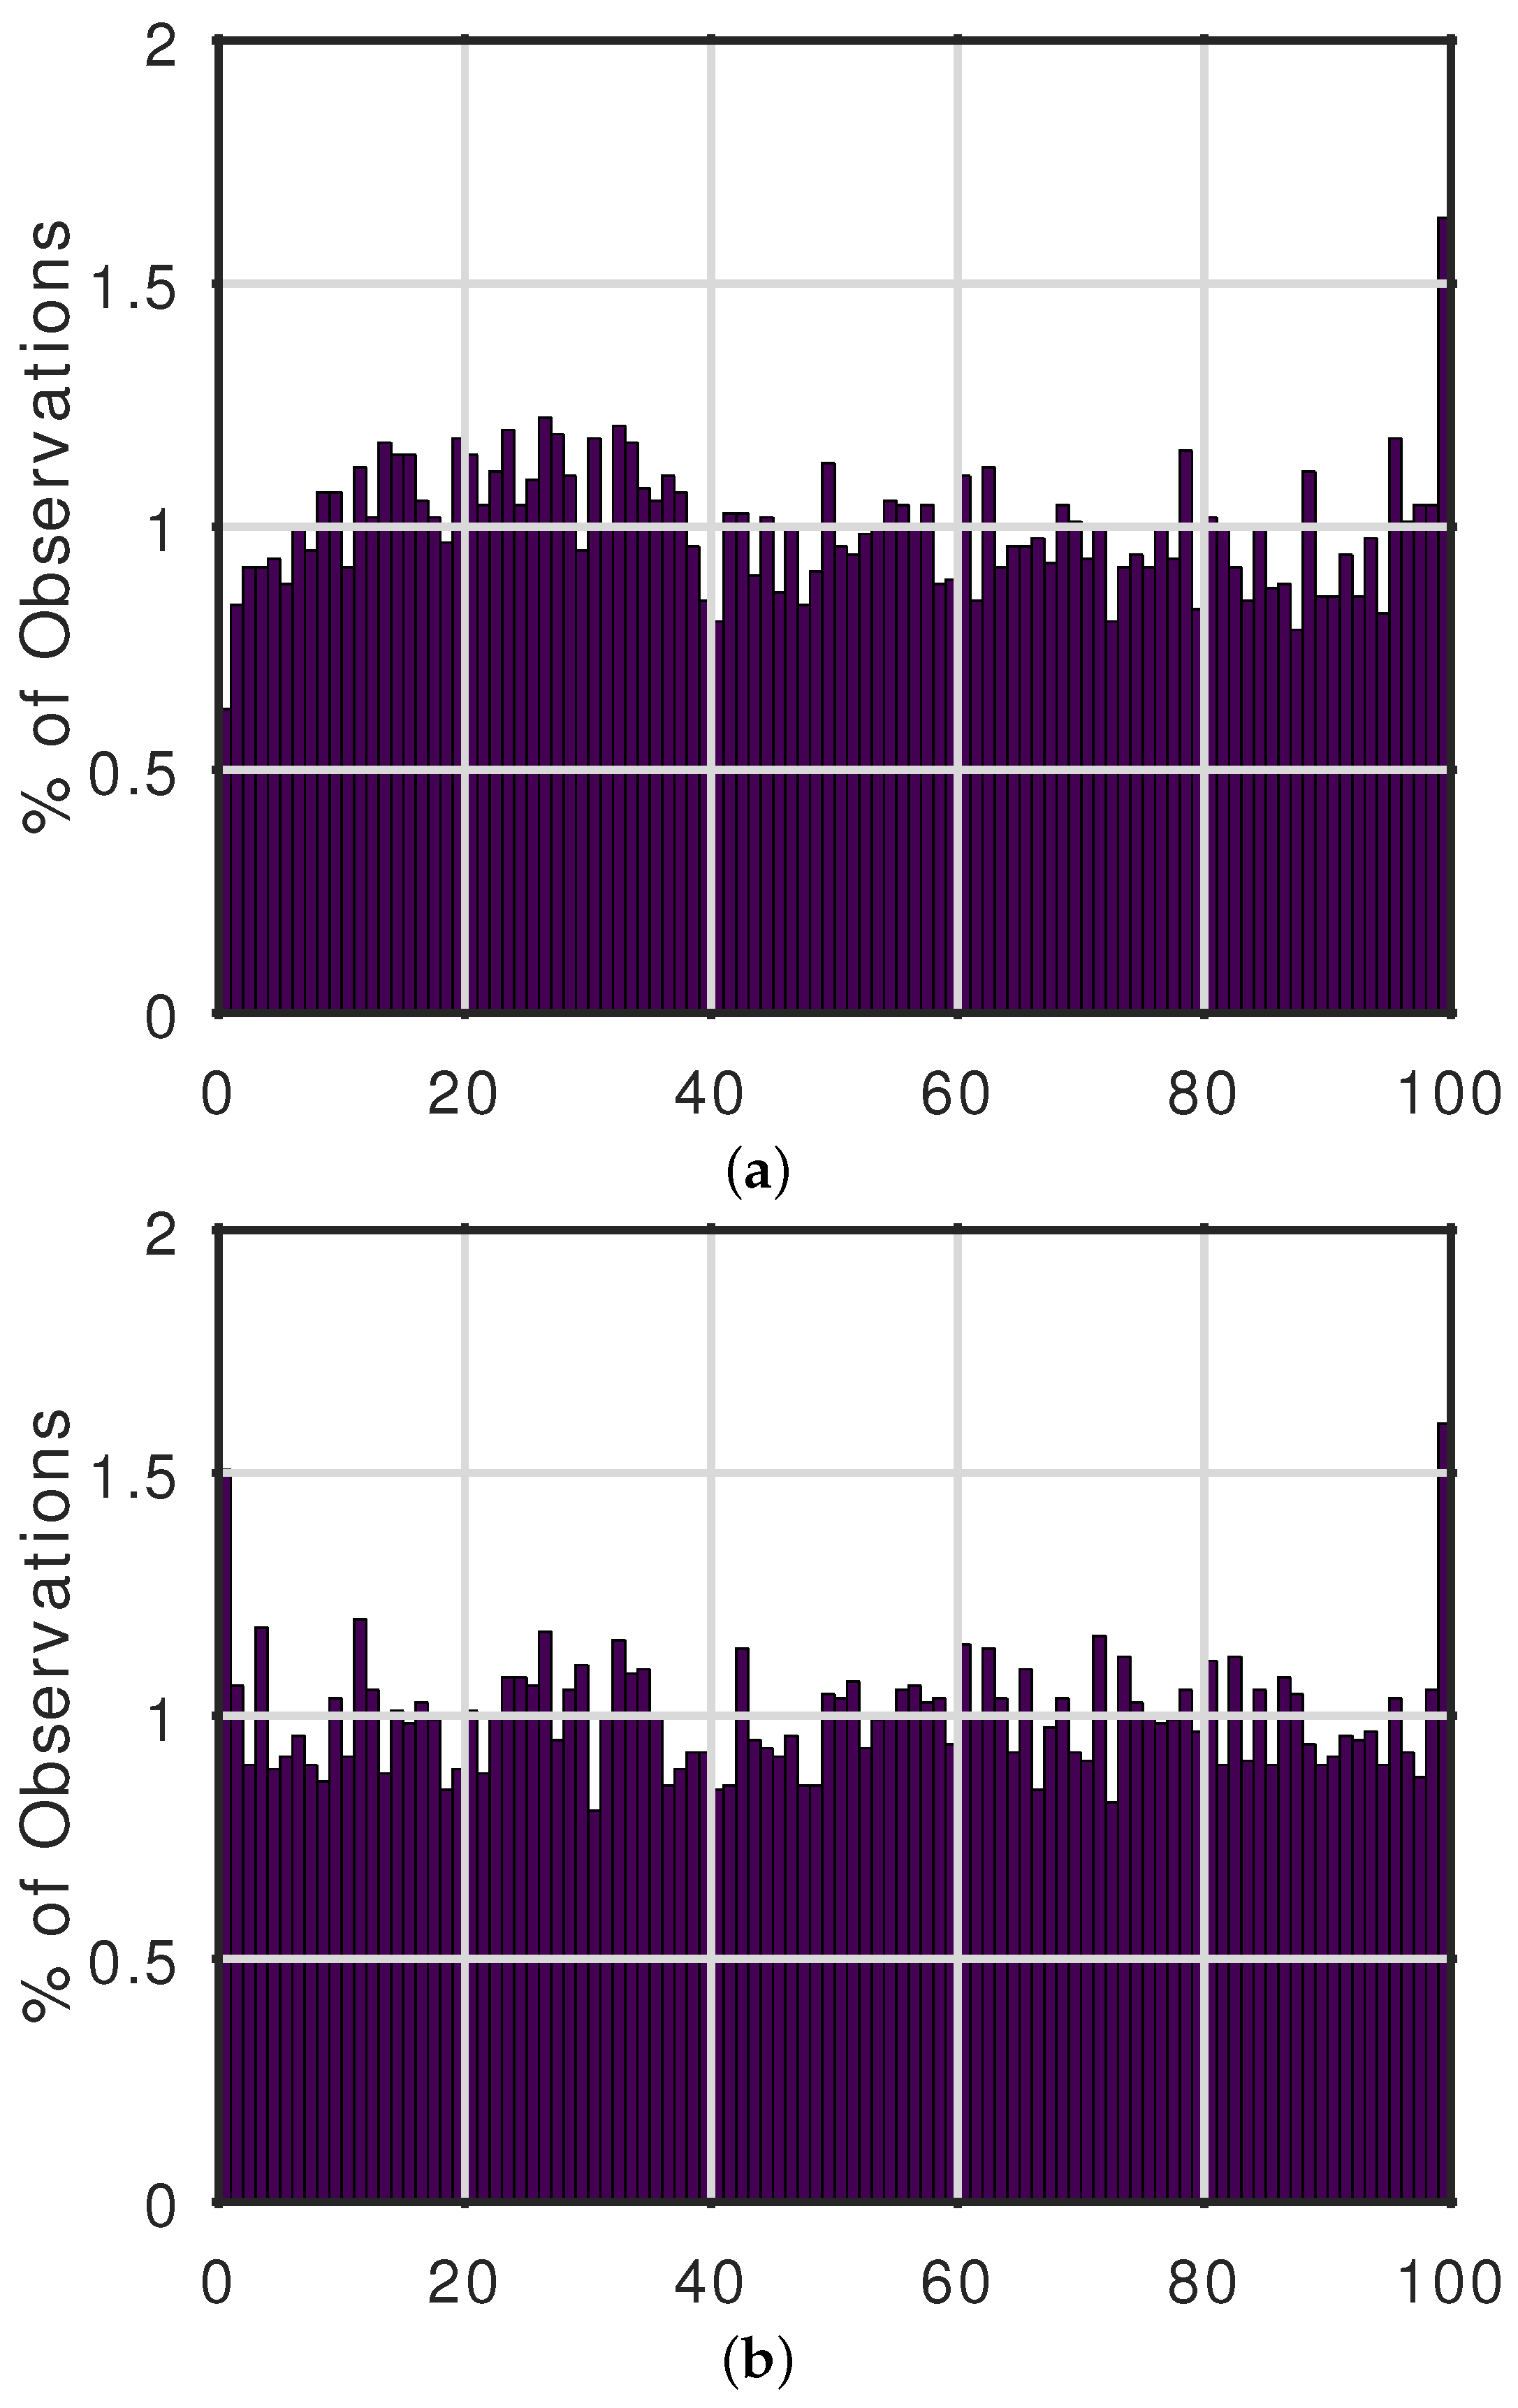
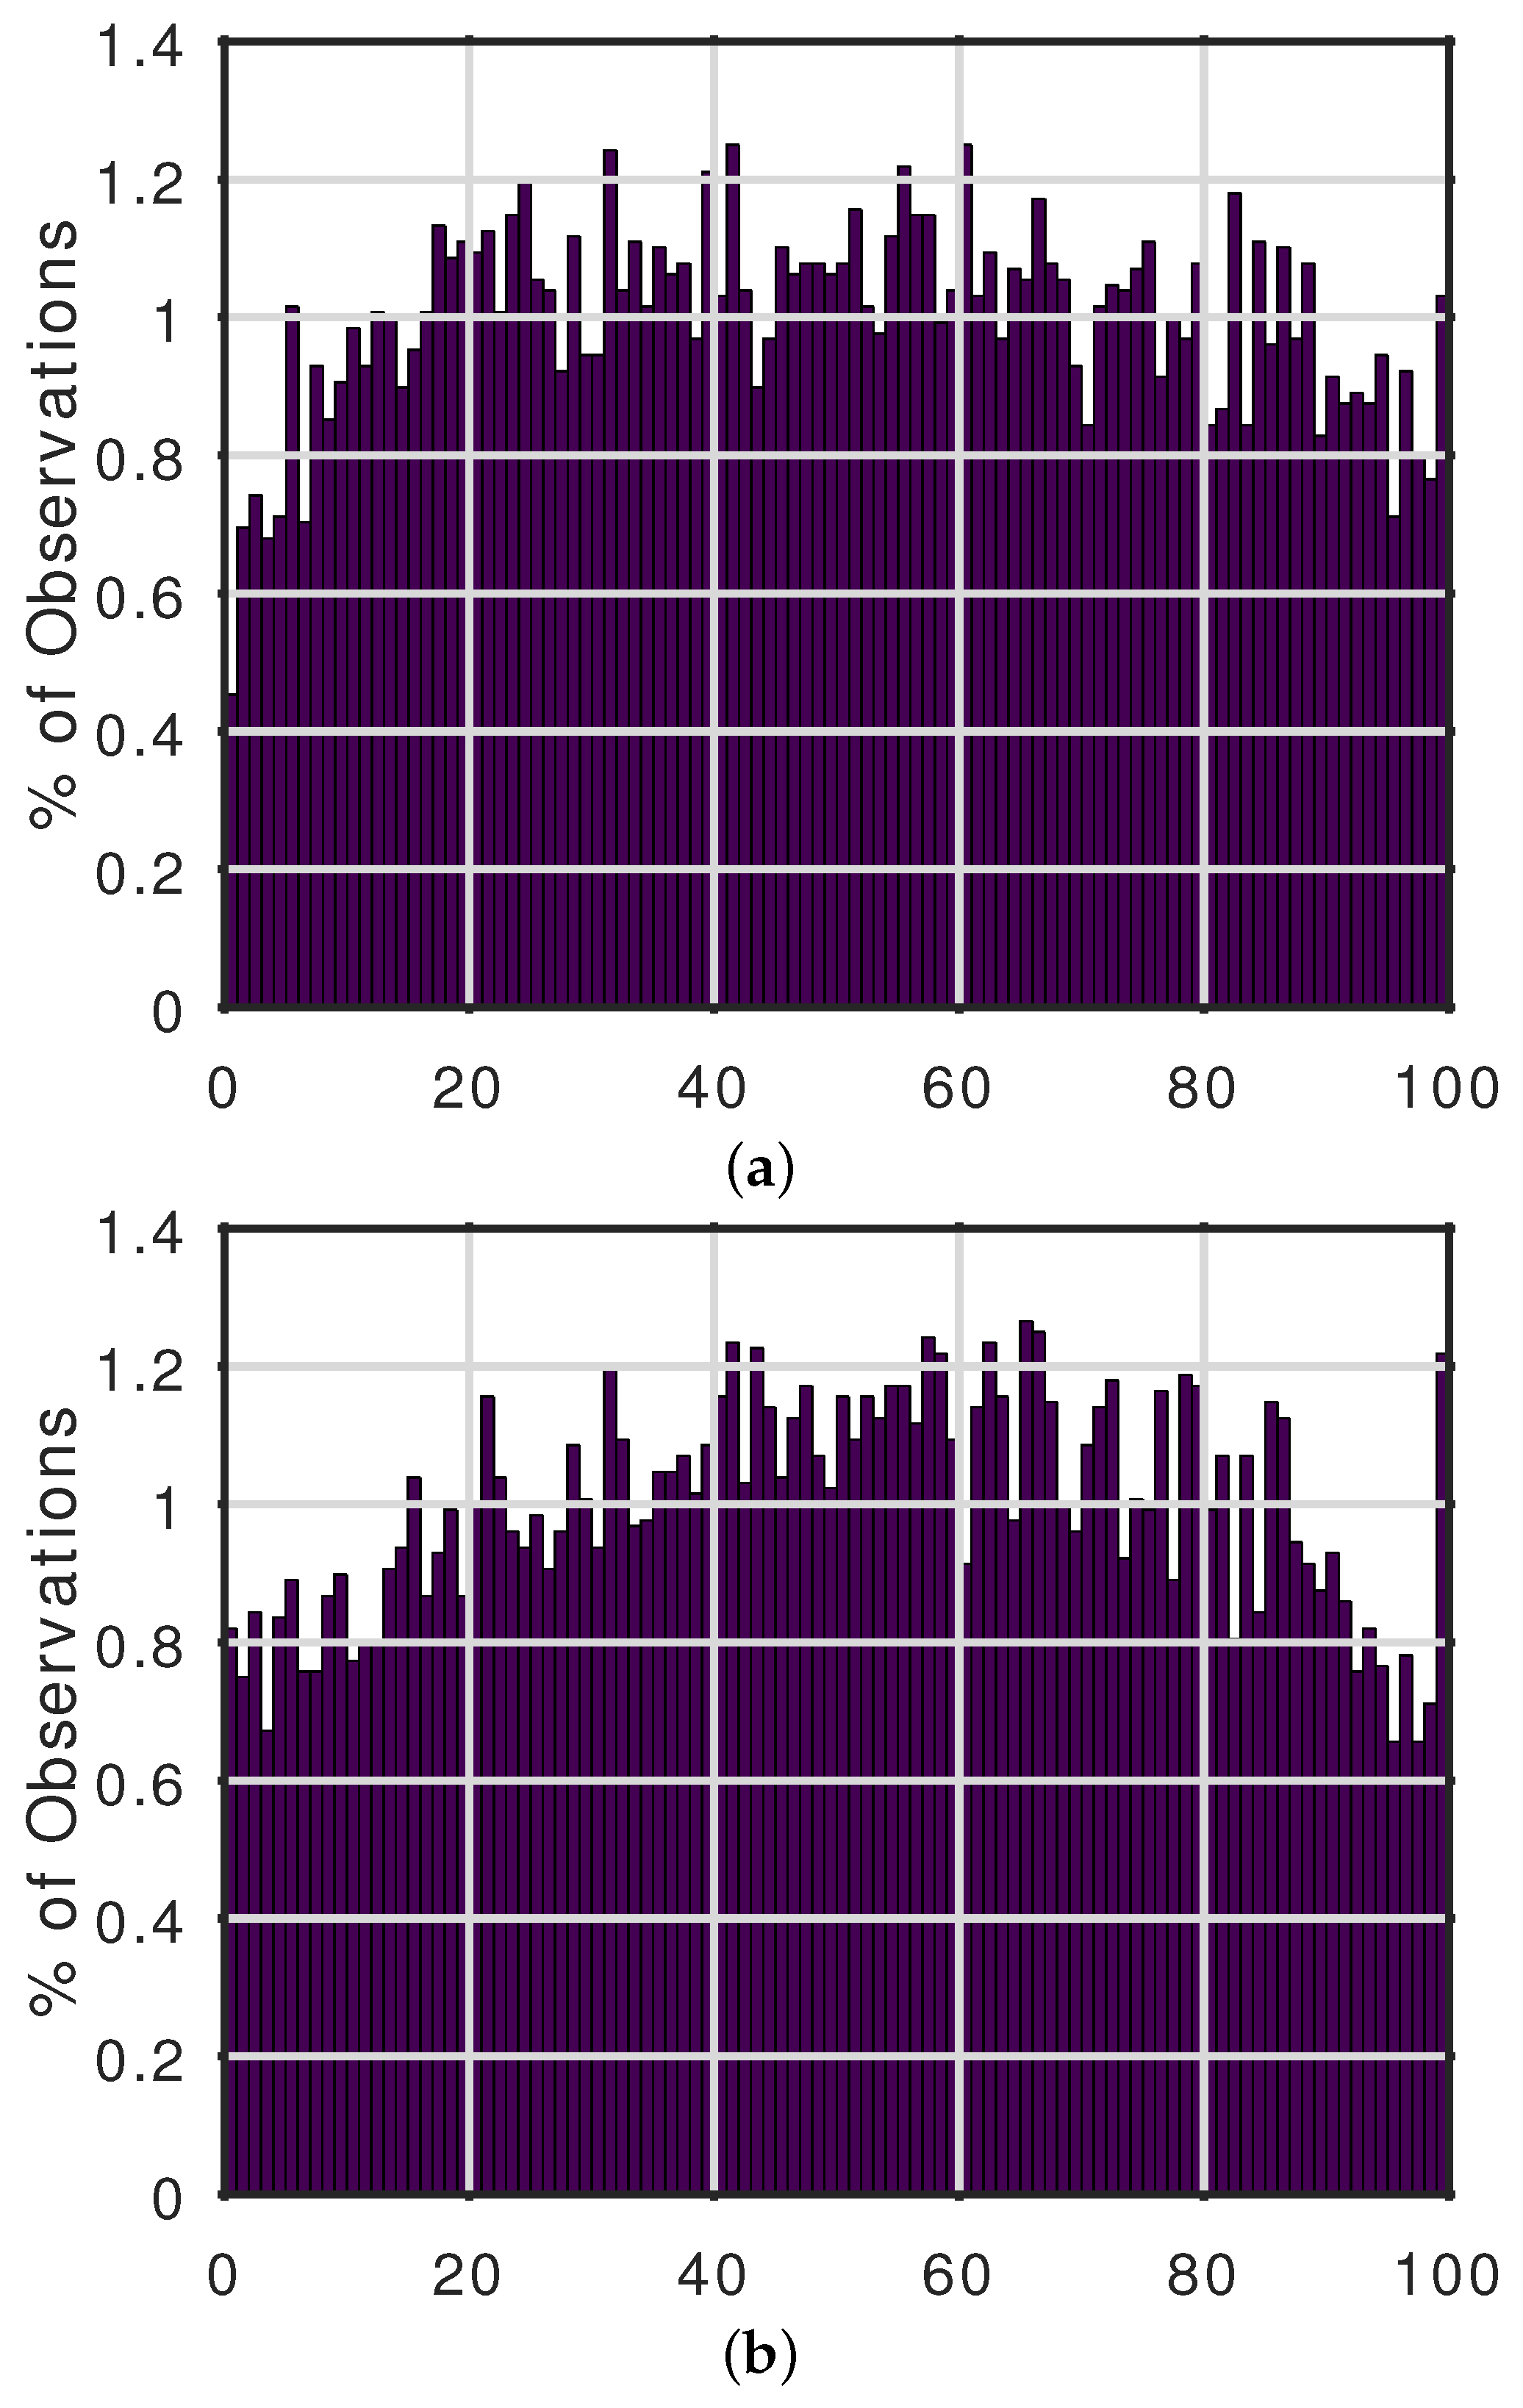
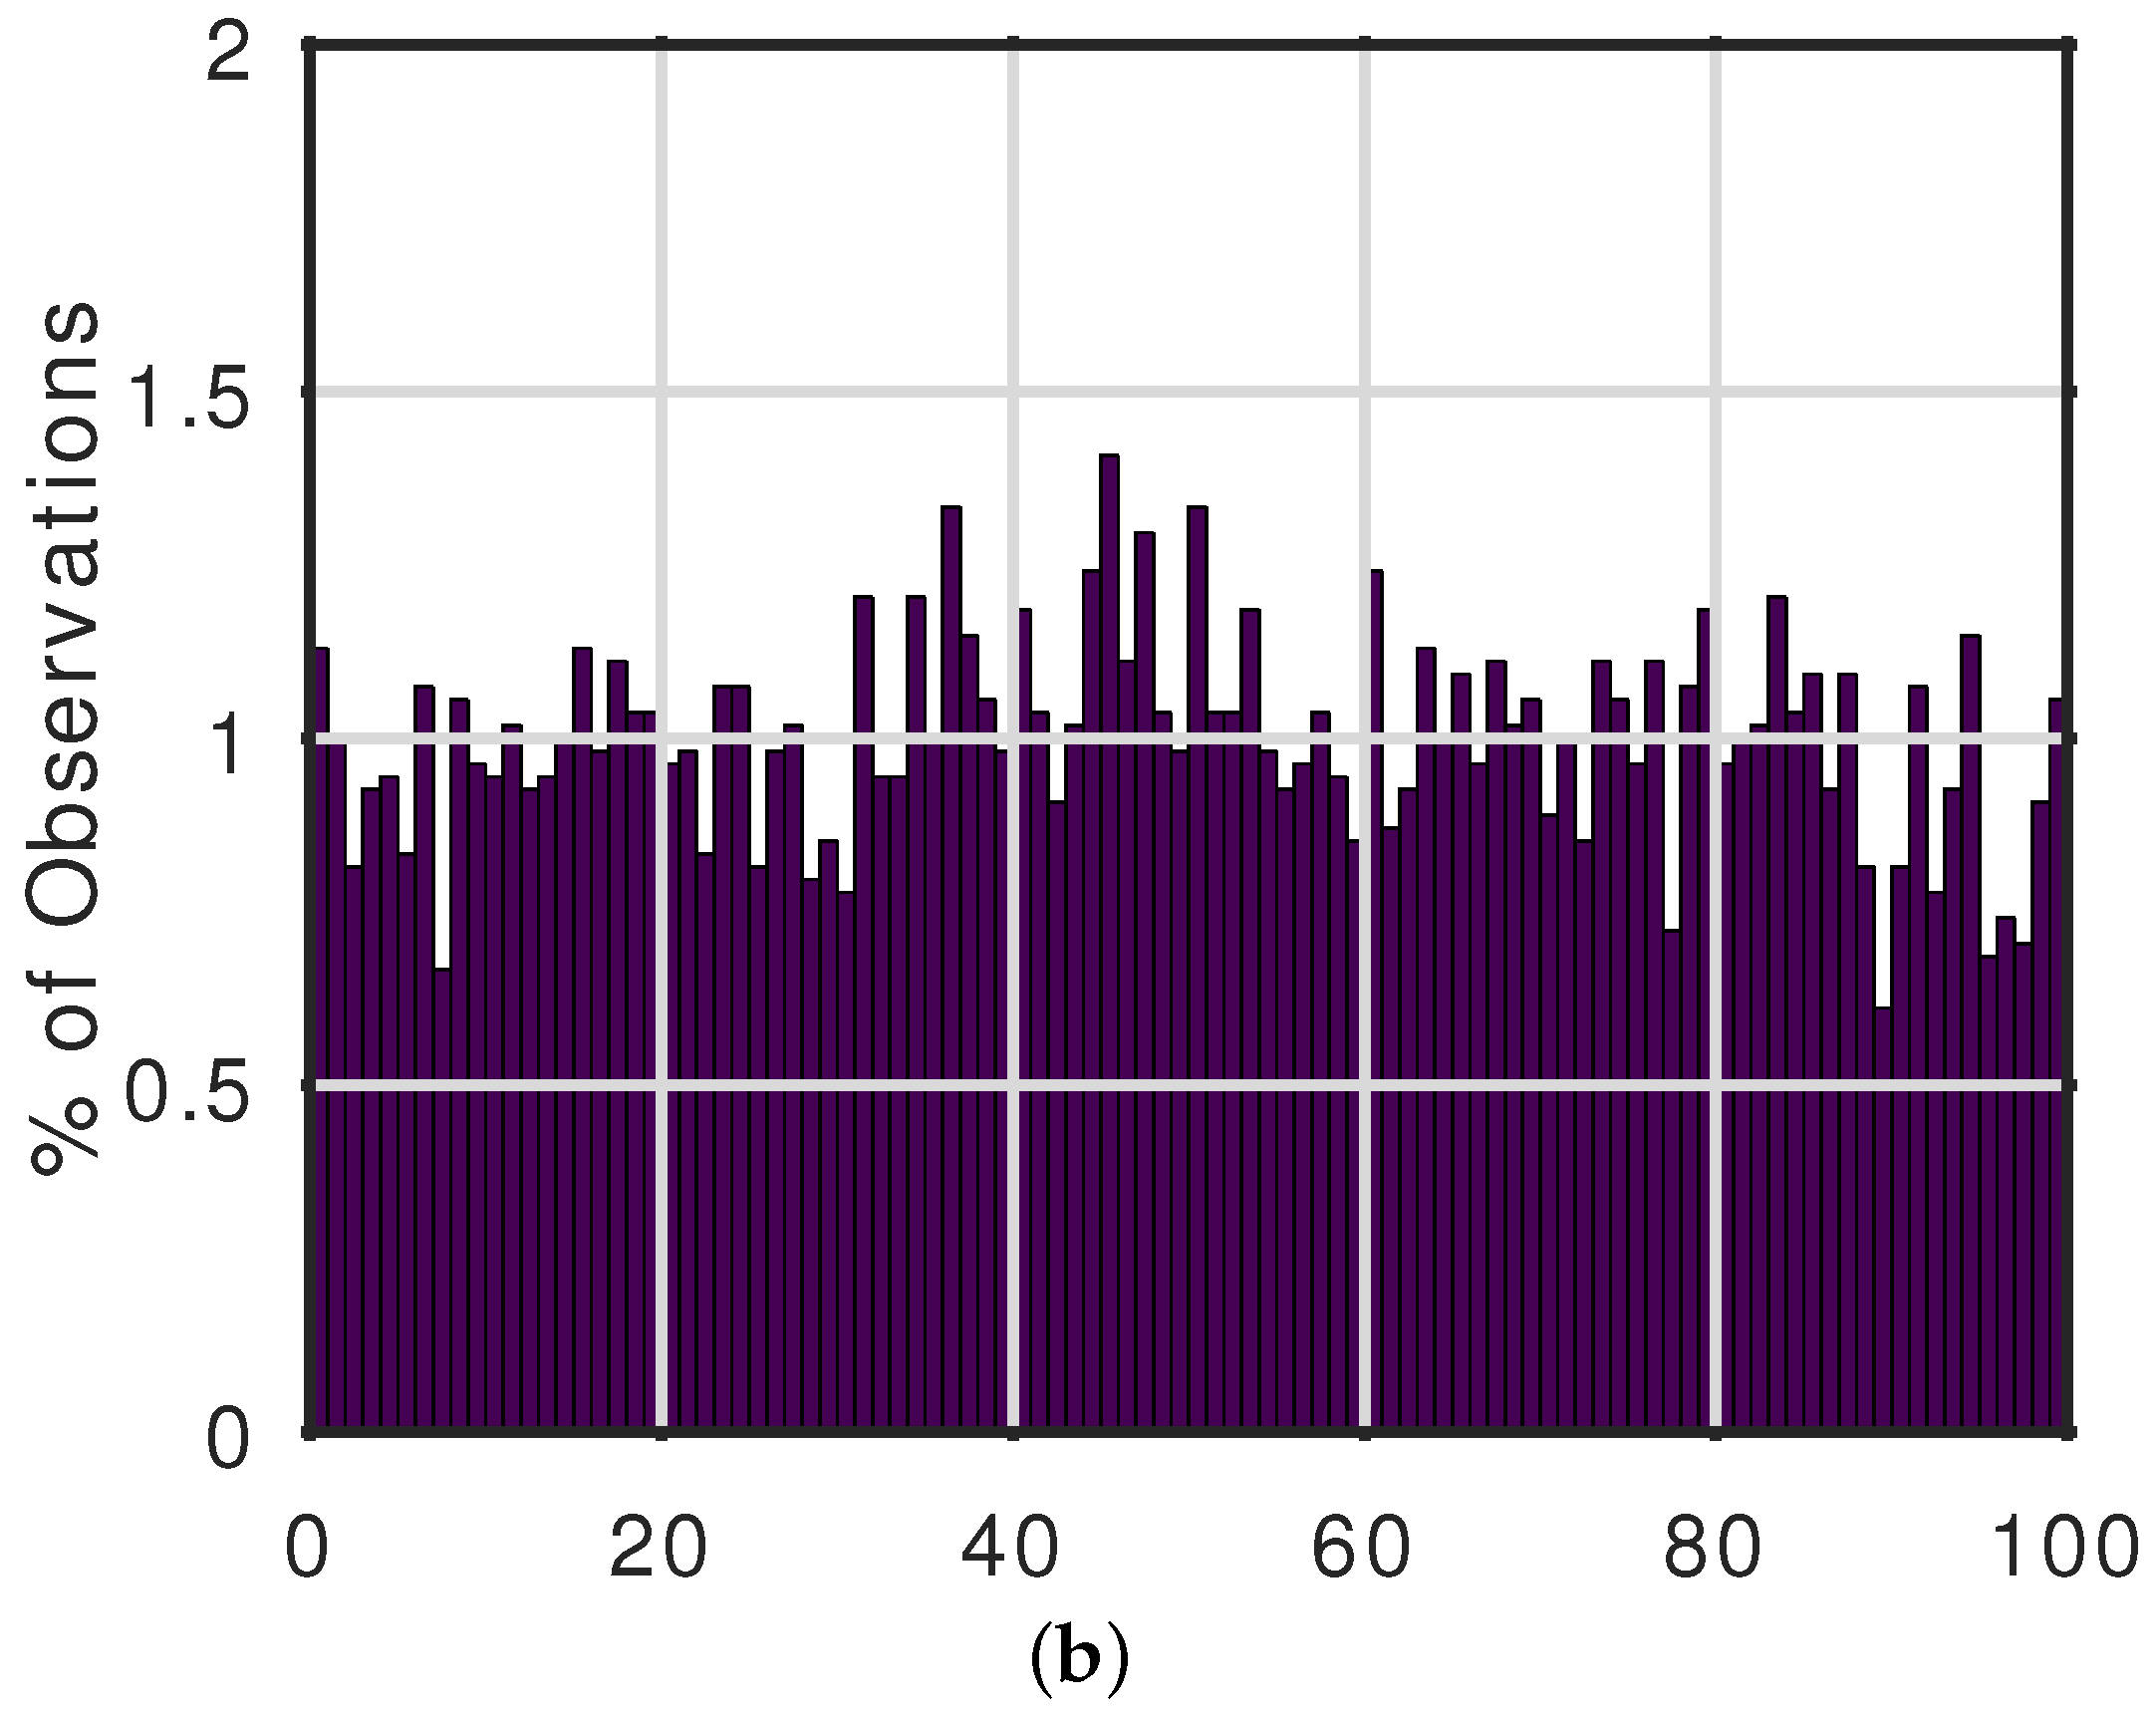
Coming back to the non-stationary forecasts, even with the normal distribution, RP 0.9 is considerably larger than expected for the station data (but not for reanalysis data), indicating that even this forecast does not completely account for the most extreme few station observations. In fact, out of 11,677 station observations, 191 (1.64%) were above the 99th percentile of the normal forecast (100-year return period—compared with 1% expected under a perfectly calibrated forecast), and 29 (0.25%) were above the 99.9 percentile (100 year return period—compared with 0.1% expected under a perfectly calibrated forecast). For the GEVD forecasts, the number above the 99th percentile was about the same, 183, but the number above the 99.9 percentile was larger, 47 (Figure 2). The GEVD forecasts for ERA5 regions also show more observations than expected in the top percentile (Figure 3), while for ERA5 grid cells, both forecasts were reasonably calibrated at the top percentile (Figure 4). Thus, much of the normal distribution’s outperformance appears to lie in its ability to better represent the most extreme fraction of observations, which the GEVD, despite its theoretical foundation in extreme value theory, performed worse at representing.

4. Discussion

4.1. Why Are Extreme Temperatures So Normal?

A key finding of this work is that, for probabilistic forecasting of hot extremes in recent decades, the simpler normal distribution outperformed the GEVD. The GEVD underestimated the probability of the most extreme high temperatures. Therefore, it is recommended that the World Weather Attribution collaboration and similar efforts replace, or at least supplement, the GEVD as their primary tool for estimating the probability of extreme heat waves.
This poorer performance of the GEVD for the hottest extremes is unexpected, given its theoretical justification as the asymptotic limit distribution for extremes derived from a wide variety of parent distributions. Indeed, the World Weather Attribution protocol notes that “If the event is not very extreme, a normal distribution can also be used. …Gaussian [=normal] distributions are often seen not to describe the tails well. …[The GEVD] is thus used for event definitions like the annual maximum temperature” [18]. Also outside of climate science, it is commonly assumed that, unlike the GEVD and related distributions, normal distributions underestimate the likelihood of the most extreme and impactful events [65,66]. There are a number of possible reasons for the surprising over-performance, found in the current study, of the normal distribution as compared to the GEVD for annual maximum temperatures.
The finite available record length, typically on the order of 50–100 years from observations and reanalyses, may not be sufficient for the GEVD to be a good approximation. Also, in regions with strong temperature seasonality, TXx represents the maximum over only a few dozen days and a few synoptic shifts during the hottest month or two, which may not constitute a sufficiently extreme block maximum for the GEVD to approximate well.
In general, the best probability distribution to fit a given type of data depends on the length of the available record. More complex distributions (with additional free parameters) often provide better predictions when there is a very long record for fitting, whereas simpler distributions with fewer free parameters are typically better suited when there are fewer data points [67]. From this perspective, the present analysis, with the test forecasts being based on 30–157 years of data, is directly applicable to typical efforts to estimate the risk of future temperature extremes using either station or reanalysis data, where the record length is of this order in most cases.
More concretely, the GEVD fitted to the annual maximum temperature series generally has a negative shape parameter, ξ, which implies zero probability mass above some upper limit that may not be far above the record historical value. This does not fit the physics of even a stationary climate, since an unlikely but physically possible configuration of atmospheric circulation can generally push temperature substantially above a previous record at a given location. In a climate with different anthropogenic and natural perturbations over a range of timescales, a hard upper limit to next year’s temperature is even less plausible. The Bayesian approach adopted here, which uses the full posterior distribution of GEVD parameters to generate a forecast—thereby blurring the definite upper bound associated with each individual GEVD parameter combination—mitigates this conceptual discrepancy and improves the forecast NLL compared to using a point estimate of GEVD parameters [36], although this is evidently not enough to predict sufficient probabilities for the most extreme recently observed temperatures.

4.2. Extensions and Future Research Directions

Even the normal distribution underestimated the occurrence of the most extreme temperatures, particularly in station data. As described below, a number of approaches could be tried to generate better forecasts, beyond an empirical adjustment for this misfit [68] in the form of a quantile-based bias correction [69]. The poorer fit of forecasts for station temperature compared to reanalysis temperature may also be influenced by observation errors, shifts in instruments and observation conditions, and aspects of microclimate that are not captured in reanalyses but could still play an important role in local heat impacts.
Temperatures in certain regions have been found to have nonzero skew or asymmetric tails, inconsistent with the normal distribution [24,70,71]. In this context, generalized normal and skew-normal distributions could be explored [72,73] to improve extreme temperature forecasts. Variants of the GEVD that may mitigate its underestimation of the likelihood of the most extreme temperatures can also be compared [36]. The distribution scale (standard deviation) may change over time, as well as its location (mean) [74,75]. Covariates for local climate influences (beyond global mean temperature) could be added, ranging from teleconnections such as the Southern Oscillation to urbanization, land use, and air pollution [76,77,78]. Spatial statistics methods could also refine forecasts of extreme heat risk and allow extension to unobserved areas by pooling information from several nearby stations [79].
It would be interesting to see to what extent the conclusions drawn for annual maximum temperature (TXx) values are valid for other temperature extremes. Annual minimum temperature, TNn, like TXx, has been warming, and understanding the evolving risk of cold extremes is significant for agriculture, ecology, and civic infrastructure [80,81,82,83]. Humid heat poses health risks beyond temperature alone, so the risk of extreme humid heat metrics, such as wet bulb temperature, could also be assessed [33,84,85,86].

5. Conclusions

In this work, a representative global station, grid, and regional temperature time series were used to compare the ability of the GEVD and normal distributions to accurately estimate the risk of the hot extremes observed in recent decades using only data from earlier years. A Bayesian approach was used to integrate across parametric uncertainty to produce probabilistic assessments of future temperature extremes. As measured by the negative log-likelihood of observations in the forecast, year-ahead local and regional maximum temperature forecasts align better with the normal distribution compared to the GEVD. Selecting an appropriate probability distribution is crucial for generating well-calibrated assessments of the risk of high-impact heat extremes, which can inform mitigation and adaptation measures at local, national, and global scales. Several potential directions for follow-up research are outlined to further improve probabilistic forecasts of the most extreme events, including the exploration of alternative probability distributions and covariates beyond global mean temperature.

Funding

NYK was partly funded by the United States National Oceanic and Atmospheric Administration Educational Partnership Program with Minority-Serving Institutions—Cooperative Science Center for Earth System Sciences and Remote Sensing Technologies under Cooperative Agreement Grant number NA22SEC4810016. The statements contained within this article are not the opinions of the funding agency or the United States government but reflect the author’s opinions.

Data Availability Statement

The temperature data used and programs written to carry out the reported analyses are available at https://github.com/nir-krakauer/normal-heat-extremes.

Conflicts of Interest

The author declares no conflicts of interest.

References

  1. Nerantzaki, S.D.; Papalexiou, S.M.; Rajulapati, C.R.; Clark, M.P. Nonstationarity in high and low-temperature extremes: Insights from a global observational data set by merging extreme-value methods. Earth’s Future 2023, 11, e2023EF003506. [Google Scholar] [CrossRef]
  2. Stillman, J.H. Heat waves, the new normal: Summertime temperature extremes will impact animals, ecosystems, and human communities. Physiology 2019, 34, 86–100. [Google Scholar] [CrossRef] [PubMed]
  3. Thompson, V.; Mitchell, D.; Hegerl, G.C.; Collins, M.; Leach, N.J.; Slingo, J.M. The most at-risk regions in the world for high-impact heatwaves. Nat. Commun. 2023, 14, 2152. [Google Scholar] [CrossRef] [PubMed]
  4. Matthews, T.K.R.; Wilby, R.L.; Murphy, C. Communicating the deadly consequences of global warming for human heat stress. Proc. Natl. Acad. Sci. USA 2017, 114, 3861–3866. [Google Scholar] [CrossRef]
  5. Oldenborgh, G.J.V.; Wehner, M.F.; Vautard, R.; Otto, F.E.L.; Seneviratne, S.I.; Stott, P.A.; Hegerl, G.C.; Philip, S.Y.; Kew, S.F. Attributing and projecting heatwaves is hard: We can do better. Earth’s Future 2022, 10, e2021EF002271. [Google Scholar] [CrossRef]
  6. de Haan, L.; Ferreira, A. Extreme Value Theory; Springer: New York, NY, USA, 2006. [Google Scholar] [CrossRef]
  7. Klein Tank, A.M.; Zwiers, F.W.; Zhang, X. Guidelines on Analysis of Extremes in a Changing Climate in Support of Informed Decisions for Adaptation; Technical Report; World Meteorological Organization: Geneva, Switzerland, 2009. [Google Scholar]
  8. Jenkinson, A.F. The frequency distribution of the annual maximum (or minimum) values of meteorological elements. Q. J. R. Meteorol. Soc. 1955, 81, 158–171. [Google Scholar] [CrossRef]
  9. Hall, P.; Tajvidi, N. Nonparametric analysis of temporal trend when fitting parametric models to extreme value data. Stat. Sci. 2000, 15, 153–167. [Google Scholar] [CrossRef]
  10. Slater, R.; Freychet, N.; Hegerl, G. Substantial changes in the probability of future annual temperature extremes. Atmos. Sci. Lett. 2021, 22, e1061. [Google Scholar] [CrossRef]
  11. Castillo-Mateo, J.; Asín, J.; Cebrián, A.C.; Mateo-Lázaro, J.; Abaurrea, J. Bayesian variable selection in generalized extreme value regression: Modeling annual maximum temperature. Mathematics 2023, 11, 759. [Google Scholar] [CrossRef]
  12. Rai, S.; Hoffman, A.; Lahiri, S.; Nychka, D.W.; Sain, S.R.; Bandyopadhyay, S. Fast parameter estimation of generalized extreme value distribution using neural networks. Environmetrics 2024, 35, e2845. [Google Scholar] [CrossRef]
  13. Cannon, A.J. A flexible nonlinear modelling framework for nonstationary generalized extreme value analysis in hydroclimatology. Hydrol. Process. 2009, 24, 673–685. [Google Scholar] [CrossRef]
  14. Otto, F.E.L.; Massey, N.; van Oldenborgh, G.J.; Jones, R.G.; Allen, M.R. Reconciling two approaches to attribution of the 2010 Russian heat wave. Geophys. Res. Lett. 2012, 39, L04702. [Google Scholar] [CrossRef]
  15. Fischer, E.M.; Knutti, R. Anthropogenic contribution to global occurrence of heavy-precipitation and high-temperature extremes. Nat. Clim. Change 2015, 5, 560–564. [Google Scholar] [CrossRef]
  16. Zhang, L.; Yu, X.; Zhou, T.; Zhang, W.; Hu, S.; Clark, R. Understanding and attribution of extreme heat and drought events in 2022: Current situation and future challenges. Adv. Atmos. Sci. 2023, 40, 1941–1951. [Google Scholar] [CrossRef]
  17. Tejedor, E.; Benito, G.; Serrano-Notivoli, R.; González-Rouco, F.; Esper, J.; Büntgen, U. Recent heatwaves as a prelude to climate extremes in the western Mediterranean region. NPJ Clim. Atmos. Sci. 2024, 7, 218. [Google Scholar] [CrossRef]
  18. Philip, S.; Kew, S.; van Oldenborgh, G.J.; Otto, F.; Vautard, R.; van der Wiel, K.; King, A.; Lott, F.; Arrighi, J.; Singh, R.; et al. A protocol for probabilistic extreme event attribution analyses. Adv. Stat. Climatol. Meteorol. Oceanogr. 2020, 6, 177–203. [Google Scholar] [CrossRef]
  19. van Oldenborgh, G.J.; van der Wiel, K.; Kew, S.; Philip, S.; Otto, F.; Vautard, R.; King, A.; Lott, F.; Arrighi, J.; Singh, R.; et al. Pathways and pitfalls in extreme event attribution. Clim. Change 2021, 166, 13. [Google Scholar] [CrossRef]
  20. Philip, S.Y.; Kew, S.F.; van Oldenborgh, G.J.; Anslow, F.S.; Seneviratne, S.I.; Vautard, R.; Coumou, D.; Ebi, K.L.; Arrighi, J.; Singh, R.; et al. Rapid attribution analysis of the extraordinary heat wave on the Pacific coast of the US and Canada in June 2021. Earth Syst. Dyn. 2022, 13, 1689–1713. [Google Scholar] [CrossRef]
  21. Bercos-Hickey, E.; O’Brien, T.A.; Wehner, M.F.; Zhang, L.; Patricola, C.M.; Huang, H.; Risser, M.D. Anthropogenic contributions to the 2021 Pacific Northwest heatwave. Geophys. Res. Lett. 2022, 49, e2022GL099396. [Google Scholar] [CrossRef]
  22. Zeder, J.; Sippel, S.; Pasche, O.C.; Engelke, S.; Fischer, E.M. The effect of a short observational record on the statistics of temperature extremes. Geophys. Res. Lett. 2023, 50, e2023GL104090. [Google Scholar] [CrossRef]
  23. Bruhn, J.A.; Fry, W.E.; Fick, G.W. Simulation of daily weather data using theoretical probability distributions. J. Appl. Meteorol. 1980, 19, 1029–1036. [Google Scholar] [CrossRef]
  24. Harmel, R.D.; Richardson, C.W.; Hanson, C.L.; Johnson, G.L. Evaluating the adequacy of simulating maximum and minimum daily air temperature with the normal distribution. J. Appl. Meteorol. 2002, 41, 744–753. [Google Scholar] [CrossRef]
  25. Corobov, R.; Overcenco, A. To normality of air temperature distribution with an emphasis on extremes. In Academician Eugene Fiodorov–100 Years: Collection of Scientific Articles; Eco-TIRAS: Bendery, Moldova, 2010; pp. 36–42. [Google Scholar]
  26. Krakauer, N.Y.; Devineni, N. Up-to-date probabilistic temperature climatologies. Environ. Res. Lett. 2015, 10, 024014. [Google Scholar] [CrossRef]
  27. Singh, T.; Saha, U.; Prasad, V.; Gupta, M.D. Assessment of newly-developed high resolution reanalyses (IMDAA, NGFS and ERA5) against rainfall observations for Indian region. Atmos. Res. 2021, 259, 105679. [Google Scholar] [CrossRef]
  28. Mistry, M.N.; Schneider, R.; Masselot, P.; Royé, D.; Armstrong, B.; Kyselý, J.; Orru, H.; Sera, F.; Tong, S.; Lavigne, É.; et al. Comparison of weather station and climate reanalysis data for modelling temperature-related mortality. Sci. Rep. 2022, 12, 5178. [Google Scholar] [CrossRef]
  29. Hersbach, H.; de Rosnay, P.; Bell, B.; Schepers, D.; Simmons, A.; Soci, C.; Abdalla, S.; Alonso-Balmaseda, M.; Balsamo, G.; Bechtold, P.; et al. Operational Global Reanalysis: Progress, Future Directions and Synergies with NWP; Technical Report 27; ECMWF: Reading, UK, 2018. [Google Scholar] [CrossRef]
  30. ERA5 Reanalysis (0.25 Degree Latitude-Longitude Grid). 2024. Available online: https://rda.ucar.edu/datasets/d633000/ (accessed on 1 June 2024). [CrossRef]
  31. Kennedy-Asser, A.T.; Andrews, O.; Mitchell, D.M.; Warren, R.F. Evaluating heat extremes in the UK Climate Projections (UKCP18). Environ. Res. Lett. 2020, 16, 014039. [Google Scholar] [CrossRef]
  32. Rogers, C.D.W.; Ting, M.; Li, C.; Kornhuber, K.; Coffel, E.D.; Horton, R.M.; Raymond, C.; Singh, D. Recent increases in exposure to extreme humid-heat events disproportionately affect populated regions. Geophys. Res. Lett. 2021, 48, e2021GL094183. [Google Scholar] [CrossRef]
  33. Speizer, S.; Raymond, C.; Ivanovich, C.; Horton, R.M. Concentrated and intensifying humid heat extremes in the IPCC AR6 regions. Geophys. Res. Lett. 2022, 49, e2021GL097261. [Google Scholar] [CrossRef]
  34. Kong, Q.; Huber, M. Regimes of soil moisture-wet bulb temperature coupling with relevance to moist heat stress. J. Clim. 2023, 36, 7925–7942. [Google Scholar] [CrossRef]
  35. Krakauer, N.Y. Amplification of extreme hot temperatures over recent decades. Climate 2023, 11, 42. [Google Scholar] [CrossRef]
  36. Krakauer, N.Y. Extending the blended generalized extreme value distribution. Discov. Civ. Eng. 2024, 1, 97. [Google Scholar] [CrossRef]
  37. Doxsey-Whitfield, E.; MacManus, K.; Adamo, S.B.; Pistolesi, L.; Squires, J.; Borkovska, O.; Baptista, S.R. Taking advantage of the improved availability of census data: A first look at the Gridded Population of the World, Version 4. Pap. Appl. Geogr. 2015, 1, 226–234. [Google Scholar] [CrossRef]
  38. Center For International Earth Science Information Network-CIESIN-Columbia University. Gridded Population of the World, Version 4 (GPWv4): Population count, Revision 11, 2018. Available online: https://earthdata.nasa.gov/data/catalog/sedac-ciesin-sedac-gpwv4-popcount-r11-4.11 (accessed on 1 June 2024).
  39. Cattiaux, J.; Ribes, A.; Thompson, V. Searching for the most extreme temperature events in recent history. Bull. Am. Meteorol. Soc. 2024, 105, E239–E256. [Google Scholar] [CrossRef]
  40. Stone, D.A. A hierarchical collection of political/economic regions for analysis of climate extremes. Clim. Change 2019, 155, 639–656. [Google Scholar] [CrossRef]
  41. Durre, I.; Menne, M.J.; Gleason, B.E.; Houston, T.G.; Vose, R.S. Comprehensive automated quality assurance of daily surface observations. J. Appl. Meteorol. Climatol. 2010, 49, 1615–1633. [Google Scholar] [CrossRef]
  42. Menne, M.; Durre, I.; Vose, R.; Gleason, B.; Houston, T. An overview of the Global Historical Climatology Network-Daily database. J. Atmos. Ocean. Technol. 2012, 29, 897–910. [Google Scholar] [CrossRef]
  43. Jaffrés, J.B. GHCN-Daily: A treasure trove of climate data awaiting discovery. Comput. Geosci. 2019, 122, 35–44. [Google Scholar] [CrossRef]
  44. Kotz, S.; Nadarajah, S. Extreme Value Distributions: Theory and Applications; Imperial College Press: London, UK, 2000. [Google Scholar]
  45. Beirlant, J.; Goegebeur, Y.; Teugels, J.; Segers, J. Statistics of Extremes: Theory and Applications; Wiley: Hoboken, NJ, USA, 2004. [Google Scholar] [CrossRef]
  46. Rohde, R.; Muller, R.; Jacobsen, R.; Perlmutter, S.; Rosenfeld, A.; Wurtele, J.; Curry, J.; Wickham, C.; Mosher, S. Berkeley Earth temperature averaging process. Geoinf. Geostat. Overv. 2013, 1, 1000103. [Google Scholar] [CrossRef]
  47. Rohde, R.; Muller, R.A.; Jacobsen, R.; Muller, E.; Perlmutter, S.; Rosenfeld, A.; Wurtele, J.; Groom, D.; Wickham, C. A new estimate of the average Earth surface land temperature spanning 1753 to 2011. Geoinf. Geostat. Overv. 2013, 1, 1000101. [Google Scholar] [CrossRef]
  48. Martins, E.S.; Stedinger, J.R. Generalized maximum-likelihood generalized extreme-value quantile estimators for hydrologic data. Water Resour. Res. 2000, 36, 737. [Google Scholar] [CrossRef]
  49. Ailliot, P.; Thompson, C.; Thomson, P. Mixed methods for fitting the GEV distribution. Water Resour. Res. 2011, 47, W05551. [Google Scholar] [CrossRef]
  50. Smith, R.l. Maximum likelihood estimation in a class of nonregular cases. Biometrika 1985, 72, 67–90. [Google Scholar] [CrossRef]
  51. Castillo, E.; Hadi, A.S. Parameter and quantile estimation for the generalized extreme-value distribution. Environmetrics 1994, 5, 417–432. [Google Scholar] [CrossRef]
  52. Coles, S.G.; Dixon, M.J. Likelihood-based inference for extreme value models. Extremes 1999, 2, 5–23. [Google Scholar] [CrossRef]
  53. Lee, Y.; Shin, Y.; Park, J.S. A data-adaptive maximum penalized likelihood estimation for the generalized extreme value distribution. Commun. Stat. Appl. Methods 2017, 24, 493–505. [Google Scholar] [CrossRef]
  54. Gelman, A.; Hill, J. Data Analysis Using Regression and Multilevel/Hierarchical Models; Cambridge University Press: Cambridge, UK, 2006; ISBN 052168689X. [Google Scholar]
  55. Yoon, S.; Cho, W.; Heo, J.H.; Kim, C.E. A full Bayesian approach to generalized maximum likelihood estimation of generalized extreme value distribution. Stoch. Environ. Res. Risk Assess. 2010, 24, 761–770. [Google Scholar] [CrossRef]
  56. Tokdar, S.T.; Kass, R.E. Importance sampling: A review. WIREs Comput. Stat. 2009, 2, 54–60. [Google Scholar] [CrossRef]
  57. Koch, K.R. Introduction to Bayesian Statistics, 2nd ed.; updated and enlarged edition ed.; Springer: Berlin/Heidelberg, Germany, 2007; p. 250. [Google Scholar]
  58. Krakauer, N.Y.; Grossberg, M.D.; Gladkova, I.; Aizenman, H. Information content of seasonal forecasts in a changing climate. Adv. Meteorol. 2013, 2013, 480210. [Google Scholar] [CrossRef]
  59. Aizenman, H.; Grossberg, M.D.; Krakauer, N.Y.; Gladkova, I. Ensemble forecasts: Probabilistic seasonal forecasts based on a model ensemble. Climate 2016, 4, 19. [Google Scholar] [CrossRef]
  60. Benedetti, R. Scoring rules for forecast verification. Mon. Weather Rev. 2010, 138, 203–211. [Google Scholar] [CrossRef]
  61. Tödter, J. New Aspects of Information Theory in Probabilistic Forecast Verification. Master’s Thesis, Goethe University, Frankfurt am Main, Germany, 2011. [Google Scholar]
  62. Prates, F.; Buizza, R. PRET, the Probability of RETurn: A new probabilistic product based on generalized extreme-value theory. Q. J. R. Meteorol. Soc. 2011, 137, 521–537. [Google Scholar] [CrossRef]
  63. Dong, Q. Calibration and quantitative forecast of extreme daily precipitation using the extreme forecast index (EFI). J. Geosci. Environ. Prot. 2018, 6, 143–164. [Google Scholar] [CrossRef]
  64. Efron, B.; Gong, G. A leisurely look at the bootstrap, the jackknife, and cross-validation. Am. Stat. 1983, 37, 36–48. [Google Scholar] [CrossRef]
  65. Embrechts, P.; Resnick, S.I.; Samorodnitsky, G. Extreme value theory as a risk management tool. N. Am. Actuar. J. 1999, 3, 30–41. [Google Scholar] [CrossRef]
  66. Chen, W.; Zhao, X.; Zhou, M.; Chen, H.; Ji, Q.; Cheng, W. Statistical inference and application of asymmetrical generalized Pareto distribution based on peaks-over-threshold modela. Symmetry 2024, 16, 365. [Google Scholar] [CrossRef]
  67. Cherkassky, V.; Mulier, F. Learning from Data: Concepts, Theory, and Methods; Wiley: Hoboken, NJ, USA, 2007. [Google Scholar]
  68. van den Dool, H.; Becker, E.; Chen, L.C.; Zhang, Q. The probability anomaly correlation and calibration of probabilistic forecasts. Weather Forecast 2017, 32, 199–206. [Google Scholar] [CrossRef]
  69. Singh, A.; Sahoo, R.K.; Nair, A.; Mohanty, U.C.; Rai, R.K. Assessing the performance of bias correction approaches for correcting monthly precipitation over India through coupled models. Meteorol. Appl. 2017, 24, 326–337. [Google Scholar] [CrossRef]
  70. Donat, M.G.; Alexander, L.V. The shifting probability distribution of global daytime and night-time temperatures. Geophys. Res. Lett. 2012, 39, L14707. [Google Scholar] [CrossRef]
  71. Ruff, T.W.; Neelin, J.D. Long tails in regional surface temperature probability distributions with implications for extremes under global warming. Geophys. Res. Lett. 2012, 39, L04704. [Google Scholar] [CrossRef]
  72. Nadarajah, S. A generalized normal distribution. J. Appl. Stat. 2005, 32, 685–694. [Google Scholar] [CrossRef]
  73. Azzalini, A. The skew-normal distribution and related multivariate families. Scand. J. Stat. 2005, 32, 159–188. [Google Scholar] [CrossRef]
  74. McKinnon, K.A.; Rhines, A.; Tingley, M.P.; Huybers, P. The changing shape of Northern Hemisphere summer temperature distributions. J. Geophys. Res. Atmos. 2016, 121, 8849–8868. [Google Scholar] [CrossRef]
  75. Tamarin-Brodsky, T.; Hodges, K.; Hoskins, B.J.; Shepherd, T.G. Changes in Northern Hemisphere temperature variability shaped by regional warming patterns. Nat. Geosci. 2020, 13, 414–421. [Google Scholar] [CrossRef]
  76. Mishra, V.; Ganguly, A.R.; Nijssen, B.; Lettenmaier, D.P. Changes in observed climate extremes in global urban areas. Environ. Res. Lett. 2015, 10, 024005. [Google Scholar] [CrossRef]
  77. Belkhiri, L.; Kim, T.J. Individual influence of climate variability indices on annual maximum precipitation across the global scale. Water Resour. Manag. 2021, 35, 2987–3003. [Google Scholar] [CrossRef]
  78. Wu, X.; Wang, L.; Yao, R.; Luo, M.; Li, X. Identifying the dominant driving factors of heat waves in the North China Plain. Atmos. Res. 2021, 252, 105458. [Google Scholar] [CrossRef]
  79. Zhong, P.; Huser, R.; Opitz, T. Modeling nonstationary temperature maxima based on extremal dependence changing with event magnitude. Ann. Appl. Stat. 2022, 16, 272–299. [Google Scholar] [CrossRef]
  80. Magarey, R.D.; Borchert, D.M.; Schlegel, J.W. Global plant hardiness zones for phytosanitary risk analysis. Sci. Agric. 2008, 65, 54–59. [Google Scholar] [CrossRef]
  81. Krakauer, N.Y. Estimating climate trends: Application to United States plant hardiness zones. Adv. Meteorol. 2012, 2012, 404876. [Google Scholar] [CrossRef]
  82. Krakauer, N.Y. Shifting hardiness zones: Trends in annual minimum temperature. Climate 2018, 6, 15. [Google Scholar] [CrossRef]
  83. Suh, J.N.; Kang, Y.I.; Choi, Y.J.; Seo, K.H.; Kim, Y.H. Plant hardiness zone map in Korea and an analysis of the distribution of evergreen trees in Zone 7b. J. People Plants Environ. 2021, 24, 519–527. [Google Scholar] [CrossRef]
  84. Matthews, T. Humid heat and climate change. Prog. Phys. Geogr. Earth Environ. 2018, 42, 391–405. [Google Scholar] [CrossRef]
  85. Wang, P.; Yang, Y.; Jianping, T.; Leung, L.R.; Liao, H. Intensified humid heat events under global warming. Geophys. Res. Lett. 2020, 48, e2020GL091462. [Google Scholar] [CrossRef]
  86. Willett, K.M. HadlSDH.extremes part II: Exploring humid heat extremes using wet bulb temperature indices. Adv. Atmos. Sci. 2023, 40, 1968–1985. [Google Scholar] [CrossRef]
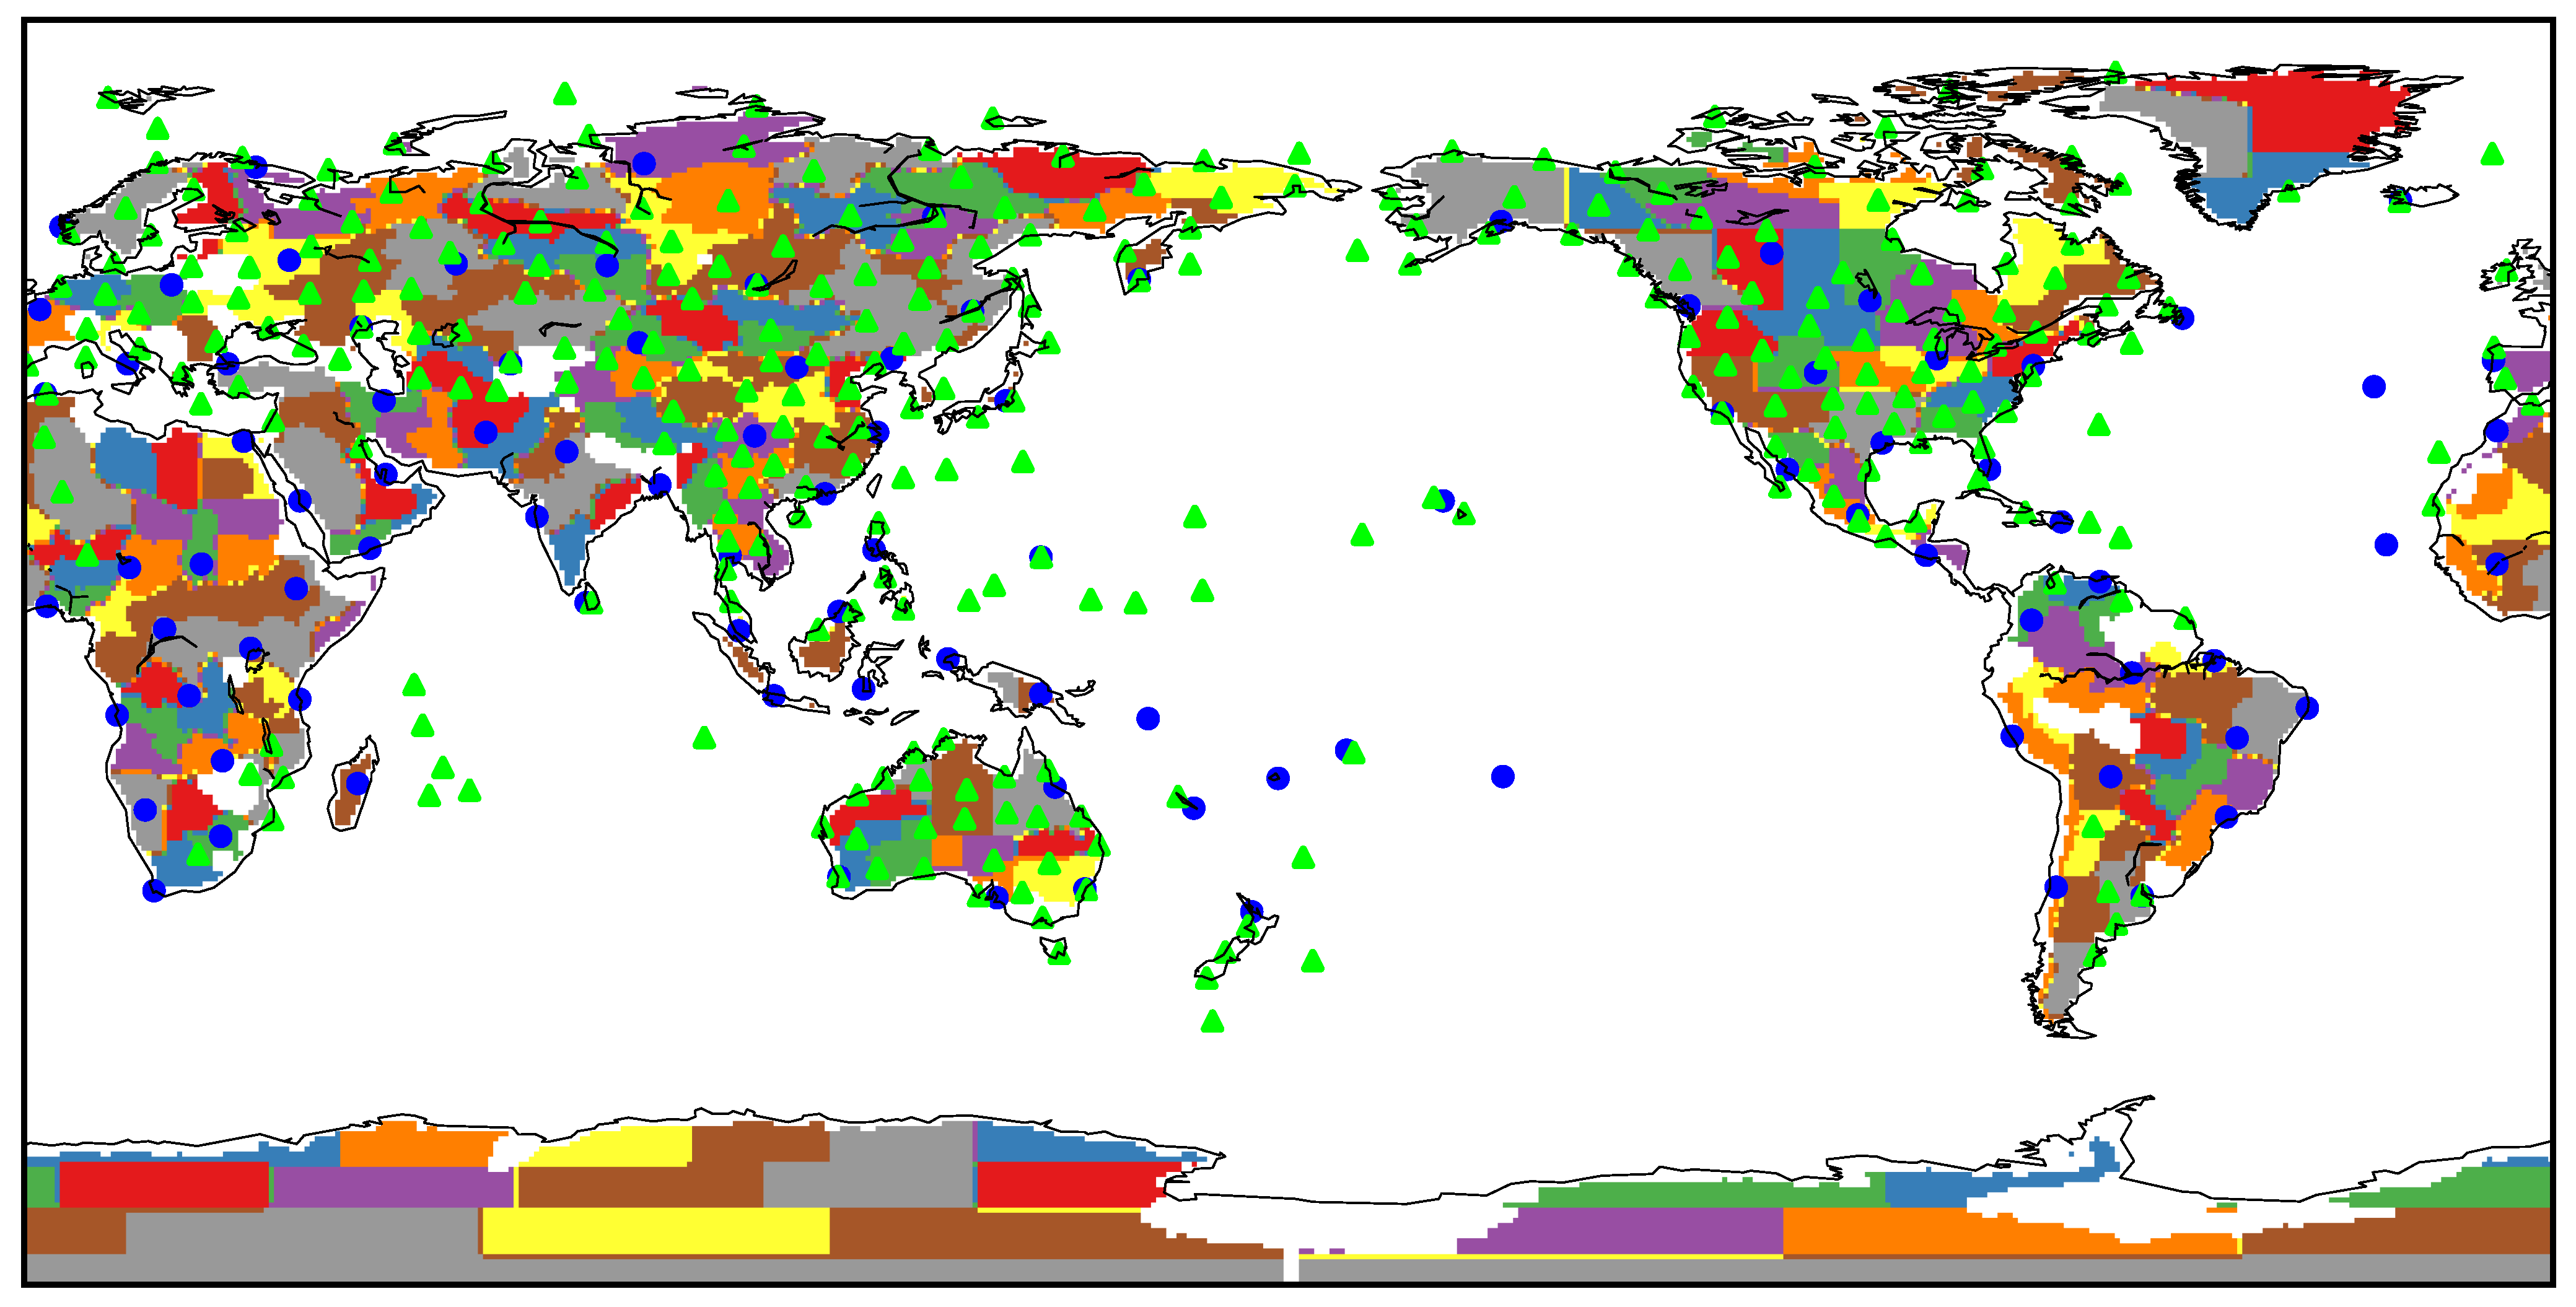
Figure 1. Locations of ERA5 grid cells (blue circles), GHCN stations (green triangles), and land regions (colored areas) whose temperature time series were analyzed.
Climate 12 00204 g001
Figure 2. Frequency distribution of observed annual maximum temperatures as percentiles of the one-year-ahead forecast probability distribution for station data using either the (a) normal distribution or (b) GEVD for the forecasts. For a well-calibrated forecast, this histogram should be flat.
Climate 12 00204 g002
Figure 3. Frequency distribution of the observed annual maximum temperatures as percentiles of the one-year-ahead forecast probability distribution for ERA5 region-average data using either the (a) normal distribution or (b) GEVD for the forecasts. For a well-calibrated forecast, this histogram should be flat.
Climate 12 00204 g003
Figure 4. Frequency distribution of observed annual maximum temperatures as percentiles of the one-year-ahead forecast probability distribution for ERA5 grid-cell data using either the (a) normal distribution or (b) GEVD for the forecasts. For a well-calibrated forecast, this histogram should be flat.
Climate 12 00204 g004aClimate 12 00204 g004b
Table 1. Extreme temperature year-ahead forecast skill metrics. See the text for details on the methods and datasets compared. GEVD = generalized extreme value distribution; Stat = stationary model (no change in the distribution parameters with time); NLL = mean negative log-likelihood (nats); D n = Kolmogorov–Smirnov statistic; RP = return period (mean of values raised to the indicated power); q = quantile of the observed value in the forecast distribution (the number and percentage of forecasts where q is above the indicated threshold).
NLL D n RP 0.1 10 9 RP 0.5 2 RP 0.9 10 q > 0.99 (%) q > 0.999 (%)
Station data
GEVD2.0410.00760.0074.738680.10183 (1.57)47 (0.40)
Normal2.0220.01970.0030.2830.01191 (1.64)29 (0.25)
GEVD-Stat2.0570.07040.0251.59683.20243 (2.08)70 (0.60)
Normal-Stat2.0440.05720.0250.93233.55264 (2.26)54 (0.46)
ERA5 grid
GEVD1.6150.0204−0.0022.2473978.3262 (1.15)11 (0.20)
Normal1.5950.0340−0.0030.033−0.4566 (1.22)9 (0.17)
GEVD-Stat1.7570.18080.05463.621,122,590.46140 (2.60)30 (0.56)
Normal-Stat1.7390.15890.0551.0934.87181 (3.35)29 (0.54)
ERA5 region
GEVD1.4650.0293−0.00060.3889.02160 (1.25)42 (0.33)
Normal1.4300.0263−0.0020.0140.12132 (1.03)16 (0.12)
GEVD-Stat1.7020.24440.073110.548,683,674.37392 (3.06)126 (0.98)
Normal-Stat1.6750.24200.0731.1320.23396 (3.09)61 (0.48)
Disclaimer/Publisher’s Note: The statements, opinions and data contained in all publications are solely those of the individual author(s) and contributor(s) and not of MDPI and/or the editor(s). MDPI and/or the editor(s) disclaim responsibility for any injury to people or property resulting from any ideas, methods, instructions or products referred to in the content.