


Abstract
Selecting maize hybrids for a given planting density requires knowing whether their yield responses to nutrition programmes persist across seasons. A two-season factorial randomized complete block experiment in Karacabey, Türkiye, compared ten commercial hybrids at three target densities under mineral fertilization (NPK) or a plant growth-promoting bacterial consortium (PGPB) without mineral fertilizer. Grain yield was standardized to 15% moisture. Across seasons, NPK and PGPB averaged 1578.73 and 1554.70 kg da−1, respectively. The PGPB-NPK difference was −24.02 kg da−1 (heteroscedasticity-robust 95% confidence interval: −40.95 to −7.10). The PGPB-NPK difference for P2105 at 9500 plants da−1 was positive in both seasons but was not significant after adjustment for multiple comparisons. The results identify hybrid-density combinations for further testing and do not establish yield equivalence or support replacing mineral fertilizer. P2105 at 9500 plants da−1 is a candidate for independent validation under comparable conditions. These findings show that recommendations for the bacterial nutrition programme should account for maize hybrid, target planting density and growing season.
1. Introduction
Maize (Zea mays L.) supplies grain for human food, animal feed and industrial processing. Its commercial value makes grain yield, grain quality and adaptation to production conditions central targets of breeding and crop management. Improvements in productivity depend on selecting suitable hybrids and matching plant population and nutrient supply to the growing environment. Long-term field evidence shows that changes in optimal plant density and yield per plant have both contributed to maize yield gains, while commercial hybrids differ in their responses to density and nitrogen supply [1,2].
Maintaining this productivity while limiting fertilizer inputs is a practical challenge. Fertilizer affordability and access can constrain management, and nutrient losses can affect water quality and the efficiency of agricultural resource use. Microbial approaches are therefore of interest where they improve nutrient acquisition or help maintain crop performance with reduced mineral inputs [3,4]. Bacterial inoculation, however, supplies living organisms rather than an assured quantity of crop-available nutrients. Its performance must be evaluated against a defined mineral fertilizer reference under field conditions [5,6]. Plant growth-promoting bacteria (PGPB) can affect root growth, nutrient mobilization and interactions in the rhizosphere. Nitrogen fixation, phosphorus mobilization and changes in phytohormone signalling are among the mechanisms reported for particular organisms, but these functions vary among strains and environments. The presence of a bacterial genus in an inoculant does not itself demonstrate that a given mechanism operated in the field. Formulation, microbial viability, delivery and compatibility with the host plant also influence the response [3,6,7]. Biological nitrogen fixation offers opportunities in cereal systems, although its contribution requires direct evidence rather than inference from yield alone [8]. Phosphorus and potassium mobilization provide further reasons to evaluate microbial nutrition in maize. In a study of indigenous potassium-solubilizing bacteria, Saheewala et al. [9] combined strain characterization, quantitative potassium-release assays and maize testing. Such functional measurements connect an organism to a nutrient-mobilization process. In the present study, the corresponding contribution is agronomic evaluation of a consortium across commercial hybrids and plant densities; its nitrogen-, phosphorus- and potassium-related functions remain hypotheses for direct testing.
Field studies illustrate both the opportunities and the variability of inoculation [4,10,11]. Efthimiadou et al. [10] reported improvements in maize performance following soil or foliar bacterial applications under Mediterranean conditions. Molina-Romero et al. [4] found that a bacterial consortium combined with reduced urea could maintain yield relative to their full urea treatment. Conversely, Kifle and Laing [11] reported cases in which selected diazotrophs did not increase grain yield. Responses also differed among bacterial strains in sweet corn [12]. These findings support testing particular host–inoculant combinations rather than assuming a uniform response across commercial hybrids. Plant population adds another source of variation. Increasing population can raise yield per unit area while increasing competition among plants, and the balance depends on hybrid characteristics and resource supply. A bacterial response observed at one density may therefore be absent or reversed at another. Mastrodomenico et al. [2] documented substantial variation among hybrids in their responses to density, nitrogen fertility and environment. Evaluation of bacterial and mineral nutrition across several populations and more than one season can reveal whether promising hybrid responses persist or depend on a particular field setting.
This two-season experiment compared a mineral fertilization programme with a bacterial consortium programme across ten commercial maize hybrids and three target planting densities. It extends the single-season dose study of Kurt [13] by examining whether programme differences vary across hybrid–density combinations and recur across seasons. We hypothesized that the difference in grain yield and yield components between programmes would depend on hybrid and target density, and that these interactions could vary by season.
2. Results
2.1. Weather and Soil Context
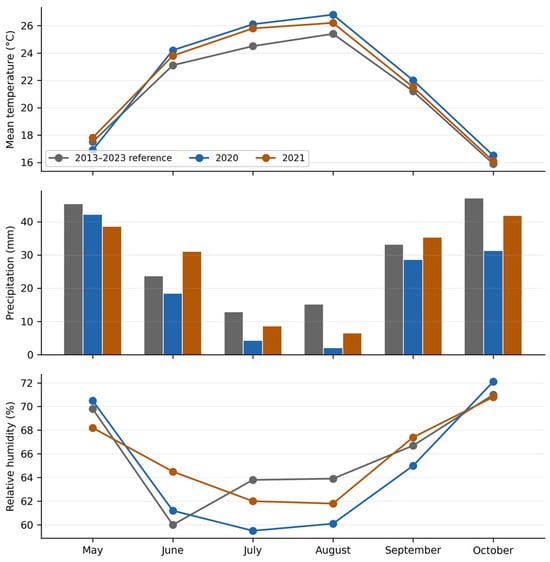
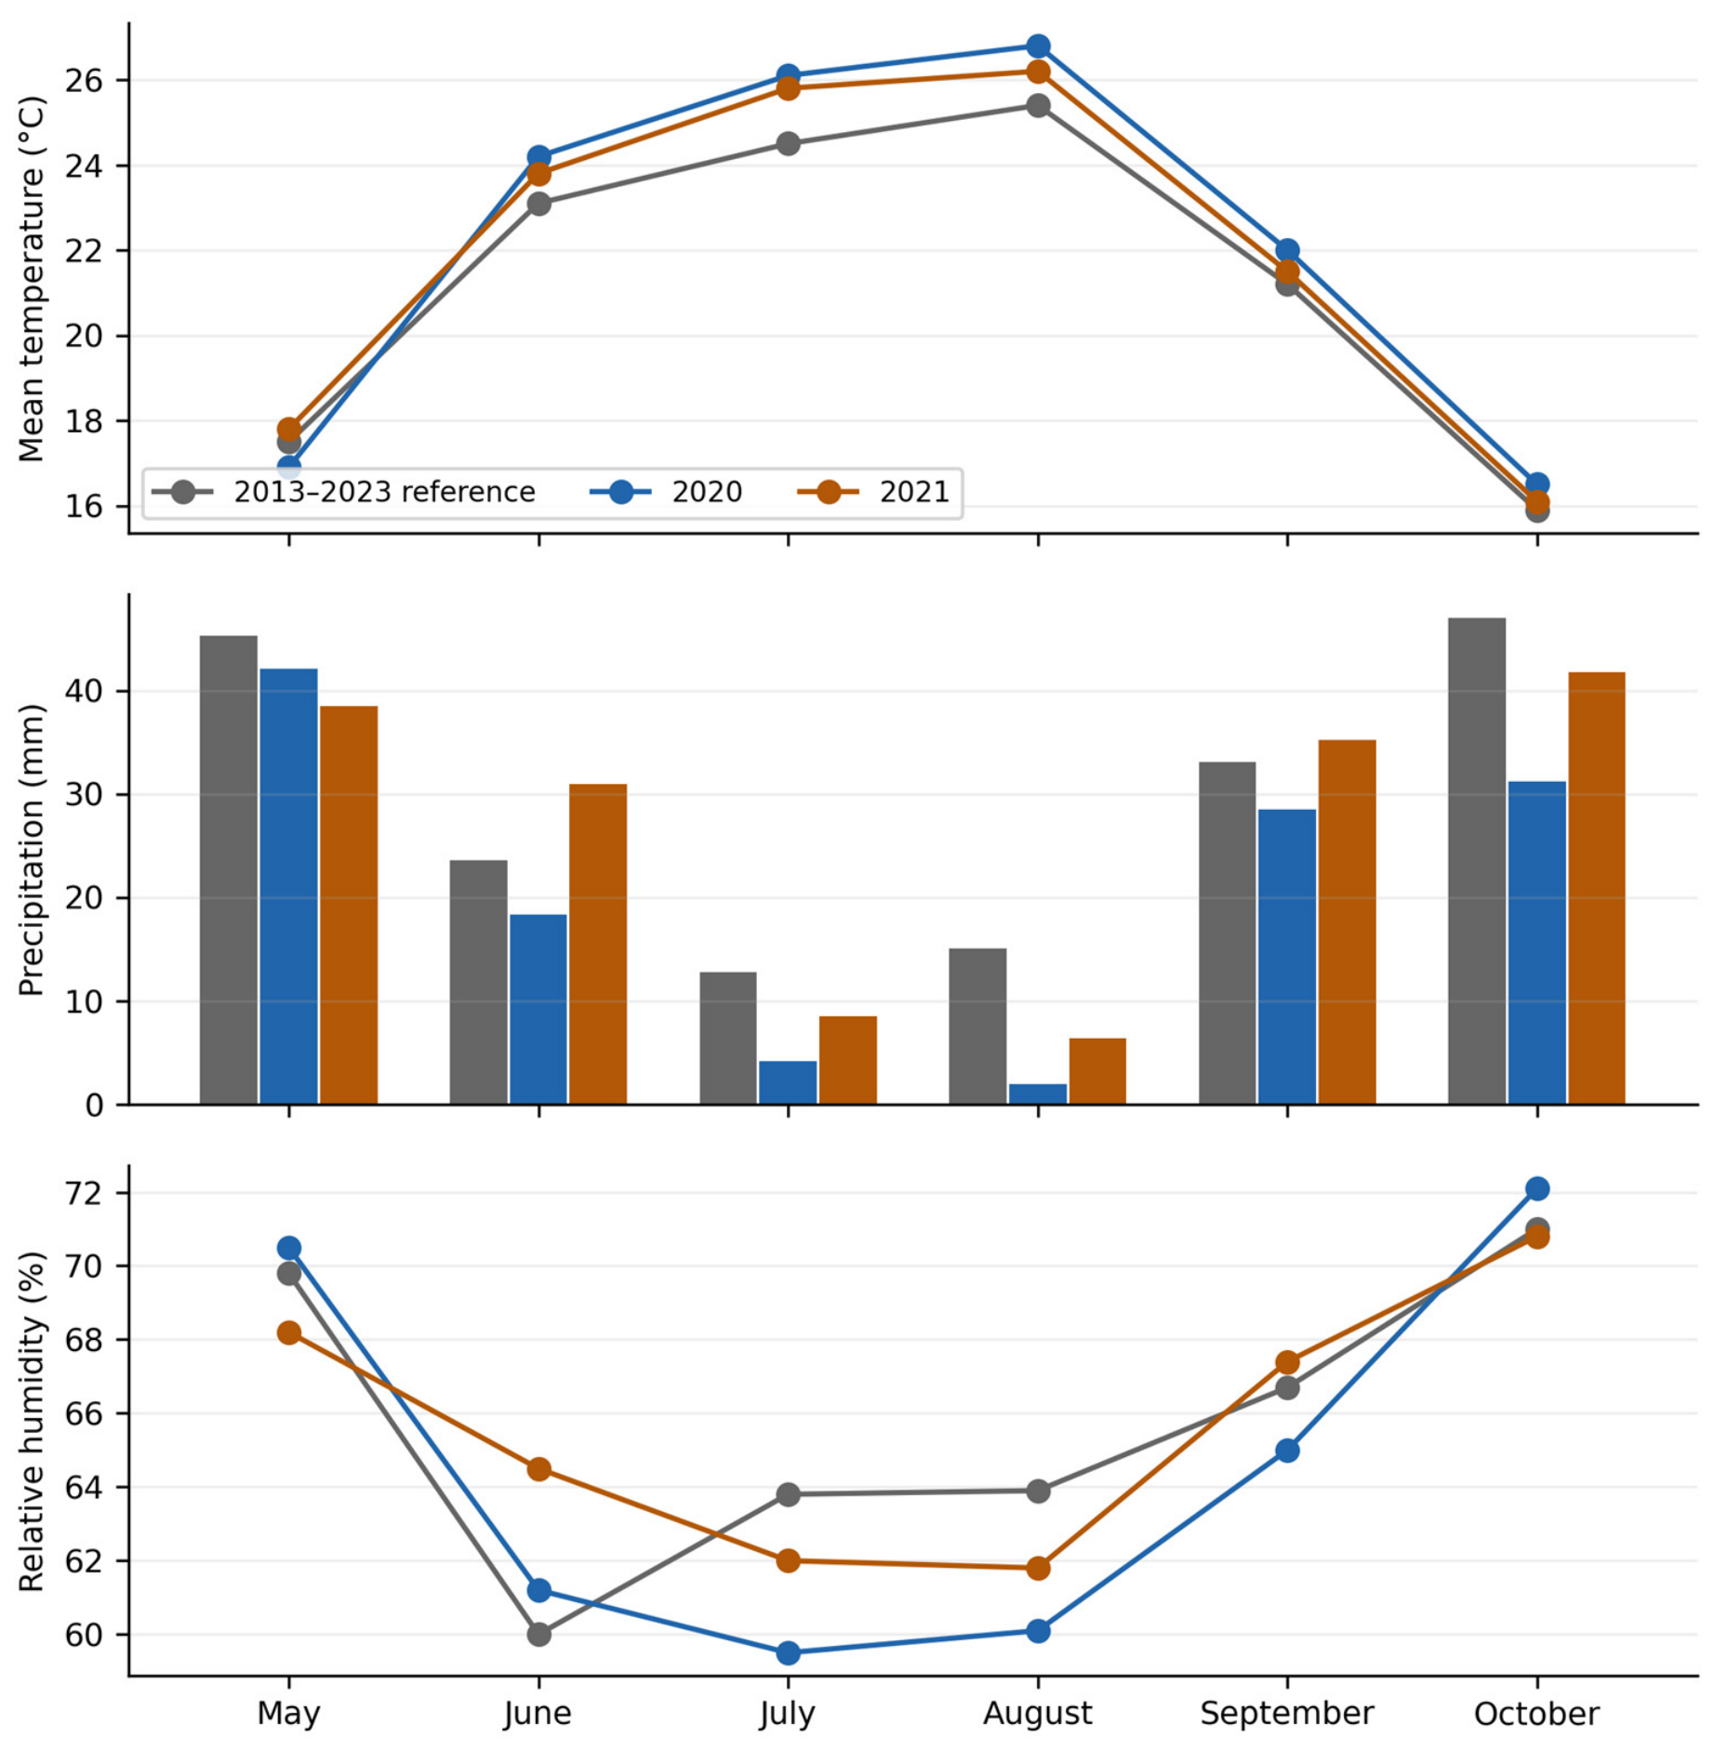
The May-October rainfall total was 126.4 mm in 2020 and 161.4 mm in 2021, compared with 176.9 mm in the 2013–2023 reference series (Figure 1). July-August rainfall was especially limited in 2020, totalling 6.2 mm, compared with 14.9 mm in 2021 and 27.9 mm in the reference series. Mean monthly temperatures in July and August exceeded reference values in both seasons. Mean relative humidity in July and August was 59.5% and 60.1% in 2020 and 62.0% and 61.8% in 2021, respectively, compared with reference values of 63.8% and 63.9% for 2013–2023 (Figure 1).
Figure 1.
Monthly temperature, rainfall and relative humidity in 2020 and 2021 and the 2013–2023 reference series. Source: Turkish State Meteorological Service.
In composite soil samples representing the trial site, organic matter content before sowing was 1.4% in 2020 and 1.8% in 2021, with pH values of 7.6 and 7.4, respectively. Organic matter content at tasseling (VT) was 1.6% and 2.1%, compared with 1.5% and 1.9% after harvest (Table S2). In both seasons, soil pH was lower at VT than before sowing and increased after harvest without returning to pre-sowing values. Plant-available phosphorus and potassium were higher at VT than before sowing, whereas extractable calcium was lower.
2.2. Hybrid Variation and Interactions
The combined analysis evaluated programme, target density, hybrid and their interactions (Table 1). Local contrasts were examined to determine whether the pooled programme difference described individual hybrid–density combinations. The season × programme × density × hybrid interaction was significant in the conventional model (F(18, 236) = 2.58, p = 0.0006; Table S5), indicating that the programme contrast across hybrid–density combinations varied by season.
Table 1.
Combined ANOVA F values for nutrition, density, hybrid and their interactions.
2.3. Grain Yield Under NPK and Bacterial Nutrition
Mean harvest moisture under NPK and PGPB was 23.21% and 23.28% in 2020 and 22.71% and 23.00% in 2021, respectively. All yield comparisons below use the plot-level correction to 15% moisture.
In 2020, mean standardized yields were 1577.35 kg da−1 under NPK and 1555.77 kg da−1 under PGPB. In 2021, the corresponding means were 1580.11 and 1553.64 kg da−1 (Table 2).
Table 2.
Nutrition marginal means and Tukey comparisons across hybrids and densities.
Figure 2.
Mean grain yield at 15% moisture by target planting density, nutrition programme and season. Points average ten hybrids and three blocks.
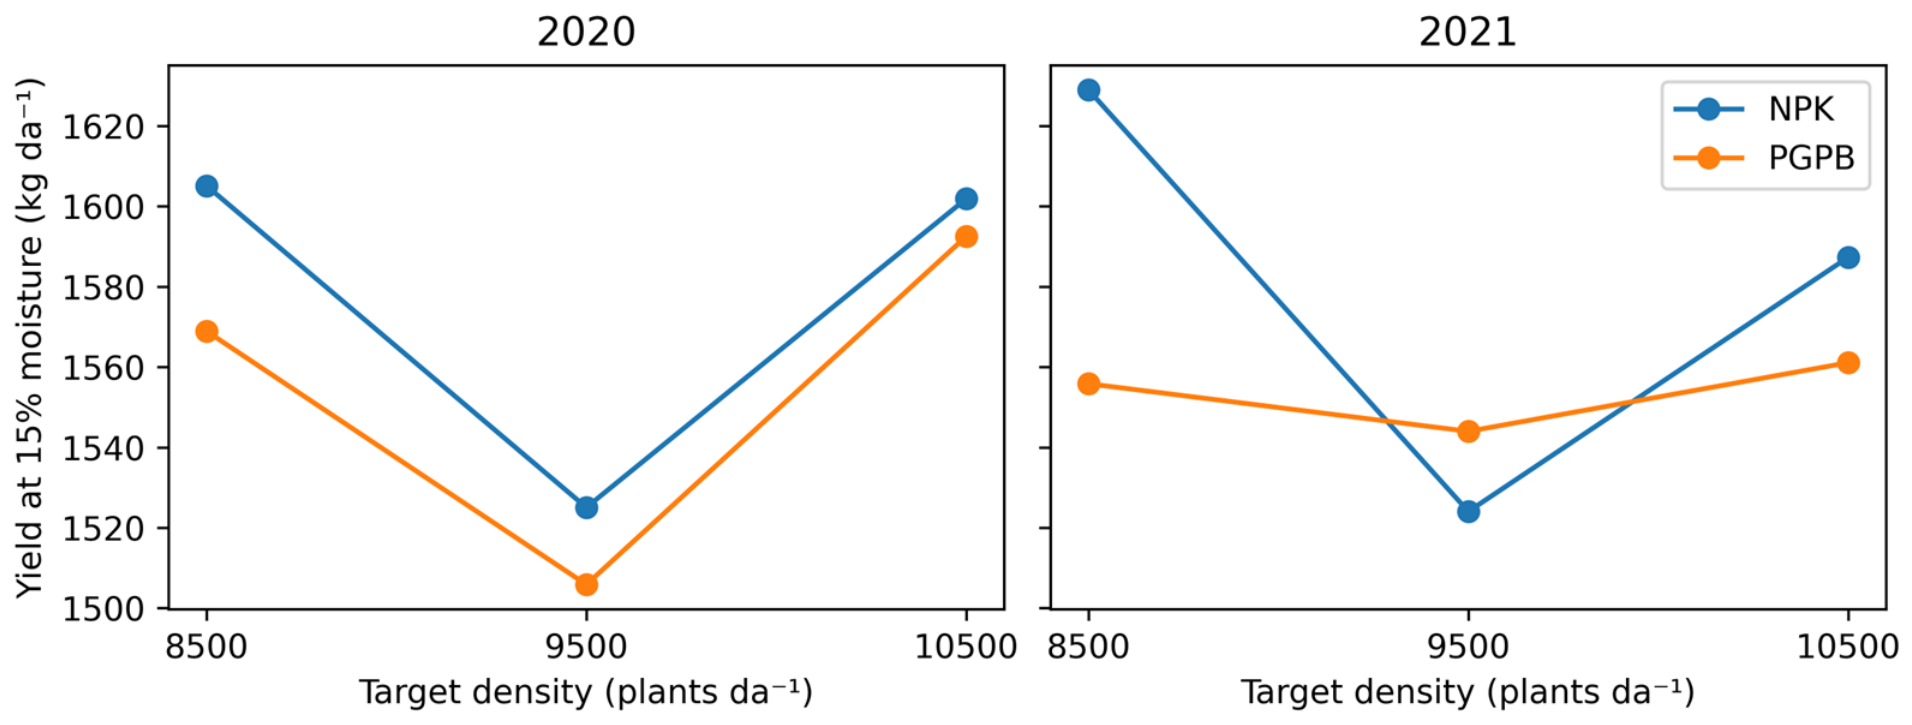
Across both seasons, PGPB averaged 1554.70 kg da−1, compared with 1578.73 kg da−1 under NPK. The difference was −24.02 kg da−1 (nominal 95% CI: −37.73 to −10.32; HC3 95% CI: −40.95 to −7.10). The HC3 test gave p = 0.0056. This marginal comparison is separate from the 30 local contrasts tested within each period and was outside their Holm adjustment.
Hybrid means averaged over densities are reported in Table 3. Table 4 presents local comparisons with their uncertainty.
Table 3.
Annual and combined grain yield by hybrid and nutrition setting.
Table 4.
Selected grain yield contrasts using HC3 standard errors.
For SY Bambus, the direction of the grain yield difference between nutrition programmes changed with target density in 2020. Relative to NPK, PGPB yielded 140.99 kg da−1 less at 9500 plants da−1 and 204.26 kg da−1 more at 10,500 plants da−1 (Holm-adjusted p = 0.0078 and 0.0113, respectively; Table 4).
For P2105 at 9500 plants da−1, PGPB-NPK differences (kg da−1) with nominal HC3 95% confidence intervals were 2020: +79.02 [−65.67 to 223.70], Holm p = 1.0000; 2021: +97.63 [20.61 to 174.65], Holm p = 0.3623; combined: +88.32 [6.79 to 169.86], Holm p = 0.6772. The combined estimate is exploratory and none of these contrasts was significant after Holm adjustment (Table 4). Supplementary Table S7 reports the complete set of conventional local contrasts, and Table S8 compares conventional and HC3 inference for the combined period.
2.4. Ear and Grain Components
Across seasons, the PGPB and NPK marginal means, respectively, were kernels per ear: 550.75 versus 541.06 (conventional p = 0.049979; HC3 p = 0.112); test weight: 66.24 versus 64.63 kg hL−1 (conventional p = 0.00076395; HC3 p = 0.0062162); thousand-kernel weight: 390.91 versus 390.03 g (conventional p = 0.7009; HC3 p = 0.75579). The kernel-number contrast met the conventional 0.05 threshold but not the HC3 threshold. The test-weight contrast was significant under both analyses; thousand-kernel weight was not significant under either analysis. These pooled comparisons do not imply a uniform response across hybrids and densities (Table 2).
The highest observed combined hybrid means were kernel rows per ear, DKC6980 (19.53); kernels per ear, DKC6980 (637.26); kernels per row, LG 30.685 (35.01); thousand-kernel weight, DKC6492 (412.23 g); grain yield, DKC6897 (1833.64 kg da−1). These rankings describe the observed marginal means; Tukey groups determine which pairwise differences were significant (Table 5; Table S3).
Table 5.
Selected combined hybrid means and Tukey grouping.
The combined hybrid means spanned the following ranges (Table S3): ear length, 17.84–19.37 cm (LG 31.695 to SY Bambus); ear diameter, 49.04–52.01 mm (LG 30.685 to DKC6980); kernel weight per ear, 187.62–237.65 g (KWS OLIMPION to DKC6980); grain moisture, 20.28–24.11% (DKC6492 to KWS OLIMPION). Moisture at sampling does not establish maturity or drying rate. These marginal ranges do not establish pairwise significance or characterize every hybrid-by-density combination.
2.5. Multivariate Trait Patterns
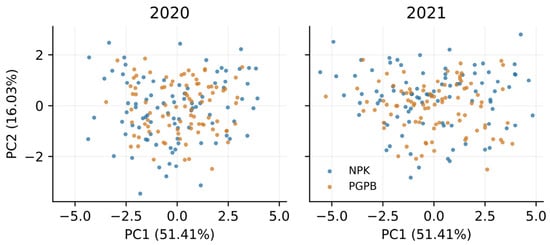
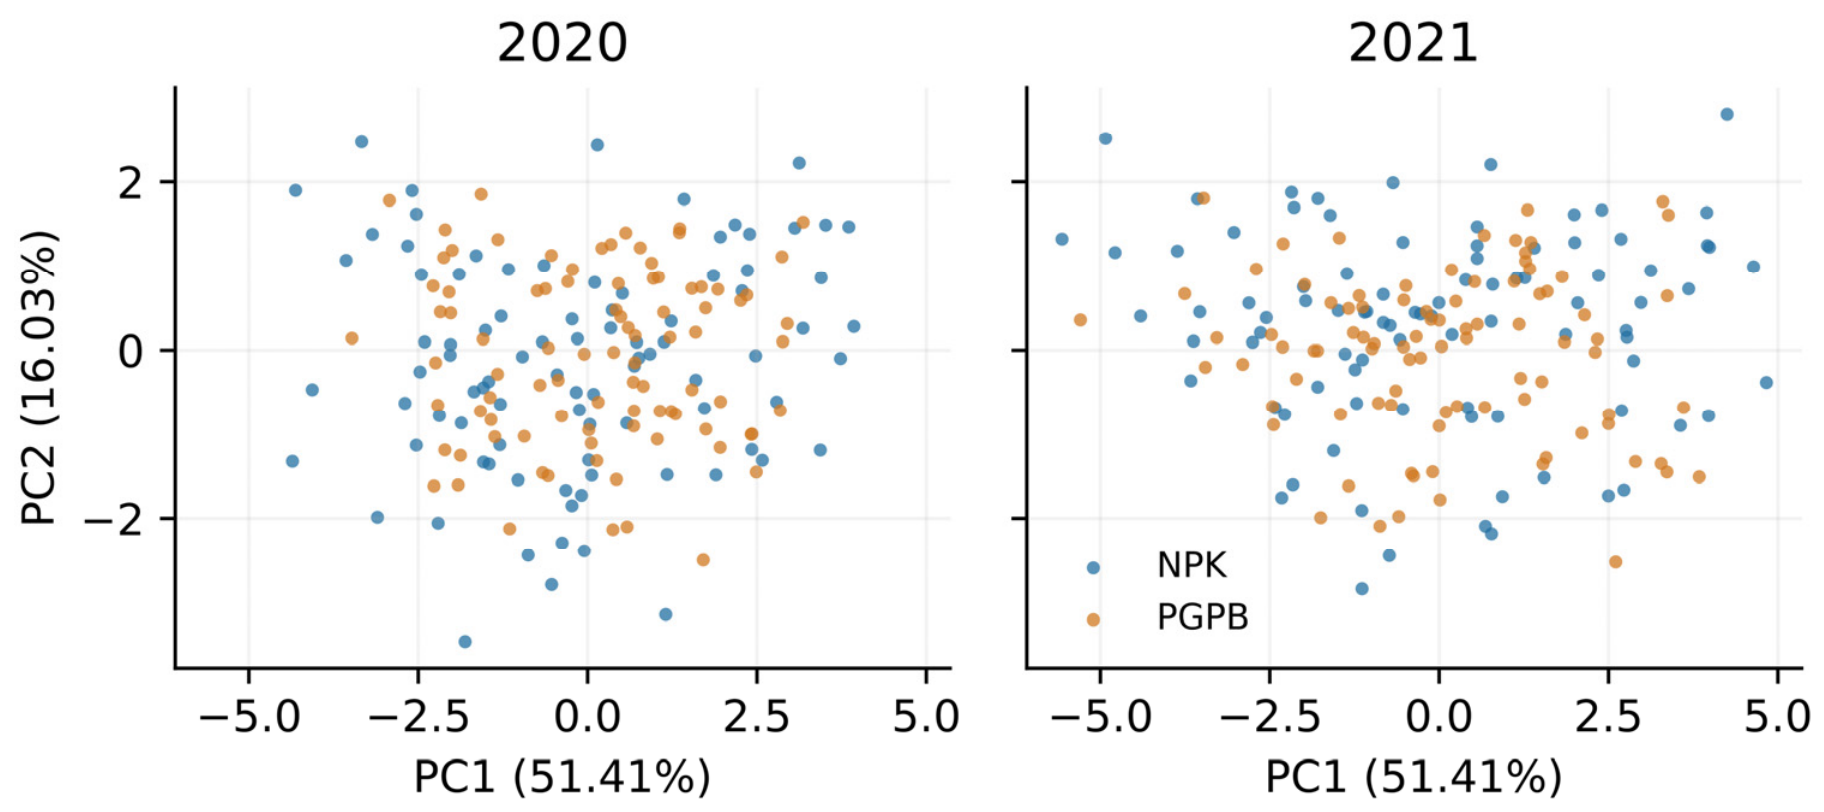
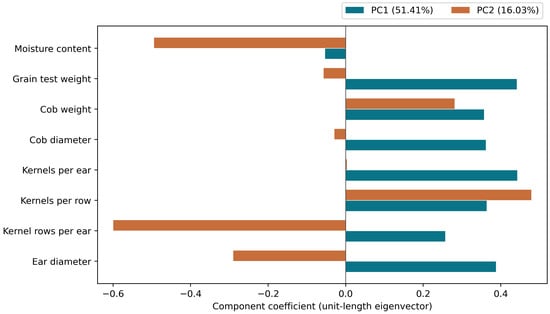
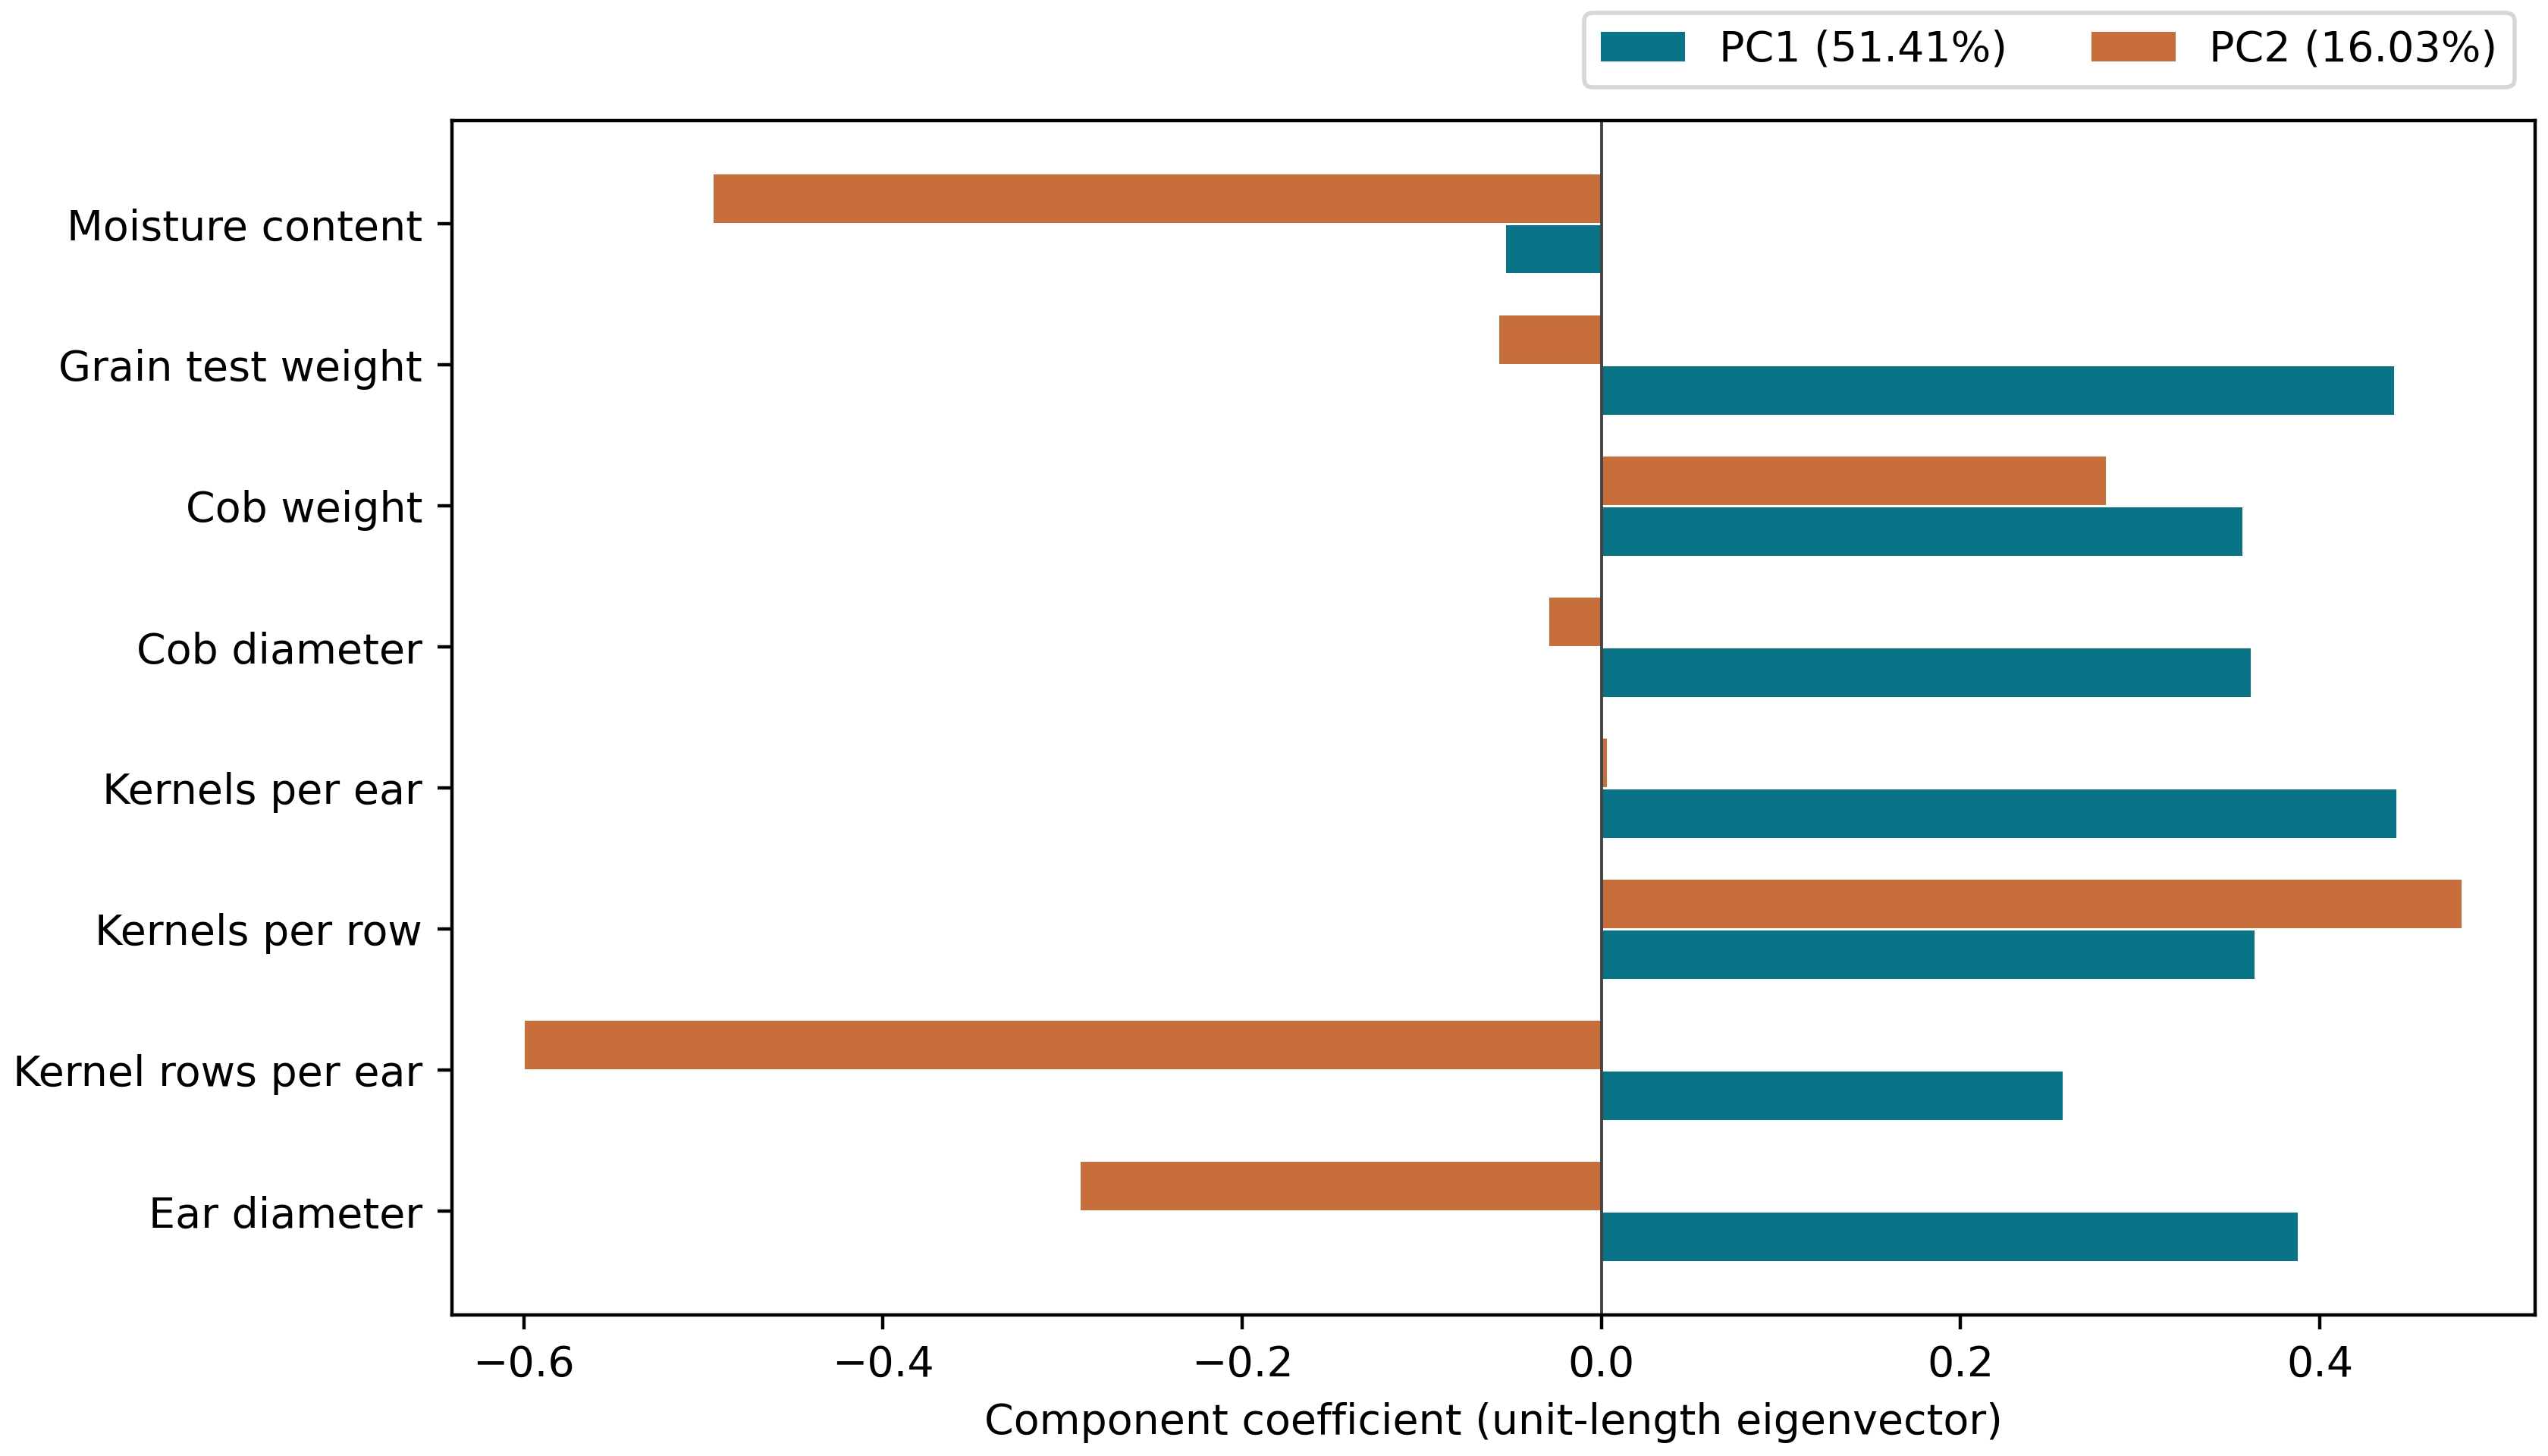
Principal component analysis (PCA) was used to summarize which of the selected ear and grain traits varied together and whether nutrition or seasonal groups occupied distinct regions of the resulting trait space. The first two principal components explained 67.44% of the standardized variation: PC1 accounted for 51.41% and PC2 for 16.03% (Figure 3). The largest positive PC1 coefficients were associated with KPE (0.442), TW (0.442) and ED (0.388). PC1 thus summarized covariation in kernel number, grain bulk density and ear dimensions within the selected trait matrix. PC2 was associated most strongly with KRE (−0.599), MC (−0.494) and KPR (0.479), distinguishing contrasting row and kernel arrangements alongside grain moisture. These are component coefficients, not correlations with yield.
Figure 3.
Two-dimensional principal component analysis (PCA) scores from a pooled analysis of 360 plot–year observations, displayed separately by season and coloured by nutrition programme. Each point is one plot. The eight input traits were ear diameter, kernel rows per ear, kernels per row, kernels per ear, cob diameter, cob weight, grain test weight and moisture content, standardized before analysis. PC1 and PC2 jointly explain 67.44% of their variation. Nearby points have similar scores on these two composite axes; the display does not directly compare grain yield, which was not included in the PCA.
NPK and PGPB observations overlapped substantially in the two-dimensional space. The bacterial setting therefore did not form a wholly separate trait cluster, consistent with the mixture of positive and negative component differences among hybrids. This overlap does not show that the nutrition programmes were statistically equivalent. Because grain yield was not an input, proximity in the ordination also cannot substitute for a yield comparison.
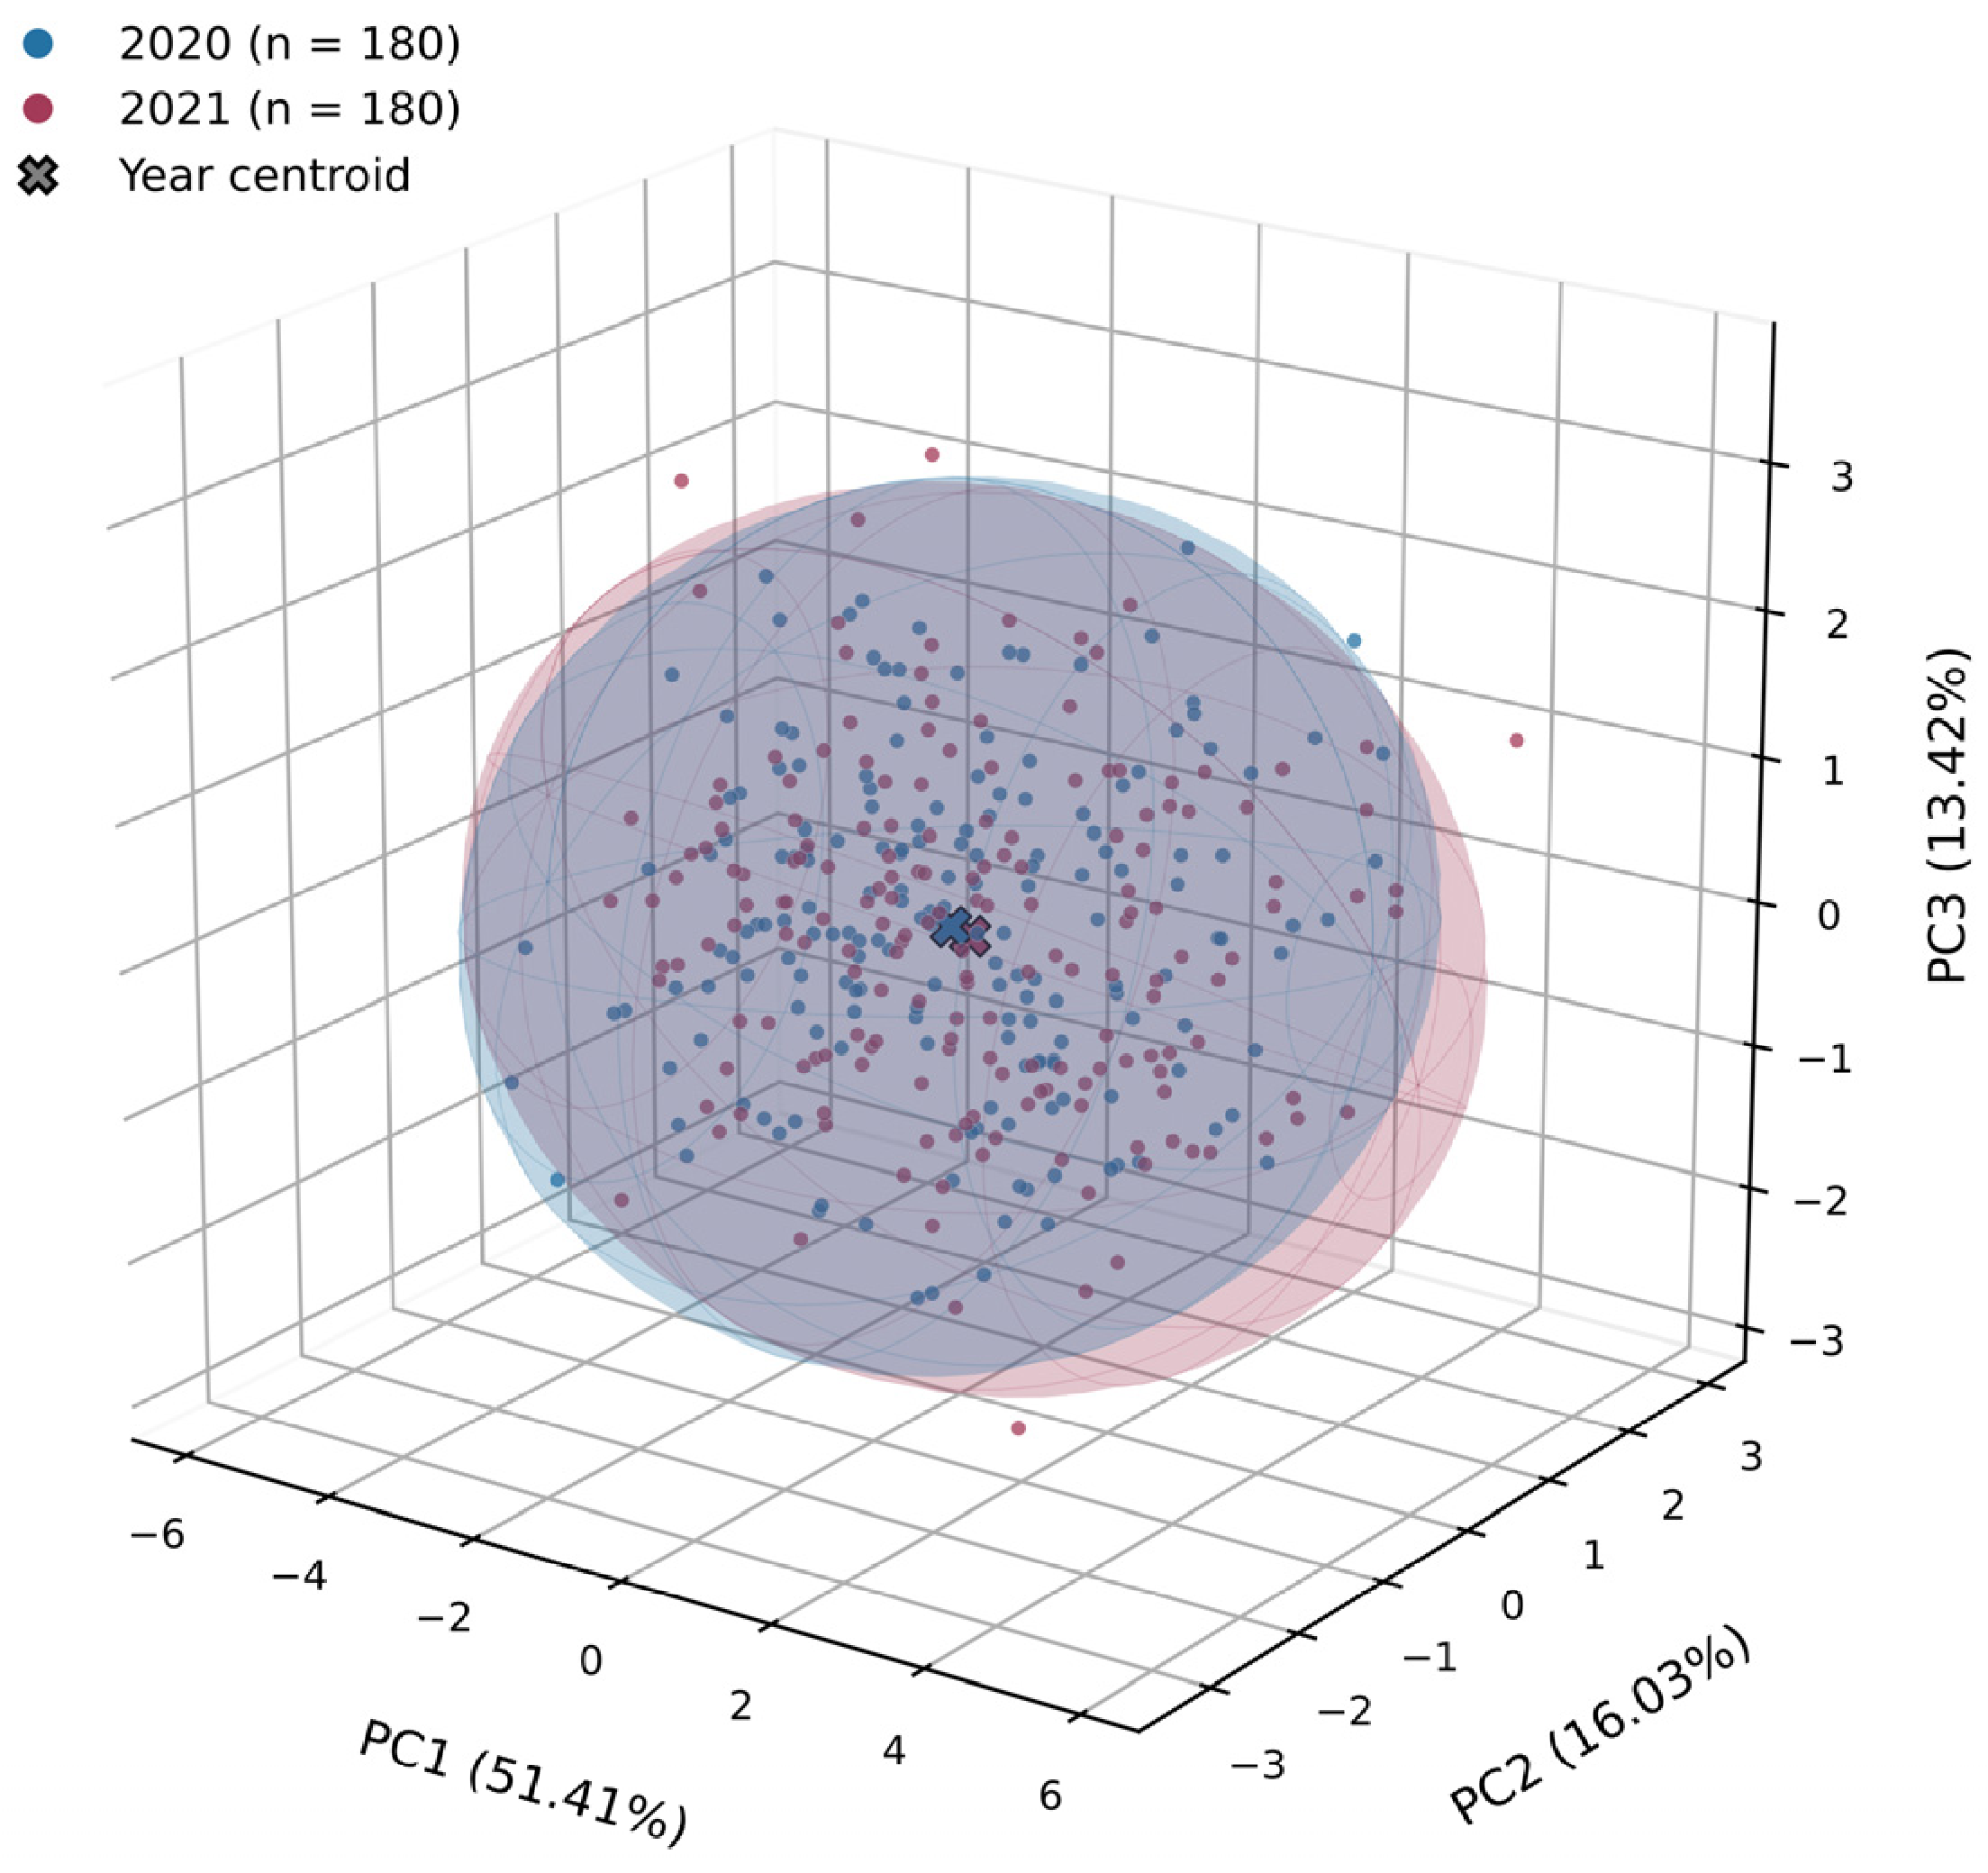
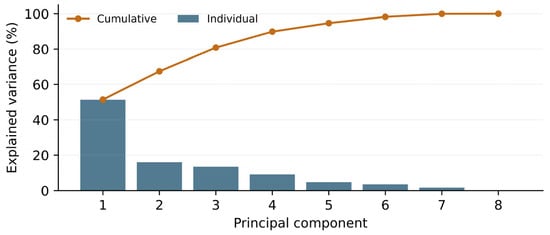
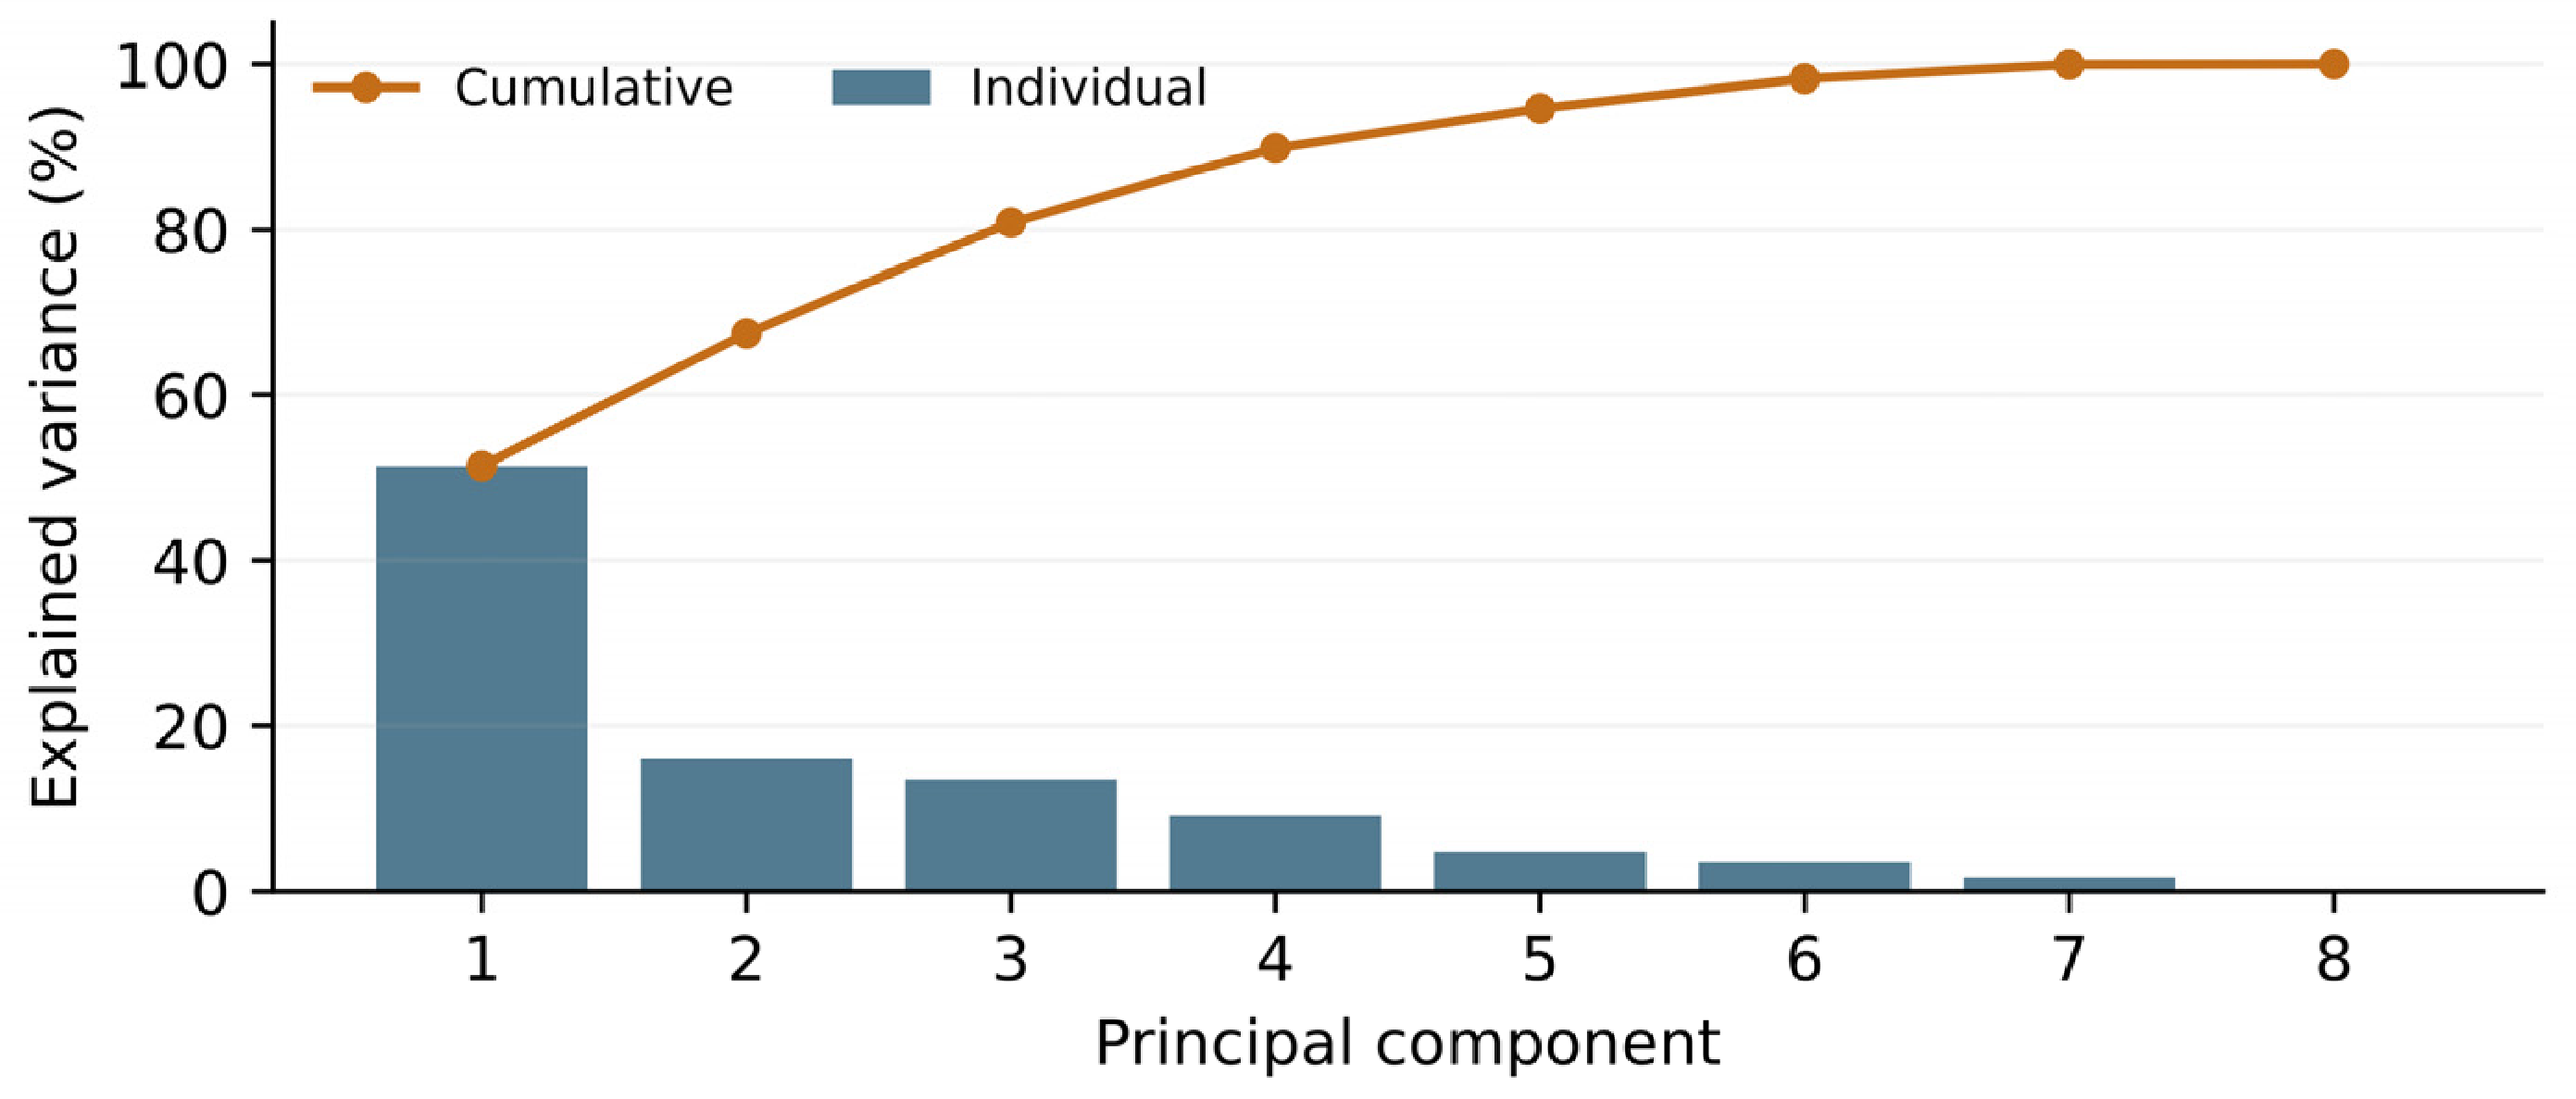
PC3 explained a further 13.42%, bringing the cumulative proportion to 80.87% (Figure 4 and Figure 5). Its largest coefficients were for MC (0.672), KRE (−0.445) and CW (0.415). The three-dimensional view retained an additional moisture- and cob-related contrast that was absent from the PC1-PC2 projection. Year-specific covariance ellipsoids overlapped extensively and their centroids were close, indicating broad overlap in the pooled eight-trait profiles of the two seasons. The ellipsoids summarize the spread of all hybrids, densities and nutrition programmes within each year; their overlap is not a test of year effects or treatment equivalence. The remaining 19.13% of variation lay outside the first three axes.
Figure 4.
Three-dimensional PCA scores with year-specific covariance ellipsoids, calculated from the same eight standardized traits and 360 plot–year observations as Figure 3. Blue and burgundy identify 2020 and 2021, respectively (180 observations per year); cross-shaped symbols mark year centroids. The translucent surfaces are covariance ellipsoids scaled by the 95th percentile of the chi-squared distribution with three degrees of freedom, providing approximate 95% concentration regions under a multivariate-normal reference. They summarize within-year score dispersion and are not confidence regions for the centroids. PC1, PC2 and PC3 jointly explain 80.87% of variation.
Figure 5.
Variance explained by each of the eight principal components from the standardized eight-trait dataset. Bars show the percentage explained by each individual component; the line shows the cumulative percentage. The first two components retain 67.44% and the first three retain 80.87% of variation. This figure describes information retained by the PCA projections, rather than crop yield or the size of a nutrition effect.
The magnitudes and signs of the coefficients describe the relative weighting and direction of each trait in PC1 and PC2 (Figure 6). Coefficients with the same sign indicate contributions in the same direction along a component; these descriptive patterns do not estimate treatment effects or explain yield differences.
Figure 6.
Coefficients of the first two principal components from eight standardized traits. The legend gives the percentage of variance explained by each component.
3. Discussion
3.1. Grain Yield Under the Two Nutrition Programmes
After standardization to 15% grain moisture, mean yield across the two seasons was 24.02 kg da−1 (1.52%) lower under PGPB than under NPK. The trial was not designed to assess yield against a prespecified threshold for agronomically acceptable loss, so the observed difference does not establish yield equivalence. Molina-Romero et al. [4] reported similar grain yields for a consortium combined with 50% of the recommended urea dose and the full urea treatment, whereas the consortium-only treatment had a lower mean yield than the full urea treatment. The lower pooled yield under the present PGPB programme is consistent with that numerical ordering for inoculation without mineral N. However, their field trial used a different consortium and maize material, and the mineral reference was urea rather than the NPK programme used here. Their reduced-urea combination therefore provides evidence for an integrated approach that was not tested in the present experiment. The current results concern the performance of a consortium programme without added mineral fertilizer and cannot establish the yield response to adding this consortium to a reduced NPK rate.
3.2. Hybrid and Density Responses Across Seasons
For P2105 at 9500 plants da−1, the PGPB-NPK estimates were positive in both seasons (+79.02 and +97.63 kg da−1 in 2020 and 2021, respectively), but neither contrast was significant after Holm adjustment (Table 4). The 2020 nominal HC3 confidence interval included zero, while the 2021 interval did not; the latter still failed to meet the multiplicity-adjusted threshold. The combined estimate of +88.32 kg da−1 therefore identifies a combination for further testing rather than a demonstrated programme advantage. Mastrodomenico et al. [2] evaluated 101 hybrids across eight environments and found that responses to density and N supply, as well as yield stability, differed among hybrids. That evidence supports evaluating a hybrid within its management and environmental setting. Their stability assessment across multiple environments also shows why two positive seasonal estimates at one site are insufficient to establish broad adaptation or yield stability for P2105.
The SY Bambus result illustrates a different aspect of the interaction. In 2020, its PGPB-NPK contrast changed from −140.99 kg da−1 at 9500 plants da−1 to +204.26 kg da−1 at 10,500 plants da−1, with both contrasts remaining significant after Holm adjustment (Table 4). Thus, even the direction of the programme difference depended on target density for this hybrid in that season. This does not mean that increasing density necessarily increased yield within either programme: the contrasts compare programmes at each density. Assefa et al. [1] found that maize yield responses to density differed among yield environments, with contributions from both population density and per-plant yield components. Together with the hybrid-dependent responses reported by Mastrodomenico et al. [2], those findings provide context for the observed interaction, although neither study tested the present bacterial consortium. The SY Bambus reversal therefore supports local evaluation of programme-by-density combinations rather than a general recommendation for the higher target density.
Plant counts at emergence served as field checks, but recorded counts and final stands were unavailable. Consequently, these comparisons concern assigned planting prescriptions. Differences in establishment or survival could have contributed to the observed yield responses, and the present data cannot separate those contributions from responses at a common achieved population.
3.3. Component Traits and Multivariate Evidence
The component results show that a favourable response in one ear trait need not translate into greater land-area yield. PGPB had numerically higher pooled kernel number and test weight, while its mean grain yield remained slightly lower. Differences in ear number per area, plant establishment, kernel mass distribution and grain moisture could contribute to this mismatch, but their individual contributions cannot be resolved from the available measurements. The association between density and yield components therefore requires interpretation at both plant and area scales. Assefa et al. [1] attributed historical maize yield gains to changes in both agronomic optimum density and per-plant yield components. This provides a basis for interpreting kernel number together with plant population and kernel mass, rather than treating an increase in kernels per ear as sufficient evidence of increased grain yield per unit area. In the present experiment, thousand-kernel weight did not differ significantly between programmes, and final stands were unavailable. Component compensation is therefore a possible explanation for the divergence between kernel number and area yield, rather than a mechanism demonstrated by these measurements. Regional studies provide context for the magnitude of the measurements rather than fixed biological acceptance limits. Öktem and Toprak [14] reported ear lengths of 19.6–22.8 cm, ear diameters of 44–51 mm and test weights of 64.5–72.3 kg hL−1 among dent maize genotypes under Çukurova conditions. The present combined ear lengths were generally lower, while ear diameters partly overlapped and test weights extended below that reported range. Mut et al. [15] reported test weights of 70.06–76.86 kg hL−1 and thousand-kernel weights of 200.29–380.10 g among maize cultivars in Bilecik. Several present hybrids had lower test weight but higher thousand-kernel weight than those ranges. Such differences can arise from germplasm, grain filling conditions and measurement basis; they do not identify a biological mechanism underlying the nutrition response. Direct yield comparisons are especially sensitive to moisture correction conventions. The PCA summarizes covariance among selected ear and grain traits. Overlap in score space describes those traits and does not test whether the programmes differ in grain yield.
3.4. Soil Interpretation and Implications
The field-wide soil series showed a similar ordering of sampling dates in both seasons: organic matter, available P and available K were highest at VT, while pH and extractable Ca were lowest at that stage (Table S2). Organic matter changed from 1.4% before sowing to 1.6% at VT and 1.5% after harvest in 2020; the corresponding values were 1.8%, 2.1% and 1.9% in 2021. These observations describe concentrations in composite samples, not replicated programme effects or changes in soil carbon stocks. In a long-term maize field experiment, Shahbaz et al. [16] used microbial biomarkers and carbon isotopes to show seasonal changes in microbial abundance and carbon-source use associated with crop development and soil moisture. Their results provide evidence that soil biological processes vary during a maize season, but do not establish the cause of the organic matter pattern observed here. The distinction matters because microbial biomass and substrate use are different measurements from bulk-soil organic matter concentration.
The phosphorus observations also require a cautious interpretation. The available P at VT exceeded the pre-sowing value in both seasons and declined after harvest (Table S2). This sequence cannot by itself demonstrate bacterial phosphorus solubilization. In a factorial maize pot experiment, Zhou et al. [17] found that phosphorus-solubilizing bacteria increased microbial biomass P but reduced Olsen-P on average, while their effects on plant P uptake depended on the addition of mineral P. That result shows that inoculation can redistribute phosphorus among microbial, extractable and plant pools without producing a uniform increase in extractable P. Their controlled rhizosphere experiment differs from the present field-wide sampling, so it supplies a possible process framework rather than direct evidence for the mechanism operating at this site. The higher VT values for available P and K, together with lower extractable Ca, should therefore be treated as separate descriptive observations, rather than combined into a claim of improved soil fertility caused by the consortium.
Because soil samples were not collected separately from replicated nutrition treatments, the soil series cannot establish that changes in soil fertility caused the yield contrast between programmes. Plant nutrient uptake, microbial activity and consortium colonization were not measured. In addition, the absence of an uninoculated zero-fertilizer treatment and a carrier-only treatment prevent separation of introduced bacterial effects from native soil nutrient supply and carrier effects. Future experiments should pair replicated, programme-specific soil sampling with plant tissue nutrient measurements, microbial biomass and colonization assessments, and direct tests of the proposed nutrient-mobilization processes. These measurements would allow the mechanisms suggested by the literature [16,17] to be tested alongside yield responses.
The environmental comparison has further limits. Drip irrigation means that the seasonal rainfall totals alone cannot establish crop water stress. The same field was reused after soil preparation and rerandomization, so residual effects from the first season cannot be excluded. These constraints limit causal explanations of seasonal yield differences.
4. Materials and Methods
4.1. Site and Plant Material
The experiment was conducted in Karacabey, Bursa, Türkiye, over two consecutive growing seasons. Sowing and harvest dates were 20 May and 10 October in 2020 and 26 May and 24 October in 2021. The ten commercial maize hybrids were P2105, P1551, P2085, LG 31.695, LG 30.685, SY Bambus, KWS OLIMPION, DKC6492, DKC6897 and DKC6980. Monthly temperature, rainfall and relative humidity were obtained from the Turkish State Meteorological Service. Weather during May-October was compared with the available 2013–2023 reference series. This eleven-year series includes the experimental seasons and is not a standard thirty-year climate normal. Hybrid names and associated brands or companies are summarized in Supplementary Table S10 [18,19,20,21,22,23,24,25].
4.2. Field Arrangement and Crop Management
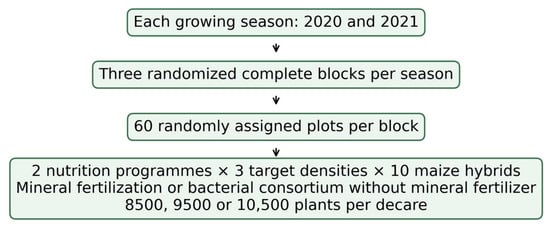
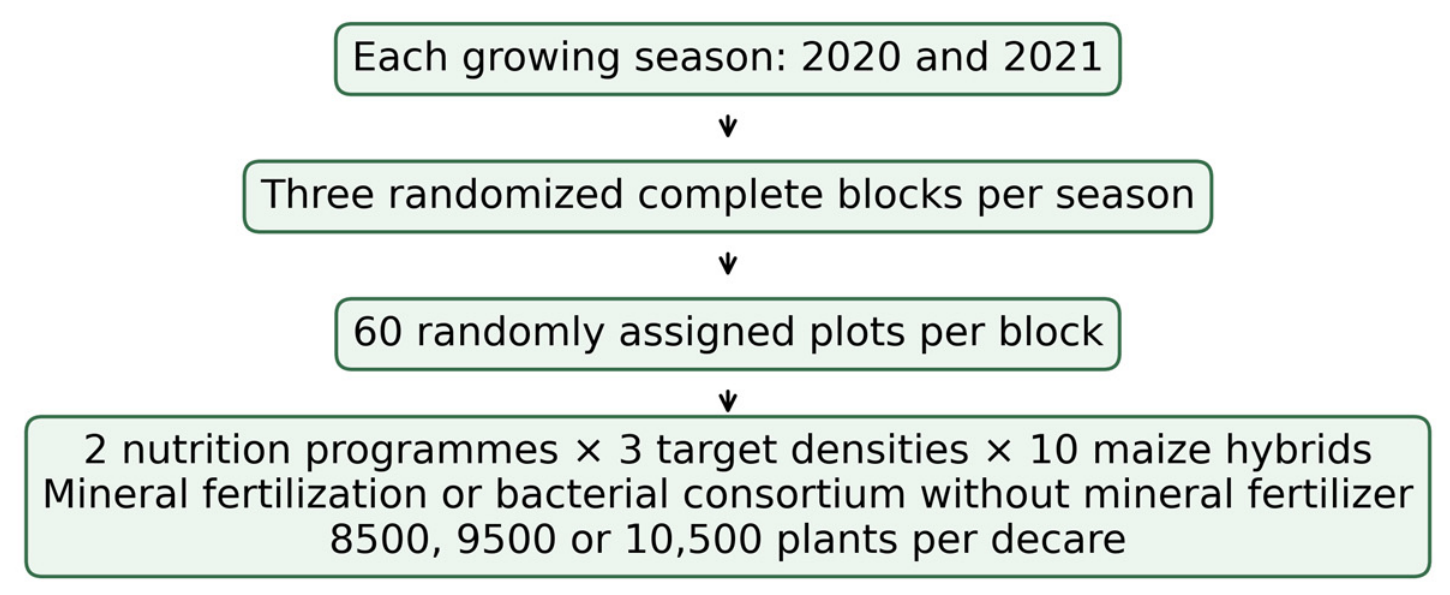
Each of the ten maize hybrids was grown at three target densities under both mineral fertilization and bacterial inoculation without mineral fertilizer. The 60 treatment combinations were assigned independently to plots within each of the three randomized complete blocks per season (180 plots; Figure 7). The same field footprint was used in both seasons, but the soil was prepared anew, plots were laid out again and treatments were rerandomized in 2021. Each plot consisted of eight 5 m rows spaced 0.70 m apart (28 m2). Target densities were 8500, 9500 and 10,500 plants da−1 (85,000, 95,000 and 105,000 plants ha−1). The two lower levels represent a range evaluated in maize density research [1,2]; the highest level tested whether further crowding altered yield and grain traits under either programme.
Figure 7.
Factorial treatment structure and randomization within each growing season. The diagram shows the design structure rather than the field map. One decare equals 1000 m2.
Before sowing, soil moisture below the surface was assessed manually. Approximately 50–75% of field capacity was used as the planting criterion. Instrument readings for the sowing dates were unavailable.
A planter equipped with a prescription-controlled planting system (Precision Planting LLC, Tremont, IL, USA) was used to sow each plot with the assigned hybrid at the target density. Plants were counted along a 1 m segment of one of the six interior rows in each selected plot. These checks were used to assess establishment in the field; counts were not retained and final stands were not measured. Drip lines were installed immediately after sowing, and drip irrigation was used throughout both growing seasons. Irrigation was generally applied every 3–4 days and was discontinued 7–10 days before harvest. A total of 600–750 mm of irrigation water (600–750 m3 da−1) was applied per season, excluding rainfall and including the water used to deliver the bacterial consortium. A general line supplied all plots, and a separately valved line delivered inoculum through outlets located only in PGPB plots. Weeds were controlled mechanically. Both nutrition programmes received the same irrigation volume per event, with drip irrigation applied at the same flow rate and for the same duration across all plots.
4.3. Mineral Nutrition and Inoculant Preparation
Mineral fertilizers were applied manually and exclusively to NPK plots. A basal application of 50 kg da−1 of 15-15-15 compound fertilizer supplied 7.5 kg da−1 each of N, P2O5 and K2O. When plants reached 40–50 cm in height, urea (46% N) was applied to supply an additional 5 kg N da−1. The total seasonal mineral nutrient input was therefore 12.5 kg N, 7.5 kg P2O5 and 7.5 kg K2O da−1. Fertilizer quantities were calculated separately for each plot. PGPB plots received no mineral fertilizer.
The FEYZ FARM laboratory prepared the consortium using the same protocol in both seasons. Equal volumes of cultures assigned to Azotobacter, Bacillus, Paenibacillus, Pantoea and Pseudomonas were combined in a formulation containing 1% carboxymethyl cellulose. The laboratory specified a viable concentration of at least 108 CFU mL−1 for the final formulation. Further details are provided in Supplementary Methods S1.
The prepared consortium was applied at 130 mL da−1 per application immediately after sowing and at V4, V8 and VT via the dedicated drip line. No mineral fertilizer was applied to PGPB plots and no CMC was applied to NPK plots. The experiment did not include uninoculated zero-fertilizer or carrier-only controls.
4.4. Soil Sampling and Measurements
Composite soil samples were collected from 0 to 30 cm depth before sowing, at VT and after harvest. Five randomly located subsamples within each sampled area were combined to obtain a representative sample. Soil pH and physicochemical properties were determined using the reported laboratory procedures. Organic matter was measured by the Walkley-Black method, total N by the Kjeldahl method, and available P by bicarbonate extraction using the Olsen method [26,27,28]. Potassium was measured by flame photometry. Iron, Zn, Mn and Cu were extracted with DTPA and measured by atomic absorption spectrometry using a PerkinElmer AAnalyst 400 [29]. Cation exchange capacity was determined with 1 N ammonium acetate at pH 7.0.
Soil samples represented the experimental field as a whole rather than as individual plots or separate nutrition treatments. The resulting observations describe changes with year and sampling stage and were not used to test nutrition-treatment effects (Supplementary Table S2).
4.5. Agronomic Observations and Grain Yield
The analyzed traits were ear length (EL, cm), ear diameter (ED, mm), kernel rows per ear (KRE), kernels per row (KPR), kernels per ear (KPE), cob diameter (CD, mm), cob weight (CW, g), test weight (TW, kg hL−1), thousand-kernel weight (TKW, g), dry matter content (DM, %), moisture content (MC, %), kernel weight per ear (KW, g), and grain yield (GY, kg da−1). Ten plants were randomly selected from the six inner rows of each plot, excluding the first and last rows. Ears from these plants were used for ear and grain measurements.Ear length was measured after husk removal, and ear diameter was measured at the midpoint with a digital calliper (model 1108-150, INSIZE Co., Ltd., Suzhou, China). Kernel rows were counted on each ear, and kernels per ear were calculated by multiplying that ear’s row number by its mean number of kernels per row. After shelling, cob diameter, cob weight and kernel weight per ear were determined. Measurements were averaged to obtain one value per plot. For thousand-kernel weight, four subsamples of 100 kernels were counted and weighed; their combined mass was multiplied by 2.5. Grain moisture and test weight were measured using the DICKEY-john mini GAC plus instrument. Dry matter content was determined separately by weighing grain samples before and after oven drying at 130–133 °C for 2–3 h and expressing the remaining dry mass as a percentage of the initial sample mass. Trait definitions and units are given in Supplementary Table S1.
The full 5 m length of each of the six interior rows was harvested, and grain from the resulting 21 m2 net harvest area was weighed separately for each plot. Harvest moisture was measured on a representative sample of the weighed grain. Plot yield was standardized to 15% moisture as Y15 = W × (100 − M)/85 × 1000/21, where W is the harvested grain mass (kg) and M is its moisture percentage.
4.6. Statistical Analysis
Annual factorial ANOVAs included block, programme, target density, hybrid and all treatment interactions. The combined model included season, blocks nested within season, and season interactions with all treatment terms. Plot means were analyzed, with residual degrees of freedom of 118 per season and 236 in the combined model. The Tukey tests used the corresponding model residual variance for marginal and within-setting comparisons. The Shapiro–Wilk and median-centred Levene tests assessed model residuals (Table S4). Conventional and HC3 robust tests were used to assess yield contrasts. Holm adjustment was applied separately to the 30 hybrid-by-density contrasts per period [30]; nominal 95% confidence intervals used the model residual degrees of freedom (Section 2.3 and Table 4). Supplementary Tables S7 and S8, together with main-text Table 6, provide the corresponding test summaries and sensitivity results. Analyses were performed in Python using NumPy 2.3.5, pandas 2.2.3 and SciPy 1.17.0. Balanced factorial sums of squares were calculated from orthogonal marginal contrasts and independently verified by ordinary least-squares fits of equivalent design matrices. Each plot was the experimental unit; the ten sampled plants were subsamples and were not counted as independent replicates. The plot dataset, executable analysis scripts and full-precision output tables accompany the submission.
Table 6.
Conventional and HC3 tests of the nutrition-programme main effect in each period.
Exploratory principal component analysis used 360 plot observations and eight centred, unit-variance traits: ear diameter, kernel rows per ear, kernels per row, kernels per ear, cob diameter, cob weight, grain test weight and moisture content. This subset represents ear structure, kernel set and physical grain properties; yield was analyzed separately. All score plots used the same pooled axes (Table S6). Seasonal ellipsoids used the covariance of the first three scores and the 95th percentile of a chi-square distribution with three degrees of freedom; they describe score dispersion rather than confidence regions for seasonal means.
5. Conclusions
The field comparison shows that the relative performance of the two nutrition programmes depends on hybrid choice, target planting density and season. A pooled yield difference therefore provides limited guidance for selecting the hybrid type and planting density at a particular site. The results identify combinations for independent testing under comparable management. Trials across sites with documented final stands and appropriate controls are needed to determine whether those responses are repeatable and to separate bacterial effects from the effects of the complete nutrition programmes. P2105 at 9500 plants da−1 is a candidate for independent validation under comparable conditions.
Supplementary Materials
The following supporting information can be downloaded at: https://www.mdpi.com/article/10.3390/plants15223545/s1, Table S1: Trait definitions and units; Table S2: Field-wide soil observations; Table S3: Hybrid marginal means for 2020, 2021 and the combined analysis; Table S4: Residual diagnostics; Table S5: Annual and combined ANOVA mean squares; Table S6: PCA coefficients; Table S7: All 90 conventional local grain yield contrasts; Table S8: Conventional and HC3 sensitivity comparisons for the 30 combined local grain yield contrasts; Table S9: Nutrition and density marginal means; Table S10: Hybrid names and companies. Supplementary Methods S1 describes consortium preparation. The former supplementary nutrition main-effect tests are presented in main-text Table 6. Additional_Tables contains the 18 explicitly labelled hybrid comparison tables within each period, nutrition programme and target density, in CSV format. Supplementary Data S1 is Data_Set_2020_2021_Pakize OZlem KURT_Plants Journal_.xlsx. Supplementary Code S1 is Plants_Statistical_Analysis_15pct.zip, containing the scripts, an identical dataset and full-precision CSV outputs. README.txt identifies each file and explains how to open the material.
Funding
This research received no external funding.
Data Availability Statement
The plot-level observations are provided in Supplementary Data S1 (Data_Set_2020_2021_Pakize OZlem KURT_Plants Journal_.xlsx). Supplementary Tables S1–S10 and Methods S1 are provided in Plants_Supplementary_Yield_15pct.docx and the matching PDF. Supplementary Code S1 (Plants_Statistical_Analysis_15pct.zip) contains executable scripts, an identical dataset and full-precision outputs.
Acknowledgments
The author used ChatGPT (OpenAI, GPT-6.1 Sol) for language editing and takes full responsibility for the final manuscript.
Conflicts of Interest
The author declares no conflicts of interest.
Abbreviations
The following abbreviations are used in this manuscript:
| NPK | Nitrogen, phosphorus and potassium |
| PGPB | Plant growth-promoting bacteria |
| EL | Ear length |
| ED | Ear diameter |
| KRE | Kernel rows per ear |
| KPR | Kernels per row |
| KPE | Kernels per ear |
| CD | Cob diameter |
| CW | Cob weight |
| TW | Grain test weight |
| TKW | Thousand-kernel weight |
| DM | Dry matter |
| MC | Moisture content |
| KW | Kernel weight per ear |
| GY | Grain yield |
| PCA | Principal component analysis |
| SE | Standard error |
| CFU | Colony-forming units |
References
- Assefa, Y.; Carter, P.; Hinds, M.; Bhalla, G.; Schon, R.; Jeschke, M.; Paszkiewicz, S.; Smith, S.; Ciampitti, I.A. Analysis of long term study indicates both agronomic optimal plant density and increase maize yield per plant contributed to yield gain. Sci. Rep. 2018, 8, 4937. [Google Scholar] [CrossRef] [Scilit] [PubMed]
- Mastrodomenico, A.T.; Haegele, J.W.; Seebauer, J.R.; Below, F.E. Yield stability differs in commercial maize hybrids in response to changes in plant density, nitrogen fertility, and environment. Crop Sci. 2018, 58, 230–241. [Google Scholar] [CrossRef] [Scilit]
- Richardson, A.E.; Barea, J.M.; McNeill, A.M.; Prigent-Combaret, C. Acquisition of phosphorus and nitrogen in the rhizosphere and plant growth promotion by microorganisms. Plant Soil 2009, 321, 305–339. [Google Scholar] [CrossRef] [Scilit]
- Molina-Romero, D.; Juárez-Sánchez, S.; Venegas, B.; Ortíz-González, C.S.; Baez, A.; Morales-García, Y.E.; Muñoz-Rojas, J. A bacterial consortium interacts with different varieties of maize, promotes the plant growth, and reduces the application of chemical fertilizer under field conditions. Front. Sustain. Food Syst. 2021, 4, 616757. [Google Scholar] [CrossRef] [Scilit]
- Vessey, J.K. Plant growth promoting rhizobacteria as biofertilizers. Plant Soil 2003, 255, 571–586. [Google Scholar] [CrossRef] [Scilit]
- Bashan, Y.; de-Bashan, L.E.; Prabhu, S.R.; Hernandez, J.P. Advances in plant growth-promoting bacterial inoculant technology: Formulations and practical perspectives (1998–2013). Plant Soil 2014, 378, 1–33. [Google Scholar] [CrossRef] [Scilit]
- Lugtenberg, B.; Kamilova, F. Plant-growth-promoting rhizobacteria. Annu. Rev. Microbiol. 2009, 63, 541–556. [Google Scholar] [CrossRef] [Scilit] [PubMed]
- Ladha, J.K.; Peoples, M.B.; Reddy, P.M.; Biswas, J.C.; Bennett, A.; Jat, M.L.; Krupnik, T.J. Biological nitrogen fixation and prospects for ecological intensification in cereal-based cropping systems. Field Crops Res. 2022, 283, 108541. [Google Scholar] [CrossRef] [Scilit] [PubMed]
- Saheewala, H.; Sanadhya, S.; Upadhyay, S.K.; Mohanty, S.R.; Jain, D. Polyphasic characterization of indigenous potassium-solubilizing bacteria and its efficacy studies on maize. Agronomy 2023, 13, 1919. [Google Scholar] [CrossRef] [Scilit]
- Efthimiadou, A.; Katsenios, N.; Chanioti, S.; Giannoglou, M.; Djordjevic, N.; Katsaros, G. Effect of foliar and soil application of plant growth promoting bacteria on growth, physiology, yield and seed quality of maize under Mediterranean conditions. Sci. Rep. 2020, 10, 21060. [Google Scholar] [CrossRef] [Scilit] [PubMed]
- Kifle, M.H.; Laing, M.D. Effects of selected diazotrophs on maize growth. Front. Plant Sci. 2016, 7, 1429. [Google Scholar] [CrossRef] [Scilit] [PubMed]
- Katsenios, N.; Andreou, V.; Sparangis, P.; Djordjevic, N.; Giannoglou, M.; Chanioti, S.; Kasimatis, C.N.; Kakabouki, I.; Leonidakis, D.; Danalatos, N.; et al. Assessment of plant growth promoting bacteria strains on growth, yield and quality of sweet corn. Sci. Rep. 2022, 12, 11598. [Google Scholar] [CrossRef] [Scilit] [PubMed]
- Kurt, P.O. Field-based evaluation of multi-strain PGPR to improve Zea mays yield and soil nutrient dynamics in semi-arid of Türkiye. Sci. Rep. 2025, 15, 22553. [Google Scholar] [CrossRef] [Scilit] [PubMed]
- Öktem, A.; Toprak, A. Determination of yield and some morphological characteristics of some dent corn genotypes (Zea mays L. indentata) under Çukurova conditions. Harran Üniversitesi Ziraat Fakültesi Derg. 2013, 17, 15–24. (In Turkish) [Google Scholar]
- Mut, Z.; Kardeş, Y.M.; Erbaş Köse, Ö.D. Determining the grain yield and nutritional composition of maize cultivars in different growing groups. Turk. J. Field Crops 2022, 27, 158–166. [Google Scholar] [CrossRef] [Scilit]
- Shahbaz, M.; Kätterer, T.; Thornton, B.; Börjesson, G. Dynamics of fungal and bacterial groups and their carbon sources during the growing season of maize in a long-term experiment. Biol. Fertil. Soils 2020, 56, 759–770. [Google Scholar] [CrossRef] [Scilit]
- Zhou, G.; Wang, M.; Zhu, H.; Wang, J.; Zhang, S. Effects of organic carbon, inorganic phosphorus, and phosphorus-solubilizing bacteria on maize growth, nutrient uptake, and rhizosphere phosphorus availability. Front. Plant Sci. 2025, 16, 1644448. [Google Scholar] [CrossRef] [Scilit] [PubMed]
- Corteva Agriscience. P2105. Available online: https://www.pioneer.com/tr/urunler/tohum/misir/p2105.html (accessed on 23 October 2026).
- Corteva Agriscience. P1551. Available online: https://www.pioneer.com/content/dam/dpagco/corteva/eu/tr/tr/files/pioneer/borchure/corn/P1551-brosur.pdf (accessed on 23 October 2026).
- Corteva Agriscience. P2085. Available online: https://www.pioneer.com/content/dam/dpagco/corteva/eu/tr/tr/files/pioneer/borchure/corn/P2085-brosur.pdf (accessed on 23 October 2026).
- Limagrain Türkiye. LG 31.695. Available online: https://lgseeds.com.tr/urun/lg-31-695 (accessed on 23 October 2026).
- Limagrain Türkiye. LG 30.685. Available online: https://lgseeds.com.tr/urun/lg-30-685 (accessed on 23 October 2026).
- Syngenta Türkiye. SY Bambus. Available online: https://www.syngenta.com.tr/product/seed/sy-bambus (accessed on 23 October 2026).
- KWS Türk. KWS OLIMPION. Available online: https://www.kws.com/tr/tr/urunler/misir/cesitleri/olimpion-kws/ (accessed on 23 October 2026).
- Bayer Crop Science Türkiye. Mısır Kataloğu 2025. Available online: https://www.cropscience.bayer.com.tr/content/dam/bayer-crop-science/turkey/bcs/tr-brochures/Misir_Katalogu_2025_Web.pdf (accessed on 23 October 2026).
- Walkley, A.; Black, I.A. An examination of the Degtjareff method for determining soil organic matter, and a proposed modification of the chromic acid titration method. Soil Sci. 1934, 37, 29–38. [Google Scholar] [CrossRef] [Scilit]
- Kjeldahl, J. Neue Methode zur Bestimmung des Stickstoffs in organischen Körpern. Fresenius Z. Anal. Chem. 1883, 22, 366–382. [Google Scholar] [CrossRef] [Scilit]
- Olsen, S.R.; Cole, C.V.; Watanabe, F.S.; Dean, L.A. Estimation of Available Phosphorus in Soils by Extraction with Sodium Bicarbonate; USDA Circular 939; United States Department of Agriculture: Washington, DC, USA, 1954.
- Lindsay, W.L.; Norvell, W.A. Development of a DTPA soil test for zinc, iron, manganese, and copper. Soil Sci. Soc. Am. J. 1978, 42, 421–428. [Google Scholar] [CrossRef] [Scilit]
- Holm, S. A simple sequentially rejective multiple test procedure. Scand. J. Stat. 1979, 6, 65–70. [Google Scholar]

Disclaimer/Publisher’s Note: The statements, opinions and data contained in all publications are solely those of the individual author(s) and contributor(s) and not of MDPI and/or the editor(s). MDPI and/or the editor(s) disclaim responsibility for any injury to people or property resulting from any ideas, methods, instructions or products referred to in the content. |
© 2026 by the author. Licensee MDPI, Basel, Switzerland. This article is an open access article distributed under the terms and conditions of the Creative Commons Attribution (CC BY) license.