


Abstract
This study investigated a Vatica mangachapoi community in the Bawangling area of Hainan Tropical Rainforest National Park. We analyzed the 20 woody species with the highest importance values in each of the four forest layers to compare species dominance, plot-level distributional patterns, and interspecific associations. The results showed that: (1) Vatica mangachapoi ranked first in importance value in the large, medium, and small arbor layers and second in the shrub layer, while exhibiting the greatest niche breadth in all four forest layers, indicating its prominent position in the community and relatively widespread and even distribution of importance values across plots. (2) Niche overlap was common among dominant species, particularly in the small arbor layer, but high-overlap pairs remained rare (<8% in each layer). All layers exhibited significant positive overall associations, and positive pairwise association coefficients predominated, although few pairs were significant in Fisher’s exact tests. After Benjamini–Hochberg correction, only three species pairs retained significant positive Spearman correlations, two with high niche overlap. (3) Within each layer, Pianka overlap and Spearman correlations were positively related, reflecting concordance between indices derived from the same plot-level importance-value data. These findings reveal differences in species dominance, plot-level co-occurrence, and covariation across forest layers in the surveyed Vatica mangachapoi community, providing a basis for future monitoring.
1. Introduction
Plant species within a community do not exist in isolation; rather, they interact with one another and with their environment, resulting in reciprocal dependence and influence. The ecological niche describes how a species uses resources and habitats under particular environmental conditions and provides an important basis for understanding its position within a community and its relationships with coexisting species [1,2]. Niche breadth reflects the range of resources used by a species and the extent of its habitat distribution, whereas niche overlap characterizes the similarity in resource or habitat use among species within the same temporal or spatial context and thus provides a basis for identifying potential resource partitioning among species [3,4,5].
Interspecific associations reflect spatial co-occurrence and distributional relationships among different species within a community. Such associations may be influenced by both interspecific interactions and environmental conditions [6]. When calculated from plot-level importance values, niche breadth and overlap indices describe the breadth, evenness, and similarity of species’ importance-value distributions across plots. Integrating analyses of ecological niches and interspecific associations can therefore improve our understanding of species’ distribution patterns and associations within communities, providing insights into community structure and species coexistence.
Tropical rainforests exhibit pronounced vertical stratification, with forest layers differing in light availability, canopy space, neighborhood environments, and the ontogenetic stages of constituent individuals. Consequently, species’ resource-acquisition strategies and interspecific relationships may vary with vertical position [7,8]. Comparing the distribution patterns and interspecific associations of dominant species across forest layers can therefore help reveal vertical variation in community structure.
Vatica mangachapoi is an evergreen tree belonging to the genus Vatica in the family Dipterocarpaceae and is a representative dominant species in the tropical lowland rainforests of Hainan. During the 1990s, the lowland rainforest communities in which Vatica mangachapoi occurred were severely disturbed because of the species’ high economic value [9]. Although populations of Vatica mangachapoi have recovered to some extent following the implementation of conservation measures, the species remains listed as a Class II nationally protected wild plant in China. Recent studies have mainly focused on the genetic diversity, genomic characteristics, population structure, and endangered status of Vatica mangachapoi, thereby elucidating its genetic background and conservation value [10,11,12,13]. Research on its population characteristics and ecological relationships within plant communities has also gradually expanded. Shu et al. [14] further confirmed the dominance of Vatica mangachapoi in a natural community in Ganshiling, Hainan. However, most community-level studies have treated the arbor layer as a single unit. Consequently, little is known about how the relative dominance and plot-level distribution patterns of Vatica mangachapoi, as well as its associations with dominant coexisting species, vary among forest layers. The Bawangling area of Hainan Tropical Rainforest National Park supports a relatively concentrated population of Vatica mangachapoi within well-preserved natural communities characterized by distinct vertical stratification and limited human disturbance. These conditions provide a natural setting for comparing the species dominance, plot-level distribution patterns, and interspecific associations of Vatica mangachapoi across forest layers. Focusing on communities containing Vatica mangachapoi in the Bawangling area, we classified their vertical structure into four forest layers: the large arbor layer, medium arbor layer, small arbor layer, and shrub layer.
For each forest layer, we analyzed the importance values, niche breadths, niche overlap, and interspecific association patterns of the dominant species. By integrating these analyses, we compared vertical variation in species dominance, plot-level importance-value distributions, and interspecific associations within the Vatica mangachapoi community, thereby providing a basis for understanding its vertical structure and informing its conservation and management.
2. Materials and Methods
2.1. Study Area
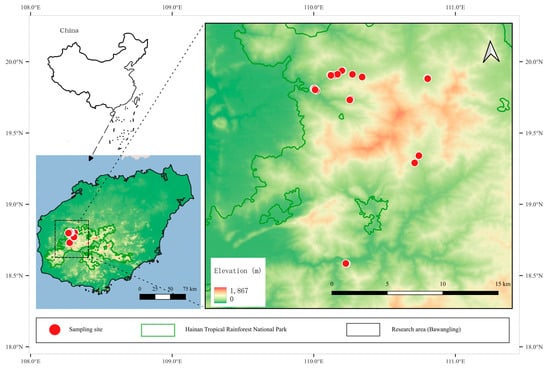
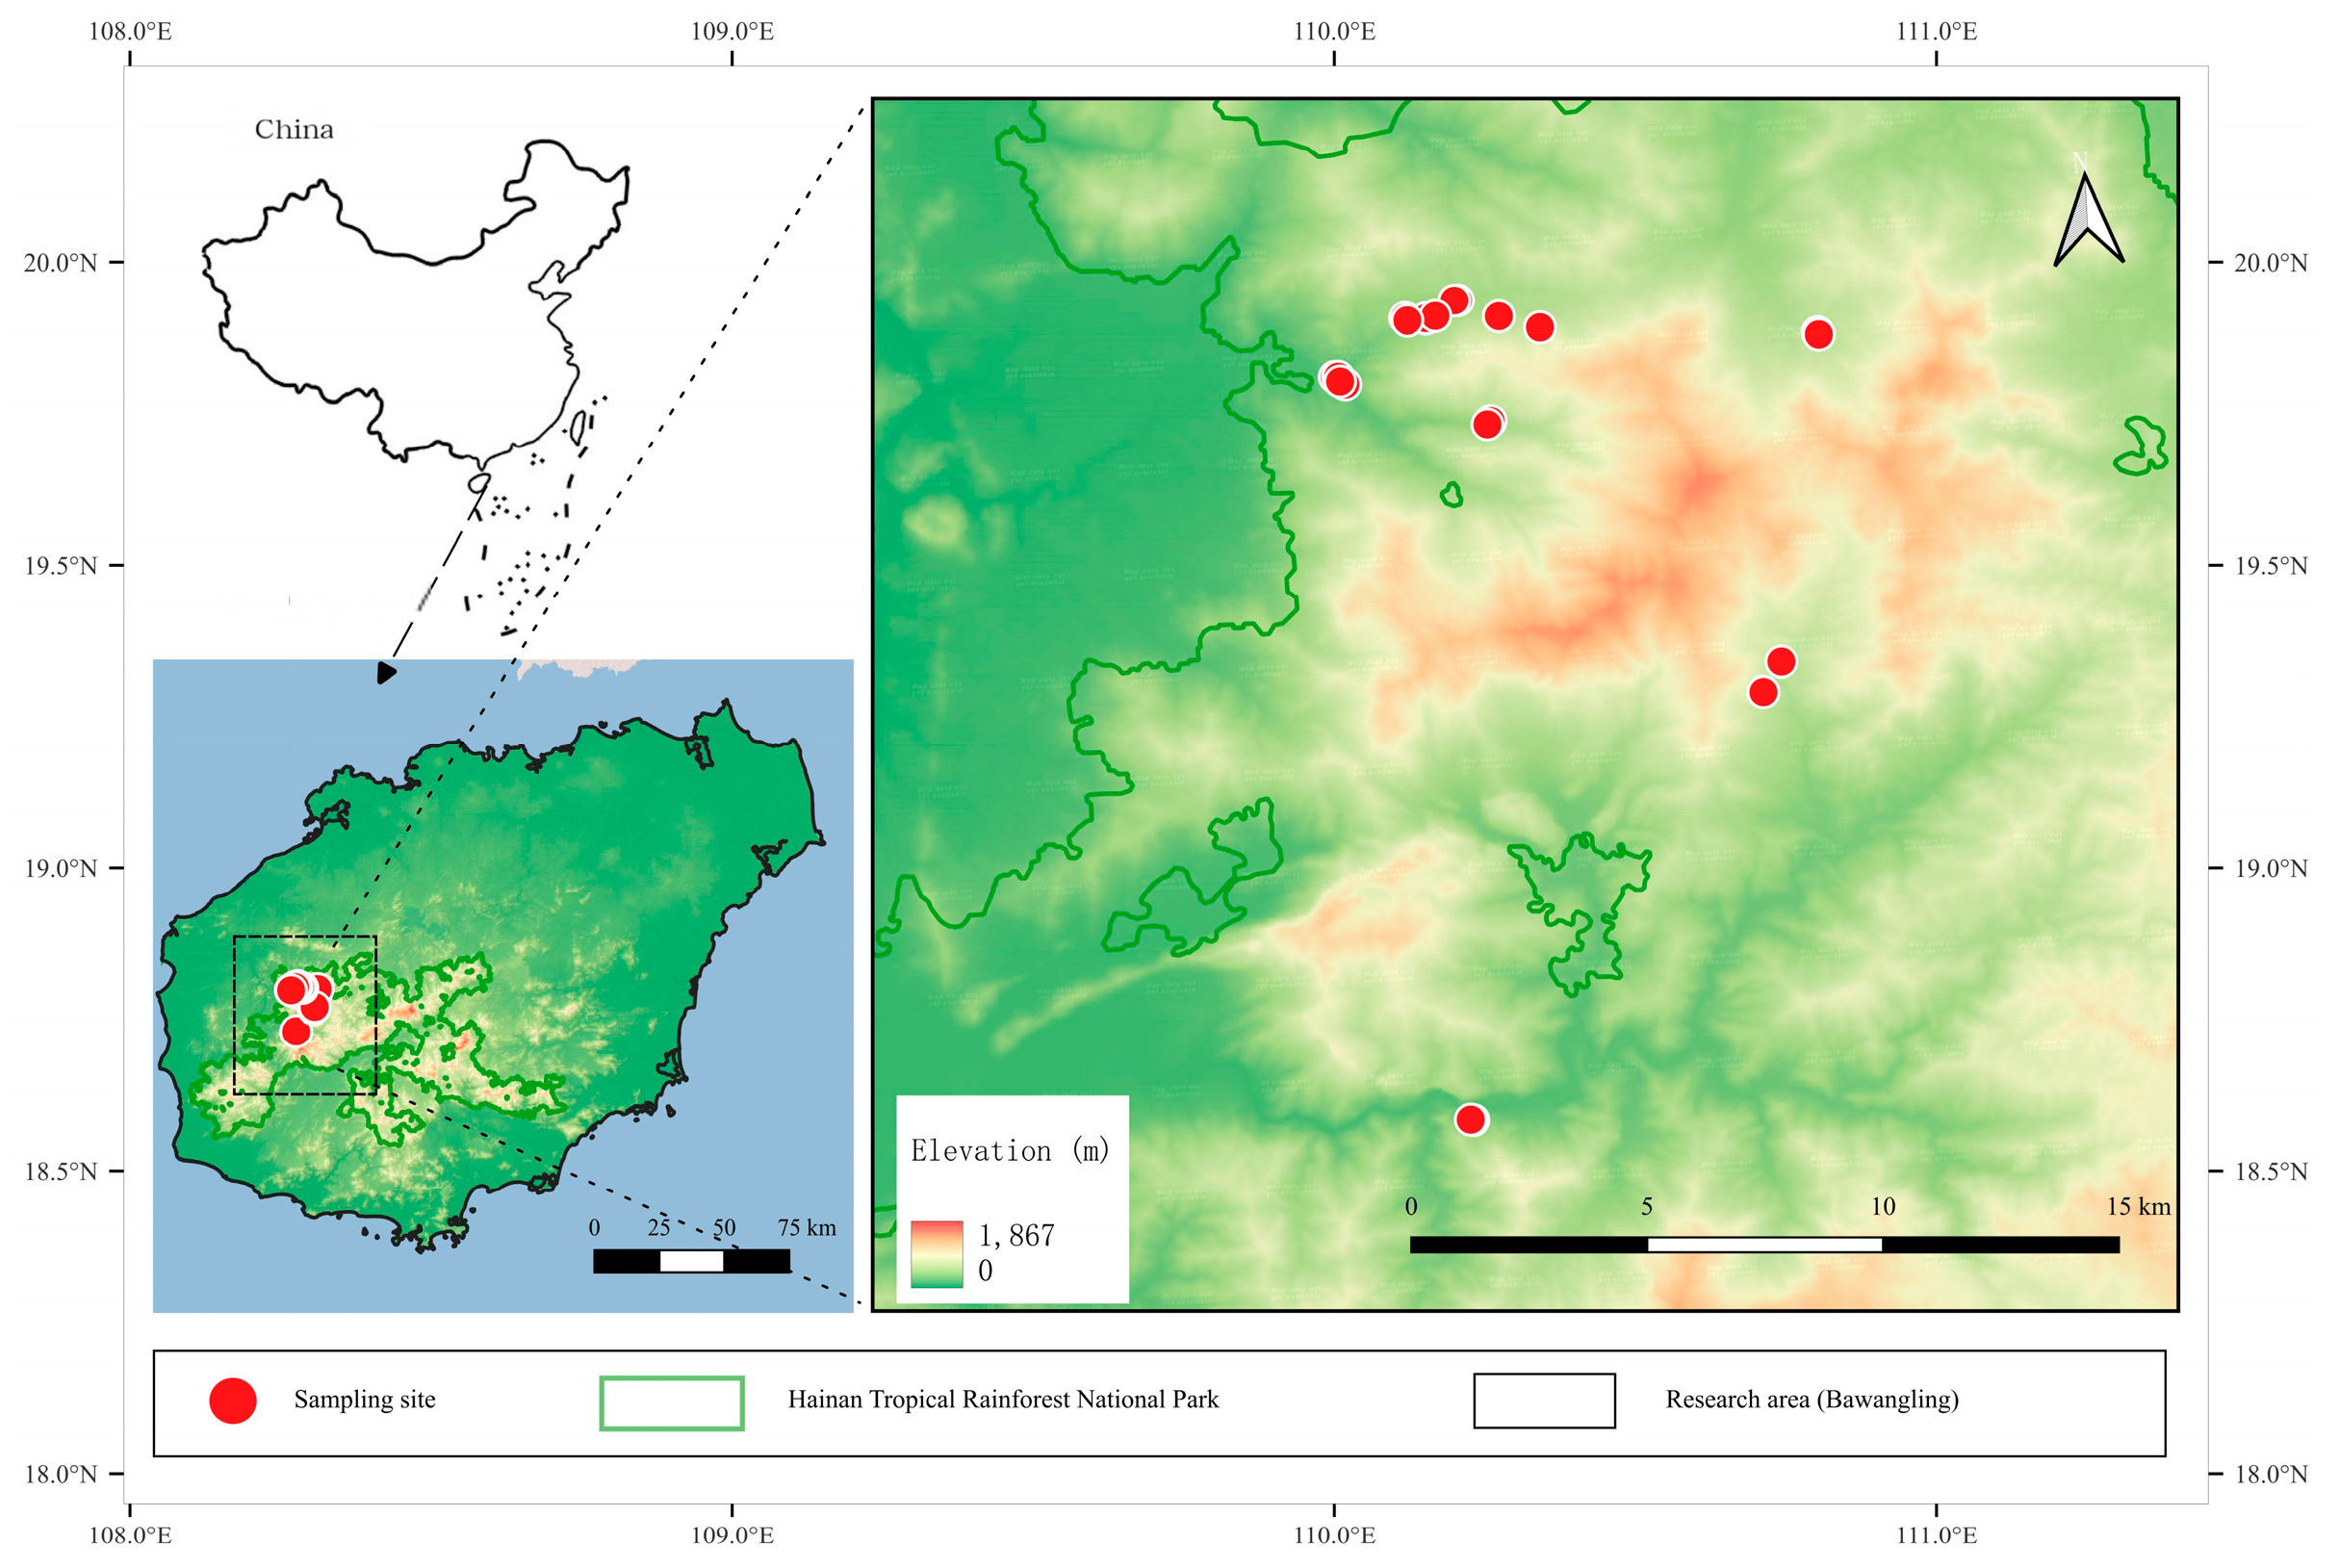
The Bawangling sector of Hainan Tropical Rainforest National Park (18°54′–19°13′ N, 109°01′–109°18′ E) is located in southwestern Hainan Province and spans Changjiang Li Autonomous County and Baisha Li Autonomous County. It is one of the best-preserved tropical rainforest regions on Hainan Island. The study area is predominantly mountainous, with elevations ranging from 100 to 1654 m, and supports a relatively intact tropical montane rainforest ecosystem (Figure 1). The region has a tropical monsoon climate characterized by warm and humid conditions throughout the year and a strong monsoon influence. The annual mean temperature ranges from 21.3 to 24.0 °C, with an average annual precipitation of approximately 1657 mm and a mean relative humidity of 84.2%, representing typical climatic conditions of a tropical montane rainforest. The soils are mainly derived from deeply weathered red weathering crusts and are dominated by latosols, with deep soil profiles and relatively high organic matter content.
Figure 1.
Overview of the study area.
The principal vegetation types are tropical lowland rainforest, tropical montane rainforest, and evergreen broad-leaved forest [15]. Forest vegetation in this area is relatively well preserved, with pronounced vertical stratification and high tree species richness, making it an important region for tropical rainforest biodiversity conservation in China [16].
2.2. Plot Establishment
Based on the distribution of Vatica mangachapoi in the Bawangling sector, we established sampling plots in areas where the species was relatively abundant and the surrounding forest communities were relatively well preserved. The 20 plots (Table 1) were distributed across different locations within the Bawangling sector, providing spatial coverage for examining species composition, niche characteristics, and interspecific associations in the surveyed Vatica mangachapoi communities.
Table 1.
Plot Overview.
A total of 20 permanent plots, each measuring 20 m × 20 m, were established, and each plot was subdivided into four 10 m × 10 m tree quadrats. All woody individuals taller than 1.0 m with a stem diameter ≥ 1.3 cm were censused. Stem diameter was measured at breast height (1.3 m above ground) for individuals ≥ 1.3 m tall and as basal diameter for individuals with 1.0 m < H < 1.3 m. Species identity, stem diameter, tree height, and number of individuals were recorded, together with plot-level elevation and slope.
Following the principles of community surveys and vertical stratification specified in the protocols for compiling the Vegegraphy of China [17], and considering the vertical structure of the community, woody plants were classified into four forest layers: the large arbor layer (H ≥ 7 m), medium arbor layer (5 m ≤ H < 7 m), small arbor layer (3 m ≤ H < 5 m), and shrub layer (H < 3 m), where H represents plant height. Within each forest layer, the 20 species with the highest importance values were selected as dominant species for subsequent analyses.
2.3. Data Analysis
2.3.1. Calculation of Importance Values
The importance value (IV) of each species was calculated from its relative density, relative frequency, and relative dominance, following Curtis and McIntosh [18] and Song [19], as follows:
where RD, RF, and RP denote relative density, relative frequency, and relative dominance, respectively. RD is the number of individuals of a given species divided by the total number of individuals in the corresponding forest layer; RF is the frequency of occurrence of a given species divided by the sum of occurrence frequencies of all species in that layer; and RP is the total stem cross-sectional area of a given species divided by the total stem cross-sectional area of all species in that layer, calculated using the measured stem diameters (DBH or basal diameter, as appropriate).
First, the overall importance values of species in each forest layer were calculated using data from all 20 plots, and the 20 species with the highest importance values were selected as dominant species. Subsequently, importance values were calculated for each species within each forest layer at the individual 20 m × 20 m plot level. The denominators for relative density, relative frequency, and relative dominance were the total number of individuals, the sum of occurrence frequencies, and the total basal area of all species in the corresponding forest layer within each plot, respectively. Finally, the resulting plot-level importance values were organized into a species-by-plot matrix for each forest layer and used to calculate niche breadth, niche overlap, and Spearman’s rank correlations.
2.3.2. Niche Characteristics
Niche breadth was quantified using the Levins’ index (Bl) [20] and the Shannon–Wiener index (Bs) [21], as follows:
where Pij is the proportion of the importance value of species i in plot j relative to the sum of its importance values across all plots, and n is the total number of plots. A larger Bs value indicates a more even distribution of species’ importance values across plots, whereas a larger Bl value indicates a broader niche.
Niche overlap was quantified using Pianka’s index (Oik) [22] to measure the similarity in species’ plot-level importance-value distributions, as follows:
where Pij and Pkj represent the proportions of the importance values of species i and k, respectively, in plot j. To facilitate comparisons of niche overlap among forest strata, Pianka’s niche overlap index was operationally classified as follows: low overlap (0 ≤ Oik < 0.30); moderate overlap (0.30 ≤ Oik < 0.60); and high overlap (0.60 ≤ Oik ≤ 1.00).
2.3.3. Overall Interspecific Association Test
The variance ratio (VR) method was used to test the overall interspecific associations among dominant species within each forest layer and to determine whether the species assemblage exhibited an overall positive, negative, or nonsignificant association. Calculations were performed following Schluter [23] and Zhang [24], as follows:
where S is the number of species, N is the number of plots, Pi is the frequency of occurrence of species i, Tj is the number of species occurring in plot j, and t is the mean number of species across all plots. Under the null hypothesis of species independence, the expected value of VR is 1. A VR value greater than 1 indicates an overall positive interspecific association, whereas a value less than 1 indicates an overall negative interspecific association.
The significance of the overall association was assessed using the statistic W = N × VR. Because 20 plots were included in this study, W was assumed to approximately follow a χ2 distribution with N = 20 degrees of freedom. For the two-sided test at α = 0.05, the acceptance interval was 9.59–34.17. The overall association was considered nonsignificant when W fell within this interval, significantly positive when W > 34.17, and significantly negative when W < 9.59.
2.3.4. Interspecific Association Analysis
Interspecific associations among dominant woody species within each forest layer were evaluated using the association coefficient (AC), Fisher’s exact test, and Spearman’s rank correlation analysis. We first constructed a binary presence–absence (0–1) matrix based on species occurrences across the 20 plots, with 1 indicating presence and 0 indicating absence. The AC was used to quantify the direction and strength of pairwise associations, following Wang and Peng [25] as follows:
When ad ≥ bc,
When ad < bc and d ≥ a,
When ad < bc and d < a,
where a represents the number of plots in which both species occurred, b and c represent the numbers of plots in which only one of the two species occurred, and d represents the number of plots in which neither species occurred. AC values range from −1 to 1, with positive and negative values indicating positive and negative associations, respectively, and zero indicating no directional association. The statistical significance of pairwise associations was assessed using two-sided Fisher’s exact tests. p-values below 0.05 and 0.01 were considered significant and highly significant, respectively. Given the large number of species-pair comparisons involved in Fisher’s exact tests, some significant results may be affected by multiple testing. Therefore, these results were treated as exploratory and used to identify potential interspecific co-occurrence patterns.
Because Vatica mangachapoi occurred in all 20 plots in the large arbor layer, medium arbor layer, and shrub layer, its binary occurrence data showed no variation. Therefore, the 19 species pairs involving Vatica mangachapoi were excluded from the AC and Fisher’s exact test analyses in each of these three layers, leaving 171 valid species pairs per layer. In the small arbor layer, Vatica mangachapoi was absent from one plot, allowing all 190 species pairs to be included in these analyses.
Spearman’s rank correlation analysis was performed using species importance values across the 20 plots to calculate pairwise correlation coefficients (ρ) and their associated p-values. All 190 species pairs in each forest layer, including those involving Vatica mangachapoi, were included in this analysis. The Benjamini–Hochberg (BH) procedure was applied separately to the 190 p-values within each forest layer to control the false discovery rate (FDR). Correlations with FDR-adjusted p-values below 0.05 were considered significant.
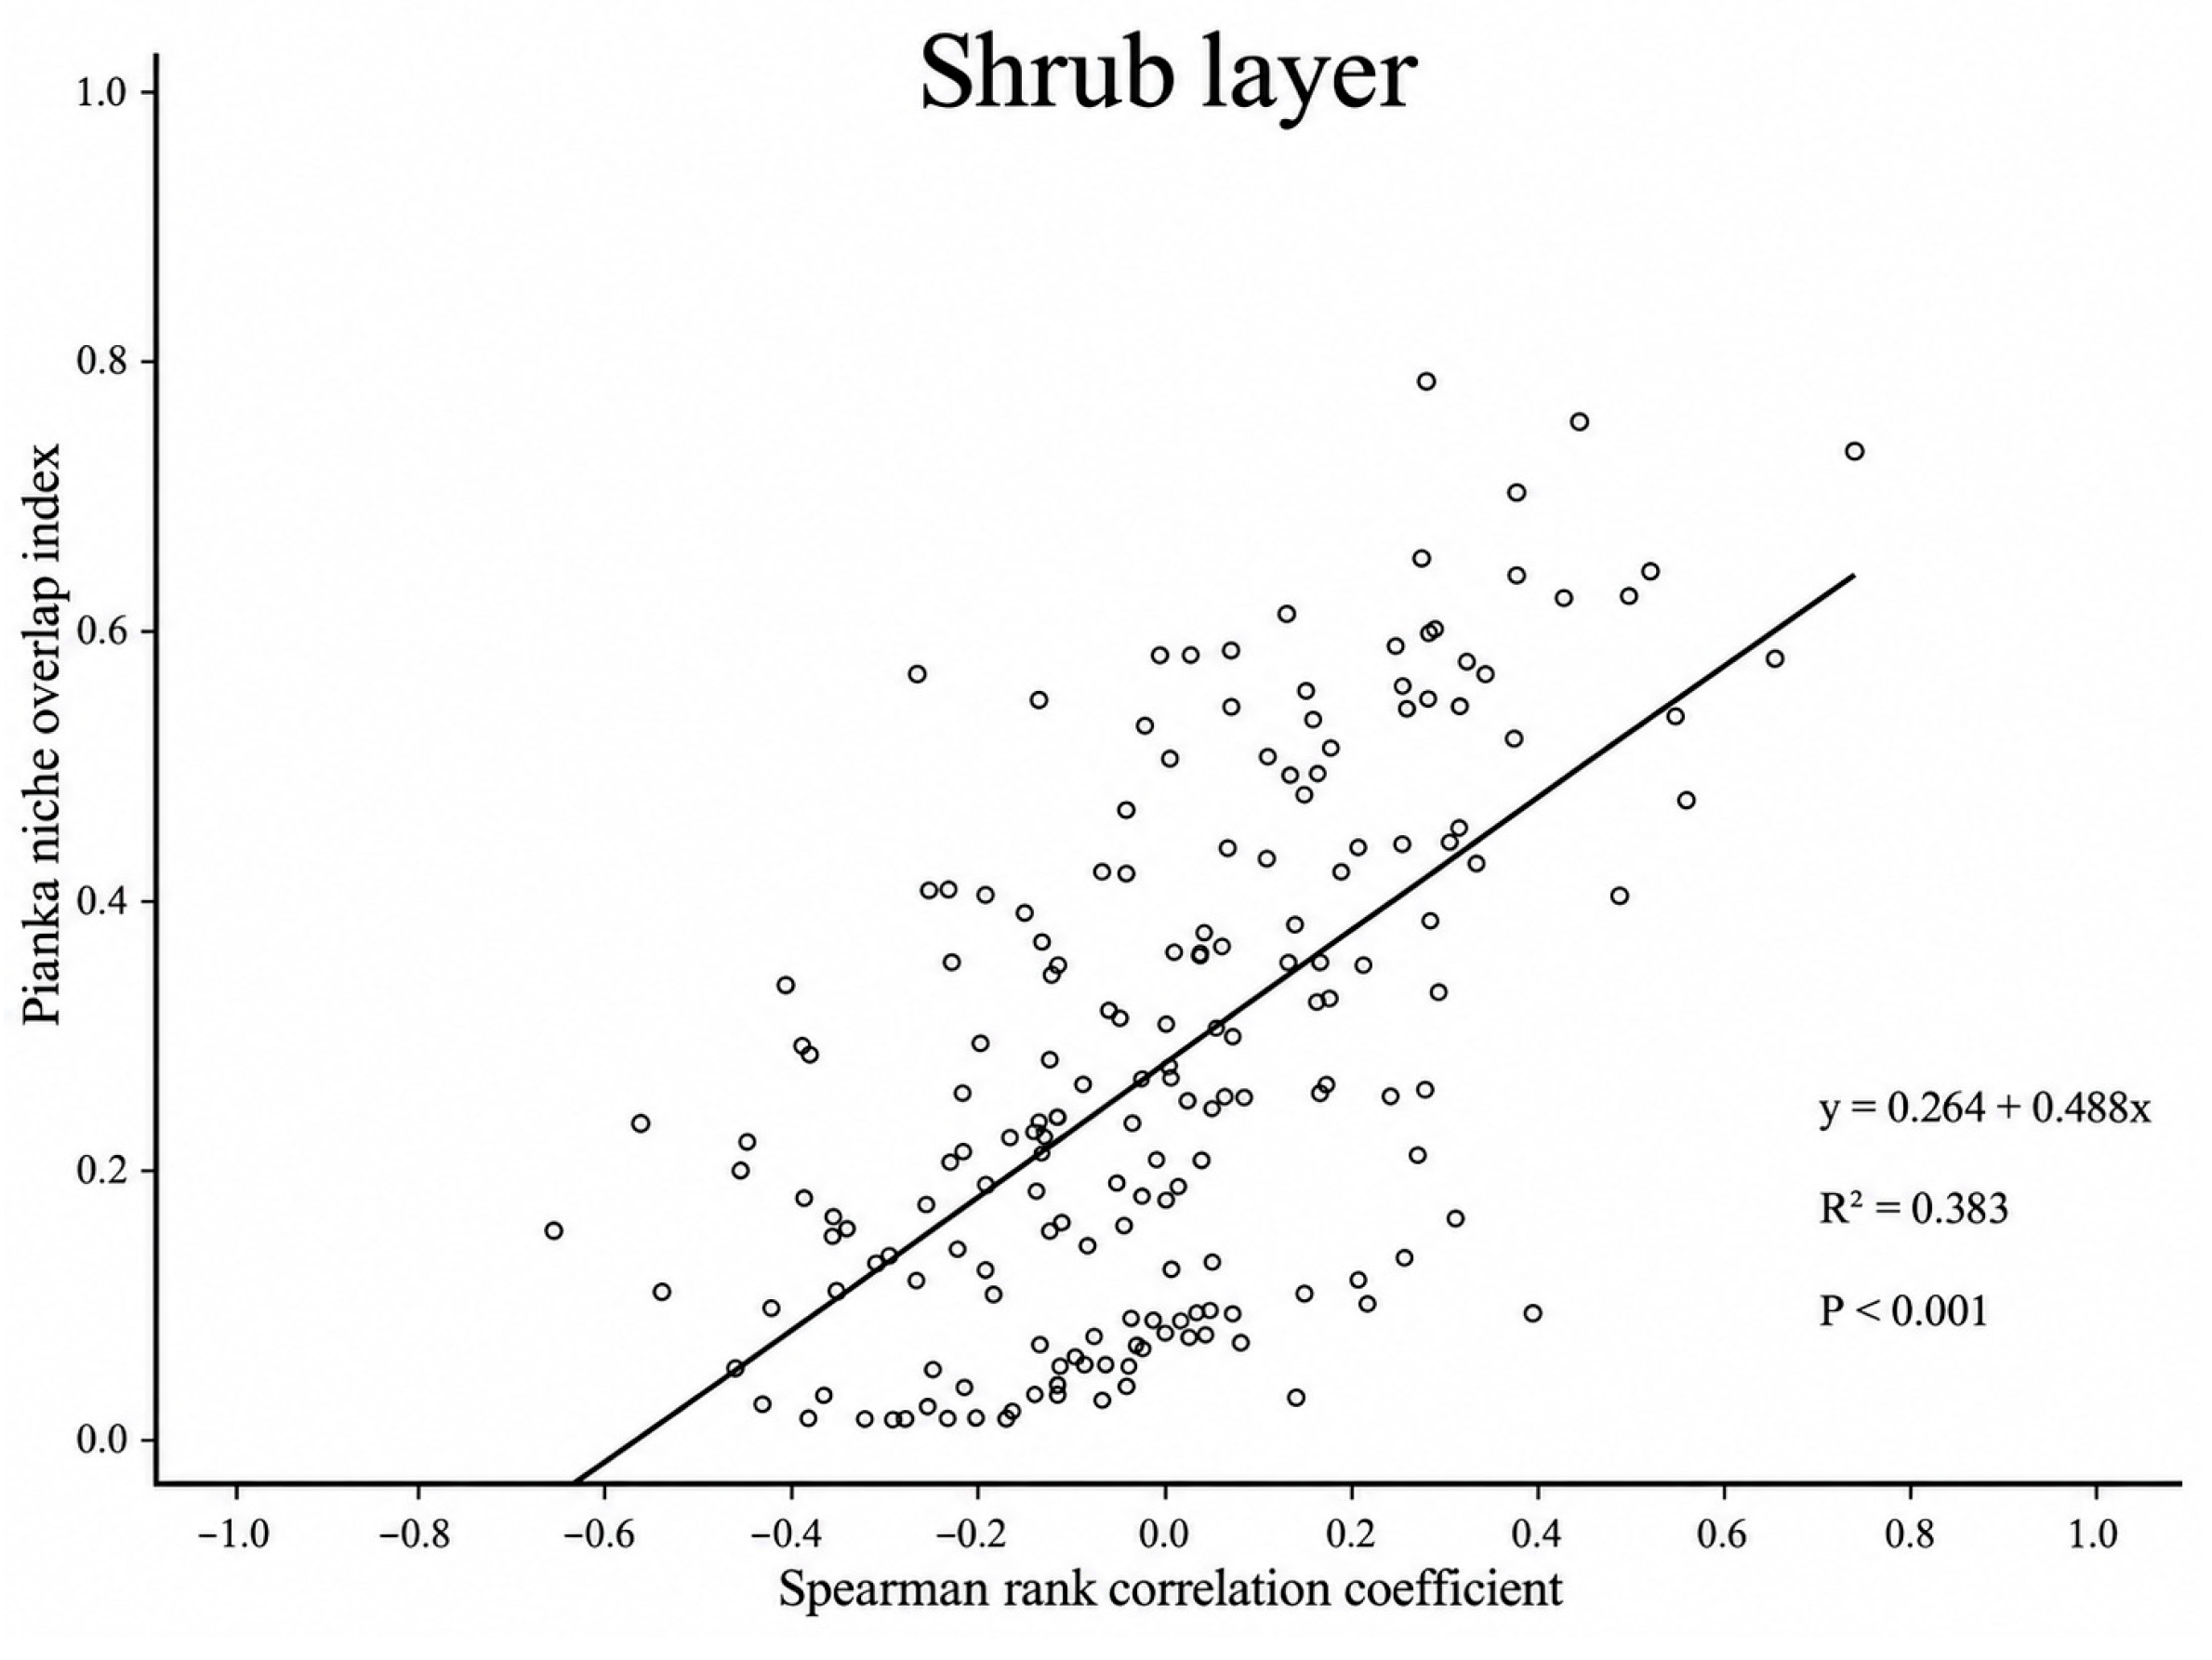
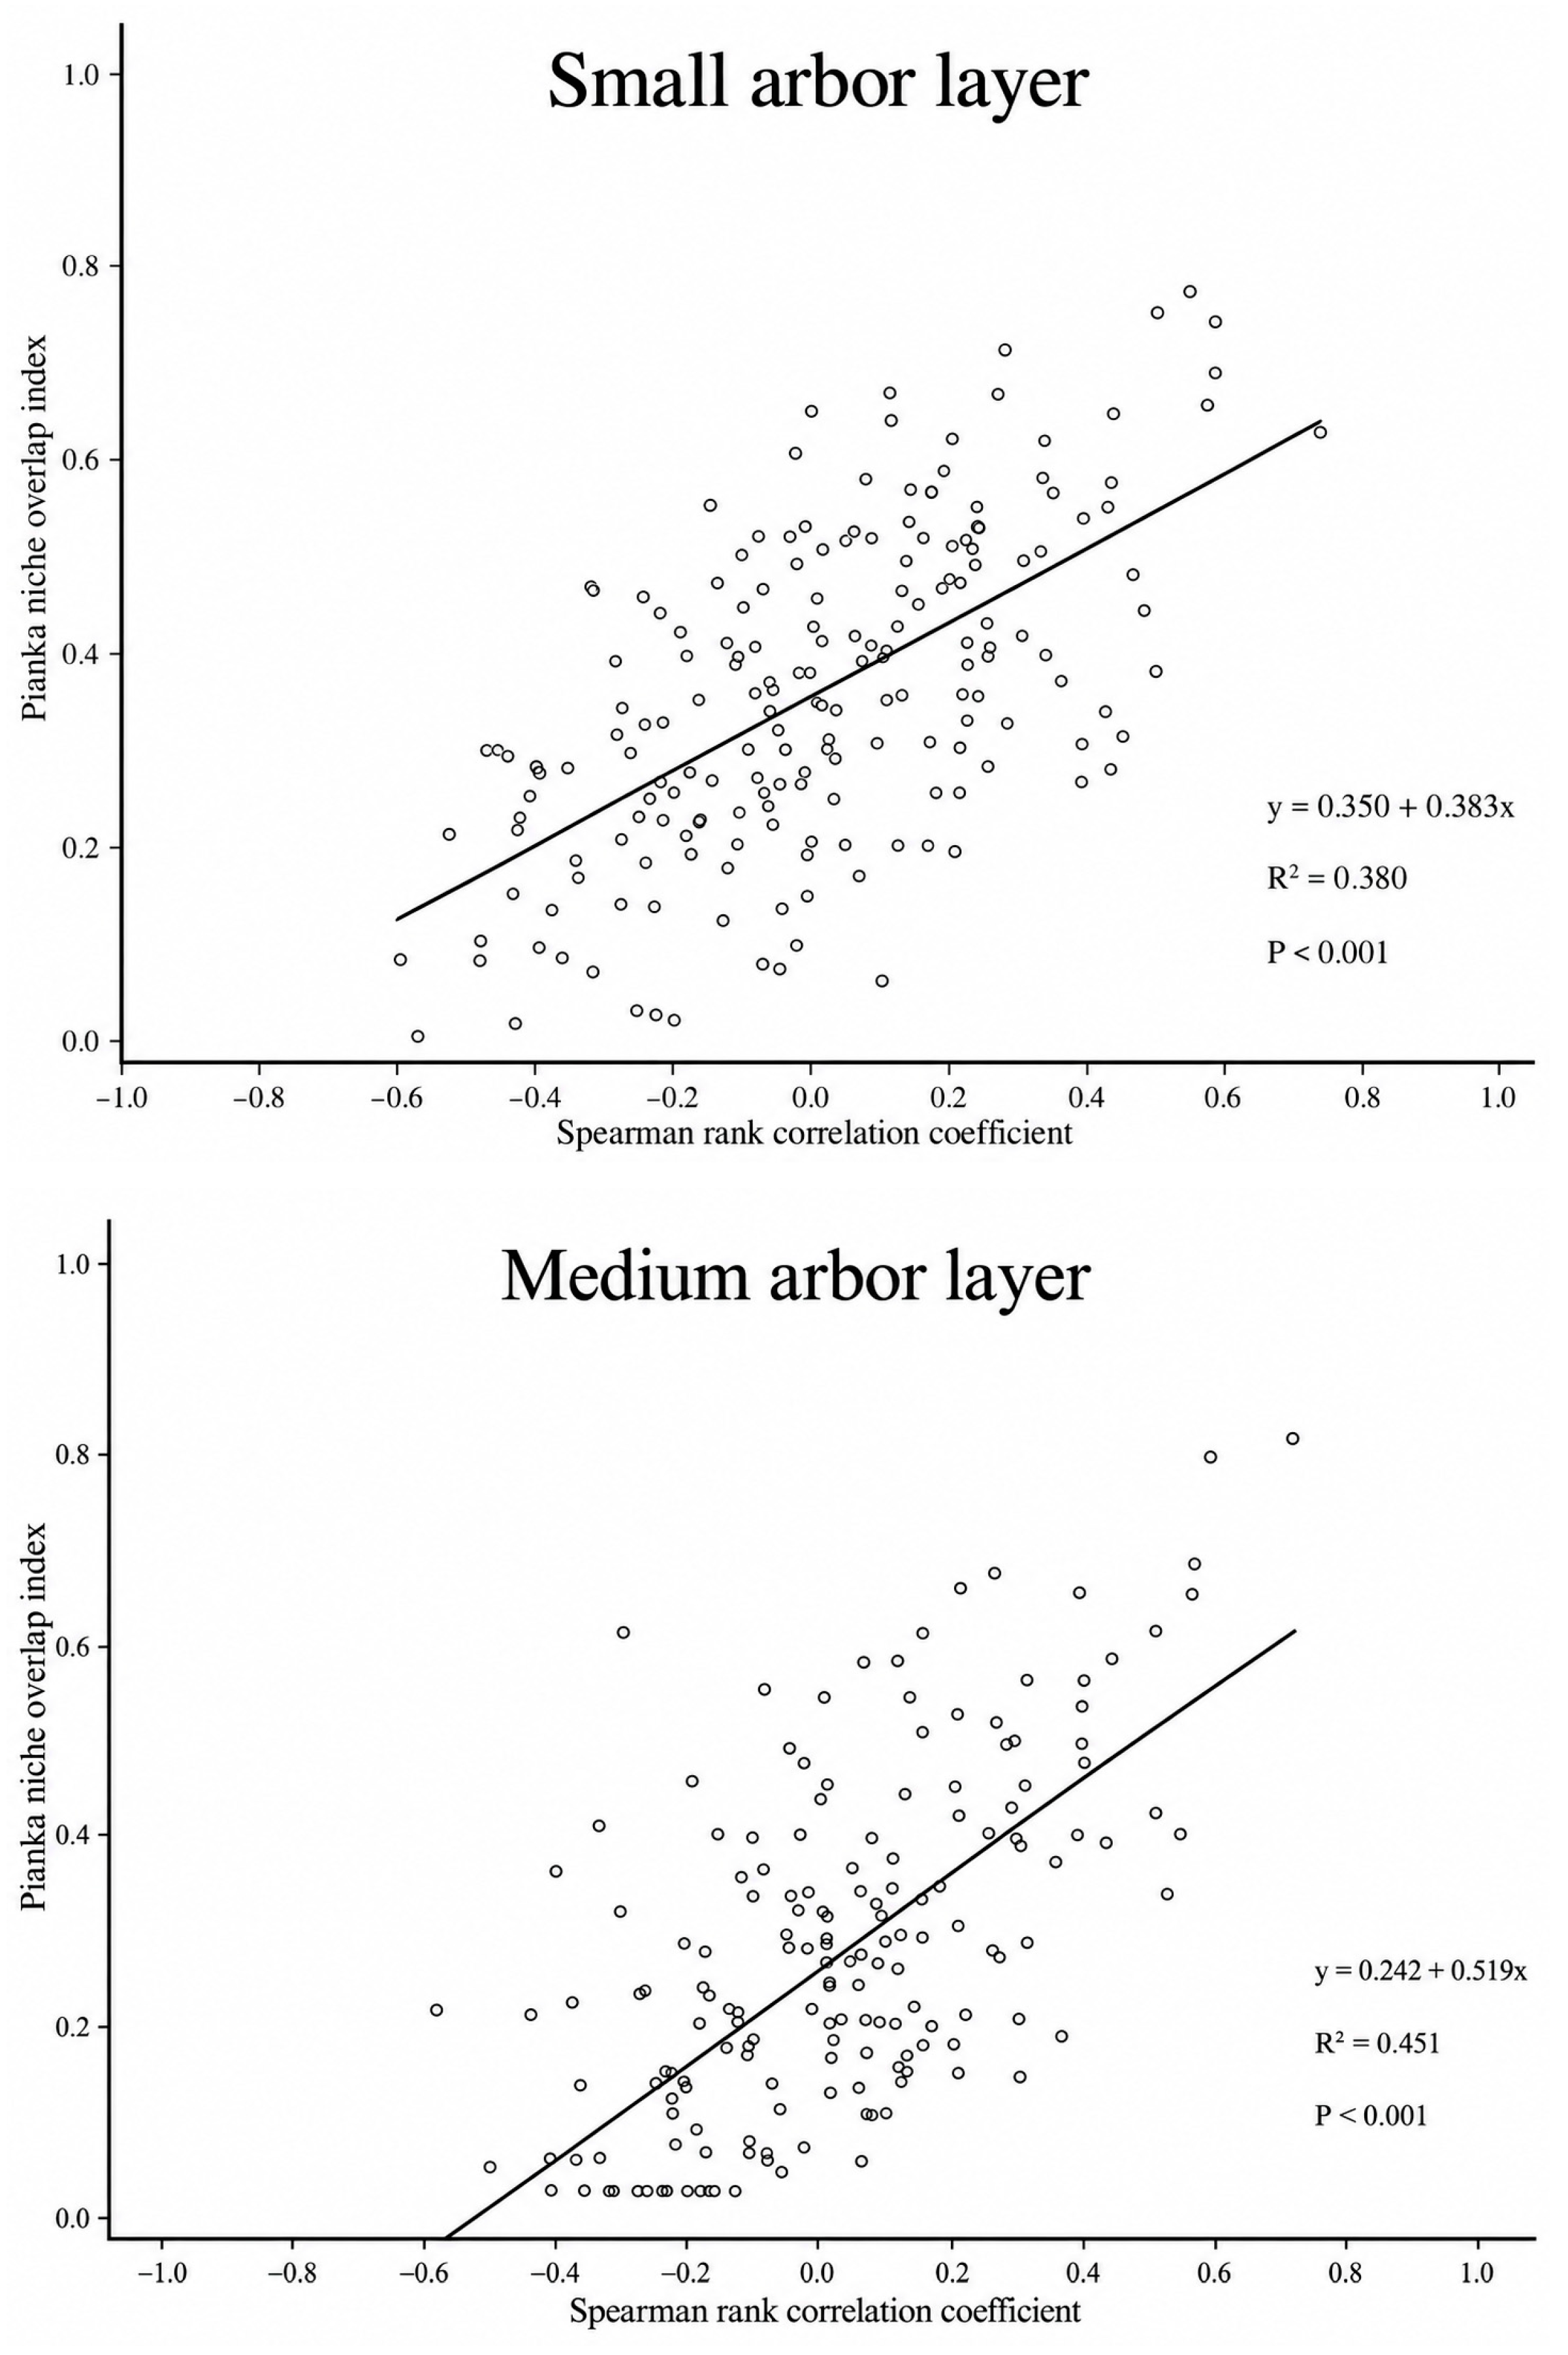
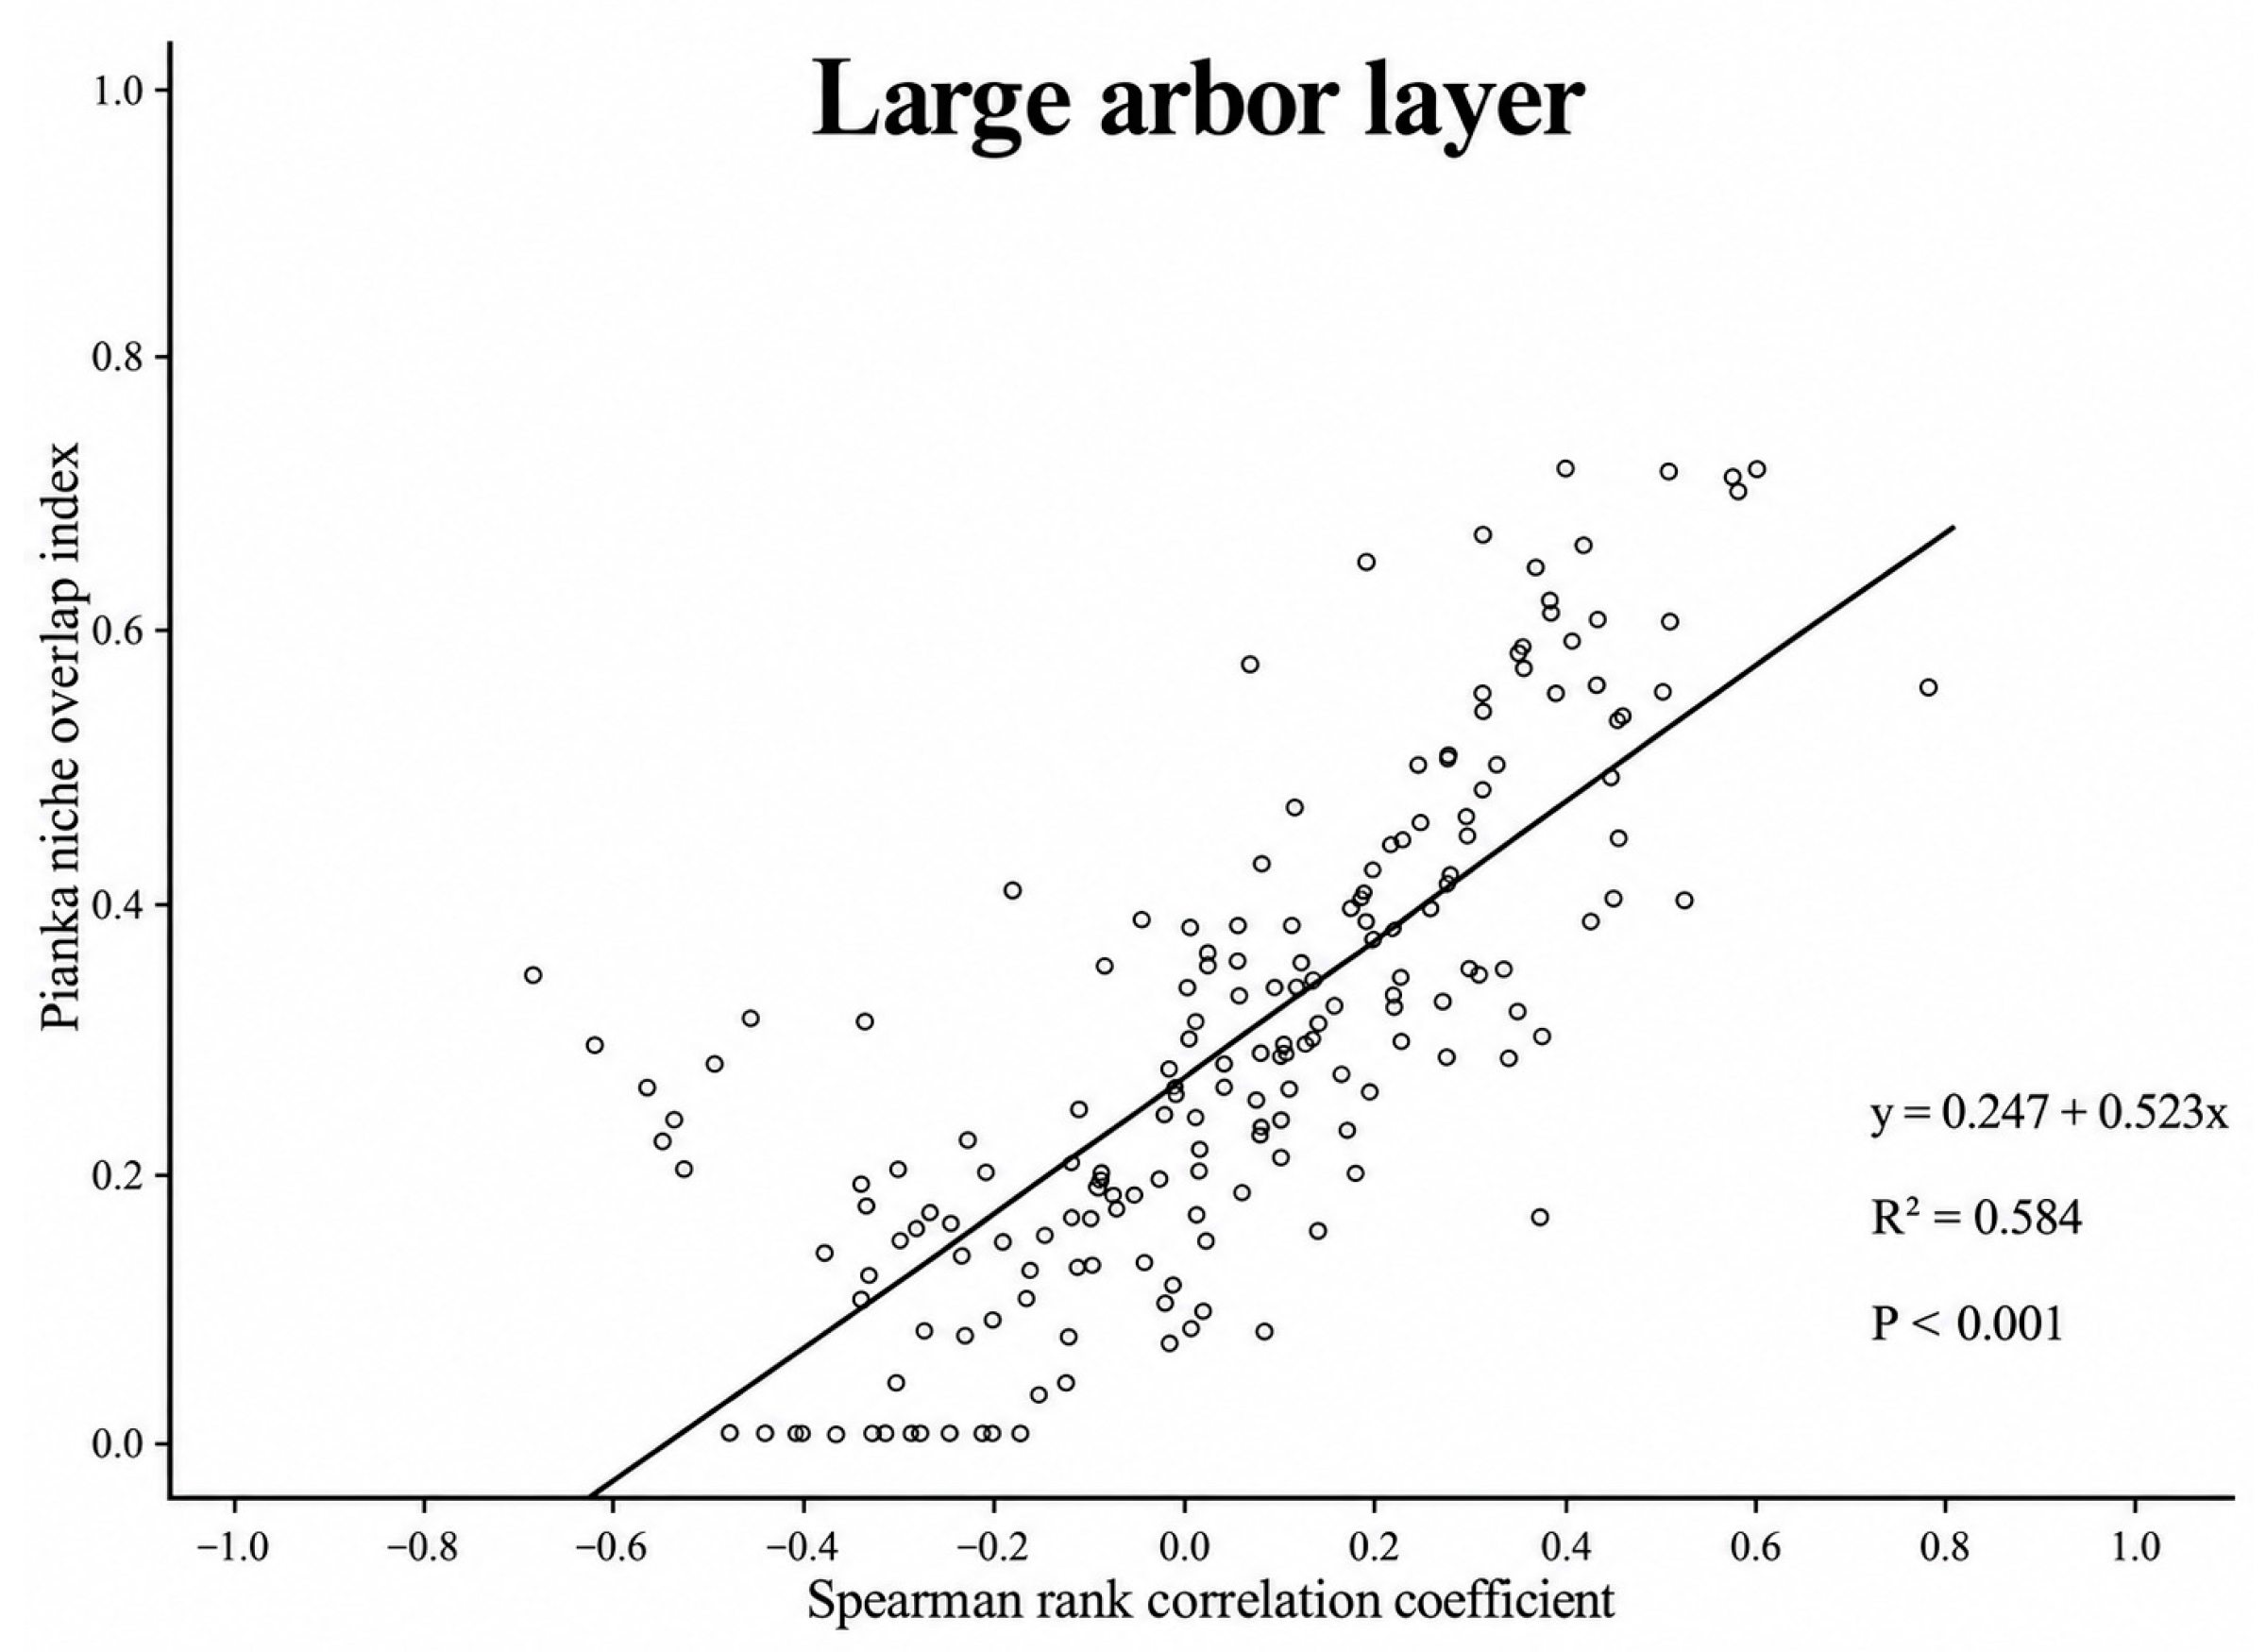
To examine the relationship between niche overlap and interspecific correlations, we extracted Pianka’s niche overlap index (Oik) and the corresponding Spearman’s rank correlation coefficient (ρ) for each of the 190 unique species pairs within each forest layer. Using ρ as the independent variable and Oik as the dependent variable, we performed ordinary least-squares linear regression separately for each forest layer in R version 4.3.2. Regression slopes, coefficients of determination (R2), and p-values were calculated to characterize the linear relationship between these two indices.
Data organization and importance-value calculations were performed using Microsoft Excel 2016. Ecological indices and statistical analyses were calculated using R version 4.3.2. Figures were prepared using Origin 2021 and R version 4.3.2.
3. Results
3.1. Importance Values and Niche Breadths Across Forest Strata
The composition of dominant species and their importance-value rankings varied among forest layers. Vatica mangachapoi ranked first in importance value in the large, medium, and small arbor layers and second in the shrub layer, with only a small difference from the first-ranked Garcinia oblongifolia. This indicates that Vatica mangachapoi maintained a high level of relative dominance across all four forest layers. Apart from Vatica mangachapoi, the principal dominant species varied among forest layers. Croton laevigatus, Machilus chinensis, and Garcinia oblongifolia had relatively high importance values in the large arbor layer; Lithocarpus corneus, Diospyros cathayensis, and Croton laevigatus were prominent in the medium arbor layer; Lithocarpus corneus, Koilodepas hainanense, Diospyros cathayensis, and Psychotria asiatica predominated in the small arbor layer; and Garcinia oblongifolia, Psychotria asiatica, and Machilus chinensis had relatively high importance values in the shrub layer.
Species rankings based on importance value did not fully correspond to those based on niche breadth across forest layers. Vatica mangachapoi had the highest values for both niche-breadth indices in all four forest layers, with Bl values of 13.93, 13.13, 12.99, and 13.73 in the large arbor layer, medium arbor layer, small arbor layer, and shrub layer, respectively, consistent with its high importance-value rankings across all layers. In contrast, the rankings of associated species based on importance value did not consistently correspond to their rankings based on niche breadth. In the small arbor layer, Koilodepas hainanense ranked third in importance value but only nineteenth in Bl, whereas Garcinia oblongifolia ranked eleventh in importance value but second in Bl, showing marked differences between importance-value and niche-breadth rankings.
The correspondence between importance-value and niche-breadth rankings also varied among forest layers. For example, Garcinia oblongifolia ranked second in Bl in the large arbor layer, medium arbor layer, and small arbor layer, but fell to seventeenth in the shrub layer, despite ranking first in importance value in that layer. Overall, Vatica mangachapoi consistently maintained high importance values and broad niches across forest layers, whereas community dominance and niche breadth were not consistently aligned among the associated dominant species.
3.2. Niche Overlap
As shown in Figure 2, niche overlap was widespread among dominant species within all four forest layers. Among the 190 possible species pairs in each layer, 175 (92.11%), 189 (99.47%), 156 (82.11%), and 168 (88.42%) pairs exhibited nonzero niche overlap in the shrub layer, small arbor layer, medium arbor layer, and large arbor layer, respectively. However, species pairs with high niche overlap (Oik ≥ 0.60) were relatively uncommon, numbering 10 (5.26%), 15 (7.89%), 10 (5.26%), and 13 (6.84%), respectively. The corresponding numbers of non-overlapping species pairs were 15 (7.89%), 1 (0.53%), 34 (17.89%), and 22 (11.58%), respectively. The small arbor layer exhibited the most widespread niche overlap and the highest number of highly overlapping species pairs, whereas the medium arbor layer had the highest proportion of non-overlapping pairs.
Figure 2.
Pianka’s niche overlap indices of dominant tree species in different forest layers. Each cell represents the pairwise Pianka niche overlap index between two species. Species abbreviations correspond to those listed in Table 2. Higher values indicate greater similarity in species’ importance-value distributions across plots. Niche overlap was operationally classified as low (0 ≤ Oik < 0.30), moderate (0.30 ≤ Oik < 0.60), or high (0.60 ≤ Oik ≤ 1.00).
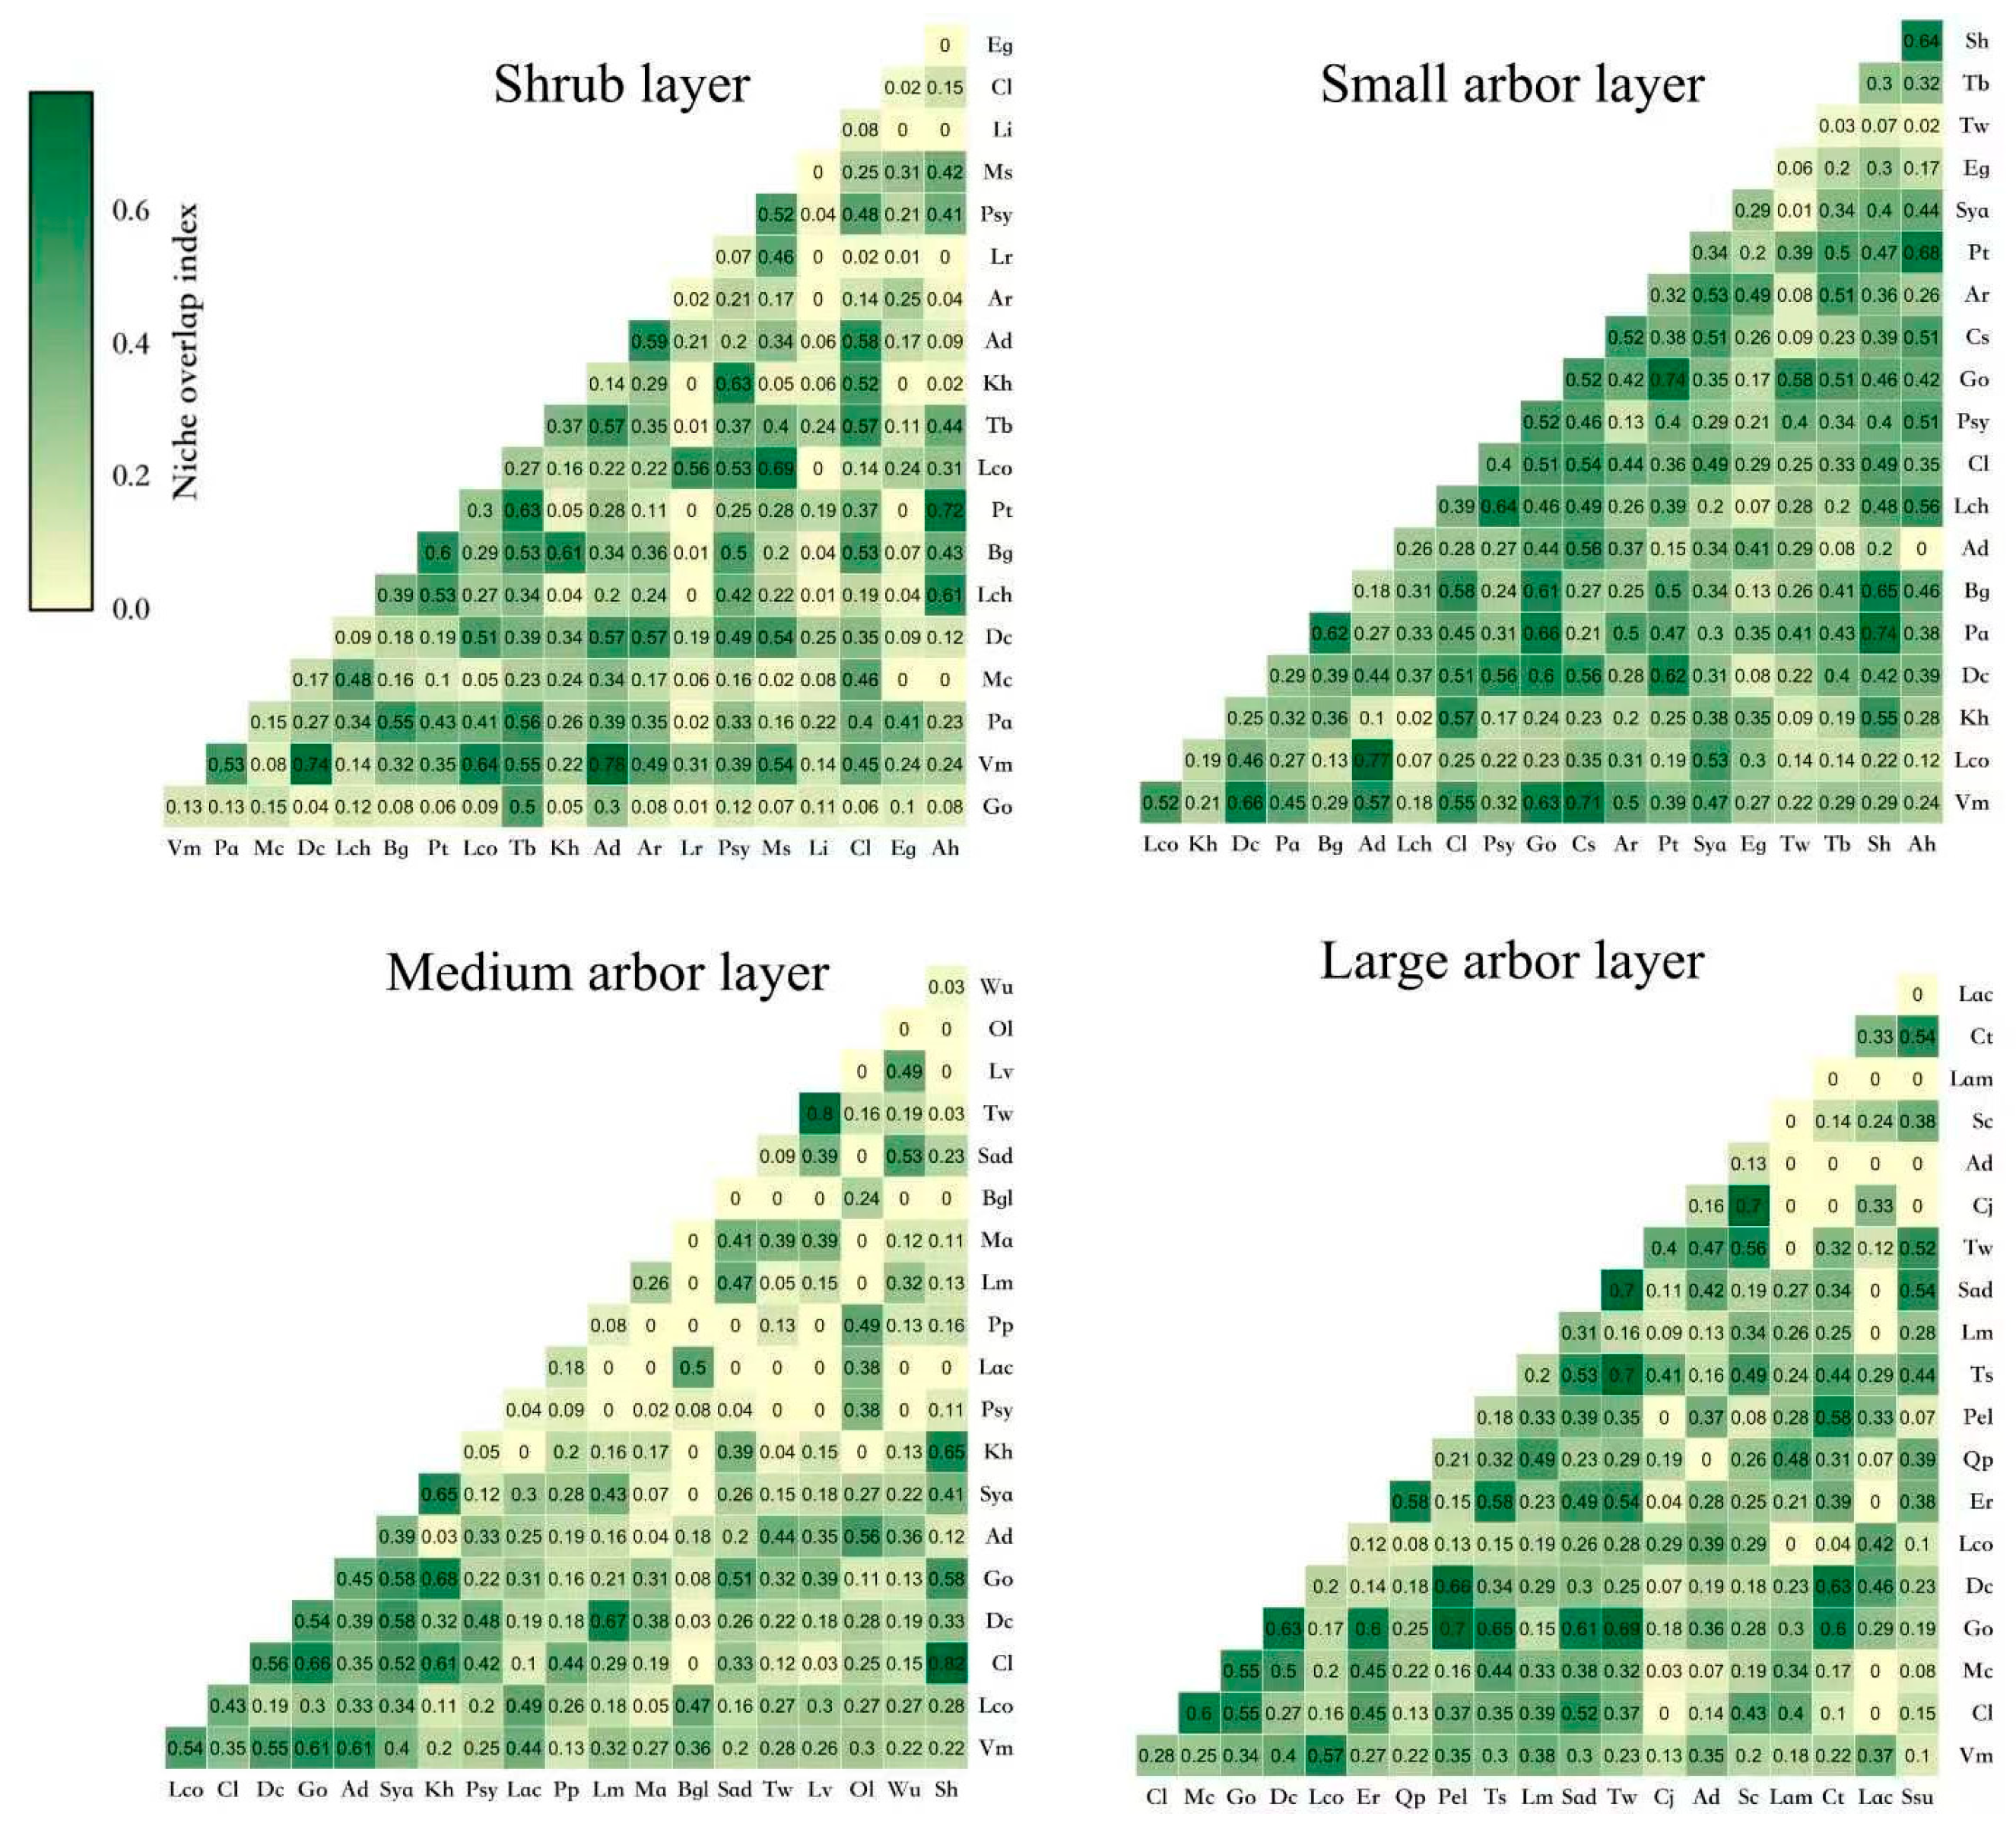
Table 2.
Importance values and niche breadths of dominant tree species across different forest layers.
The species pairs with the highest niche overlap differed among forest layers. In the shrub layer, the highest niche overlap was observed between Aporosa dioica and Vatica mangachapoi (Oik = 0.78); in the small arbor layer, between Aporosa dioica and Lithocarpus corneus (0.77); and in the medium arbor layer, between Syzygium hancei and Croton laevigatus (0.82). In the large arbor layer, four species pairs shared the highest recorded niche overlap value of 0.70: Peltophorum dasyrrhachis–Garcinia oblongifolia, Tarennoidea wallichii–Toxicodendron succedaneum, Tarennoidea wallichii–Symplocos adenophylla, and Semiliquidambar cathayensis–Castanopsis jucunda.
Species pairs involving Vatica mangachapoi with high niche overlap were found only in the shrub layer, small arbor layer, and medium arbor layer, with 3, 3, and 2 pairs, respectively; none were detected in the large arbor layer. Among these, Diospyros cathayensis exhibited high niche overlap with Vatica mangachapoi in both the shrub and small arbor layers, Garcinia oblongifolia in both the small and medium arbor layers, and Aporosa dioica in both the shrub and medium arbor layers. These high-overlap relationships indicate similar plot-level distribution patterns between Vatica mangachapoi and some associated species, possibly reflecting similar responses to local environmental conditions.
3.3. Interspecific Association Patterns Across Forest Layers
3.3.1. Overall Association
As shown in Table 3, the variance ratios (VRs) for the shrub, small arbor, medium arbor, and large arbor layers were 1.88, 2.82, 1.82, and 3.51, respectively, while the corresponding W values were 37.61, 56.41, 36.33, and 70.15. The VR values exceeded 1 in all four forest layers, and all W values exceeded the upper limit (34.17) of the two-sided 95% acceptance interval of the χ2 distribution with 20 degrees of freedom, indicating significant positive overall interspecific associations in all four layers. The associations were highly significant in the large and small arbor layers (p < 0.001) and significant in the medium arbor and shrub layers (p < 0.05). The large arbor layer exhibited the highest VR value, whereas the medium arbor layer had the lowest.
Table 3.
Overall interspecific associations of dominant species across forest layers.
3.3.2. Pairwise Interspecific Association Analysis
In this study, dominant species in all four forest layers of the Bawangling community exhibited significant positive overall associations. Association coefficient (AC) analysis further showed that positive pairwise associations predominated in each layer, indicating an overall tendency toward positive co-occurrence among dominant species. However, only 29 species pairs reached nominal significance in two-sided Fisher’s exact tests, and only three pairs retained significant positive Spearman correlations after Benjamini–Hochberg false discovery rate (BH-FDR) correction. These findings indicate that significant positive overall associations and a predominance of positive pairwise association coefficients do not necessarily imply statistically significant associations for most individual species pairs.
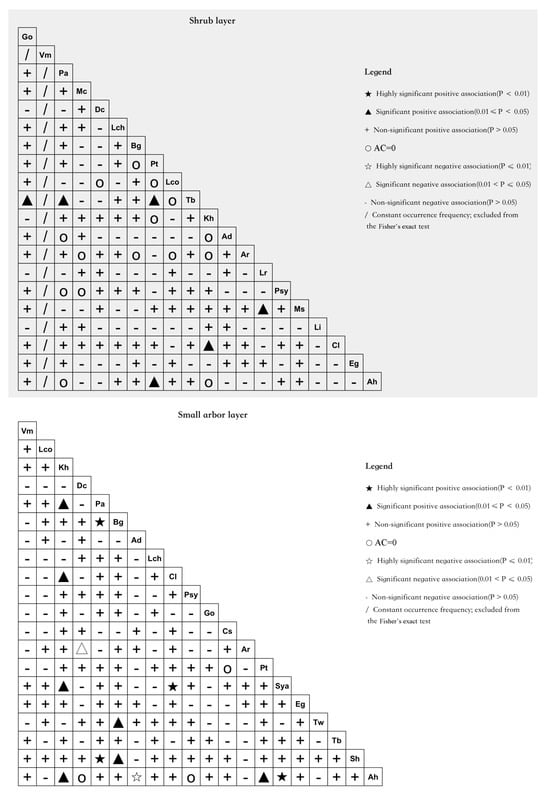
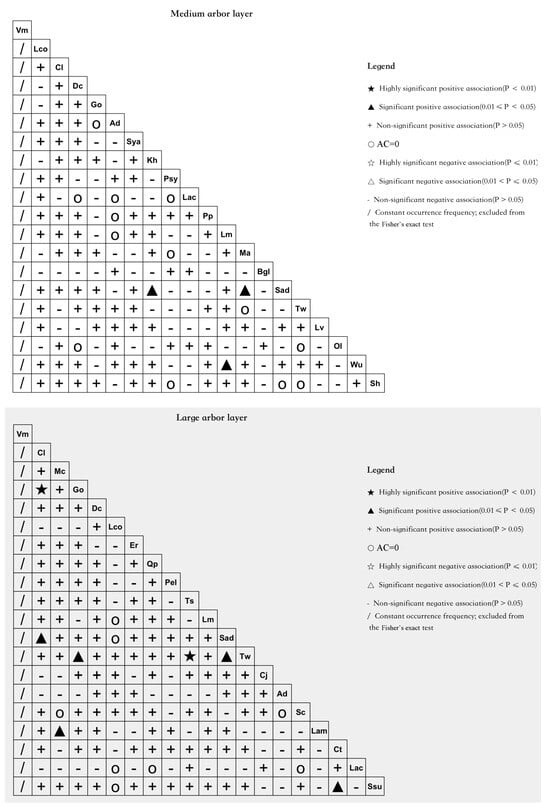
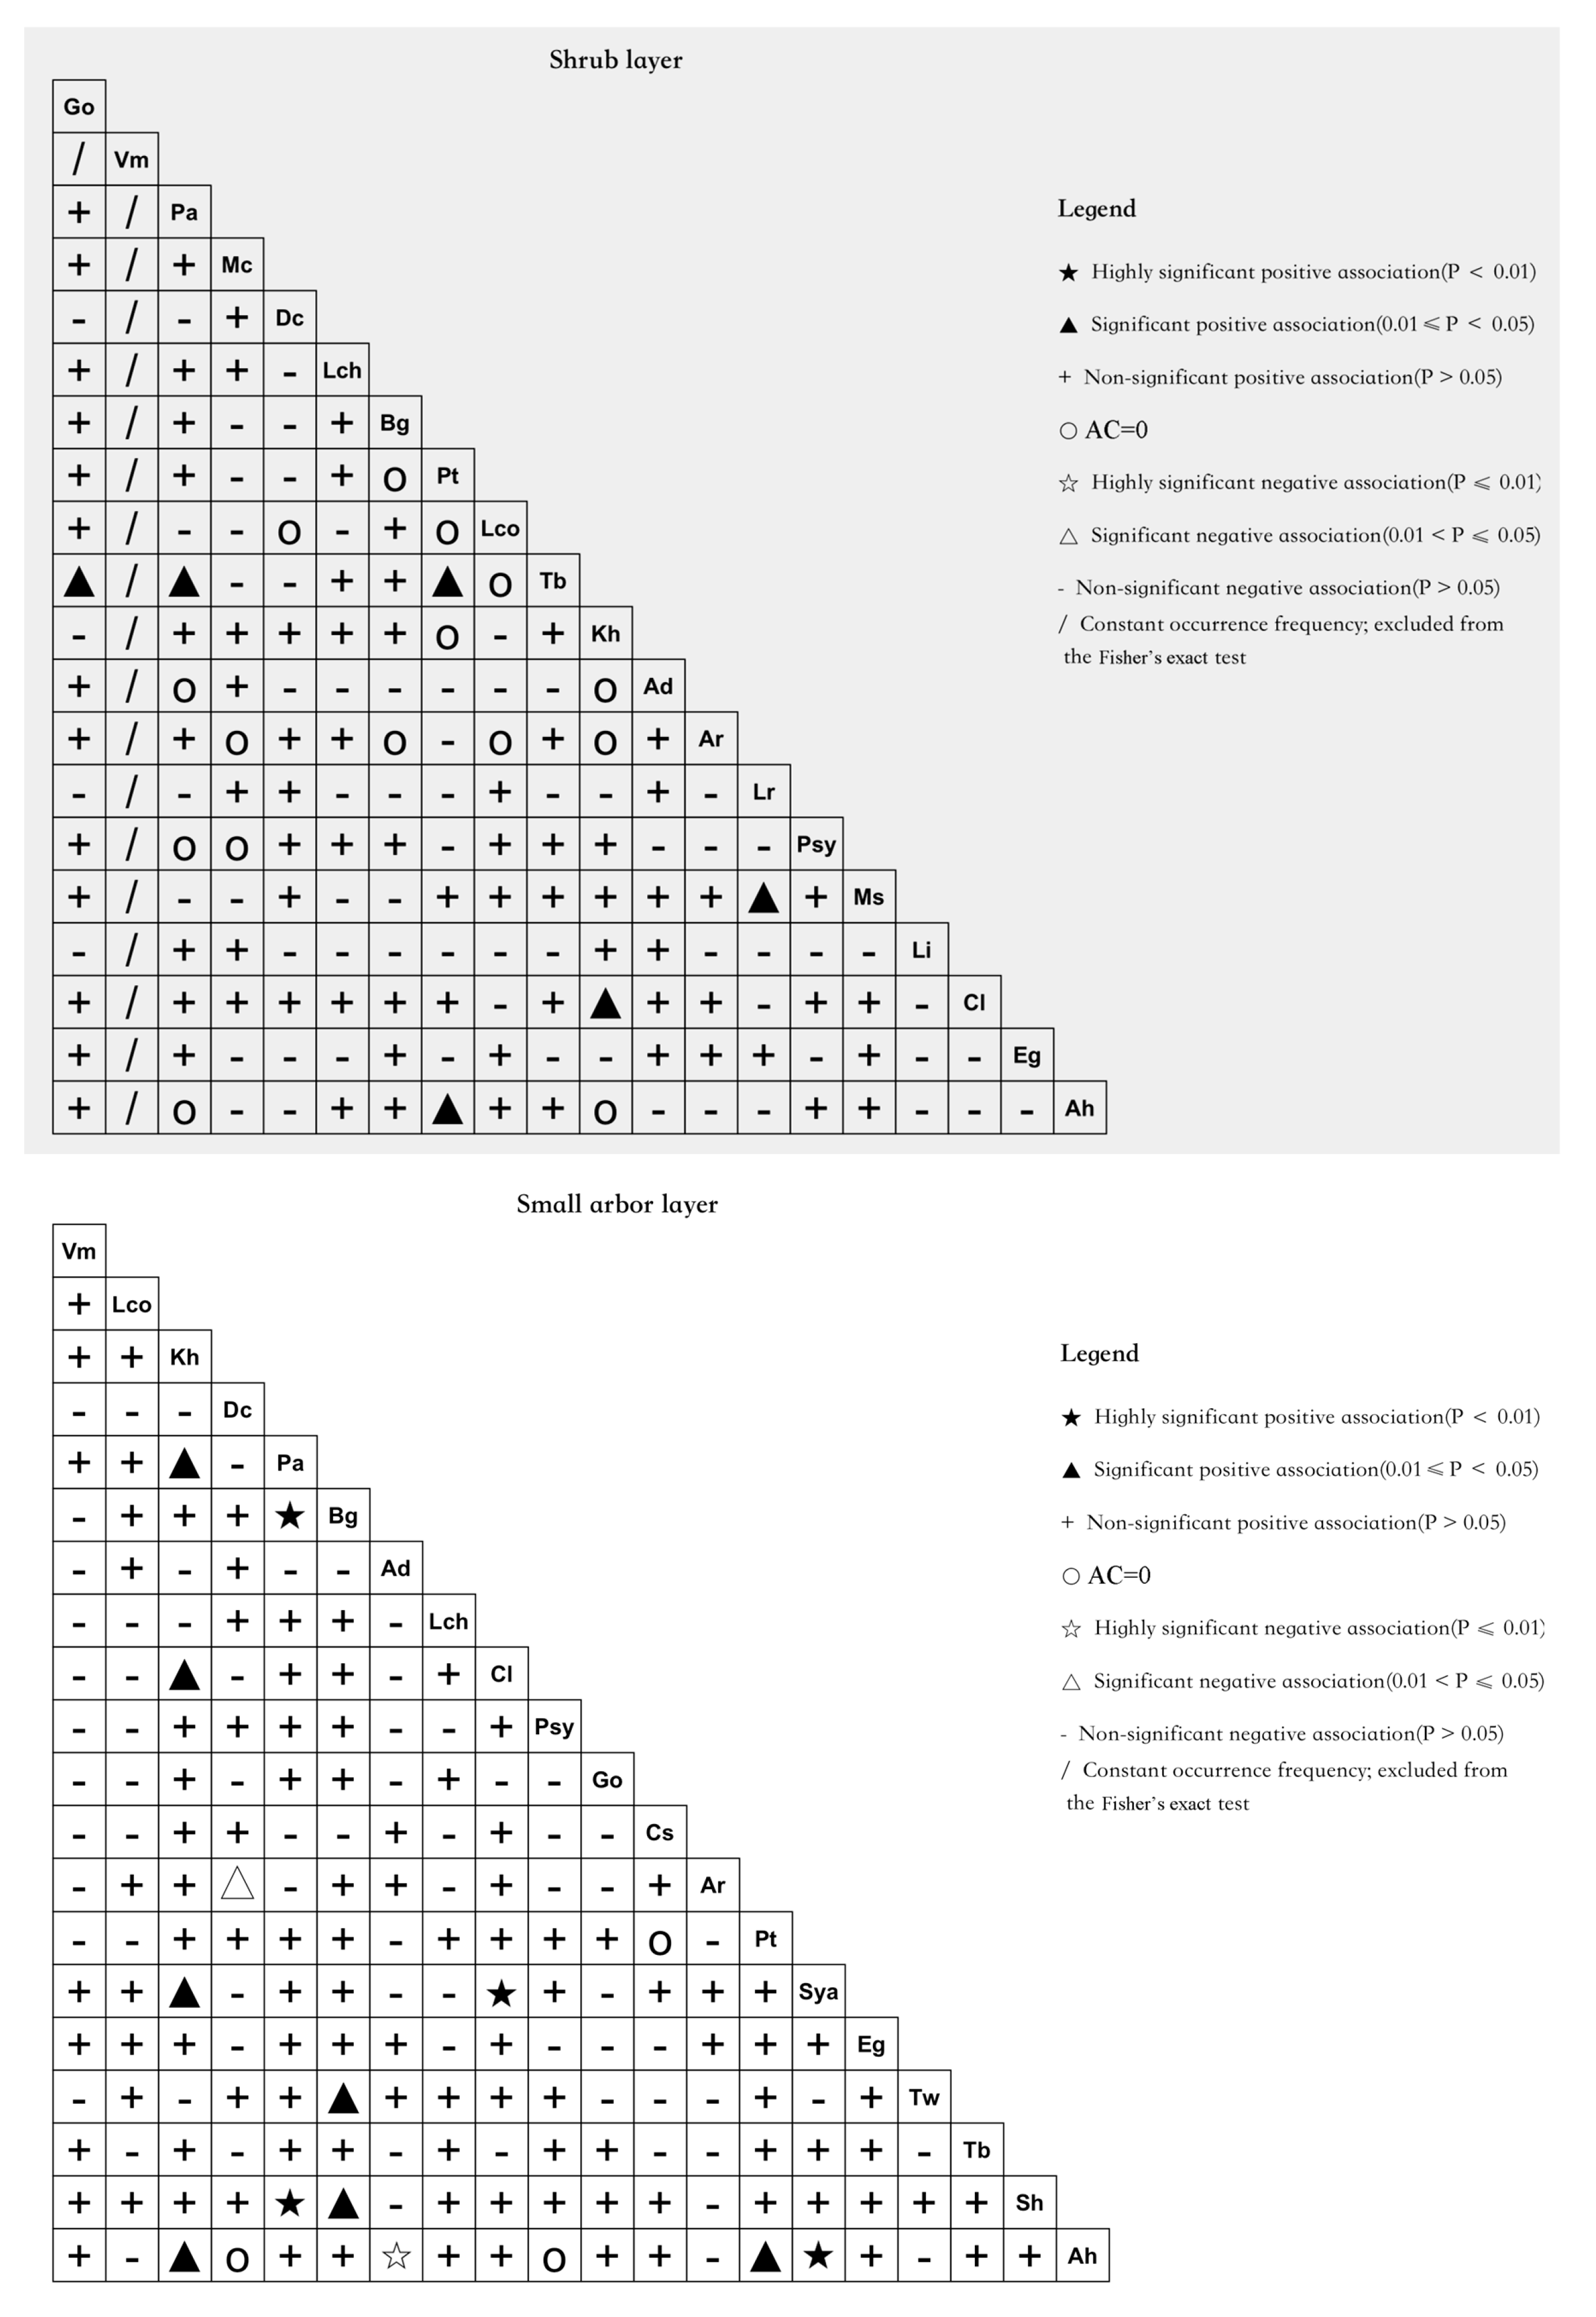
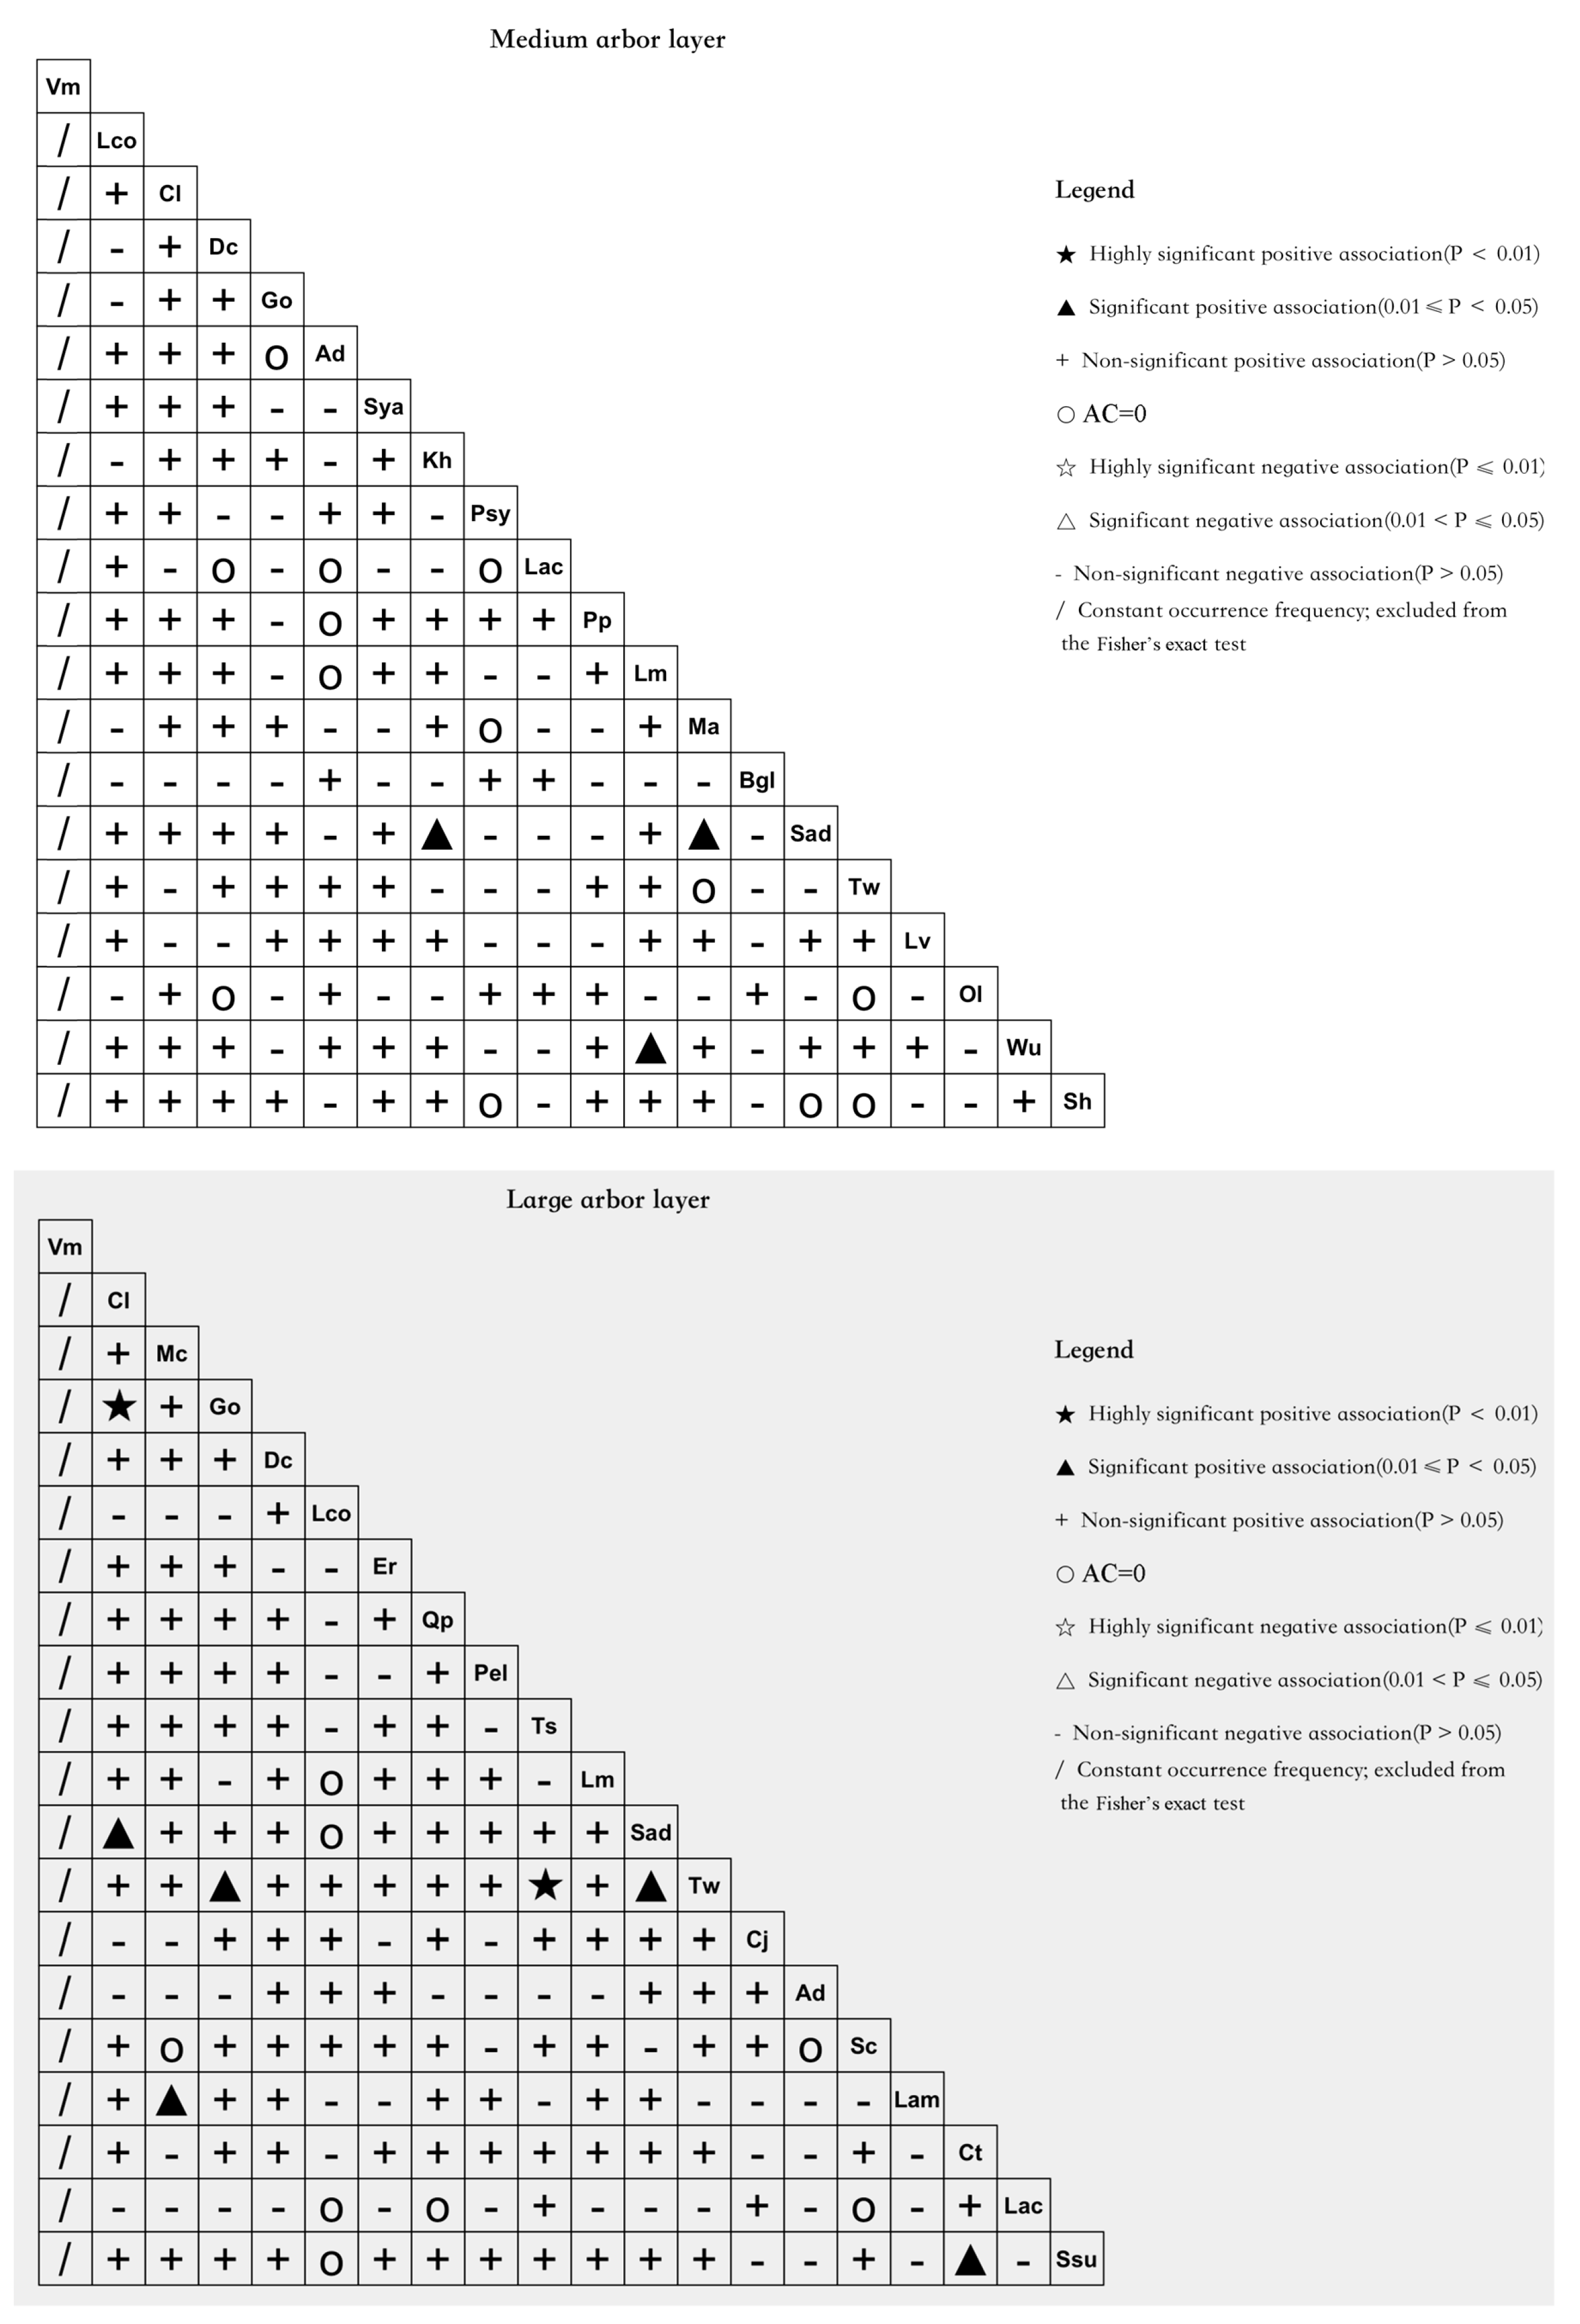
Based on the variation in species occurrence across plots, 171 species pairs were included in two-sided Fisher’s exact tests in each of the large arbor, medium arbor, and shrub layers, whereas all 190 pairs were included in the small arbor layer. As shown in Figure 3 and Table 4, association coefficient (AC) analysis showed that positive pairwise associations predominated in all four forest layers, although the proportions of positive and negative associations varied among layers.
Figure 3.
Pairwise interspecific associations based on association coefficients (ACs) and two-sided Fisher’s exact tests across forest layers.
Table 4.
Summary of pairwise interspecific associations based on association coefficients and two-sided Fisher’s exact tests across forest layers.
The shrub, small arbor, medium arbor, and large arbor layers contained 88, 115, 92, and 111 positively associated species pairs, accounting for 51.46%, 60.53%, 53.80%, and 64.91% of the valid pairs, respectively. The corresponding numbers of negatively associated pairs were 68, 72, 66, and 52, representing 39.77%, 37.89%, 38.60%, and 30.41%, respectively. The large arbor layer had the highest proportion of positive associations, whereas the shrub layer had the lowest. Two-sided Fisher’s exact tests identified 6, 13, 3, and 7 significantly associated pairs in the shrub, small arbor, medium arbor, and large arbor layers, respectively, with positive associations accounting for most significant pairs.
The large arbor layer had the highest proportion of positive associations, with highly significant positive associations observed between Tarennoidea wallichii and Toxicodendron succedaneum and between Garcinia oblongifolia and Croton laevigatus. In the medium arbor layer, only three pairs showed significant positive associations: Koilodepas hainanense–Symplocos adenophylla, Lithocarpus megalophyllus–Wendlandia uvariifolia, and Mallotus anomalus–Symplocos adenophylla. By contrast, the small arbor layer contained the greatest number of significantly associated pairs, including highly significant positive associations between Psychotria asiatica and Brassaiopsis glomerulata and between Croton laevigatus and Syzygium acuminatissimum, as well as significant negative associations between Aporosa dioica and Aidia henryi and between Diospyros cathayensis and Alchornea rugosa, indicating variation in the direction of pairwise associations within this layer.
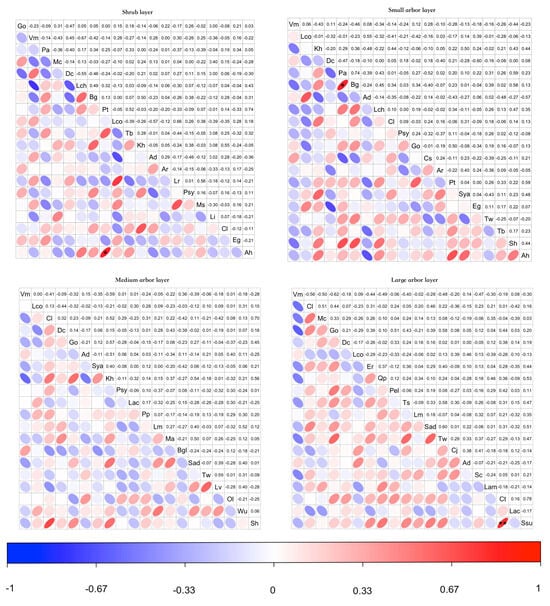
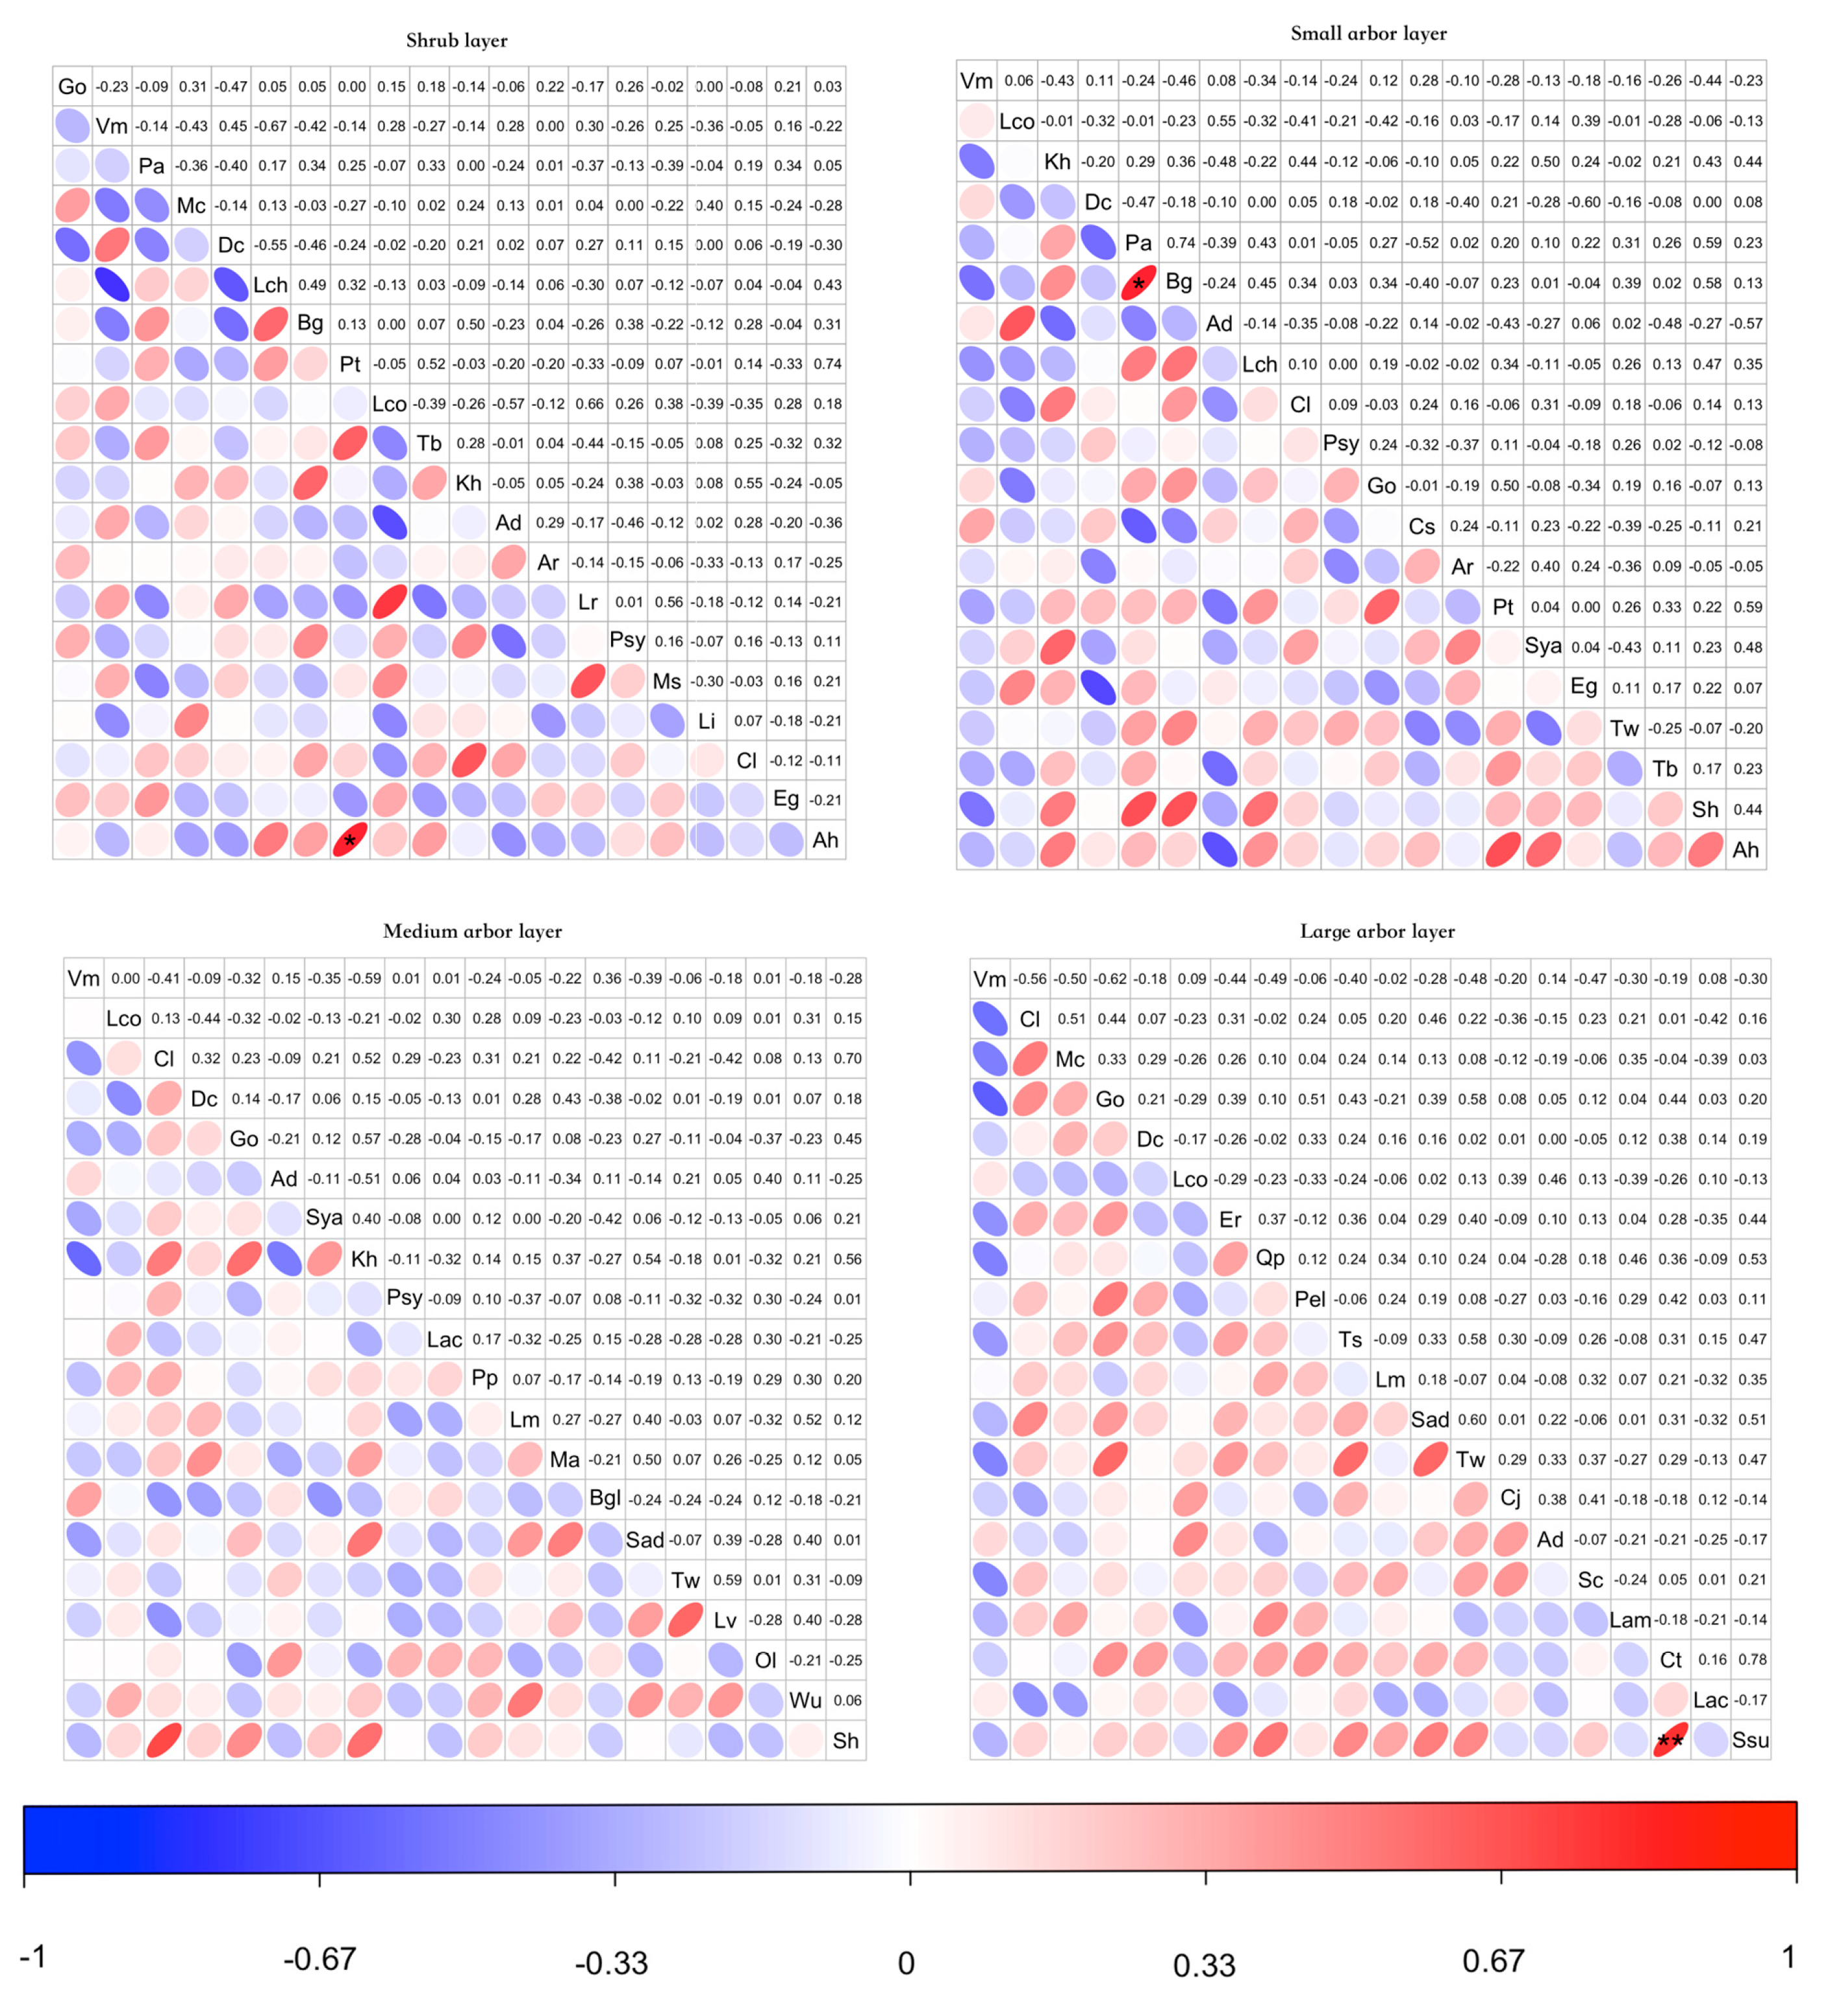
As shown in Figure 4, Spearman’s rank correlation analysis revealed differences in the numbers of positively and negatively correlated species pairs among forest layers. The shrub layer contained 87 positive and 103 negative correlations, whereas the small arbor layer contained 96 positive and 94 negative correlations. In the medium arbor layer, negative correlations slightly outnumbered positive correlations (96 vs. 94), while the large arbor layer showed a predominance of positive correlations (118 vs. 72). The corresponding positive-to-negative correlation ratios were 0.84, 1.02, 0.98, and 1.64, respectively. After Benjamini–Hochberg false discovery rate (BH-FDR) correction, only one significantly positive correlation remained in each of the shrub, small arbor, and large arbor layers, and none in the medium arbor layer. These were Aidia henryi–Prismatomeris tetrandra in the shrub layer (PFDR = 0.0320), Brassaiopsis glomerulata–Psychotria asiatica in the small arbor layer (PFDR = 0.0360), and Castanopsis tonkinensis–Schima superba in the large arbor layer (PFDR = 0.0080). The last pair was highly significant (PFDR < 0.01). No significant negative correlations or significant correlations involving Vatica mangachapoi were detected in any forest layer after BH-FDR correction.
Figure 4.
Spearman rank correlation analysis of dominant tree species across forest layers. The (upper) triangle displays the numerical Spearman correlation coefficients (ρ), whereas the (lower) triangle represents the corresponding correlations graphically. Red indicates positive correlations and blue indicates negative correlations, with color intensity and ellipse shape reflecting the strength of the correlations. Asterisks indicate correlations that remained significant after Benjamini–Hochberg false discovery rate (BH-FDR) correction (*, adjusted p < 0.05; **, adjusted p < 0.01). Species abbreviations correspond to those listed in Table 2.
3.4. Regression Analysis of Niche Overlap and Interspecific Correlations
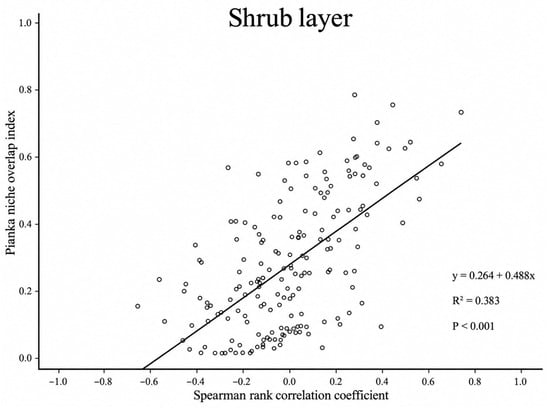
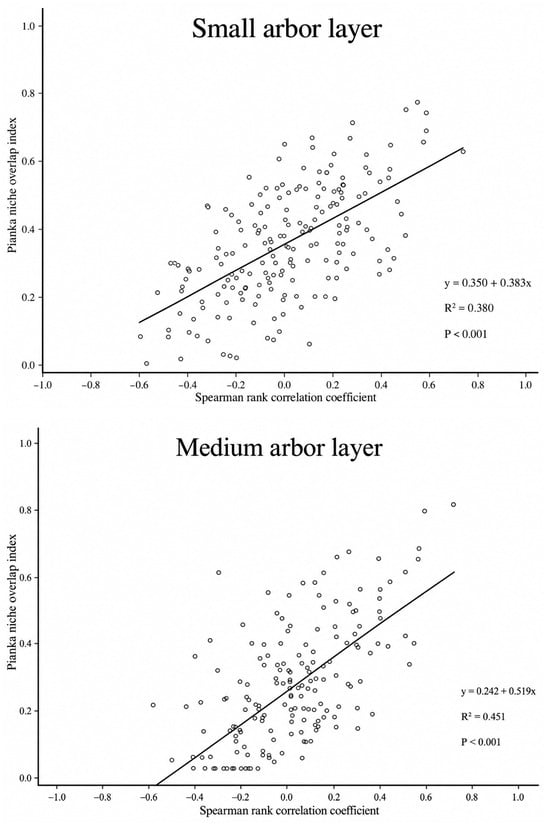
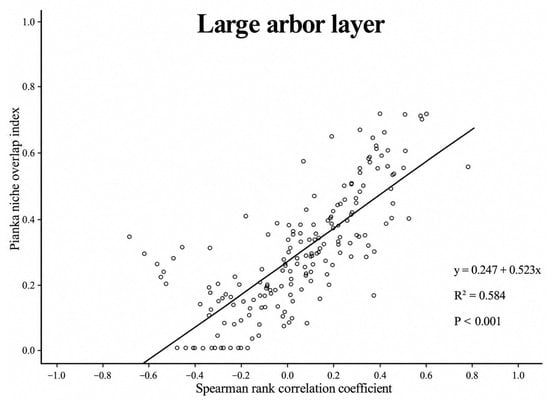
As shown in Figure 5, positive linear relationships were observed between Pianka’s niche overlap index and Spearman’s rank correlation coefficient in all four forest layers (p < 0.001). The regression slopes for the shrub layer, small arbor layer, medium arbor layer, and large arbor layer were 0.488, 0.383, 0.519, and 0.523. Among the four forest layers, the large arbor layer exhibited the strongest linear fit, followed by the medium arbor layer, whereas the small arbor and shrub layers showed comparable fits. In all four layers, Pianka niche overlap indices tended to increase with Spearman correlation coefficients, reflecting concordance between two metrics derived from the same underlying plot-level importance-value distributions.
Figure 5.
Relationships between Pianka’s niche overlap index and Spearman’s rank correlation coefficient across four forest layers.
4. Discussion
4.1. Species Dominance and Distributional Characteristics Across Forest Layers
Importance value reflects a species’ relative status and ecological role within a community, whereas niche breadth reflects the breadth and evenness of its importance-value distribution across plots. In general, species that dominate a community may be relatively widely distributed across multiple plots, often exhibiting greater niche breadth and higher importance values.
Vatica mangachapoi had the greatest niche breadth in all four forest layers and ranked first in importance value in the small, medium, and large arbor layers. These findings are consistent with those reported by Shu et al. [14], who also found that Vatica mangachapoi had high importance values and relatively large niche breadth in the Ganshiling community, Hainan. The consistency between the two study areas highlights the prominent community status and broad distributional characteristics of Vatica mangachapoi as a dominant tree species in Hainan’s tropical lowland rainforests.
Previous studies have suggested that species with higher importance values may also have greater niche breadth, although the two indices do not necessarily vary in parallel [26]. In the shrub layer, Garcinia oblongifolia ranked first in importance value, surpassing Vatica mangachapoi, but exhibited a relatively narrow niche breadth. Similarly, in the small arbor layer, Koilodepas hainanense had a relatively high importance value but a narrow niche breadth, possibly reflecting its concentration in a subset of sampling plots with high local abundance or dominance.
In contrast, Garcinia oblongifolia had a lower importance value but greater niche breadth in the same layer and occurred in more plots. These contrasting patterns suggest that a species’ high importance value may primarily reflect its dominance in certain plots, whereas greater niche breadth reflects a broader and more even distribution of its importance values across plots. Therefore, a species’ relative dominance within a community does not necessarily correspond to the breadth and evenness of its importance-value distribution across plots.
4.2. Niche Overlap Across Different Forest Layers
Higher niche overlap reflects greater similarity in species’ distributions across sampling plots and may be associated with shared habitat preferences or similarities in resource use [27]. Niche overlap was widespread among dominant species across all four forest layers, but highly overlapping pairs were scarce, accounting for no more than 8% of all pairs in any layer.
The small arbor layer contained relatively large numbers of both overlapping and highly overlapping species pairs, suggesting that although the plot-level importance-value distributions of many dominant species showed some degree of similarity, only a limited number of species pairs exhibited high similarity. This pattern may be related to spatial environmental heterogeneity in tropical rainforests and differences in species’ responses to environmental conditions. Previous studies have shown that tropical tree species differ in their growth responses to changes in understory light availability and that topographic conditions can influence species distributions and forest community composition [28,29]. Because species differ in their ecological characteristics and habitat preferences, even species occurring within the same plot may exhibit different patterns of relative dominance across plots in response to variations in local environmental conditions. Such differences in plot-level importance-value distributions may partly explain why most species pairs did not exhibit high niche overlap.
Previous studies have suggested that importance value, niche breadth, and niche overlap may be related, although these indices do not necessarily vary in parallel [30,31]. In the medium arbor layer, both Vatica mangachapoi and Garcinia oblongifolia exhibited relatively broad niche breadths and high niche overlap. However, the highest niche overlap in this layer was observed between Syzygium hancei and Croton laevigatus (Oik = 0.82). Syzygium hancei ranked twentieth in importance value and had a relatively narrow niche breadth, whereas Croton laevigatus ranked third and exhibited a broader niche breadth. Similar patterns have been reported in Myrica nana shrublands in central Yunnan and Castanopsis carlesii communities in Wuyi Mountain [32,33]. Niche breadth reflects the extent and evenness of a species’ importance-value distribution across plots, whereas niche overlap depends on the similarity between the distributions of two species. Thus, species with broadly distributed importance values do not necessarily exhibit high niche overlap with other species, whereas species with more concentrated importance-value distributions may still show high overlap when their distributions across plots are similar.
4.3. Overall and Interspecific Associations Across Forest Layers
Species distributions and association patterns in plant communities are jointly influenced by various ecological processes, including environmental filtering, dispersal, and interspecific interactions [6,34]. Integrating analyses of ecological niches and interspecific associations helps elucidate community structure and interspecific relationships from complementary perspectives of species’ plot-level distribution patterns and co-occurrence [35]. In this study, dominant species in all four forest layers at Bawangling exhibited significant positive overall associations. Association coefficient (AC) analysis also showed that positive pairwise associations predominated in each layer, indicating an overall tendency toward positive co-occurrence among dominant species.
However, most species pairs did not show significant associations in Fisher’s exact tests or significant correlations in Spearman’s rank correlation analyses after BH-FDR correction. The coexistence of positive overall associations and a low proportion of significant pairwise associations has also been reported in other forest communities [36,37], indicating that positive overall associations do not necessarily imply widespread strong relationships between individual species pairs.
After BH-FDR correction, only three species pairs retained significant positive Spearman correlations, all of which also exhibited significant positive associations in Fisher’s exact tests: Aidia henryi–Prismatomeris tetrandra in the shrub layer, Psychotria asiatica–Brassaiopsis glomerulata in the small arbor layer, and Castanopsis tonkinensis–Schima superba in the large arbor layer. The agreement between the two analyses indicates that these species pairs exhibited both significant positive co-occurrence associations and consistent positive variation in their importance values across plots.
Notably, Aidia henryi exhibited a highly significant negative association with Aporosa dioica in the small arbor layer, whereas its positive association with Prismatomeris tetrandra in the shrub layer was significant in both analyses. Aidia henryi occurs in forest interiors, near streams, and in hillside shrublands, and has some capacity for recruitment in natural montane rainforests of Hainan. Similarly, Prismatomeris tetrandra occurs in forests and shrublands and has been reported to increase in dominance during natural forest recovery in parts of Hainan [38]. Their similarities in life form and habitat occurrence may contribute to comparable responses to forest environmental conditions. By comparison, Aporosa dioica has been characterized as a light-demanding pioneer species in secondary forests at Bawangling [39]. Differences in habitat responses may therefore contribute to its negative association with Aidia henryi in the small arbor layer. These findings suggest that variation in association patterns among accompanying species may be related to their ecological characteristics and responses to local forest conditions.
Spearman’s rank correlation analysis yielded positive-to-negative correlation ratios of 0.84, 1.02, 0.98, and 1.64 in the shrub, small arbor, medium arbor, and large arbor layers, respectively. Positive correlations were relatively more common in the large arbor layer, whereas negative correlations slightly predominated in the shrub layer.
However, the correlation patterns involving Vatica mangachapoi differed from the overall pattern. Among the 76 species pairs involving Vatica mangachapoi across the four forest layers, 55 (72.37%) exhibited negative correlations, none of which remained significant after BH-FDR correction. Vatica mangachapoi was negatively correlated with Croton laevigatus in all four layers and with Koilodepas hainanense, Tarennoidea wallichii, and Garcinia oblongifolia in three layers each. Previous studies of Vatica mangachapoi communities in Hainan have likewise reported that Vatica mangachapoi exhibited high relative dominance and relatively large niche breadth but generally weak or nonsignificant associations with accompanying species [14,40]. These relatively weak associations may be related to the species’ adaptability to different habitat conditions. Field observations indicate that Vatica mangachapoi can grow in forest sites with relatively intact soil cover, sandy areas, and rock crevices. Transcriptomic evidence also suggests that Vatica mangachapoi responds to drought stress by regulating the expression of genes involved in stomatal control, damage responses, and terpene biosynthesis [13]. Such adaptability may contribute to its ability to maintain a prominent position within the community across heterogeneous habitats.
4.4. Relationship Between Niche Overlap and Interspecific Correlations Across Forest Layers
Previous studies have suggested that stronger positive interspecific associations are often accompanied by greater niche overlap, whereas stronger negative associations tend to correspond to lower niche overlap [41]. The present results support this general pattern, as Spearman’s rank correlation coefficients were positively related to Pianka’s niche overlap indices across all four forest layers (Figure 5). This suggests that species pairs showing more similar patterns of importance-value variation across plots generally exhibit higher niche overlap.
For example, in the small arbor layer, Brassaiopsis glomerulata and Psychotria asiatica exhibited a significant positive correlation (ρ = 0.740, PFDR = 0.036) and high niche overlap (Oik = 0.62), indicating a high degree of similarity in their plot-level importance-value distributions. Brassaiopsis glomerulata commonly occurs in dense forests on hillsides and in valleys, whereas Psychotria asiatica is a relatively shade-tolerant evergreen shrub or small tree that favors warm, humid conditions and low understory light availability. Their significant positive correlation and high niche overlap may be associated with similar understory habitat preferences, which could help explain their similar distribution patterns across plots.
5. Conclusions and Conservation Implications
By examining species dominance, plot-level importance-value distributions, and interspecific associations among the principal dominant woody species in the Vatica mangachapoi community in the Bawangling area of Hainan Tropical Rainforest National Park, this study found that Vatica mangachapoi occupied a prominent position across all four forest layers and exhibited the greatest niche breadth in each layer. Niche overlap was widespread among dominant species, although highly overlapping species pairs were relatively uncommon. Species pairs involving Vatica mangachapoi with high niche overlap occurred mainly in the shrub, small arbor, and medium arbor layers. Dominant species exhibited significant positive overall associations in all four forest layers, but relatively few individual species pairs showed significant associations. Among species pairs involving Vatica mangachapoi, negative Spearman correlations predominated, although none remained significant after BH-FDR correction.
These findings highlight two priorities for the conservation of Vatica mangachapoi communities. First, existing natural habitats should be protected and anthropogenic disturbances minimized to maintain forest vertical structure and species composition.
Second, greater attention should be given to associated species showing high niche overlap with Vatica mangachapoi in the shrub, small arbor, and medium arbor layers, particularly Diospyros cathayensis, Garcinia oblongifolia, and Aporosa dioica. These species could be considered as candidates for continued monitoring and further research to investigate their interspecific relationships with Vatica mangachapoi in relation to population dynamics and habitat conditions, thereby providing a basis for the conservation and management of Vatica mangachapoi communities.
Supplementary Materials
The following supporting information can be downloaded at: https://www.mdpi.com/article/10.3390/plants15223546/s1, Supplementary S1. Arbor layer (tree layer); Supplementary S2. Large tree layer; Supplementary S3. Shrub layer; Supplementary S4. Understory tree layer.
Author Contributions
Field investigation survey: B.Y., P.L., H.D., H.C., X.X., K.X., S.H. and R.L.; Writing—original draft preparation; B.Y.; Conceptualization, Methodology: B.Y., D.L. and X.Y.; Writing—review & editing: D.L., X.Y. and D.Q. All authors have read and agreed to the published version of the manuscript.
Funding
This research was funded by the National Natural Science Foundation of China (No. 32260267), the Hainan Institute of National Park (HD-KYH-2021120), the National Key Research and Development Program of China (2016YFC0503104), and the Hainan Provincial Forestry Bureau (HD-KYH-2022165).
Data Availability Statement
Data including the species × plot matrix and the variables required to reproduce importance values, niche indices, and interspecific-association as Supplementary Materials in this study are included in the article.
Conflicts of Interest
The authors declare no conflicts of interest.
References
- Buche, L.; Spaak, J.W.; Jarillo, J.; De Laender, F. Niche Differences, Not Fitness Differences, Explain Predicted Coexistence across Ecological Groups. J. Ecol. 2022, 110, 2785–2796. [Google Scholar] [CrossRef] [Scilit]
- Helm, N.; Chytrý, K.; Hülber, K.; Moser, D.; Wessely, J.; Gattringer, A.; Hausharter, J.; Pauli, H.; Winkler, M.; Saccone, P.; et al. Fine-scale Alpine Plant Community Assembly: Relative Roles of Environmental Sorting, Dispersal Processes and Species Interactions. J. Ecol. 2024, 112, 2745–2757. [Google Scholar] [CrossRef] [Scilit]
- Carscadden, K.A.; Emery, N.C.; Arnillas, C.A.; Cadotte, M.W.; Afkhami, M.E.; Gravel, D.; Livingstone, S.W.; Wiens, J.J. Niche Breadth: Causes and Consequences for Ecology, Evolution, and Conservation. Q. Rev. Biol. 2020, 95, 179–214. [Google Scholar] [CrossRef] [Scilit]
- Xiang, X.; De, K.J.; Lin, W.; Feng, T.; Li, F.; Wei, X. The Ecological Niche Characteristics and Interspecific Associations of Plant Species in the Alpine Meadow of the Tibetan Plateau Affected Plant Species Diversity under Nitrogen Addition. PeerJ 2024, 12, e18526. [Google Scholar] [CrossRef] [Scilit] [PubMed]
- He, S.Y.; Wang, Y.X.; Meng, M.H.; Shi, Y. The Impacts of Tourism Disturbance on the Ecological Niches and Interspecific Associations of Herbaceous Communities along Trails in Tianmu Mountain. Acta Ecol. Sin. 2026, 46, 1964–1975. [Google Scholar] [CrossRef]
- Blanchet, F.G.; Cazelles, K.; Gravel, D. Co-occurrence Is Not Evidence of Ecological Interactions. Ecol. Lett. 2020, 23, 1050–1063. [Google Scholar] [CrossRef] [Scilit] [PubMed]
- Laurans, M.; Hérault, B.; Vieilledent, G.; Vincent, G. Vertical Stratification Reduces Competition for Light in Dense Tropical Forests. For. Ecol. Manag. 2014, 329, 79–88. [Google Scholar] [CrossRef] [Scilit]
- Matsuo, T.; Martínez-Ramos, M.; Bongers, F.; Van Der Sande, M.T.; Poorter, L. Forest Structure Drives Changes in Light Heterogeneity during Tropical Secondary Forest Succession. J. Ecol. 2021, 109, 2871–2884. [Google Scholar] [CrossRef] [Scilit] [PubMed]
- Li, Y.D. Biodiversity of Tropical Forest and Its Protection Strategies in Hainan Island, China. For. Res. 1995, 8, 455–461. [Google Scholar] [CrossRef]
- Yu, H.; Pei, X.; Zhang, H. Threat Categories of Vatica mangachapoi Should Be Reassessed. Front. For. Glob. Change 2024, 7, 1356104. [Google Scholar] [CrossRef] [Scilit]
- Duan, J.Y.; Zhu, S.Q.; Yao, X.L.; Rao, C.K.; Cai, Y.; Tang, L. Genetic Variation and Demographic History of Vatica Mangachapoi Blanco (Dipterocarpaceae), a Dominant Tree in the Lowland Rainforests of Hainan Island, China. Bot. J. Linn. Soc. 2026, boag027. [Google Scholar] [CrossRef] [Scilit]
- Zhu, S.Q.; Duan, J.Y.; Tang, L. Fine-Scale Spatial Genetic Structure of Vatica mangachapoi (Dipterocarpaceae). J. Trop. Biol. 2026, 17, 903–912. [Google Scholar] [CrossRef]
- Tang, L.; Liao, X.Z.; Tembrock, L.R.; Ge, S.; Wu, Z.Q. A Chromosome-Scale Genome and Transcriptomic Analysis of the Endangered Tropical Tree Vatica mangachapoi (Dipterocarpaceae). DNA Res. 2022, 29, dsac005. [Google Scholar] [CrossRef] [Scilit] [PubMed]
- Shu, Q.; Xu, R.J.; Hu, X.; Shang, Z.A.; Qi, L.H. Niche and Interspecific Association of the Main Tree Species in Vatica mangachapoi Communities in Ganshiling, Hainan Island, China. Chin. J. Ecol. 2021, 40, 2689–2697. [Google Scholar] [CrossRef]
- Liu, G.F.; Zang, R.G.; Ding, Y.; Wang, W.Y.; Li, R.C.; Chen, S.W.; Zhou, Z.L. Diversity and Distribution of Epiphytic Orchids in Different Types of Old-Growth Tropical Forests in Bawangling National Nature Reserve, Hainan Island, China. Chin. J. Plant Ecol. 2010, 34, 396–408. [Google Scholar] [CrossRef]
- Wang, Q.; Li, J.B.; Yang, X.B.; Zeng, R.J.; Xia, D.; Wang, H.; Zhu, Z.C.; Jiang, Y.X.; Wang, C.Y.; Zhang, S.W.; et al. Community Structure and Species Diversity of Pinus Latteri Forests in Bawangling Ridge, Hainan. J. Trop. Biol. 2023, 14, 585–592. [Google Scholar] [CrossRef]
- Wang, G.H.; Fang, J.Y.; Guo, K.; Xie, Z.Q.; Tang, Z.Y.; Shen, Z.H.; Wang, R.Q.; Wang, X.P.; Wang, D.L.; Qiang, S.; et al. Contents and Protocols for the Classification and Description of Vegetation Formations, Alliances and Associations of Vegetation of China. Chin. J. Plant Ecol. 2020, 44, 128–178. [Google Scholar] [CrossRef] [Scilit]
- Curtis, J.T.; McIntosh, R.P. An Upland Forest Continuum in the Prairie-Forest Border Region of Wisconsin. Ecology 1951, 32, 476–496. [Google Scholar] [CrossRef] [Scilit] [PubMed]
- Song, Y. Vegetation Ecology; East China Normal University Press: Shanghai, China, 2001; ISBN 978-7-5617-2640-2. [Google Scholar]
- Levins, R. Evolution in Changing Environments: Some Theoretical Explorations. (MPB-2); Princeton University Press: Princeton, NJ, USA, 1968; ISBN 978-0-691-20941-8. [Google Scholar]
- Shannon, C.E.; Weaver, W. The Mathematical Theory of Communication; University of Illinois Press: Urbana, IL, USA, 1949; ISBN 978-0-252-72548-7. [Google Scholar]
- Pianka, E.R. The Structure of Lizard Communities. Annu. Rev. Ecol. Syst. 1973, 4, 53–74. [Google Scholar] [CrossRef] [Scilit]
- Schluter, D. A Variance Test for Detecting Species Associations, with Some Example Applications. Ecology 1984, 65, 998–1005. [Google Scholar] [CrossRef] [Scilit]
- Zhang, J. Quantitative Ecology; Science Press: Beijing, China, 2004. [Google Scholar]
- Wang, B.S.; Peng, S.L. Studies on the Measuring Techniques of Interspecific Association of Lower-Subtropical Evergreen-Broadleaved Forests. I. The Exploration and the Revision on the Measuring Formulas of Interspecific Association. Acta Phytoecol. Et. Geobot. Sin. 1985, 9, 274–279. [Google Scholar]
- Liu, R.H.; Chang, B.; Rong, C.Y.; Jiang, Y.; Yang, R.A.; Liu, X.T.; Zeng, H.F.; Fu, G.H. Niche of Main Woody Plant Populations of Pterocarya Stenoptera Community in Riparian Zone of Lijiang River, China. Chin. J. Appl. Ecol. 2018, 29, 3917–3926. [Google Scholar] [CrossRef] [PubMed]
- Zhang, G.S.; Su, Q.D.; Li, R.S.; Ye, Z.J.; Huang, X.B.; Tang, R.; Su, J.R.; Li, S.F. Analysis of Community Composition and Interspecific Associations in the Extremely Small Population of Musa Ruiliensis. Acta Ecol. Sin. 2026, 46, 6504–6513. [Google Scholar] [CrossRef]
- Zhou, L.; Thakur, M.P.; Jia, Z.; Hong, Y.; Yang, W.; An, S.; Zhou, X. Light Effects on Seedling Growth in Simulated Forest Canopy Gaps Vary across Species from Different Successional Stages. Front. For. Glob. Change 2023, 5, 1088291. [Google Scholar] [CrossRef] [Scilit]
- Wang, J.; Xu, H.; Li, Y.; Lin, M.; Zhou, Z.; Luo, T.; Chen, D. Effects of Topographic Heterogeneity on Community Structure and Diversity of Woody Plants in Jianfengling Tropical Montane Rainforest. Sci. Silvae Sin. 2018, 54, 1–11. [Google Scholar] [CrossRef]
- Chen, Y.K.; Yang, Q.; Mo, Y.N.; Yang, X.B.; Li, D.H.; Hong, X.J. A Study on the Niches of the State’s Key Protected Plants in Bawangling, Hainan Island. Chin. J. Plant Ecol. 2014, 38, 576–584. [Google Scholar] [CrossRef] [Scilit]
- Shang, N.Y.; Li, D.H.; Yang, X.B.; Huang, Y.; Liu, R.T.; Su, X.; Du, C.Y.; He, S.C.; Qi, T.Y. Niches and Interspecific Associations of Dominant Tree Species of Different Forest Layers in the Communities with the Endangered Plant Heritiera Parvifolia. Acta Ecol. Sin. 2025, 45, 3389–3400. [Google Scholar] [CrossRef]
- Zhang, L.N.; Zhu, G.Q.; Yang, K.; Liu, X.Y.; Gong, H.D.; Zheng, L. Niche and Interspecific Association of Main Woody Plants in Myrica Nana Shrubland in Central Yunnan, China. Chin. J. Plant Ecol. 2022, 46, 1400–1410. [Google Scholar] [CrossRef] [Scilit]
- Huang, S.D.; Nie, S.; Xiao, X.X.; Huang, Y.P.; Lin, J.; Gao, W. Niches and Interspecific Associations of Dominant Tree Populations of Castanopsis Carlesii (Hemsl.) Hay. in Wuyi Mountain. Plant Sci. J. 2023, 41, 291–300. [Google Scholar] [CrossRef]
- Vellend, M. Conceptual Synthesis in Community Ecology. Q. Rev. Biol. 2010, 85, 183–206. [Google Scholar] [CrossRef] [Scilit] [PubMed]
- Gu, L.; Gong, Z.; Li, W. Niches and Interspecific Associations of Dominant Populations in Three Changed Stages of Natural Secondary Forests on Loess Plateau, P.R. China. Sci. Rep. 2017, 7, 6604. [Google Scholar] [CrossRef] [Scilit] [PubMed]
- Liu, Y.-P.; Ye, X.-Z.; Ye, L.-Q.; Chen, X.-H.; Zheng, S.-Q.; Chen, S.-P.; Zhang, G.-F.; Liu, B. Niche and interspecific association of dominant tree species in Michelia odora community. Chin. J. Appl. Ecol. 2022, 33, 2670–2678. [Google Scholar] [CrossRef] [Scilit] [PubMed]
- Wu, J.J.; Zhang, W.; Gao, L.; Tan, X.; Yue, J.; Tian, Q.L.; Feng, D.L.; Huang, X.H.; Qi, D.H.; Xu, Y.F.; et al. Community Characteristics and Interspecific Association of Secondary Cotinus Coggygria Shrubbery in Three Gorges Reservoir Region. Acta Ecol. Sin. 2020, 40, 4053–4063. [Google Scholar] [CrossRef]
- Li, C.; Li, D.; Yang, X.; Shi, J.; Zhao, J.; Li, L.; Chen, L.; Zhang, P.; Tian, L. Changes of Species Composition and Community Characteristics of Tropical Natural Forests in the Central Area of Hainan Island. J. Trop. Biol. 2022, 13, 287–296. [Google Scholar] [CrossRef]
- Lu, X.; Zang, R.; Ding, Y.; Huang, J. Changes in Biotic and Abiotic Drivers of Seedling Species Composition during Forest Recovery Following Shifting Cultivation on Hainan Island, China. Biotropica 2016, 48, 758–769. [Google Scholar] [CrossRef] [Scilit]
- Li, Y.; Xu, H.; Chen, D.; Luo, T.; Mo, J.; Luo, W.; Chen, H.; Jiang, Z. Discussing on the Ecological Species Groups and Functional Groups Division Based on the Interspecific Association—A Case Study on the Arbor Layer Data in Tropical Lowland Rain Forest of Jianfenling, Hainan Island, China. Sci. Silvae Sin. 2007, 43, 9–16. [Google Scholar] [CrossRef]
- Chen, Y.K.; Yang, X.B.; Li, D.H.; Nong, S.Q.; Lu, X.B.; Lu, J.J.; Yang, M.; Li, X.C. Interspecific Associations among Dominant Plant Populations in Keteleeria Hainanensis Communities in Bawangling, Hainan Island. Plant Sci. J. 2011, 29, 278–287. [Google Scholar]

Disclaimer/Publisher’s Note: The statements, opinions and data contained in all publications are solely those of the individual author(s) and contributor(s) and not of MDPI and/or the editor(s). MDPI and/or the editor(s) disclaim responsibility for any injury to people or property resulting from any ideas, methods, instructions or products referred to in the content. |
© 2026 by the authors. Licensee MDPI, Basel, Switzerland. This article is an open access article distributed under the terms and conditions of the Creative Commons Attribution (CC BY) license.