


Abstract
A better understanding of the associations between urban morphology and performance can support more evidence-based urban governance and design evaluation. However, conventional hand-crafted metrics may omit important configurational information, making it difficult to model morphology–performance relationships consistently across multiple performance domains and under changing urban conditions. To address this issue, this study tests a modeling pathway based on variational autoencoder (VAE) latent representations of urban morphology, combined with neighborhood de-averaging to reduce the influence of locational context, and evaluates it through a four-phase design covering explanatory gain, cross-dimensional response, contextual-scale and spatial robustness, and temporal generalizability. Using Shanghai as the empirical case, the results show that the latent-representation modeling pathway consistently outperforms multiple hand-crafted metric-based baselines. This relative advantage remained evident across multiple contextual scales, under spatially grouped validation, and in temporal validation. The pathway enables complex urban morphology to enter multidimensional performance models through a unified representation and has practical application potential for data-driven urban evaluation and performance-oriented planning support.
1. Introduction
Urban morphology is closely related to multiple dimensions of urban performance, including thermal conditions, social activity, and economic outcomes. Understanding these relationships can support more evidence-based urban governance and design evaluation. Existing studies have shown that urban form is associated with microclimates [1,2], social interaction [3,4,5], and economic exchange [6] in different ways. However, these relationships are often examined separately within individual domains, resulting in fragmented evidence that is difficult to apply to integrated decision-making.
One key limitation concerns the representation of urban form [3]. Conventional hand-crafted metrics, such as floor area ratio, building coverage ratio, and density-related indicators, summarize urban fabrics through a limited set of predefined variables. These metrics are useful and interpretable, but they may omit configurational information related to building arrangement, enclosure, and three-dimensional composition [7]. To compensate for this limitation, researchers often expand the metric system by adding more indicators. However, this approach can introduce multicollinearity and scale inconsistency [8], and it still does not fully resolve the difficulty of describing urban morphology in a unified way across multiple performance dimensions.
A second limitation concerns the modeling of morphology–performance associations. Regression models based on hand-crafted metrics, including OLS, GWR, and MGWR, have provided valuable evidence, but their explanatory capacity is often constrained by the predefined input variables [5,9]. Non-linear machine learning models such as GBDT [10], random forest [11], and XGBoost [12,13] can improve predictive performance and reveal threshold effects. Even so, when the input variables contain limited configurational information, improvements in algorithmic complexity alone may not be sufficient. In such cases, post hoc interpretation methods such as SHAP [14] remain tied to the semantic boundaries of the original metric system.
Recent deep learning studies have explored an alternative approach: learning urban morphological representations directly from spatial data. However, existing approaches still present several limitations. Image classification methods [3] often rely on manually defined categories, which may lead to a loss of morphological detail. Feature extraction methods without reconstruction-based verification, such as CNN-based feature extraction [15] or perceptual hashing [16], may produce embeddings whose physical meaning is difficult to assess. Standard autoencoder variants [17,18,19] can generate compact representations, but the continuity and structure of their latent spaces are not always well suited for comparative analysis. In addition, many studies primarily validate learned features through clustering or similarity-based tasks [20,21,22], and subsequently revert to conventional hand-crafted metrics for interpretation. The potential of learned representations for explaining morphology–performance associations has not yet been systematically evaluated [23].
Another issue is how model validity is assessed. In many studies, emphasis is placed on fitting local samples or describing spatial heterogeneity within a specific dataset. Such analyses are important, but they do not by themselves show whether the identified associations remain useful under new spatial or temporal conditions. In urban systems, differences across studies may reflect real contextual variation, but they may also result from incomplete input representations or sample-specific noise. For this reason, it is necessary to evaluate not only in-sample fit, but also the stability of morphology–performance associations under data shifts.
To address these issues, this study tests a modeling framework based on variational autoencoder (VAE) latent representations of urban morphology. Unlike hand-crafted metrics defined through predefined variables, these representations are learned directly from spatial data and retain morphological information in a spatially structured form rather than reducing it to the selected metric set. Previous studies have shown that high-dimensional learned representations can capture morphological variations that are not fully reflected by conventional metrics [24]. Building on this prior validation, the present study examines whether this alternative representational capacity, when organized through a VAE-derived latent-representation modeling pathway, can be translated into higher, more stable, and more transferable explanatory performance in modeling morphology–performance associations relative to strong metric-based baselines. Shanghai is used as the empirical case. The analysis follows a progressive validation design covering four aspects: baseline comparison, cross-dimensional response, contextual-scale sensitivity and spatial robustness, and cross-temporal generalization. Rather than assuming that latent representations are universally superior, this study evaluates the VAE-derived latent-representation modeling pathway in comparison with strong metric-based baselines under a consistent analytical framework.
The study addresses four research questions:
- RQ1. Explanatory gain: Does the VAE-derived latent-representation modeling pathway achieve higher explanatory performance than metric-based baselines under the same evaluation framework?
- RQ2. Cross-dimensional response: Is the relative advantage of the latent-representation modeling pathway observed across environmental, social, and economic indicators, or is it concentrated in specific performance dimensions?
- RQ3. Contextual-scale and spatial robustness: Does the relative advantage of the latent-representation modeling pathway depend on a specific contextual scale or sample partitioning strategy?
- RQ4. Cross-temporal generalization: Does the latent-representation modeling pathway achieve higher explanatory performance than metric-based baselines when tested on data from a different year?
By comparing metric-based and VAE-derived latent-representation modeling pathways across multiple performance dimensions, contextual scales, and temporal validation settings, this study examines whether learned morphological representations can support more consistent morphology–performance modeling than conventional metric-based representations under the present empirical setting.
2. Methodology
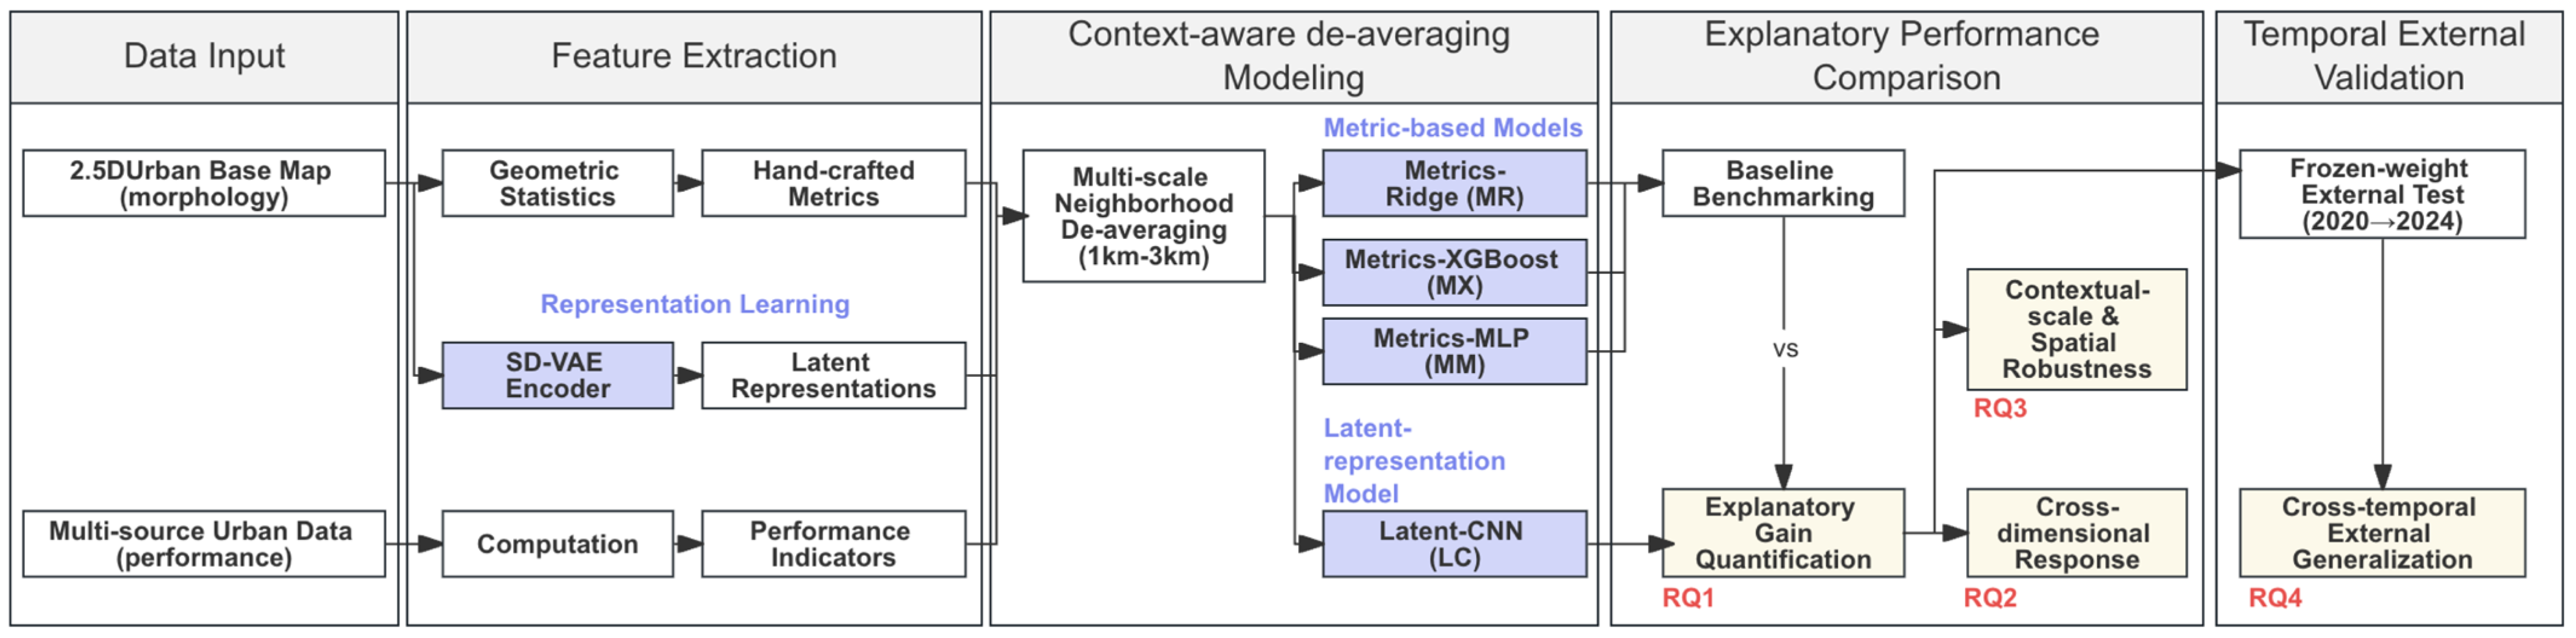
This study develops an integrated research framework (Figure 1) that synthesizes multi-source urban big data, deep representation learning, and multi-phase quantitative evaluation. The framework evaluates the explanatory performance of two modeling pathways: a metric-based pathway and a VAE-derived latent-representation pathway. This evaluation follows a structured workflow that includes feature extraction, neighborhood-based de-averaging, and temporal generalizability assessment.
Figure 1.
The overarching research framework for quantifying the urban morphology–performance associations. The arrow from 2020 to 2024 indicates that the models developed using the 2020 data were directly applied to the 2024 external dataset to evaluate cross-temporal generalizability under data shifts. The parallel branches represent the metric-based and latent-representation modeling pathways. SD-VAE denotes the stable diffusion-based variational autoencoder used for representation learning.
2.1. Study Area and Urban Data
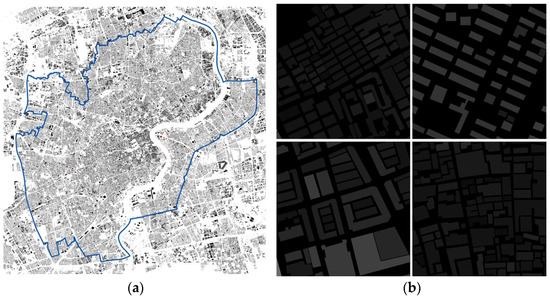
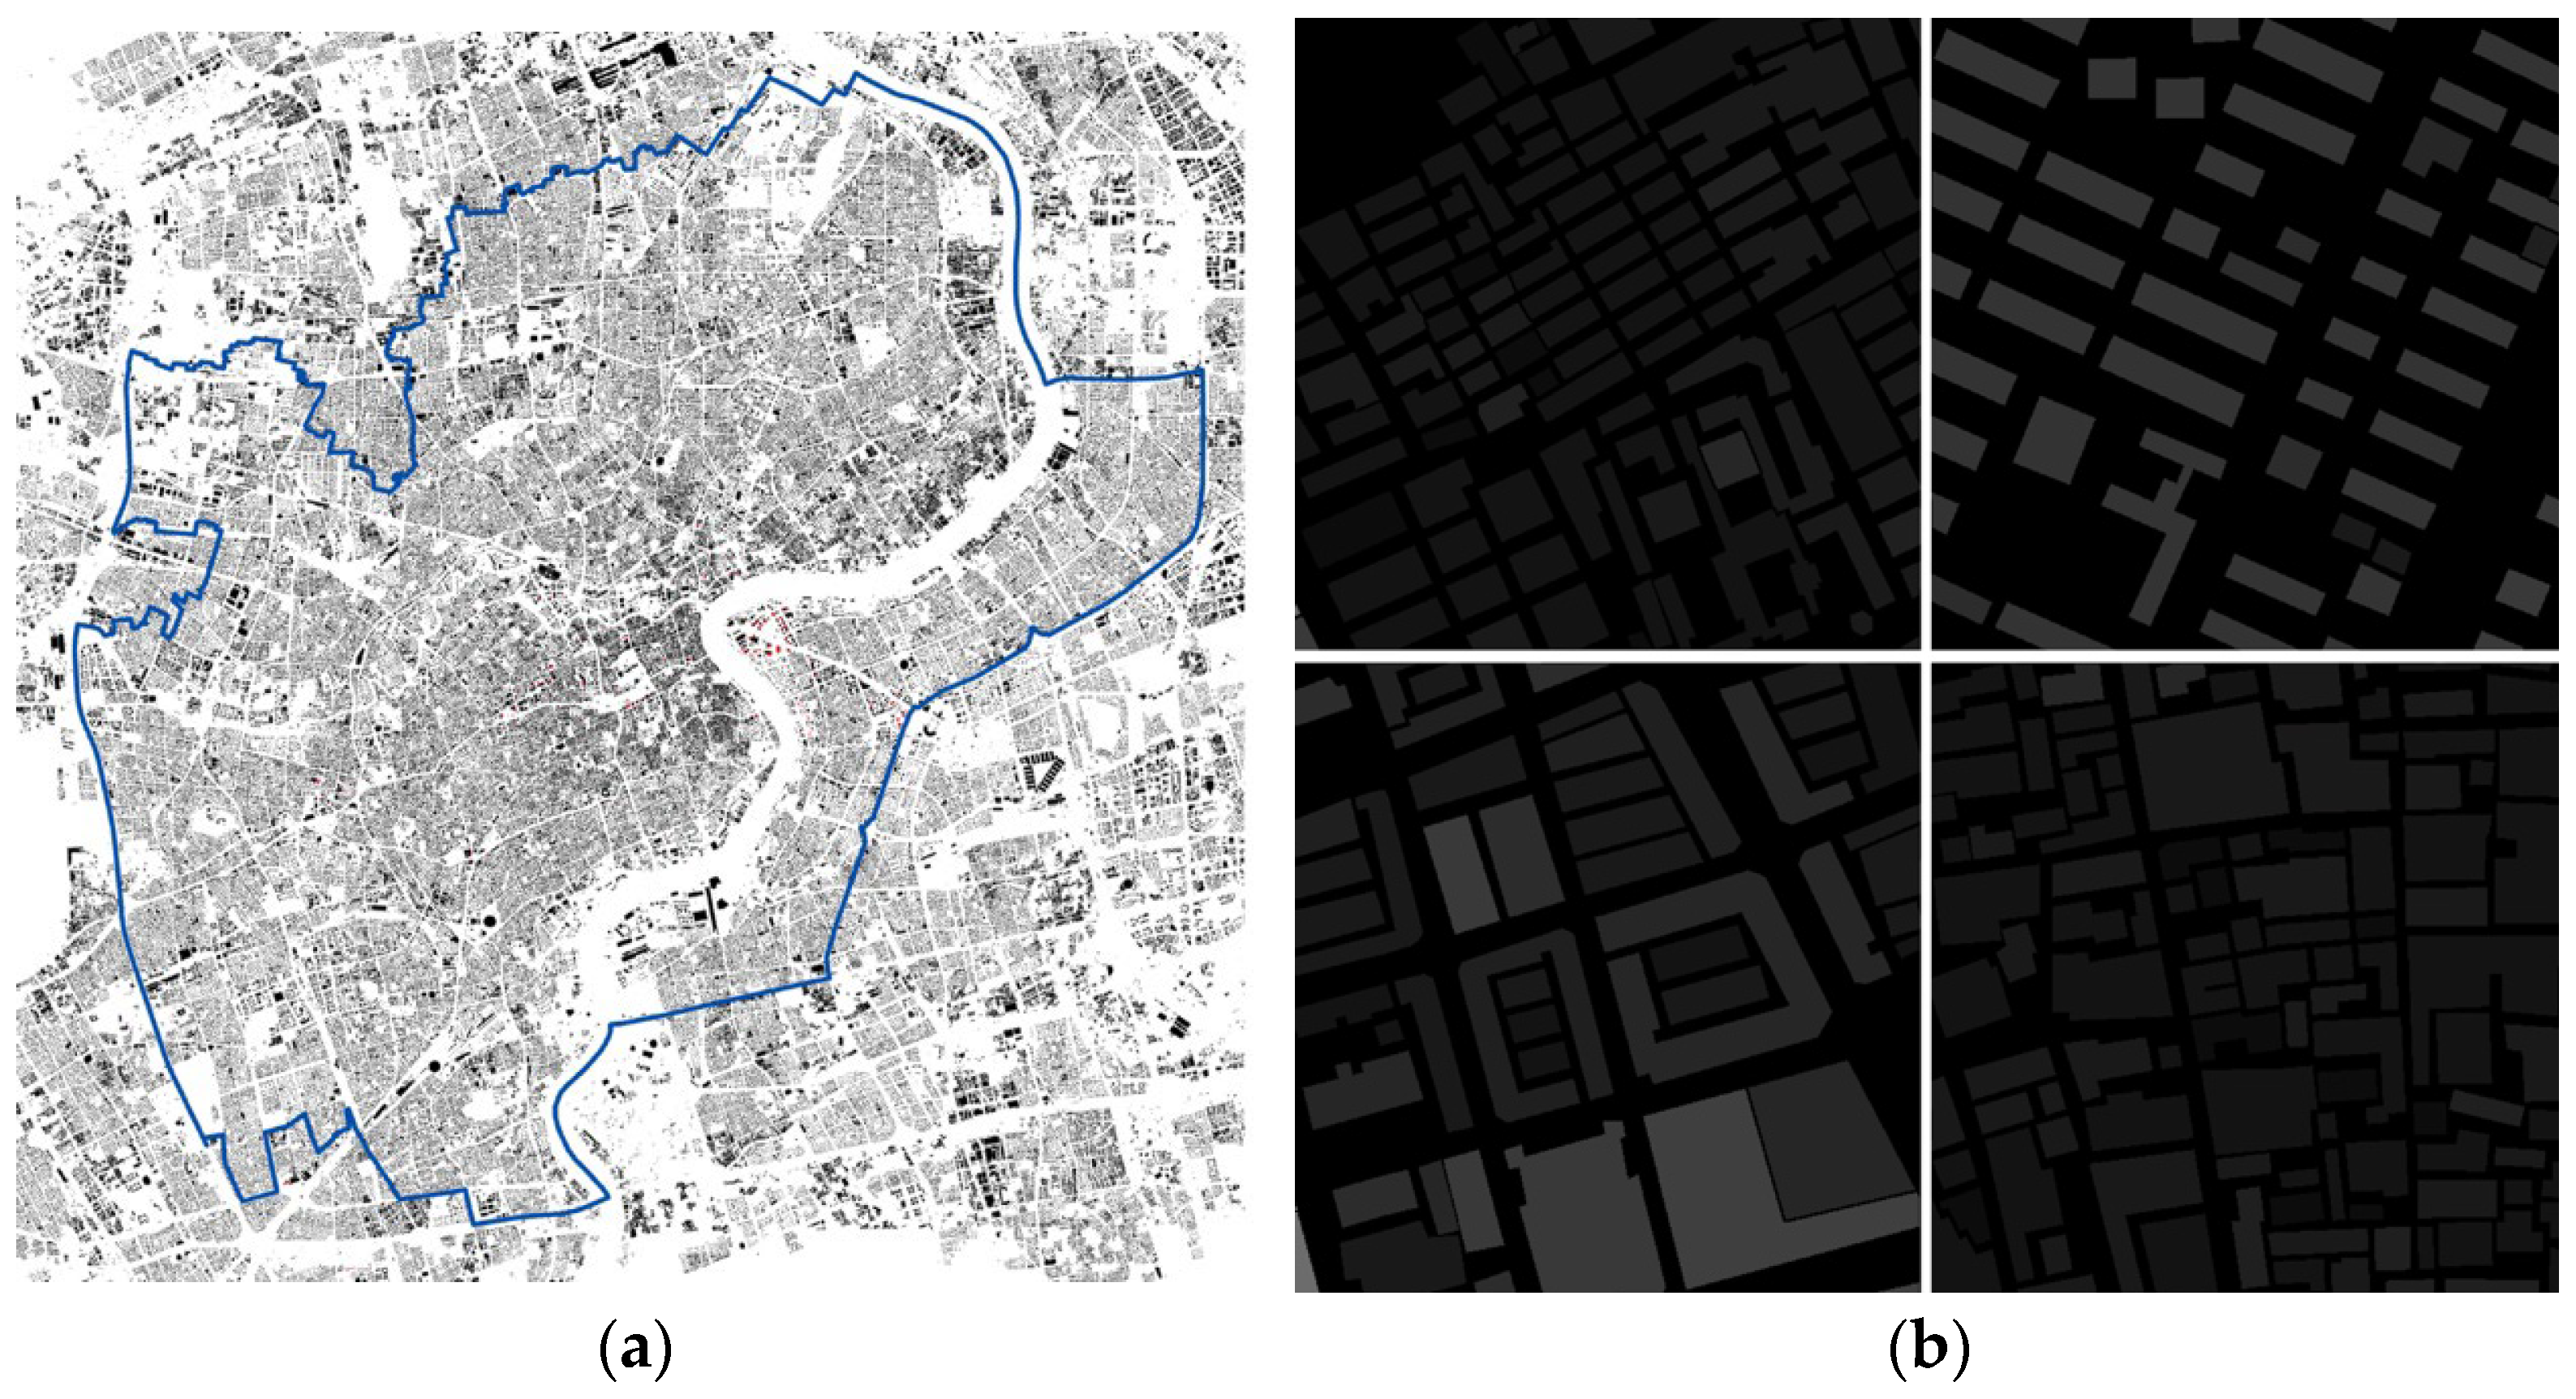
The study focuses on the core area of Shanghai (~487.87 km2), a high-density urban environment with substantial morphological diversity (Figure 2). Urban form was sampled using a sliding-window strategy with a 50 m stride. Each 300 m × 300 m unit was converted into a 512 × 512 grayscale image, in which pixel intensity encoded building floors. This produced a spatial resolution of approximately 0.59 m per pixel. Samples with limited morphological validity (e.g., BCR < 0.1 or maximum building floors > 40) were excluded to remove areas with insufficient built-up structures or extreme values that may reflect data noise or non-representative cases, yielding more than 160,000 candidate units. This configuration increases the spatial sampling density and supports the neighborhood-based comparison framework used in subsequent analyses.
Figure 2.
Geographical context of the study area and the morphological diversity of urban base map samples: (a) study area of Shanghai; (b) diverse samples (300 m × 300 m).
Morphological metrics were organized into a Statistical–Individual–Configurational (S–I–C) framework (Table 1). This framework includes intensity-related metrics, individual geometric metrics, and spatial configuration metrics, covering both 2D and 3D descriptors of urban form. Prior studies have suggested that 3D descriptors can better capture vertical complexity in urban form [2,25]. Rather than exhausting all possible hand-crafted metrics, the selected indicator set is intended to provide a representative morphological benchmark spanning development intensity, individual geometric attributes, and spatial configuration. This design balances coverage and redundancy, while avoiding the excessive collinearity that would arise from unrestricted expansion of the metric set.
Table 1.
Taxonomy of hand-crafted morphological metrics.
Performance indicators were organized into environmental, social, and economic dimensions (Table 2), which are used as grouping categories in subsequent analyses. Environmental indicators focused on thermal conditions, social indicators captured density, flow, and functional diversity, and economic indicators described job–housing structure, real-estate dynamics, and socioeconomic standing. The purpose of this indicator set is not to exhaust all possible dimensions of urban performance or to optimize explanation for any single outcome variable. Instead, it provides a multidimensional basis for comparing the explanatory performance of the metric-based modeling pathway and the VAE-derived latent-representation modeling pathway across heterogeneous urban performance responses.
Table 2.
Multidimensional urban performance indicators.
All morphological and performance indicators were aligned to the 300 m × 300 m sampling units. Raster data were aggregated using mean values within each grid cell, point-based data were converted into counts or densities within each unit, and polygon-based data were assigned using area-weighted averaging.
2.2. VAE-Based Morphological Representation: Model Selection and Validation
Variational Autoencoders (VAEs) provide a continuous latent space by regularizing the encoding distribution through Kullback–Leibler (KL) divergence [29]. Compared with discretized representation methods, this property facilitates smoother transitions between encoded samples in the latent space. Because the subsequent de-averaging step relies on deviations between each sample and its neighborhood mean, the continuous latent space provides a more suitable representation for computing local morphological differences than a discretized encoding scheme.
Morphological features of urban base maps were extracted using a pre-trained VAE from the Stable Diffusion framework [30]. The encoder compresses 512 × 512 × 3 input images into 64 × 64 × 4 latent tensors. The model was pre-trained on large-scale visual datasets and was used here without further fine-tuning. The encoder was kept frozen and used only for feature extraction. To meet input requirements, grayscale urban samples were linearly rescaled to the 0–255 image range and replicated into three-channel inputs. The resulting latent tensors were retained in spatial form and used directly as inputs to the downstream Latent-CNN model.
In the model selection phase, we compared three publicly available VAE variants—Original VAE, EMA-VAE [31], and MSE-VAE [32]—based on reconstruction performance on the urban dataset. While fine-tuned variants (MSE/EMA) achieved better perceptual quality (lower LPIPS [33]), the Original VAE showed higher structural similarity (SSIM [34]) and lower reconstruction error, indicating better preservation of morphological configurations (Table 3). Therefore, the Original VAE was selected for feature extraction.
Table 3.
Reconstruction fidelity of SD-VAE variants on urban morphological base maps.
To examine whether latent representations retain information relevant to conventional morphological descriptors, a probing-task framework [24] was adopted to evaluate the compatibility between the latent representations and the selected hand-crafted morphological metrics. A CNN model was trained to predict hand-crafted morphological metrics from latent representations. For the probing task, samples were randomly divided into training and test sets at a ratio of 0.8:0.2. The results (Table 4) show that these metrics can be reconstructed with low error (mean deviation < 6%), suggesting that information associated with these metrics is embedded in the latent representations. This provides empirical support for using the extracted representations as input features in subsequent morphology–performance modeling. In this study, the morphological meaning of latent representations is interpreted at the representation level rather than through one-to-one semantic assignment to individual latent dimensions.
Table 4.
Probing-task Results for Predicting Hand-crafted Morphological Metrics from SD-VAE Latent Representations.
2.3. Context-Aware Association and De-Averaging Modeling
Morphology–performance associations are often influenced by locational context, such as centrality, accessibility, and surrounding urban functions [35]. As a result, models based on absolute values may partly capture location-dependent patterns rather than localized morphology–performance relationships. While local spatial models and spatial autocorrelation diagnostics are useful for identifying spatial heterogeneity or dependence [36], they do not by themselves remove locational context from the feature representation.
To reduce the influence of locational context, this study adopts a neighborhood de-averaging strategy. In this study, contextual scale refers to the size of the local reference neighborhood used for de-averaging, and neighborhood de-averaging refers to subtracting the neighborhood mean from both predictors and outcomes so that the analysis focuses on localized deviations rather than absolute values. In implementation, the neighborhood was defined using a square moving window at each contextual scale, and the neighborhood mean was computed from all samples within the window, including the focal sample itself. This idea is related to spatial de-averaging approaches used to mitigate fixed-effect interference in spatial analysis [37,38]. Specifically, for each sample, the deviation of the feature vector from its neighborhood mean is calculated within a given spatial scale, and the same operation is applied to the corresponding performance indicator:
where denotes the deviation of morphological features from the neighborhood mean, denotes the deviation of the target indicator from the neighborhood mean, and ϵ is the error term. To reduce edge effects, only samples whose neighborhood windows contained at least 90% of the full expected sample count at a given scale were retained for analysis. This formulation shifts the analysis from absolute urban states to localized deviations relative to surrounding context, improving comparability across areas with different locational baselines. To examine whether the de-averaging transformation reduced spatial background structure in the outcome variables, Moran’s I was compared between and across distance rings and contextual scales.
2.4. Analytical Framework and Evaluation Phases
The study uses the coefficient of determination (R2) as the primary evaluation metric, with mean squared error (MSE) as a supplementary metric. While MSE reflects absolute prediction error, R2 provides an intuitive measure of how much spatial variation in urban performance is explained by the model. A four-phase evaluation framework is designed to compare the explanatory performance of the metric-based pathway and the VAE-derived latent-representation pathway across multiple urban performance dimensions, contextual scales, and validation settings.
- Phase I: Baseline Benchmarking and Explanatory Gain
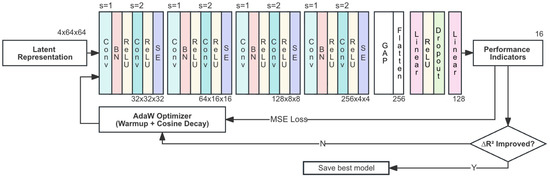
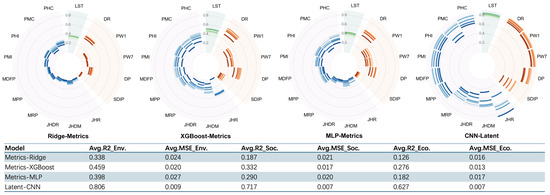
This phase establishes strong benchmark models for the metric-based pathway and compares its explanatory performance with that of the latent-representation pathway. Ridge Regression [39] is used as the linear baseline (MR) because of its robustness to multicollinearity in low-dimensional tabular indicators. XGBoost [40] is used as the non-linear baseline (MX) because of its strong performance in modeling complex non-linear relationships in structured tabular data. A Multi-Layer Perceptron (MLP) is further used as a neural-network baseline for hand-crafted metrics (MM), allowing the analysis to examine the explanatory performance of conventional metrics under a more flexible non-linear neural architecture. For latent representations, a Latent-CNN (LC) model is used (Figure 3), as the latent tensors preserve spatial structure that can be directly exploited by convolutional layers. This design allows both hand-crafted metrics and latent representations to be evaluated using model forms suited to their respective data structures. Detailed training settings, data partitioning, and hyperparameter tuning procedures for MR, MX, MM, and LC are provided in Appendix A.
Figure 3.
Architecture of the Latent-CNN regression framework.
- Phase II: Cross-dimensional Response
This phase examines whether the explanatory performance differences between the metric-based pathway and the latent-representation pathway are observed across environmental, social, and economic dimensions. By comparing these differences across domains, the analysis evaluates whether any advantage of the latent-representation pathway is concentrated in specific indicators or remains visible across multiple types of urban performance.
- Phase III: Contextual-Scale Sensitivity and Spatial Robustness
This phase examines whether the relative model advantage of the latent-representation pathway over the metric-based pathway depends on a specific contextual scale or sample partitioning strategy. It consists of three components: de-averaging diagnostics, contextual-scale analysis, and spatially grouped validation.
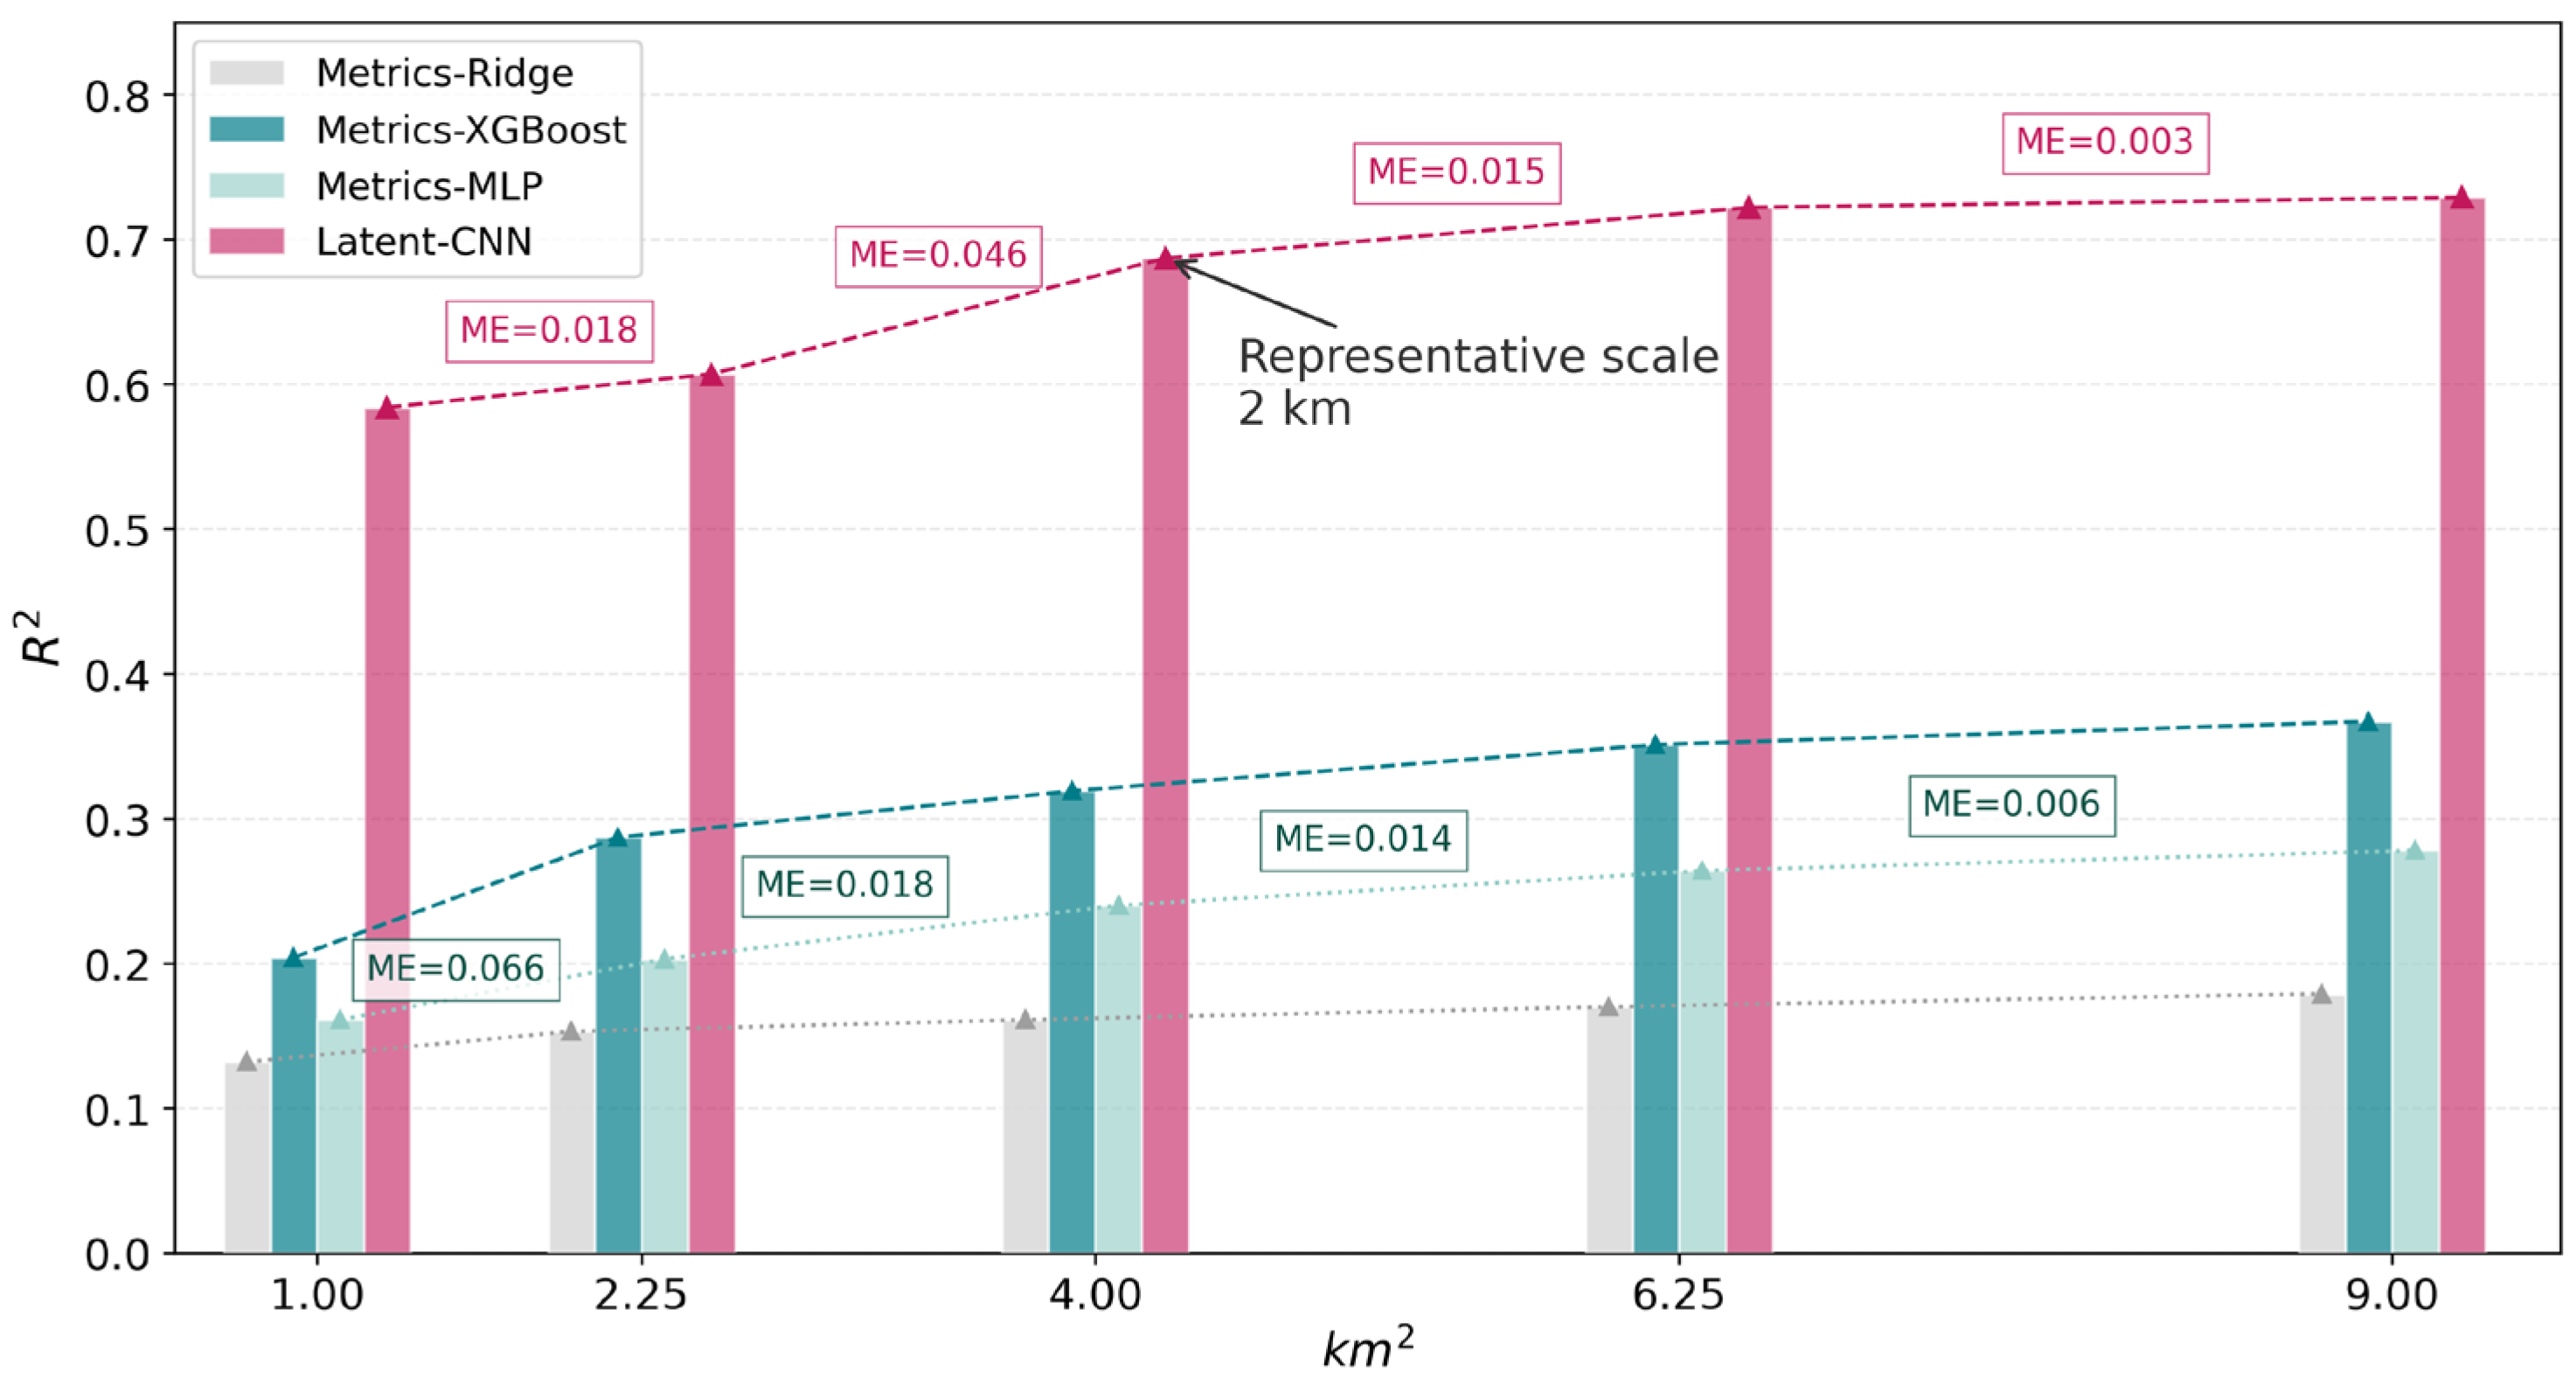
First, the de-averaging diagnostics are used to verify that spatial background structure is reduced in the relative performance variables, providing a more appropriate basis for subsequent model comparison. Second, the contextual-scale analysis compares the explanatory performance of the metric-based pathway and the latent-representation pathway within each of the five neighborhood scales: 1.0, 1.5, 2.0, 2.5, and 3.0 km. This step examines whether the relative advantage is observed across the tested scales or is limited to a particular contextual-scale setting. In addition, Marginal Efficiency (ME) is calculated to characterize the trade-off between increasing contextual scale and changes in explanatory performance, and to assist in selecting a representative scale for subsequent validation:
Finally, a research-unit-scale spatially grouped validation is conducted to examine whether model performance depends on a specific sample partitioning strategy.
- Phase IV: Temporal Generalizability
This phase evaluates whether explanatory relationships learned from 2020 data remain informative when applied to 2024 data. Models trained on 2020 data are directly applied to the 2024 dataset without refitting. Because comparable 2024 data are available only for a subset of indicators, this phase focuses on the matched indicators across both periods. By comparing R2 and prediction errors normalized by the 2020 training-target scale (nRMSEtrStd), the analysis assesses the relative temporal generalizability of different modeling pathways.
3. Explanatory Performance of the Latent-Representation Modeling Pathway
3.1. Baseline Comparison and Explanatory Gain
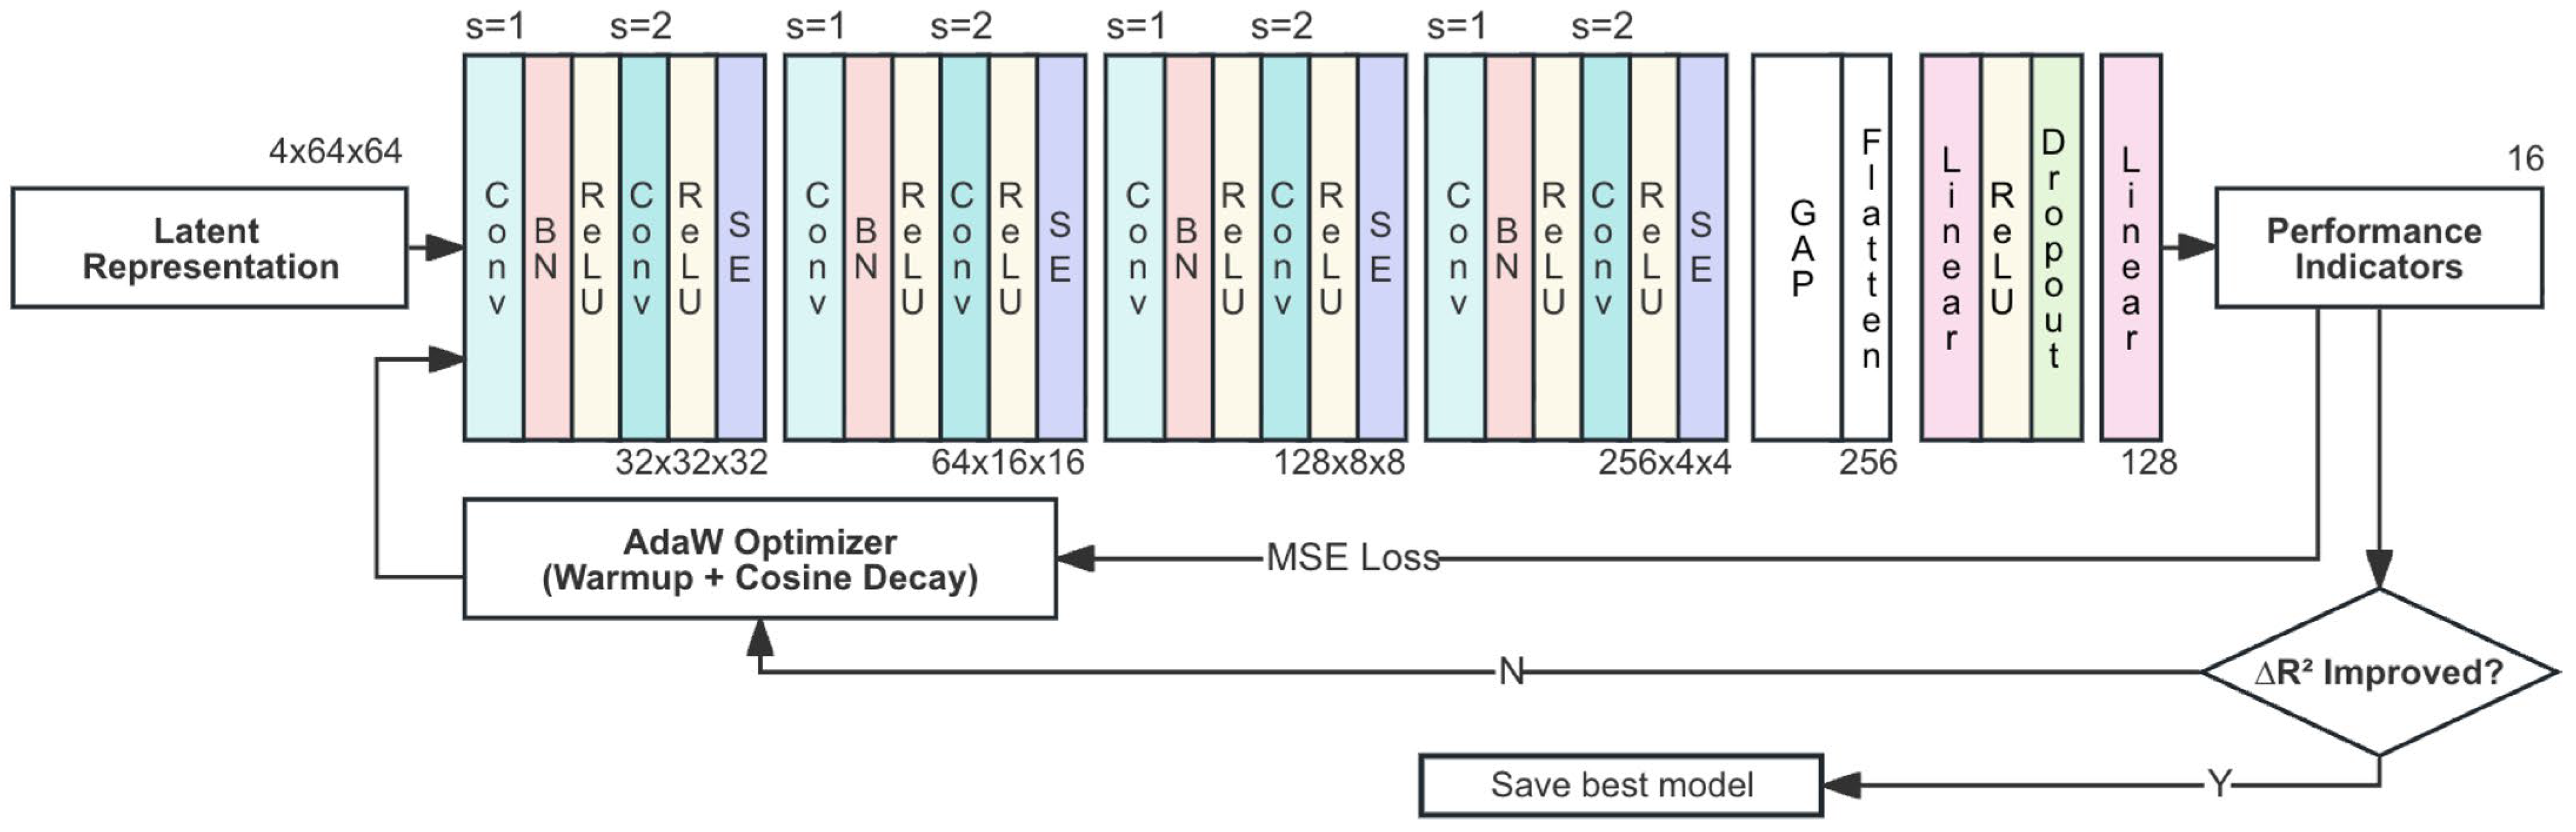
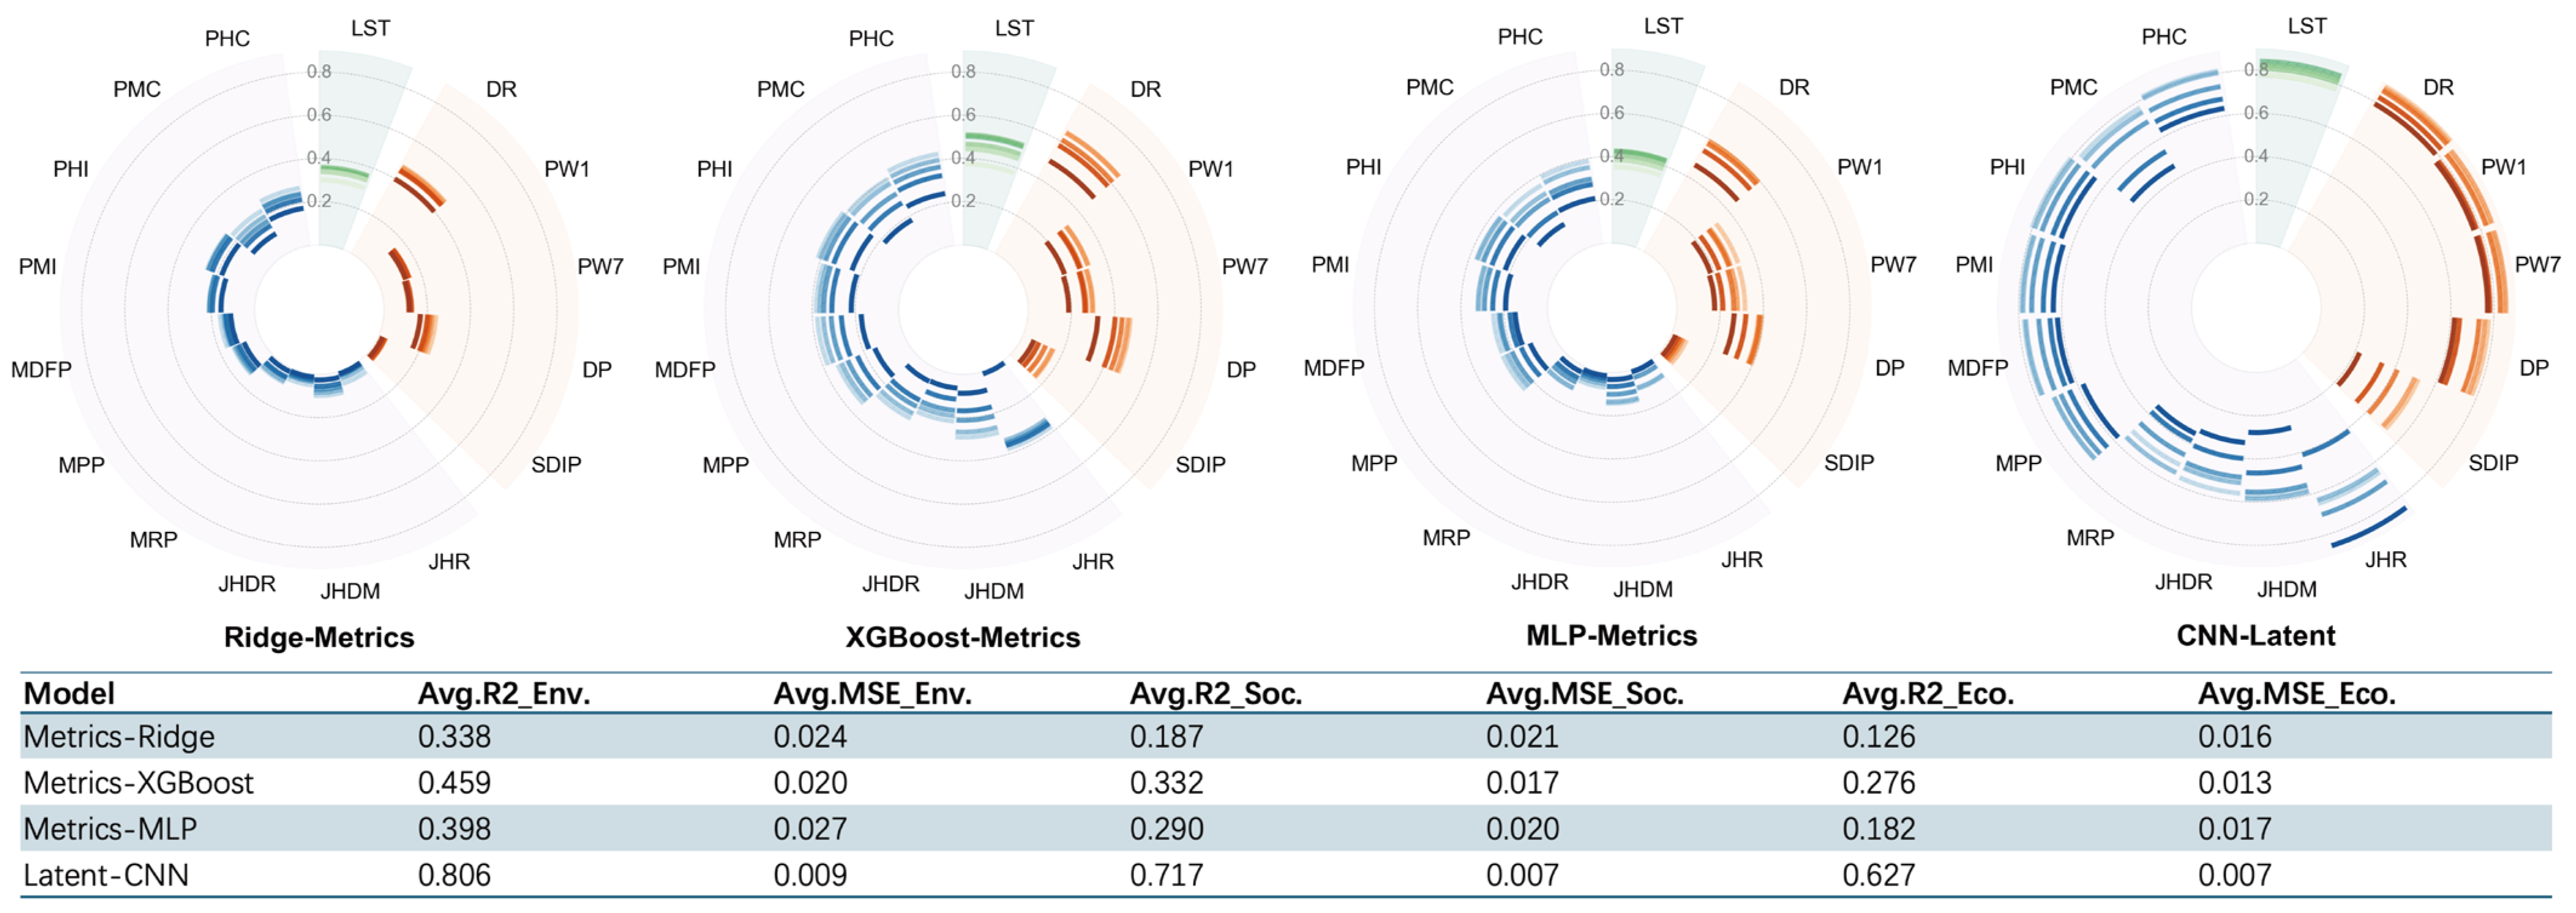
Figure 4 presents the results across four modeling frameworks. In the radial plots, the color intensity of each indicator arc fades as the neighborhood scale increases, with the mean R2 and MSE values for each dimension summarized below. Overall, under the same evaluation framework, the latent-representation modeling pathway shows higher explanatory performance than the metric-based baselines.
Figure 4.
Distribution of explanatory performance for morphology–performance associations across multiple modeling frameworks. Different colors distinguish the environmental, social, and economic performance dimensions, while the fading intensity within each color indicates increasing neighborhood scales. Full R2 and MSE results for all indicators across the five contextual scales are provided in Appendix B.
Within the hand-crafted-metric pathway, XGBoost (MX) and the multi-layer perceptron model (MM) achieve higher R2 values than the linear Ridge model (MR) in most dimensions (Figure 4). This indicates that local differences in urban morphology and performance involve nonlinear relationships. A purely linear model is therefore insufficient to fully capture these associations. This difference is more evident in the social and economic domains, indicating that these performance responses may involve more complex morphological configurations. At the same time, MM does not show a stable advantage over MX, suggesting that introducing a neural-network structure does not necessarily lead to higher explanatory performance when hand-crafted metrics are used as inputs.
This result can be further understood from the perspective of the representation–modeling combination. MM provides a comparison based on hand-crafted metrics and a neural-network model. This comparison suggests that differences in input representation may also play an important role in shaping model performance. In the present framework, VAE-derived latent representations and the convolutional model form a representation–modeling combination that differs from the hand-crafted-metric pathway. The latent representations retain high-dimensional morphological information in the form of spatial tensors, and LC can further use this spatial structure for downstream modeling. Therefore, the relative advantage of LC can be understood as a pathway-level advantage produced by the joint use of latent representations and convolutional modeling.
3.2. Cross-Dimensional Response and Indicator-Level Gains
Table 5 further disaggregates the results by indicator and reports the average performance across multiple contextual scales.
Table 5.
Multi-model comparison and explanatory gains over the strongest metric-based baseline.
- Environmental and basic social capacity indicators
For environmental (LST) and basic social capacity (DR) indicators, hand-crafted metrics already exhibit moderate explanatory performance in linear models (R2 ranging from approximately 0.33 to 0.44). This is consistent with existing knowledge that thermal conditions and population density are closely related to physical intensity measures such as building density and floor area ratio. With the LC model, explanatory performance increases to higher levels (R2 > 0.8), accompanied by substantial reductions in MSE. This suggests that the LC pathway may benefit from spatially structured information retained in VAE-derived latent representations and further used through convolutional modeling, which may support the explanation of localized variations in thermal conditions and residential density.
- Social vitality indicators
Stronger gains are observed for social vitality indicators. For passenger flow (PW1, PW7), the linear model shows the lowest explanatory performance, while MX and MM perform at similar levels, with R2 values mainly ranging between 0.2 and 0.3. In contrast, the LC model achieves substantially higher explanatory performance (R2 > 0.8). Although the model does not explicitly include street network topology, the LC results suggest that the spatial structures retained in the latent representations may contain information associated with differences in movement intensity.
For POI density (DP), explanatory performance also improves with latent representations, increasing from approximately 0.42 to around 0.71. Compared with passenger flow, however, the baseline performance of metric-based models is already moderate, and the relative gain is less pronounced. This suggests that while POI density is associated with morphological configurations, part of its variation can still be captured by conventional intensity-based metrics. For functional diversity (SDIP), MR and MM both show low explanatory performance (R2 < 0.05). MX provides only a slight improvement (R2 = 0.11). LC also improves explanatory performance (R2 = 0.4), but it does not reach the level observed for passenger flow indicators. This suggests that spatial variation in functional diversity may be more strongly associated with non-morphological factors, such as functional planning, land-use organization, policy intervention, or business activities.
- Economic indicators
For indicators related to job–housing structure (JHR, JHDM, JHDR), MR and MM show limited explanatory performance (R2 < 0.1), while MX achieves relatively higher values (0.15–0.35). The LC model further increases R2 to a range of approximately 0.45–0.65. These indicators can be partly explained by local morphological information, but their variation may also be influenced by broader spatial structure, transport accessibility, or infrastructure conditions beyond localized morphology.
For real estate-related indicators, non-linear metric-based models improve explanatory performance compared with the linear model, while LC further increases performance. The gains are more pronounced for purchase price (MPP) and transaction frequency (MDFP) than for rental price (MRP). This may suggest that purchase-related indicators are more closely aligned with relatively stable spatial attributes, whereas rental-related variation may be more affected by short-term market factors and locational conditions, making it more difficult to explain using localized morphological differences alone.
For income and consumption indicators (PMI, PHI, PMC, PHC), LC also improves explanatory performance compared with the metric-based baselines, with R2 increasing to the range of 0.6–0.7. This suggests that the LC pathway may use spatially structured information associated with socioeconomic variation.
Taken together, the indicator-level results show that the relative advantage of the latent-representation modeling pathway is visible across domains but uneven across indicators. The gains are more pronounced for passenger-flow and several economic indicators, while they remain limited for indicators more strongly influenced by non-morphological factors.
3.3. Contextual-Scale Sensitivity and Spatial Robustness
- Effect of de-averaging on spatial autocorrelation
The original performance variables show clear spatial continuity and distance decay. As shown in Table 6, the distance-ring Moran’s I results indicate that the original performance variables retain positive spatial autocorrelation across all reported distance rings, although the values gradually decrease as distance increases. In contrast, after neighborhood de-averaging, the Moran’s I values of are substantially reduced and are close to zero or slightly negative for most contextual scales. These results indicate that neighborhood de-averaging effectively weakens the medium-distance spatial background structure embedded in the original performance variables, and that this effect does not depend on a single de-averaging scale.
Table 6.
Mean Moran’s I of absolute and relative performance variables across distance rings and de-averaging scales.
- Contextual-Scale Sensitivity and Marginal Efficiency
After the de-averaging diagnostics, this section further compares the explanatory performance of different modeling pathways across five neighborhood scales to examine whether the relative advantage of the latent-representation modeling pathway depends on a specific contextual scale. Figure 5 presents the average model performance at the 1.0, 1.5, 2.0, 2.5, and 3.0 km scales.
Figure 5.
Contextual-scale sensitivity and marginal efficiency of model explanatory performance.
The results show that the LC model maintains higher explanatory performance than the metric-based baselines across all five contextual scales, indicating that its relative advantage is not limited to a specific scale. The Marginal Efficiency (ME) results further show that, within the multi-indicator comparison in this study, the 2 km scale provides a relatively balanced basis in terms of overall explanatory performance, relative stability of multi-indicator performance, and preservation of local differences. Further expanding the contextual range increases computational cost, and the marginal gains in explanatory performance gradually decrease. Based on these results, the 2 km scale is selected as the representative contextual scale for subsequent validation.
- Spatially Grouped Cross-validation of Relative Advantage between Modeling Pathways
Because non-overlapping tiled sampling would not provide sufficient sample size or adequate coverage of local morphological differences, this study uses overlapping sliding-window sampling as a sample expansion strategy. To examine whether the advantage of the latent-representation modeling pathway over the metric-based pathway depends on local sample mixing that may be introduced by random partitioning of overlapping samples, this section further conducts research-unit-scale spatially grouped cross-validation.
Specifically, the study area is divided into tiled groups based on the 300 m research-unit scale, and each sample is assigned to a group according to the 300 m grid cell in which its center is located. Five-fold cross-validation is then conducted at the group level, ensuring that samples within the same group do not appear simultaneously in the training and testing sets. The de-averaging diagnostics reported above show that Moran’s I of is substantially reduced in distance rings beyond 300 m, which provides ancillary support for using research-unit-scale spatially grouped validation. In total, the validation includes 2674 valid groups, with approximately one-fifth of the groups used as the test set in each fold.
The results for all modeling frameworks are shown in Table 7. The LC model achieves the highest R2 and the lowest MSE across all indicators. Relative to the strongest metric-based baseline for each indicator, LC achieves an average R2 gain of 0.223 and an average MSE difference of −0.006. These results indicate that the relative advantage of the latent-representation modeling pathway remains observable under research-unit-scale spatially grouped cross-validation.
Table 7.
Spatially grouped validation of relative model advantage at the 2 km contextual scale.
4. External Validation: Temporal Generalizability Under Data Shifts
4.1. Temporal Changes in Urban Performance Data (2020–2024)
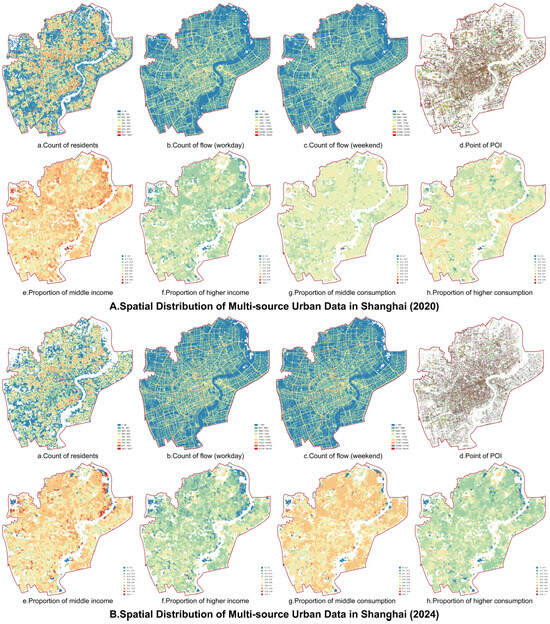
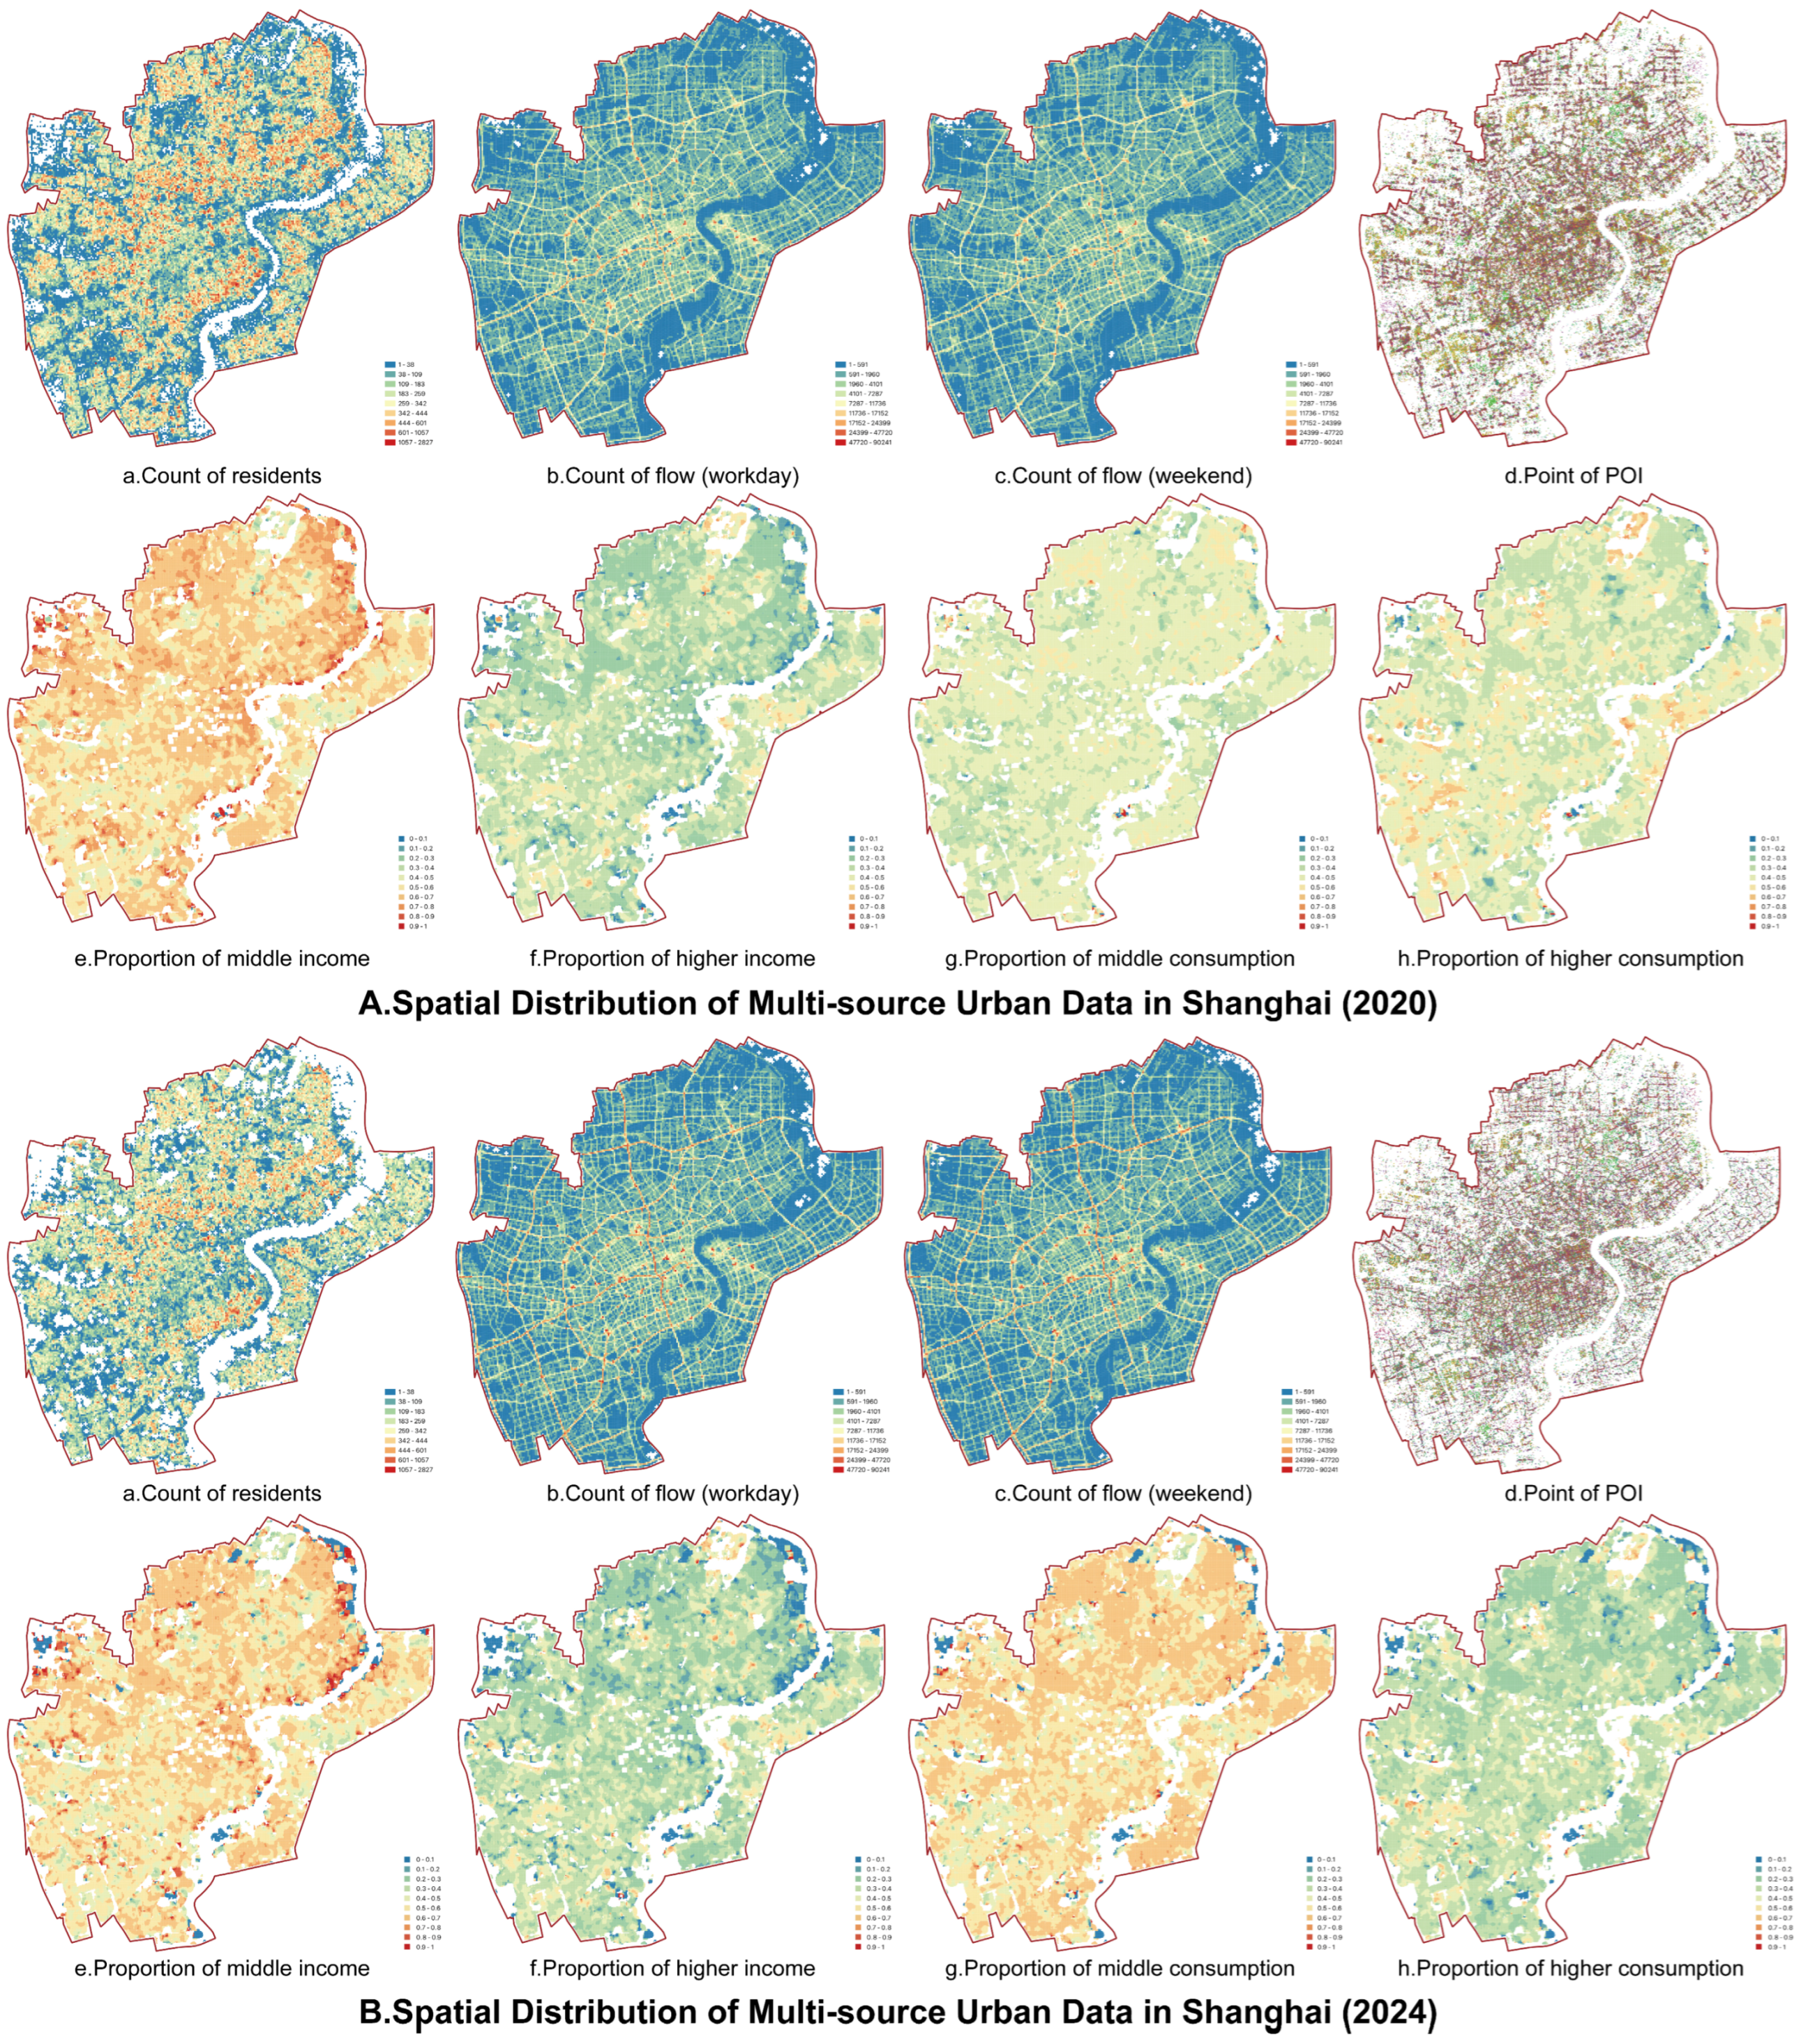
Urban data for 2024 were used as an external validation set (n = 79,223). Compared with 2020, both the magnitude and spatial distribution of multiple indicators show substantial changes (Figure 6; Table 8), providing a suitable test for cross-temporal generalizability under data shifts. The two time points correspond to different macro contexts, allowing model generalizability to be evaluated beyond in-sample conditions.
Figure 6.
Spatiotemporal distributions of urban performance data in Shanghai in 2020 and 2024. Subpanels show residential population density, workday flow intensity, weekend flow intensity, points of interest, proportion of middle income, proportion of higher income, proportion of middle consumption, and proportion of higher consumption.
Table 8.
Descriptive statistical comparison of urban data (2020 vs. 2024).
Several broad patterns can be observed. First, residential population becomes more spatially homogenized, with reduced variability (CV decreases from 0.93 to 0.81). Second, social vitality indicators, including passenger flow on both workdays and weekends as well as POI density, increase in magnitude while exhibiting higher spatial heterogeneity (CV increases). Third, economic indicators show distributional shifts, particularly in income and consumption structure, indicating changes in the spatial distribution of socioeconomic characteristics. Overall, these changes suggest that the relationship between urban morphology and performance is tested under substantially different data distributions, providing a robust basis for cross-temporal validation.
Due to data availability constraints, not all performance indicators used in the 2020 analysis are included in the 2024 validation set. The validation therefore focuses on a subset of indicators for which comparable data are available across both periods. While this limits full one-to-one comparison across all dimensions, the selected indicators still cover key aspects of urban performance, providing a meaningful test of cross-temporal generalizability.
4.2. External Transfer Performance in 2024 Validation
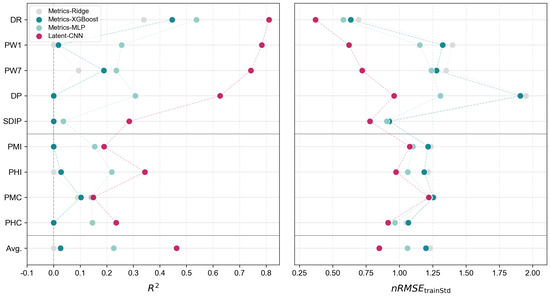
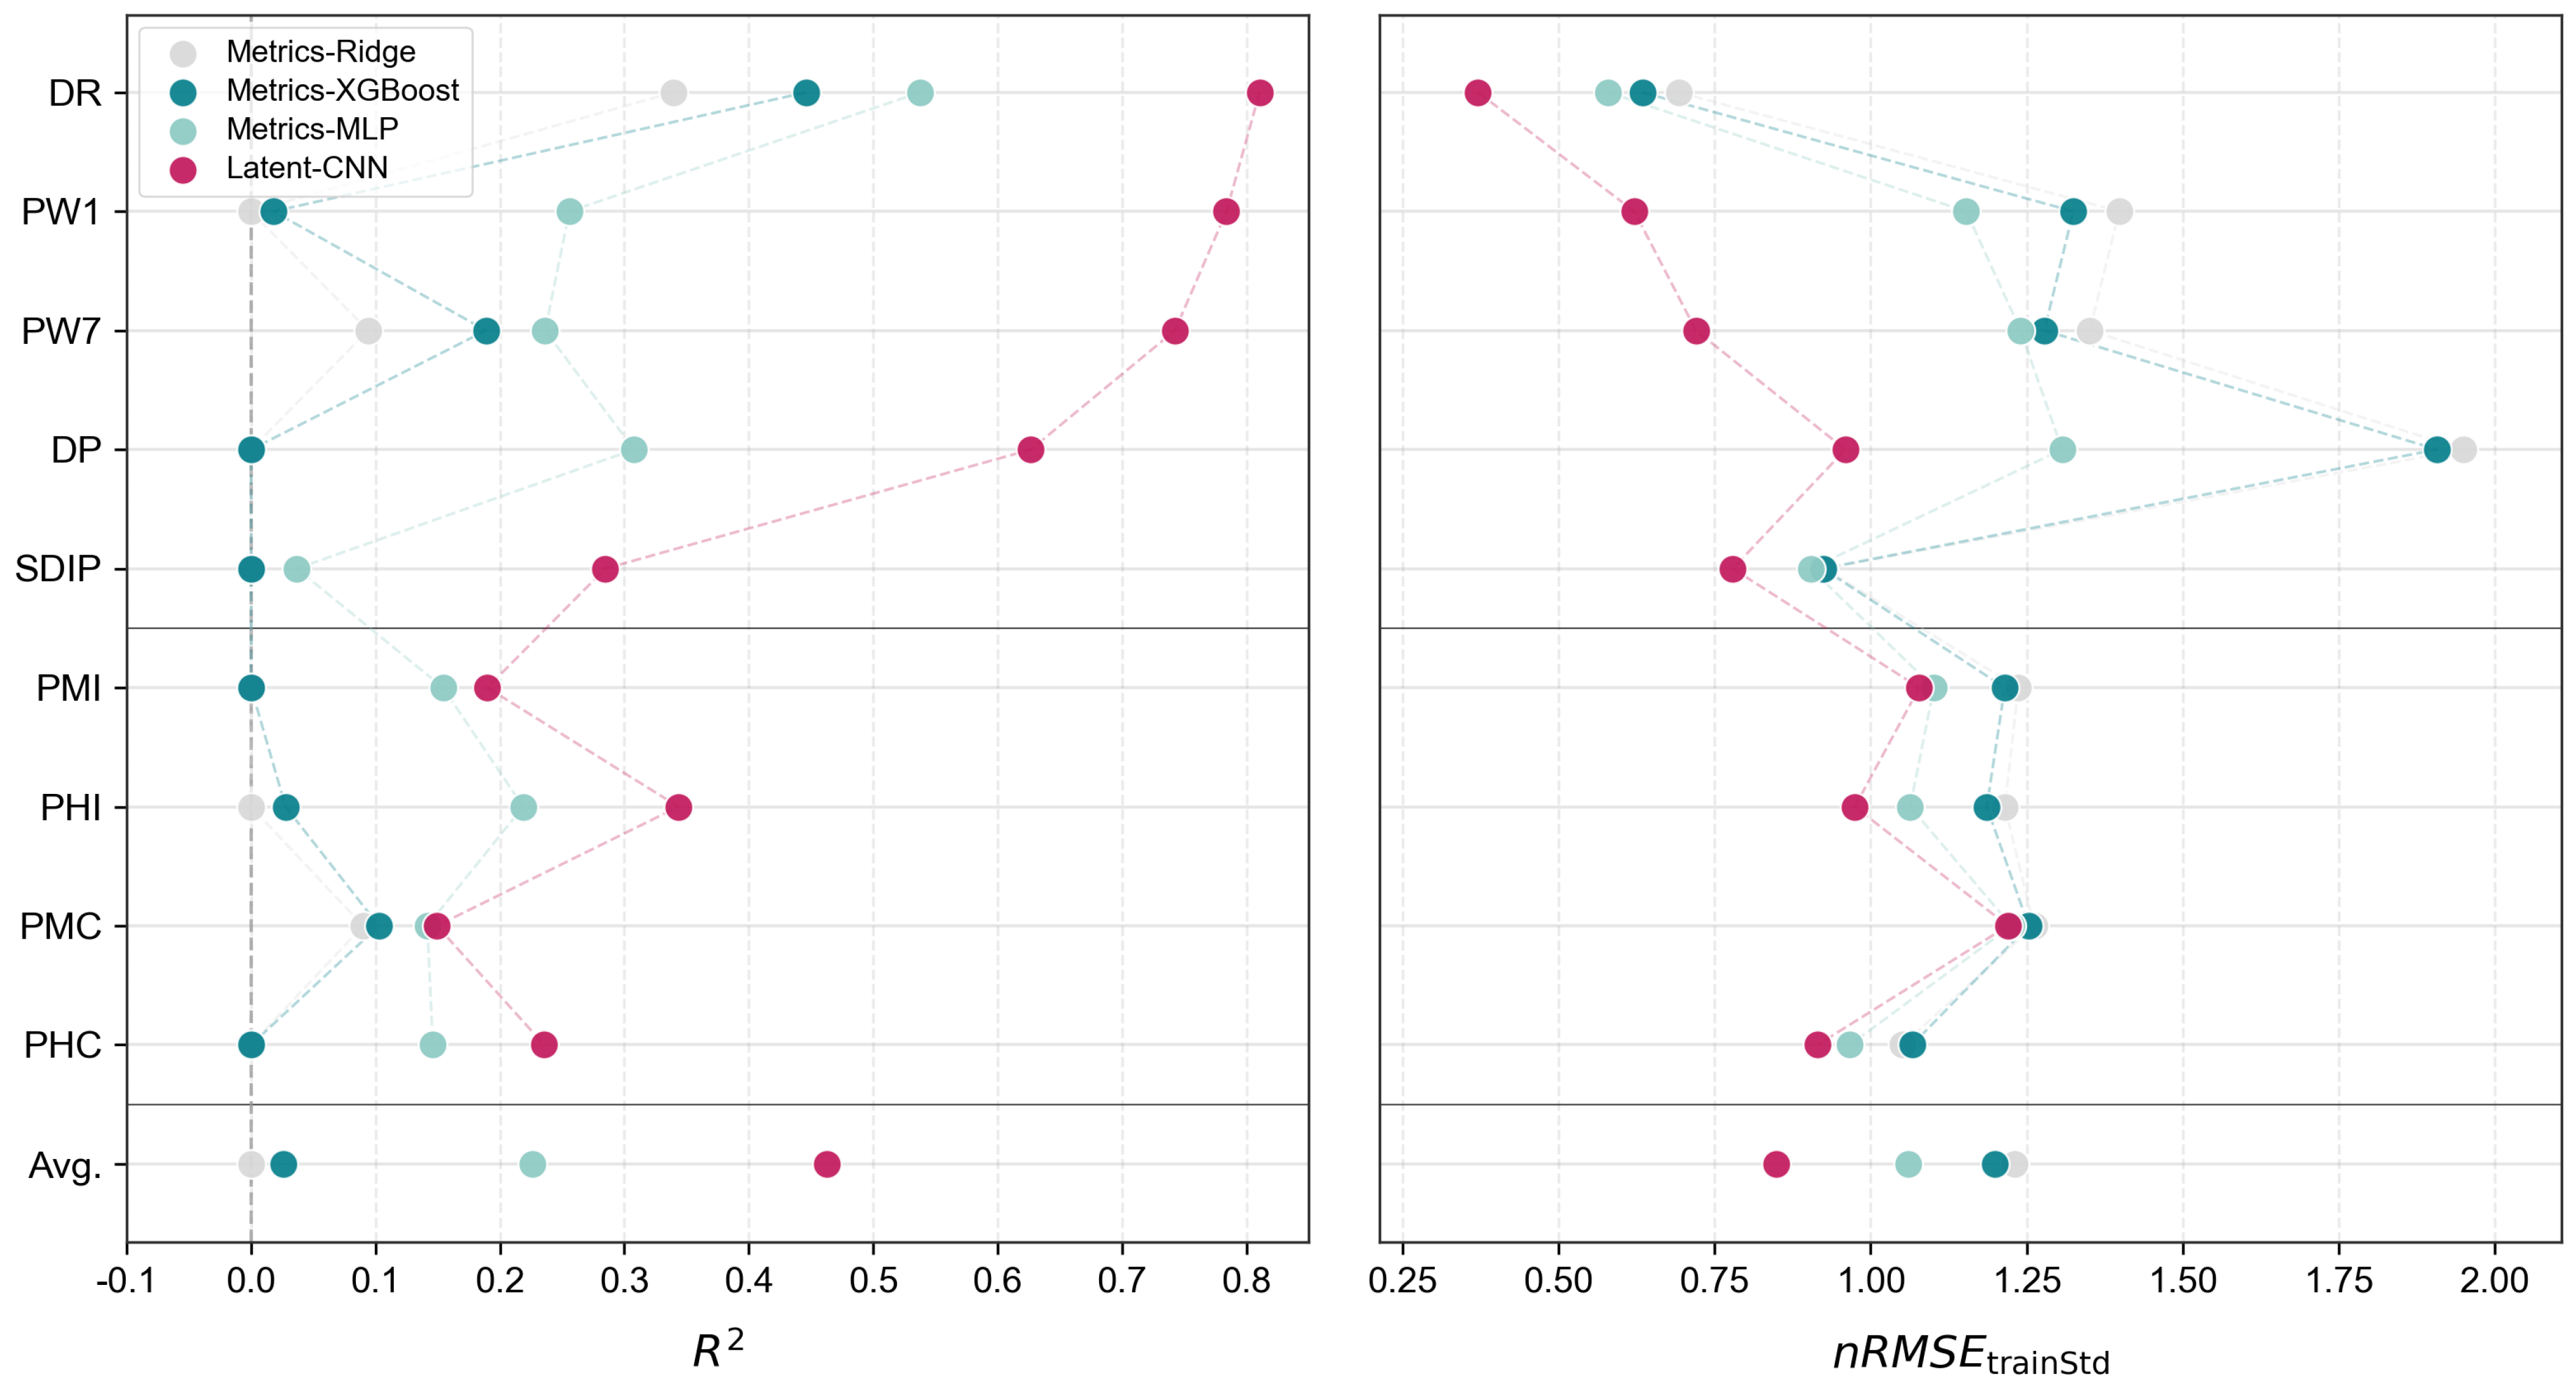
The 2024 external validation results show that, under the same external dataset and evaluation metrics, the latent-representation pathway exhibits stronger temporal generalizability than the hand-crafted metric-based pathways. As shown in Figure 7, the average R2 of LC is 0.463, higher than those of MR, MX, and MM, which are −0.024, 0.026, and 0.226, respectively. Its average nRMSEtrStd is 0.849, lower than the corresponding values of the three metric-based models, namely 1.231, 1.199, and 1.060. These results indicate that, within the current external validation framework, the latent-representation pathway shows a clearer advantage in both explanatory performance and prediction error.
Figure 7.
Temporal generalizability of four modeling frameworks. Higher R2 values indicate stronger explanatory performance on the 2024 external dataset. Negative R2 values are truncated at 0 for visualization. nRMSEtrStd denotes the prediction error normalized by the standard deviation of the training targets, with lower values indicating smaller external prediction errors. Full cross-temporal validation results are provided in Appendix C.
At the metric level, the advantage of LC is not driven by only a few indicators, as it outperforms the strongest metric-based pathway across all indicators available for 2024 validation. Social indicators constitute the main source of this advantage. The R2 values of DR, PW1, PW7, and DP all exceed 0.6. In particular, although the metric-based pathways perform relatively weakly for PW1 and PW7, LC still achieves explanatory performance of 0.784 and 0.743, respectively. This suggests that the latent-representation pathway has stronger external transfer value for social activity-related performance indicators.
However, this pathway advantage does not imply that all indicators have the same level of external explainability. Although SDIP still obtains the highest R2 under LC, its value is only 0.285, which is lower than those of population density and passenger-flow activity indicators. For the economic indicators, the R2 values of PMI, PHI, PMC, and PHC range from 0.15–0.35, also lower than those of population density and activity-intensity indicators. This indicates that, across different performance mechanisms, the latent-representation pathway has a more consistent relative explanatory advantage over the hand-crafted metric-based pathways, but its absolute explanatory capacity still depends on the extent to which each performance indicator can be explained by local morphological differences.
5. Conclusions and Future Work
This study addresses the problem of modeling associations between urban morphology and multidimensional performance. It develops a context-aware de-averaging modeling framework and sets up multiple hand-crafted metric-based baselines to compare the performance of hand-crafted metric pathways and VAE-derived latent-representation pathways in terms of explanatory gain, cross-dimensional response, contextual-scale and spatial robustness, and cross-temporal external validation. The results show that, under the current experimental framework, the overall explanatory pathway formed by combining latent representations with CNN modeling demonstrates stronger multidimensional explanatory capacity and better external validation performance than conventional hand-crafted metric-based pathways.
- For RQ1 (explanatory gain), the main experimental results show that the latent-representation modeling pathway achieves stronger overall explanatory performance than the hand-crafted metric-based pathways. The multi-model baseline results further suggest that this advantage is unlikely to be attributable solely to learner complexity, but instead relates to the overall modeling pathway formed by latent representations and the CNN architecture.
- For RQ2 (cross-dimensional response), the explanatory advantage of the latent-representation modeling pathway is not confined to a single performance domain, but is observed across environmental, social, and economic dimensions.
- For RQ3 (contextual-scale and spatial robustness), the latent-representation modeling pathway shows relative advantages across different contextual scales, indicating that its effectiveness does not depend on a specific contextual scale. The spatially grouped cross-validation results indicate that the main experimental results are not solely attributable to spatial proximity effects under random partitioning. Under a stricter sample partitioning strategy, the advantage of LC over the hand-crafted metric-based pathways remains evident.
- For RQ4 (cross-temporal generalization), the external validation results show that the latent-representation modeling pathway shows a consistent relative explanatory advantage over the hand-crafted metric-based pathways.
Overall, the contributions of this study are mainly reflected in two aspects. At the level of morphological representation, this study introduces VAE-derived latent representations into urban morphology–multidimensional performance modeling, providing a morphological representation scheme that differs from the conventional hand-crafted metric-mediated pathway. Alongside the descriptive and interpretive value of hand-crafted metrics, this scheme offers a complementary pathway for representing high-dimensional and complex urban morphological structures that are difficult to fully capture through predefined indicators. At the level of modeling method, this study develops a context-aware de-averaging modeling framework. By comparing local units within their neighborhood contexts, the framework organizes morphological differences and performance differences within the same relative-change structure, providing an operational method for reducing the influence of locational background differences on the estimation of morphology–performance associations.
The value of this study lies in addressing the difficulty of representing complex urban morphology in a unified manner and the fragmentation of morphology–performance evidence across different domains. It validates a morphology–performance explanatory pathway jointly formed by VAE-derived latent representations and context-aware de-averaging modeling. This pathway enables complex urban morphology to be incorporated into multidimensional performance models through a unified representation and, by reducing the influence of locational background, places local morphological differences and performance differences across environmental, social, and economic dimensions within a unified relative-change framework, thereby allowing morphology–performance explanatory relationships to be identified more clearly. It thus provides a quantitative basis for integrated urban morphology evaluation and performance-oriented design evaluation in the early stages of local urban regeneration.
At the same time, the findings of this study have clear applicability boundaries. First, the context-aware de-averaging framework models morphological differences between local units and their neighborhood contexts, together with the corresponding performance differences. The model outputs therefore primarily represent relative performance relationships rather than the absolute performance levels of specific areas. Second, LC shows lower explanatory performance for spatially unseen areas than under spatially mixed samples, indicating that its relative pathway advantage does not imply sufficient capacity for absolute cross-area prediction. Accordingly, the findings are more applicable to comparing the relative performance of different morphological conditions within the same or similar local contexts, and should not be directly used to predict absolute performance across different areas without local validation or calibration.
Several directions for future research remain. First, future studies could explore the direct use of latent spaces for morphology–performance modeling and decision-support-oriented applications, without treating the complete mapping of latent representations back to predefined metrics as a necessary prerequisite. While retaining appropriate interpretation and diagnostic procedures, greater emphasis could be placed on the verifiability, robustness, and practical effectiveness of latent representations, thereby establishing a more direct modeling link between morphological configurations and multidimensional performance. Second, cross-area validation could be extended to additional cities and different types of urban areas to examine the applicability of the latent-representation modeling pathway under varying morphological, socioeconomic, and performance contexts, as well as its requirements for local validation and calibration. Finally, future research could further investigate the integration of latent-representation modeling with urban form generation, scheme comparison, and multi-objective evaluation, extending the framework from morphology–performance explanation toward performance-oriented morphological evaluation and urban regeneration support.
Author Contributions
Conceptualization, Chengyu Sun and Yu Meng; data curation, Xinru Wang and Yu Meng; formal analysis, Yu Meng; funding acquisition, Chengyu Sun; investigation, Yu Meng; methodology, Yu Meng; project administration, Chengyu Sun; software, Yu Meng; resources, Chengyu Sun and Xinru Wang; supervision, Chengyu Sun; validation, Yu Meng; visualization, Yu Meng; writing—original draft, Yu Meng; writing—review and editing, Chengyu Sun, Xinru Wang, and Yu Meng. All authors have read and agreed to the published version of the manuscript.
Funding
This work was supported by the National Natural Science Foundation of China under Grant No. 52478030.
Data Availability Statement
The datasets generated and analyzed during the current study are not publicly available due to privacy and confidentiality constraints regarding urban administrative data. Access to these data is subject to the policies of the Shanghai Key Laboratory of Urban Regeneration and Spatial Optimization Technology. Inquiries regarding data access should be directed to the laboratory via the institutional administrative office.
Acknowledgments
The authors would like to thank the Shanghai Key Laboratory of Urban Regeneration and Spatial Optimization Technology, as well as the Key Laboratory of Ecology and Energy-Saving Study of Dense Habitat (Tongji University), Ministry of Education, for their support in providing the data used in this study.
Conflicts of Interest
The authors declare no conflicts of interest.
Abbreviations
The following abbreviations are used in this manuscript:
| VAE | Variational Autoencoder |
| SD | Stable Diffusion |
| MR | Metrics–Ridge |
| MX | Metrics–XGBoost |
| MM | Metrics–MLP |
| LC | Latent–CNN |
Appendix A. Detailed Implementation Settings
Appendix A.1. Metric-Based Baseline Settings
For MR, MX, and MM, the de-averaged relative metric indicators were used as inputs. MR and MX were trained separately for each performance indicator, whereas MM was implemented as a multi-output neural network that jointly predicted all performance indicators. The architecture of MM is shown in Figure A1. The detailed settings of the three metric-based baselines are summarized in Table A1, and the XGBoost hyperparameter search space is provided in Table A2.
Figure A1.
Architecture of the Metrics-MLP.
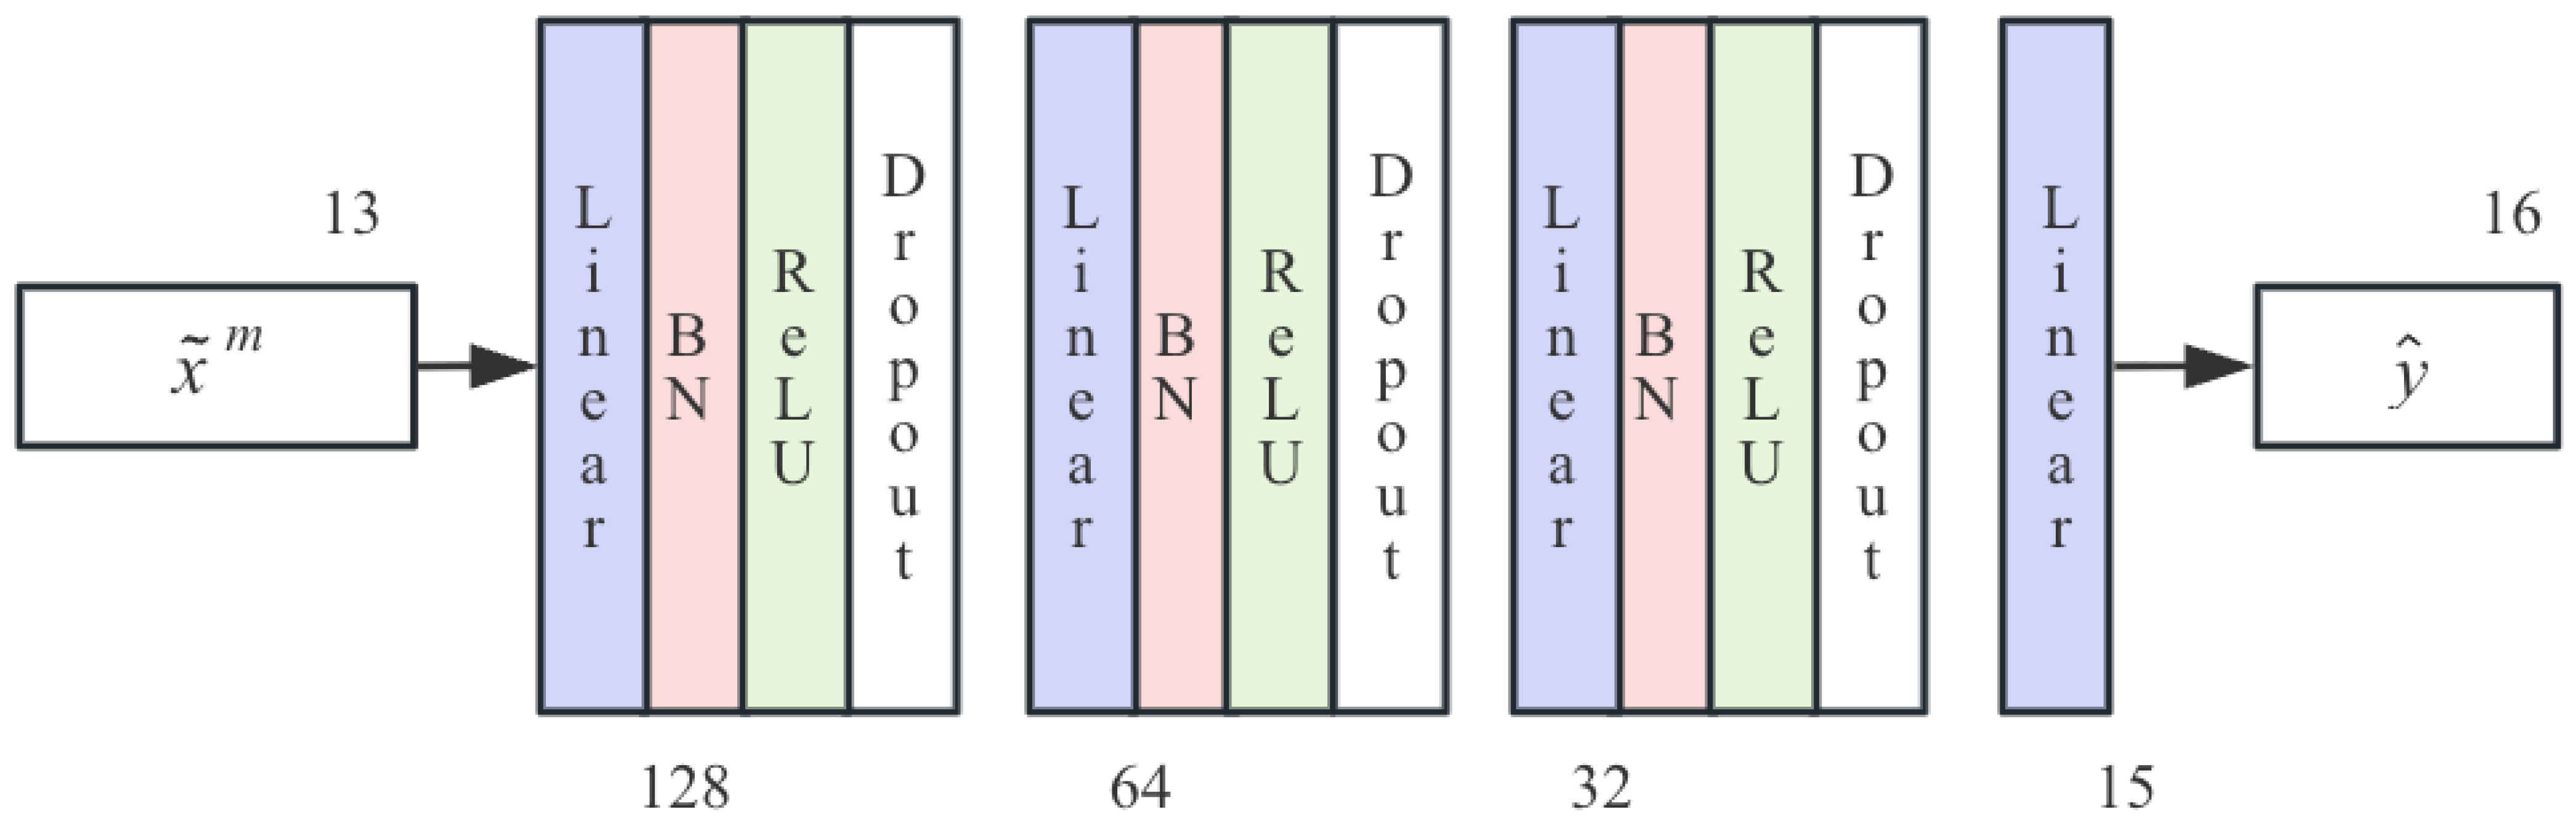
Table A1.
Summary of metric-based baseline settings.
Table A2.
Hyperparameter search space for Metrics-XGBoost.
Appendix A.2. Latent-CNN Settings
The LC model took 64 × 64 × 4 latent tensors as input and predicted 16 performance indicators simultaneously. The network consisted of four convolutional stages with channel sizes of 32, 64, 128, and 256. Each stage included convolutional layers and channel-attention modules (SE blocks), followed by global average pooling. The pooled features were passed through fully connected layers (256 → 128 → 16), with a dropout rate of 0.5 before the final output layer.
The model was trained using MSE loss and the AdamW optimizer, with an initial learning rate of 0.001 and weight decay of 1 × 10⁻⁴. Batch size was set to 128. Samples were randomly divided into training and held-out evaluation sets at a ratio of 0.8:0.2 (random_state = 42). During training, the held-out split was used for validation-based model selection and early stopping. Training was run for up to 150 epochs with warm-up scheduling and early stopping.
Appendix B. Full Model Performance Across Contextual Scales
Table A3.
Full R2 results for Metrics-Ridge across contextual scales.
Table A4.
Full MSE results for Metrics-Ridge across contextual scales.
Table A5.
Full R2 results for Metrics-XGBoost across contextual scales.
Table A6.
Full MSE results for Metrics-XGBoost across contextual scales.
Table A7.
Full R2 results for Metrics-MLP across contextual scales.
Table A8.
Full MSE results for Metrics-MLP across contextual scales.
Table A9.
Full R2 results for Latent-CNN across contextual scales.
Table A10.
Full MSE results for Latent-CNN across contextual scales.
Appendix C. External Cross-Temporal Validation Results
Table A11.
External validation results of four modeling frameworks on the 2024 dataset.
References
- Song, J.; Chen, W.; Zhang, J.; Huang, K.; Hou, B.; Prishchepov, A.V. Effects of Building Density on Land Surface Temperature in China: Spatial Patterns and Determinants. Landsc. Urban Plan. 2020, 198, 103794. [Google Scholar] [CrossRef] [Scilit]
- Wu, Y.; Che, Y.; Liao, W.; Liu, X. The Impact of Urban Morphology on Land Surface Temperature across Urban-Rural Gradients in the Pearl River Delta, China. Build. Environ. 2025, 267, 112215. [Google Scholar] [CrossRef] [Scilit]
- Chen, W.; Wu, A.N.; Biljecki, F. Classification of Urban Morphology with Deep Learning: Application on Urban Vitality. Comput. Environ. Urban Syst. 2021, 90, 101706. [Google Scholar] [CrossRef] [Scilit]
- Wang, B.; Lei, Y.; Xue, D.; Liu, J.; Wei, C. Elaborating Spatiotemporal Associations between the Built Environment and Urban Vibrancy: A Case of Guangzhou City, China. Chin. Geogr. Sci. 2022, 32, 480–492. [Google Scholar] [CrossRef] [Scilit]
- Long, Y.; Huang, C. Does Block Size Matter? The Impact of Urban Design on Economic Vitality for Chinese Cities. Environ. Plan. B Urban Anal. City Sci. 2019, 46, 406–422. [Google Scholar] [CrossRef] [Scilit]
- Martino, N.; Girling, C.; Lu, Y. Urban Form and Livability: Socioeconomic and Built Environment Indicators. Build. Cities 2021, 2, 220–243. [Google Scholar] [CrossRef] [Scilit]
- Rhee, J.; Kiany, K.; de Salvatierra, A. Revealing Implicit Associations between Urban Form and Socioeconomic Indices. Environ. Plan. B Urban Anal. City Sci. 2026. [Google Scholar] [CrossRef] [Scilit]
- Sun, C.; Wang, X.; Meng, Y. A Review of Compactness Indexes of Form in Computational Urban Design. In Proceedings of the 29th International Conference of the Association for Computer-Aided Architectural Design Research in Asia (CAADRIA), Singapore, 23–25 April 2024; Volume 2, pp. 325–334. [Google Scholar]
- Doan, Q.C.; Zhang, X. A Systematic Review of Urban Vitality Studies: Trends and Research Opportunities. Land Use Policy 2025, 158, 107745. [Google Scholar] [CrossRef] [Scilit]
- Xiao, L.; Lo, S.; Liu, J.; Zhou, J.; Li, Q. Nonlinear and Synergistic Effects of TOD on Urban Vibrancy: Applying Local Explanations for Gradient Boosting Decision Tree. Sustain. Cities Soc. 2021, 72, 103063. [Google Scholar] [CrossRef] [Scilit]
- Ming, Y.; Liu, Y.; Li, Y.; Yue, W. Core-Periphery Disparity in Community Vitality in Chongqing, China: Nonlinear Explanation Based on Mobile Phone Data and Multi-Scale Factors. Appl. Geogr. 2024, 164, 103222. [Google Scholar] [CrossRef] [Scilit]
- Gao, S.; Ge, X.; Li, H.; Zhou, H. Analysis of Urban Vitality and Its Driving Factors in Zhengzhou’s Main Urban Area Based on Multi-Source Data and XGBoost. Ecol. Indic. 2025, 179, 114187. [Google Scholar] [CrossRef] [Scilit]
- Yuan, Y.; Guo, W.; Tang, S.; Zhang, J. Effects of Patterns of Urban Green-Blue Landscape on Carbon Sequestration Using XGBoost-SHAP Model. J. Clean. Prod. 2024, 476, 143640. [Google Scholar] [CrossRef] [Scilit]
- Lundberg, S.; Lee, S.-I. A Unified Approach to Interpreting Model Predictions. arXiv 2017, arXiv:1705.07874. [Google Scholar]
- Cai, C.; Guo, Z.; Zhang, B.; Wang, X.; Li, B.; Tang, P. Urban Morphological Feature Extraction and Multi-Dimensional Similarity Analysis Based on Deep Learning Approaches. Sustainability 2021, 13, 6859. [Google Scholar] [CrossRef] [Scilit]
- Yao, J.; Huang, C.; Liu, P.; Zhang, Y. Urban Texture Recognition and Evaluation Based on Artificial Intelligence. Hous. Sci. 2019, 39, 9–14. [Google Scholar]
- Cai, J.; Chen, Y. A Novel Unsupervised Deep Learning Method for the Generalization of Urban Form. Geo-Spat. Inf. Sci. 2022, 25, 568–587. [Google Scholar] [CrossRef] [Scilit]
- Dong, J.; Li, L.; Han, D. New Quantitative Approach for the Morphological Similarity Analysis of Urban Fabrics Based on a Convolutional Autoencoder. IEEE Access 2019, 7, 138162–138174. [Google Scholar] [CrossRef] [Scilit]
- Ran, W.; Yu, J.; Yin, L. Machine-Learning-Driven Comparative Study Morphological Taxonomy in Screen-Based Building Clusters. In Proceedings of the 43rd Annual Conference of the Association for Computer Aided Design in Architecture, ACADIA, Denver, CO, USA, 26–28 October 2023; Volume 2, pp. 596–605. [Google Scholar]
- de-Miguel-Rodriguez, J.; Requena-Garcia-Cruz, M.V.; Romero-Sánchez, E.; Morales-Esteban, A. Automated Building Typology Clustering and Identification Using a Variational Autoencoder on Digital Land Cadastres. Results Eng. 2025, 26, 105232. [Google Scholar] [CrossRef] [Scilit]
- Li, J.; Li, C.; Quan, S.J.; Liang, Y. Deciphering Urban Land Use: A Typological Analysis of Built Form across 105 Urban Areas in the U.S. Using Representation Learning. Land Use Policy 2026, 161, 107878. [Google Scholar] [CrossRef] [Scilit]
- Rhee, J. Comparative Analysis of Urban Structures in Three American Rust Belt Cities. Environ. Plan. B Urban Anal. City Sci. 2025, 52, 2066–2083. [Google Scholar] [CrossRef] [Scilit]
- Amer, A.A.; Abdel-Moneim, N.M.; Khalil, H.A.E.E. What Deep Learning Can (and Can’t) See: A Systemic Review Assessing Applicability for Quantifying Qualities of Urban Vitality. Comput. Urban Sci. 2025, 5, 67. [Google Scholar] [CrossRef] [Scilit]
- Meng, Y.; Wang, X.; Sun, C. Beyond Traditional Metrics: A High-Fidelity Latent-Representation Framework for Urban Morphological Typology Refinement and Quantification. In Proceedings of the 31st International Conference of the Association for Computer-Aided Architectural Design Research in Asia (CAADRIA), Hsinchu City, Taiwan, 26 April–2 May 2026; Volume 3, pp. 675–684. [Google Scholar]
- Liu, Y.; Wang, H. The Effects of 2D and 3D Urban Morphology on Air Quality. Water. Air. Soil Pollut. 2023, 234, 593. [Google Scholar] [CrossRef] [Scilit]
- Akrofi, M.M.; Okitasari, M. Beyond Costs: How Urban Form Could Limit the Uptake of Residential Solar PV Systems in Low-Income Neighborhoods in Ghana. Energy Sustain. Dev. 2023, 74, 20–33. [Google Scholar] [CrossRef] [Scilit]
- Csomós, G.; Bertalan-Balázs, B.; Farkas, J.Z. Investigating the Green and Thermal Environmental Quality of Educational Institutions in an Urban Planning Context: A Debreceni Case Study. Buildings 2026, 16, 836. [Google Scholar] [CrossRef] [Scilit]
- Sun, C.; Meng, Y.; Wang, X. Scale Mismatching: Prevalent Compactness Indexes of Urban Form Do Not Work in Computational Urban Design. In Proceedings of the 29th International Conference of the Association for Computer-Aided Architectural Design Research in Asia (CAADRIA), Singapore, 23–25 April 2024; Volume 2, pp. 455–464. [Google Scholar]
- Kingma, D.P.; Welling, M. Auto-Encoding Variational Bayes. arXiv 2013, arXiv:1312.6114. [Google Scholar] [CrossRef] [Scilit]
- Rombach, R.; Blattmann, A.; Lorenz, D.; Esser, P.; Ommer, B. High-Resolution Image Synthesis with Latent Diffusion Models. In Proceedings of the 2022 IEEE/CVF Conference on Computer Vision and Pattern Recognition (CVPR), New Orleans, LA, USA, 21–24 June 2022; pp. 10674–10685. [Google Scholar]
- Stability AI. SD-VAE-FT-EMA Weights. 2022. Available online: https://huggingface.co/stabilityai/sd-vae-ft-ema (accessed on 15 July 2026).
- Stability AI. SD-VAE-FT-MSE Weights. 2022. Available online: https://huggingface.co/stabilityai/sd-vae-ft-mse (accessed on 15 July 2026).
- Zhang, R.; Isola, P.; Efros, A.A.; Shechtman, E.; Wang, O. The Unreasonable Effectiveness of Deep Features as a Perceptual Metric. In Proceedings of the IEEE Conference on Computer Vision and Pattern Recognition (CVPR), Salt Lake City, UT, USA, 19–21 June 2018; pp. 586–595. [Google Scholar]
- Wang, Z.; Bovik, A.C.; Sheikh, H.R.; Simoncelli, E.P. Image Quality Assessment: From Error Visibility to Structural Similarity. IEEE Trans. Image Process. 2004, 13, 600–612. [Google Scholar] [CrossRef] [Scilit] [PubMed]
- Fotheringham, A.S.; Brunsdon, C.; Charlton, M. Geographically Weighted Regression. Sage Handb. Spat. Anal. 2009, 1, 243–254. [Google Scholar] [CrossRef] [Scilit]
- Tu, W.; Zhu, T.; Zhong, C.; Zhang, X.; Xu, Y.; Li, Q. Exploring Metro Vibrancy and Its Relationship with Built Environment: A Cross-City Comparison Using Multi-Source Urban Data. Geo-Spat. Inf. Sci. 2022, 25, 182–196. [Google Scholar] [CrossRef] [Scilit]
- Elhorst, J.P. Spatial Econometrics: From Cross-Sectional Data to Spatial Panels; Springer: Berlin/Heidelberg, Germany, 2014. [Google Scholar]
- Kuminoff, N.V.; Parmeter, C.F.; Pope, J.C. Which Hedonic Models Can We Trust to Recover the Marginal Willingness to Pay for Environmental Amenities? J. Environ. Econ. Manag. 2010, 60, 145–160. [Google Scholar] [CrossRef] [Scilit]
- Hoerl, A.E.; Kennard, R.W. Ridge Regression: Biased Estimation for Nonorthogonal Problems. Technometrics 1970, 12, 55–67. [Google Scholar] [CrossRef]
- Chen, T.; Guestrin, C. XGBoost: A Scalable Tree Boosting System. In Proceedings of the 22nd ACM SIGKDD International Conference on Knowledge Discovery and Data Mining, San Francisco, CA, USA, 13 August 2016; pp. 785–794. [Google Scholar]

Disclaimer/Publisher’s Note: The statements, opinions and data contained in all publications are solely those of the individual author(s) and contributor(s) and not of MDPI and/or the editor(s). MDPI and/or the editor(s) disclaim responsibility for any injury to people or property resulting from any ideas, methods, instructions or products referred to in the content. |
© 2026 by the authors. Published by MDPI on behalf of the International Society for Photogrammetry and Remote Sensing. Licensee MDPI, Basel, Switzerland. This article is an open access article distributed under the terms and conditions of the Creative Commons Attribution (CC BY) license.