


Abstract
The construction of the Archaeological Site Prediction Model (ASPM) and quantitative research on the driving mechanisms of influencing factors are key to better understanding the multidimensional interactions between ancient humans and the environment. They also constitute an essential technical approach for guiding field archaeological survey and excavation. This study aims to develop a highly stable, accurate, and interpretable predictive model for archaeological sites in the Chongqing Three Gorges region (CQTGR). BP neural network prediction (BPNN) has been applied in various fields, but its random initial weights and thresholds often lead to suboptimal accuracy and weak interpretability. To address these issues, this study constructs BPNN optimized with a Bayesian algorithm to enhance its accuracy. Additionally, it integrates the SHAP model to quantitatively identify nonlinear interactions and threshold effects of influencing factors, thereby improving its interpretability. The results indicate that: (1) The BPNN-based prediction model outperforms other conventional models. After hyperparameter optimization using the Bayesian algorithm, the AUC (area under the ROC curve) on the test set increases by 0.0812, reaching a final value of 0.8815. This indicates that the optimization model is effective and that the model exhibits strong predictive capability. (2) Archaeological sites exhibit a tiered and linear corridor distribution pattern along the Yangtze River and its major tributaries. This pattern can be divided into five concentric tiers radiating outward from the core of the main river systems. High-probability zones are particularly clustered in the low-lying and flat river valleys. (3) The distribution of archaeological sites is comprehensively influenced by both the natural environment and human activities. Elevation and river systems are key driving factors, with NDVI and land use also exerting significant influence. The major factors demonstrate notable threshold and interaction effects. Areas where the interaction between factors exhibits positive enhancement are often the core areas of archaeological site distribution. This research not only provides a precise scientific basis for the preventive protection and monitoring of potential distribution areas of archaeological sites but also offers decision support for the spatial conservation planning of these sites.
1. Introduction
Archaeological sites are remnants of early human activities preserved on the Earth’s surface, serving as historical witnesses to the long-term interaction between humans and nature. They hold rich historical, scientific, cultural, and other values, making them invaluable cultural heritage [1]. However, with the rapid development of globalization and urbanization in recent years, archaeological sites are facing threats such as disappearance and degradation. As a result, preventive conservation and monitoring of archaeological sites have become a hot topic in landscape archaeology research [2,3]. Archaeological Site Predictive Modeling (ASPM) is an important quantitative method for estimating the probability of archaeological site occurrence. It can be used to predict potential distribution areas of archaeological sites and to understand the relationship between human site selection and the natural environment, which is of great significance for revealing ancient human–environment interactions, conducting archaeological surveys and excavations, and supporting cultural heritage conservation and management [4]. Traditional archaeological survey and detection methods have obvious limitations in achieving systematic excavation and monitoring of archaeological sites over large areas with high precision and efficiency [5], making it difficult to meet the demands of refined cultural heritage management in the new era. Archaeological predictive models narrow the scope of archaeological surveys and provide crucial regional indicators for detecting and identifying potential site locations [6], especially in topographically complex mountainous areas, where they reduce the difficulty of archaeological detection and improve field survey efficiency. The Chongqing Three Gorges region (CQTGR) is located in the transitional zone between the second and third topographic steps of China and serves as a major transportation route and cultural corridor in the upper Yangtze River region. The Chongqing Three Gorges culture embodies and documents the development and transformation of human society and culture in the Three Gorges region over the past two million years, resulting in rich archaeological sites with distinctive regional characteristics [7,8]. In recent years, however, archaeological sites in the CQTGR have faced dual threats from economic development and environmental destruction. Moreover, during the salvage excavations of Three Gorges cultural relics, it has been found that some ancient sites still require further investigation and excavation. Given the constraints of time and resources, archaeologists face the practical challenge of cultural heritage protection [9]. Consequently, there is an urgent need to develop a model that not only achieves high prediction accuracy but also provides interpretability of its predictive mechanisms for archaeological research in CQTGR.
Archaeological sites prediction (ASP) plays a critical role in archaeological survey and excavation as well as in cultural heritage conservation and monitoring, and thus holds significant research value [6]. The progress in the prediction of archaeological sites is presented in Table 1. Archaeological site prediction originated in the 1950s when Viru Valley [10] pioneered the prediction of archaeological sites in the Virú Valley of Peru during a study of settlement systems, preliminarily exploring the relationship between site distribution and the environment through qualitative analysis. By the 1980s, with the advancement of computer technology, ASPM had emerged and gained traction in North America. Archaeologists Green et al. proposed an archaeological site predictive model in 1973 and applied it to the spatial analysis of Maya sites in South America [11]. Subsequently, Kvamme integrated statistical and spatial analysis techniques to improve and apply archaeological predictive models [12]. Since then, ASPM has gradually become a broad and important research direction in GIS applications within archaeology [6,13]. Entering the 21st century, archaeological site prediction has been successfully applied in numerous archaeological surveys and cultural heritage conservation efforts worldwide, such as in northeastern Romania [14], multiple regions of China [2,8,15], Japan [4], and northwestern Belize [16]. These applications mainly focus on two aspects.
Table 1.
Comparison of core methods and performance characteristics of ASPM across different periods.
First, methods for ASPM have gradually exhibited diversified and varied developmental characteristics, and can be roughly divided into three categories: statistical analysis methods, machine learning methods, and hybrid methods [5]. Traditional analytical approaches include logistic regression (LR), coefficient of variation methods, and improved stochastic gradient ascent methods [17,18,19,20], among which the logistic model is the most widely used. These methods rely heavily on a large number of samples and produce easily interpretable results. However, when the sample size in a small watershed is limited, the application of statistical methods faces certain constraints. Moreover, they struggle to capture the complex nonlinear relationships between site distribution and environmental factors, often leading to underfitting and low precision [15]. In recent years, the development of artificial intelligence has expanded and revolutionized archaeological methods and technologies. Machine learning methods mainly include Maximum Entropy, Random Forests (RF), Support Vector Machine (SVM), XGboost, etc. [3,5,21,22]. Some scholars have begun applying machine learning to archaeological site prediction and conducted comparative studies with traditional methods, demonstrating that machine learning performs significantly better in site prediction [15,23,24]. Caspari [25] further adopted convolutional neural networks for site prediction; Yuan Wang [4] used a hybrid algorithm combining frequency ratio and attention mechanism in deep learning for site prediction, revealing the great potential of deep learning algorithms in archaeological applications. Nevertheless, the application of deep learning models in site prediction is still in its early stage and has not been fully validated, especially lacking systematic validation in regions with pronounced spatial heterogeneity (e.g., the complex mountainous area of the Three Gorges in Chongqing) [15]. Moreover, most models focus on improving predictive performance while offering weak interpretability. The SHAP interpretability model provides important technical support for the application of site prediction models, as it can compensate for the “black box” effect of prediction models, making the decision-making process transparent and greatly enhancing the application value of the models [26]. Therefore, integrating multiple models to construct an interpretable archaeological site prediction model is urgently required.
Second, the selection of influencing factor variables is key to constructing ASPM, as it directly affects prediction accuracy. The principle underlying the construction of the influencing factor variable system is the coupling relationship between humans and the environment. Traditional variables are mostly natural environmental variables, with topographic and hydrological variables being the most widely used types. These variables have demonstrated outstanding advantages in capturing surface morphological features, but little consideration has been given to human activity influences [5]. In recent years, advances in computer and remote sensing technologies have continuously transformed archaeological research methods, and multi-source data fusion has gradually become a new research trend, offering the possibility of building more systematic predictive models [27]. Thus, a systematic predictive indicator system for ancient sites in the CQTGR is urgently needed to improve prediction accuracy.
To address the aforementioned issues and limitations in archaeological site prediction, this study developed an enhanced interpretable deep learning prediction model (BPNN-SHAP) and applied it for the first time to the CQTGR. The study aims to achieve the following three objectives: (1) Construct an interpretable prediction model combining Bayesian optimization with BPNN-SHAP to explain the spatial distribution characteristics and patterns of archaeological sites, thereby providing a scientific basis for field archaeological survey and excavation, as well as for the tiered conservation and monitoring of cultural heritage. (2) Evaluate the accuracy and practicality of the model in predicting archaeological sites in complex mountainous regions, and compare it with traditional models to enhance its application value. (3) Quantitatively identify and interpret the key influencing factors, thresholds, and interaction effects shaping the distribution of archaeological sites in the CQTGR, in order to reveal the patterns of human–nature interaction in the region. This research will not only provide precise scientific support for the construction of the Chongqing Three Gorges section of the Yangtze River National Cultural Park, but also offer a transferable technical approach for archaeological site prediction in other topographically complex mountainous areas.
2. Materials, Methods, and Experimental Procedure Design
2.1. Study Area
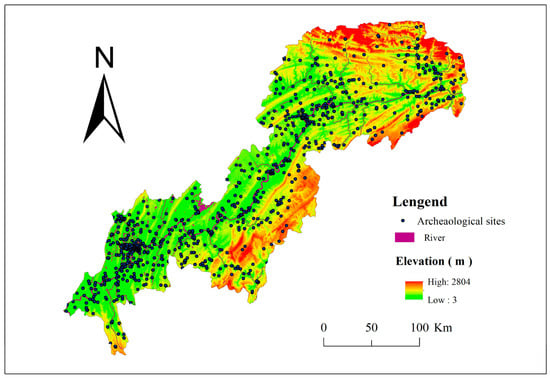
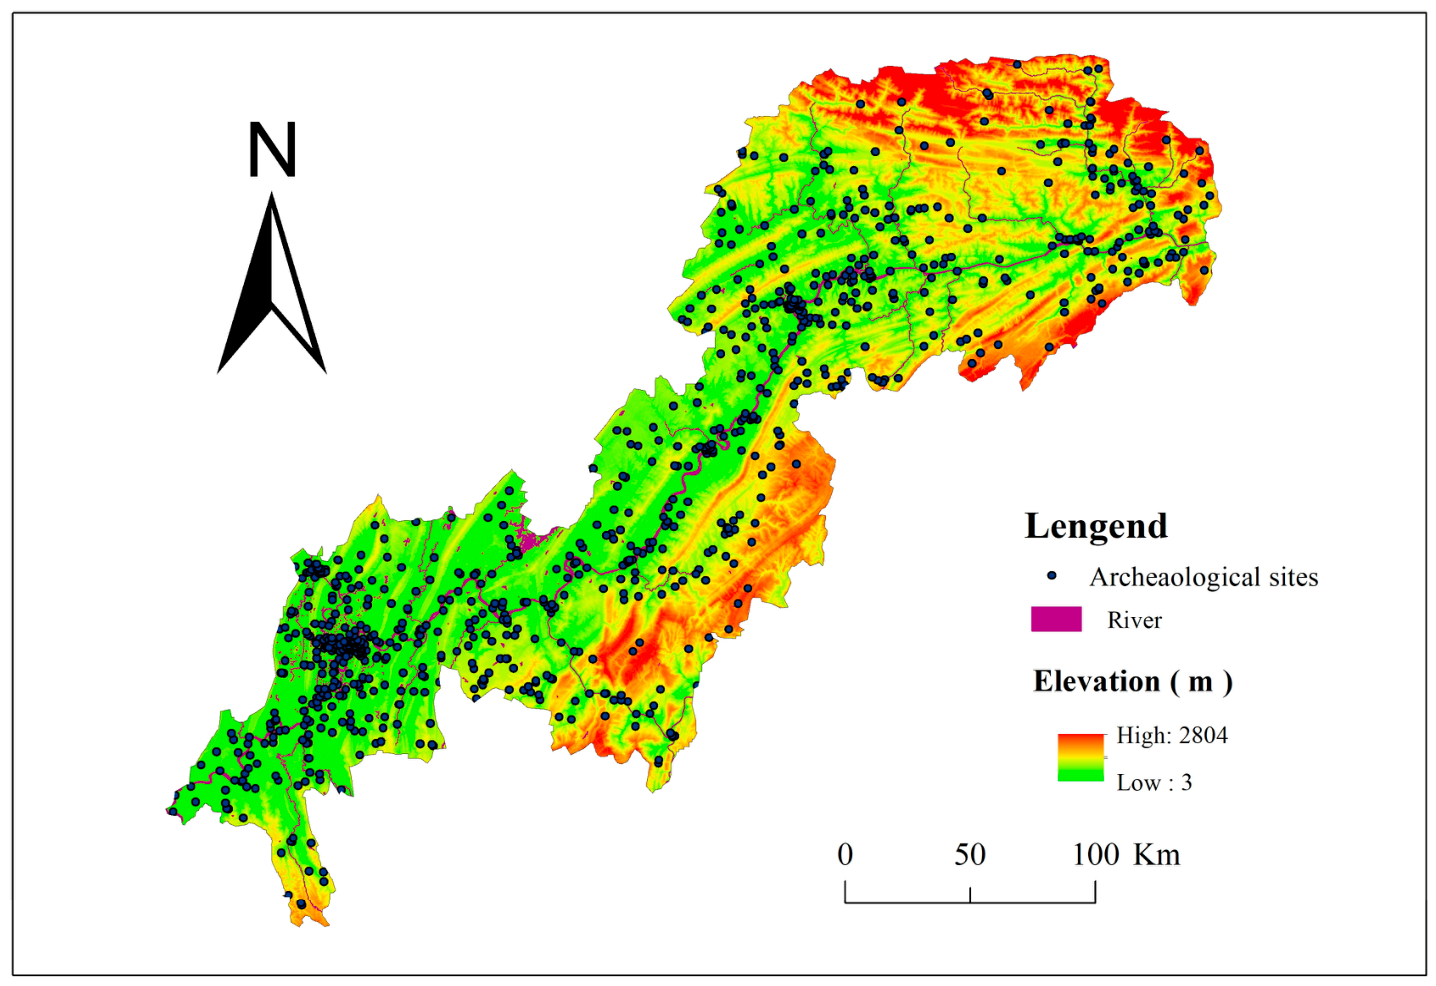
The Chongqing Three Gorges region (Figure 1), located between 28°31′–31°44′ N and 105°49′–110°12′ E, encompasses 22 districts and countries including Fengjie, Shizhu, Jiangjin and so on, covering an area of approximately 46,200 km2. Since ancient times, this region has been a core area of civilization in the upper reaches of the Yangtze River. Situated in the transitional zone between China’s second and third topographic steps, the area features complex terrain dominated by hills and mountains. The western part is the eastern Sichuan parallel ridge-valley belt, characterized mainly by hilly and low mountain areas, while the eastern part is a mid-low mountain region. Meanwhile, located in a subtropical monsoon climate zone, CQTGR has a warm and humid climate with abundant animal and plant resources. Moreover, the Yangtze River runs across the entire region, with well-developed tributaries and rich water resources [28]. In addition, CQTGR boasts exceptionally rich mineral resources, including salt springs and cinnabar, and its unique geographical environment was therefore suitable for ancient human activities. Consequently, CQTGR has witnessed human activity since around two million years ago. The discovery of Wushan Man confirms that CQTGR is an important area for the origin of humans in East Asia. CQTGR is also the heartland of Ba culture and the civilization of the Ba state, where the Ba cultural relics are particularly distinctive. Since the Qin and Han dynasties, with the advancement of Sinicization, the culture of CQTGR continued to develop, reaching its peaks during the Qin–Han and Ming–Qing periods. Since modern times, CQTGR, serving as the wartime capital, has preserved a wealth of Important Modern and Contemporary Historical Sites and Representative Architecture. In summary, the relics within CQTGR are diverse in type and distinctive in character, including ancient buildings, ancient tombs, ancient city sites, stone carvings, and salt-cinnabar mining sites. Most cultural relics are distributed along the Yangtze River and its tributaries, often located in wide river valley areas or on adjacent terraces and slopes, forming a unique beaded cultural corridor. Moreover, owing to its unique geographical position, CQTGR served as a core interaction zone between the cultures of the upper and middle Yangtze River, as well as between the Yangtze and Yellow River cultures [29]. The regional culture is characterized by diverse coexistence, along with distinct features such as uniqueness, openness, inclusiveness, and continuity. Therefore, the ancient sites in CQTGR hold significant research value. They not only provide a scientific basis for the construction of the Yangtze River National Cultural Park in the Chongqing section but also offer data support and value interpretation for the establishment of the Chongqing Three Gorges cultural identity.
Figure 1.
Distribution map of archaeological sites in the study area.
2.2. Data Resource
In this study, a spatial database of archaeological sites in the CQTGR was established, with a primary focus on site information dating from the Neolithic period onward. The original data sources are listed in Table 2. During data collection, representative and typical sites or site clusters were selected through a combination of literature analysis and field investigation. The DEM data were obtained from the Geospatial Data Cloud as images with a spatial resolution of 30 m, which can accurately reflect the macro-scale topographic units of paleotopography in the historical period and effectively avoid interference from modern landform modification details [3]. Since the Holocene, no significant geological activities have occurred in the CQTGR, and both geological structures and landform morphology have remained largely unchanged [30,31]. Therefore, it is feasible to use modern data to predict the distribution of archaeological sites. Meanwhile, during the data processing, to further improve the objectivity and authenticity of the data, this study split the paleosites that contained multiple features or were widely scattered, ultimately obtaining 1227 sample points. At the same time, to reduce errors, the spatial resolution of the raster data was uniformly resampled to 1000 m.
Table 2.
Data resource.
2.3. Methods
2.3.1. Backpropagation Neural Network
BPNN is a bionic algorithm that simulates the transmission of neural information in the human brain. It was jointly proposed by Rumelhart and Hinton in 1986 and is a hierarchical feedforward artificial neural network composed of an input layer, one or more hidden layers, and an output layer [32]. This study aims to construct a backpropagation (BP) neural network model based on binary classification to reveal the selective preferences and changing trends of archaeological site distribution in response to environmental factors within the CQTGR. Its operational mode involves the gradual optimization of connection weights and thresholds between neurons across layers through error backpropagation, with iterative adjustments continuing until the error reaches a predefined target value [32]. During the data training process, it can accurately identify the intrinsic relationship between input and output data through extensive and complex sample training, thereby enabling precise prediction of archaeological sites. BPNN exhibits strong mapping capabilities, self-learning and self-adaptation abilities, as well as data generalization capacity, resulting in high prediction accuracy [33].
2.3.2. Bayesian Optimization Algorithm
Bayesian optimization is a model-based approach that constructs a Gaussian process surrogate model based on Bayesian theorem to approximate the objective function [34]. It utilizes an acquisition function to guide sampling, aiming to identify the global optimum with minimal experimental trials for hyperparameter tuning in BPNN. Compared to traditional grid search, Bayesian optimization demonstrates faster and more intelligent convergence to the optimal solution. With Bayesian hyperparameter optimization, BPNN not only saves computational cost but also significantly improves prediction accuracy.
2.3.3. SHAP
This study further integrates the SHAP model for systematic exploration, aiming to uncover the complex nonlinear relationships between the distribution of archaeological sites and environmental factors. This approach compensates for the insufficiency of black-box effects in predictive modeling and enhances the understanding of the decision-making process within the predictive model. As an important method in explainable AI, the SHAP model quantifies the actual contribution of each feature to the target variable by calculating the importance of features based on the sum of their average marginal contributions to the predictive model [35]. SHAP interaction effects measure the interaction between different features by computing the average contribution of each feature across various feature combinations [36], thereby analyzing the synergistic and trade-off effects between factors and identifying regions of positive synergistic enhancement between two factors. The SHAP value of the feature , which indicates its marginal contribution to the model prediction, can be computed as follows [37]:
where denotes the total number of features, is the set of all possible feature combinations excluding , is a feature subset within , represents the model prediction incorporating the features in , and is the prediction for the union of features in and the feature .
The predicted value for the sample is computed as follows:
where is the average predicted value across the training dataset, and represents the marginal contribution of the i-th feature for the j-th sample.
2.3.4. LOWESS (Locally Weighted Scatterplot Smoothing)
LOWESS, short for locally weighted scatterplot smoothing, was first proposed by Cleveland in 1979 and later refined by Cleveland and Devlin [38,39]. It is an algorithm that fits nonlinear curves using locally weighted regression for trend analysis. This study utilizes the SHAP values of various features to perform LOWESS curve fitting, aiming to capture and visualize the complex nonlinear relationships between feature values and predicted values. By visualizing the trend of the curves, threshold points can be further identified. These thresholds represent points where the intensity or direction of the influence of feature factors on the probability of site distribution undergoes significant changes. This threshold is a key indicator for quantifying the adaptability of ancient human activity site selection to environmental variables.
2.4. Experimental Procedure Design
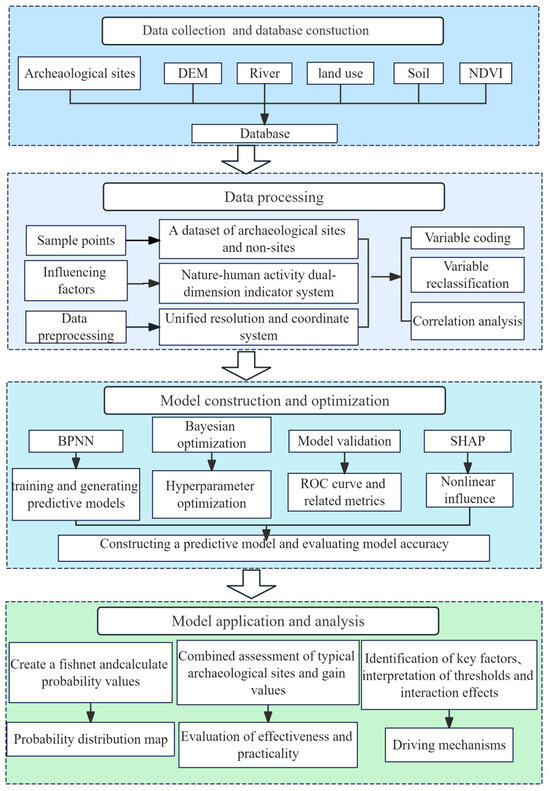
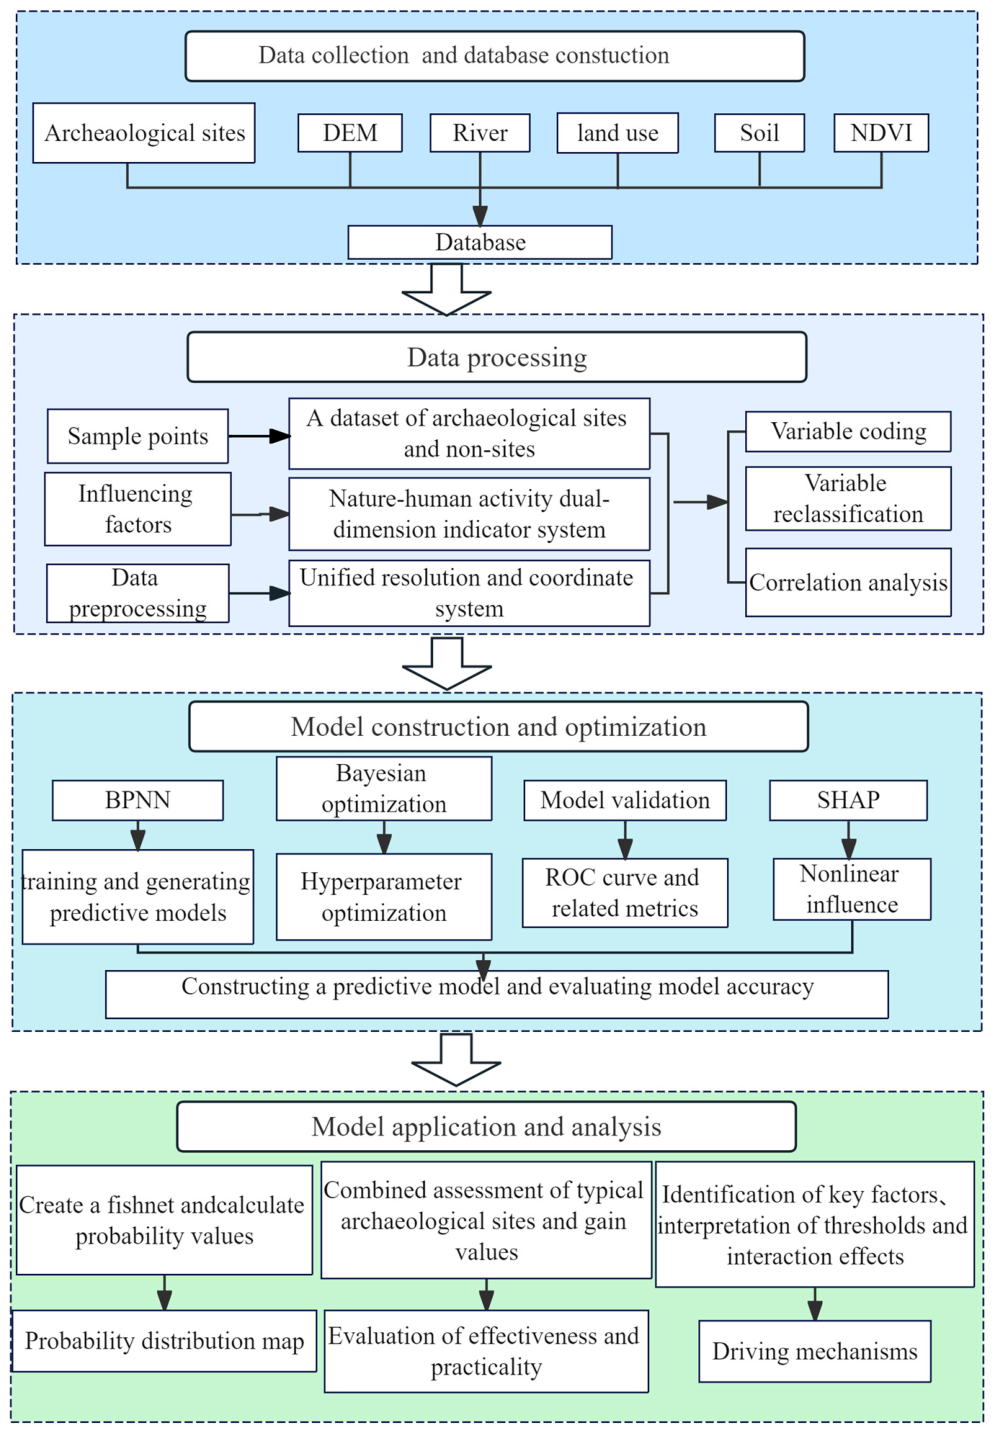
This study developed an interpretable predictive model for archaeological sites applicable to the CQTGR and validated its effectiveness and practicality. The detailed research procedure is illustrated in Figure 2.
Figure 2.
Technical roadmap for archaeological site prediction.The arrows indicate the research process, and the different colors of the boxes represent different research contents.
2.4.1. Data Collection and Influencing Factors Selection
This study focuses on CQTGR as the research region and collects relevant data, including information on archaeological sites, DEM, river systems and so on. A spatial database of archaeological site resources was constructed using a GIS platform. The archaeological sites (1227 in total) were used as positive samples and labeled as 1, while negative samples were collected at a 1:1 ratio. The negative samples were generated using the random point tool in ArcMap 10.7, with points falling within a 1000 m buffer zone of archaeological sites excluded and were labeled as 0.
The CQTGR features a unique riverine mountainous landscape, with high ridges and connected mountains, as well as narrow and deep valleys. This distinctive natural environment constrained the ways of human subsistence. In ancient times, due to low levels of economic development, human activities were highly dependent on the natural environment and available resources. Consequently, topography, hydrologic conditions, vegetation, and soil were key factors considered by ancient humans in site selection. Human activities, especially land use patterns, directly or indirectly affected site selection and preservation conditions. Therefore, drawing on previous research findings [5,6,26], considering the complexity of human activities, and taking into account the actual conditions of the study area, this study constructed an index system of influencing factors for archaeological site prediction in typical mountainous regions, which comprises three categories: three categories: natural factors, human activity factors, and comprehensive influencing factors. The natural environmental factors include: elevation, slope, aspect, plan curvature, profile curvature and distance to water. Soil and NDVI are factors that are comprehensively influenced by both natural environment and human activities. The human activity factor is land use, as land use patterns can directly or indirectly affected site selection and preservation conditions. Among all variables, soil and land use are categorical variables that require encoding, with their classification standards and codes shown in Table 3.
Table 3.
Categorical variable coding table of Chongqing Three Gorges Region.
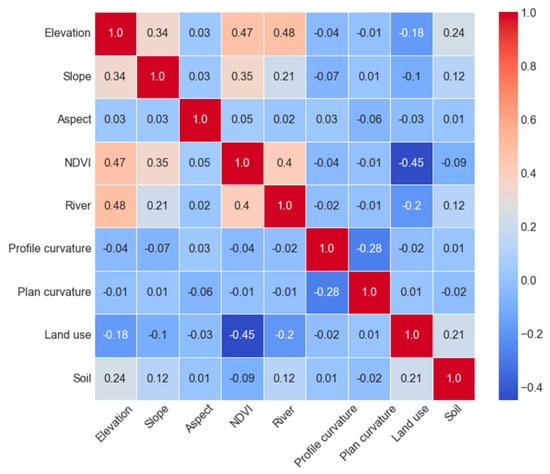
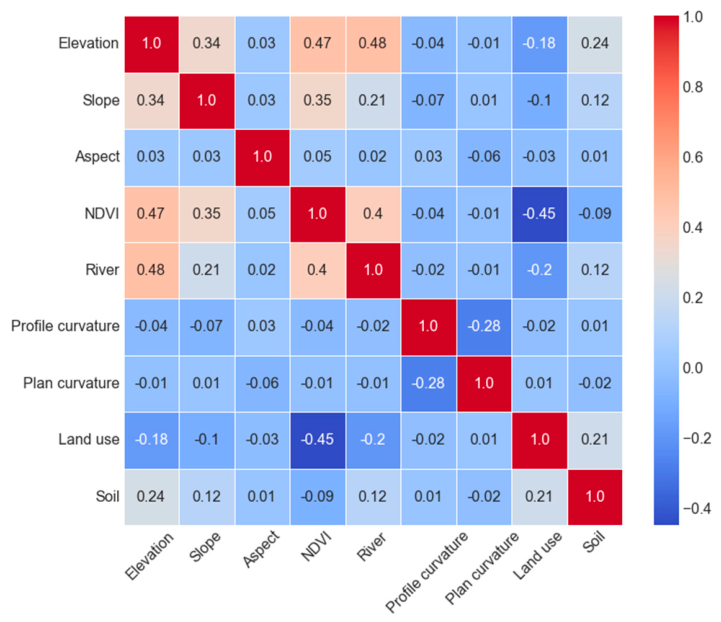
In the context of influencing factors, feature selection aims to identify the most representative and relevant subset of features from the original dataset, thereby reducing dimensionality, retaining key information, and boosting prediction accuracy [40]. The study employed Spearman’s method to calculate the correlation coefficients. Previous research suggests that an inter-factor correlation coefficient below 0.5 indicates a low correlation [41]. As shown in Figure 3, all correlation coefficients in this study are below this threshold; hence, all influencing factors were retained.
Figure 3.
Heatmap of correlation of influencing factors.
2.4.2. The Establishment and Optimization of a Binary Classification Model
The preprocessing of data first requires cleaning the acquired sample to remove outliers. To minimize the impact of different scales, this study applied Z-score normalization to the raw data, transforming all values into a dataset with a mean of 0 and a standard deviation of 1. The standardized dataset (comprising 1227 site points and 1227 non-site points) was then divided into a training set and a test set at a ratio of 8:2. Specifically, the training set contained 982 site points and 982 non-site points, while the test set contained 245 site points and 245 non-site points. On the training set, the Bayesian optimization algorithm was employed to tune the hyperparameters of the BP neural network model, and the optimal model was obtained through comparative testing.
2.4.3. Model Accuracy Verification and Performance Evaluation
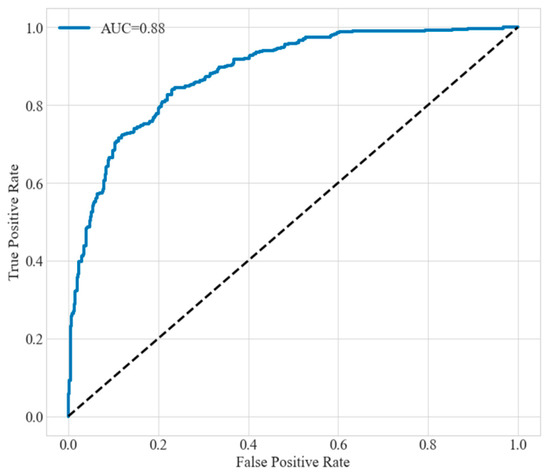
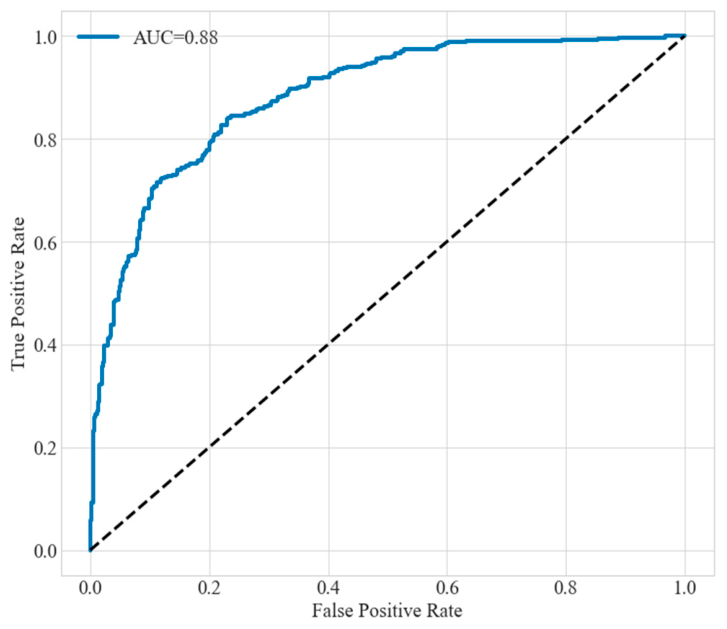
The trained prediction model requires accuracy testing and performance evaluation. This study utilizes the ROC curve to measure the model’s accuracy. The AUC, which quantifies the area under the ROC curve, serves as an indicator for assessing the model’s predictive accuracy. Typically, the AUC value ranges from 0.5 to 1, with values closer to 1 indicating higher model accuracy. The study employs K-fold cross-validation to continuously improve the model’s performance. The evaluation metrics for K-fold cross-validation are: accuracy, precision, recall, and F1-score. Values of these metrics closer to 1 indicate better model performance. Selecting appropriate parameters is crucial for the BPNN model. After hyperparameter tuning via the Bayesian optimization algorithm, the test set AUC increased from the original 0.8003 to 0.8815 (as shown in Figure 4). The values of the model accuracy metrics are as follows: accuracy 0.8018, precision 0.8120, recall 0.8018, and F1-score 0.7997. These results indicate that the trained model has high accuracy, excellent performance, and strong generalization capability, making it suitable for predicting archaeological sites in the CQTGR.
Figure 4.
ROC curve. The dashed line represents the performance baseline of a random classifier (diagonal line).
2.4.4. Model Application
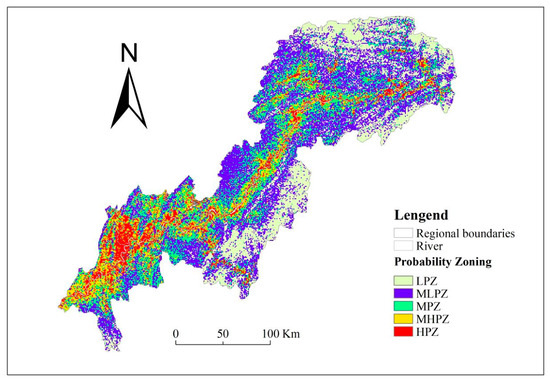
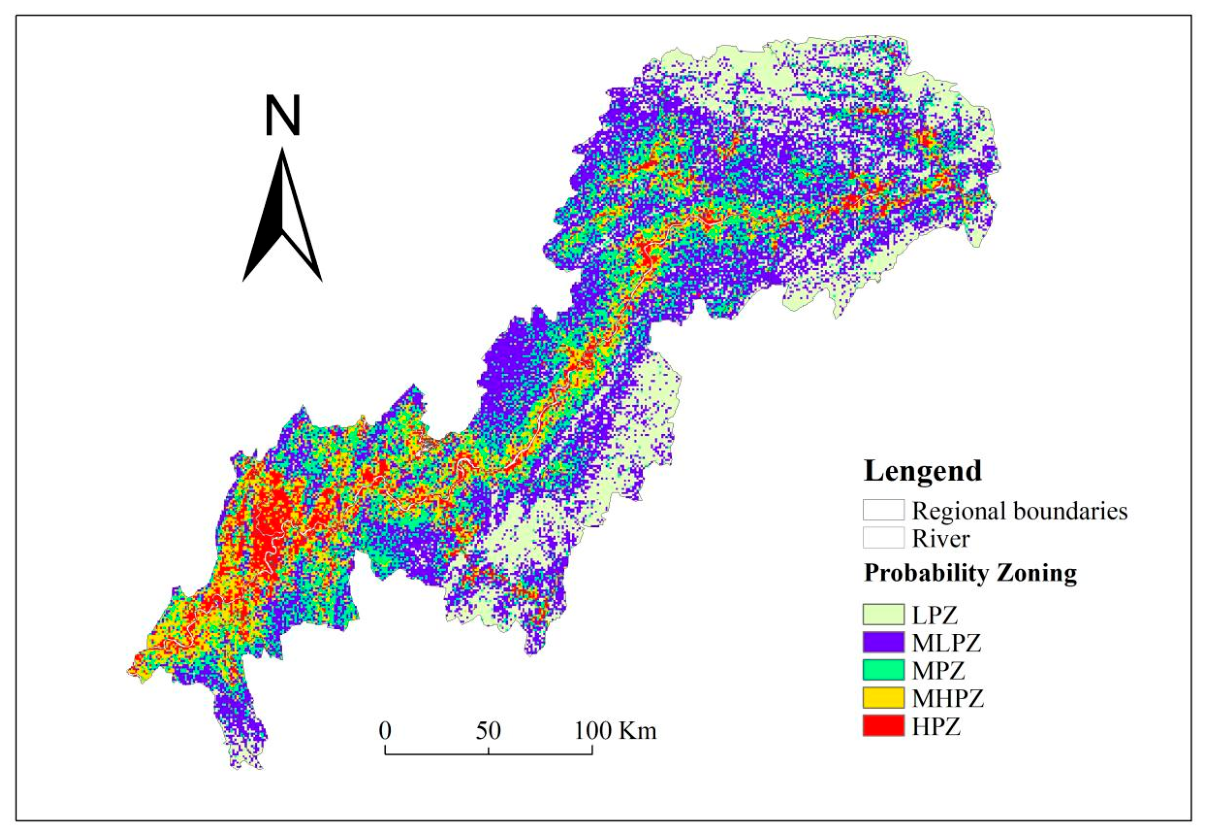
The study area was divided into 1000 m × 1000 m grids using the “Create Fishnet” tool in ArcMap 10.7. By combining the model generated from the aforementioned training, the probability value of each grid within the area was calculated, resulting in a probability distribution map of the entire study area. The natural breaks classification method was adopted to categorize the results into five classes for zonal discussion, thereby more scientifically delineating potential protection zones for the sites. These classes are: high-probability zone (HPZ), medium-high-probability zone (MHPZ), medium-probability zone (MPZ), medium-low-probability zone (MLPZ), and low-probability zone (LPZ), as illustrated in Figure 5.
Figure 5.
Distribution probability map of the Chongqing Three Gorges site prediction.
3. Result
The spatial distribution pattern of ancient sites is primarily controlled by the dual influence of the natural environment and human activities. Among these, the natural environment establishes the fundamental geographic framework for site distribution, while human activities further reshape the typological characteristics and developmental evolution of archaeological sites. As illustrated in Figure 5, the spatial distribution of archaeological sites in the Three Gorges region of Chongqing exhibits distinct characteristics. These heritage landscapes, distributed along the Yangtze River and its major tributaries, demonstrate a tiered and linear corridor distribution pattern. Specifically, centered on the main waterways of the Yangtze River, the areas radiate outward from the core as high-probability, medium-high-probability, medium-probability, medium-low-probability, and low-probability zones. Among these, areas with high-probability distribution are predominantly concentrated in low-lying river valleys and flat terrains. With increasing elevation and distance from the river, the spatial distribution of probability zones for archaeological sites follows a gradually declining, tiered pattern. Additionally, the distribution of archaeological sites demonstrates significant spatial correlation and heterogeneity. The spatial concentration of these sites shows a pattern of higher density in the southwest and lower density in the northeast, indicating a clear developmental tendency towards the southwestern regions. Ultimately, the distribution of archaeological sites formed a distinct core–periphery structure centered on the confluence of the Yangtze and Jialing Rivers. This outcome was shaped jointly by the unique river-and-gorge terrain of the Three Gorges area and the course of socio-economic development in Chongqing throughout history [42].
According to Table 4, the high-probability zone covers an area of 3685.28 km2, accounting for 7.99% of the total area, yet it contains 446 archaeological sites, representing 36.20% of the total. This zone has the highest concentration of archaeological sites, with a distribution density of 0.121 sites/km2. Combined with Figure 5, the high-probability zone is characterized by a clear tendency to cluster in low-elevation, flat river terrace areas. Most sites are distributed at elevations between 67 and 602 m, with an average elevation of 241.33 m. The high-probability zone also demonstrates a strong affinity for water, with 52.27% of archaeological sites located within 5 km of rivers. The maximum distance from a river for any site in this zone is 14.59 km, with an average distance of 2.53 km. High-probability areas are primarily distributed along the main stem and major tributaries of the Yangtze River, as well as in the valley regions of the parallel ridge-valley area of eastern Sichuan Basin. They are particularly concentrated at the confluences of the Yangtze River’s main stem and its major tributaries, where site distribution is most dense. This pattern is closely linked to the fact that low-lying areas are conducive to human production and daily life, supporting human activities such as agriculture, gathering, fishing, and hunting. Additionally, reliance on the natural Yangtze River system facilitated the development of riverine shipping, which in turn promoted regional economic and social development.
Table 4.
Statistical table of zoning based on probability prediction of archaeological sites.
The medium-high-probability zone is primarily distributed along the periphery of the high-probability zone, covering an additional area of 5620.67 km2, accounting for 17.53% of the total study area. It is mainly located in the low hills and valleys of the parallel ridge-valley region in the eastern Sichuan Basin and is frequently developed along the main course and tributaries of the Yangtze River. Compared to the high-probability zone, this zone is situated at higher elevations, with site elevations ranging from 68 m to 771 m and an average elevation of 346.36 m. The maximum distance to water for sites in this zone is 14.17 km, with an average distance of 4.48 km. This area contains 216 archaeological sites, representing 17.53% of the total. The region features favorable soil and water conditions and abundant forestry resources, making it a historically significant area for imperial timber procurement and a zone of ethnic interaction [43]. Based on the literature and the distribution characteristics of sites across various periods, human activities during the Neolithic Age were primarily concentrated in river terrace areas. However, with socioeconomic development and population migration, population density increased in low-lying river valleys, and human activities began to expand toward mountainous regions. The shetain practice (a form of shifting cultivation) emerged during the Sui and Tang dynasties and flourished in the Song and Yuan dynasties, forming a unique vertical agricultural system in the Three Gorges region [43]. This has resulted in a relatively high number of ancient sites remaining in this area.
The medium-probability zone is mainly distributed along the periphery of the medium-high-probability zone. It contains 226 archaeological sites, accounting for 18.34% of the total. The elevation of sites in this zone ranges from 72 m to 1222 m, with an average elevation of 465.04 m. The maximum distance to water is 26.47 km, with an average distance of 6.82 km.
The medium-low-probability zone, situated on the periphery of the medium-high-probability zone, is predominantly found in the central-eastern mountainous areas. It contains 280 archaeological sites, representing 22.73% of the total. However, with an area of 16,869.45 km2, accounting for 36.59% of the total study area, the site distribution density in this zone is relatively low. Site elevations range from 76 m to 1505 m, with an average elevation of 598.21 m. The maximum distance to water is 35.53 km, with an average distance of 13.47 km.
The low-probability zone is primarily distributed in the high mountain areas of the central-eastern region. The elevations of the sites vary between 421 m and 1763 m, averaging 1146.56 m. It can be observed that the medium-low- and low-probability zones of archaeological sites are primarily distributed in the mountainous areas of the central-western region, which are located far from the major waterways of the Yangtze River system and characterized by complex terrain and high elevation. These conditions were unfavorable for human production, activities, and communication, resulting in underdeveloped economies and societies. Consequently, the distribution of archaeological sites in these areas is sparse, with low density, small scale, and a predominantly dispersed pattern.
4. Discussion
This study mainly addresses four aspects: quantitative identification of influencing factors, advantages and distinctive features of ASPM, validation of model practicality and verification on typical archaeological sites, and limitations and future prospects. These are used to compare the similarities and differences between this study and previous research, and to highlight the distinctive features of this study. Details are presented in Table 5.
Table 5.
Comparative summary of key discussion points.
4.1. Identification of Key Influencing Factors, Thresholds, and Interaction Effects
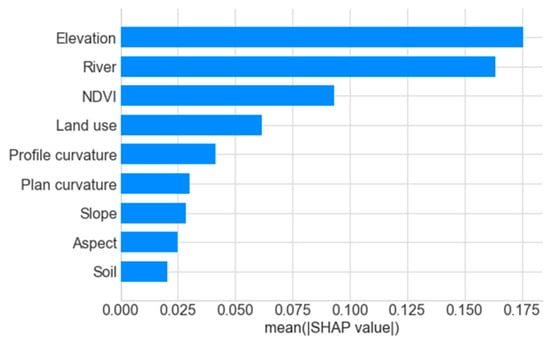
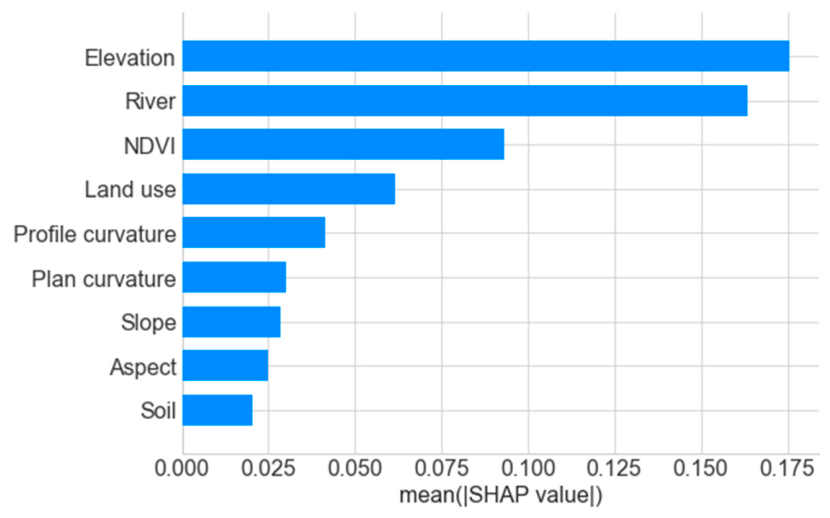
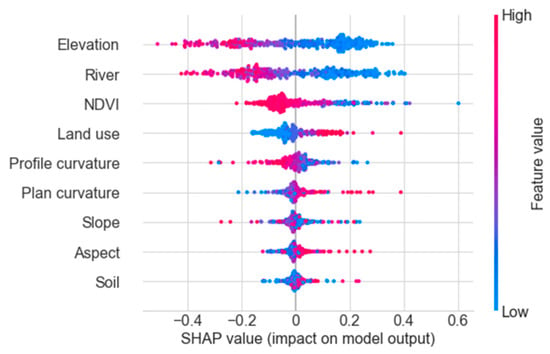
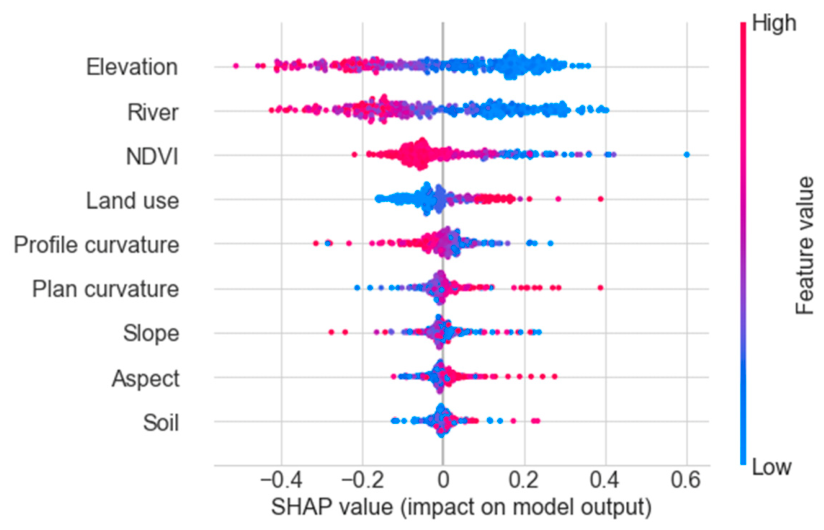
To improve the model’s transparency, reliability, and interpretability, this study employs the SHAP model to identify the importance of influencing factors and key driving factors. As shown in Figure 6, the influencing factors are ranked by importance as: elevation, river, NDVI, land use, profile curvature, plan curvature, slope, aspect, and soil. Among them, elevation and rivers are the key driving factors, while NDVI and land use also exert significant influences, so they are four major driving factors. Further analysis based on the SHAP bee swarm plot (Figure 7) reveals that the distribution of ancient sites exhibits complex nonlinear responses to driving factors. In terms of the direction of influence, elevation, river proximity, vegetation, and profile curvature are generally negatively correlated, while land use, planar curvature, slope aspect, and soil type show positive correlations. Regarding the magnitude of influence, elevation, water proximity, and NDVI have relatively significant impacts. Specifically, elevation and water proximity primarily concentrate in low-value areas, contributing positively, whereas NDVI is mainly concentrated in high-value areas, contributing negatively.
Figure 6.
Importance ranking of influencing factors.
Figure 7.
SHAP summary plot of influencing factors.
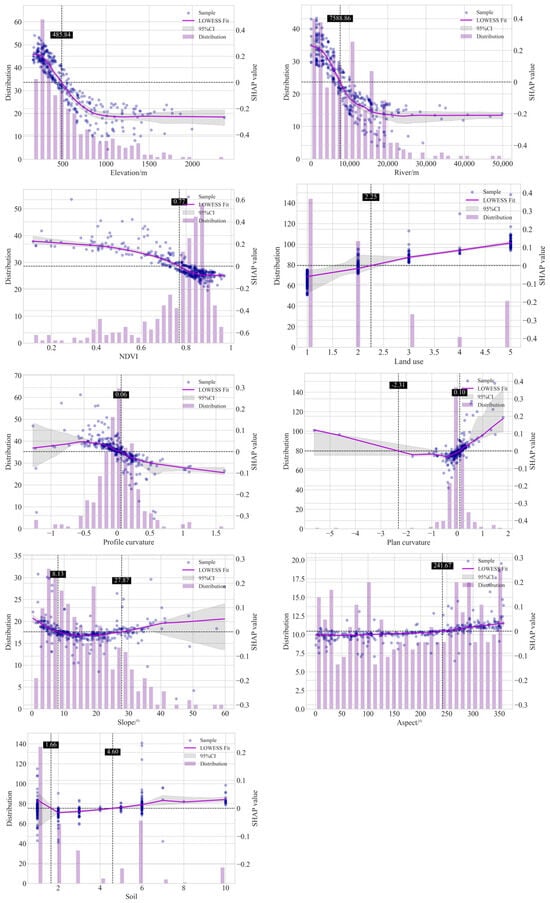
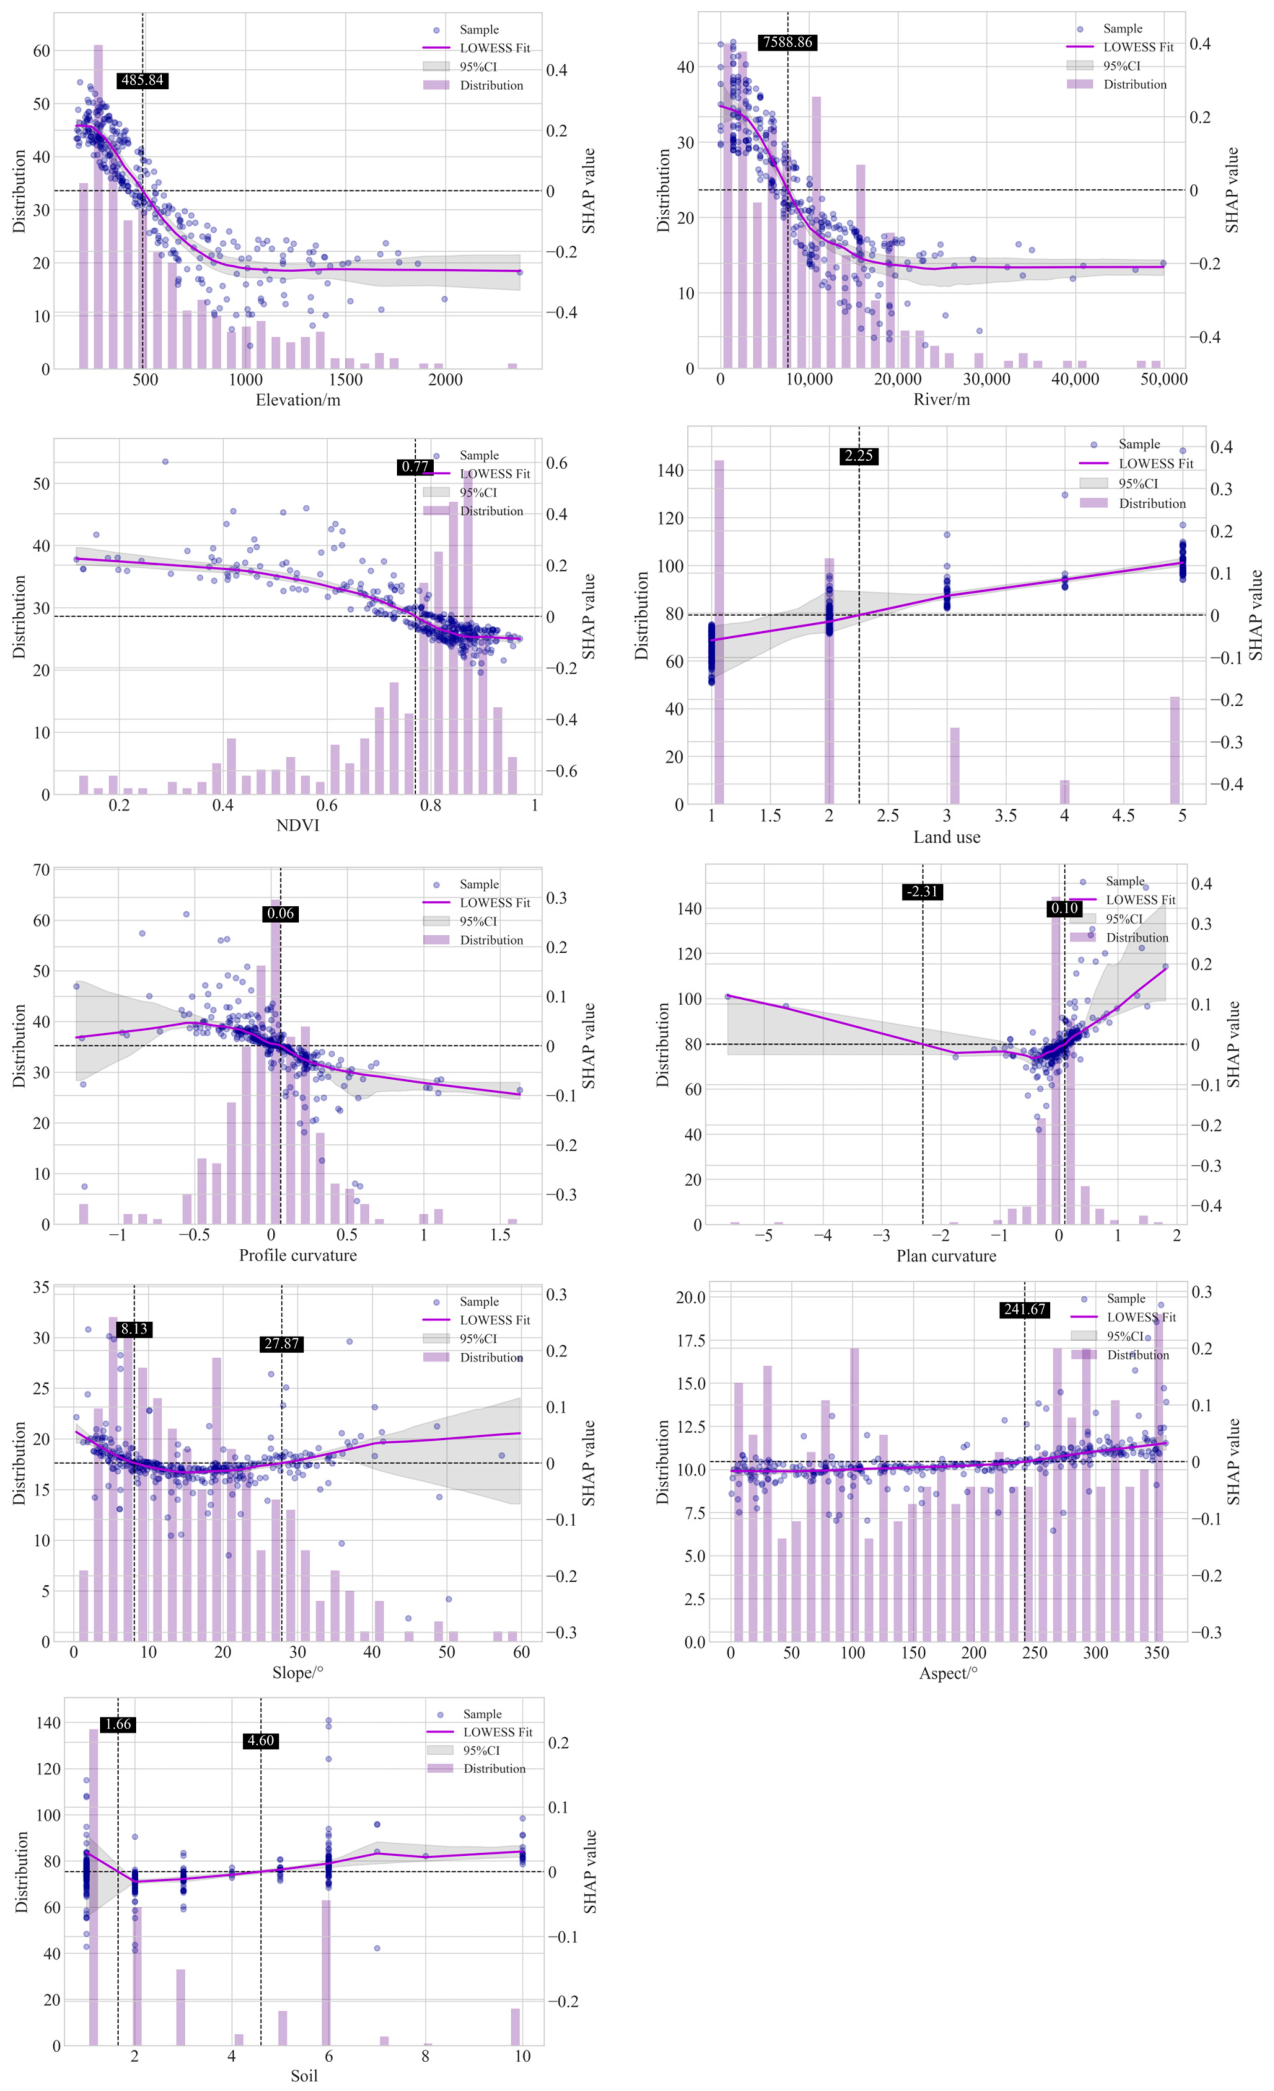
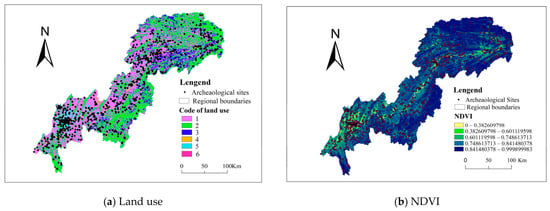
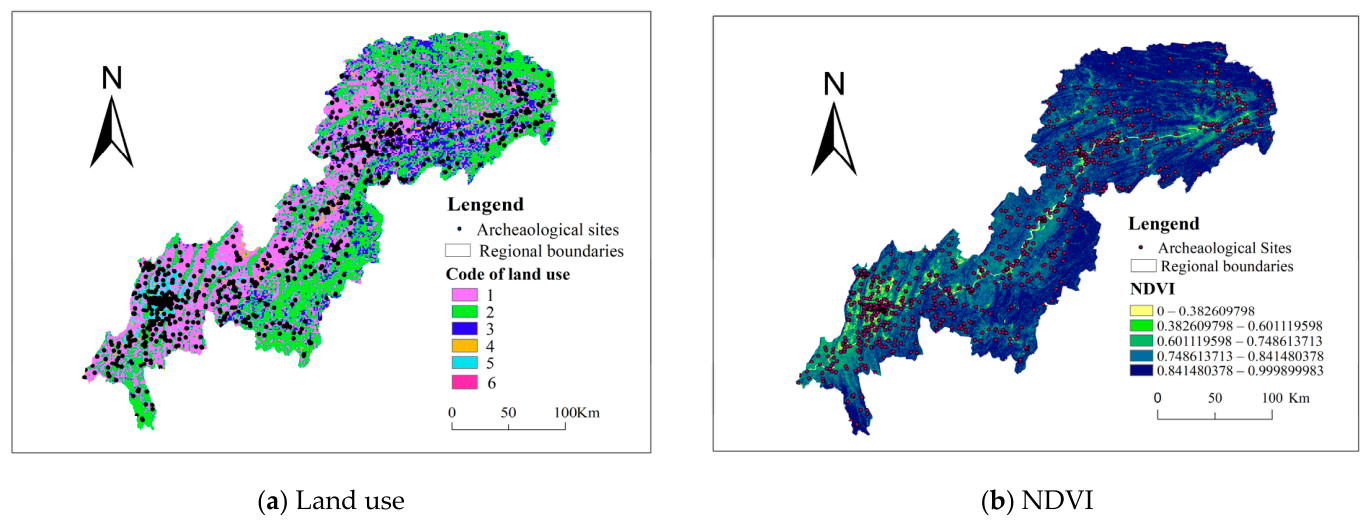
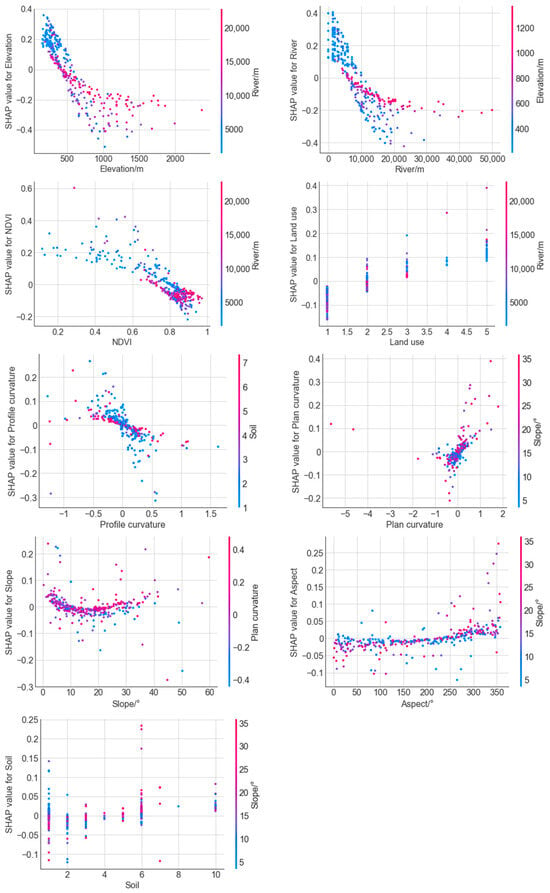
To further capture the nonlinear relationships between driving factors and the target variable, and to identify the influence trends and thresholds of these factors, thereby intuitively representing their impact patterns and intensity, this study introduces the LOWESS curve fitting model. The Bootstrap resampling technique is applied on SHAP dependence plots to calculate a 95% confidence interval for the LOWESS fitted curve model. Based on this, curve fitting is performed to observe changing trends and identify key thresholds. When the feature value is below the threshold, its impact on the target variable is negative; when the feature value is above the threshold, the impact is positive. As shown in Figure 8, the nonlinear relationships between each driving factor and the target variable exhibit diverse characteristics, with critical thresholds displaying features such as single-segment and multi-segment thresholds. As elevation increases, the distribution of archaeological sites decreases, and the contribution value of elevation to the target variable shows a gradual declining trend, with a clear threshold effect. At an elevation of 485.84 m, the SHAP value for elevation is 0. In areas where elevation is below 485.84 m, its impact on the target variable is positive, whereas in areas above this threshold, the impact is negative. The influence trend of rivers on the target variable is similar to that of elevation, indicating a significant interactive effect between rivers and elevation. As the distance from rivers increases, the distribution of archaeological sites shows a fluctuating decline, and the contribution value of rivers to the target variable also gradually decreases, with a distinct threshold effect observed at 7588.86 m. For the NDVI variable, as vegetation coverage increases, the distribution of archaeological sites gradually increases. However, the contribution of NDVI to the target variable decreases as the feature value rises, becoming zero when the NDVI value reaches 0.77. Spatially, combining Figure 9 and Figure 1, it can be seen that areas with low NDVI are mostly low-lying river valley regions. These areas are predominantly agricultural land and urban/rural residential land, where human activities are relatively frequent. Thus, in areas where NDVI is less than 0.77, its effect on the target variable is positive; whereas in areas where NDVI exceeds 0.77, the distribution of the target variable is primarily influenced by other variables. Regarding the land use type variable, archaeological sites are mainly distributed in cultivated and forested areas, with a clear threshold observed in forested areas. In cultivated areas, the impact of land use type on the target variable is negative, indicating that site distribution in these areas is mainly influenced by other variables. In forested areas, the impact fluctuates around the SHAP zero threshold, showing no significant effect on the target variable. In grassland, water bodies, and urban–rural industrial–mining–residential areas, the SHAP values are positive and show a gradually increasing trend, with urban–rural industrial–mining land use having a notably positive impact on the target variable. The influence of profile curvature was mainly concentrated within −0.5 to 0.5, characterized by a decreasing SHAP contribution with increasing profile curvature. Positive contributions were primarily found between −0.5 and 0, which was related to enhanced sedimentation, water convergence, and higher fertility on concave slopes, favoring human activities and site preservation. The effect of plan curvature showed multi-stage features, with sites mainly distributed near zero, suggesting a preference for areas with low plan curvature; SHAP contributions were largely within −0.1 to 0.1. Aspect contribution remained relatively steady, with SHAP values slightly increasing around zero. Overall, the contribution turned from negative to positive with increasing azimuth, with a turning point at about 200°. Slope gradient exhibited a shallow U-shaped trend, with negative effects within 8.13–27.87° and positive effects elsewhere. Ancient sites were mainly found on slopes of less than 27.87°, with a marked positive contribution below 8.13°. Soil SHAP contributions varied little, and sites were most abundant on purple soils, where contributions were predominantly positive.
Figure 8.
Single-factor SHAP dependence plot and threshold effect plot. The dashed line represents the threshold line.
Figure 9.
Spatial distribution map of main influencing factors.
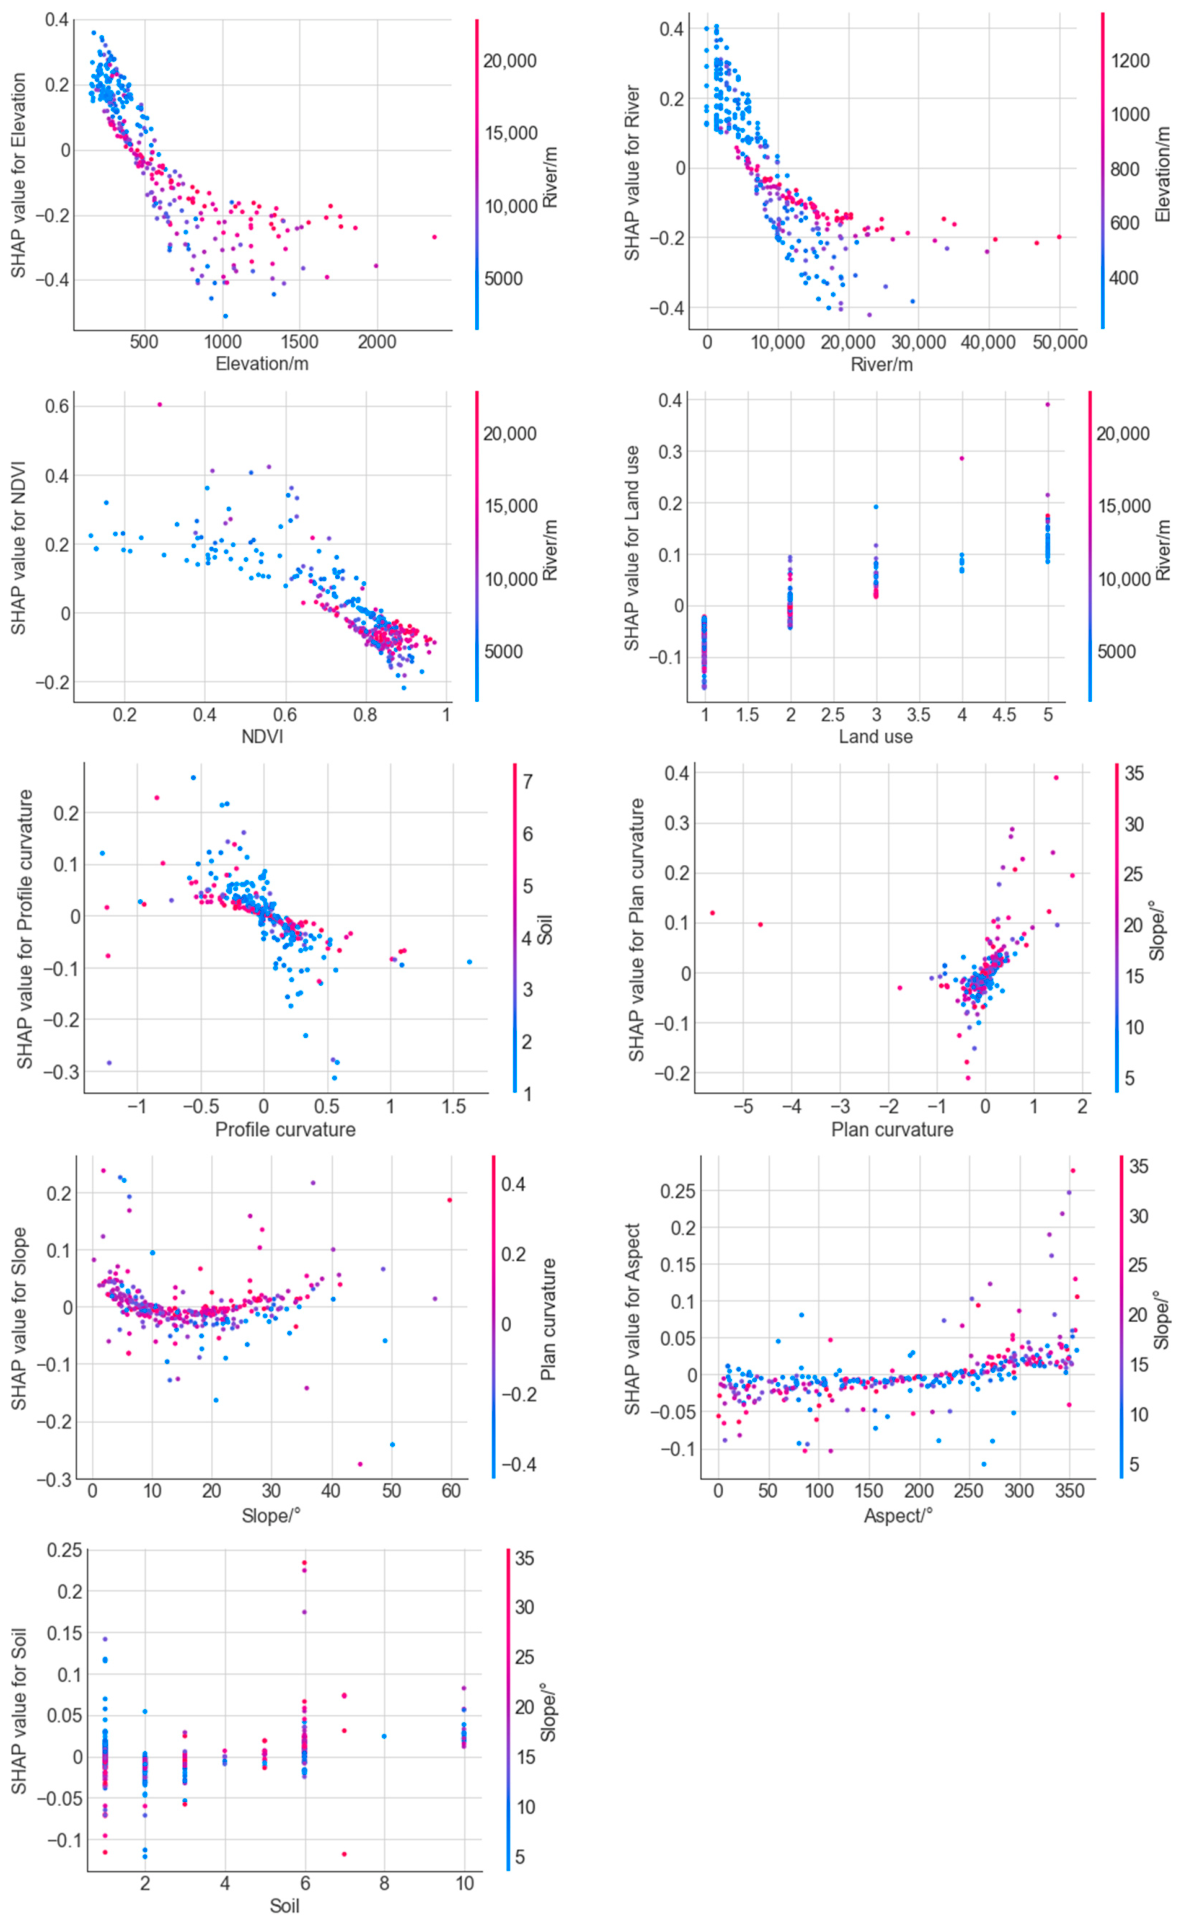
The distribution of archaeological sites is influenced by a variety of factors. These influencing factors are interconnected and interact with each other, collectively forming a regional landscape system, rather than being determined by any single factor. Therefore, it is necessary to further study the interaction effects among these influencing factors, as the synergistic enhancement of two factors can produce a “1 + 1 > 2” effect. This study employs SHAP model to further investigate the factor with the strongest interaction with each influencing factor (as shown in Figure 10), in order to explore the synergistic and trade-off relationships among the factors. Regarding elevation, rivers exhibit the greatest interactive effect. In low-elevation areas, the closer the proximity to rivers, the greater the positive contribution. At approximately 500 m, the influence of elevation gradually shifts from positive to negative, meaning that as elevation increases, its impact on the target variable becomes increasingly negative, and this effect is more pronounced the closer the proximity to rivers. The factor with the strongest interaction with rivers is elevation. In areas with low proximity to water, the positive interactive effect is more evident, meaning that the closer the proximity to rivers and the lower the elevation, the stronger the positive influence. Similarly, as the distance from rivers increases, its impact on the target variable gradually decreases. At approximately 800 m from rivers, the influence of rivers gradually shifts from positive to negative, and this effect is more pronounced in high-elevation areas closer to rivers. NDVI exhibits the strongest interaction with rivers. As the distance from rivers increases, higher NDVI values exert a greater negative impact on the target variable. This indicates that in areas where NDVI values are low, the closer the site points are to the river, the greater the positive contribution to the target variable. Land use exhibits the strongest interaction with rivers. Archaeological sites are primarily distributed in cultivated land and forested areas that are close to rivers. The farther the proximity to water, the fewer archaeological sites are distributed across various land use types. Moreover, the greater the proximity to water distance, the lower the contribution rate in forest and grassland areas, while the smaller the proximity to water distance, the higher the contribution value. Profile curvature exhibits the strongest interaction with soil. In negative curvature areas, lower soil values correspond to greater positive contributions. As shown in Table 3, the low-value soil areas are mainly purple soil and paddy soil. Plan curvature shows the strongest interaction with slope gradient, with the effect mainly concentrated near zero plan curvature; within positive plan-curvature areas, steeper slopes yield more positive contributions. Aspect also interacts most strongly with slope gradient, with their combined SHAP values fluctuating around zero. Soil interacts most strongly with slope gradient, and in purple soil areas, gentler slopes produce greater positive contributions. In conclusion, the distribution of ancient sites is subject to the dual influence of the natural environment and human activities, and areas where the pairwise interaction between driving factors exhibits positive synergistic enhancement are often the core regions for the distribution of ancient site landscapes.
Figure 10.
Impact factor interaction effect.
This study constructed an interpretable machine learning model that excels at identifying key driving factors and interaction effects and threshold effects among factors. Through the above quantitative analyses, the spatial distribution patterns of archaeological sites can be deeply revealed, thereby shedding light on the unique regional landscape system shaped by the distinctive mountain-river geographical space of the CQTGR. This can provide fundamental theoretical support for research on the distinctive survival wisdom of the Three Gorges residents and the sustainable development of regional culture. Compared with other regions, this area has been rich in paleosite resources with strong regional characteristics since the Holocene, making it an ideal area for studying human–land relationships in the riverine mountainous region. To date, research on this area has been relatively limited, mostly focusing on human–environment interactions from the perspective of environmental archaeology, with qualitative descriptions predominantly centered on typical sites, while systematic regional analyses are lacking [44]. Among them, the studies by Zhu et al. are the most representative. Tan [45] used GIS technology to analyze the spatial distribution patterns of sites from the Eastern Zhou to the Han Dynasty in the CQTGR but still failed to deeply explore the nonlinear driving mechanisms of influencing factors. This study, by contrast, employs deep learning and GIS to deeply analyze the nonlinear relationships between influencing factors and the target variable. This approach not only compensates for the shortcomings of traditional research but also highlights the value of geospatial intelligence in archaeological research. This study can provide both a precise scientific basis for the protection planning of ancient sites in the CQTGR and methodological support for the innovation of the research paradigm and methods in archaeological human–environment relationship studies.
4.2. Advantages and Distinctive Features of ASPM
Research on ASP in recent years has primarily focused on model application and parameter selection. In terms of model application, multivariate statistical methods are predominant, with numerous studies by domestic and international scholars confirming their effectiveness [17,18,19]. However, statistical methods require substantial statistical data, which proves insufficient in small watershed studies where data volume is limited; furthermore, these methods exhibit certain limitations in handling complex nonlinear relationships and high-dimensional data [26]. In contrast, deep learning models possess a powerful capacity for learning complex features, excel at managing intricate nonlinear relationships, and significantly improve the efficiency of ASPM.
Based on the commonly used models in existing studies, such as logistic regression (LR), support vector machine (SVM), random forest (RF), and XGBoost, this study constructed separate predictive models for ancient sites in the CQTGR for comparative analysis. As shown in Table 6, the evaluation metrics indicate that the BPNN outperforms the other models in terms of accuracy. Moreover, after Bayesian optimization, the BPNN model achieved an accuracy of 0.8815. Compared with the performance of models reported in the previous literature [3,5,15,17], the model constructed in this study exhibits higher accuracy and better generalization ability, demonstrating that BPNN is more capable of handling complex nonlinear relationships. Traditional machine learning models have been confirmed in prior studies to have a notable limitation—the black-box effect [23,24]. This study further developed an interpretable ensemble model based on Bayesian-optimized BPNN combined with SHAP, so as to enhance model interpretability. This approach not only facilitates data-driven quantitative interpretation of ancient human–environment relationships and deepens the understanding of human survival wisdom in the unique gorge region, but also provides a scientific theoretical basis for the delineation of graded protection zones for ancient sites in the CQTGR and for refined archaeological surveys. Therefore, this study bears significant academic and practical value. In view of the fact that salvage excavations conducted due to the construction of the Three Gorges Reservoir have revealed that some sites still remain, this research has important practical implications for narrowing the scope of future archaeological prospection and conducting targeted investigations and excavations. Meanwhile, the ASPM constructed in the CQTGR can serve as a referable technical approach for similar studies in other mountainous regions.
Table 6.
Comparative performance of ASPM.
4.3. Validation of Model Practicality and Verification on Typical Archaeological Sites
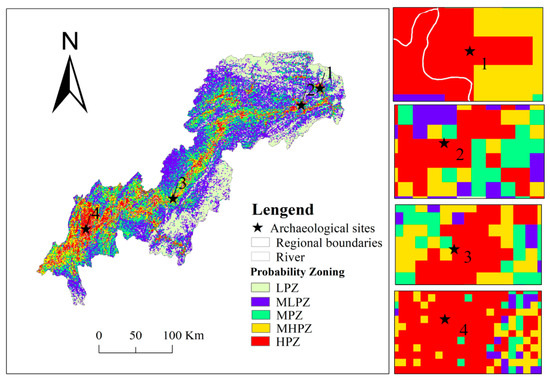
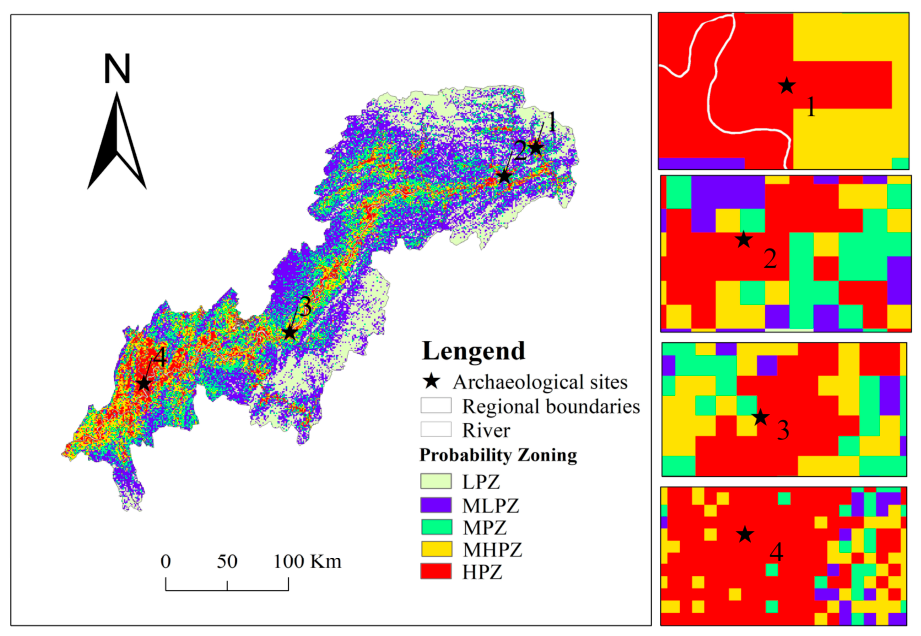
To further demonstrate the accuracy and practical utility of the predictive model, this study adopts the G-value evaluation method proposed by Kvamme, which considers both prediction probability and prediction area, to effectively enhance the model’s practical applicability [19]. Specifically, a model is considered more useful when a larger number of sites are identified within a smaller area, as this not only narrows the survey scope but also improves the site discovery rate. Conversely, when the study area is large and the number of sites is insufficient, the model’s practicality decreases. Based on calculations, the highest concentration of ancient sites is found in the high-probability zone, accounting for 36.2% of the total number of sites and 7.99% of the total area, with a G-value of 77.93%, which is higher than the 75% reported by Guo Fei et al. [19]. The medium-high-probability zone contains 17.75% of the sites and covers 12.19% of the area, with a G-value of 30.46%, which is roughly comparable to the 32% reported by Guo Fei et al. This indicates that our model has practical application value. Comparing Figure 4 with Figure 1, it can be seen that the predicted distribution map of archaeological sites generated in this study is similar to the distribution characteristics reported in previous studies, which indicates that archaeological sites tend to be located in low-lying river valley areas, especially at river confluences [31]. As shown in Figure 11, several representative sites were randomly selected within the study area for validation. These include Site 1 (Shuangyantang Site at Wushan), Site 2 (Kui Prefecture Ancient City Site), Site 3 (Cliff Inscriptions of Su Gong Ci), and Site 4 (Mawangchang Site). Using the model developed in this study, the predicted probability values for these sites were calculated as 79.25%, 81.99%, 95.54%, and 91.95%, respectively. As shown in Figure 11, all these sites fall within high-probability zones and are situated in low-lying valley floors along river courses. This is also consistent with the findings of Zhu et al. [31,44], indicating that the model constructed in this study is reasonably accurate. This further indicates that the model constructed in this study is relatively accurate. This has important implications for future exploration and verification of new sites under the guidance of the ASPM for this region, and for advancing in-depth research on ancient sites and cultures in the CQTGR.
Figure 11.
Probability distribution map of typical sites.
4.4. Limitations and Future Directions
- (1)
- Insufficient dynamic analysis across temporal dimensions. This study is primarily based on a geospatial perspective for analysis, failing to adequately distinguish the stage-specific differences in environmental selection and human intervention modes across different historical periods, which to some extent limits the in-depth interpretation of the evolutionary process of regional human–environment relationships in antiquity. In future work, we plan to systematically integrate archaeological excavation reports, thematic studies, and extant historical documents to construct a spatiotemporal database covering multiple historical intervals [5], thereby extending the analysis from two-dimensional spatial distribution to a time-slice-based dynamic evolutionary analysis.
- (2)
- Need for improvement in the factor system and model generalizability. The current model mainly incorporates natural environmental factors and human activity indicators, while variables such as neotectonic activity, socio-economic conditions, and historical-cultural background remain insufficiently considered. Subsequent research will attempt to introduce additional multivariate proxies—including fault activity indices and historical settlement hierarchies—to evaluate their explanatory contributions to site distribution. Concurrently, we aim to combine historical document digitization with paleoenvironmental reconstruction techniques to retrieve baseline data for key periods, thereby enabling a more comprehensive understanding of the coupling mechanisms within the regional human–environment system.
- (3)
- Precision biases arising from paleoenvironmental proxy data. Owing to the limited availability of high-resolution paleotopographic and paleoclimatic data, this study temporarily employs modern topographic data as a substitute. Despite the relatively slow pace of natural geological structures and topographic and geomorphic environments, which have little effect on the robustness of the core conclusions [30,31], processes such as tectonic uplift and river diversion may still introduce systematic errors. The next step involves the construction of paleo-DEMs and paleo-drainage networks for different historical periods, combined with the integration of multi-source remote sensing radar data and automated predictive identification techniques to enable detailed capture of micro-environmental features. This approach will further revise the ASPM to enhance its accuracy and reliability.
5. Conclusions
- (1)
- This study constructed a BPNN-based archaeological site prediction model, which was optimized via Bayesian optimization. Among several commonly used predictive methods, BPNN demonstrated the best performance. After Bayesian tuning, the AUC increased from 0.8003 to 0.8815, an improvement of 0.0812, with a gain value of 77.93%, indicating that the model possesses high predictive accuracy and good regional applicability.
- (2)
- The spatial distribution of archaeological sites in the CQTGR exhibits a stepped zonal pattern centered on the main stream of the Yangtze River and its major tributaries. From the water system outward, the probability zones are sequentially high, moderately high, medium, moderately low, and low. The low-lying valley and flatland areas are the most concentrated site zones, with probability decreasing as elevation and distance from rivers increase. The overall site density shows a “southwest-high, northeast-low” trend, and the confluence of the Yangtze and Jialing rivers forms the core area of site distribution.
- (3)
- The site distribution is collectively shaped by natural environment and human activities, with elevation and river distance identified as the key driving factors, followed by NDVI and land use. The various factors exhibit diverse nonlinear threshold effects on site distribution, with the critical thresholds identified as elevation of 485.84 m, distance to rivers of 7588.86 m, NDVI of 0.77, and land use type (forest land). Among factor interactions, the synergistic enhancement effects of elevation–river, river–elevation, profile curvature–soil and soil–slope are more significant, and their positive superposition zones are highly consistent with the core site distribution areas.
The ASPM for the CQTGR constructed in this study has demonstrated strong accuracy and practicality through comparative testing and validation. It can provide a scientific basis for systematic and efficient survey as well as targeted excavation of ancient sites in this region, and also offer decision-making support for preventive, tiered conservation and monitoring of regional cultural heritage. Future research could focus on paleoenvironmental reconstruction to further refine and adjust the model, thereby enhancing its practical value and generalization capability.
Author Contributions
Conceptualization: Xiaoli Wang; Methodology: Hao Chen; Data organization and collection: Yani Cao. Model design and Data analysis: Xiaoli Wang and Hao Chen; Writing—original draft preparation: Xiaoli Wang; Writing—review and editing: Houxi Zou and Hao Chen. All authors have read and agreed to the published version of the manuscript.
Funding
The research was supported by the Project of Education Science and Technology of Chongqing Municipal Education Commission (KJQN202500524) and the National Science Foundation of China (42071277).
Data Availability Statement
The datasets used and analyzed during the current study are available from the corresponding author on reasonable request.
Conflicts of Interest
The authors declare no conflicts of interest.
References
- Huang, X.; Shen, S.; Hu, X. Spatiotemporal distribution characteristics of cultural heritage and their association with natural environment in Meishan area. Econ. Geogr. 2023, 44, 218–228. [Google Scholar]
- Fu, J.; Mao, H. Study on the spatio-temporal distribution patterns and infuencing factors of cultural heritage: A case study of Fujian Province. npj Herit. Sci. 2024, 12, 324. [Google Scholar] [CrossRef] [Scilit]
- Zhang, J.; Zhang, H.; Li, J.; Wang, H.; Zhang, C.; Dong, J.; Lin, C.; Zhang, J.; Li, X.; Ming, X. Distribution prediction and driving mechanism of Neolithic settlements in the Jing River Basin, Northwest China. npj Herit. Sci. 2026, 14, 274. [Google Scholar] [CrossRef] [Scilit]
- Wang, Y.; Shi, X.; Oguchi, T. Archaeological predictive modeling using machine learning and statistical methods for Japan and China. ISPRS Int. J. Geo-Inf. 2023, 12, 238. [Google Scholar] [CrossRef] [Scilit]
- Luo, Y.S.; Chen, F.L.; Zhu, M.; Luo, Y.; Chen, F.; Zhu, M.; Gao, S.; Li, H.; Zhang, X.; Chen, C.; et al. Multi-model prediction and comparison of archaeological sites by integrating remote sensing image texture features and environmental factors. J. Geo-Inf. Sci. 2025, 27, 2510–2529. [Google Scholar]
- Yang, H.; Hu, Q.W.; Zou, Q.S. Predicting ancient city sites using GEE coupled with geographic element features and temporal spectral features: A case study of the Neolithic and Bronze Age of the Jianghan region, China. npj Herit. Sci. 2025, 13, 11. [Google Scholar] [CrossRef] [Scilit]
- Zhao, W.M.; Yang, G. The landscape features and living heritage approach of historical towns in the Three Gorges Area. Chin. Landsc. Archit. 2021, 37, 37–42. [Google Scholar]
- Yang, H. Archaeological Culture of the Three Gorges; Hubei People’s Publishing House: Wuhan, China, 2018. [Google Scholar]
- Luo, L.; Wang, X.; Guo, H.; Jia, X.; Fan, A. Earth observation in archaeology: A brief review. Int. J. Appl. Earth Obs. Geoinf. 2023, 116, 103169. [Google Scholar] [CrossRef] [Scilit]
- Willey, G. Prehistoric Settlement Patterns in the Viru Valley, Peru; Bureau of American Ethnology Bulletin; U.S. Government Printing Office: Washington, DC, USA, 1953; Volume 155, pp. 1–453.
- Green, E.L. Location analysis of prehistoric Maya sites in northern British Honduras. Am. Antiq. 1973, 38, 279–293. [Google Scholar] [CrossRef] [Scilit]
- Kvamme, K.L. Computer processing techniques for regional modeling of archaeological site locations. Adv. Comput. Archaeol. 1983, 1, 26–52. [Google Scholar]
- Lei, S.L. The application of GIS in cultural relics protection and archaeological study in recent years. Jianghan Archaeol. 2014, 3, 98–108. [Google Scholar]
- Nicu, I.C.; Mihu-Pintilie, A.; Williamson, J. GIS-based and statistical approaches in archaeological predictive modelling (NE Romania). Sustainability 2019, 11, 5969. [Google Scholar] [CrossRef] [Scilit]
- Li, G.; Dong, J.J. GIS and machine learning models target dynamic settlement patterns and their driving mechanisms from the neolithic to bronze age in the northeastern Tibetan plateau. Remote Sens. 2024, 16, 1454. [Google Scholar] [CrossRef] [Scilit]
- Vaughn, S.; Crawford, T. A predictive model of archaeological potential: An example from northwestern Belize. Appl. Geogr. 2009, 29, 542–555. [Google Scholar] [CrossRef] [Scilit]
- Wachtel, I.; Zidon, R.; Garti, S.; Shelach-Lavi, G. Predictive modeling for archaeological site locations: Comparing logistic regression and maximal entropy in north Israel and north-east China. J. Archaeol. Sci. 2018, 92, 28–36. [Google Scholar] [CrossRef] [Scilit]
- Cao, Y.W. Prediction model of Ante—Qin dynasty sites in Conghua Liuxi River Basin based on logistic regression analysis. Geomat. Spat. Inf. Technol. 2021, 22, 128–131. [Google Scholar]
- Wan, J.; Gao, H.G.; Shang, Z.M. Construction of site prediction model in Kashgar area based on remote sensing combined with geographic information system. Spacecr. Recovery Remote Sens. 2023, 44, 31–39. [Google Scholar]
- Guo, F.; Yu, L.J.; Nie, Y.P. Application of modified stochastic gradient ascent on archaeological site predictive modeling. Remote Sens. Inf. 2018, 33, 49–54. [Google Scholar]
- Wu, R.C.; Gan, S.; Yu, L.; Zhu, J.; Liu, F. The study of predictive distribution of Pakistani sites based on Maxent model. Sci. Surv. Mapp. 2021, 46, 96–103. [Google Scholar]
- Yu, S.Z.; Shou, S.T.; Zhang, Y.P. Spatial distribution of landscape heritage in Liangzhu ancient city based on MaxEnt model and clustering algorithm. J. Anhui Agric. Univ. 2024, 51, 67–73. [Google Scholar]
- Yaworsky, P.M.; Vernon, K.B.; Spangler, J.D.; Brewer, S.C.; Codding, B.F. Advancing predictive modeling in archaeology: An evaluation of regression and machine learning methods on the Grand Staircase-Escalante National Monument. PLoS ONE 2020, 15, e0239424. [Google Scholar] [CrossRef] [Scilit] [PubMed]
- Fan, X.; Mao, L.; Zou, C.; Wang, C.; Mo, D. Settlement strategies and their driving mechanisms of Neolithic settlements using machine learning approaches: A case study in Zhejiang Province. npj Herit. Sci. 2025, 13, 186. [Google Scholar] [CrossRef] [Scilit]
- Caspari, G.; Crespo, P. Convolutional neural networks for archaeological site detection–Finding “princely” tombs. J. Archaeol. Sci. 2019, 110, 104998. [Google Scholar] [CrossRef] [Scilit]
- Yang, J.; Luo, L.; Zhao, J. Explainable artificial intelligence with negative sample optimization for archaeological site prediction in Surkhandarya Uzbekistan. npj Herit. Sci. 2025, 13, 689. [Google Scholar] [CrossRef] [Scilit]
- Wu, H.J.; Wang, X.Q.; Wang, X.Y.; Zhang, L.R.; Dong, S.C. Predictive modeling for neolithic settlements in the Lingnan Region, South China. J. Archaeol. Sci. Rep. 2023, 49, 103992. [Google Scholar] [CrossRef] [Scilit]
- Feng, W.B. Chongqing Vernacular Architecture; Chongqing University Press: Chongqing, China, 2017. [Google Scholar]
- Bai, J.J. Literature, Relics, Civilization: Archaeological Exploration of the Ba Culture; Science Press: Beijing, China, 2025. [Google Scholar]
- Shi, W.; Zhu, C.; Li, S.; Ma, C. Climatic and Environmental Changes as well as Ancient Culture Response in the Yangtze Gorges Region. Acta Geogr. Sin. 2009, 11, 1304–1317. [Google Scholar]
- Zhu, C.; Ma, C.; Li, L. The progress in the study of environmental archaeology during the Holocene in Three Gorges reservoir area of the Yangtze River. Earth Sci. Front. 2010, 17, 222–232. [Google Scholar]
- Li, C.L. Research on Rapid Prediction of Solid Thermal Conductivity Based on BP Network; Shandong University: Jinan, China, 2021. [Google Scholar]
- Kang, K.; Meng, Y.X.; Zhen, J.; Fu, Q.F.; Xu, G.P.; Cui, D.S. Analysis and prediction of crack deformation monitoring data of Zhoukoudian site based on back propagation neural network. Saf. Environ. Eng. 2024, 31, 169–178. [Google Scholar]
- Xie, M.K.; Feng, Z.; Wang, S.; Wang, S.; Chang, X. Spatiotemporal patterns and nonlinear drivers of carbon emission intensity under urban shrinkage and growth: A machine learning approach with interpretability. Sustain. Cities Soc. 2025, 130, 106593. [Google Scholar] [CrossRef] [Scilit]
- Shao, D.D.; Zoh, K.; Xie, Y. The spatial differentiation mechanism of intangible cultural heritage and its integration with tourism development based on explainable machine learning and coupled coordination models: A case study of the Jiang-Zhe-Hu in China. npj Herit. Sci. 2024, 12, 414. [Google Scholar] [CrossRef] [Scilit]
- Yuan, H.; Tang, D.-W.; Liu, H.; Jiang, Y.-Y.; Liu, H.; Liu, A. Dynamics evolution and driving factors interaction effects of ecosystem services in the Wuling mountain area. Environ. Sci. 2026, 47, 431–443. [Google Scholar] [CrossRef] [Scilit]
- Li, Z. Extracting spatial effects from machine learning model using local interpretation method: An example of SHAP and XGBoost Computers. Comput. Environ. Urban Syst. 2022, 96, 101845. [Google Scholar] [CrossRef] [Scilit]
- Cleveland, W.S. Robust locally and smoothing weighted regression scatterplots. J. Am. Stat. Assoc. 1978, 74, 829–836. [Google Scholar]
- Cleveland, W.S. LOWESS: A program for smoothing scatterplots by robust locally weighted regression. Am. Stat. 1981, 35, 54. [Google Scholar] [CrossRef] [Scilit]
- Lu, H.; Lu, S.; Li, J.; Lin, Z.; Li, Y. Interpretable and landslide susceptibility evaluation using a BP neural network model optimized by multiple algorithms. Chin. J. Geol. Hazard Control 2025, 36, 160–174. [Google Scholar]
- Xie, W.; Li, X.; Jian, W.; Yang, Y.; Liu, H.; Robledo, L.F.; Nie, W. A novel hybrid method for landslide susceptibility mapping-based GeoDetector and machine learning cluster: A case of Xiaojin County, China. ISPRS Int. J. Geo-Inf. 2021, 10, 93. [Google Scholar] [CrossRef] [Scilit]
- Zhou, Y. General History of Chongqing; Chongqing Publishing House: Chongqing, China, 2022. [Google Scholar]
- Lan, Y. Historical Geography of the Three Gorges of the Yangtze River; Sichuan People’s Publishing House: Chengdu, China, 2003. [Google Scholar]
- Cai, T.; Zhu, C.; Sun, Z.; Zheng, C. Palaeoenviorments of holocene archeological sites in the Yangzi gorges area. J. Stratigr. 2017, 1, 32–38. [Google Scholar]
- Tan, M. Exploration on the Relics Space Allocation Among the Three Gorges From the Eastern Zhou Dynasty to Han Dynastiy via GIS; Jilin University: Changchun, China, 2015. [Google Scholar]

Disclaimer/Publisher’s Note: The statements, opinions and data contained in all publications are solely those of the individual author(s) and contributor(s) and not of MDPI and/or the editor(s). MDPI and/or the editor(s) disclaim responsibility for any injury to people or property resulting from any ideas, methods, instructions or products referred to in the content. |
© 2026 by the authors. Published by MDPI on behalf of the International Society for Photogrammetry and Remote Sensing. Licensee MDPI, Basel, Switzerland. This article is an open access article distributed under the terms and conditions of the Creative Commons Attribution (CC BY) license.