


Abstract
This study presents a comprehensive multidimensional analysis of pedestrian accidents in Amman, Jordan, from 2014 to 2023. By integrating spatial, temporal, and statistical techniques, the research identifies critical risk patterns to inform evidence-based safety interventions. Characterizing a decade-long database of 14,821 cases, the study utilizes radar graphs, Kernel Density Estimation (KDE), and DBSCAN cluster analysis to delineate high-risk zones and temporal peaks. Temporal findings indicate that Thursdays recorded the highest accident frequency (2382 cases), with peak occurrences between 17:00 and 23:00. Spatial clustering identified five significant high-risk zones, with Central Amman emerging as the primary critical area. The study’s novelty lies in being the first in the Jordanian context to bridge accident frequency with severity mechanisms by integrating advanced spatial clustering and KDE with a robust Ordered Logit Model. Severity analysis reveals that while 59.34% of incidents resulted in minimal injuries, fatalities accounted for 5.02%. The model demonstrates that injury outcomes are systematically associated with traffic dynamics and behavior rather than environmental factors. Speed-related driver error was identified as the strongest predictor of severe outcomes (OR = 81.3). Significant dependencies were confirmed between vehicle category and road type (χ2 = 2182.20, p < 0.001), lighting and road surface (χ2 = 76.21, p < 0.001), and vehicle type and lighting (χ2 = 148.52, p < 0.001). The study proposes a multi-layered framework combining site-specific nodal improvements with corridor-level strategies to enhance urban safety in Amman City.
1. Introduction
1.1. Global Road Safety Challenges
Traffic accidents are often considered among the most significant challenges facing the world today, as they pose a serious threat to human life on a global scale. Road traffic accidents (RTAs) pose a serious and notable public health threat worldwide, with 93% of crash fatalities occurring in low and middle-income countries, according to a recent report by the Global Road Safety Facility [1]. Globally, the incidence of road injuries has increased from 63.2 million in 1990 to 103.2 million in 2019, accompanied by an increase in road injury-related deaths from 1.11 million to 1.2 million over the same period [2,3].
Moreover, more than 1.3 million deaths and fifty million injuries and disabilities are attributed to road injuries annually [4]. RTAs are considered the leading cause of death among children and young adults aged 5–29 years [1,4] and are associated with serious economic burdens in terms of direct and indirect financial losses [4]. Major risk factors include human factors [5,6] such as speeding, aggressive driving, and distracted driving, as well as unsafe road infrastructure, design, and vehicles, and insufficient traffic law enforcement [1,7,8]. Recent literature has reported that more than 90% of RTAs are caused by human errors [8].
1.2. National Context: Jordan
Jordan, a middle-income developing country located in the Eastern Mediterranean Region (EMR), has a population of 11.5 million [1,9]. Occupying a strategic location in the EMR, it consists of twelve governorates distributed over three geographical regions [10]. Jordan has experienced a significant growth in both population and vehicle ownership over the past several decades. According to the Jordan Traffic Institute (JTI), the country’s population has increased dramatically, rising from 1,508,200 people in 1970 to 11,310,000 people in 2022, a staggering 7.5-fold increase [9]. Concurrently, the number of registered vehicles in Jordan has also skyrocketed, from 21,970 in 1970 to 1,855,901 in 2022—an eighty-four-fold increase. This dramatic rise in vehicle ownership is reflected in the changing ratio of vehicles to people, which has shifted from 1 vehicle per 69 people in 1970 to 1 vehicle per 6 people in 2022 [11].
This unprecedented growth in both population and vehicle ownership has placed a significant strain on Jordan’s infrastructure and services. The country is now facing major challenges in accommodating the increased demand for transportation, roads, and related infrastructure. To address these pressing issues, Jordan will need to implement comprehensive measures to develop and improve public transportation systems, as well as to enhance the capacity and efficiency of its road network [12]. Failure to do so could lead to further congestion, pollution, and strain on the country’s resources, hampering its overall development and quality of life for its citizens.
1.3. Pedestrian Safety in Amman
Traffic accidents in Jordan pose a significant public health concern, as they are the second leading cause of death in the country [2]. This challenge is particularly acute, with approximately two people dying in car crashes each day. According to data from the Jordan Traffic Institute (JTI) [13]. The types and severity of human injuries in 2022 were as follows: out of a total of 11,510 cases, there were 360 fatalities, 522 major injuries, 5232 minor injuries, and 5396 minimal injuries. It is evident that most of the injuries were a result of collision accidents, with a total of 6844 injuries from this type. This was followed by hit-and-run accidents with a total of 3847 injuries, and then rollover accidents with a total of 819 injuries. In parallel, recent advances in interpretable machine learning have demonstrated substantial promise in forecasting injury severity among pedestrians in Amman [14], where cost-sensitive algorithms applied to decade-long urban datasets successfully uncovered critical risk factors and underscored the influence of speed, lighting, vehicle type, and roadway context on fatality likelihood.
1.4. Research Objectives
The high prevalence of pedestrian casualties in Amman necessitates an evidence-based approach to safety planning. This study addresses this challenge by analyzing a decade-long database (2014–2023) of pedestrian accidents resulting in fatalities or severe injuries through the following objectives:
- Pattern Characterization: To analyze the multifaceted characteristics of pedestrian accidents to identify critical risk factors.
- Spatiotemporal Mapping: To employ radar graphs, Kernel Density Estimation (KDE), and DBSCAN cluster analysis to identify high-risk zones and temporal peaks.
- Injury Severity Modeling: To utilize an Ordered Logit Model to identify the multivariate determinants—traffic operations, temporal exposure, behavioral factors, and infrastructure—that influence the transition toward higher injury severity.
This is the first study in the Jordanian context to integrate advanced DBSCAN spatial clustering with a robust Ordered Logit Model. By bridging the gap between accident frequency (where and when) and severity mechanisms (why), this research offers a novel, integrated safety framework specifically tailored to Amman’s unique urban environment.
2. Literature Review
2.1. Theoretical and Methodological Foundations
The study of pedestrian accidents is a critical area of research in transportation safety. Traditionally associated with human factors and mechanical issues, the role of spatial factors in the identification and prevention of pedestrian accidents has gained increasing recognition [15]. Analyzing accident locations, characterizing area features, and segmenting victims are fundamental in uncovering patterns and trends in pedestrian accident data. This review examines key factors from prior research and methodological approaches in Jordan to highlight the existing gap.
2.2. Determinants of Pedestrian Safety in Jordan
Pedestrian safety is a critical concern in Jordan, where researchers use multifaceted approaches to road challenges. Obaidat and Ramadan [16] examined variables impacting the expected number of accidents, finding that average vehicle speed, posted speed limits, road design (horizontal/vertical curves, median width), surface type, lighting, traffic volume, pedestrian crossing facilities, and the percentage of heavy vehicles all play crucial roles. Al-Masaeid [17] highlighted that increased enforcement and stricter traffic laws might help reduce accidents primarily caused by careless and aggressive driving. Al-Abdallat et al. [18] discovered that alcohol and psychotropic drugs were present in 36.5% of fatal RTAs, with pedestrians comprising 49.8% of victims and those aged 19–29 making up 29.6% of cases. Furthermore, studies suggest that road geometry significantly influences driver behavior [19,20]. Drivers tend to exhibit higher speeds and riskier behaviors on wider roads and at poorly designed intersections [21]. Conversely, narrow roads, well-marked pedestrian crossings, and areas with traffic calming measures encourage safer driving practices [22,23,24,25,26].
2.3. Predictive and Statistical Modeling Approaches
Methodological advancements in Jordan emphasize data-driven insights. Yousif and AlRababaa [27] utilized a neural network technique to forecast accidents and develop regulatory equations. Rahamneh et al. [28] employed the Poisson regression model to forecast 2022 traffic accidents, using monthly data from 2017 to 2021. Hmaid and Imam [29,30] developed crash prediction models for roadway segments using 2014–2018 JTI data, showing that crash occurrence increased with higher speed limits, daily traffic, and segment length, while night driving, snowy weather, or speeds above 60 km/h significantly increased fatal risks. Khasawneh et al. [31] utilized time series analysis to forecast traffic accidents. Recently, Al Hasanat et al. [14] applied cost-sensitive algorithms to decade-long urban datasets in Amman to successfully uncover critical risk factors and underscore the influence of speed, lighting, vehicle type, and roadway context on fatality likelihood.
2.4. Spatiotemporal Patterns and Hotspot Identification
Edries and Alomari [32] found that most pedestrian accidents occurred outside of intersections, in clear weather, on dry surfaces, during daylight and low speeds, peaking on Thursdays in July. AlOmari and Obaidat [33] and Alkhadour et al., identifying accident hotspots in Irbid and Amman, respectively, often concentrated in commercial, residential, and industrial zones with high population densities and traffic volumes, coupled with low-speed limits, contributed to the elevated accident risk. Shbeeb [34] analyzed pedestrian casualty distribution using KDE, spatial autocorrelation (Moran’s I), K-Means clustering, and regression on three years of data, noting the random nature of some patterns. Shehadeh et al. (2024) [35] used a multilevel Generalized Linear Mixed Gamma regression model to analyze 166 accidents at 47 signalized intersections from 2007 to 2019 in Amman.
2.5. Socio-Economic and Public Health Impacts
Al-Tammemi et al. (2024) [36] revealed a 42.1% increase in registered vehicles alongside rising average daily RTAs, peaking at 11,241 in 2021. Financial burdens rose from 1.363 billion Dinars in 2012–2016 to 1.561 billion Dinars in 2017–2021. Alrahamneh and AlBtoush [37] developed a 15-year model (1995–2010) showing the significant financial impact of TRAs, while Ghadi et al. [38] found that expenses consistently accounted for 2.25% to 2.5% of the GDP between 2011 and 2013. Abuaddous et al. [39] identified RTA black spots in Amman over a 3-year period to inform strategies. Al-Khateeb [40] examined the safety landscape, emphasizing pedestrians as the highest casualty group, particularly males aged 18–42 and children 0–18.
2.6. Research Gap and Novelty
The existing literature emphasizes temporal patterns, spatial clustering, injury severity distributions, and global policy implications; however, an integrated methodological gap remains for Amman, Jordan, where detailed localized studies unifying spatial frequency mapping with discrete choice econometric modeling are limited. This study fills this gap by employing DBSCAN clustering and KDE to comprehensively analyze pedestrian accidents over a full decade. Unlike previous research, this study provides detailed insights into injury severity by day and hour, revealing specific temporal patterns and high-risk periods.
This is the first study in the Jordanian context to bridge accident frequency with severity mechanisms by integrating advanced DBSCAN spatial clustering and KDE with the Ordered Logit Model. By merging these methodologies, the study not only enhances the understanding of pedestrian accident dynamics but also offers localized, actionable insights and recommendations for targeted safety interventions and urban planning improvements tailored specifically to Amman’s unique urban context.
3. Methodology
3.1. Study Area and Data Collection
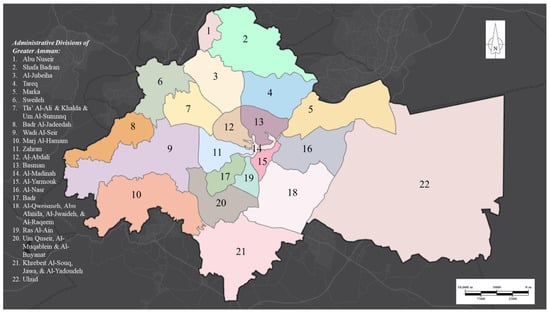
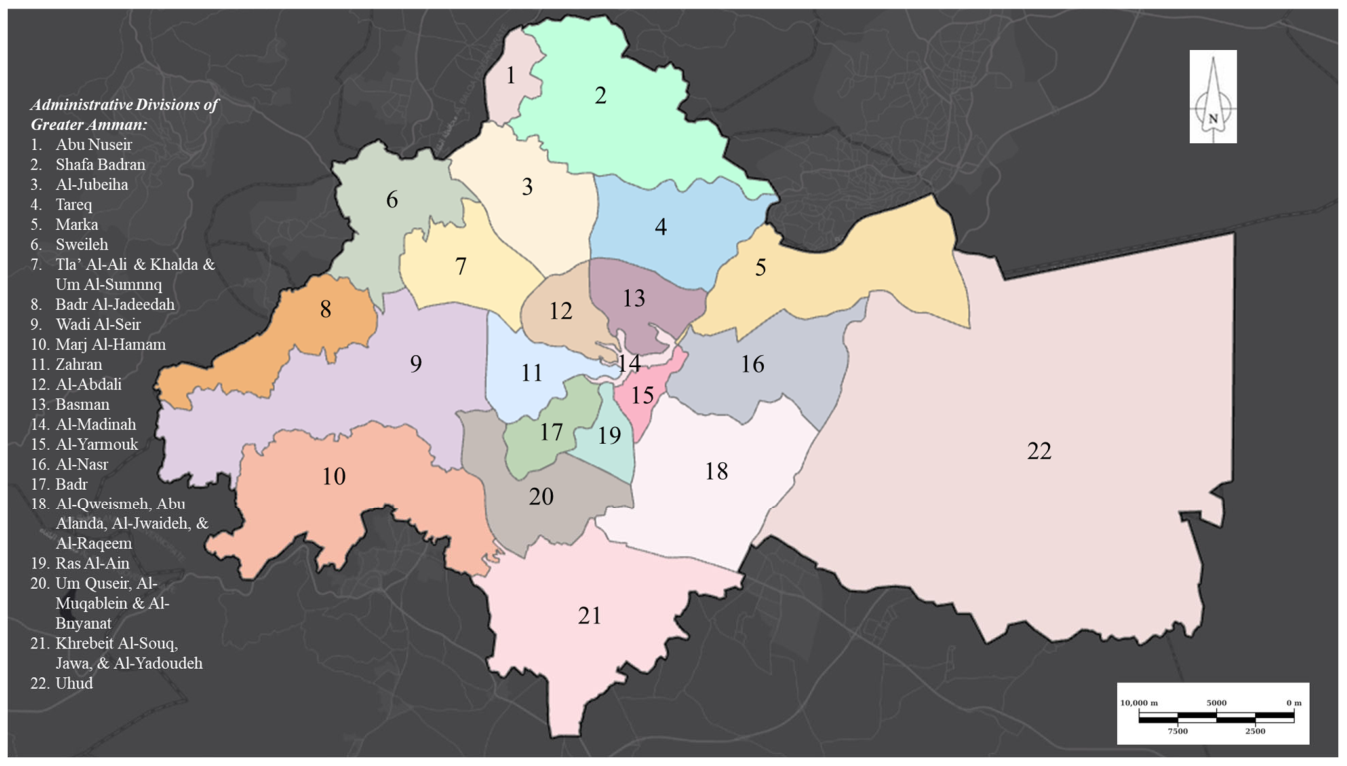
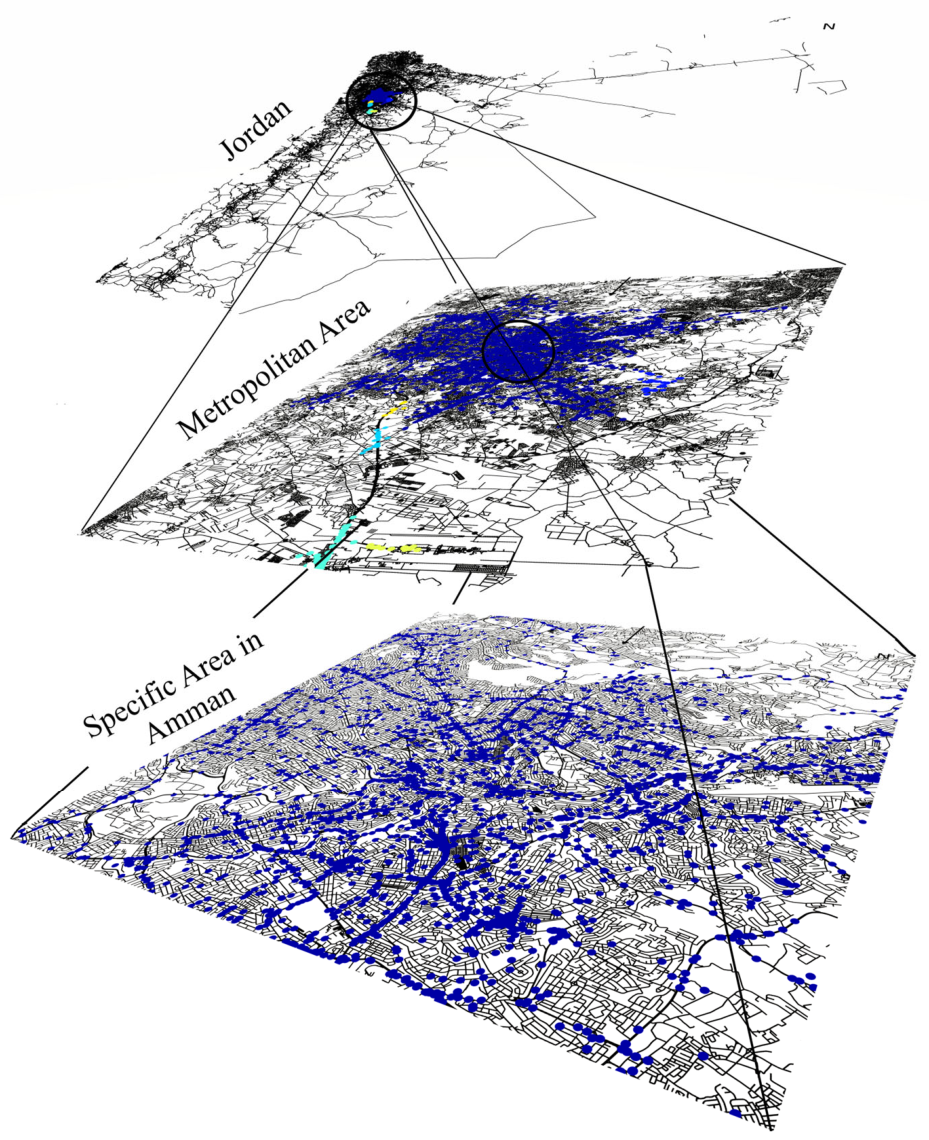
Amman, the capital and largest city of Jordan, serves as the primary metropolitan hub and the Jordanian nation’s center for commerce and governance. The city consists of twenty-two administrative areas managed by the Greater Amman Municipality, as illustrated in the administrative divisions map (Figure 1). As a major regional center, Amman’s population reached approximately 4,920,100 in 2024 [41]. The city is the nation’s most crash-affected region; the year 2022 recorded a clear peak of exactly 1635 pedestrian accidents, accounting for more than 11% of the total 14,821 decadal crashes, highlighting the critical need for safety interventions. The spatial distribution of these incidents is analyzed across multi-scale layers, from the national level down to specific urban sectors.
Figure 1.
Distinct areas within the city of Amman (source: [11]).
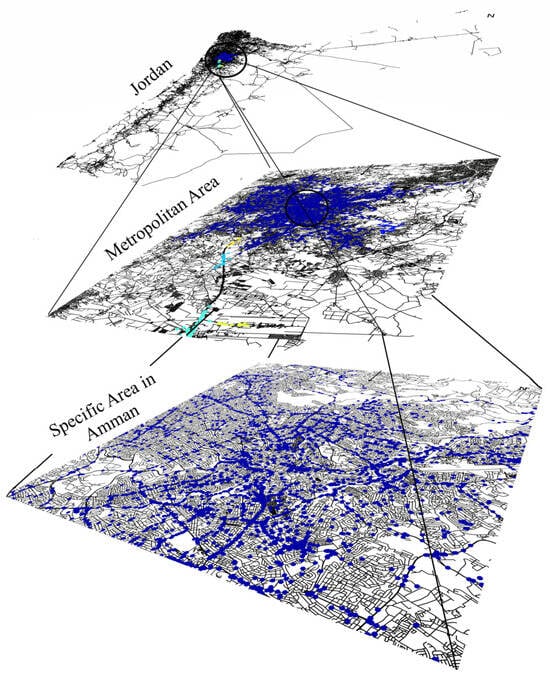
This study employs a combination of spatial and temporal analysis techniques to investigate pedestrian accidents in Amman from 2014 to 2023. Temporal patterns were analyzed using radar charts to visualize the distribution of accidents across hours, days, and months. Spatial patterns were explored using Kernel Density Estimation (KDE) to identify accident hotspots, supported by Comparative Map Analysis (CMA) (see Figure 2) where roads are in black, accidents are in blue, hotspots are in cyan/yellow/green, and spatial zooming techniques to examine trends across different locations and time periods. All data processing, analysis, and visualization were carried out using Python version 3.10.
Figure 2.
Spatial zooming map for all pedestrian accidents. (Jordan, metropolitan area, and specific area in Amman).
For exact scientific reproducibility, the projected coordinate reference system (CRS) utilized for all spatial tracking layers is the Jordan Transverse Mercator (JTM) grid (EPSG:2319), ensuring all geographic points are evaluated using true Euclidean metrics in meters. The geocoding accuracy is highly verified, featuring high-resolution coordinates captured directly on-scene via GPS by responding Public Security Directorate (PSD) traffic officers. The density-based DBSCAN algorithm was parameter-calibrated using a k-distance graph elbow analysis to establish a neighborhood search radius of 150 m and a minimum core cluster density of 30 incidents, which were systematically validated across an analytical grid-search sensitivity matrix , ; [10, 50]), to prove cluster invariance against localized noise. Concurrently, the Kernel Density Estimation (KDE) hot-spot models were structurally estimated using a standard quartic kernel function with a fixed adaptive spatial smoothing bandwidth of 250 m across all subplots, calculated and cross-verified via Silverman’s Rule of Thumb to maintain uniform density comparison scales across distinct temporal blocks.
3.2. Injury Severity Modeling
To examine the determinants of pedestrian injury severity, an ordered logit model was estimated. Injury severity in Equation (1) was treated as an ordinal dependent variable with four ordered categories:
The ordered logit model assumes the existence of an unobserved latent severity propensity Yi∗, expressed in Equation (2) as:
where is the latent injury severity propensity for crash i, Xi is a vector of explanatory variables, β’ is the vector of estimated coefficients, and εi is a random error term assumed to follow a logistic distribution. The observed injury severity category is determined by threshold parameters , as shown in Equation (3):
The cumulative probability of observing severity level j or below is given in Equation (4):
Accordingly, the probability that crash i belongs to severity category j is as shown in Equation (5):
where denotes the logistic cumulative distribution function. For the four severity categories used in this study, the category-specific probabilities are as shown through Equations (6)–(9):
The explanatory vector includes traffic, temporal, driver, vehicle, and roadway variables:
- Traffic: Speeding, number of vehicles, and collision type.
- Temporal: Time of day, day of week, and seasonal effects.
- Behavioral: Driver age, gender, and specific errors.
- Roadway: Surface condition, geometry, and lighting.
The estimated odds ratio for each explanatory variable is calculated as: , where > 1 indicates an increased likelihood of higher injury severity, while < 1 indicates a reduced likelihood of higher injury severity.
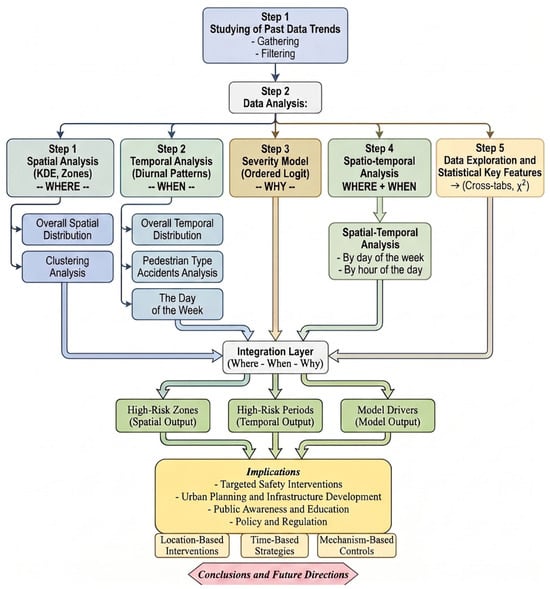
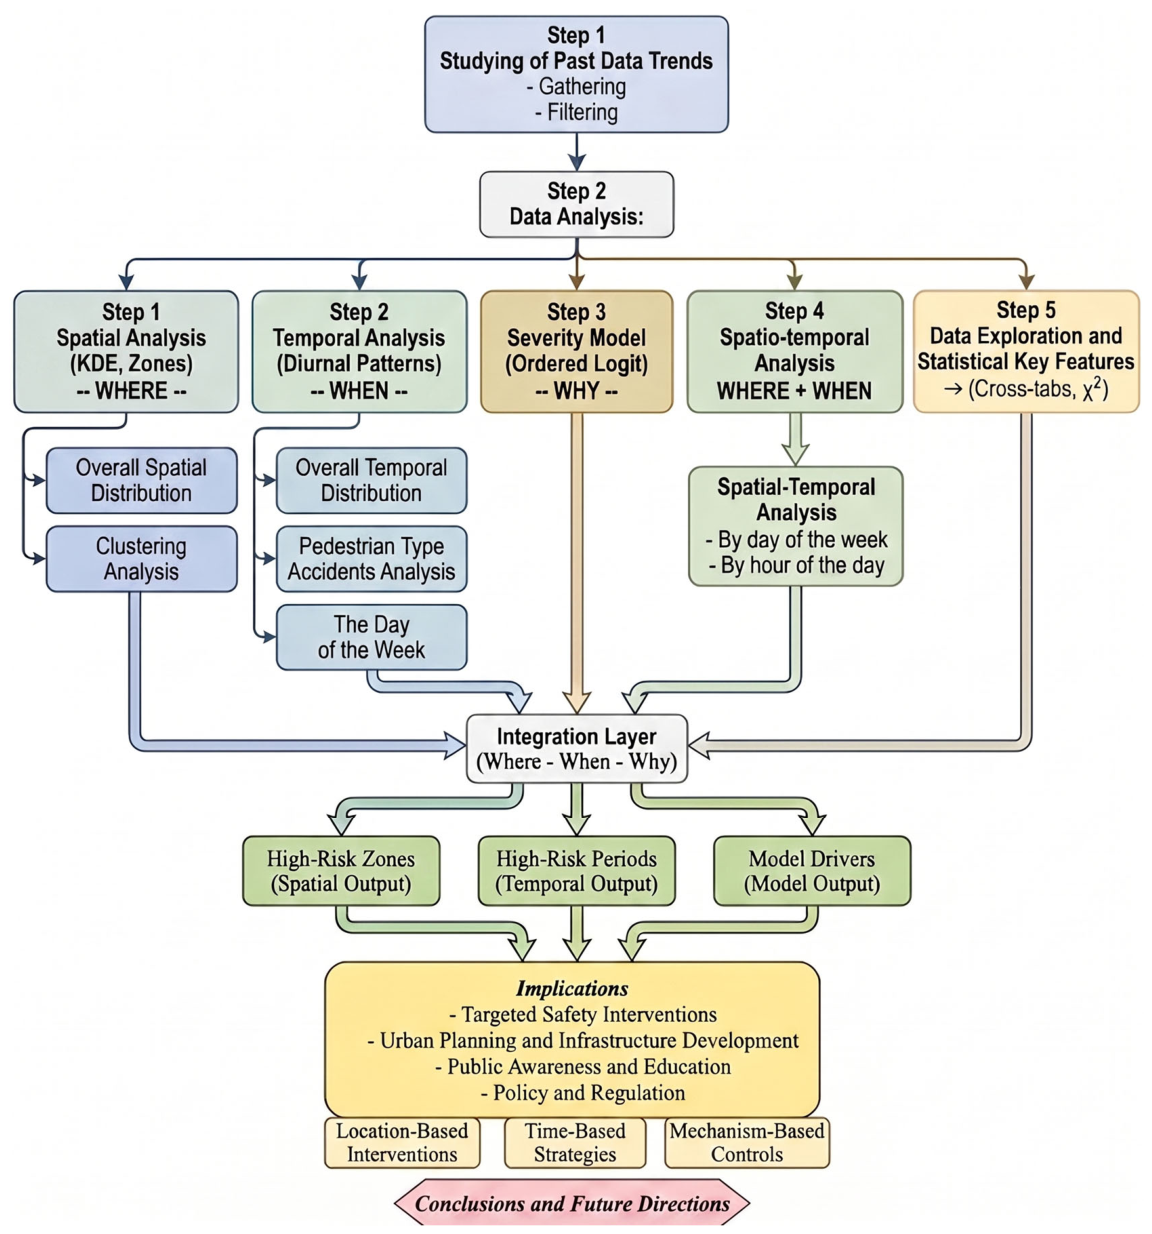
Figure 3 presents the integrated multi-stage methodological framework used in this study. The architecture begins with historical data collection and rigorous sample filtering to establish a clean decadal baseline. This dataset simultaneously feeds into five parallel analytical tracks. These tracks systematically isolate spatial point distributions, diurnal temporal variations, discrete econometric injury thresholds, combined spatio-temporal dynamics, and cross-categorical statistical key features.
Figure 3.
The general methodology flowchart employed in this study.
The primary novelty of this approach lies in synthesizing separate density clustering outputs directly with discrete choice econometric modeling parameters using Amman’s empirical transport data to bridge the analytical gap between physical exposure and casualty severity. As mapped out in the chart layout, these decoupled outputs systematically converge into a unified integration layer. This computational layer processes localized risk zones, peak operational periods, and key model drivers to establish a scientific foundation for target-specific urban interventions. Finally, these practical outputs translate directly into location-based engineering modifications, time-sensitive management strategies, and mechanism-based safety controls.
4. Analysis and Results
The analysis of 14,821 pedestrian accident cases in Amman from 2014 to 2023 provides a comprehensive understanding of the temporal, spatial, and contextual factors influencing pedestrian safety. This section follows a structured analytical progression: it begins with a descriptive examination of categorical variables and statistical independence tests, transitions into an Ordered Logit Model to isolate structural determinants of injury severity, and concludes with high-resolution spatial and temporal mapping. By integrating these multidimensional insights, the results establish a data-driven basis for evidence-based safety interventions and urban transportation policy.
4.1. Data Exploration and Statistical Key Features
This section presents a detailed examination of the dataset, referencing the categorical distributions relative to the total number of reported pedestrian accidents (see Appendix A, Table A1).
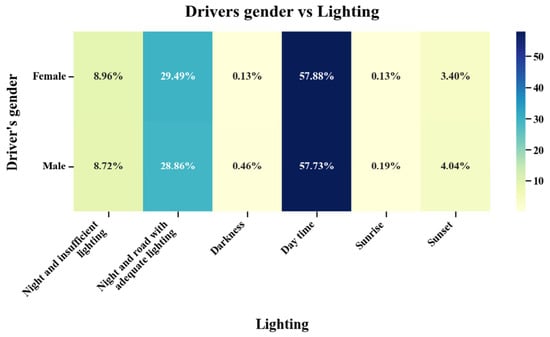
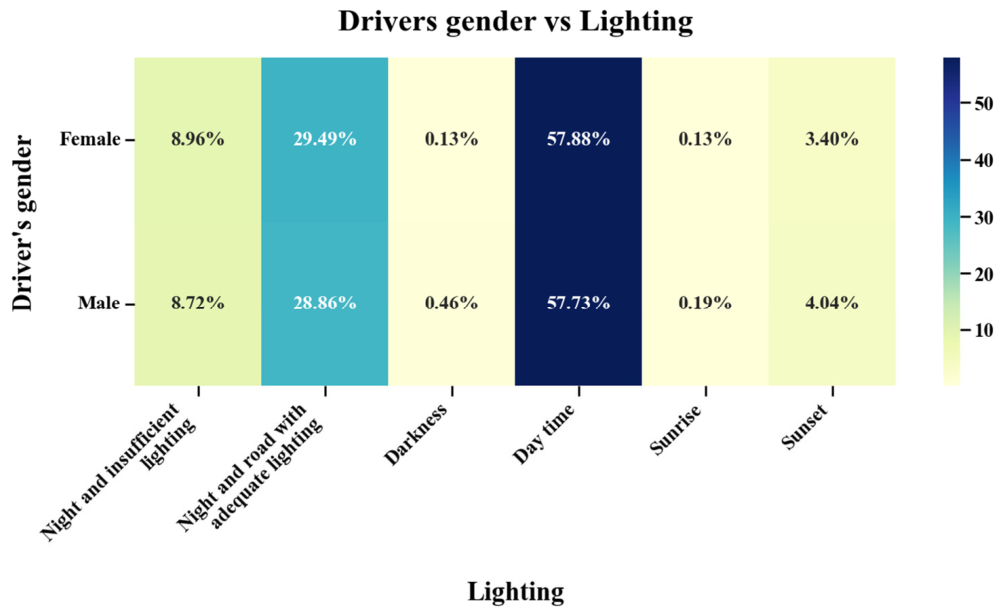
When evaluating lighting conditions and driver gender, cross-tabulations in Figure 4 establish that 79.96% of cases involved male drivers and 20.04% involved females. Among females, 57.88% of incidents occurred during daytime, 29.49% with adequate lighting at night, and 8.96% under insufficient lighting, while male drivers showed a matching distribution of 57.73% in daylight, 28.86% under adequate lighting, and 8.72% under insufficient lighting. This confirms a completely consistent visibility baseline across both gender groups, with over 57% of accidents occurring in daylight and nearly 38% combined under night conditions.
Figure 4.
Interaction of lighting conditions and driver gender in pedestrian accident cases.
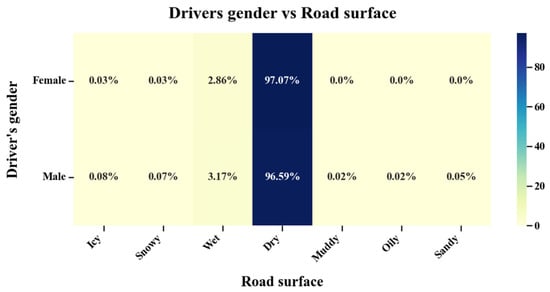
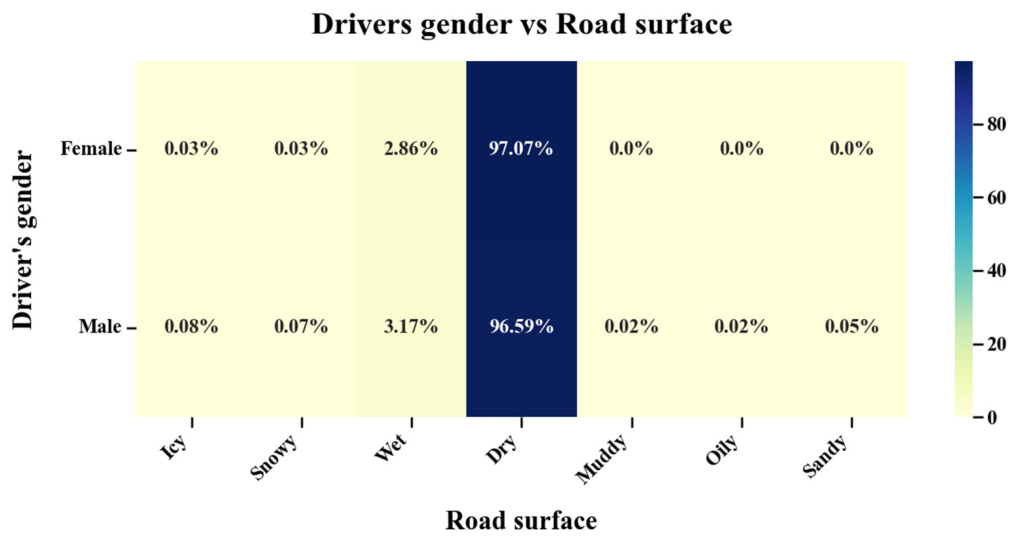
An analysis of road surface conditions and driver gender reveals that dry pavement dominated across both demographic groups, involving 97.07% of female and 96.59% of male cases as shown in Figure 5. Wet surfaces were the second most reported, accounting for 2.86% and 3.17% of female and male cases, respectively, while icy or snowy conditions were negligible, collectively tracking below 0.1% for both genders. Rare alternatives (muddy, oily, sandy) accounted for fewer than 0.1% of male incidents and were completely absent from female-related cases, reflecting Amman’s typical dry weather layout.
Figure 5.
Pedestrian crashes categorized by road surface condition and driver gender.
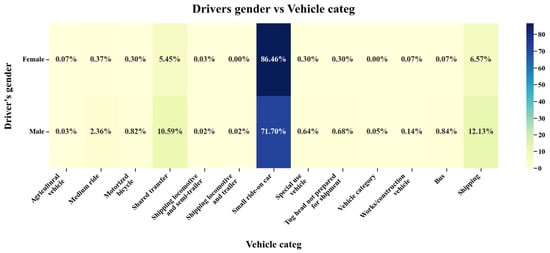
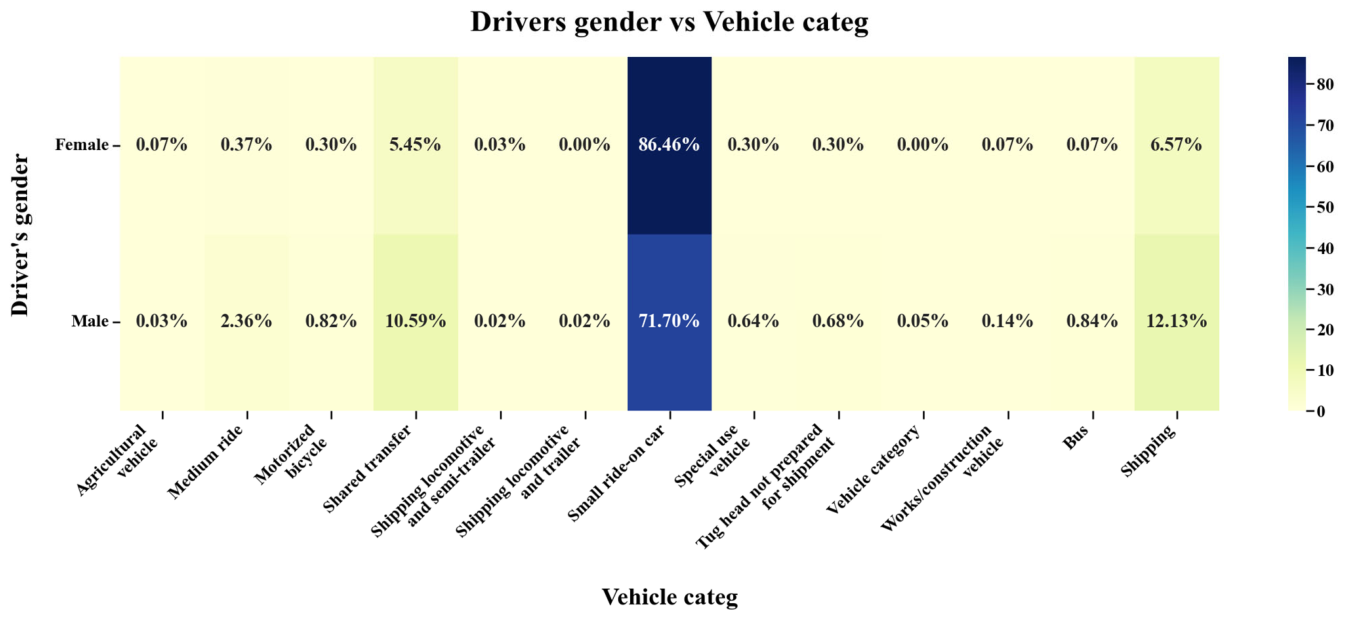
Looking at vehicle categories and driver gender, females are overwhelmingly concentrated in small ride-on cars (86.46%), followed by shared transfer (5.45%) and shipping (6.57%), with all alternative categories representing under 1% in Figure 6. Notably, heavy tug heads, locomotives, trailers, and construction vehicles are entirely absent among females. Male drivers also predominantly operate small cars (71.7%) but show a wider operational spread across shared transfer (10.59%) and shipping (12.13%), making up nearly all drivers of heavy industrial machinery.
Figure 6.
Proportion of vehicle categories by gender of the driver.
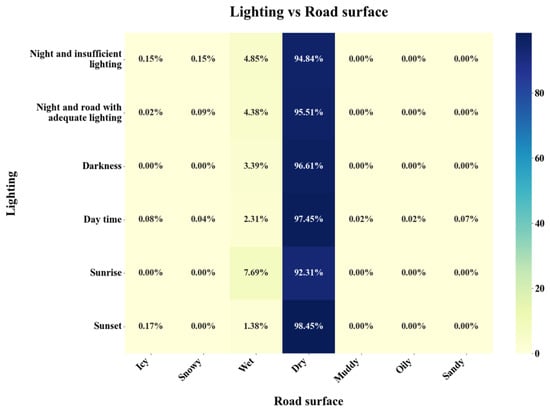
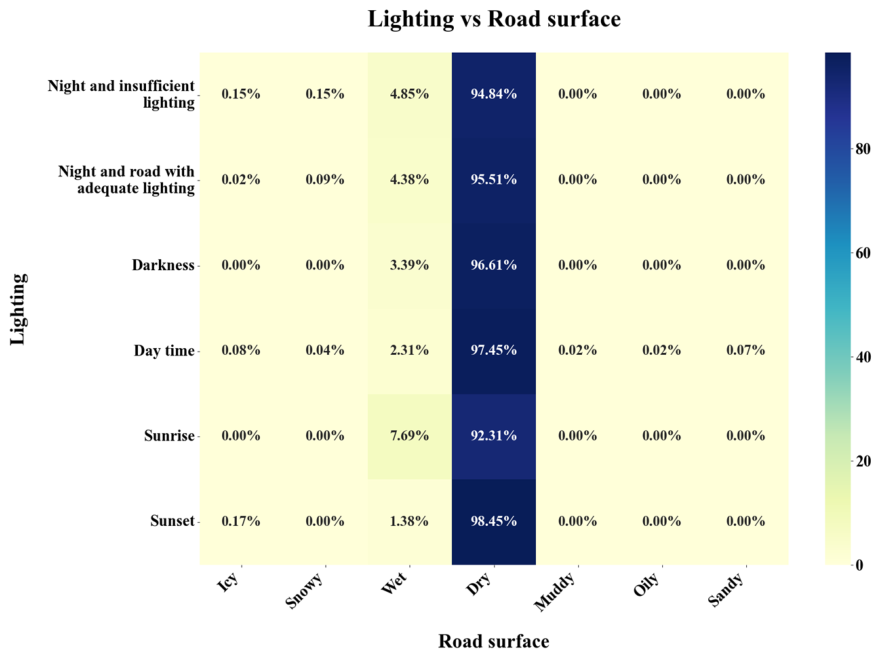
When cross-referencing lighting conditions and road surface types as illustrated in Figure 7, dry surfaces dominate across all lighting conditions, accounting for over 92% in each category, led by sunset (98.45%) and daytime (97.45%). Even under adverse visibility—night with inadequate lighting (94.84%) and night with adequate lighting (95.51%)—dry roads remain prevalent. Wet surfaces range from 1.38% to 7.69%, appearing most pronounced during sunrise (7.69%), night with insufficient lighting (4.85%), and night with adequate lighting (4.38%), while icy, snowy, or rare conditions contributed under 0.2%.
Figure 7.
Cross-distribution of lighting conditions and road surface types.
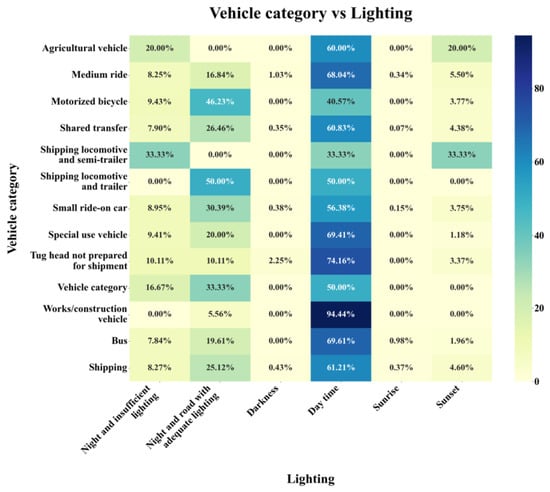
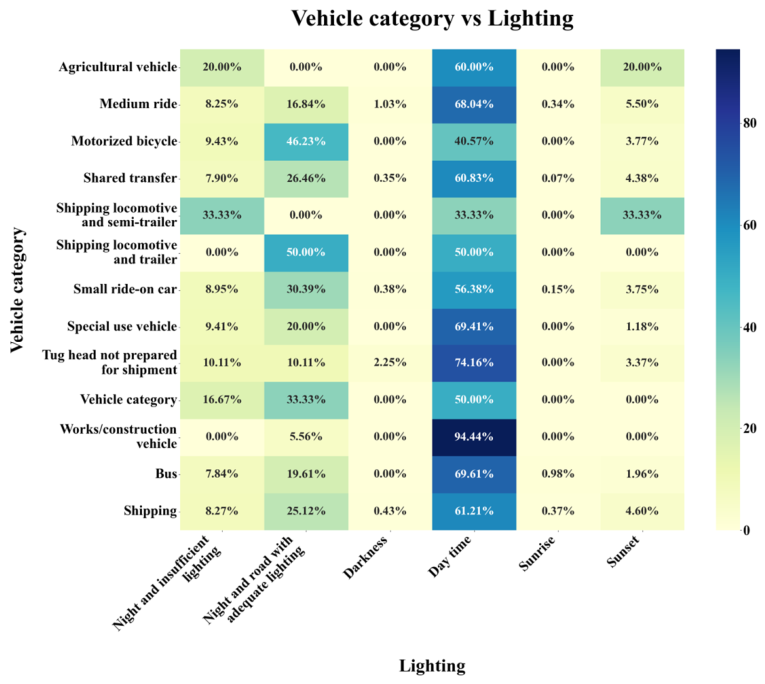
The interaction between lighting conditions and vehicle categories highlights that most incidents occurred during daylight (57.76%), followed by adequately lit roads at night (28.98%) and poorly lit conditions (8.77%), mapping out clear operational dependencies in Figure 8. Small ride-on cars are dominant, with 56.38% of incidents in daytime and 30.39% at night under sufficient lighting. Shared transfer vehicles reported 60.83% of cases in daytime and 26.46% under well-lit night conditions, while shipping-related vehicles showed 61.21% daytime and 25.12% adequately lit night incidents, and construction vehicles showed the highest daytime proportion (94.44%).
Figure 8.
Interaction of vehicle category and lighting condition in pedestrian-related incidents.
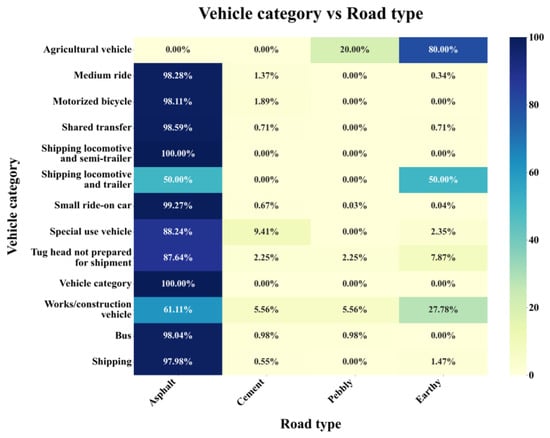
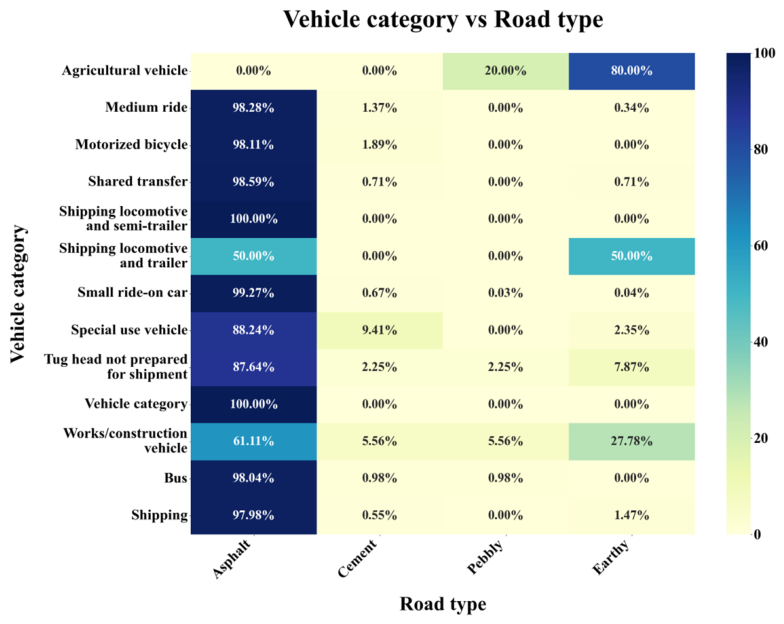
Finally, evaluating vehicle categories and road surface types indicates that asphalt roads accounted for 98.8% of all incidents across the framework evaluated in Figure 9, followed by cement (0.75%), earthy (0.39%), and pebbly roads (0.05%). Small ride-on cars showed the highest asphalt share (99.27%), with minimal incidents on alternative surfaces, while shared transfer, shipping, bus, and medium ride vehicles all recorded over 97% on asphalt. Motorized bicycles reached 98.11% on asphalt, while special use vehicles showed 88.24% on asphalt and 9.41% on cement, and tug heads recorded 87.64% asphalt and 7.87% earthy.
Figure 9.
Pedestrian-involved incidents categorized by vehicle type and road surface condition.
To examine the statistical relationships among key crash-related variables, Pearson’s Chi-square(χ2) tests of independence were conducted, with results summarized in Table 1. A statistically significant association was identified between lighting conditions and road surface, χ2(30) = 76.21, p < 0.001. suggesting that low-light environments are disproportionately associated with compromised surface conditions, such as wet or icy roads. Similarly, a strong association exists between vehicle category and lighting, χ2(60) = 148.52, p < 0.001, indicating that certain vehicle types (e.g., shared transport, heavy vehicles) are more frequently involved in pedestrian incidents during night or low-visibility periods. The most pronounced relationship was observed between vehicle category and road type, χ2(36) = 2182.20, p < 0.001, highlighting that heavier or specialized vehicles tend to be involved in crashes on specific road types. Additionally, driver gender was significantly associated with vehicle category, χ2(12) = 293.85, p < 0.001, reflecting potential gender-based differences in driving roles or vehicle assignment. Conversely, no statistically significant relationships were found between driver gender and lighting conditions, χ2(5) = 9.82, p = 0.081, or between driver gender and road surface, χ2(6) = 4.57, p = 0.600. These findings indicate that gender is not significantly linked to exposure to lighting or surface variations in the observed pedestrian crash dataset.
Table 1.
Chi-square Test Results Based on Cross-tabulation Results.
4.2. Injury Severity Modeling Results
4.2.1. Model Estimation and Analytical Purpose
An ordered logit model was estimated to identify the structural factors associated with increasing pedestrian injury severity. The dependent variable was defined as an ordinal outcome encompassing four ordered categories: minimal injury, minor injury, major injury, and fatal injury. This statistical specification is appropriate as the response variable represents an ordered progression of crash consequences rather than independent nominal outcomes. The final model was estimated using 11,948 valid observations following the exclusion of records with incomplete values in the selected explanatory variables. The successful convergence of the model indicates that the final specification was statistically estimable. A total of 18 explanatory variables were retained after reducing categorical variables into analytically meaningful groups and removing collinear predictors. The model output yielded a log-likelihood of −11,570, with AIC and BIC values of 23,180 and 23,340, respectively; these estimation statistics are summarized in Table 2.
Table 2.
Ordered logit model estimation summary.
The reduction from 14,821 to 11,948 records is attributed to the exclusion of observations with missing values in the model variables. Despite this reduction, the retained sample remains sufficiently large for estimating a robust ordinal severity model and maintains a meaningful representation across all severity categories.
4.2.2. Injury Severity Distribution in the Estimation Sample
The injury severity distribution used in the final model is summarized in Table 3. Minimal injury crashes constitute the largest share of the estimation sample (64.3%), followed by minor (20.9%), major (9.6%), and fatal injuries (5.1%). Severe outcomes, represented by the combined categories of major and fatal injuries, account for 14.7% of the estimation sample.
Table 3.
Injury severity distribution.
This distribution confirms the typical imbalance of crash severity data, where less severe outcomes occur more frequently than severe and fatal injuries. However, the presence of 1760 major and fatal injury cases provides adequate variation for identifying factors associated with transitions toward higher severity outcomes.
4.2.3. Ordered Logit Model Estimates
Table 4 reports the estimated coefficients, odds ratios (OR), and significance levels. In this framework, a positive coefficient (OR > 1) indicates an increased likelihood of higher injury severity, while a negative coefficient (OR < 1) indicates a reduced likelihood. The ‘Hour of day’ variable is modeled linearly from 1 to 24 to evaluate the baseline daily progression. While early-morning and late-night hours share overlapping risk traits, such as low visibility and higher speeds, these high-risk variations are separately captured by the ‘Evening peak’ indicator. This structure avoids statistical redundancy and maintains a clear, straightforward interpretation of the baseline temporal coefficients.
Table 4.
Final ordered logit estimates for pedestrian injury severity.
4.2.4. Traffic Operating Conditions
Traffic operating conditions significantly influence pedestrian injury severity. Speed is positive and highly significant (coefficient = 0.0222; OR = 1.022), indicating that each unit increase in speed raises the odds of a more severe injury category by 2.2%. While the coefficient appears small, its cumulative impact is substantial; for instance, a 10-unit speed increase raises the odds of higher severity by approximately 24% (). This aligns with the physical mechanism of injury, where higher impact speeds increase kinetic energy transfer and decrease evasive action time.
The number of vehicles involved is also a significant positive predictor (OR = 1.338), with each additional vehicle increasing the odds of higher severity by 33.8%. This suggests severity is amplified in complex environments where multiple vehicles contribute to secondary impacts or reduced avoidance space. These practical interpretations are summarized in Table 5. Findings indicate that severity is more strongly related to dynamic traffic conditions than static attributes, suggesting that high-speed, multi-vehicle corridors should be prioritized for safety interventions.
Table 5.
Interpretation of significant traffic operating variables.
4.2.5. Temporal Effects
Temporal variables indicate that injury severity is concentrated within specific time windows rather than increasing uniformly throughout the day. The evening peak variable is positive and statistically significant, with an odds ratio of 1.292, indicating that crashes during this period have 29.2% higher odds of resulting in a more severe injury category compared to other periods, holding all factors constant. Conversely, the continuous hour variable is negative and significant (OR = 0.983). Rather than suggesting later hours are safer, this variable captures the residual linear effect of time after accounting for peak-period indicators; the positive evening peak coefficient confirms that severity is concentrated during high-risk windows rather than increasing monotonically across the day.
Morning peak (OR = 1.046; p = 0.517) and weekend (OR = 1.077; p = 0.086) variables were not statistically significant at the 5% level, suggesting their severity profiles are not robustly distinguishable from non-peak or weekday crashes when controlling for other covariates. These findings, summarized in Table 6, support a time-targeted safety interpretation. The evening period’s association with both high occurrence and increased severity strengthens the case for evening-focused enforcement, crossing protection, and speed management.
Table 6.
Interpretation of temporal variables.
4.2.6. Driver-Related and Behavioral Factors
Driver age is not statistically significant (p = 0.758), indicating it does not independently explain severity once traffic, vehicle, and roadway variables are controlled. Similarly, the male driver indicator is negative (OR = 0.911) but only marginally significant (p = 0.100) and should not be interpreted as a robust predictor. Conversely, speed-related driver error is the model’s strongest behavioral predictor, with a coefficient of 4.3983 and an odds ratio of approximately 81.3 (p < 0.001), signifying substantially higher odds of severe outcomes.
While the magnitude of this odds ratio may reflect low category frequency or a high concentration of severe outcomes, its statistical significance confirms that speed-related error is a robust severity factor. This result reinforces the separate continuous speed effect, demonstrating that both measured speed and recorded speed-related behavior independently influence injury severity. These effects are summarized in Table 7. The combined evidence suggests that reduction strategies should prioritize speed compliance, automated enforcement, and traffic calming over general awareness campaigns.
Table 7.
Driver-related and behavioral effects.
4.2.7. Vehicle Type Effects
Among vehicle-type variables, passenger vehicles are significantly associated with lower injury severity, with a coefficient of −0.5707 and an odds ratio of 0.565. This indicates that crashes involving passenger vehicles have 43.5% lower odds of higher severity relative to the reference category. Conversely, heavy vehicles (OR = 1.029; p = 0.893), motorcycles (OR = 1.206; p = 0.531), and other vehicle categories are not statistically significant, suggesting their independent effects are not distinguishable after controlling for speed, behavior, and roadway characteristics.
These findings are summarized in Table 8. The significant protective effect of passenger vehicles may reflect differences in mass, geometry, braking performance, or operating environment relative to the reference group. From a policy perspective, vehicle composition should be considered when identifying high-severity corridors, especially in areas with frequent non-passenger vehicle operations.
Table 8.
Vehicle type parameters.
4.2.8. Roadway and Infrastructure Effects
Roadway characteristics are among the most significant structural determinants in the model. Non-asphalt roads more than double the odds of higher severity (OR = 2.166, p < 0.001) compared to asphalt roads, holding other variables constant. Two-way roads also significantly increase severity (OR = 1.385, p < 0.001), representing 38.5% higher odds of severe outcomes, likely due to greater crossing complexity and exposure to opposing traffic streams.
Conversely, straight geometry is negatively associated with severity (OR = 0.306, p < 0.001), indicating 69.4% lower odds of higher severity relative to the reference category. This suggests the omitted reference geometry represents more complex environments where visibility and path predictability are more challenging. Notably, surface conditions—including wet (OR = 0.902) and other categories (OR = 1.711)—were not statistically significant. These results, summarized in Table 9, indicate that structural roadway context and infrastructure quality influence pedestrian injury severity more than temporary surface conditions.
Table 9.
Roadway and infrastructure parameters.
4.2.9. Collinearity and Excluded Variables
Lighting-related indicators, including nighttime and low-visibility variables, were tested but not retained in the final specification following collinearity screening. This indicates their explanatory contribution was statistically absorbed by other covariates, specifically temporal indicators such as evening peak and hour of day. Rather than suggesting lighting is irrelevant, this results from the inability to separate independent lighting effects from time-of-day patterns in a multivariate framework without introducing collinearity. Consequently, while lighting remains central to descriptive and spatial–temporal interpretations, the severity model captures these effects indirectly through temporal variables. This statistically defensible approach, summarized in Table 10, avoids overparameterization while preserving the substantive interpretation of visibility through broader temporal analysis.
Table 10.
Treatment of lighting-related variables.
4.2.10. Threshold Parameters
The ordered logit model produces threshold parameters that partition the latent severity scale into observed injury categories. These cut-points serve a technical role in the model and are not interpreted as explanatory variables. As shown in Table 11, significant threshold parameters between minor-to-major (0.1832) and major-to-fatal (0.1771) categories indicate that the model effectively distinguishes upper-level severity transitions. While the first threshold parameter (0.5009; p = 0.150) is not statistically significant, these parameters collectively define the boundaries of the injury progression.
Table 11.
Ordered logit threshold estimates.
The model identifies three dominant dimensions of pedestrian injury severity in Amman: traffic operation, driver behavior, and roadway infrastructure. Key factors increasing severity include speed, speed-related driver error, multi-vehicle involvement, evening peak conditions, two-way traffic, and non-asphalt roads. Conversely, passenger vehicles and straight roadway geometry are associated with reduced severity. These findings, summarized in Table 12, suggest that severity is driven by structural and operational characteristics—such as operating speed, behavioral violations, and conflict complexity—rather than temporary weather or surface conditions.
Table 12.
Summary of significant severity determinants.
The distinction highlights that reducing pedestrian crash severity requires interventions prioritized toward traffic calming, automated speed enforcement, and improved design standards for two-way and lower-standard roads.
Overall, the severity model provides a multivariate explanation for the patterns observed in the descriptive, temporal, and spatial analyses. While the frequency analysis identifies when and where pedestrian crashes are concentrated, the ordered logit model identifies the factors associated with more severe outcomes. The results show that evening peak crashes are not only frequent but also more severe, and that severity is intensified by higher speeds, speed-related driver error, multi-vehicle involvement, two-way road environments, and non-asphalt road conditions. These findings provide a basis for moving from general hotspot identification toward severity-sensitive pedestrian safety planning.
4.3. Temporal Analysis
4.3.1. Overall Temporal Distribution
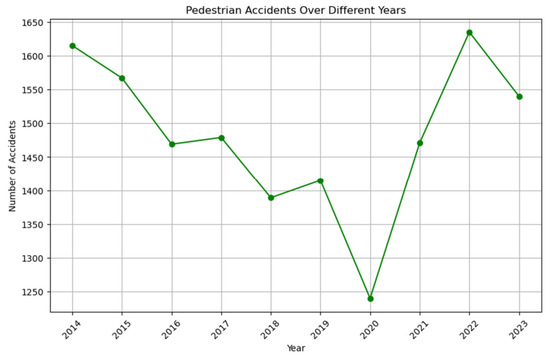
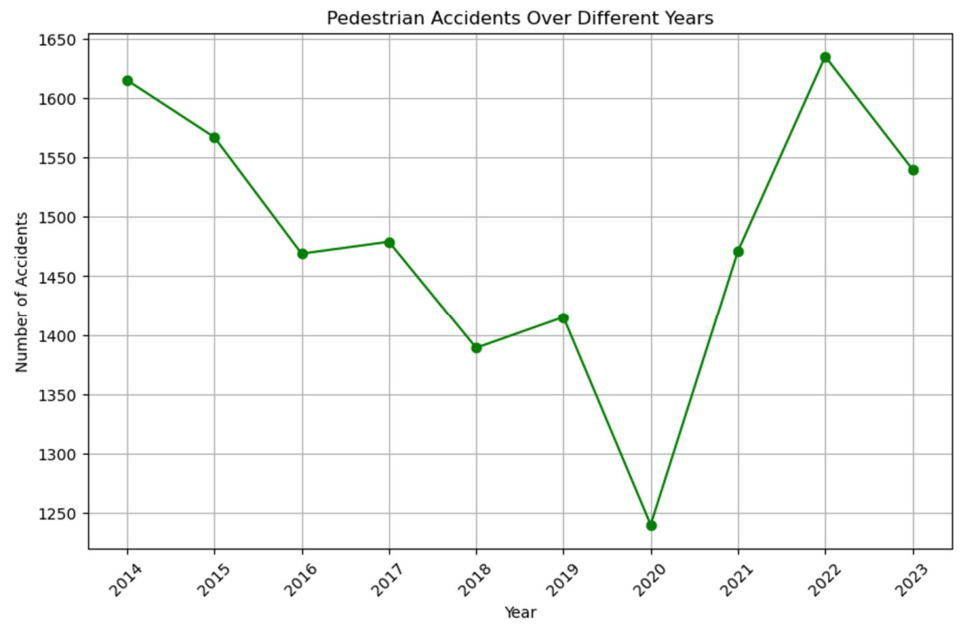
The analysis of accident frequencies by day of the week and hour of the day reveals distinct patterns that are critical for traffic management and safety strategies. Notably, Figure 10 shows the exact year-by-year breakdown of the 14,821 pedestrian accidents over the ten-year study period (2014–2023), dropping from 1615 in 2014 to a low of 1239 in 2020 due to COVID-19 restrictions, before peaking at 1635 in 2022 and settling at 1539 in 2023.
Figure 10.
Annual distribution of pedestrian accidents in Amman (2014–2023).
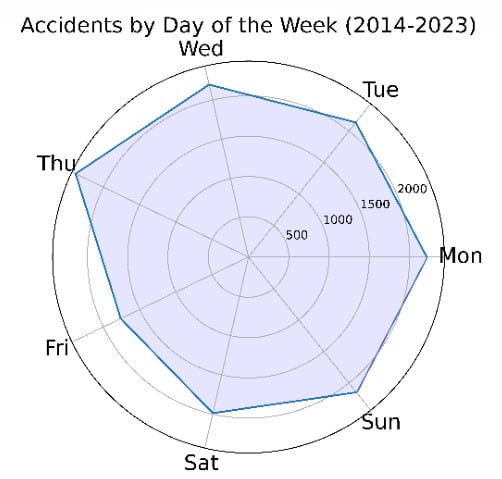
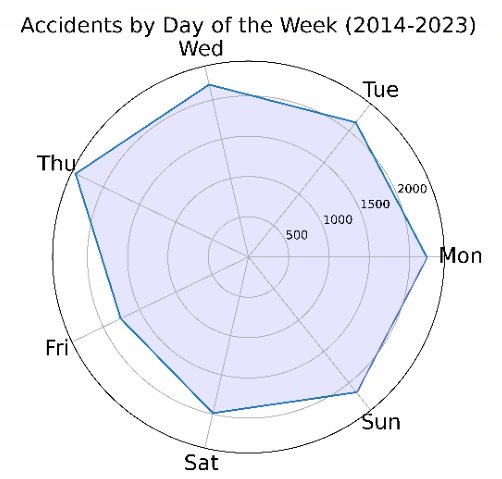
Moving to daily variations, Thursday emerges as the most accident-prone day with 2382 incidents, while Friday records the fewest accidents at 1760. This disparity suggests that Thursdays may involve higher traffic volumes or riskier conditions. Additionally, the beginning of the week, including Monday (2213 accidents), Tuesday (2136 accidents), and Wednesday (2195 accidents), along with Sunday (2148 accidents), also show significant accident frequencies, whereas Saturday (1987 accidents) falls in between the high and low extremes observed as shown in Figure 11.
Figure 11.
Distribution of accidents by day of the week.
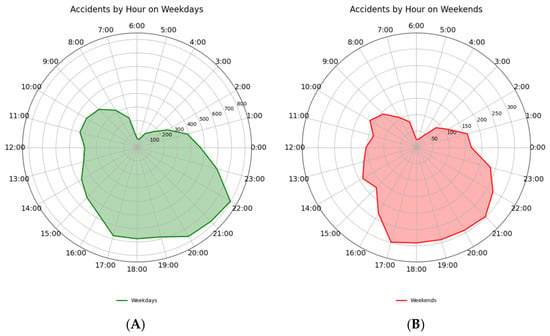
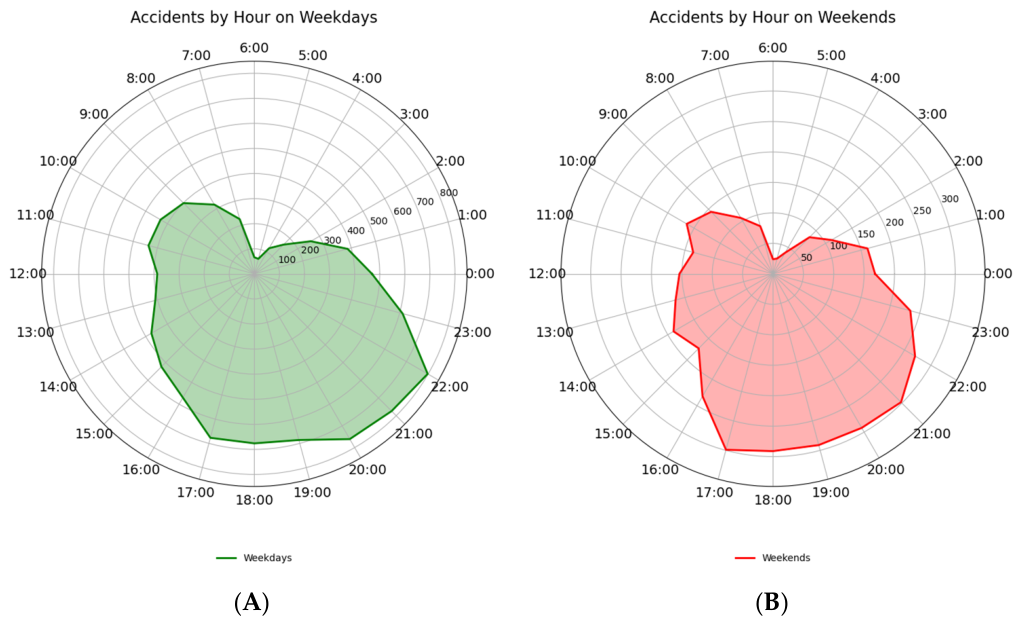
Hourly accident data further highlights critical time periods as shown in Figure 12. The late afternoon and evening hours, from 17:00 to 23:00, exhibit the highest accident counts, peaking at 21:00 with 1072 incidents, followed closely by 22:00 (1068 accidents) and 20:00 (1053 accidents). This trend indicates heightened risks during evening commutes and activities. In stark contrast, the early morning hours from 00:00 to 06:00 experience the lowest accident frequencies, with a nadir at 05:00, recording only 88 accidents. The data shows a gradual increase in accidents starting from 07:00, aligning with the onset of daily activities and traffic, reaching moderate peaks during midday hours, specifically at 14:00 (663 accidents).
Figure 12.
Hourly distribution of pedestrian accidents: (A) working days, (B) weekends.
These findings underscore the importance of targeted traffic safety measures. Increased vigilance and preventive strategies during high-risk periods, such as the late afternoons and evenings, especially on Thursdays, could mitigate accident rates. Conversely, the lower accident rates during early morning hours suggest opportunities for maintenance and infrastructure improvements with minimal traffic disruption. Overall, understanding these temporal patterns enables more effective deployment of resources and enhances public safety initiatives.
4.3.2. Types of Pedestrian Accidents by Day
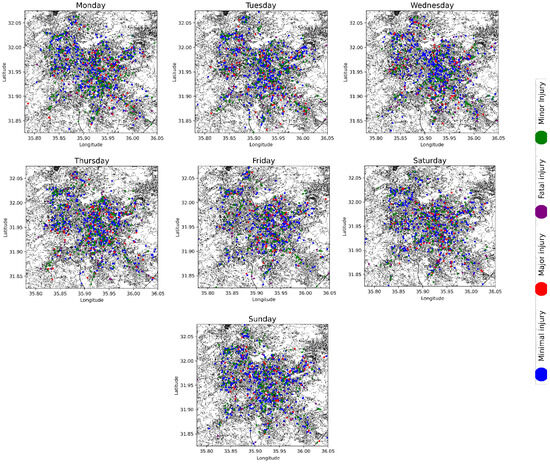
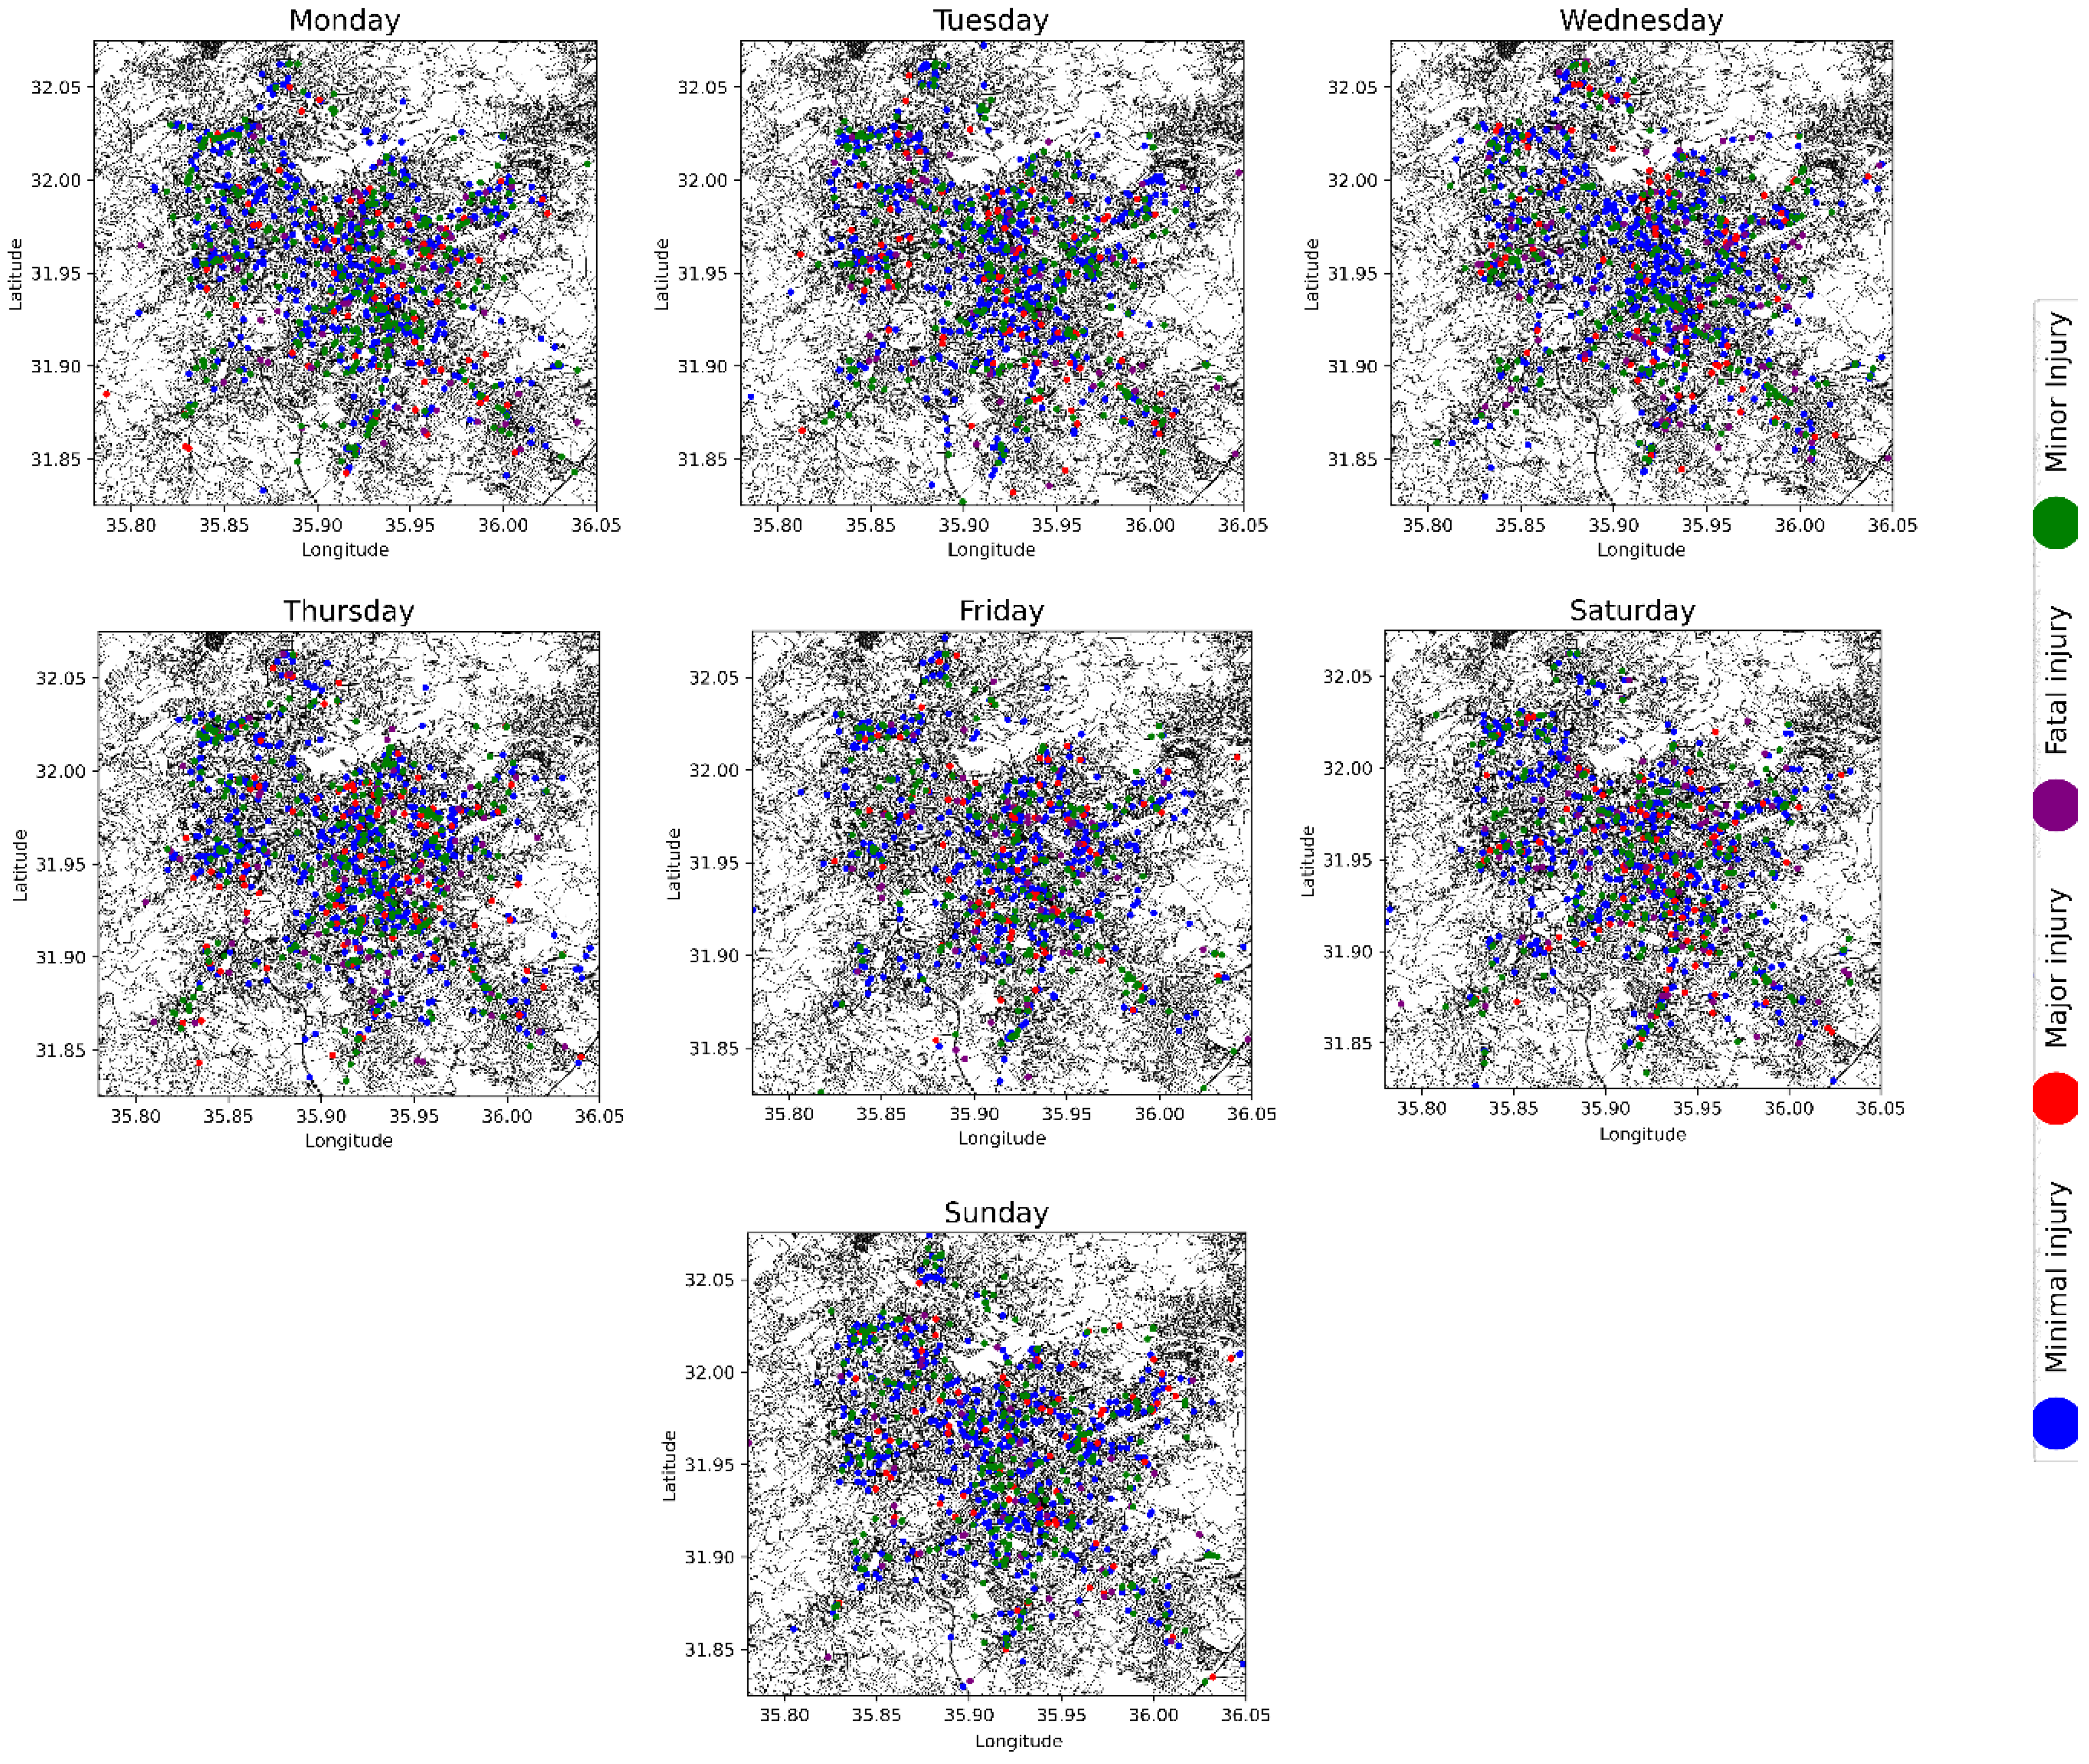
A comprehensive spatial–temporal analysis of pedestrian accident severity in Amman was conducted for the period 2014–2023. Figure 13 illustrates the distribution of the four injury types across the week from Sunday to Saturday and frequency intervals of 200 incidents. Minimal injuries (blue) represent the highest frequency, peaking on Monday and Tuesday with numbers approaching 1400 incidents, while the lowest frequencies occur on Saturday and Sunday, dipping below 200. Minor injuries (green) exhibit moderate frequencies, peaking on Thursday with slightly above 400 incidents and averaging between 200 and 400 on other days. Major injuries (red) occur at a much lower frequency, peaking on Wednesday with approximately 100 incidents and remaining consistently below 100 across other days. Fatal injuries (purple) represent the lowest frequency of all types, with slightly higher occurrences on Tuesday and Thursday (around 30 incidents) and a uniform distribution below 30 incidents on other days. Overall, minimal injuries are the most common, particularly on Monday and Tuesday, while minor injuries show a noticeable increase on Thursday. Major injuries show an even distribution with a slight peak on Wednesday, and fatal injuries remain the least frequent with minor peaks on Tuesday and Thursday. The graph effectively highlights the disparity in accident frequencies by injury type and day, providing valuable insights for preventive traffic safety measures.
Figure 13.
Spatial distribution of pedestrian accidents severity across Amman between 2014 and 2023.
4.3.3. The Day of the Week
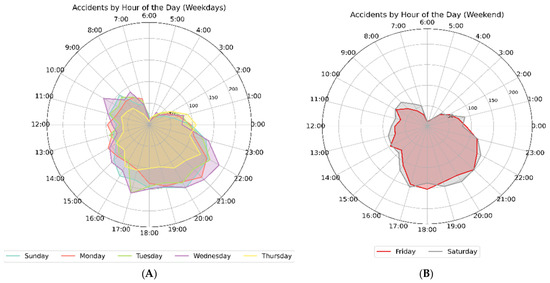
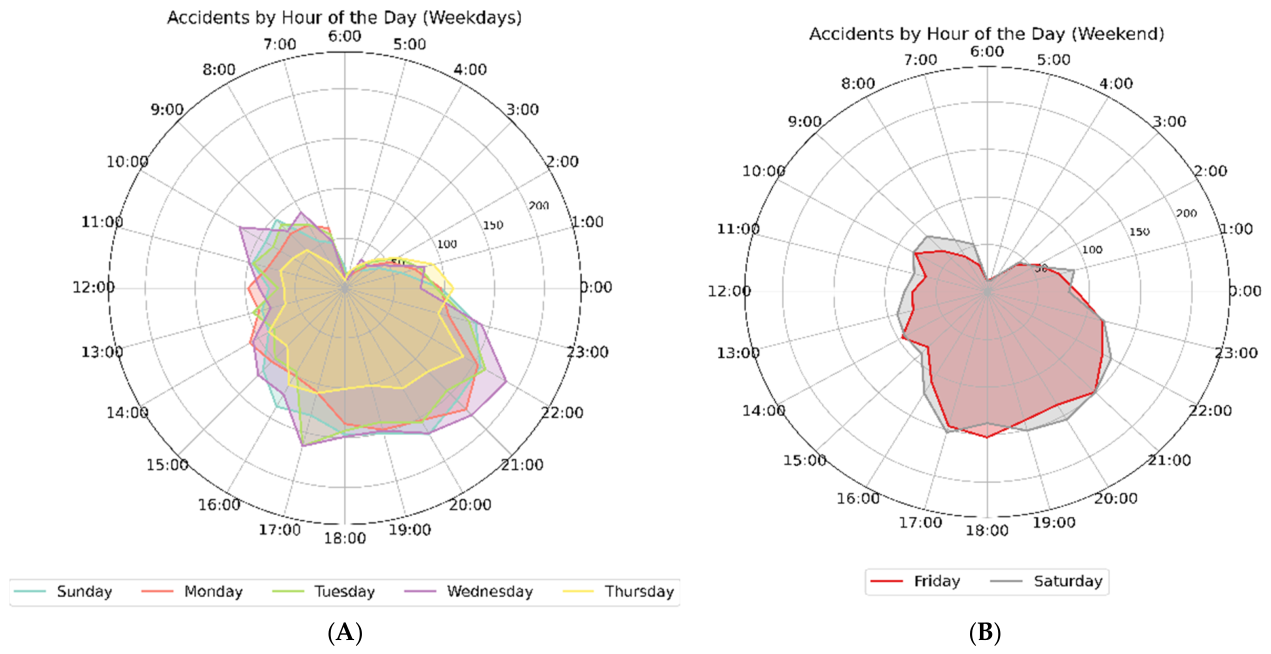
A detailed analysis of accident frequencies by hour across weekdays and weekends reveals critical insights for traffic safety, as illustrated in Figure 14. During weekdays, significant variations in accident counts are observed. Sundays, representing the start of the workweek, exhibit a peak from 18:00 to 21:00, with the highest frequency at 20:00 (169 accidents) and elevated counts at 18:00 (147 accidents) and 19:00 (151 accidents). Mondays and Tuesdays follow similar trends, with peaks at 21:00 on Monday (172 accidents) and 17:00 on Tuesday (164 accidents). Wednesdays demonstrate the highest peak frequencies of the weekday period, particularly between 21:00 and 22:00, with 180 and 187 accidents, respectively. Thursdays also maintain significant frequencies, peaking at 22:00 with 137 accidents. Weekend patterns differ substantially from the weekday profile. Friday’s accident frequency peaks in the late afternoon and evening, with the highest count recorded at 18:00 (153 accidents) and substantial frequencies at 17:00 (146 accidents) and 21:00 (149 accidents). Similarly, Saturdays show elevated accident frequencies from 17:00 to 21:00, with the maximum recorded at 20:00 (155 accidents).
Figure 14.
Pedestrian accidents by hour of the day during: (A) weekday, (B): weekends.
Comparative analysis identifies the evening window from 18:00 to 22:00 as particularly hazardous during weekdays, with Wednesday evening recording the maximum frequencies. This suggests a correlation with increased traffic during evening commutes and end-of-day activities. The significant evening counts on Sundays may be attributed to the transition into the workweek and return travel. Conversely, the high weekend frequencies observed on Fridays and Saturdays between 18:00 and 21:00 likely correlate with increased social gatherings and leisure-related mobility.
4.4. Spatial Analysis
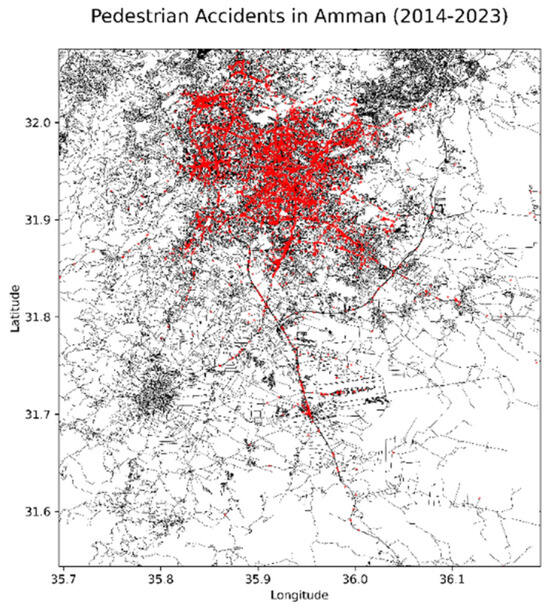
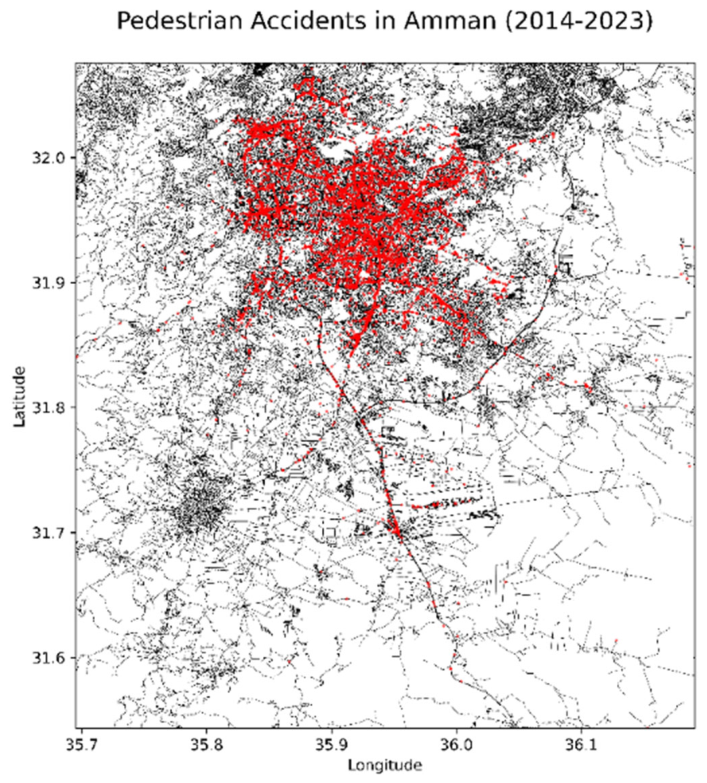
A comprehensive spatial analysis of pedestrian accidents in Amman (2014–2023) was performed using the DBSCAN (Density-Based Spatial Clustering of Applications with Noise) algorithm. This density-based clustering method was selected for its effectiveness in identifying spatial concentrations of varying shapes and sizes while distinguishing high-density clusters from low-density “noise” points. The objective was to delineate spatial hotspots to inform urban planning and safety interventions. The total spatial distribution of recorded accidents is mapped in Figure 15.
Figure 15.
Pedestrian accidents in Amman between 2014 and 2023.
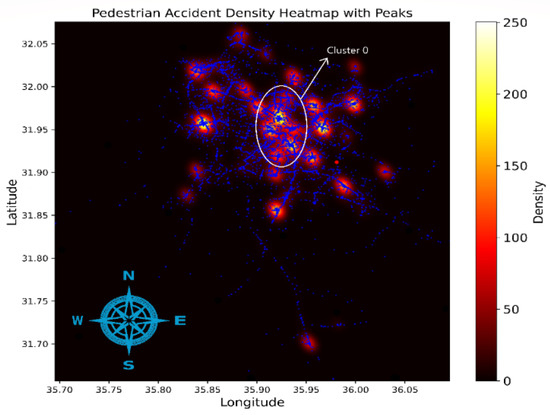
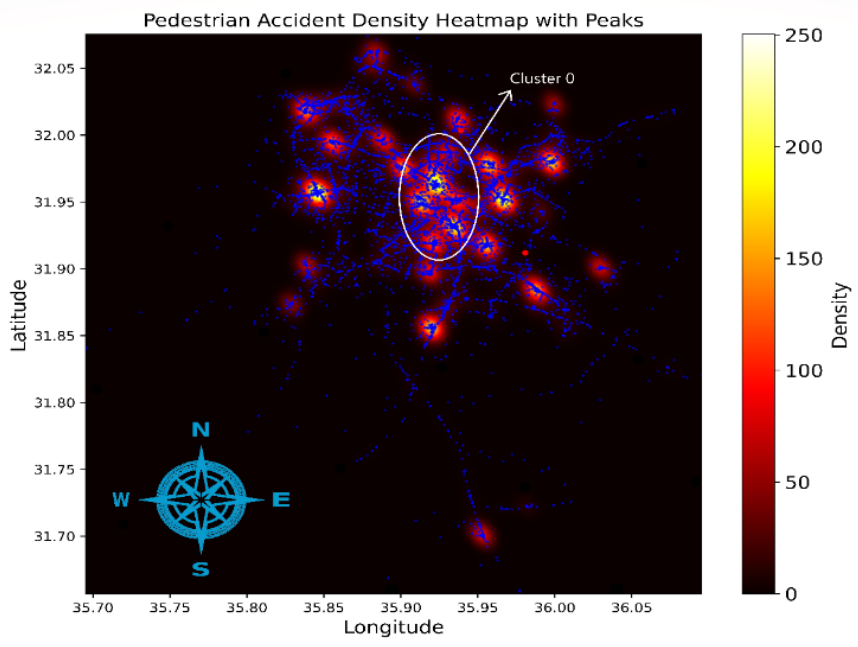
By integrating geographical coordinates from the decadal dataset, the clustering process identified five major high-density clusters located within the city’s main administrative regions, as illustrated in Figure 16. The municipal road network is displayed in blue, while the continuous red-to-yellow gradient shows the underlying accident density. This layout overlays the micro-scale DBSCAN results directly onto the continuous hot-spot background, with the most critical zone highlighted explicitly as Cluster 0. These clusters provide empirical insights into localized accident patterns:
Figure 16.
Pedestrian accidents heatmap and clusters between 2014 and 2023.
- Central Amman (Cluster 0): This region emerged as the primary critical area, exhibiting the highest concentration of accidents. Comprising the downtown region and its immediate surroundings, the high risk is attributed to dense commercial activities, heavy vehicular-pedestrian volumes, and inadequate infrastructure.
- Northern Amman (Cluster 1): A notable frequency of accidents was identified, linked to a combination of residential and commuter traffic. The risk is exacerbated by high-speed arterial roads and insufficient pedestrian signals for residents commuting toward the city center.
- Eastern Amman (Cluster 2): Encompassing industrial zones and residential neighborhoods, this cluster highlights hazardous interactions between heavy vehicles and pedestrians. The lack of designated pathways and insufficient crossings were identified as key contributing factors.
- Western Amman (Cluster 3): Characterized by affluent neighborhoods and commercial districts, this area formed a prominent cluster due to intensified pedestrian movement in busy retail zones. Enhanced enforcement and improved signage are required to mitigate risks in these districts.
- Southern Amman (Cluster 4): This cluster includes expanding residential and semi-urban areas. Accidents here are largely a product of rapid urbanization and mixed road conditions, requiring proactive infrastructure development.
The analysis also identified noise points, representing isolated incidents dispersed across various parts of the city. While non-clustered, these cases emphasize the necessity for continuous monitoring and localized safety measures alongside the primary cluster interventions.
4.5. Spatial–Temporal Analysis
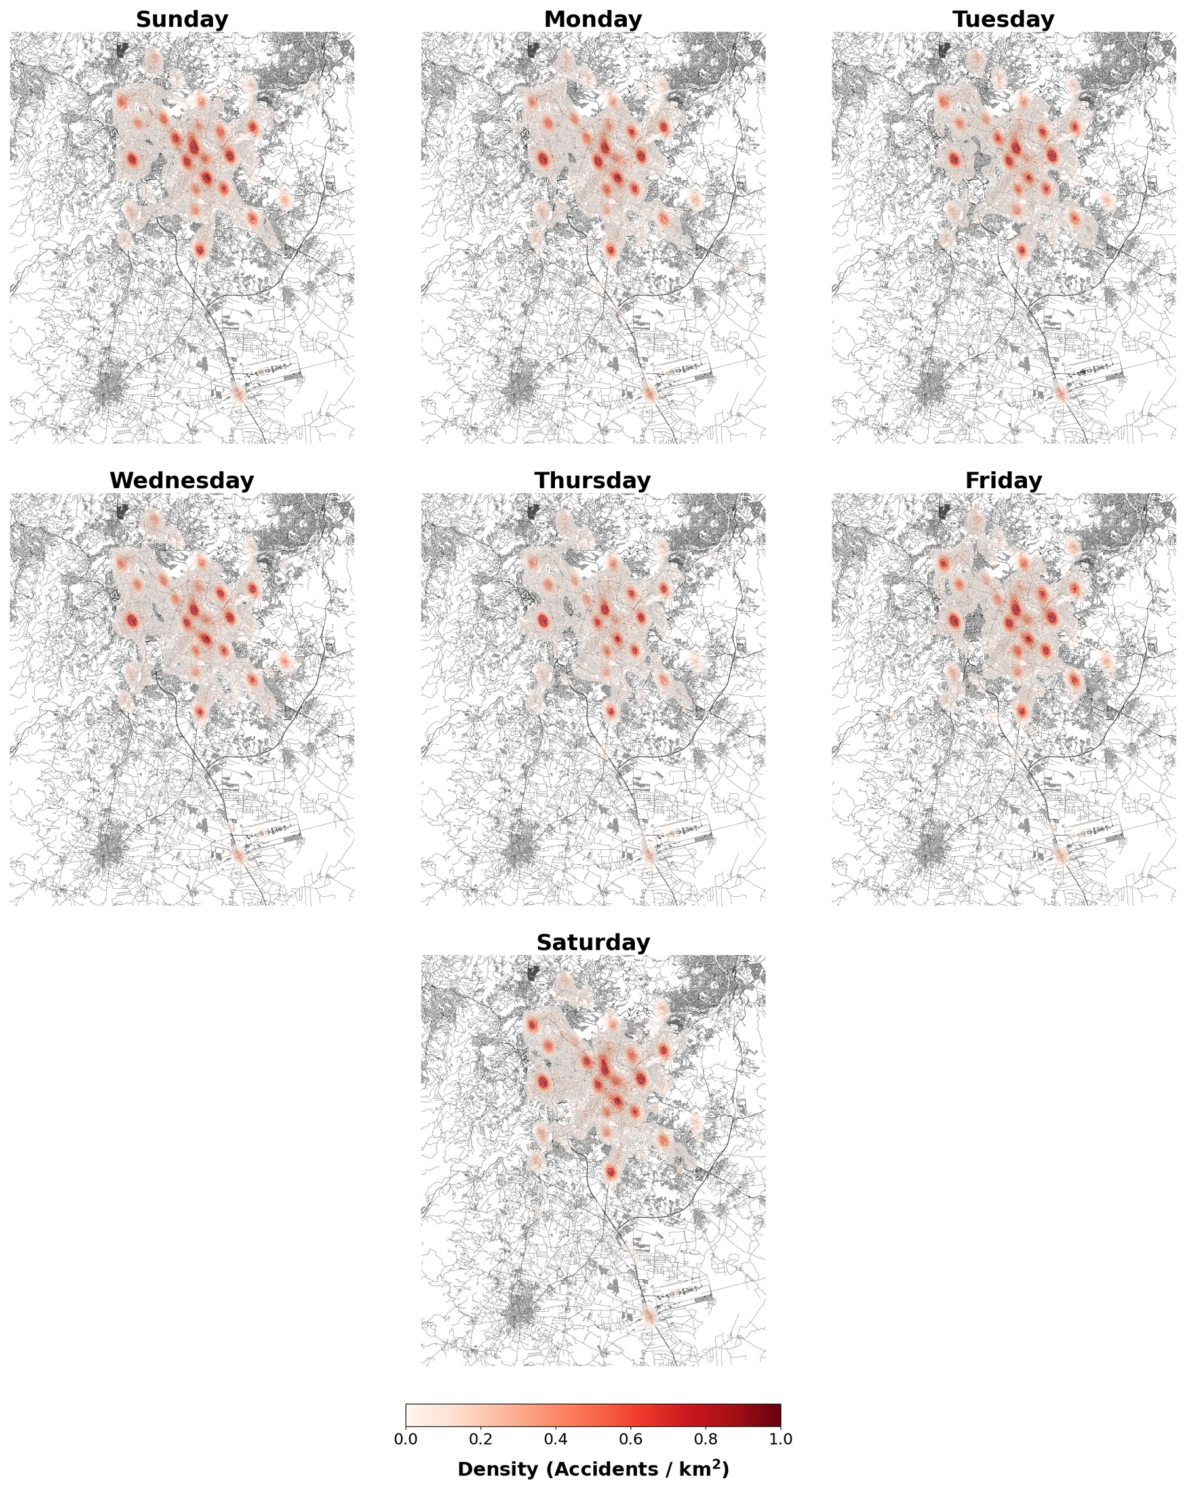
A comparative spatial–temporal analysis was performed by generating Kernel Density Estimation (KDE) heatmaps for each day of the week, presented in a two-by-four subplot grid in Figure 17. As previously detailed in the methodology (in Section 3.1), the KDE models were estimated using a fixed spatial smoothing bandwidth of 250 m, calculated via Silverman’s Rule of Thumb, to guarantee a standardized comparison scale across all temporal panels. Each subplot integrated the road network of Amman as a base layer, over which accident density was plotted to identify fluctuating levels of concentration.
Figure 17.
Kernel Density Estimation (KDE) heatmap displaying the distribution of pedestrian accidents across different days of the week.
The observations from the spatial–temporal analysis indicate the following:
- Sunday and Monday: These days exhibited lower densities of pedestrian accidents, characterized by fewer and less intense hotspots. This may indicate lower pedestrian activity or improved traffic conditions at the commencement of the workweek.
- Tuesday and Wednesday: A noticeable escalation in accident densities was observed, specifically in central and high-traffic sectors. These mid-week days showed more widespread hotspots, suggesting intensified pedestrian and vehicular interactions.
- Thursday: Accident density peaked on Thursday, featuring several prominent hotspots. This peak is likely associated with increased end-of-week traffic volumes and heightened pedestrian movement.
- Friday and Saturday: Weekend patterns revealed distinct spatial concentrations. Friday, a day of significant social activity, exhibited concentrated hotspots in leisure and commercial districts. Saturday’s pattern showed slightly more dispersed hotspots, reflecting varied pedestrian activities across the city.
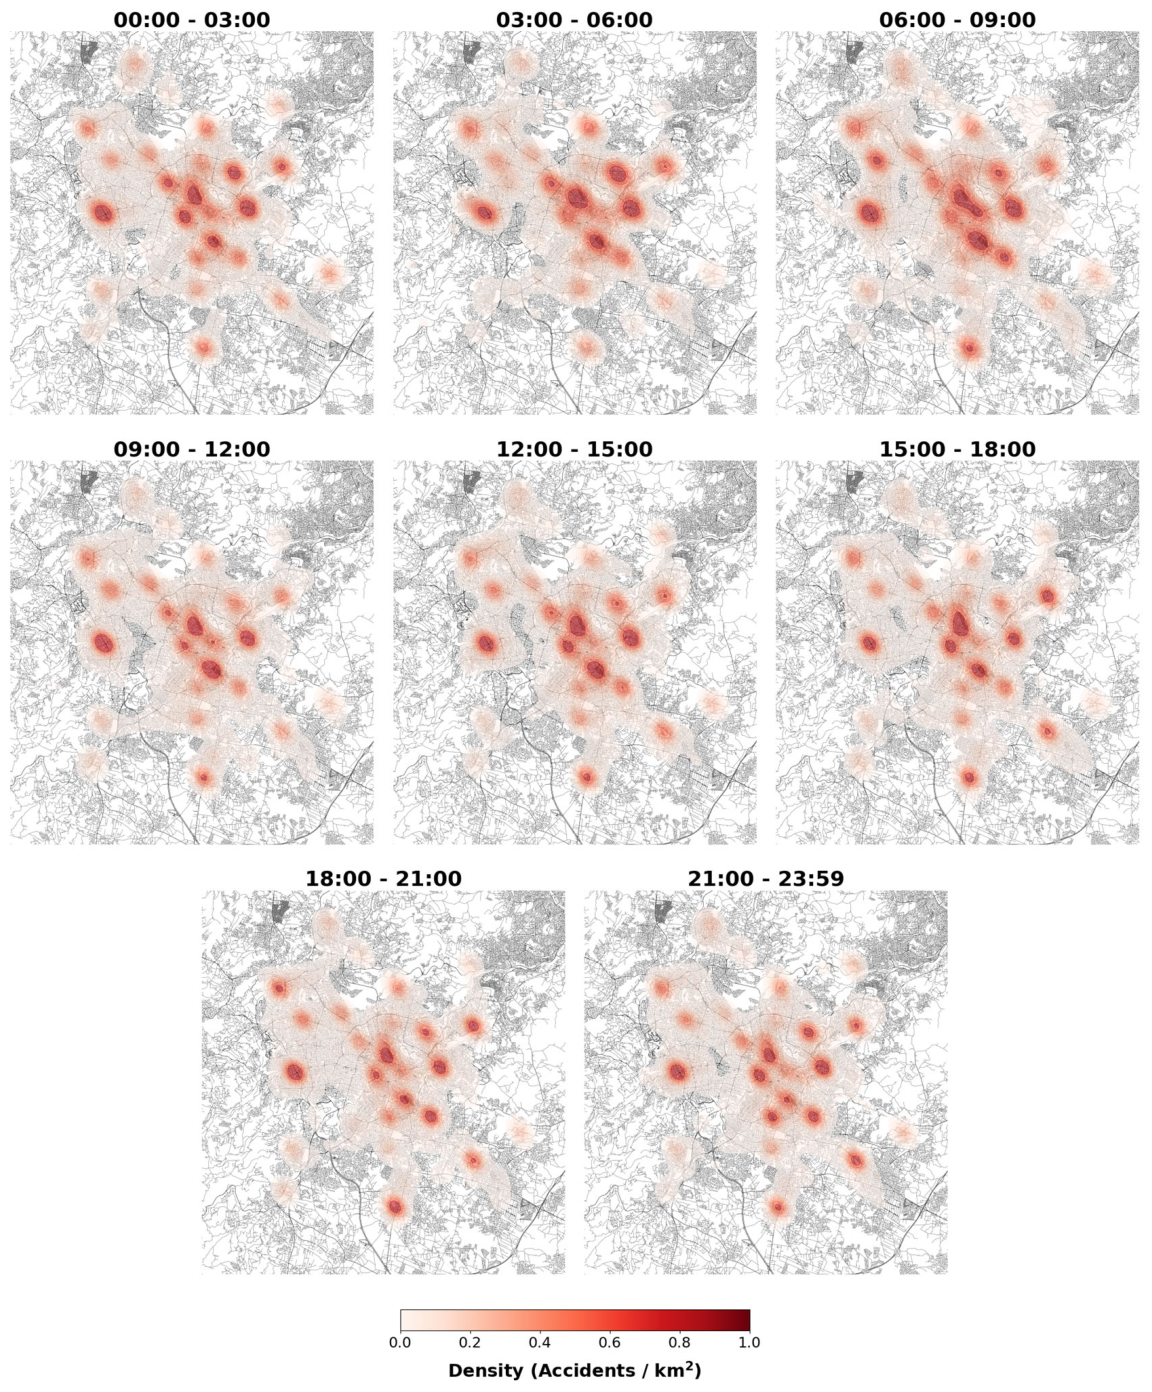
Moreover, the spatial–temporal distribution of pedestrian accidents in Amman (2014–2023) further reveals distinct patterns through Kernel Density Estimation (KDE) heatmaps segmented into eight-time intervals in Figure 18. Findings indicate significant variability in accident densities across different periods:
Figure 18.
Kernel Density Estimation (KDE) heatmap depicting the hourly distribution of pedestrian accidents.
- Early Morning (00:00–06:00): Accident densities were consistently low, reflecting minimal pedestrian and vehicular activity.
- Morning Rush Hour (06:00–09:00): A marked increase in density was observed, particularly in central and high-traffic areas, coinciding with peak commute times.
- Midday (09:00–15:00): Moderate to high densities persisted, suggesting sustained pedestrian activity throughout the morning and midday hours.
- Afternoon Rush Hour (15:00–18:00): Accident densities peaked during this interval; significant hotspots indicate high levels of pedestrian and vehicular interactions as commuters travel home from work or school.
- Evening (18:00–21:00): Densities remained moderately high, with hotspots shifting toward leisure and commercial districts, reflecting evening social and economic activities.
- Late Night (21:00–23:59): Accident densities decreased, though specific hotspots persisted, indicating ongoing but reduced activity.
These patterns identify critical periods where pedestrian safety measures could be intensified. The application of KDE heatmaps provides a clear visual representation of accident hotspots, aiding in the identification of temporal trends and facilitating targeted interventions to improve urban safety in Amman.
5. Implications
5.1. Integrating Spatial, Temporal, and Severity Evidence
This study establishes a coherent basis for interpreting pedestrian risk in Amman (2014–2023) as a function of geographic location, temporal windows, and specific infrastructure conditions. Spatial analysis demonstrates that crashes are concentrated within identifiable urban zones and corridors, while temporal data indicates a high concentration during the evening. The ordered logit model confirms that injury severity is systematically associated with traffic operating conditions, driver behavior, and infrastructure characteristics, rather than independent environmental factors like weather. Pedestrian risk must therefore be addressed through the interaction of spatial exposure, temporal concentration, and traffic dynamics.
5.2. Spatial Structure of Risk and Intervention Scales
The distribution of pedestrian crashes reveals localized clustering and diffuse corridor-based exposure. These patterns reflect different risk environments requiring calibrated intervention scales (Table 13).
Table 13.
Spatial Risk Structure and Corresponding Intervention Scale.
DBSCAN clustering identified five primary hotspots with distinct land-use traits:
- Central Amman (Cluster 0): The primary critical area with the highest concentration and volume, requiring nodal improvements like raised crossings and median refuges.
- Northern and Eastern Amman (Clusters 1 & 2): Commuting and industrial corridors where risk is distributed along road segments, necessitating continuous speed management and separated pedestrian pathways.
- Western Amman (Cluster 3): Commercial zones with intense peak-hour pedestrian volumes requiring improved signage and enforcement.
- Southern Amman (Cluster 4): Expanding residential zones where urbanization outpaces infrastructure.
5.3. Temporal Concentration and Time-Sensitive Management
Temporal and severity analyses identify two critical risk periods:
- Late-night/early-morning (00:00–03:00): Concentrated fatal injuries (which account for 5.02% of total incidents) occur despite lower absolute counts, likely due to reduced visibility and fatigued driving.
- Evening Peak (15:00–18:00 and 18:00–21:00): The ordered logit model indicates evening peak crashes have 29.2% higher odds of severe injury (). While 59.34% of total recorded incidents are minimal injuries, the evening convergence of high activity and reduced visibility necessitates time-sensitive enforcement and signal synchronization.
- This temporal concentration explains the prominent frequency spike observed on Thursdays (2382 incidents), matching the socio-economic trends identified by earlier research [32]. In Jordan, Thursday marks the last day of the working and academic week, triggering an exceptional convergence of inter-governorate commuter travel, central commercial surges, and weekend leisure mobility that drastically amplifies pedestrian exposure during the evening visibility transition.
- Morning Rush (06:00–09:00): Predominantly associated with major injuries but lacks a statistically significant independent effect on severity compared to the evening.
5.4. Traffic Operation and Behavioral Determinants
The severity model highlights traffic operation as a central determinant of injury outcomes. Speed is highly significant ; a 10-unit increase results in a 24% increase in the odds of higher severity . Multi-vehicle involvement further amplifies severity by 33.8% per additional vehicle. Speed-related driver error is the strongest behavioral predictor in the model , emphasizing that infrastructure improvements must be integrated with automated speed enforcement and targeted policing. These results suggest pedestrian safety is tied to dynamic traffic flow rather than static attributes alone.
5.5. Infrastructure Quality and Roadway Design
Roadway characteristics are critical structural determinants. Although 93.34% of accidents occurred on straight-level roads and 98.81% on asphalt, the model isolates specific high-risk configurations:
- Non-asphalt roads: Associated with more than twice the odds of higher severity ().
- Two-way roads: Increase the odds of more severe outcomes by 38.5% () due to conflict complexity.
- Straight geometry: Conversely reduces severity odds by 69.4% ().
Statistically significant dependence between vehicle category and road type () and lighting/road surface () supports context-specific redesigns, particularly for heavy and shared vehicles in industrial sectors.
5.6. Policy, Education, and Integrated Direction
A systemic regulatory response is required to address categorical risk factors. Gender-disaggregated findings—showing 79.96% of crashes involved male drivers and a significant relationship between gender and vehicle category ()—necessitate gender-sensitive education modules. Policy priorities include:
- Time-sensitive regulations: Restricting heavy vehicles in pedestrian corridors during evening peaks.
- Public Awareness: Evening-targeted campaigns and visibility aids (reflective clothing), utilizing AR/VR simulations for younger demographics.
- Systemic Approach: Deploying AI-enabled cameras for real-time monitoring and mandating ADAS technologies in shared and heavy vehicles.
Effective safety strategies must operate simultaneously across spatial, temporal, and mechanistic dimensions to achieve meaningful reductions in both crash occurrence and injury severity.
5.7. Strategic Synthesis for Policy Implementation
The combined evidence from spatial, temporal, and statistical analyses confirms that pedestrian injury severity is structured by the interaction of exposure, timing, and mechanism. Spatial clustering identifies where pedestrians are most exposed, temporal concentration identifies when that exposure is most critical, and the ordered logit model identifies the conditions under which that exposure leads to severe outcomes.
The findings therefore support a multi-layered approach to pedestrian safety, in which location-specific design improvements, time-sensitive traffic management, and mechanism-based interventions are implemented in a coordinated manner. The adoption of such an integrated framework is essential for achieving substantial reductions in both crash occurrence and injury severity.
6. Conclusions
This comprehensive, multidimensional analysis of pedestrian accidents in Amman (2014–2023) provides critical insights for enhancing urban safety through data-driven interventions in traffic management, spatial planning, and policy regulation. The temporal and spatial patterns identified emphasize the necessity for targeted, evidence-based strategies addressing specific urban vulnerabilities and behavioral dynamics.
Chronological evaluations establish clear temporal and spatial variations in Amman’s pedestrian safety landscape. The macro-scale dataset identifies late afternoon and evening hours—particularly on Thursdays—as peak operational high-risk windows, while late-night periods exhibit highly concentrated fatal severities despite lower absolute volume profiles. The integration of the Ordered Logit framework statistically validates these patterns, confirming that evening peak traffic dynamics substantially elevate individual injury severity outcomes. Geographically, density-based configurations isolate stable regional hotspots across commercial, commuting, and industrial zones, demonstrating that risk layout is fundamentally driven by localized urban configurations, rapid infrastructural expansion, and arterial corridors. These structural dependencies require target-specific design modifications rather than generalized global interventions.
Spatial analysis via DBSCAN identified five primary clusters, with Central Amman (Cluster 0) exhibiting the highest density of collisions. Clusters in Northern, Eastern, Western, and Southern Amman reflect risks driven by industrial commuting, commercial intensity, and rapid urban expansion. This research distinguishes between site-specific risk in localized clusters and segment-wide risk along road corridors, necessitating geographically adaptive interventions such as raised crossings, sidewalk continuity, and continuous segment-wide speed management.
The structural and operational determinants isolated by the econometric model highlight that pedestrian injury severity transitions are driven by core behavioral anomalies and infrastructure configurations rather than surface conditions. Speed-related driver errors and incremental velocity increases operate as the most critical behavioral acceleration factors for road trauma, while geometric road layouts, such as a lack of pavement boundaries and undivided two-way segments, significantly amplify risk. Furthermore, significant spatial–temporal dependencies running across vehicle classifications, lighting transitions, and road types prove that risk is fundamentally non-random. These cross-categorical interactions justify targeted, precision management strategies, including temporal vehicle-type segment restrictions, targeted pedestrian-centric geometric updates, and tech-driven visibility upgrades, shifting the policy focus from generalized regional measures to data-driven proactive designs.
While providing a statistically grounded evaluation, limitations exist regarding underreporting, the exclusion of certain dynamic behavioral variables (e.g., distraction, fatigue), and the lack of real-time traffic density normalization. Future research should integrate behavioral datasets, real-time environmental data, and longitudinal tracking of post-intervention outcomes. As Amman urbanizes, adopting this integrated framework—addressing where exposure occurs, when risk is critical, and the mechanisms of severity—is essential for reducing road trauma.
The integration of spatial, temporal, and severity modeling results demonstrates that pedestrian injury risk in Amman is not solely a function of crash frequency but is fundamentally shaped by the interaction between exposure patterns, time-dependent conditions, and traffic dynamics. This underscores the need for coordinated, evidence-based interventions that address not only where and when crashes occur, but also the mechanisms that determine their severity.
Author Contributions
Conceptualization, Haitham A. Al Hasanat, Rana Al-Matarneh and Omar Alharasees; methodology, Haitham A. Al Hasanat and Omar Alharasees; software, Haitham A. Al Hasanat and Omar Alharasees; validation, Haitham A. Al Hasanat, Rana Al-Matarneh, Lafee Alshamaileh and Omar Alharasees; formal analysis, Haitham A. Al Hasanat and Omar Alharasees; investigation, Haitham A. Al Hasanat and Omar Alharasees; resources, Haitham A. Al Hasanat, Rana Al-Matarneh and Omar Alharasees; data curation, Haitham A. Al Hasanat, Rana Al-Matarneh and Omar Alharasees; writing—original draft preparation, Haitham A. Al Hasanat, Rana Al-Matarneh and Omar Alharasees; writing—review and editing, Haitham A. Al Hasanat, Rana Al-Matarneh, Lafee Alshamaileh and Omar Alharasees; visualization, Haitham A. Al Hasanat and Omar Alharasees; supervision, Haitham A. Al Hasanat, Rana Al-Matarneh and Omar Alharasees; project administration, Haitham A. Al Hasanat and Omar Alharasees; funding acquisition, Haitham A. Al Hasanat and Omar Alharasees. All authors have read and agreed to the published version of the manuscript.
Funding
This research received no external funding.
Institutional Review Board Statement
Not applicable.
Informed Consent Statement
Not applicable.
Data Availability Statement
The original contributions presented in this study are included in the article. Further inquiries can be directed to the corresponding author.
Acknowledgments
The authors would like to thank Fuad Al Maiatah from the Public Security Directorate, Traffic Department, for his assistance in providing the necessary data for this research.
Conflicts of Interest
The authors declare no conflicts of interest.
Appendix A
Table A1.
Percentage Distribution of Key Categorical Variables in Pedestrian Accidents in Amman (2014–2023).
References
- World Health Organization. Global Status Report on Road Safety 2022 Summary; World Health Organization: Geneva, Switzerland, 2022; p. 20. Available online: http://apps.who.int/bookorders (accessed on 5 June 2024).
- WHO EMRO. More Than a Third of All Road Traffic Fatalities in Jordan Are Pedestrians|Jordan-News|Jordan. Available online: https://www.emro.who.int/jor/jordan-news/33-traffic-fatalities-pedestrians.html (accessed on 26 October 2024).
- GBD 2019 Diseases and Injuries Collaborators. Global burden of 369 diseases and injuries in 204 countries and territories, 1990–2019: A systematic analysis for the Global Burden of Disease Study 2019. Lancet 2020, 396, 1204–1222. [Google Scholar] [CrossRef] [PubMed]
- WHO. Road Safety-Road Traffic Injuries; World Health Organization: Geneva, Switzerland, 2025; Available online: https://www.who.int/health-topics/road-safety#tab=tab_1 (accessed on 17 November 2025).
- Alharasees, O.; Kale, U. Transport Operators Total Load Comparison by Analytical Hierarchy Process (AHP). In Emerging Trends in Electric Aviation; Springer: Cham, Switzerland, 2023; pp. 47–56. [Google Scholar] [CrossRef] [Scilit]
- Alharasees, O.; Kale, U. Comparative analysis of drivers’ vital parameters across varied driving scenarios and experience levels: A pilot study. J. Transp. Health 2025, 44, 102088. [Google Scholar] [CrossRef] [Scilit]
- Morency, P.; Gauvin, L.; Plante, C.; Fournier, M.; Morency, C. Neighborhood social inequalities in road traffic injuries: The influence of traffic volume and road design. Am. J. Public Health 2012, 102, 1112–1119. [Google Scholar] [CrossRef] [Scilit] [PubMed]
- Ghaffar, A.; Hyder, A.A.; Masud, T.I. The burden of road traffic injuries in developing countries: The 1st national injury survey of Pakistan. Public Health 2004, 118, 211–217. [Google Scholar] [CrossRef] [Scilit] [PubMed]
- Department of Statistics. Estimated Population of 2023 and Some of Selected Data. Amman, January 2023. Available online: https://dosweb.dos.gov.jo/population/population-2/ (accessed on 5 June 2024).
- Cavoli, C. Past, Present and Future Mobility Challenges and Opportunities in Amman. London, 2017. Available online: https://create-mobility.eu/PUBLICATIONS/REPORTS/CITY_REPORT_Amman_21_12_2017.pdf (accessed on 12 August 2024).
- Jordan Number of Registered Vehicles | Economic Indicators | CEIC. Economic Indicators. Available online: https://www.ceicdata.com/en/indicator/jordan/number-of-registered-vehicles (accessed on 17 November 2025).
- Alharasees, O. Evaluating Public Transport Development Projects by Multi-Criteria Methods. In Solutions for Maintenance Repair and Overhaul; Springer: Cham, Switzerland, 2023; pp. 83–94. [Google Scholar] [CrossRef] [Scilit] [PubMed]
- Public Security Directorate. Annual Report of Traffic Accidents in Jordan for the Year 2023. Amman, 2023. Available online: https://www.psd.gov.jo/ar-jo/%D8%A7%D9%84%D8%A5%D8%AF%D8%A7%D8%B1%D8%A7%D8%AA-%D9%88%D8%A7%D9%84%D9%88%D8%AD%D8%AF%D8%A7%D8%AA/%D8%A5%D8%AF%D8%A7%D8%B1%D8%A9-%D8%A7%D9%84%D8%B3%D9%8A%D8%B1/%D8%A5%D8%B5%D8%AF%D8%A7%D8%B1%D8%A7%D8%AA/ (accessed on 5 June 2024).
- Al Hasanat, H.A.; Hassanat, A.B.; Alharasees, O.; Tarawneh, A.S.; Altarawneh, G.A.; Alhasanat, L.A.; Begović, M. Interpretable machine learning for imbalanced pedestrian injury severity prediction in urban Jordan. J. King Saud Univ. Eng. Sci. 2025, 37, 39. [Google Scholar] [CrossRef] [Scilit]
- Anderson, T.K. Review of Current Practices in Recording Road Traffic Incident Data: With Specific Reference to Spatial Analysis and Road Policing Policy. London, 2003. Available online: https://discovery.ucl.ac.uk/id/eprint/228/ (accessed on 5 June 2024).
- Obaidat, M.T.; Ramadan, T.M. Traffic Accidents at Hazardous Locations of Urban Roads. Jordan J. Civ. Eng. 2012, 6, 2012–2436. Available online: https://jjce.just.edu.jo/Home/Abstract.aspx?data=P8HLzwdi80FAQQM3fdo6%2fXADEKLRYGDQZycDWVRoKKs%3d (accessed on 17 November 2025).
- Al-Masaeid, H.R. Traffic Accidents in Jordan. Jordan J. Civ. Eng. 2009, 3, 331. [Google Scholar]
- Al-Rousan, T.M.; Umar, A.A.; Al-Omari, A.A.; Goniewicz, K.; Czerski, R.; Kustra, M. Characteristics of Crashes Caused by Distracted Driving on Rural and Suburban Roadways in Jordan. Infrastructures 2021, 6, 107. [Google Scholar] [CrossRef] [Scilit]
- Al Hasanat, H.; Janos, J. Development of roundabouts empirical capacity model—Case study of Hungary. Zesz. Naukowe. Transp. Politech. Śląska 2023, 120, 5–17. [Google Scholar] [CrossRef] [Scilit]
- Al Hasanat, H.; Juhasz, J. The Influence of Circulating and Entering Flows on Critical Gaps Value in Roundabouts. Int. J. Traffic Transp. Eng. 2022, 12, 322–339. [Google Scholar] [CrossRef] [Scilit] [PubMed]
- Al Hasanat, H.A.; Juhász, J. Development of Empirical Models to Predict Gap Acceptance Parameter Based on the Geometrical and Operational Parameters of Different Roundabouts. Period. Polytech. Civ. Eng. 2023, 67, 349–356. [Google Scholar] [CrossRef] [Scilit]
- Al Haitham, H.; Schuchmann, G. Relationship between Critical Gap and Certain Geometrical Parameters in Roundabouts. Period. Polytech. Civ. Eng. 2022, 66, 922–929. [Google Scholar] [CrossRef] [Scilit]
- Al Haitham, H.; Schuchmann, G. Critical gap in roundabouts—A short comparison of estimation methods. Period. Polytech. Transp. Eng. 2022, 50, 273–278. [Google Scholar] [CrossRef] [Scilit]
- Al Hasanat, H.A.; Alharasees, O.; Alothman, D. Connected Automated Vehicles Entry Capacity on Roundabouts- Case Study Hungary. In 2024 2nd International Conference on Technology Innovation and Its Applications (ICTIIA); IEEE: New York, NY, USA, 2024; pp. 1–6. [Google Scholar] [CrossRef] [Scilit]
- Al Hasanat, H.A.; Alothman, D.; AlHarasees, O. Capacity of Single-lane Roundabouts in Hungary. Period. Polytech. Transp. Eng. 2025, 53, 124–134. [Google Scholar] [CrossRef] [Scilit]
- Alharasees, O.; Al Hasanat, H.A.; Al-Matarneh, R. A Comprehensive Human Factors Approach to Pedestrian Accidents Analysis in Urban Environments. In 2025 2nd International Conference on Advanced Innovations in Smart Cities, ICAISC 2025; IEEE: New York, NY, USA, 2025. [Google Scholar] [CrossRef] [Scilit]
- Jabar, H.Y.; Mamoun Suleiman, A. Neural Technique for Predicting Traffic Accidents in Jordan. J. Am. Sci. 2013, 9, 347–358. [Google Scholar] [CrossRef]
- AL Rahamneh, A.A.; Alzubeidi, M.A.K.; Arabyat, Y.A.; Al-Hawary, S.I.S. Forecasting the Number of Traffic Accidents in Jordan using the Poisson Regression Model. Inf. Sci. Lett. 2023, 12, 1775–1780. [Google Scholar] [CrossRef] [Scilit]
- Al-Majali, S.R.; Imam, R.M. Analysis of Pedestrian Accidents in Amman. Int. J. Civ. Eng. Technol. 2019, 10, 240–251. Available online: https://iaeme.com/Home/article_id/IJCIET_10_12_024 (accessed on 1 June 2024).
- Tala, H.; Rana, I. Development of Crash Prediction Models for Roadway Segments in Jordan. In The Second Balq’a International Engineering Conference (BIEC 2019); Al-Ahliyya Amman University: Dead Sea, Jordan, 2019. [Google Scholar]
- Khasawneh, M.A.; Al-Omari, A.A.; Ganam, B. Forecasting Traffic Accidents in Jordan Using Regression Techniques. Jordan J. Civ. Eng. 2018, 12, 2018–2570. Available online: https://jjce.just.edu.jo/Home/ShowPaper.aspx?data=Dklygrjm7NOmI4XIYaU2DFonhelXqCIHuC8q%2FeKQJuQ%3D (accessed on 17 November 2025).
- Edries, B.; Alomari, A.H. Forecasting the Fatality Rate of Traffic Accidents in Jordan: Applications of Time-Series, Curve Estimation, and Multiple Linear Regression Models. J. Eng. Sci. Technol. Rev. 2022, 15, 70–77. [Google Scholar] [CrossRef] [Scilit]
- Al-Omari, B.H.; Obaidat, E.S. Analysis of pedestrian accidents in Irbid City, Jordan. Open Transplant. J. 2013, 7, 1–6. [Google Scholar] [CrossRef] [Scilit]
- Shbeeb, L. Clustering and pedestrian crashes prediction modelling: Amman case. Int. J. Inj. Control Saf. Promot. 2023, 30, 501–529. [Google Scholar] [CrossRef] [Scilit] [PubMed]
- Shehadeh, E.A.; Al-Bayatti, A.H.; Bingöl, M.A. Effect of roadway environment characteristics on pedestrian safety at signalised intersections in Amman. Urban Plan. Transp. Res. 2024, 12, 2317766. [Google Scholar] [CrossRef] [Scilit]
- Al-Tammemi, A.B.; Altarawneh, S.A.; Abu Ghazaleh, L.Z.; Jaradat, T.M.; Abujudeh, R.; Almbaidin, M.; Hasan, H. Navigating Road Traffic Accidents in Jordan: A Retrospective Exploration of the Health and Economic Impacts. Cureus 2024, 16, e60497. [Google Scholar] [CrossRef] [Scilit] [PubMed]
- Alrahamneh, A.A.; AlBtoush, R.M. Estimating the Optimal Model for Traffic Accidents in Jordan for the Period of (1995–2010). Int. J. Bus. Manag. 2014, 9, 122. [Google Scholar] [CrossRef] [Scilit]
- Ghadi, M.; Török, Á.; Tánczos, K. Study of the economic cost of road accidents in Jordan. Period. Polytech. Transp. Eng. 2018, 46, 129–134. [Google Scholar] [CrossRef] [Scilit]
- Abuaddous, M.; Al-Hares, A.; Albtoush, A.M.F.; Al-Btoosh, J.A.A. Identification and Ranking of Accident Black Spots in Jordan. Civ. Eng. Archit. 2022, 10, 1661–1674. [Google Scholar] [CrossRef] [Scilit]
- Al-Khateeb, G.G. Analysis of Accident Data and Evaluation of Leading Causes for Traffic Accidents in Jordan. Jordan J. Civil. Eng. 2010, 4, 76–94. Available online: https://www.iiste.org/Journals/index.php/JJCE/article/view/17905 (accessed on 1 June 2024).
- Department of Statistics. Jordan Statistical Yearbook 2025. Amman, January 2025. Available online: https://dosweb.dos.gov.jo/product/jordan-statistical-yearbook-2025/ (accessed on 6 July 2026).

Disclaimer/Publisher’s Note: The statements, opinions and data contained in all publications are solely those of the individual author(s) and contributor(s) and not of MDPI and/or the editor(s). MDPI and/or the editor(s) disclaim responsibility for any injury to people or property resulting from any ideas, methods, instructions or products referred to in the content. |
© 2026 by the authors. Published by MDPI on behalf of the International Society for Photogrammetry and Remote Sensing. Licensee MDPI, Basel, Switzerland. This article is an open access article distributed under the terms and conditions of the Creative Commons Attribution (CC BY) license.