Article

User Experience-Based Evaluation of Tactile Map Production Methods for Wayfinding Among People with Visual Impairments

by
Ayça Eraslan
1,*,
Ahmet Özgür Doğru
2 and
Nesibe Necla Uluğtekin
2
1
Faculty of Applied Informatics, Department of Geographical Information Technologies, Istanbul Technical University, 34469 Istanbul, Turkey
2
Faculty of Civil Engineering, Department of Geomatics, Istanbul Technical University, 34469 Istanbul, Turkey
*
Author to whom correspondence should be addressed.
ISPRS Int. J. Geo-Inf. 2026, 15(7), 326; https://doi.org/10.3390/ijgi15070326
Submission received: 27 March 2026 / Revised: 6 July 2026 / Accepted: 10 July 2026 / Published: 16 July 2026

Abstract

Tactile maps play a critical role in supporting spatial learning and independent mobility for people with visual impairments, particularly in complex environments such as university campuses. This study evaluates the effects of two tactile map production methods, 3D printing and heat-sensitive embossed paper, through a user-centered mixed-methods experimental design. The research was conducted on the North Campus of Boğaziçi University and involved 15 university students with visual impairments. The experimental process consisted of two stages: (1) controlled tactile map perception and evaluation, and (2) real-world wayfinding and on-site navigation experience. Quantitative data were collected through structured questionnaires and analyzed using descriptive statistics, while qualitative data were obtained through observations, open-ended feedback, and thematic analysis. The findings suggest that tactile map production methods may influence tactile perception, mental map formation, and user confidence. Participants generally reported that 3D-printed maps provided clearer tactile spatial organization and supported mental mapping in complex environments, whereas embossed paper maps offered advantages in portability and rapid accessibility.

1. Introduction

Navigating complex environments such as university campuses, transportation hubs, and dense urban areas remains a major challenge for people with visual impairments [1]. Achieving safe and independent mobility in these environments depends not only on physical accessibility, but also on access to spatial information that can be effectively perceived, interpreted, and remembered without relying on visual input [2].
When tactile maps are overly detailed or when tactile symbols, textures, and spatial elements are not sufficiently distinguishable from one another, they can become confusing and may even hinder navigation rather than support it [3]. Previous research has shown that tactile map design strongly influences spatial cognition for users with visual impairments; however, the experiential consequences of different production methods remain underexplored.

Aim and Contributions of the Study

This study aims to examine how different tactile map production methods may shape user experience, spatial cognition, and wayfinding confidence among people with visual impairments. To achieve this objective, the study employed a user-centred mixed-methods research design that integrated quantitative and qualitative data collection and analysis. Quantitative data were obtained through structured questionnaires administered after tactile map exploration and wayfinding tasks, while qualitative data were collected through participant observations and open-ended feedback.
The research specifically focuses on two widely accessible yet structurally different production techniques: 3D-printed tactile maps and heat-sensitive embossed paper maps. These two methods were selected because they represent contrasting approaches in tactile cartography in terms of tactile depth, production flexibility, portability, cost, and material interaction. While 3D printing enables volumetric representation and stronger tactile differentiation, which may support spatial understanding in complex environments, embossed paper maps provide advantages in rapid production, accessibility, and ease of transport. By comparing these two production methods within a real campus wayfinding context, the study adopts a user-centered mixed-methods experimental design to explore how material and production characteristics are associated with tactile perception, mental map formation, and navigation experience.
This study demonstrates that tactile map production methods influence not only tactile perception but also the wayfinding process itself. By empirically comparing 3D-printed and embossed paper tactile maps in a real campus setting, it shows how production choices affect mental map formation, navigation confidence, and independent mobility. The study moves beyond purely technical comparisons by adopting a process-oriented and user-centered evaluation approach. By providing empirical evidence from the context of Türkiye, it contributes design-relevant insights to the development of accessibility-oriented cartography and tactile map design.

2. Literature Review

2.1. Tactile Maps and Spatial Cognition

Tactile maps are widely recognized as effective tools for supporting spatial cognition and independent mobility among individuals with visual impairments. When tactile maps lack clear differentiation or contain excessive detail, they may hinder spatial cognition rather than support navigation [4]. For people who cannot rely fully on visual input, tactile maps provide structured spatial representations that facilitate the development of cognitive maps and spatial understanding [5]. Foundational studies in tactile graphics and tactile perception similarly emphasize that successful tactile communication depends on perceptual clarity, symbol hierarchy, and the cognitive interpretation of tactile information rather than on physical representation alone [6]. These perspectives reinforce the idea that tactile map usability emerges through the interaction between tactile design, perceptual processing, and user experience.
Tactile maps are essential tools that support spatial cognition and independent mobility among individuals with visual impairments by enabling them to construct mental representations of their surrounding environment. Unlike visual maps, tactile maps are perceived sequentially through touch, requiring users to actively explore spatial elements such as lines, textures, and relief structures. This sequential perception increases cognitive load and necessitates simplified and well-generalized map designs to ensure effective interpretation [7].
Zacharogiorga and Sourdi [8] demonstrated that 3D thematic tactile maps can facilitate spatial understanding, improve tactile interaction, and support cognitive engagement during map exploration processes. Their findings suggest that volumetric differentiation and tactile depth contribute positively to users’ ability to interpret spatial relationships and mentally organize environmental information. This perspective reinforces the idea that tactile maps should not be considered merely as physical accessibility tools, but also as cognitive instruments that actively support the formation of mental maps and spatial learning among students with visual impairments.
Unlike visual maps, tactile maps are perceived sequentially through touch [2]. Sighted users can perceive a map holistically at a glance, whereas tactile map users must explore the surface fragment and integrate information mentally [9]. Foundational research in tactile perception and tactile graphics emphasizes that excessive tactile complexity, poorly differentiated symbols, and overcrowded layouts may negatively affect perceptual discrimination and cognitive processing during tactile exploration [9].
Research in spatial cognition also highlights the importance of information hierarchy in tactile maps. Clear differentiation between primary spatial elements such as paths, buildings, landmarks, and circulation networks supports users’ ability to construct coherent mental maps and identify navigational priorities [10]. This principle is also strongly emphasized in traditional cartography, where visual hierarchy, symbol differentiation, and generalization are considered essential for improving map readability and supporting efficient spatial interpretation [11]. In tactile cartography, hierarchical organization becomes even more critical because spatial information is explored sequentially through touch rather than perceived simultaneously at a glance. When tactile maps fail to effectively convey hierarchical structure, users may struggle to interpret spatial relationships, leading to confusion, increased cognitive load, and reduced navigation confidence.
Another key factor influencing tactile spatial cognition is prior experience. Users with greater familiarity with tactile maps or stronger spatial learning strategies tend to extract information more efficiently and develop more robust mental representations [12]. Conversely, individuals with limited exposure to tactile maps may require additional time, guidance, or training to fully benefit from tactile spatial information [13].
A limited number of studies conducted specifically on university campuses reveal that tactile maps are a critical preparatory tool, especially for students with visual impairments starting on campus. Aydın and Kara [14], in their study conducted on a state university campus, stated that tactile maps are effective for understanding building relationships and main pedestrian axes, but the fact that the maps are not portable limits their continuity of use. Participants stated that they primarily used maps for mental preparation before going to campus.
Another noteworthy point in the Turkish literature is the lack of support for the use of tactile maps through a systematic educational process. Yıldız and Arslan [15] revealed that a large proportion of individuals with visual impairments are introduced to tactile maps at the primary school level, but this skill is not developed in later years. The study noted that participants had difficulty interpreting concepts such as scale, direction, and legend, and suggested integrating tactile map literacy into educational programmes. This situation demonstrates that tactile maps should be considered not only as physical products but also as tools whose effectiveness increases through learning and experience.
Studies conducted in Turkiye reveal challenges related to Braille labelling, symbol standardization, tactile distinguishability, and limited user-centered evaluation in tactile map design. Similar issues have also been reported internationally, suggesting that many of the challenges associated with tactile cartography are not context-specific but globally shared. For example, research conducted in Europe and North America similarly emphasizes that tactile maps are often designed according to technical or institutional standards rather than through direct user participation, which may reduce usability and increase cognitive difficulty during navigation [3]. Likewise, Zacharogiorga-Sourdi et al. [8] reported that students with visual impairments in Greece experienced difficulties related to tactile readability, spatial interpretation, and symbol differentiation, particularly when tactile hierarchy and relief variation were insufficient. These international findings align with observations from Türkiye and suggest that the effectiveness of tactile maps depends not only on accessibility provision itself, but also on how spatial information is cognitively perceived and experientially interpreted by users across different environmental and cultural contexts.

2.2. Cartographic Design and Tactile Map Production Methods

From a cartographic perspective, tactile map effectiveness is closely linked to design decisions such as scale, generalization, symbolization, and production method [16]. 3D printing allows for volumetric representation, height variation, and big tactile difference, which support spatial differentiation and mental map formation in complex environments [17]. In contrast, embossed paper maps offer advantages in terms of rapid production, low cost, and portability, but their limited tactile depth can reduce the perceptibility of spatial structure [18]. Zacharogiorga-Sourdi et al. [8] emphasized that 3D tactile maps provide stronger tactile differentiation and enhanced user interaction compared to more conventional tactile representations, particularly in educational and thematic mapping contexts. Their research demonstrated that tactile depth, relief variation, and spatial hierarchy improve users’ ability to distinguish map elements and comprehend complex spatial structures. Existing studies primarily compare these methods based on technical feasibility or material characteristics, while their experiential and cognitive implications remain underexplored. This indicates that the discussion around tactile map production has largely remained technology-driven rather than user-driven. However, from a user perspective, the value of a production method lies not only in what it can technically represent, but in how effectively it supports perception, understanding, and navigation in practice. Therefore, evaluating these methods through real user experiences is essential to reveal their true impact on spatial cognition and wayfinding performance.
Various tactile map production techniques have been developed to support spatial accessibility for people with visual impairments, including embossed paper printing, thermoforming, swell paper, laser engraving, CNC milling, and 3D printing. These methods differ considerably in terms of tactile depth, material flexibility, production cost, portability, and the level of spatial detail they can represent. Among these techniques, relatively few allow substantial freedom in height differentiation and volumetric representation, both of which are important for improving tactile distinguishability and spatial legibility during map exploration. In this context, 3D printing has gained increasing attention in tactile cartography because it enables layered relief structures, customizable tactile hierarchies, and stronger spatial differentiation compared to many conventional production methods. These characteristics may support clearer tactile perception and more effective mental map formation, particularly in complex spatial environments [17].

2.3. User-Centered and Process-Oriented Wayfinding

Recent approaches in cartography and spatial cognition argue that tactile maps should not be evaluated solely as static representations but as components of a broader wayfinding process. Wayfinding involves stages such as pre-navigation learning, environmental interaction, and adaptation through experience [19]. Within this framework, tactile maps function as cognitive support tools that assist users in preparing for navigation, reducing uncertainty, and increasing confidence before and during movement. User-centered studies further demonstrate that tactile map usability varies depending on individual experience, map literacy, and contextual needs [3]. From this perspective, tactile maps can be understood not as passive representations, but as active elements within an evolving learning and navigation process. Their effectiveness is therefore shaped not only by design features but also by how users engage with them over time, build familiarity, and adapt them to their own strategies.
Participatory design extends this perspective by actively engaging users with visual impairments as co-creators throughout multiple stages of map development [20]. Studies employing participatory methods such as iterative prototyping, workshops, and user testing show that direct feedback from users helps identify design flaws that may not be apparent through expert evaluation alone [21].
For example, users frequently report difficulties related to symbol ambiguity, overcrowded layouts, insufficient differentiation between tactile elements, and confusing legends that designers may initially overlook. Incorporating such feedback early in the design process can significantly reduce cognitive load and improve spatial comprehension and navigation efficiency. In tactile cartography, participatory and user-centered design approaches are therefore increasingly recognized as essential components of effective map development. Previous studies have demonstrated that involving students with visual impairments directly in prototype evaluation, iterative refinement, and usability testing improves tactile map legibility, contextual interpretation, and overall accessibility [16]. These studies further emphasize that tactile maps should not be designed solely according to technical cartographic assumptions, but through continuous interaction with end users whose perceptual experiences and navigation practices provide critical insight into tactile usability.
User-centered studies also highlight the importance of learning and familiarity in the use of tactile maps. Tactile maps are not always immediately intuitive, particularly for users with limited prior exposure. Training and guided exploration can substantially improve users’ ability to extract spatial information and form reliable mental maps [14]. From this perspective, tactile maps function not merely as representational tools but as learning instruments whose effectiveness develops over time.
Recent cartographic research has increasingly emphasized the importance of user experience, interaction, and usability within map design processes. In particular, the work of Robert Roth highlights that maps should not be evaluated solely according to technical accuracy or visual representation, but also according to how users cognitively interact with spatial information and how effectively maps support decision-making, orientation, and navigation processes [22]. From this perspective, cartographic usability involves experiential dimensions such as learnability, interpretability, efficiency, and user confidence. These approaches are particularly relevant for tactile cartography, where spatial information is explored sequentially through touch and where user interaction strongly shapes cognitive mapping and wayfinding performance. Incorporating user experience perspectives into tactile map evaluation, therefore, supports a more inclusive and process-oriented understanding of cartographic design.

2.4. From Static Artifacts to Process-Oriented Wayfinding Tools

For a long time, tactile maps have been considered static objects that present spatial information in a fixed form, independent of the user. In this approach, the function of the map was limited to providing a planimetric representation of the environment; how the map is learned, remembered, and translated into actual wayfinding behaviour was often seen as a secondary issue. However, the current literature on wayfinding and spatial cognition reveals that navigation is not a one-time act of acquiring information, but a process that develops over time [19].
The process-oriented navigation approach considers wayfinding as a whole, encompassing stages such as pre-navigation, interaction with the environment, learning, making mistakes, and adaptation. According to this perspective, tactile maps are not merely tools “used on the road”; they are cognitive support tools that help users mentally construct the space beforehand, visualize possible routes, and cope with uncertainty [23]. For individuals with visual impairments in particular, this pre-navigation process is one of the fundamental components of independent movement.
Practice-based studies conducted in Türkiye demonstrate that tactile maps, when combined with structured map-reading training and user feedback mechanisms, significantly contribute to mental map formation and independent mobility among individuals with visual impairments, particularly in complex environments such as university campuses [24]. Findings support the process-oriented approach adopted in the present study, which evaluates tactile maps not only as static artifacts but as experiential tools embedded within learning and wayfinding practices [9]. Taken together, these findings suggest that the effectiveness of tactile maps emerges through use, experience, and learning rather than from design alone. In real-life contexts, users do not simply “read” maps; they gradually build familiarity, test strategies, and adapt their understanding over time.

2.5. Research Gap and Positioning of the Present Study

Although the literature clearly highlights the role of tactile maps in supporting spatial cognition and mobility, it often approaches the topic in a fragmented manner by separating design, production methods, and user experience. Many studies focus primarily on technical aspects such as material properties or production efficiency, while giving limited attention to how these features are actually perceived and interpreted by users in real navigation contexts. This creates a gap between technological capability and practical usability, suggesting that current research does not fully capture the experiential dimension of tactile map use.
Furthermore, tactile maps are frequently treated as static artifacts rather than as dynamic tools embedded within an ongoing wayfinding process. While user-centered approaches are acknowledged, they are often not deeply integrated into the design and evaluation stages, leaving important factors such as cognitive load, learning, and adaptation underexplored. In this respect, there is a need for a more holistic and process-oriented perspective that connects production methods with user experience and spatial cognition. The present study responds to this need by examining tactile maps as experiential tools shaped by real-world interaction and navigation practices. However, three key gaps remain:
  • Limited empirical evidence on how tactile map production methods shape user perception and experience.
  • Insufficient integration of production technologies into user-centered and participatory design discussions.
  • A lack of process-oriented evaluations linking tactile map use to mental map formation and independent mobility in real environments.

3. Materials and Methods

3.1. Research Design

The research design of this study is structured as a user-centered, mixed-methods experimental framework aimed at examining how different tactile map production methods influence spatial perception, mental map formation, and wayfinding confidence among users with visual impairments. Conducted within the real spatial context of Boğaziçi University North Campus, the study employed a two-stage experimental design. In the first task, participants with visual impairments evaluated two tactile map types in terms of orientation, campus comprehension, and overall legibility before selecting the map they considered most suitable for navigation. In the second task, participants used their preferred map to complete wayfinding and field-based navigation tasks involving a designated target location. This stage also included three survey questions examining participants’ navigation experiences in Table S1. Participants who were proficient in Braille and had prior experience using tactile maps successfully reached the target location on their first attempt, whereas those without previous map-reading experience required multiple trials to complete the navigation task. Quantitative data were collected through structured questionnaires and analyzed descriptively, while qualitative data were obtained through field observations and open-ended participant feedback, enabling a comprehensive interpretation of user performance, navigation experience, and perceptions of independent mobility.

3.2. Study Area

In this study, the Boğaziçi University North Campus was selected as the study area to examine the effects of tactile map production methods on user experience within a real-world navigation environment frequently encountered by individuals with visual impairments in educational and public institutional settings. University campuses represent complex semi-public environments that require regular orientation and mobility skills due to their combination of interconnected pedestrian pathways, building entrances, open gathering areas, stair systems, and circulation networks. Such environments are commonly navigated by students with visual impairments, staff members, and visitors in daily life, particularly within higher education contexts where independent mobility is essential for academic and social participation. The selected campus, therefore, provided a suitable and realistic spatial setting for evaluating tactile map usability, spatial cognition, and wayfinding experiences under conditions that reflect everyday navigation challenges rather than artificially simplified laboratory environments.

3.3. Cartographic Design and Layout Process of Tactile Maps

In this study, tactile maps were produced to meet the spatial orientation needs of individuals with visual impairments, using both three-dimensional 3D-printing technology and heat-sensitive embossed paper methods. The tactile maps cover a specific area of Boğaziçi University’s North Campus.
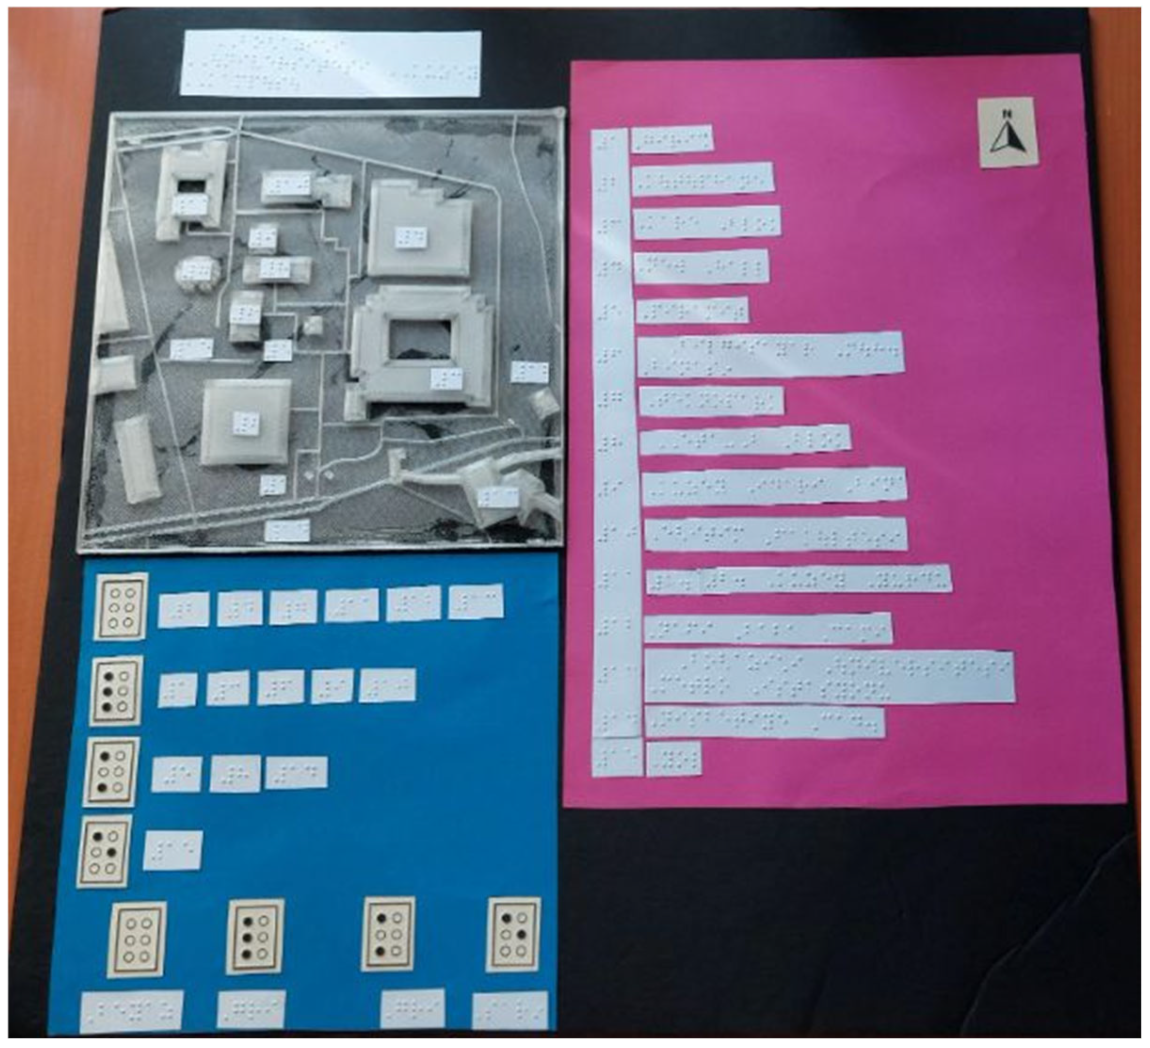
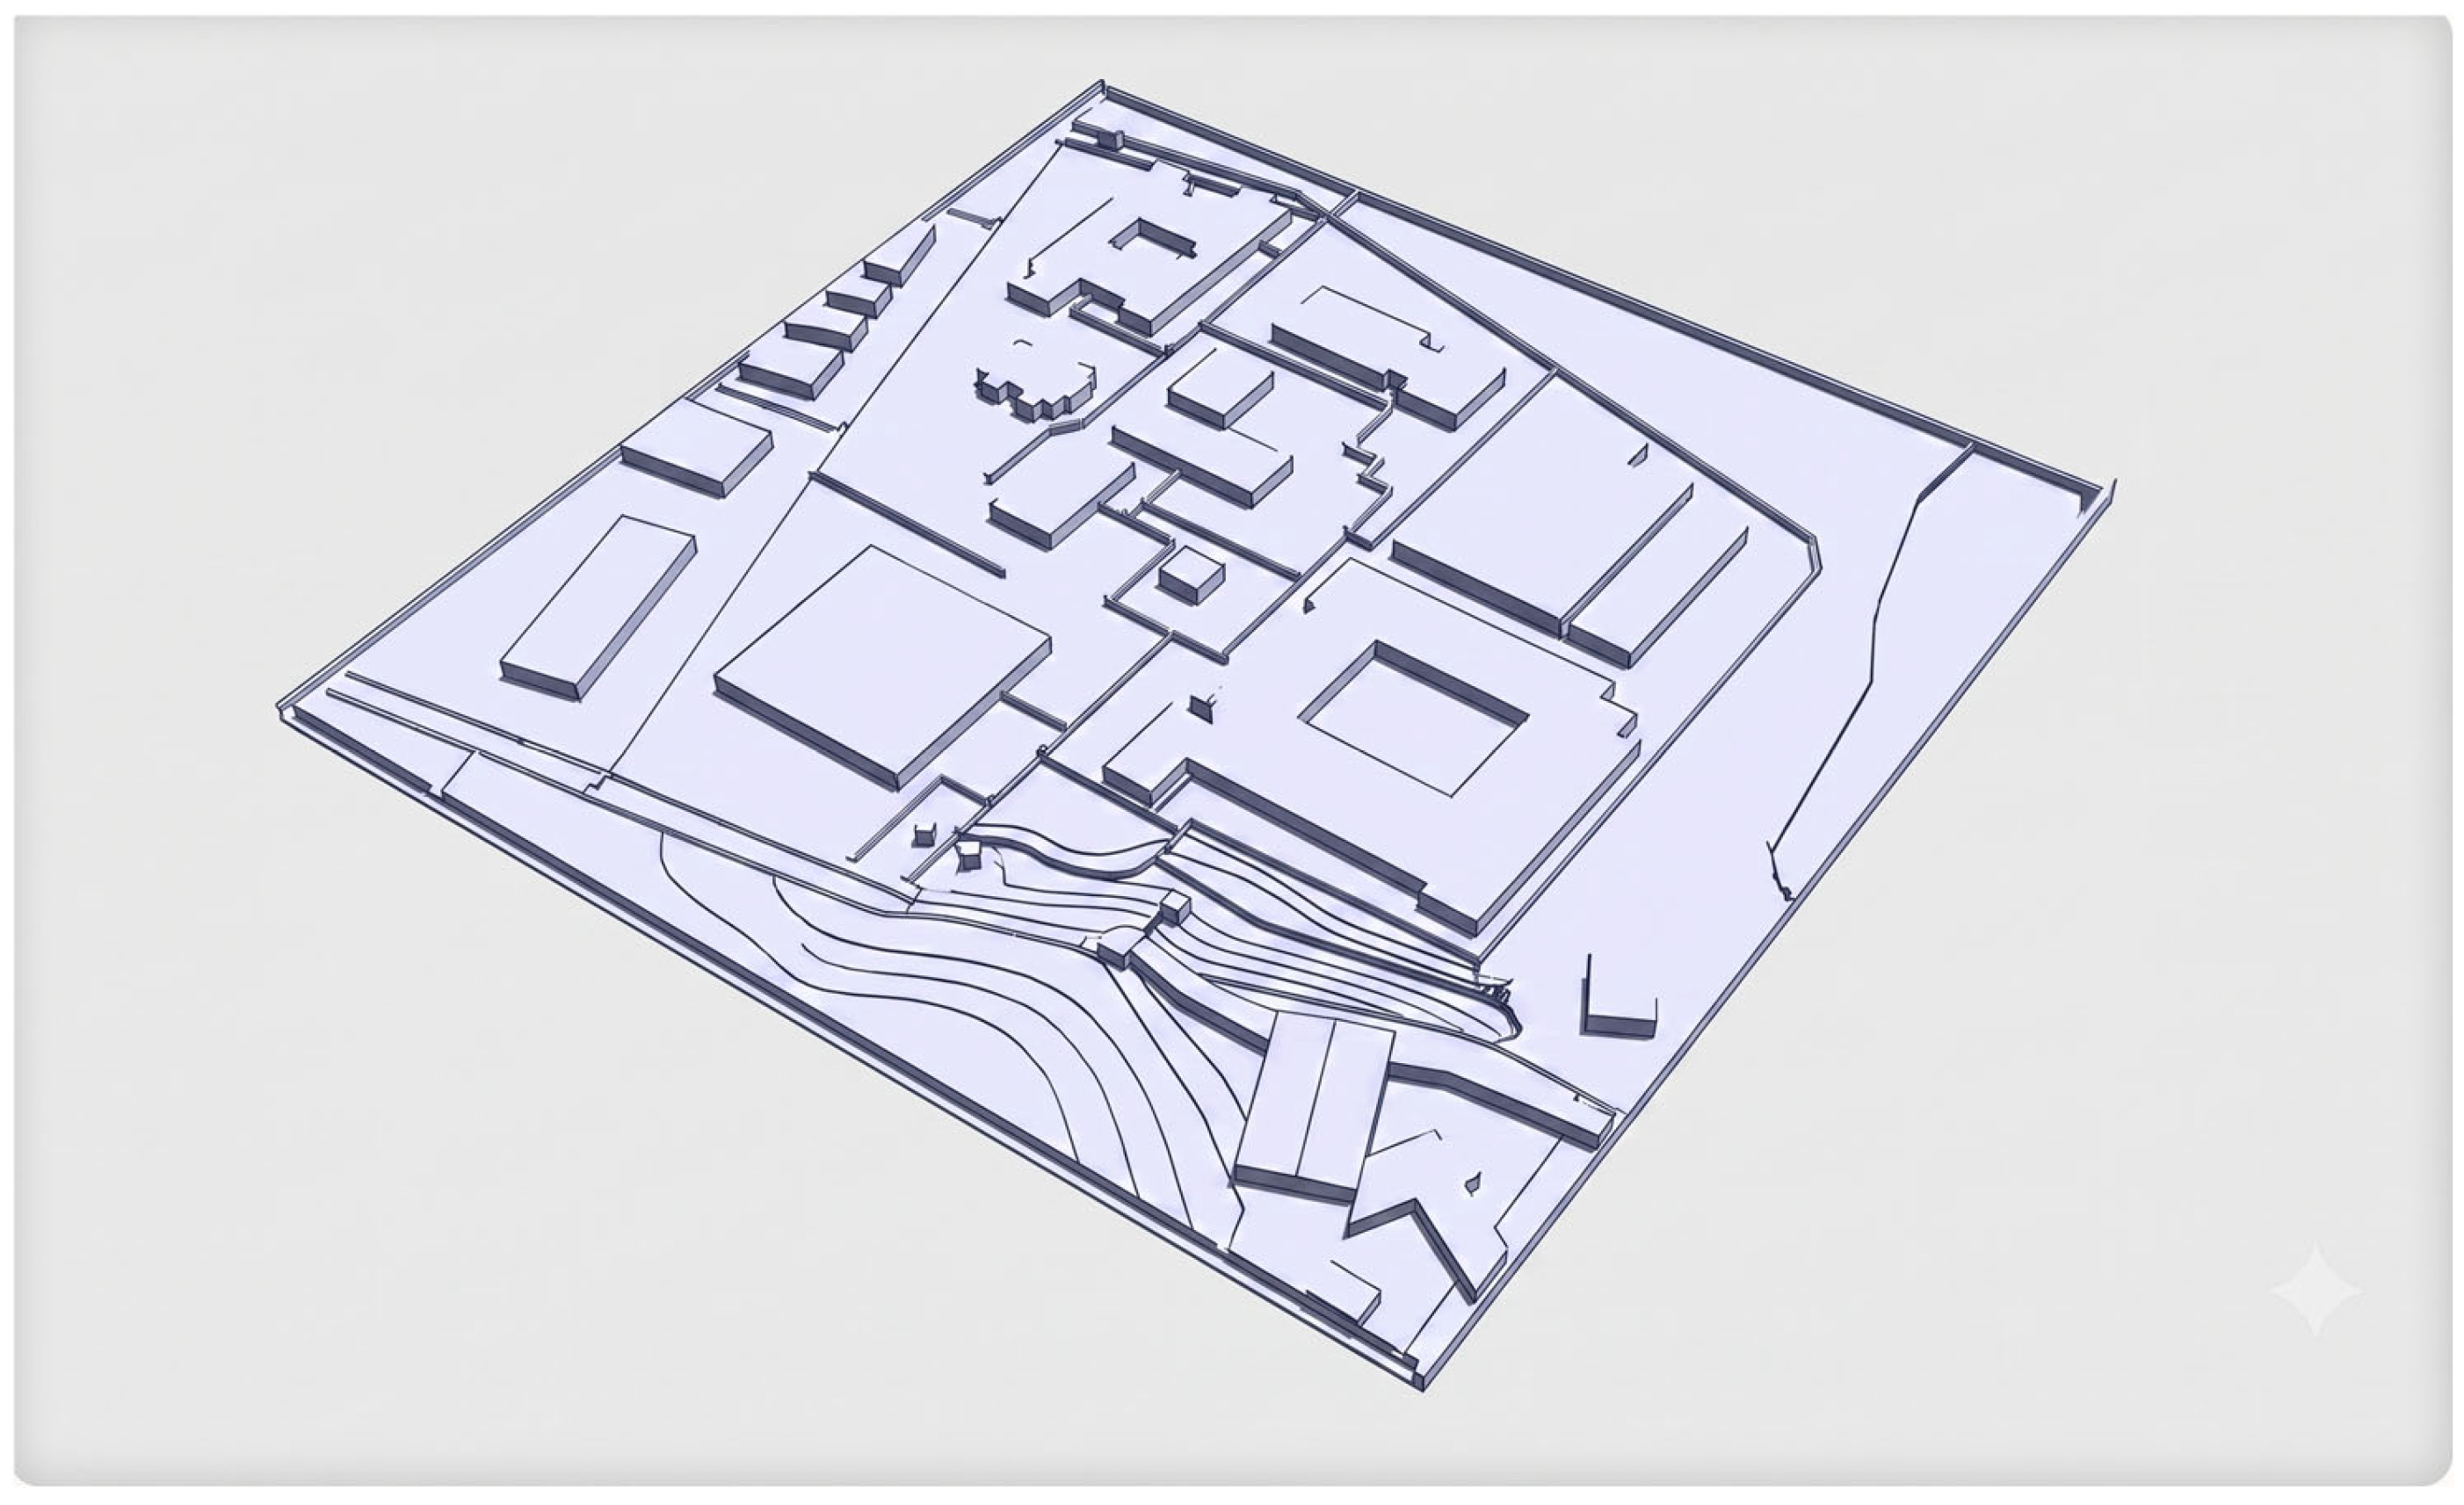
As seen in Figure 1, during the map layout phase, cartographic generalization, scaling, and tagging processes were systematically applied to enhance tactile perception. The cartographic generalization process applied in this study was not arbitrary but was guided by established principles from both traditional and tactile cartography, as well as practical considerations related to tactile perception and map readability. The primary objective of the generalization process was to reduce excessive spatial complexity while preserving the most cognitively and navigationally relevant environmental features for tactile interpretation. In this context, the design process followed principles of selection, simplification, symbol hierarchy, exaggeration, and spatial displacement commonly used in cartographic generalization [11], while also considering tactile-specific perceptual limitations described in the tactile cartography literature [6].
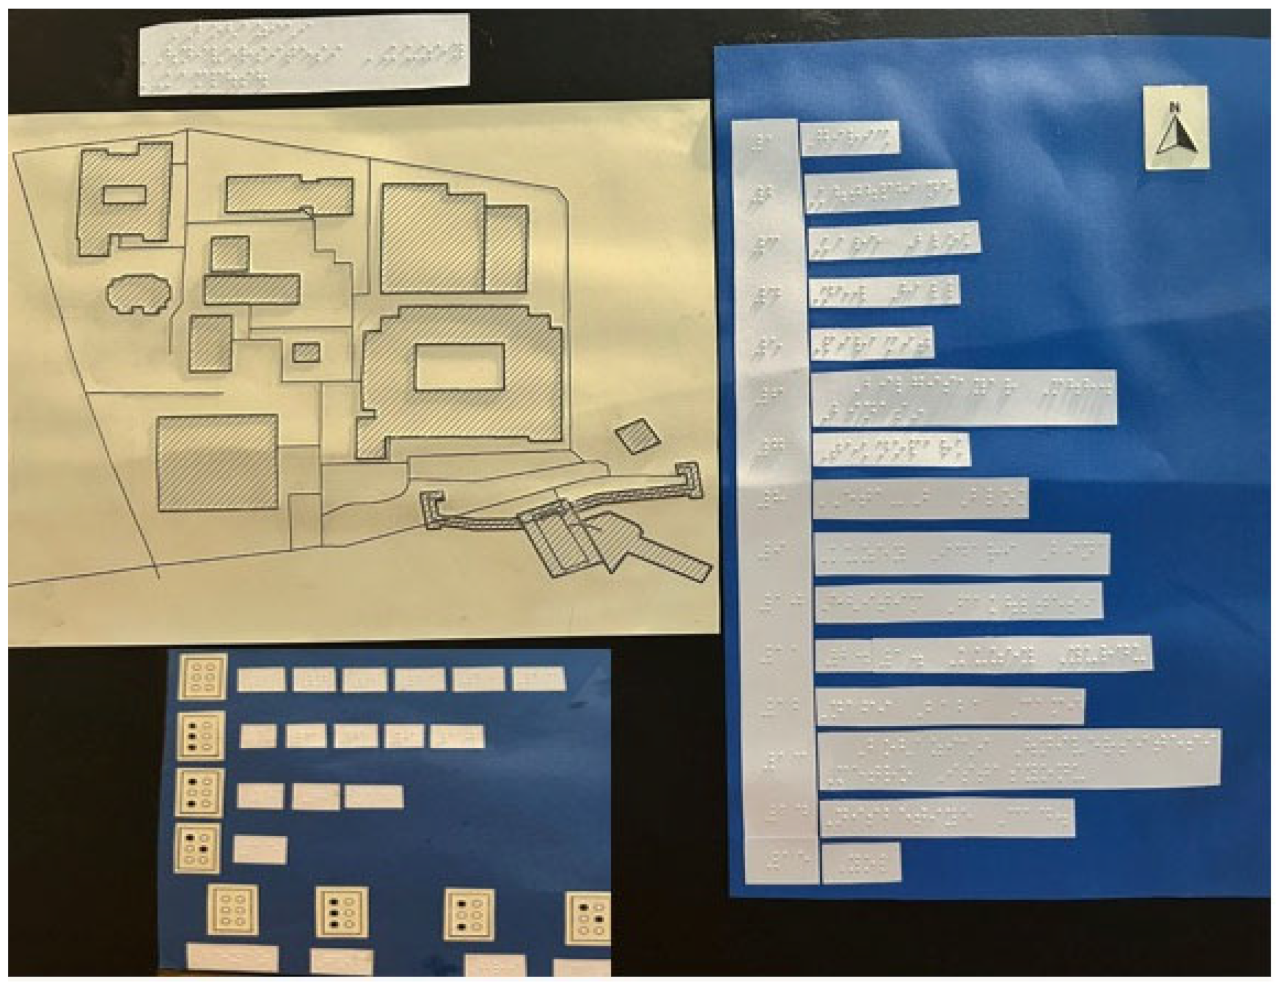
As seen in Figure 2, scale selection was determined to ensure sufficient spacing between tactile elements, preventing tactile interference during exploration. The tactile map employs a Braille-based coding system in which each building and major spatial feature is assigned a unique numeric identifier corresponding to entries in the accompanying Braille legend. The coloured background panels were used solely for visual organization during prototype preparation and do not convey any navigational information. Braille labels and legend entries were produced as embossed tactile inscriptions and integrated into the map layout. Although a north arrow was included for reference, tactile orientation relies primarily on the fixed arrangement of map elements, and future designs may benefit from the incorporation of dedicated tactile orientation markers to facilitate more intuitive map alignment.
The Embossed Paper Tactile Map was created using swell paper, whereby a 2D printed graphic undergoes thermal expansion to form a 3D tactile relief. As the resulting elevation height is relatively low compared to other embossing methods, the map’s information density was kept minimal on purpose to ensure that the tactile features remain distinct and readable (Figure 3).
Throughout the layout process, the technical constraints of the two production methods, 3D printing and heat-sensitive embossed paper, were explicitly considered. Design adjustments, including line thickness, relief height, and texture differentiation, were adapted to the material capabilities of each method to maximize legibility and comprehensibility. This layout phase was therefore a critical step directly influencing the usability, functionality, and overall user experience of the tactile map.

3.4. Participants

The sample size for this study (n = 15) was determined based on the exploratory and user-centered nature of the research, as well as practical considerations related to accessibility, participant availability, and ethical constraints. Rather than aiming for statistical generalization, the study prioritizes an in-depth understanding of user experience, perception, and wayfinding behaviour among individuals with visual impairments. In qualitative and mixed-methods research, smaller, purposefully selected samples are widely accepted as appropriate when the objective is to capture rich, contextual insights and experiential patterns.
The use of a two-stage experimental design, in which the same participants engage in both experimental stages, enhances the internal consistency of the findings by allowing direct comparison across conditions. The approach reduces inter-participant variability and strengthens the interpretability of observed differences between tactile map production methods. Therefore, the selected sample size is considered sufficient to reveal meaningful experiential trends, while acknowledging that the findings are not intended to be statistically generalizable but analytically transferable to similar contexts.
Participants consisted of 15 university students with visual impairments, including both legally blind and low-vision individuals. Purposeful sampling was employed to ensure that participants had regular interaction with the campus environment and potential need for wayfinding support.
Participant diversity in terms of Braille literacy, prior tactile map experience, and navigation strategies was considered an asset rather than a limitation, reflecting real-world user heterogeneity Table 1. All participants voluntarily consented to participate in the study prior to data collection, and ethical considerations regarding participant safety, accessibility, confidentiality, and informed participation were strictly observed throughout the research process. The study procedures were conducted in accordance with internationally recognized ethical principles for human-subject research, including the World Medical Association’s Declaration of Helsinki [26]. Particular attention was given to ensuring accessible communication, voluntary participation, the right to withdraw from the study at any stage, and the provision of a safe and supportive experimental environment for people with visual impairments during both tactile map evaluation and campus navigation activities.

3.5. Data Collection Process

In the data collection process, user experience was examined in depth using multiple data sources that are explained as follows:
Surveys: Structured surveys were administered to participants before and after the tactile map experience. The surveys aimed to measure quantitative trends with closed-ended questions while revealing participants’ subjective experiences with open-ended questions.
Observations: Observation notes were taken while participants moved along the designated routes using tactile maps; difficulties, pauses, and strategies encountered during map use were recorded.
Open-Ended Feedback: Participants’ perceptions, preferences, and suggestions for improvement regarding tactile maps were collected through open-ended feedback after the experience. This multi-data collection approach ensured that quantitative findings were supported by qualitative data and that user experience was interpreted contextually.

3.6. Data Analysis

Quantitative data were analyzed using SPSS 2022 software and evaluated through frequency and percentage distributions. Qualitative data were analyzed using thematic analysis; participant statements were coded and classified under common themes. Quantitative and qualitative findings were interpreted together, and the effects of tactile map production methods on user experience were addressed within a holistic framework. Given the exploratory nature of the study and the limited sample size, inferential statistical testing was not prioritized. Instead, the analysis focused on descriptive trends and experiential patterns.

3.7. Aim of the Method

The following insights were derived from a user-centered and experience-based perspective, underpinned by this methodological framework:
  • The study examined how tactile maps produced through different production techniques influenced users’ tactile interpretation, spatial understanding, and navigation experiences during map use;
  • The intelligibility of tactile features refers to the degree to which tactile textures, relief heights, and material contrasts can be clearly perceived, distinguished, and meaningfully interpreted by users during tactile exploration;
  • The impact of mental mapping on user experience design.
As summarized in Table 2, the evaluation criteria were assessed through a combination of structured questionnaires, direct observations, time measurements, and participant feedback. Perceptual indicators such as map clarity, tactile distinguishability, symbol readability, mental map perception, user satisfaction, confidence, anxiety, and perceived independent mobility were primarily evaluated through participant self-reports and post-task assessments. Performance-related indicators, including navigation success, route completion time, hesitation points, navigation errors, and assistance requests, were documented through systematic observation during the experimental process.
To improve the clarity of the methodology, the research design can be more explicitly presented as a two-stage experimental structure consisting of Stage 1 (Perception and Evaluation) and Stage 2 (Wayfinding and Use Experience). Although these stages are conceptually connected, each focuses on a different dimension of tactile map use. The first experiment examines how users perceive and interpret tactile information in a controlled environment, while the second experiment evaluates how this information is applied in real-world navigation.
In the first stage, participants were asked to explore two different types of tactile maps (3D-printed and heat-sensitive embossed paper maps) in a controlled setting. They examined the maps freely, identified spatial elements such as buildings and pathways, and interpreted tactile features including textures and Braille labels. This stage focused on users’ initial perception and cognitive processing of the maps. Following the exploration, participants completed structured questionnaires and provided open-ended feedback. These procedures aimed to capture both measurable trends and subjective experiences related to map readability, tactile differentiation, and initial mental map formation.
In the second stage, the same participants engaged in real-world wayfinding tasks within the campus environment. They were required to navigate from a defined starting point to a target destination using the tactile maps as a reference. During this process, their navigation behaviour, time to reach the destination, and encountered difficulties were systematically observed and recorded.
Across both experiments, the independent variable was the tactile map production method (3D-printed versus embossed paper), while the dependent variables differed according to the stage. In the first experiment, the dependent variables included perceived clarity, tactile distinguishability, and ease of interpretation, assessed through structured questionnaires administered after tactile map exploration. In the second experiment, dependent variables included navigation success, route completion time, confidence, anxiety, and perceived independent mobility, evaluated through observations, time measurements, and post-navigation assessments. In the first experiment, dependent variables included perceived clarity, tactile distinguishability, and ease of interpretation. In the second experiment, they included navigation success, time to destination, and perceived confidence. In addition, to reduce potential bias, the order in which participants were exposed to different map types was systematically controlled by alternating the sequence across participants.
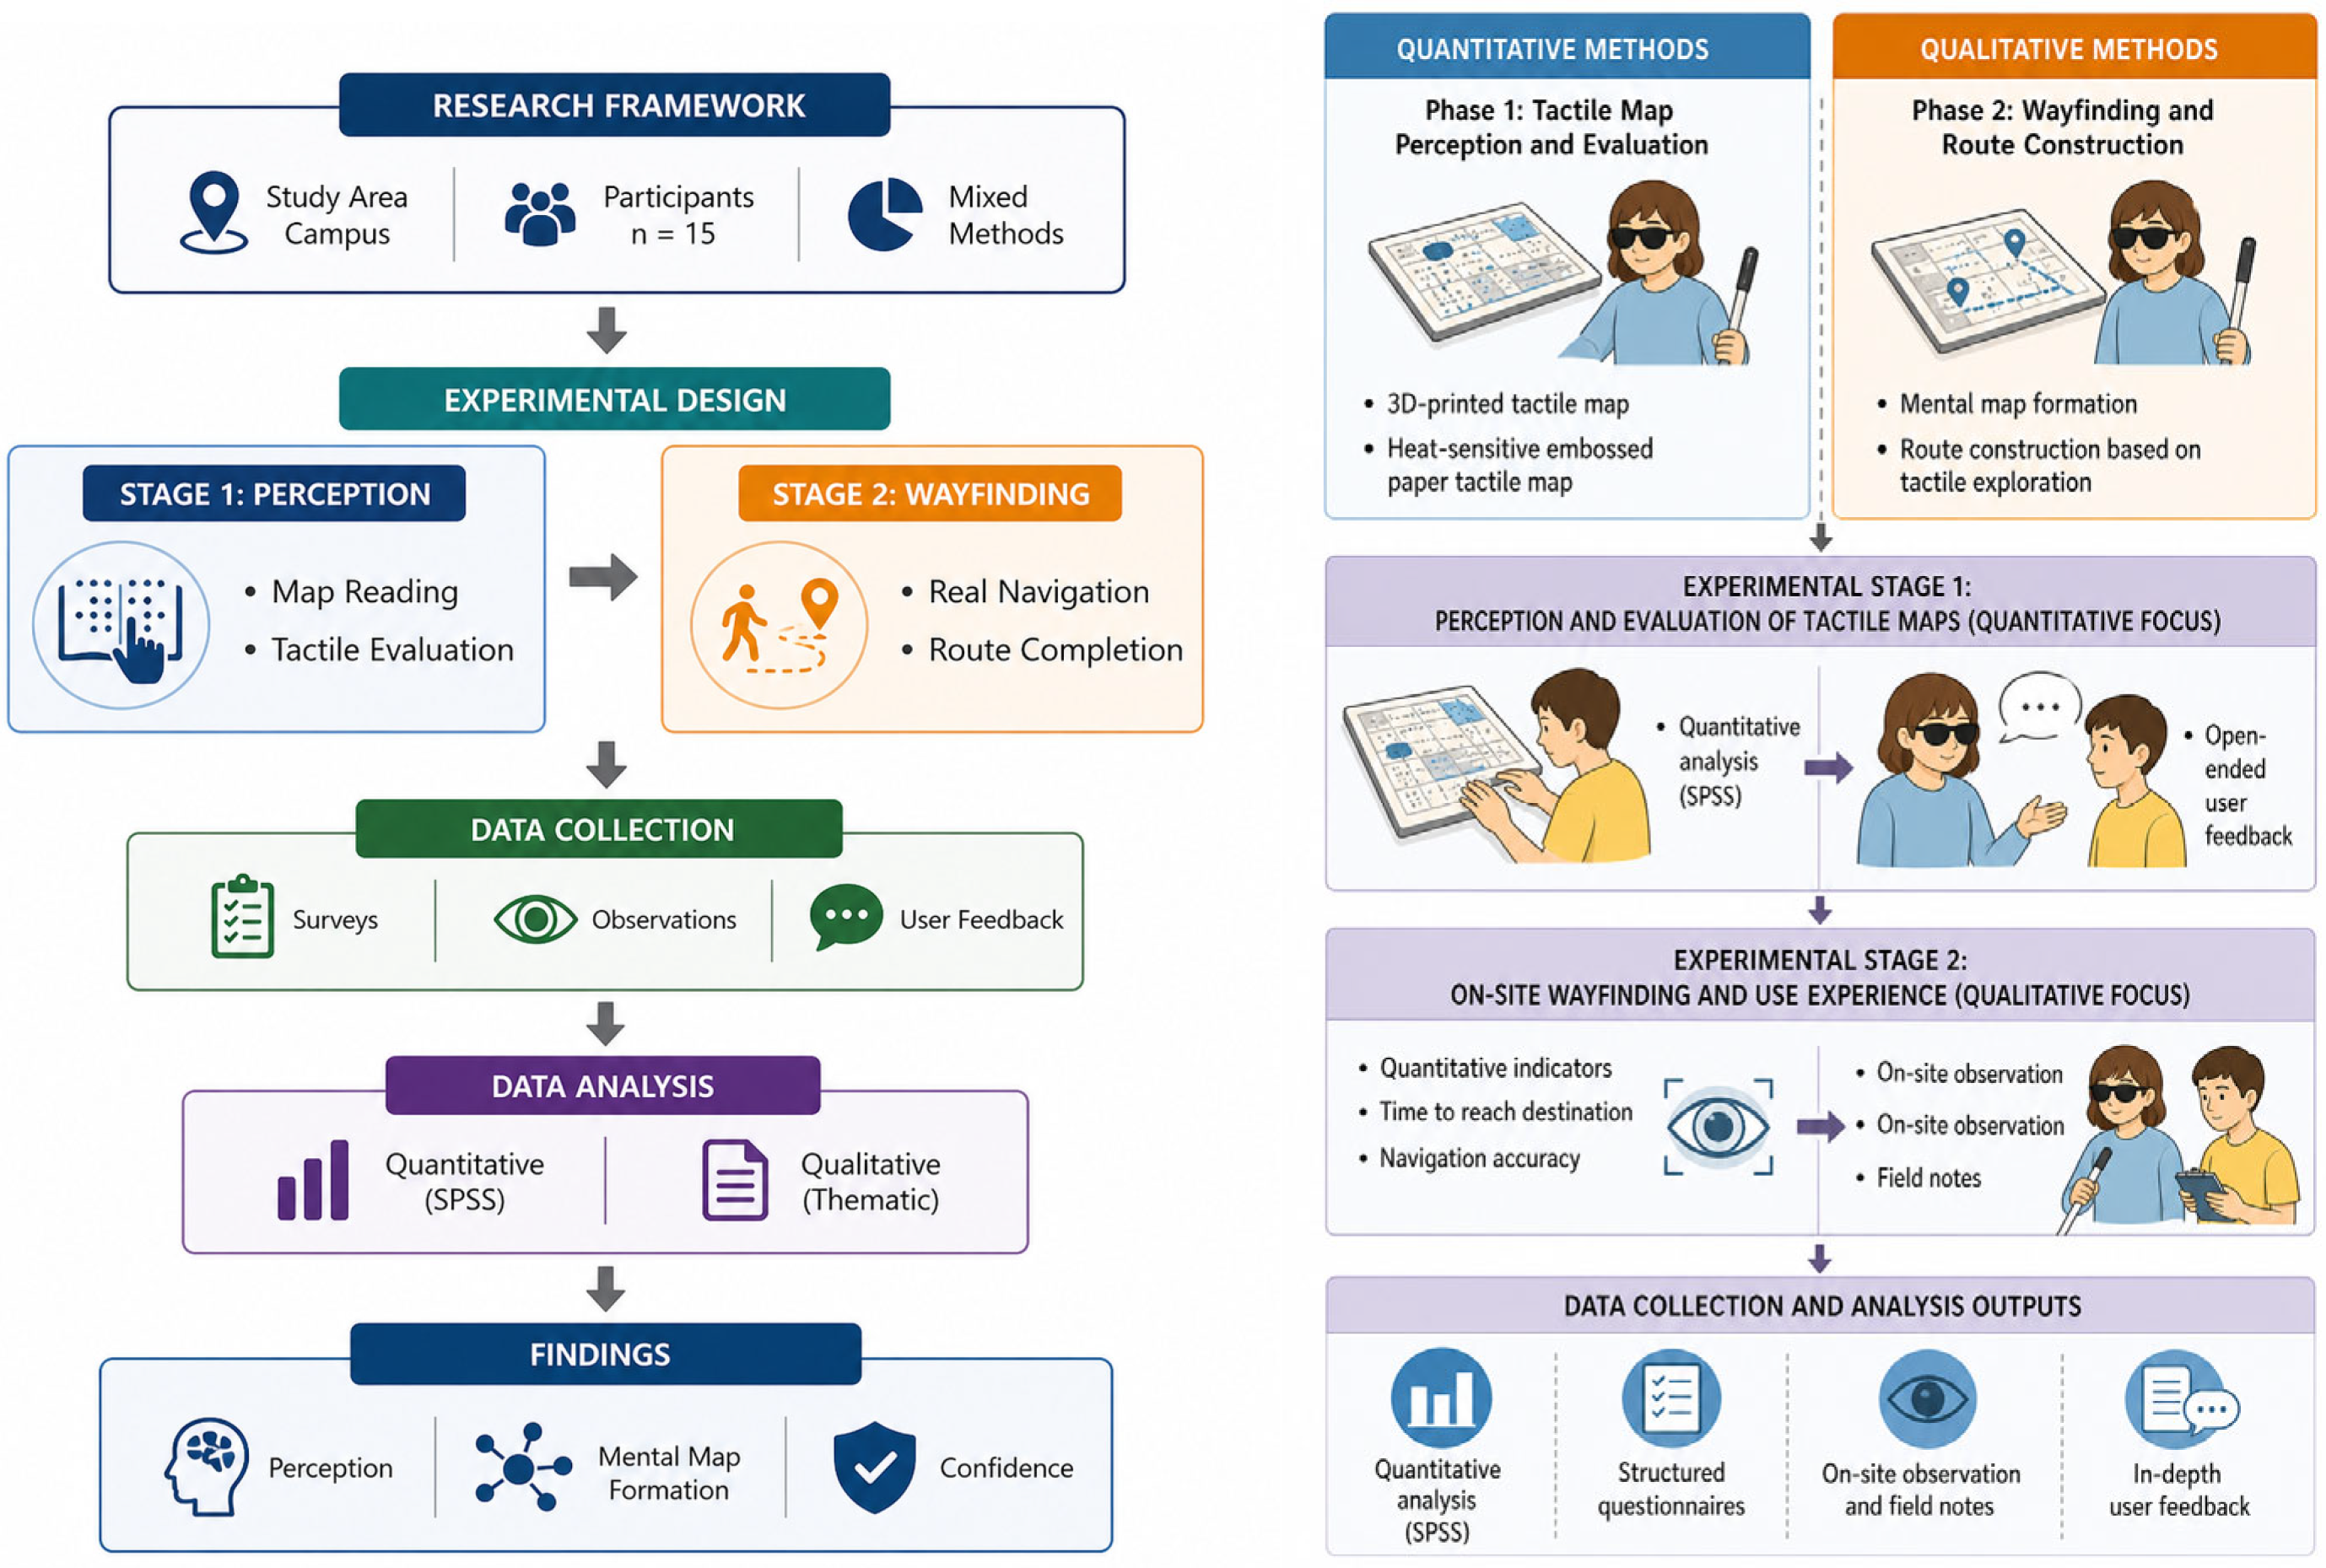
Figure 4 presents complementary representations of the same mixed-methods research framework rather than separate analytical processes. The left diagram summarizes the overall methodological structure of the study, whereas the right diagram illustrates the sequential workflow for data collection and analysis. The research process followed a chronological order in which participants first completed tactile map exploration and navigation tasks, followed by questionnaire administration, observations, and participant feedback collection. Quantitative analyses and qualitative thematic coding were conducted only after the completion of data collection. The two diagrams are therefore intended to highlight different dimensions of the same research design rather than distinct methodological stages.

4. User-Based Evaluation of Tactile Maps

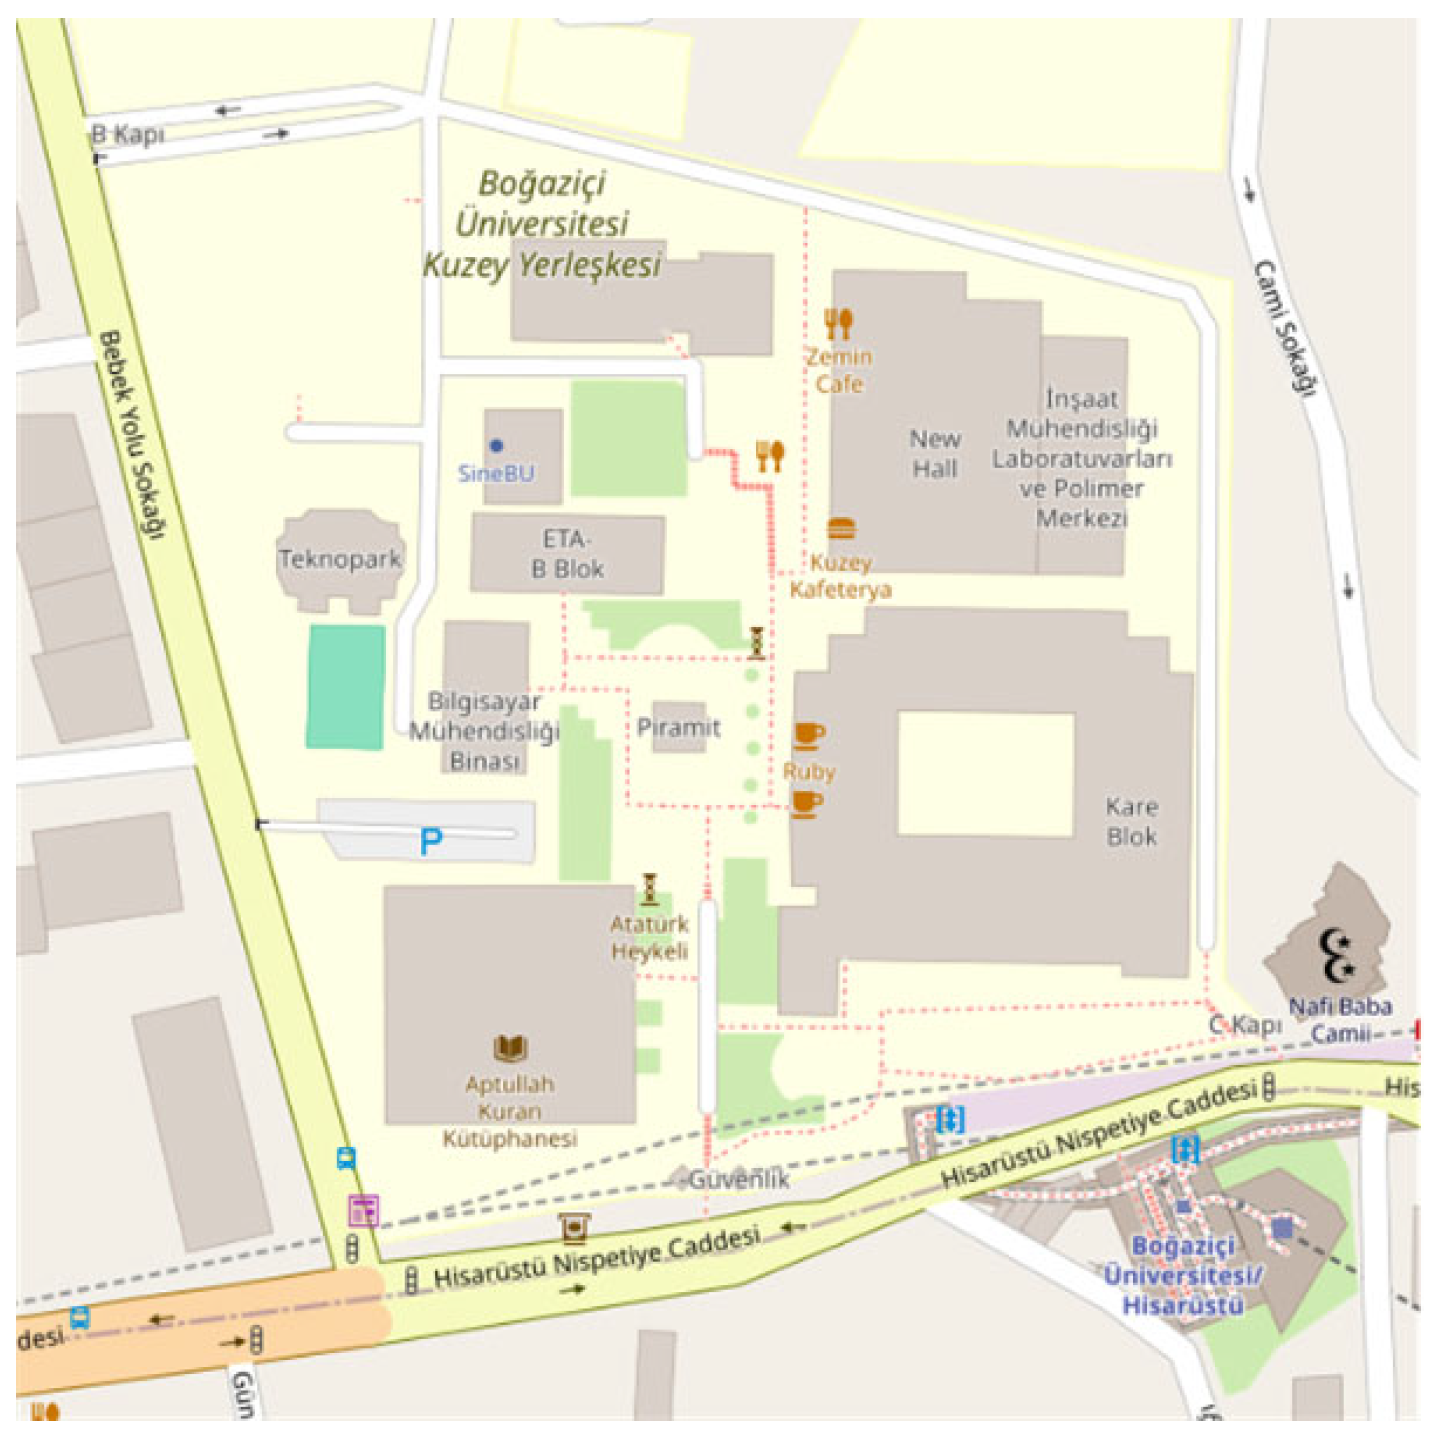
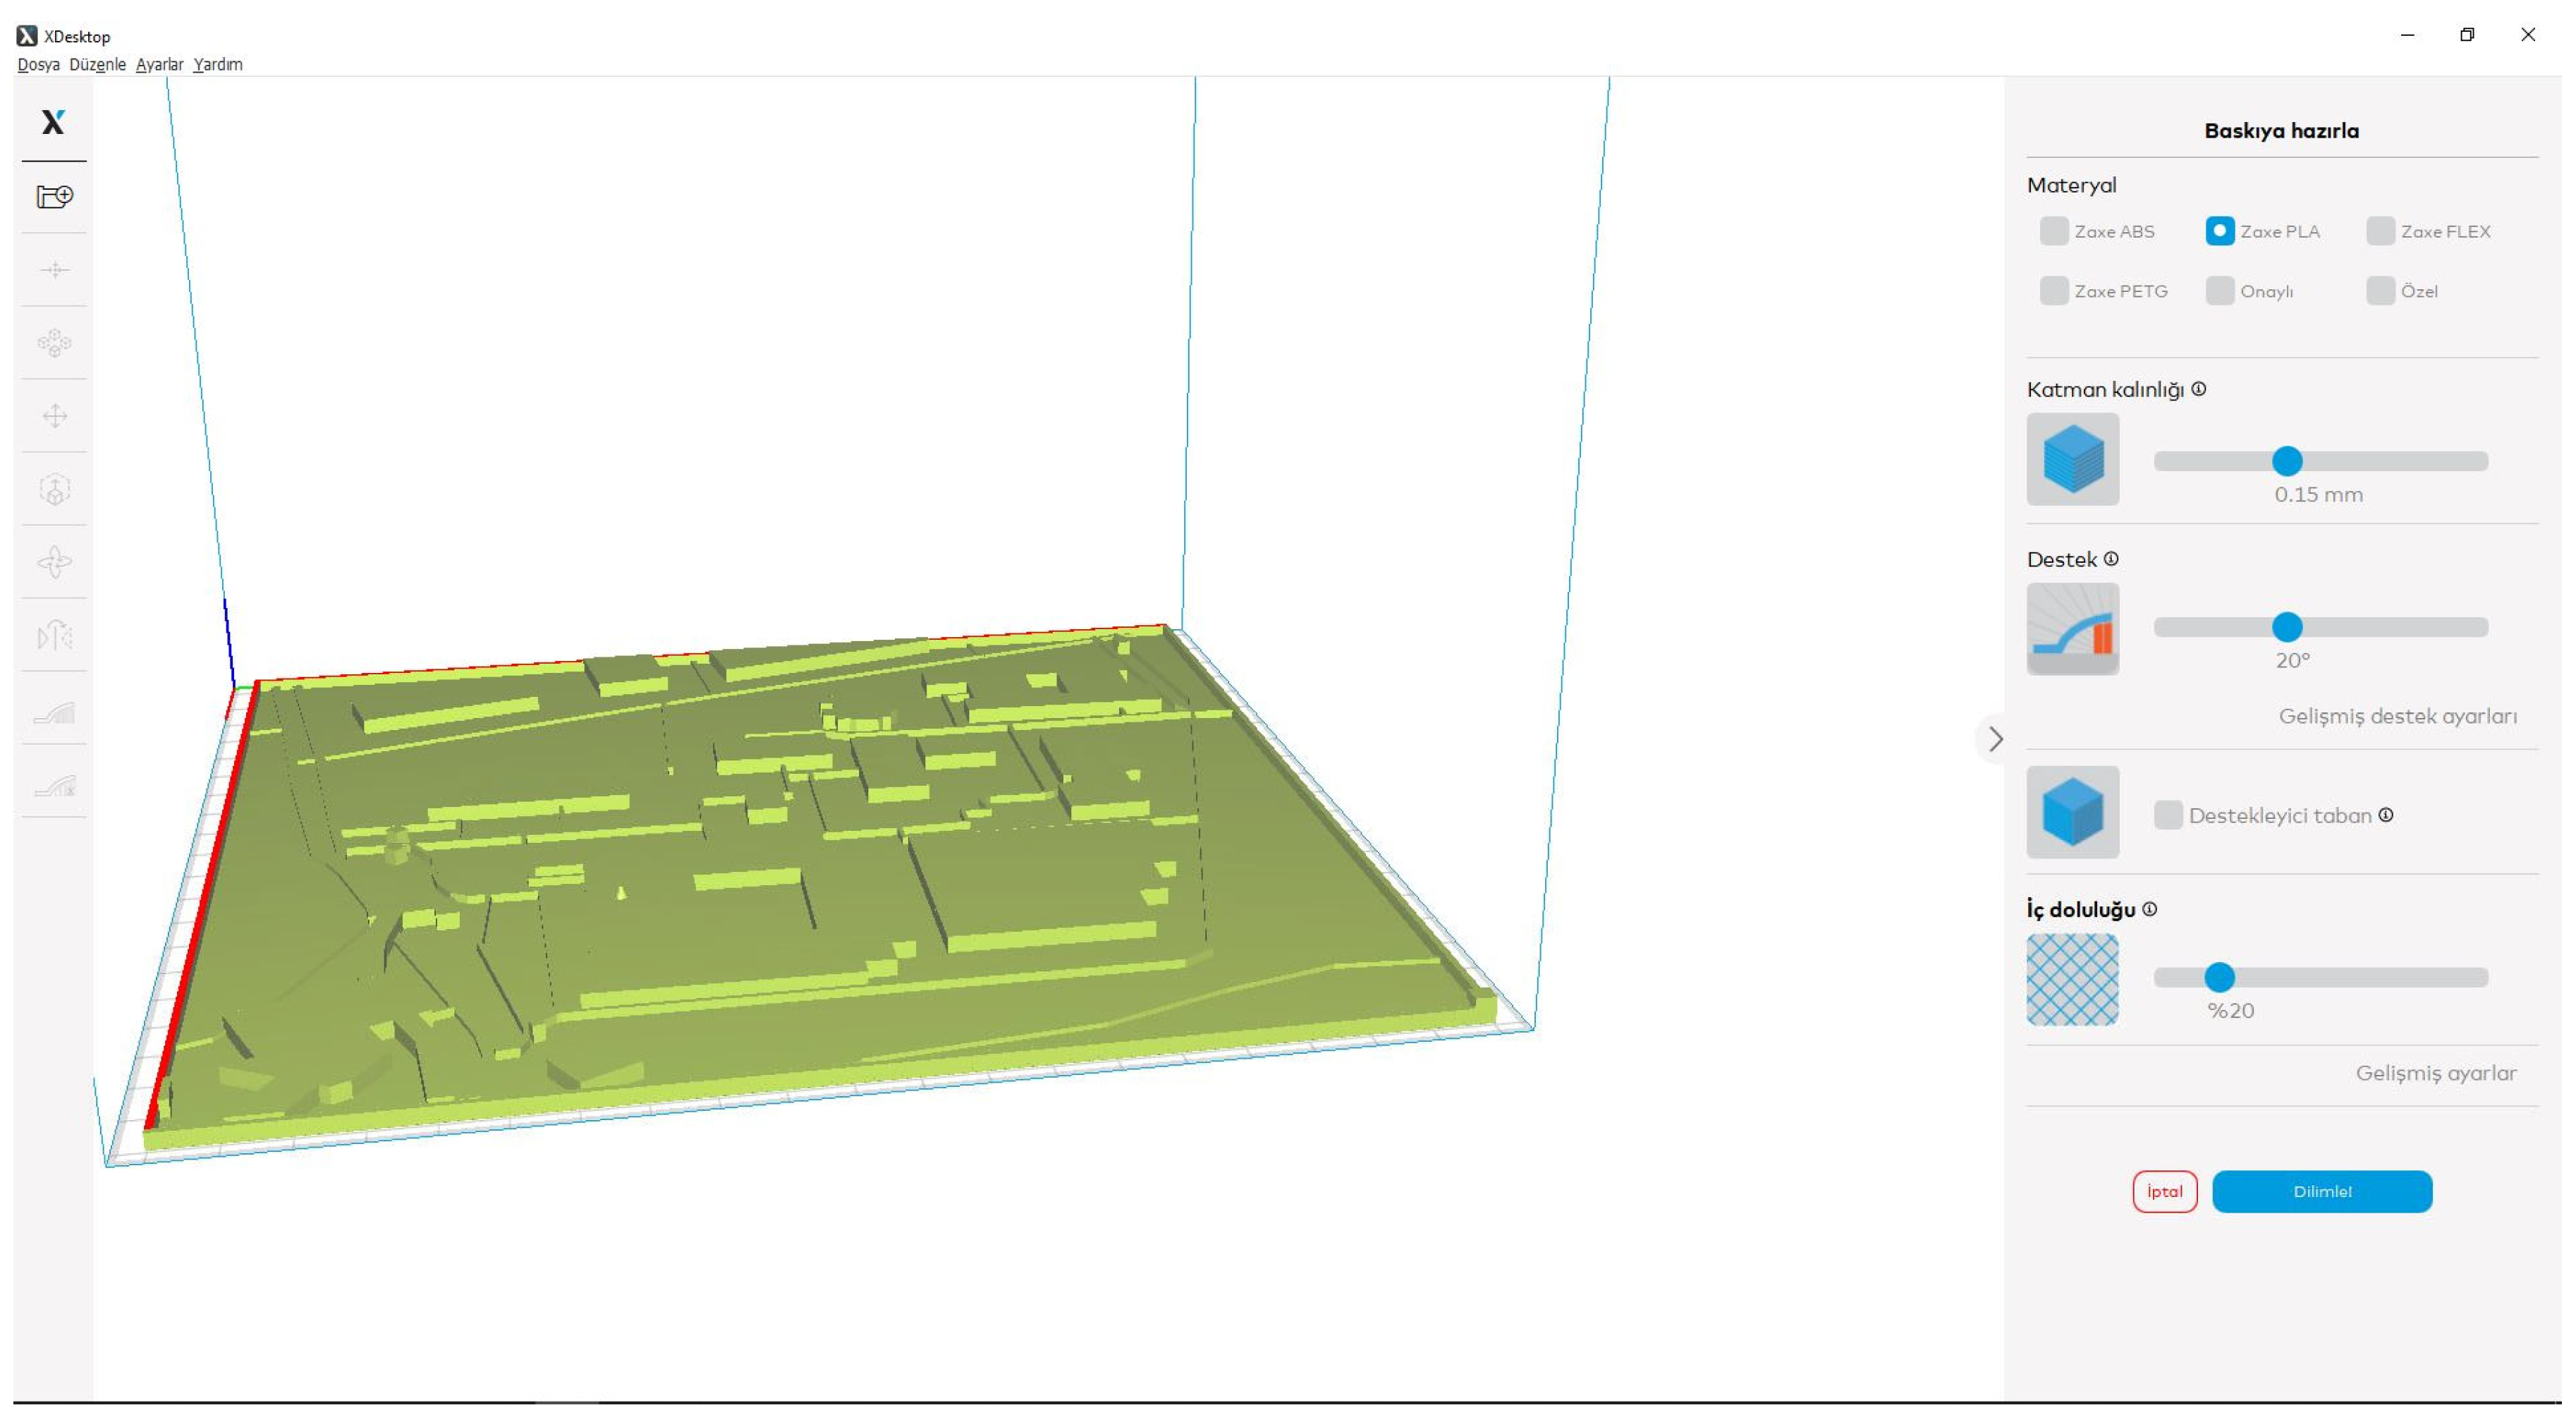
In the 3D-printed tactile map, the campus area was converted to the STL (Stereolithography) data format using Open Street Map (OSM) data from Touch Mapper software. A 20 × 20 cm output was targeted for the physical production of the map, and a custom scale of 1:1600 was chosen accordingly (Figure 5). This scale was optimized to maintain the level of detail of the campus area while providing the user with a readable and perceptible dimension.
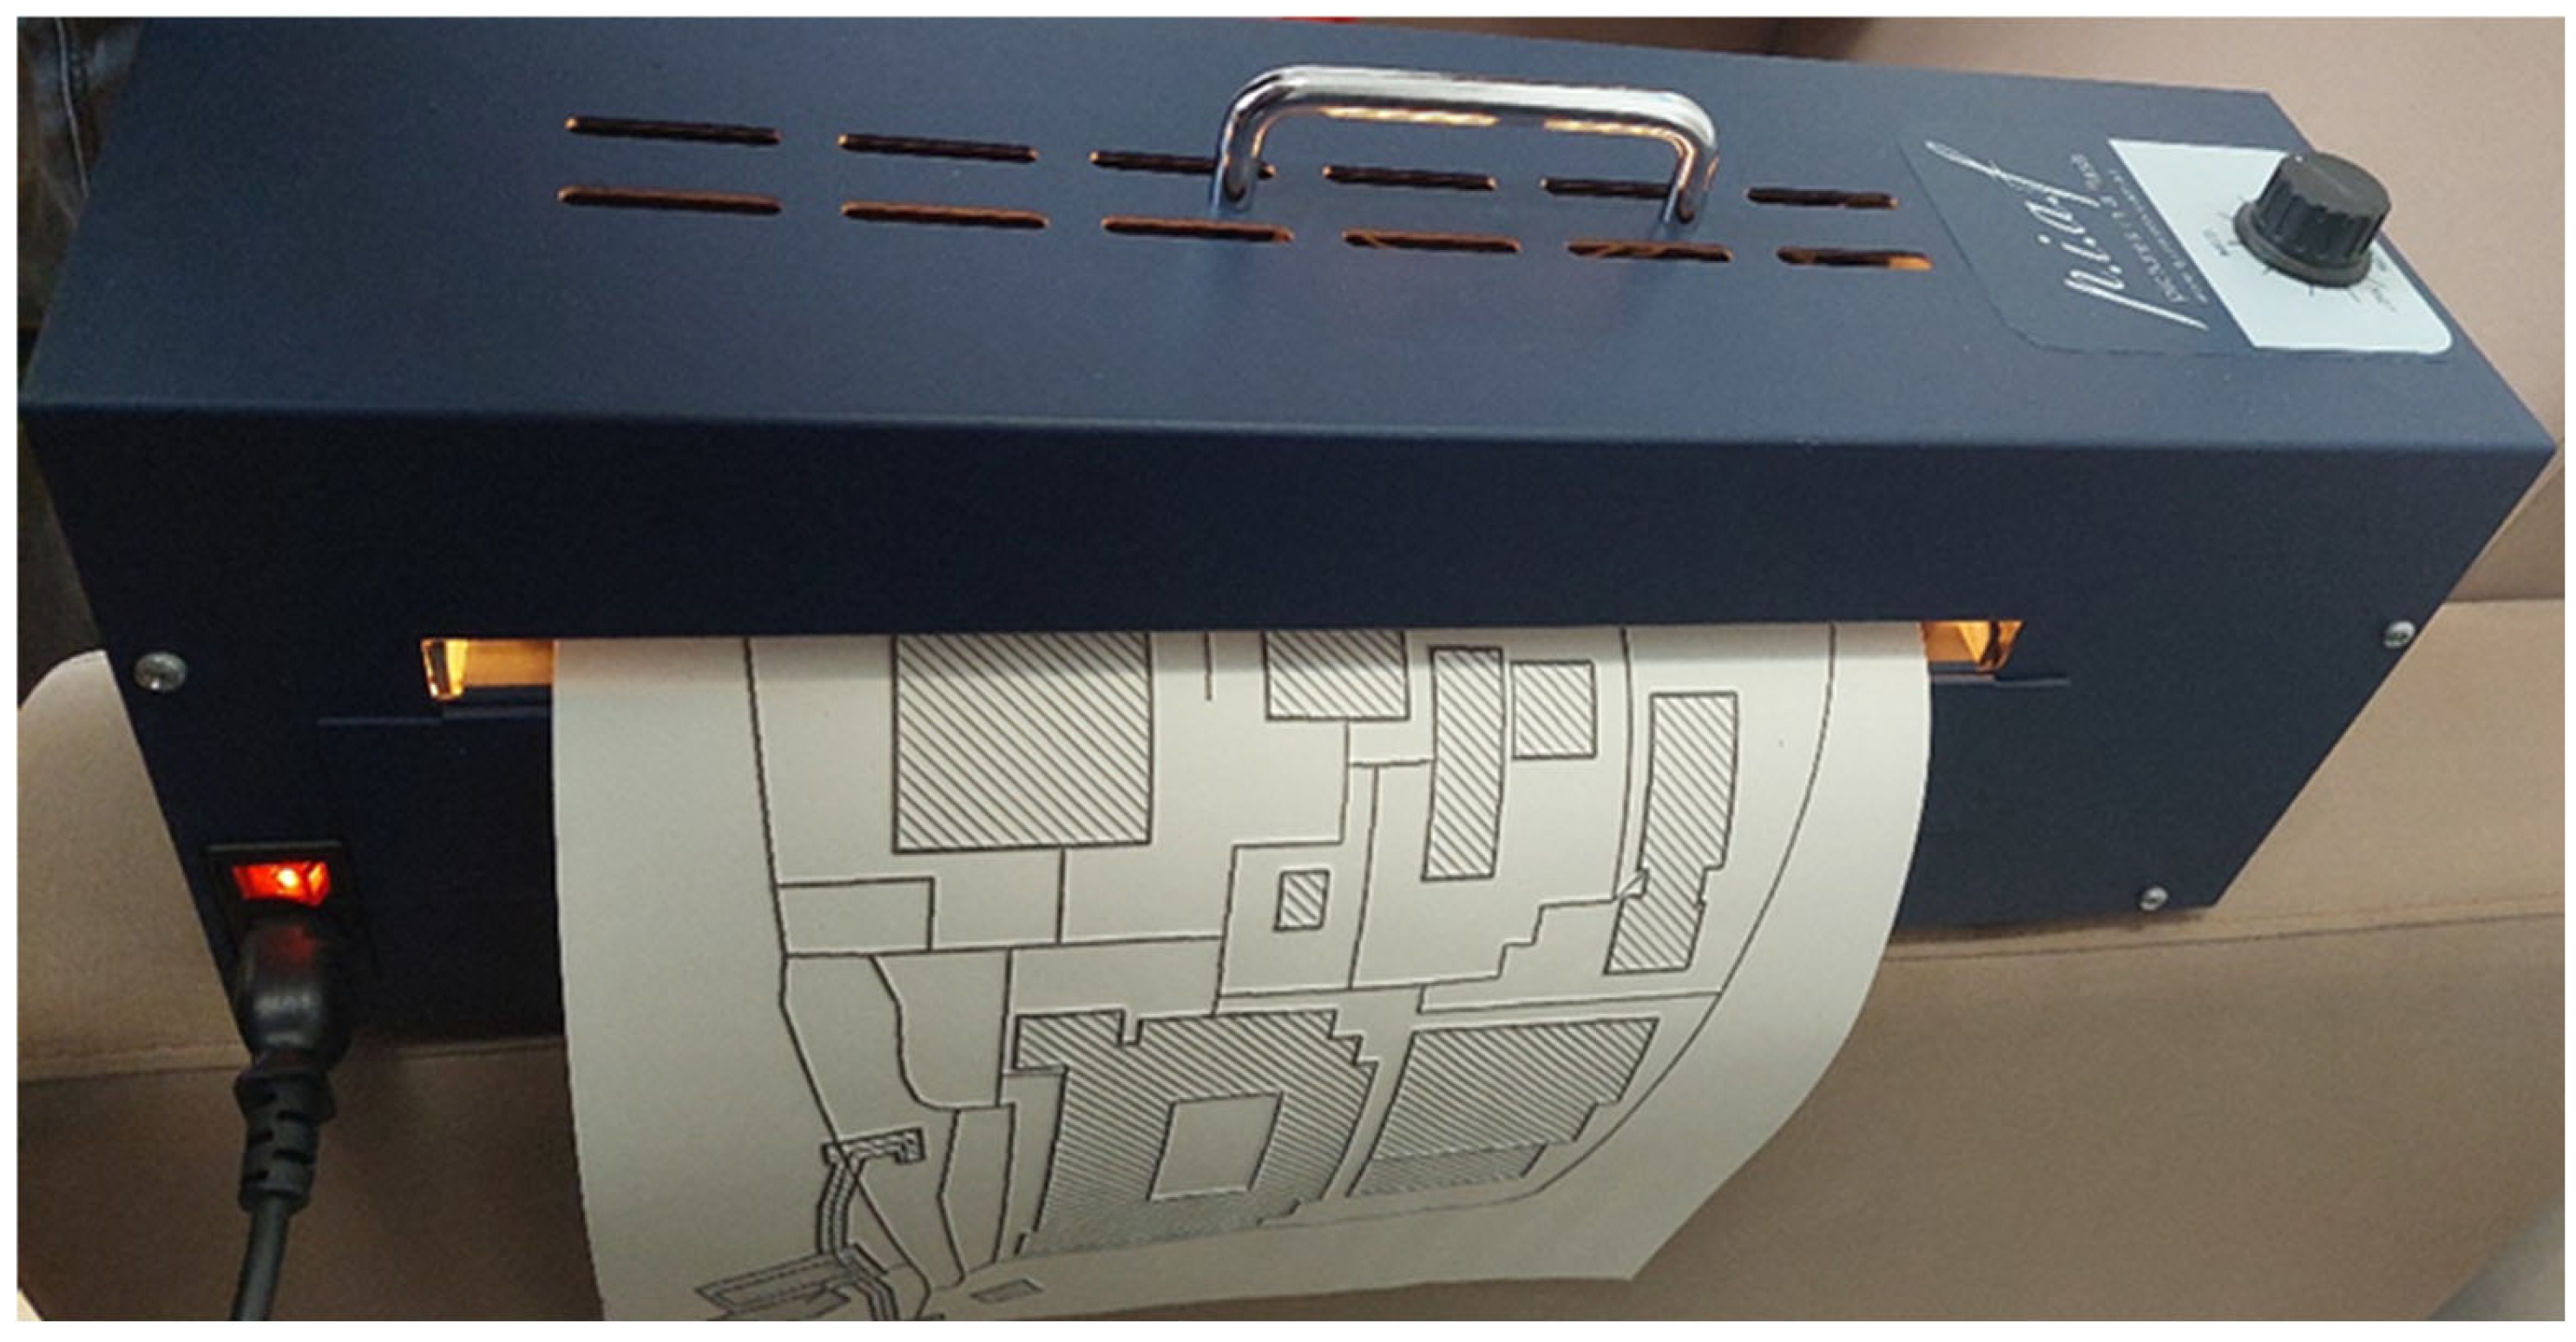
The embossed paper tactile map (Figure 3) was produced using a Piaf embossing machine (Figure 6) with Zytex Swell Paper and black-and-white PNG map images prepared in QGIS software. The 3D tactile map was automatically generated using the TouchMapper platform based on OpenStreetMap spatial data. The Touchmapper software enhanced the legibility of the 3D model by performing generalization on the QGIS map. For this process, “Zytex Swell Paper” was used, and black-and-white PNG (Portable Network Graphics) map images prepared via QGIS software were transferred to the Piaf machine (Figure 6). Maps were created by heat-embossing black lines on a heat-sensitive surface, and the process was repeated to increase the embossing depth if necessary. This method is advantageous due to its low cost and high production speed.
Touch Mapper was used to generate the final STL model for 3D printing. The source spatial data were first processed and generalized in QGIS prior to export. During this stage, non-essential features were removed, spatial elements were simplified, and the map content was adapted to tactile cartographic design requirements. The generalized dataset was subsequently used as the basis for STL generation and tactile map production. Compared with 3D-printed tactile maps, embossed swell-paper maps generally offer lower levels of tactile depth variation and structural layering. While swell-paper technology enables the creation of raised tactile elements, the range of achievable height differentiation remains more limited than that of fully three-dimensional-printed models.
The text information on the maps in the Figure 7 was created in Braille using the Index Braille Embosser device. Braille text was translated from a Word document using the Duxbury Braille Translator software and printed on special surface cardboard. Building names on the map were represented using a numeric referencing system, and the corresponding descriptions were provided in separate Braille-written description boxes to avoid overcrowding the tactile surface. This approach enabled users to identify spatial features while maintaining tactile clarity and reducing cognitive load during exploration.
In tactile cartography, legibility is not limited to recognisability of individual symbols or textures but is basically shaped by the spatial relationships between objects on the map, particularly the tactilely perceivable distance between them. Unlike visual maps, where multiple features can be perceived simultaneously, tactile maps are explored sequentially through touch. Consequently, insufficient spacing between objects such as buildings, paths, or landmarks can lead to tactile interference, confusion, and increased cognitive load, significantly reducing overall map legibility [27].
To address these challenges, tactile differentiation was adapted according to the capabilities of each production method. In the 3D-printed tactile map, differentiation was achieved primarily through variations in relief height, surface texture, and spatial separation between map elements. In the embossed swell-paper map, where height variation is inherently more limited, tactile distinguishability relied mainly on simplified map content, line thickness, texture contrast, and adequate spacing between features. These design strategies ensured that essential navigational information could be perceived through touch and supported spatial understanding without reliance on visual cues.
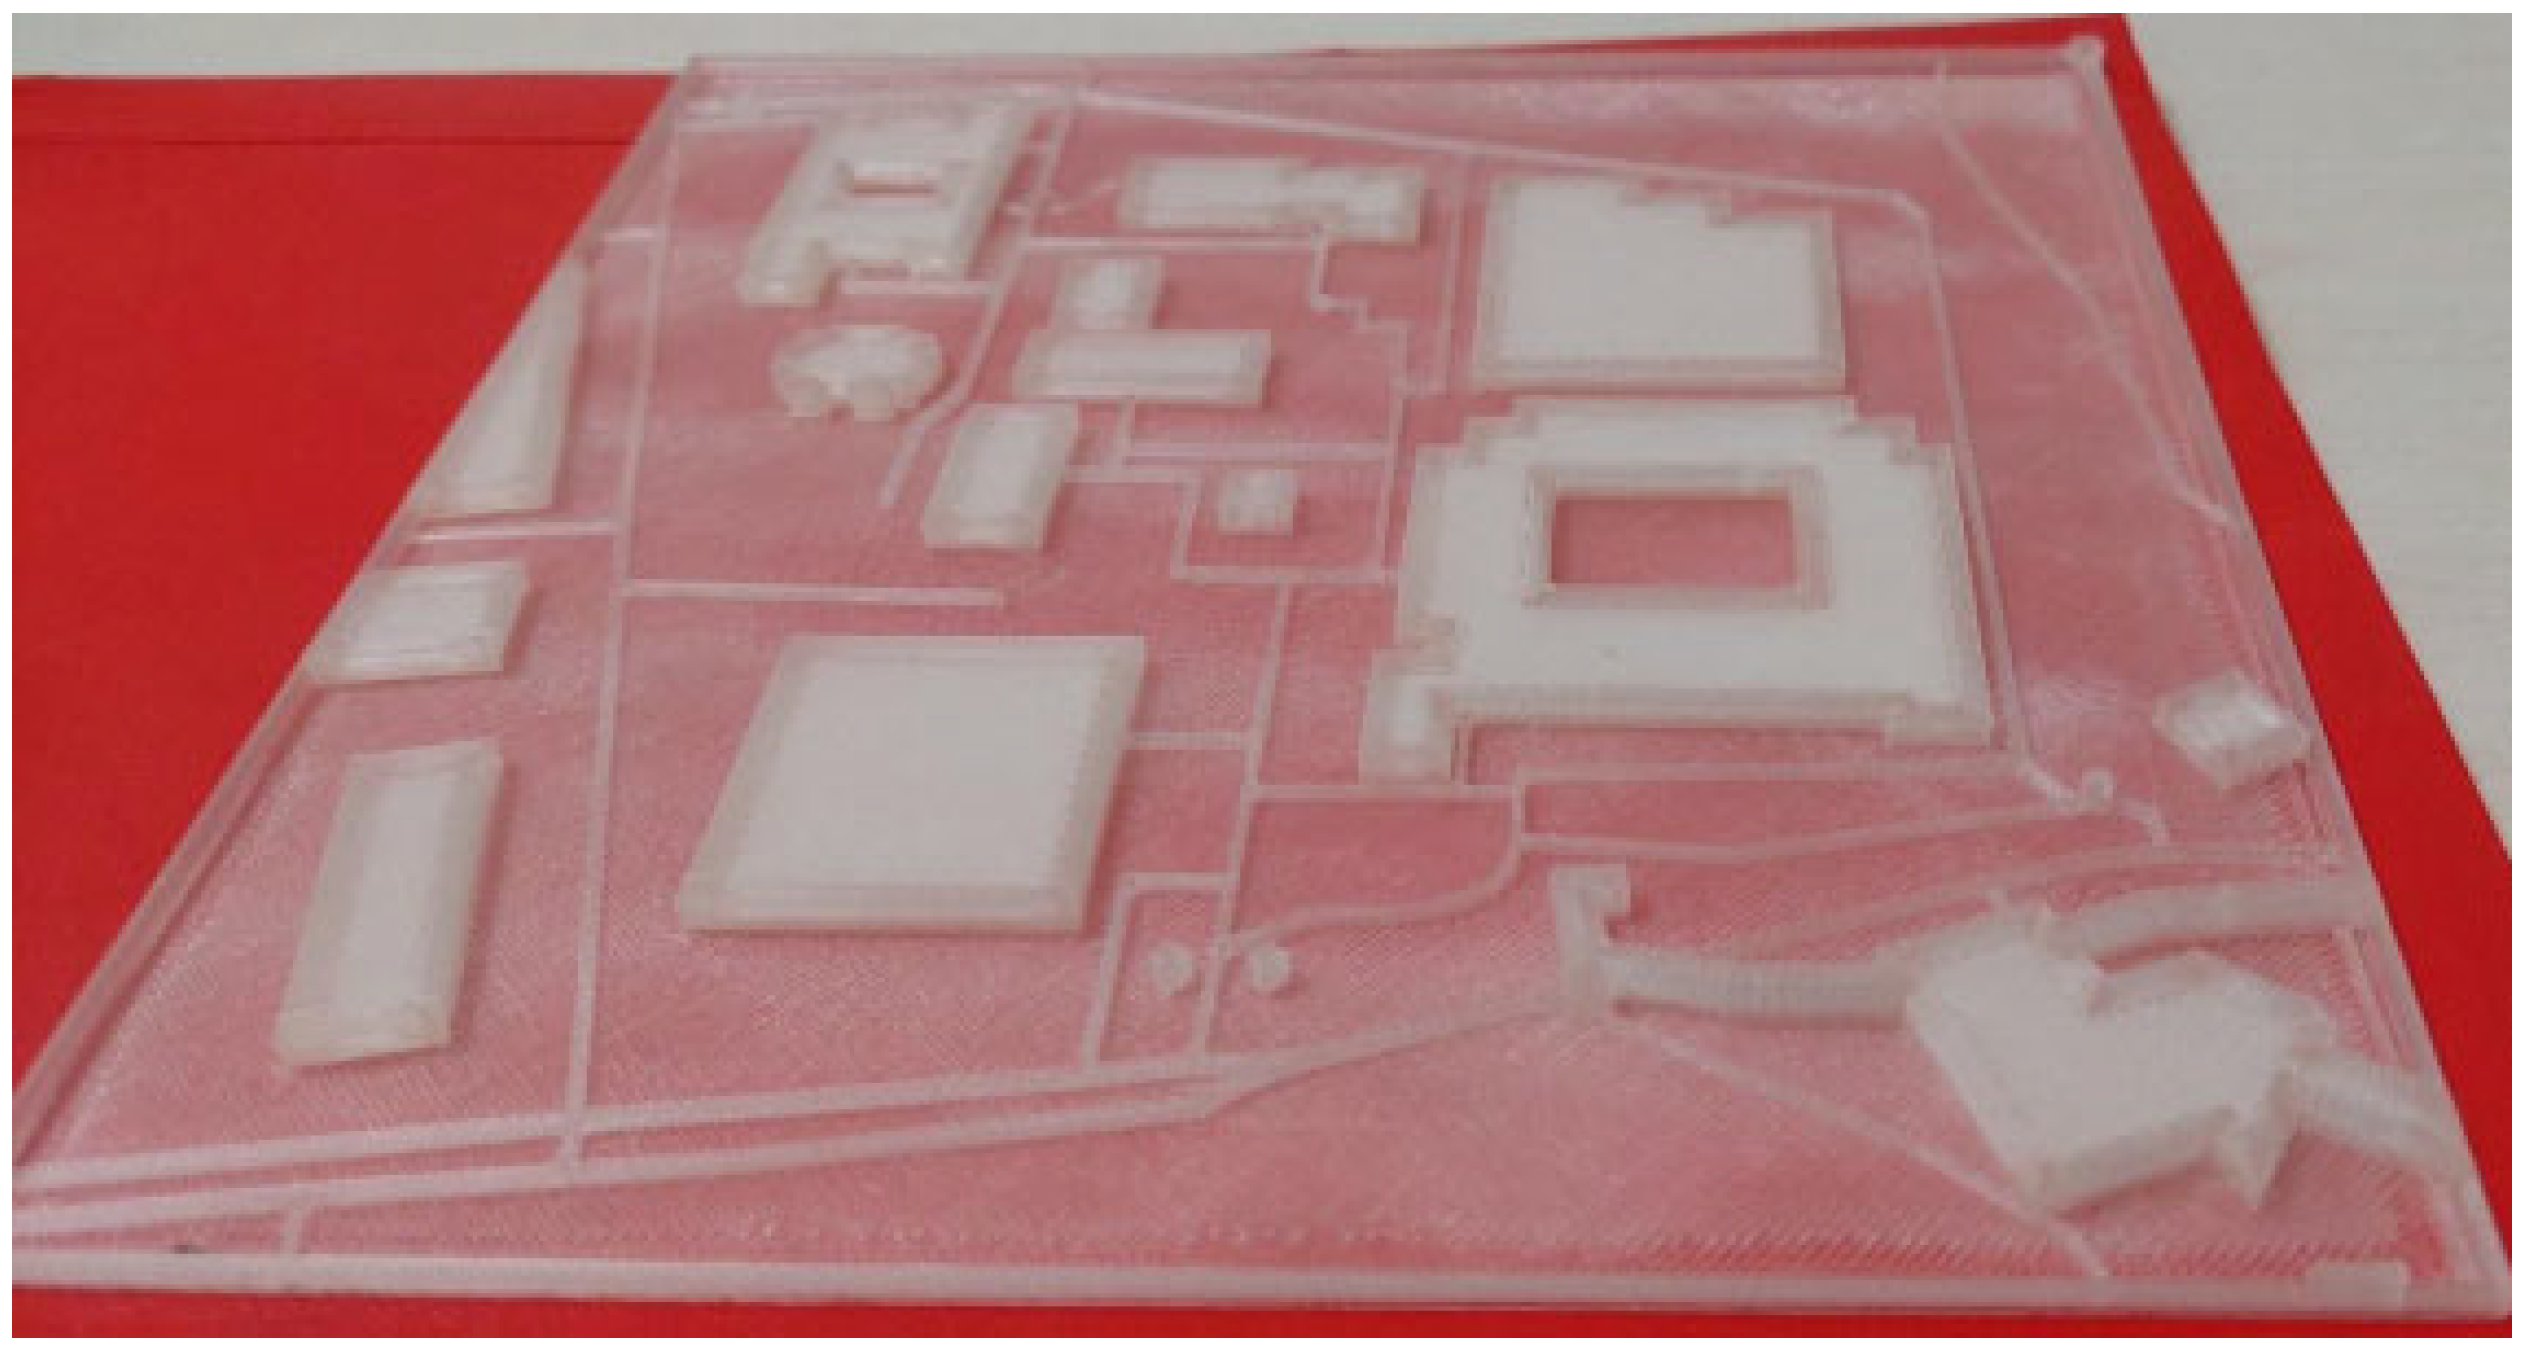
The map in the Figure 8 produced using a 3D printer was mounted on a 50 × 70 cm foam board to ensure tactile stability and to prevent unintended movement during exploration (Figure 2). Buildings and roads on the map were numbered using Braille, with corresponding descriptions provided in separate Braille written description boxes positioned alongside the map to avoid surface overcrowding. The production and design process followed a user-centered approach, aiming to support independent map use and clear tactile perception.
Due to its physical dimensions, the 3D-printed map was not intended for continuous mobile use. Instead, it was primarily designed as a prenavigation learning tool, allowing users to study the spatial layout and form a mental map prior to movement. Participants reported that carrying a rigid map of this size during daily navigation, especially while using a cane, was impractical. This limitation was therefore acknowledged as a trade-off between tactile legibility and portability and is discussed in detail in the limitations section.
In the process of arranging cartographic symbols for tactile maps, the tagging of spatial features was carried out using the Braille Alphabet and numbering system; building names and roads were written in their original Braille text without using Braille abbreviations. In the legend section of the tactile maps, tactile variables were used to represent different categories of spatial information through distinguishable textures, line patterns, heights, and surface characteristics rather than visual colour itself. Since students with visual impairments primarily interpret spatial information through touch, different tactile patterns and relief structures were assigned to map elements such as pedestrian paths, buildings, open spaces, boundaries, and landmarks in order to improve tactile differentiation and symbol recognition. These tactile variables functioned similarly to visual variables in traditional cartography by supporting hierarchy, categorization, and spatial interpretation during tactile exploration.

5. Findings

5.1. Quantitative Findings

The quantitative data obtained in the research were analyzed using the SPSS 2022 software. The quantitative findings section of the study was designed to reveal the knowledge, usage experiences, preferences, and needs of individuals with visual impairments regarding tactile maps through numerical data. Responses to closed-ended questions obtained through a pre-designed questionnaire were analyzed, and the data obtained were evaluated using frequency and percentage distributions. Analyses focusing on variables such as participants’ knowledge of the Braille alphabet, familiarity with tactile maps, preference for three-dimensional and embossed paper maps, and navigation success provide important indicators in terms of map functionality and user-friendly design features.
Findings in Table 3 regarding participants’ visual acuity show that the vast majority of individuals participating in the study (66.7%) were legally blind (100% people with visual impairments). The remaining 33.3% consisted of individuals with “low vision”. This distribution is important for explaining why opinions may differ in the evaluation of tactile map experiences, especially regarding issues such as colour tagging, tactile contrasts, and the significance of visual cues. Furthermore, it appears that needs and perceptions regarding map literacy and wayfinding skills also vary depending on visual acuity.
The vast majority of participants (86.7%) stated that they knew the Braille alphabet, with only a small group of 13.3% indicating that they were not Braille literate. Table 4 presents participants’ functional Braille literacy rather than different levels of Braille proficiency. Participants were asked a closed-ended question regarding their ability to read Braille in everyday use. Accordingly, a “Yes” response indicates that the participant was able to use Braille functionally for reading and interpreting tactile information, while a “No” response indicates that the participant did not use Braille functionally. The purpose of this question was to distinguish Braille users from non-users rather than to assess the degree of Braille reading proficiency.
Participants who were unfamiliar with Braille were still able to interpret the map legends through tactile symbol differentiation, repeated orientation support provided before the experiment, and verbal explanation of legend categories during the introductory phase of the study.
As seen in Table 5, while 60% of participants stated that they knew the colours of recreational and relaxation facilities such as seating areas, trash cans, tables, and benches in the campus square, 40% stated that they did not have this knowledge. This difference may be related to the participants’ visual acuity and environmental awareness experiences. It was observed that individuals with low vision, in particular, could distinguish contrasting colours (e.g., white-blue, red-black) and therefore used colour cues in the spatial environment in their mental mapping process.
The findings presented in Table 6 provide insight into participants’ previous experiences and perceptions regarding tactile map use. The responses indicate that participants relied on different strategies when interpreting spatial information and navigating unfamiliar environments. These findings suggest that the effectiveness of tactile maps is closely related to users’ prior experience with tactile spatial representations and their familiarity with map-reading practices. Consequently, tactile map usability should be considered not only as a product-design issue but also as a component of spatial learning and orientation training.
Approximately half of the participants (53.3%) stated in Table 7 that they had previously encountered tagging related to the colours of buildings and other spatial features on campus, while 46.7% stated that they had not encountered such information. A significant portion of participants who answered “yes” had obtained this information through building exterior colours (e.g., red brick, grey concrete, and white glass) or through explanatory boards, guide explanations, and verbal tagging from friends. In contrast, participants with lower visual impairments emphasized that they found colour tagging to be “abstract” and “dysfunctional” and that the function, location, texture, and neighbourhood relationships of the building were more meaningful instead.
Table 7 shows 73.3% of participants stated that they could easily access faculties or campus areas outside their department independently, while 26.7% reported experiencing difficulties. Individuals who reported being able to access the area generally developed personal strategies such as familiarity with the location, navigation skills, cane use, and the ability to interpret environmental signs.
The results shown in Table 8 reveal important aspects of how participants perceived and utilized tactile map information during orientation and navigation tasks. The distribution of responses suggests that users evaluate tactile maps based on their ability to support spatial understanding, route planning, and environmental awareness.
Table 8 shows that 66.7% of participants stated that they experienced anxiety when they had to reach a place on campus for the first time and alone. Reasons for this anxiety included insufficient knowledge of navigation, lack of adequate signage systems, inability to foresee obstacles (stairs, barriers, open walls, etc.), and inadequate maps. Due to anxiety, some participants did not go to their intended destination at all, while others only reached it with outside help. The places they intended to go included: a faculty building, the student affairs office, the cafeteria, the conference hall, and the rector’s building. On the other hand, 33.3% of participants stated that they were confident in their navigation skills, that they conducted preliminary research to familiarize themselves with the location, or that they memorized routes over time.
Table 9 shows that 80% of the individuals participating in the survey stated that they were familiar with tactile maps. This indicates that a significant portion of individuals with visual impairments have previously encountered or experienced such maps. According to the participants, knowledge of tactile maps is generally acquired in primary school years (for example, with maps of Turkiye or the world), but since it is not supported by systematic education, the ability to use them may remain limited in later years. The 20% who answered “No” stated that they encountered the concept of tactile maps for the first time in this study and that they could not experience the map design and the meaning of the legend by reading it. This situation reveals that the promotion and training processes for tactile maps should be widespread, and that descriptive information should be made clearer and more accessible.
Table 10 shows that sixty percent of participants stated that they had never used a tactile map based on colour tagging before. In this study, colour was not used as a tactile coding system or as an independent navigational layer. Rather, colour information was included as supplementary descriptive information that could be verbally communicated by sighted assistants to people who are legally blind. For instance, when a landmark or building is described by a sighted person as “the white New Hall building,” this colour-based description may support landmark identification and orientation during assisted wayfinding. Therefore, colour served as a contextual descriptive reference rather than a tactile map-reading variable.
In contrast, 40% of participants reported that the use of colour and visual contrast may be beneficial for individuals with residual vision, particularly during the initial interpretation of tactile maps and the formation of visual-spatial associations. These participants were primarily low-vision users who could combine limited visual information with tactile exploration. It should be noted that colour was not used as a tactile coding system and did not convey navigational information independently. Rather, it served as supplementary visual support for participants with usable residual vision.
Although colour is generally considered less important for users with visual impairments, it also serves an additional function that goes beyond direct perception. In particular, colour plays a significant role for sighted individuals such as teachers, guides, or assistants, who support users with visual impairments during navigation or learning processes. For this reason, colour should be evaluated not only from the perspective of users with visual impairments but also as an instrumental element that facilitates communication and interaction between users and their support environments.
It was emphasized that colour tagging often remains “abstract” and dysfunctional for legally blind individuals, and that texture, pattern, and object-function information are more meaningful. These findings reveal that tactile maps should be designed with inclusive accessibility principles, integrating not only colour but also multiple sensory components such as texture, relief, and auditory feedback.
Table 11 shows that while 46.7% of participants stated that colour tagging in tactile maps was meaningful to them, 53.3% stated that these tags were not functional or did not contribute anything. Individuals who found them meaningful were generally in the low-vision group and emphasized that colours (e.g., “red building = administrative unit”, “blue area = social facility”) helped in distinguishing spatial features. In contrast, individuals with complete blindness stated that colour tagging remained at the conceptual level because it was based on visual memory or past experiences, and that textures, auditory directions, or embossed symbols were more useful for wayfinding. It was stated that emphasizing colour tagging of geographical features would be beneficial in finding the target location where individuals with visual impairments can communicate. This finding shows that tactile maps should be designed not only with colour descriptions but also with functional matching and multisensory access tools.
Table 12 shows that the vast majority of participants 86.7% stated that they wanted to receive training on the use of tactile maps. This demand rate indicates that individuals have limited existing map-reading skills and that users are seeking support for more effective and safe navigation. Some participants stated that they had encountered tactile maps before but had not had a systematic experience using them, while others stated that they were hearing about such maps for the first time. Individuals requesting training particularly wanted to gain knowledge in areas such as colour tagging, sign reading, understanding map scales, navigation practices, and real-world applications. This result points to the need to support accessibility infrastructures not only physically but also in terms of access to information and user competence. It is recommended that training content be diversified with Braille, audio tagging, and practical navigation training.
Table 13 shows that sixty percent of participants stated that they had created a mental map beforehand by working on a tactile map and had tried to reach their destination independently with this preparation. These individuals, especially those with strong spatial memory or developed navigation strategies, stated that they modelled the route in their minds through the reliefs, directional arrows, signs, and tags on the map. This method offers a significant advantage in terms of saving time and independent movement, especially in large and complex areas such as campuses. On the other hand, 40% of the group stated that they had never tried this method or could not implement it because they did not feel confident enough to do so. These findings reveal that tactile maps need to be supported not only by design but also by processes such as pre-use guidance, examples suitable for homework, and hands-on training.
Table 14 shows that the majority of participants (93.3%) stated that spatial information (e.g., building names, ramps, stairs, directional details) included in tactile maps would significantly facilitate their use. These users emphasized that this information is vital for independent movement, safe navigation, and reaching destinations, especially in complex and large areas like campuses. They indicated that building names allow for location verification, ramps and stairs are indicated, routes can be planned in advance, and potential physical obstacles can be overcome. Only one participant stated that this information would not be sufficiently meaningful and that they navigated using environmental aids or pre-memorized routes.
Table 15 shows that 73.3% of participants believe that a system encouraging the updating and improvement of tactile maps through user participation is necessary. The findings presented in Table 16 reflect participants’ evaluations and recommendations regarding the future development of tactile mapping systems. The responses indicate that users value solutions that enhance accessibility, improve information retrieval, and facilitate independent navigation.
Table 16 shows that sixty percent of participants stated that the portability, accessibility, privacy, and security features of tactile maps were “very important,” while 26.7% rated them as “important.” In total, a high percentage of 86.7% emphasize that these four elements are critical to user experience. In addition to portability and accessibility, participants were also asked about several other usability-related features that may influence real-world tactile map use, including tactile readability, symbol distinguishability, spatial clarity, ease of orientation, confidence during navigation, physical handling comfort, and overall user satisfaction. Open-ended feedback questions additionally allowed participants to express personal preferences and suggest improvements related to map size, tactile detail density, legend interpretation, and potential integration with audio or digital navigation support systems. Privacy is particularly important for individuals who do not want others to know where they want to go or to protect their personal traces on the map. Security is related not only to the physical durability of the map (resistance to wear and tear) but also to the fact that it does not carry the risk of misdirection. These data demonstrate that tactile maps are not only a physical access tool but also a strategic product that must be designed with user privacy and security in mind.
Comparative frequency analysis in Table 17 reveals a significant and consistent difference in experience between the two tactile map production methods. The vast majority of participants found 3D-printed tactile maps more effective for overall comprehensibility, spatial relationship differentiation, and mental map formation. This was particularly evident in the tactile perception of building masses, road boundaries, and voids. In contrast, relief paper maps were more frequently preferred due to their portability and ease of use while on the move. However, a more balanced distribution was observed between the two methods in terms of aiding navigation. Given the relatively small and heterogeneous participant group, the quantitative findings should be interpreted primarily as exploratory and descriptive rather than statistically generalizable. In particular, participants with residual vision and those who were legally blind may have interacted with tactile maps differently due to variations in visual support, tactile reliance, and spatial interpretation strategies. Therefore, the study does not claim statistically definitive differences between production methods but instead highlights recurring experiential patterns and user perceptions observed across the evaluation process. For this reason, qualitative feedback and contextual interpretation were prioritized over formal inferential statistical generalization.
An additional aspect that should be considered concerns the visual appearance of the tactile maps for participants with residual vision. Monochromatic FDM-produced 3D tactile maps may appear visually less distinguishable and lower in visual contrast compared with swell paper graphics, where black embossed elements on a bright background can provide stronger visual differentiation. Although the primary focus of this study was tactile interaction and spatial interpretation, visual contrast and aesthetic clarity may also influence usability, orientation efficiency, and user preference among partially sighted individuals. This issue represents an important design consideration for future tactile map development and multimodal accessibility research.
The findings from the Table 18 suggest that while 3D-printed tactile maps provide stronger spatial organization and tactile differentiation, embossed paper maps remain advantageous in terms of portability and practical accessibility. These results support the argument that tactile map effectiveness should not be evaluated solely through technical production quality, but through the interaction between material properties, user perception, and navigation context.
Given the exploratory character of the study and the limited sample size, the statistical findings should be interpreted cautiously. Nevertheless, the inclusion of non-parametric analysis provides additional methodological support for understanding experiential differences between tactile map production methods.

5.2. Qualitative Findings

In this section, data obtained from surveys and individual interviews conducted with participants with visual impairments were analyzed through thematic analysis. The data obtained are presented under headings such as tactile map use, functionality of colour tagging, mental map creation experience, accessibility, and portability.
Table 19 shows that most participants stated that they first encountered tactile maps in university. However, the content of these maps mostly consisted of abstract geographical information, such as maps of Türkiye or the world. Experience with tactile maps in a campus environment was very limited. Some participants mentioned thematic maps they encountered in city squares or museums: “There was a tactile map in Zaragoza city square (Spain). I tried to understand the location of the buildings by sliding my fingers” (participant: O).
However, several participants reported difficulties during their initial interaction with tactile maps. The most frequently mentioned challenges were uncertainty about identifying their current position on the map, limited familiarity with tactile map-reading conventions, and difficulties interpreting the legend. As one participant noted, “One cannot understand where they are on the map. Training is needed for map reading” (Participant L), while another stated, “It was difficult for me to understand the geographical information because I couldn’t read the legend” (Participant E). These findings suggest that tactile map usability is influenced not only by map design but also by users’ prior map-reading experience and familiarity with tactile navigation tools.
Participants’ experiences revealed several recurring themes related to tactile map use. Limited familiarity with tactile maps (T1) indicates that exposure to tactile cartography is often confined to early educational stages and is rarely supported by continuous learning processes in later years, resulting in underdeveloped tactile map literacy among individuals with visual impairments [28]. In parallel, many participants reported difficulties in understanding legends and tactile symbols (T2), emphasizing uncertainty about where to begin map exploration and how to interpret symbol–meaning relationships. In parallel, many participants reported difficulties in understanding legends and tactile symbols (T2), particularly in determining where to begin tactile exploration and how to interpret symbol–meaning relationships. These challenges may be partially associated with differences in Braille literacy, prior tactile map experience, and the absence of integrated multimodal support such as audio guidance or enhanced visual assistance for participants with residual vision. The findings therefore suggest that tactile maps may benefit from multimodal accessibility strategies that combine tactile information with audio instructions, high-contrast visual elements, or guided orientation support to improve interpretability for diverse user groups.
This finding aligns with previous studies showing that insufficient symbol differentiation, lack of hierarchical clarity, and absence of map-reading training significantly reduce the usability and cognitive effectiveness of tactile maps [29]. Perceptions regarding the functionality of colour tagging (T3) further highlight user diversity: while participants with low vision reported that contrasting colours could support visual–mental associations, individuals with complete blindness generally perceived colour information as abstract and non-functional for direct navigation. However, colour references were noted to have an indirect role in facilitating verbal communication with sighted individuals during wayfinding, a finding consistent with literature emphasizing the greater effectiveness of tactile, functional, and multisensory cues over purely colour-based descriptors in non-visual navigation contexts [29].
The qualitative themes summarized in Table 19 are largely consistent with existing literature on tactile cartography and wayfinding for users with visual impairments. Participants’ limited familiarity with tactile maps, difficulties in interpreting legends and symbols, and strong demand for map-reading training reflect well-documented gaps in tactile map literacy and learning continuity [30]. Reports emphasizing the importance of mental map formation and reduced navigation anxiety align with spatial cognition and wayfinding theories, highlighting pre-navigation learning as a key component of independent mobility [31]. Furthermore, concerns related to portability, privacy, and the need for user participation in map updating support user-centered and participatory design approaches, which stress adaptability and user involvement in accessible spatial information systems [32]. Finally, participants’ interest in technology-supported and multisensory solutions reinforces recent calls for integrating tactile maps into hybrid wayfinding ecosystems rather than treating them as static accessibility artifacts [33].
Some participants emphasized that they could distinguish between light and dark colours thanks to their memories from previous experiences: “I can pick out colours like black, white, and red. I can make matches based on them” (participant: C). However, it was stated that using colours as a functional tool is generally insufficient, and that tactile patterns, building structures, or environmental positioning are more meaningful instead: “For me, features such as whether the building is stone, new, or flat are more descriptive.” (Participant: O) “Instead of colour, the sound of the building, the stone paving at the entrance, or the trees in the surroundings are more important signs” (participant: E).
The vast majority of participants stated that they had previously studied and visualized a place they aimed to reach, and that they found their way this way. This strategy is applied through finger tracing on a map and establishing spatial connections in memory: “I studied at home and created a mental map. Once the map of the place I want to go is visualized in my head, it is easier to walk outdoors” (participant: B). Some participants stated that experiencing the process in a hands-on environment was more efficient, and that abstract map work alone was insufficient: “It is more efficient to practice reading the map in the field and reaching the target location. Mental work alone is not enough” (participant: A).
Almost all participants stated that indicating spatial features such as building names, ramps, and stairs on the tactile map greatly contributed to the wayfinding process: “Information such as where the building entrances are the location of the ramp, and how many steps there are is important. If there is no one around, it is difficult for me to identify the building by sound or with a cane” (participant: B). “We can learn the campus locations and stair structures. I can more easily plan a route to the place I want to reach” (participant: L).
The majority of participants stated that tactile maps may be difficult to use if they are heavy, rigid, or non-foldable. It was emphasized that the map should be waterproof, easy to carry, and fit in a bag: “It’s difficult to carry a map while holding a cane; it could be like an apron hanging around the neck” (participant: A). “If the pages were in the form of a notebook with a cover showing specific parts of the place, maps like this could be taken anywhere” (participant: C).
Some participants emphasized that the maps should not show hidden areas or sensitive regions. Some participants, however, did not attach much importance to privacy or evaluated it contextually: “Hidden areas should be indicated as encrypted, private, or not shown at all” (participant: E). “I don’t go to hidden places anyway. Classrooms and cafeterias are usually sufficient” (participant: M).
The ability to understand tactile maps is a competency that needs to be developed for most participants. Many individuals who had difficulty understanding the map upon their first encounter stated that they wanted to receive map-reading training: “I had difficulty understanding the tactile map; I couldn’t understand anything. I should have received Braille alphabet and map reading training” (participant: O).
The vast majority of participants stated that tactile maps should be updated with user feedback and that they wanted to actively participate in this process. Some suggested methods for this purpose are as follows:
  • Audio feedback boxes;
  • Braille comment areas;
  • Digital survey with QR code;
  • Monetary incentives (gift card, app membership, etc.).
“If there was a feedback system with QR codes, it would be both easy and accessible to everyone” (participant: E).
A significant portion of participants suggested that tactile maps should be supported by digital technologies (navigation, voice guidance, and artificial intelligence assistants). In addition, creative suggestions such as personalized map production with 3D printing, modular part-based and voice map notebooks came to the fore: “The textured surface from the 3D printer was very useful for me. It can be designed according to the needs of each user” (participant: E). “A map combined with navigation, voice and embossed would be much more functional” (participant: L).
The findings show that tactile maps are an important supporting tool in the experience of individuals with visual impairments finding their way around the campus, but there are areas open to improvement in terms of education, user contribution, physical design and digital integration. The participants’ requests are not limited only to the physical presence of the map; this crucial user-centric approach highlights the need for a multi-sensory wayfinding ecosystem that requires careful consideration.


6. Discussion

The findings of this study suggest that tactile map production methods are associated with differences in tactile perception, spatial understanding, and wayfinding experience among students with visual impairments. Rather than functioning merely as static accessibility products, tactile maps appeared to operate as experiential and cognitive support tools that shaped how participants prepared for navigation, interpreted spatial relationships, and developed confidence during movement within the campus environment.
Participants generally reported that 3D-printed tactile maps provided stronger tactile differentiation and clearer spatial organization compared to heat-sensitive embossed paper maps. This tendency may be explained by the volumetric and layered structure of 3D-printed surfaces, which likely enabled users to distinguish pathways, buildings, and spatial boundaries more effectively during sequential tactile exploration. Since tactile perception occurs fragment by fragment rather than holistically, clearer relief variation may reduce cognitive ambiguity and support more stable mental map formation [34].
Qualitative observations and participant feedback further supported these tendencies. Several participants described the 3D-printed maps as “easier to mentally organize” and “more understandable spatially,” particularly when attempting to interpret relationships between buildings and pedestrian routes. One participant noted that the raised structures “made it easier to imagine the campus before walking,” while another participant explained that “the buildings felt more separated and recognizable through touch.”
At the same time, the findings also indicate that embossed paper maps offered important practical advantages despite their more limited tactile depth. Participants frequently emphasized portability, rapid accessibility, and ease of handling as positive characteristics of embossed maps. Some users stated that the lighter structure of embossed maps made them easier to carry during navigation activities, even though certain tactile symbols and textures were perceived as less distinguishable.
The study additionally suggests that tactile map usability cannot be understood solely through technical production quality. User familiarity, prior tactile map experience, and individual navigation strategies appeared to shape how spatial information was interpreted. Participants with greater previous exposure to tactile maps generally demonstrated more confidence in interpreting tactile symbols and constructing spatial relationships. In contrast, participants with limited tactile map experience relied more heavily on sequential exploration, verbal confirmation, or environmental cues [35].
Another important finding concerns the process-oriented role of tactile maps within navigation. The findings suggest that participants did not use tactile maps merely as reference objects during movement; rather, the maps functioned as preparatory cognitive tools that supported pre-navigation planning and reduced uncertainty before entering the environment. Several participants reported that exploring the tactile maps beforehand increased their confidence and reduced anxiety during route-following tasks [36].
From a cartographic design perspective, the study highlights the importance of tactile hierarchy, simplification, and material-sensitive design. Excessive spatial detail or insufficient tactile contrast may increase cognitive load and reduce interpretability, particularly in complex environments such as university campuses [37].
The findings of this study should also be considered within the broader context of emerging digital navigation technologies for people with visual impairments. Although tactile maps remain valuable tools for spatial learning, route familiarization, and cognitive map formation, their portability and practicality for continuous on-site navigation remain limited. Previous studies have similarly emphasized that traditional tactile and audio-tactile maps are often cumbersome, difficult to update, and primarily useful during pre-navigation preparation rather than real-time wayfinding [38]. Recent research has demonstrated the potential of mobile audio-vibratory and digital audio–tactile mapping systems to overcome some of these limitations by providing portable, interactive, and dynamically updateable spatial information through smartphones and touchscreen devices [37,38,39]. Likewise, digital audio-map approaches have been proposed as functional equivalents of tactile maps, supporting spatial awareness and mental map development through auditory interaction and contextual descriptions [25]. These findings suggest that tactile maps and digital navigation technologies should not be viewed as competing solutions but rather as complementary tools. While tactile maps facilitate the development of cognitive representations of space, mobile navigation applications, audio-tactile systems, QR-supported interfaces, and audio-vibratory maps may provide effective support for real-time navigation and independent mobility in unfamiliar environments.
Although tactile maps are widely acknowledged as valuable accessibility tools, they are often treated as static products whose effectiveness is taken for granted. In practice, many design decisions, particularly those concerning production methods, are guided by technical feasibility, cost, or availability, rather than by how users actually experience and use the maps in real-world navigation contexts [40].
The findings of this study directly address the research gaps identified in the literature review. First, by comparing 3D-printed and embossed tactile maps through both perceptual evaluation and real-world navigation tasks, the study provides empirical evidence regarding how tactile map production methods influence user perception, confidence, and navigation experience. Second, the user-centered mixed-methods approach contributes to the integration of production technologies within participatory and experience-based tactile cartography research, moving beyond purely technical evaluations of map production. Third, the results demonstrate that tactile maps function not only as static representations but also as process-oriented wayfinding tools that support mental map formation, spatial learning, and independent mobility in real environments.
An important consideration emerging from this study concerns the practical portability of tactile maps. Although embossed tactile maps were generally perceived as more portable than their 3D-printed counterparts, neither map type can be considered fully suitable for continuous on-site navigation. Instead, tactile maps appear to provide their greatest value during pre-navigation preparation, route familiarization, and cognitive map formation. In contrast, real-time wayfinding is increasingly supported by smartphone-based navigation applications and assistive digital technologies used by individuals with visual impairments. Rather than functioning as competing solutions, tactile maps and digital navigation systems should be viewed as complementary tools.
The findings also highlight opportunities for integrating tactile maps with emerging audio-tactile technologies. Recent studies have demonstrated that audio-tactile systems can enrich spatial exploration by combining tactile interaction with auditory feedback, enabling users to access additional environmental information without increasing tactile complexity. Such hybrid approaches may address some of the limitations associated with purely tactile maps, including difficulties with presenting detailed information, updating content, and supporting independent orientation in unfamiliar environments. Furthermore, participant suggestions regarding QR-code-supported feedback systems indicate a growing interest in interactive and multimodal navigation solutions. Future research should therefore investigate how audio-tactile interfaces, mobile applications, and tactile cartography can be integrated to support both cognitive map formation and real-world navigation performance.

7. Conclusions

This study examined tactile maps not only as representational products but as process-oriented wayfinding tools shaped through user experience, learning, and contextual interaction. By comparing 3D-printed tactile maps and heat-sensitive embossed paper maps within a real campus environment, the research provides empirical evidence on how production methods influence tactile perception, mental map formation, and independent navigation.
The findings demonstrate that 3D-printed tactile maps offer stronger support for tactile spatial organization and cognitive mapping, particularly in complex environments, whereas embossed paper maps provide practical advantages in terms of portability, speed of production, and accessibility. These results highlight that no single production method universally satisfies all wayfinding needs; instead, effectiveness depends on the interaction between material properties, user experience, and spatial features.
The open-ended survey responses provided critical insights that could not be captured through structured questions alone. Participants articulated individual experiences related to tactile map usability, anxiety during independent navigation, mental map formation, and expectations for future map designs. These qualitative findings complemented the quantitative results by explaining why certain production methods were perceived as more effective and by revealing user-driven design needs such as portability, simplification, and training support. Consequently, the open-ended responses played a key role in interpreting the quantitative trends and in shaping the study’s conclusions, which positioned tactile maps as process-oriented wayfinding tools rather than static accessibility artifacts.
Importantly, the study reinforces the view that tactile maps should be understood as dynamic components of a broader wayfinding process rather than static accessibility artifacts. Participants’ experiences revealed that pre-navigation learning, familiarity, confidence development, and awareness of tactile map availability are central to successful independent mobility. Several participants indicated that tactile maps can only effectively support navigation when users are informed about their existence, understand how to access and interpret them, and receive sufficient orientation or training before real-world use. Moreover, the strong demand for training and user participation suggests that tactile maps reach their full potential only when supported by learning-oriented, participatory, and multimodal accessibility frameworks integrating tactile, visual, and audio guidance elements.
An important implication of this study is the necessity of systematic map-reading education for users with visual impairments. The findings demonstrate that the effectiveness of tactile maps depends not only on their production methods and technical characteristics but also on users’ familiarity with map symbols, legends, scales, and spatial conventions, as well as on the broader social and institutional support available during orientation processes. Several participants reflected on their first experiences navigating the university campus and emphasized the importance of assistance provided by peers, family members, university accessibility offices, and orientation services in developing confidence and spatial familiarity. These experiences suggest that tactile maps alone may not fully support independent navigation unless accompanied by orientation training, guided introduction to campus environments, and accessible support systems. Therefore, integrating map-reading education into university orientation programmes, accessibility units, rehabilitation services, and peer-support practices should be considered an essential component of inclusive wayfinding systems rather than an optional supplement.
Despite its contributions, the study is limited by its sample size, single-campus context, and the scope of production technologies examined. Future research could expand this framework by incorporating larger and more diverse user groups, alternative fabrication methods, and digital or hybrid tactile-audio systems. Integrating tactile maps into adaptive, multisensory wayfinding ecosystems represents a promising direction for advancing inclusive spatial design.

8. Limitations

Although the study provides important insights into the experiential use of tactile maps in real-world navigation contexts, several limitations should be considered when interpreting the findings. First, the study was conducted with a relatively small participant group within a single university campus environment. While this context provided a controlled and accessible setting for field-based experimentation, the findings may not be directly transferable to other spatial environments with different structural characteristics or navigation complexities.
Second, the study focused specifically on two tactile map production methods 3D printing and heat-sensitive embossed paper selected because of their accessibility, practicality, and contrasting material characteristics. Other tactile production techniques, such as thermoforming or CNC-based fabrication, were beyond the scope of the research and may produce different experiential outcomes.
In addition, participants demonstrated varying levels of tactile map familiarity, Braille literacy, and navigation experience, which may have influenced perception and wayfinding performance. Because the study adopted an exploratory mixed-methods design with descriptive analysis, the findings should be interpreted as experience-based and contextual rather than statistically generalizable.
Future research may benefit from larger and more diverse participant groups, cross-cultural comparisons, and the integration of interactive or digital tactile technologies. Further studies conducted across different urban and institutional environments may also contribute to a broader understanding of how tactile cartographic systems support independent mobility and spatial cognition in everyday navigation contexts.
The study was conducted within a single campus environment to ensure participant safety and experimental control. While this context provided a realistic and secure setting, it limits generalizability to other spatial configurations. Additionally, participants represented diverse levels of prior tactile map experience, visual impairment conditions, and navigation familiarity, which strengthened the study by allowing the evaluation of tactile map usability across a heterogeneous user group. The consistency of participant responses despite these differences suggests that the findings may reflect broader experiential patterns rather than highly individualized perceptions.
The production of tactile maps is subject to several physical and technical constraints that influence their usability and design. In particular, the maximum printable size is limited by printer dimensions and material characteristics, which may require large environments to be represented across multiple map sections. Such segmentation can interrupt spatial continuity and introduce tactile seams that users may mistakenly interpret as actual spatial features. In addition, large-format tactile maps are generally less portable, reducing their practicality for use during active navigation and independent mobility tasks.
Another important consideration is the balance between readability and spatial detail. As map size decreases, stronger cartographic generalization becomes necessary to preserve tactile distinguishability and prevent perceptual overload. This often requires the removal or simplification of secondary spatial features while retaining essential navigation information. Furthermore, updating tactile maps in response to environmental changes may require partial or complete reproduction, increasing production effort and reducing long-term flexibility. These challenges affect both embossed and 3D-printed tactile maps, although some constraints, such as segmentation and tactile seams, are particularly relevant to large-scale 3D-printed productions.

Supplementary Materials

The following supporting information can be downloaded at: https://www.mdpi.com/article/10.3390/ijgi15070326/s1, Table S1: Survey questions for this research paper.

Author Contributions

Conceptualization, Ayça Eraslan, Ahmet Özgür Doğru and Nesibe Necla Uluğtekin; methodology, Ayça Eraslan, Ahmet Özgür Doğru and Nesibe Necla Uluğtekin; software, Ayça Eraslan; validation, Ayça Eraslan, Ahmet Özgür Doğru and Nesibe Necla Uluğtekin; formal analysis, Ayça Eraslan; investigation, Ayça Eraslan; resources, Ayça Eraslan, Ahmet Özgür Doğru and Nesibe Necla Uluğtekin; data curation, Ayça Eraslan; writing—original draft preparation, Ayça Eraslan; writing—review and editing, Ahmet Özgür Doğru and Nesibe Necla Uluğtekin; visualization, Ayça Eraslan; supervision, Ahmet Özgür Doğru and Nesibe Necla Uluğtekin. All authors have read and agreed to the published version of the manuscript.

Funding

This research received no external funding.

Data Availability Statement

Enquiries about data availability should be directed to the authors.

Conflicts of Interest

The authors declare no conflict of interest.

References

  1. Rosli, H.F.; Safura, A.S.; Nur, F.T. Challenges and solutions in teaching and learning for students with disabilities in higher education institutions. J. Quran Sunnah Educ. Spec. Needs 2024, 8, 15–32. [Google Scholar] [CrossRef]
  2. Pissaloux, E.; Velazquez, R.; Gay, S. Tactile Technologies to Support Spatial Cognition and Mobility inpeople with visual impairments People. In Mobility of People with Visual Impairments People: Fundamentals and ICT Assistive Technologies; Springer Nature: Cham, Switzerland, 2026; pp. 429–452. [Google Scholar]
  3. Hersh, M.A.; Johnson, M.A. Assistive Technology Forpeople with Visual Impairments and Blind People; Springer: London, UK, 2008. [Google Scholar] [CrossRef]
  4. Lobben, A.K. The Role of Maps in Virtual Environments. Cartogr. Geogr. Inf. Sci. 2005, 32, 259–271. [Google Scholar]
  5. Wabiński, J.; Mościcka, A. Automatic (Tactile) Map Generation—A Systematic Literature Review. ISPRS Int. J. Geo-Inf. 2019, 8, 293. [Google Scholar] [CrossRef]
  6. Edman, P. Tactile Graphics; American Foundation for the Blind: New York, NY, USA, 1992. [Google Scholar]
  7. Barvir, R.; Vondrakova, A.; Brus, J. Efficient Interactive Tactile Maps: A Semi-Automated Workflow Using the TouchIt3D Technology and OpenStreetMap Data. ISPRS Int. J. Geo-Inf. 2021, 10, 505. [Google Scholar] [CrossRef]
  8. Zacharogiorga-Sourdi, A.; Kokla, M.; Tomai, E. Evaluation of the Usability of 3D Thematic Maps: A Survey with Students with visual impairments. Br. J. Vis. Impair. 2023, 41, 646–661. [Google Scholar]
  9. Crawford, K.; Posada, J.; Okueso, Y.E.; Higgins, E.; Lachin, L.; Hamidi, F. Inquiry into Accessibility Service Possibilities for Blind and Low-Vision University Students through Co-Designing a 3D-Printed Tactile Campus Map. J. Enabling Technol. 2026, 20, 73–87. [Google Scholar]
  10. Golledge, R.G. Wayfinding Behavior: Cognitive Mapping and Other Spatial Processes; Johns Hopkins University Press: Baltimore, MD, USA, 1999. [Google Scholar]
  11. Robinson, W.I. Remapping development in light of globalisation: From a territorial to a social cartography. Third World Q. 2002, 23, 1047–1071. [Google Scholar] [CrossRef]
  12. Ungar, S.; Blades, M.; Spencer, C. The Construction of Cognitive Maps by Children with Visual Impairments. In The Construction of Cognitive Maps; Portugali, J., Ed.; Springer: Dordrecht, The Netherlands, 1996; pp. 247–273. [Google Scholar]
  13. Papadopoulos, K.; Koustriava, E.; Kartasidou, L. The Impact of Tactile Maps on Spatial Learning of Students with Visual Impairments. J. Vis. Impair. Blind. 2011, 105, 484–495. [Google Scholar]
  14. Aydın, S.; Kara, H. Üniversite Kampüslerinde Görme Engelliler İçin Dokunsal Harita Uygulamalarının Değerlendirilmesi. Mimar. Ve Plan. Araştırmaları Derg. 2021, 5, 145–162. [Google Scholar]
  15. Yıldız, A.; Arslan, F. Görme Engelli Bireylerde Dokunsal Harita Okuryazarlığı ve Mekânsal Algı. Özel Eğitim Derg. 2018, 19, 211–229. [Google Scholar] [CrossRef]
  16. Mościcka, A.; Śmiechowska-Petrovskij, E.; Wabiński, J.; Araszkiewicz, A.; Kiliszek, D. Methodical testing of tactile cartographic signs in isolation and in context. Cartogr. Geogr. Inf. Sci. 2025, 52, 181–198. [Google Scholar]
  17. Brock, A.M.; Truillet, P.; Oriola, B.; Picard, D.; Jouffrais, C. Interactivity Improves Usability of Geographic Maps forpeople with visual impairments People. Hum.-Comput. Interact. 2015, 30, 156–194. [Google Scholar] [CrossRef]
  18. Gual, J.; Puyuelo, M.; Lloveras, J. Designing Tactile Maps for Users with visual impairments. J. Vis. Impair. Blind. 2014, 108, 285–298. [Google Scholar]
  19. Montello, D.R. Navigation. In The Cambridge Handbook of Visuospatial Thinking; Shah, P., Miyake, A., Eds.; Cambridge University Press: Cambridge, UK, 2005; pp. 257–294. [Google Scholar]
  20. Lippke, S.; Anand Kumar, V. Codesign and Cocreation with People with Disabilities. In The Palgrave Encyclopedia of Disability; Palgrave Macmillan: Cham, Switzerland, 2025; pp. 1–23. [Google Scholar] [CrossRef]
  21. Haklay, M. Citizen Science and Volunteered Geographic Information: Overview and Typology of Participation. In Crowdsourcing Geographic Knowledge; Sui, D.Z., Elwood, S., Goodchild, M., Eds.; Springer: Dordrecht, The Netherlands, 2013; pp. 105–122. [Google Scholar]
  22. Roth, R.E. Interactive Maps: What We Know and What We Need to Know. J. Spat. Inf. Sci. 2013, 6, 59–115. [Google Scholar] [CrossRef]
  23. Wiener, J.M.; Büchner, S.J.; Hölscher, C. Taxonomy of Human Wayfinding Tasks. Spat. Cogn. Comput. 2009, 9, 152–165. [Google Scholar] [CrossRef]
  24. Altı Nokta Körler Vakfı. Harita/Kroki Atölyesi Çalışma Raporu (Proje No: TR10/18/ÇVG/0093); Dokunsal Materyal Atölyesi/Kütüphanesi Projesi: İstanbul, Türkiye, 2018. [Google Scholar]
  25. OpenStreetMap Contributors. OpenStreetMap Contributors. OpenStreetMap. Available online: https://www.openstreetmap.org (accessed on 13 May 2026).
  26. World Medical Association. World Medical Association Declaration of Helsinki: Ethical principles for medical research involving human participants. JAMA 2025, 333, 71–74. [Google Scholar] [CrossRef]
  27. Giudice, N.A.; Legge, G.E. Blind Navigation and the Role of Technology. In Foundations of Orientation and Mobility, 2nd ed.; Wiener, W.R., Welsh, R.L., Blasch, B.B., Eds.; AER Press: New York, NY, USA, 2008; pp. 479–500. [Google Scholar]
  28. Cakmak, Z.; Demir, M. Kamusal Alanlarda Dokunsal Harita Tasarımının Erişilebilirlik Açısından İncelenmesi. Kent. Çalışmaları Derg. 2020, 12, 87–104. [Google Scholar]
  29. Kalantari, M.; Castro, A.F. Accessibility of Spatial Information forpeople with visual impairments People. Trans. GIS 2015, 19, 245–264. [Google Scholar] [CrossRef]
  30. Sargsyan, E.; Oriola, B.; Serrano, M.; Jouffrais, C. Audio-vibratory you-are-here mobile maps for people with visual impairments. Proc. ACM Hum.-Comput. Interact. 2024, 8, 551. [Google Scholar] [CrossRef]
  31. Ozdemir, E.; Yılmaz, T. Görme Engelliler İçin Dokunsal Haritalarda Sembol ve Braille Kullanımı Üzerine Bir Değerlendirme. Harit. Derg. 2019, 161, 23–38. [Google Scholar]
  32. Paladugu, S.; Sreekanth, V.; Reddy, C.S. 3D Printed Tactile Maps for Inclusive Navigation. Int. J. Hum.-Comput. Stud. 2020, 136, 102376. [Google Scholar] [CrossRef]
  33. Roth, R.E. Visual Variables. In The International Encyclopedia of Geography: People, the Earth, Environment and Technology; John Wiley & Sons, Ltd.: Hoboken, NJ, USA, 2016; Volume 15, pp. 1–11. [Google Scholar] [CrossRef]
  34. Schiff, W.; Foulke, E. (Eds.) Tactual Perception: A Sourcebook; Cambridge University Press: Cambridge, UK, 1982. [Google Scholar]
  35. Slocum, T.A.; McMaster, R.B.; Kessler, F.C.; Howard, H.H. Thematic Cartography and Geovisualization; CRC Press: Boca Raton, FL, USA, 2022. [Google Scholar]
  36. van Altena, V.; Rijnberk, D.; Kuijer, M.; Jansen, J.; Min, E.; van Welbergen, A.; Nauta, J. Tailoring tactile maps based on blind users’ needs. In Proceedings of the ICA; Copernicus Publications: Göttingen, Germany, 2023; Volume 5, p. 22. [Google Scholar]
  37. Wabiński, J.; Mościcka, A.; Śmiechowska-Petrovskij, E. Comparative Evaluation of Production Techniques for Tactile Map Rendering. IEEE Trans. Tactiles 2025, 19, 54–66. [Google Scholar]
  38. Tran, C.M.; Bach, N.G.; Tan, P.X.; Kamioka, E.; Kanamaru, M. Enabling self-practice of digital audio–tactile maps for visually impaired people by large language models. Electronics 2024, 13, 2395. [Google Scholar] [CrossRef]
  39. Gotlib, D.; Lipka, K.; Świech, H. Interactive indoor audio-map as a digital equivalent of the tactile map. Appl. Sci. 2025, 15, 8975. [Google Scholar] [CrossRef]
  40. Eraslan, A.; Ulugtekin, A.O.D.; Ulugtekin, N.N. Towards Standardized Tactile Map Design for the Visually Impaired: A Systematic Review of Cartographic Practices. In Proceedings of the 10ICCGIS2026: 10th International Conference on Cartography and GIS, Nessebar, Bulgaria, 14–19 June 2026. (In Press)
Figure 1. Boğaziçi University’s North Campus [25].
Ijgi 15 00326 g001
Figure 2. Generalized map (3D-printed tactile map).
Ijgi 15 00326 g002
Figure 3. Generalized map (embossed paper tactile map).
Ijgi 15 00326 g003
Figure 4. Research flowchart.
Ijgi 15 00326 g004
Figure 5. Map viewing in Touchmapper software.
Ijgi 15 00326 g005
Figure 6. Piaf embossing machine (printing tactile map on swell paper).
Ijgi 15 00326 g006
Figure 7. Image of the map to be printed in the X Desktop Slicing Software.
Ijgi 15 00326 g007
Figure 8. Map obtained from a 3D printer.
Ijgi 15 00326 g008
Table 1. Characteristics of selected participants (coded).
CodeVisual StatusBraille Literacy Prior Tactile Map ExperienceCampus FamiliarityDominant Navigation Strategy
ALegally blindYesHighMediumMental mapping + cane
BLegally blindYesMediumMediumRoute memorization
CLegally blindNoLowLowVerbal guidance
DLow
vision
YesHighHighLandmark-based navigation
ELegally blindYesHighHighMental map + spatial structure
FLow
vision
YesMediumMediumVisual–tactile integration
GLegally blindYesMediumLowTrial-and-error navigation
HLegally blindYesLowMediumCane + environmental cues
ILow visionYesHighHighVisual memory + tactile support
JLegally blindNoLowLowExternal assistance
KLegally blindYesMediumHighRoute learning
LLow visionYesLowLowTechnology-assisted navigation
MLegally blindYesLowMediumSequential tactile exploration
NLegally blindYesHighHighAdvanced mental mapping
OLow visionYesMediumHighHybrid visual–tactile strategy
Table 2. Comparative summary of the two experimental designs.
Experimental StageStage 1: Tactile Map Review and Perception AssessmentStage 2: Field Navigation and Usage Experience
Main ObjectiveTo evaluate how different tactile map production techniques influence initial tactile interpretation, map readability, and perceptual usabilityTo examine how tactile maps support real-world navigation, spatial orientation, and independent mobility
Research DesignMixed-methods experimental evaluation with quantitative emphasis supported by qualitative feedbackMixed-methods field-based evaluation with qualitative emphasis supported by observational and quantitative measurements
Participantsn = 15 people with visual impairments, university students (66.7% blind; 33.3% partially sighted)Same participant group; measures experimental design
Experimental EnvironmentControlled indoor evaluation environmentReal-world campus environment (Boğaziçi University North Campus)
Tactile Map Production Techniques• 3D-printed tactile map • Heat-sensitive embossed paper tactile map• 3D-printed tactile map • Heat-sensitive embossed paper tactile map
Experimental ProcedureParticipants manually explored each tactile map without a strict time limitation and evaluated tactile symbols, textures, legends, spatial organization, and overall readability. Structured questionnaires and open-ended feedback forms were administered after each evaluation session.Participants first examined the tactile maps and then completed a predefined navigation route between the same starting and target locations within the campus environment. Navigation behaviour, route completion, hesitation points, wrong turns, and assistance requests were systematically observed and recorded.
Independent Variables• Tactile map production technique• Tactile map production technique • Real-world spatial complexity
Evaluation Metrics/Indicators• Map clarity (ease of understanding spatial organization) • Tactile distinguishability (ability to differentiate tactile elements) • Symbol readability (ease of identifying tactile symbols and legends) • Mental map perception (ability to cognitively organize spatial structure) • User satisfaction• Navigation success (successful arrival at target destination) • Route completion time • Confidence level during navigation • Anxiety level during movement • Perceived independent mobility
Data Collection Tools• Structured questionnaires • Open-ended questions • User feedback forms• Observation forms • Time measurements • Post-navigation interviews • User feedback forms
Researcher InterventionResearchers provided procedural explanations but did not guide tactile interpretation during exploration tasks.Participants navigated independently; researchers intervened only in situations involving safety concerns or explicit participant requests for assistance.
Process RecordingMap exploration duration and participant feedback were recorded for each tactile map condition.Route completion time, hesitation points, navigation errors, assistance requests, and participant movement behaviours were documented throughout the navigation process.
Key Analytical FocusInitial tactile interaction, perceptual interpretation, and tactile usability of different map production techniquesReal-world usability, route comprehension, spatial orientation, and independent navigation performance
Main FindingsDifferent tactile production techniques influenced tactile distinguishability, map readability, and perceived usability during the first interaction.Tactile maps supported confidence, spatial orientation, and independent movement during real-world navigation tasks.
Contribution to LiteratureProvides empirical evidence regarding how tactile production characteristics influence initial tactile perception and cognitive interpretation.Demonstrates that tactile maps function as experiential navigation tools shaped by contextual interaction, spatial cognition, and user experience.
Table 3. Visual Acuity.
TagsFrequency (n)Percentage (%)
Low vision533.3
Legally blind1066.7
Total15100
Table 4. Functional Braille literacy of participants.
TagFrequency (n)Percentage (%)
Yes1386.7
No213.3
Total15100
Table 5. Colour knowledge level of geographic and spatial features on campus.
TagFrequency (n)Percentage (%)
Yes960
No640
Total15100
Table 6. Encountering colour tagging of campus buildings.
TagFrequency (n)Percentage (%)
Yes853.3
No746.7
Total15100
Table 7. Ease of access to different faculties or campuses.
TagFrequency (n)Percentage (%)
Yes1173.3
No426.7
Total15100
Table 8. Assessment of problems experienced in reaching the target location alone for the first time.
TagFrequency (n)Percentage (%)
Yes, I was worried1066.7
No, I didn’t have any problems533.3
Total15100
Table 9. Tactile map recognition.
TagFrequency (n)Percentage (%)
Yes1280
No320
Total15100
Table 10. Usage status of colour-tagged tactile maps.
TagFrequency (n)Percentage (%)
Yes640
No960
Total15100
Table 11. Meaningfulness of colour tagging.
TagFrequency (n)Percentage (%)
Yes, it makes sense746.7
No, it doesn’t make sense853.3
Total15100
Table 12. Request for tactile map training.
TagFrequency (n)Percentage (%)
Yes1386.7
No213.3
Total15100
Table 13. Unassisted mobility experience by providing mental maps with tactile maps.
TagFrequency (n)Percentage (%)
Yes960
No640
Total15100
Table 14. Belief that spatial information provides ease of use.
TagFrequency (n)Percentage (%)
Yes, it provides convenience1493.3
No, it does not contribute16.7
Total15100
Table 15. The need for methods to encourage user participation.
TagFrequency (n)Percentage (%)
Yes, it should be considered1173.3
No, it’s not necessary426.7
Total15100
Table 16. Importance level of tactile map features.
Importance Level (1–5)Frequency (n)Percentage (%)
1. Not important at all00
2. Slightly important16.7
3. Undecided16.7
4. Important426.7
5. Very important960
Total15100
Table 17. Comparative evaluation of tactile map production methods (n = 15).
Evaluation Criteria3D Printed Map (n)Embossed Paper Map (n)
General comprehensibility/clarity105
Distinguishing spatial relationships (building–path–space)114
Contribution to mind mapping96
Assisting in navigation87
Portability and ease of use411
Table 18. Comparative analysis of 3D-printed and swell paper tactile maps: results from the Wilcoxon signed-rank test.
Evaluation CriterionPreferred Map TypeZ Valuep
Value
Interpretation
Map Clarity3D Printed−2.4120.016Significant difference in favour of 3D-printed maps
Tactile Distinguishability3D Printed−2.7310.006Strong tactile differentiation in 3D maps
Ease of Reading3D Printed−2.1180.034Improved readability in 3D tactile structures
Mental Map Formation3D Printed−2.8450.004Enhanced support for spatial cognition
PortabilityEmbossed Paper−2.0210.043Embossed maps perceived as easier to carry
Rapid AccessibilityEmbossed Paper−1.9920.046Faster immediate usage perception
Table 19. Thematic coding distribution according to participant opinions (n = 15).
Theme CodeThematic AreaNumber of
Participants (n)
T1Familiarity with tactile maps14
T2Difficulty understanding legends and symbols10
T3Functionality of colour tagging9
T4Creating a cognitive map10
T5Anxiety about independent movement and navigation12
T6Need for portability and simplification in map design13
T7Perception of privacy and security7
T8Demand for map-reading training13
T9Suggestion for user participation in map updating11
T10Suggestion for technology-supported maps (navigation, voice map, etc.)9
Disclaimer/Publisher’s Note: The statements, opinions and data contained in all publications are solely those of the individual author(s) and contributor(s) and not of MDPI and/or the editor(s). MDPI and/or the editor(s) disclaim responsibility for any injury to people or property resulting from any ideas, methods, instructions or products referred to in the content.