


Abstract
Preventing large-scale illegal migration is one of the EU’s highest priorities. In this study, we analyze the potential for integrating and fusing remote sensor data with a wider range of data streams to enhance border security situational awareness, specifically targeting illegal migration. The aim was to develop a dynamic predictive risk analysis model to identify high-risk zones for illegal border crossings at Croatia’s external EU borders. The model’s methodological framework is based on the integration of Geographic Information Systems (GISs), Multi-Criteria Analysis (MCA), and the Analytic Hierarchy Process (AHP). The model utilizes various environmental and infrastructure variables derived from the open-source databases ESA WorldCover and OpenStreetMap to generate a categorized risk map showing areas of lowest, moderate, and highest risk for illegal border crossing. The model was quantitatively verified using a weighted detection-versus-background design against 7481 geocoded border crossing incidents, demonstrating high predictive skill and robust calibration (Continuous Boyce Index up to 0.97) when controlling for patrol effort bias and spatial autocorrelation. High-resolution historical satellite imagery showing activities related to illegal migration was used for the generation of labeled datasets for AI training. Features such as suspicious vans, river boats, tire tracks, tents, illegal campsites, and clusters of individuals were observed in high-resolution Airbus and Maxar historical satellite images. The model can be used for various practical applications, including the strategic allocation of surveillance resources and the enhancement of frontier and pre-frontier intelligence, enabling more informed actions and optimized operations.
1. Introduction
The events of the mass migration movements of 2015, caused by the civil war in Syria, highlighted the threat of illegal migration, which at times threatened to overwhelm most southeast EU member states and their border security regimes [1]. The inability to prevent such mass movements of people prompted the EU to highly prioritize border security management, including the enhancement of border surveillance capabilities, data fusion and predictive risk analysis assessment [2,3].
Although Earth Observation (EO) technology offers many opportunities for border reconnaissance and enhancement of situational awareness [4], especially when integrated with GIS-based MCA and AHP, EO is not yet routinely deployed or utilized for border security management. Current research primarily emphasizes better detection capabilities, improved automated tracking of suspicious vessels, more efficient communication between different sensors, improved information sharing among different stakeholders, and easier access to state-of-the-art technology. The main obstacle for EO security applications is the time lag between consecutive satellite images, which may be too large for a change to be noticed. However, this situation will most likely change in the near future as the deployment of new satellite constellations dramatically enhances both spatial resolution and revisit frequency. Currently, the most promising EO application that can be deployed immediately in border security management is predictive dynamic risk modeling to increase situational awareness of illegal border crossings. By utilizing free, lower-resolution satellite imagery to analyze static variables (such as slope or road proximity) and dynamic variables (such as snow cover and water levels), potential entry points for migrants can be better predicted. Such satellite images can be collected free of charge every five days, with analysis results deliverable within 24 h.
Rapid advancements in satellite technologies significantly expand the potential for EO to improve frontier and pre-frontier situational awareness. The most advanced commercial satellites currently offer five revisits per day to every location on Earth, with 10 cm resolution for optical imagery and 2 m resolution for thermal imagery [5]. Given the high administrative and socio-economic costs associated with the repatriation or assimilation of illegal migrants, it is economically viable to prevent their movement before they reach the EU’s external border. Suspicious movements or the buildup of large numbers of people and vehicles near international borders provide a critical early warning system. The use of near-real-time EO to track dispersal patterns or multi-vectored approaches towards the border may further enhance border security situational awareness.
The Global Monitoring for Stability and Security (GMOSS Network of Excellence) research project (EU FP6, 2004–2008) was the first comprehensive European effort to evaluate the potential of EO technologies in supporting border security management [6]. As part of this project, researchers at the Joint Research Centre (JRC) focused particularly on the potential use of satellite imagery to monitor migrant flows across borders. Within this project, the scientists developed a GIS-based “border permeability model” that considers the likelihood of illegal border crossings by immigrants [7]. This model is similar to the risk assessment analysis conducted in this study, although JRC researchers focused on assessing the likelihood that migrants could “walk” through the border undetected, i.e., “hide” from the police surveillance system while crossing the border illegally. Since then, the migration paradigm has changed, as over 90% of illegal migrants use the services of organized criminal groups for part or all of their journey to the EU [8]. Thus, the availability of transportation and existing infrastructure were considered the most important parameters in the risk analysis method developed in the present study.
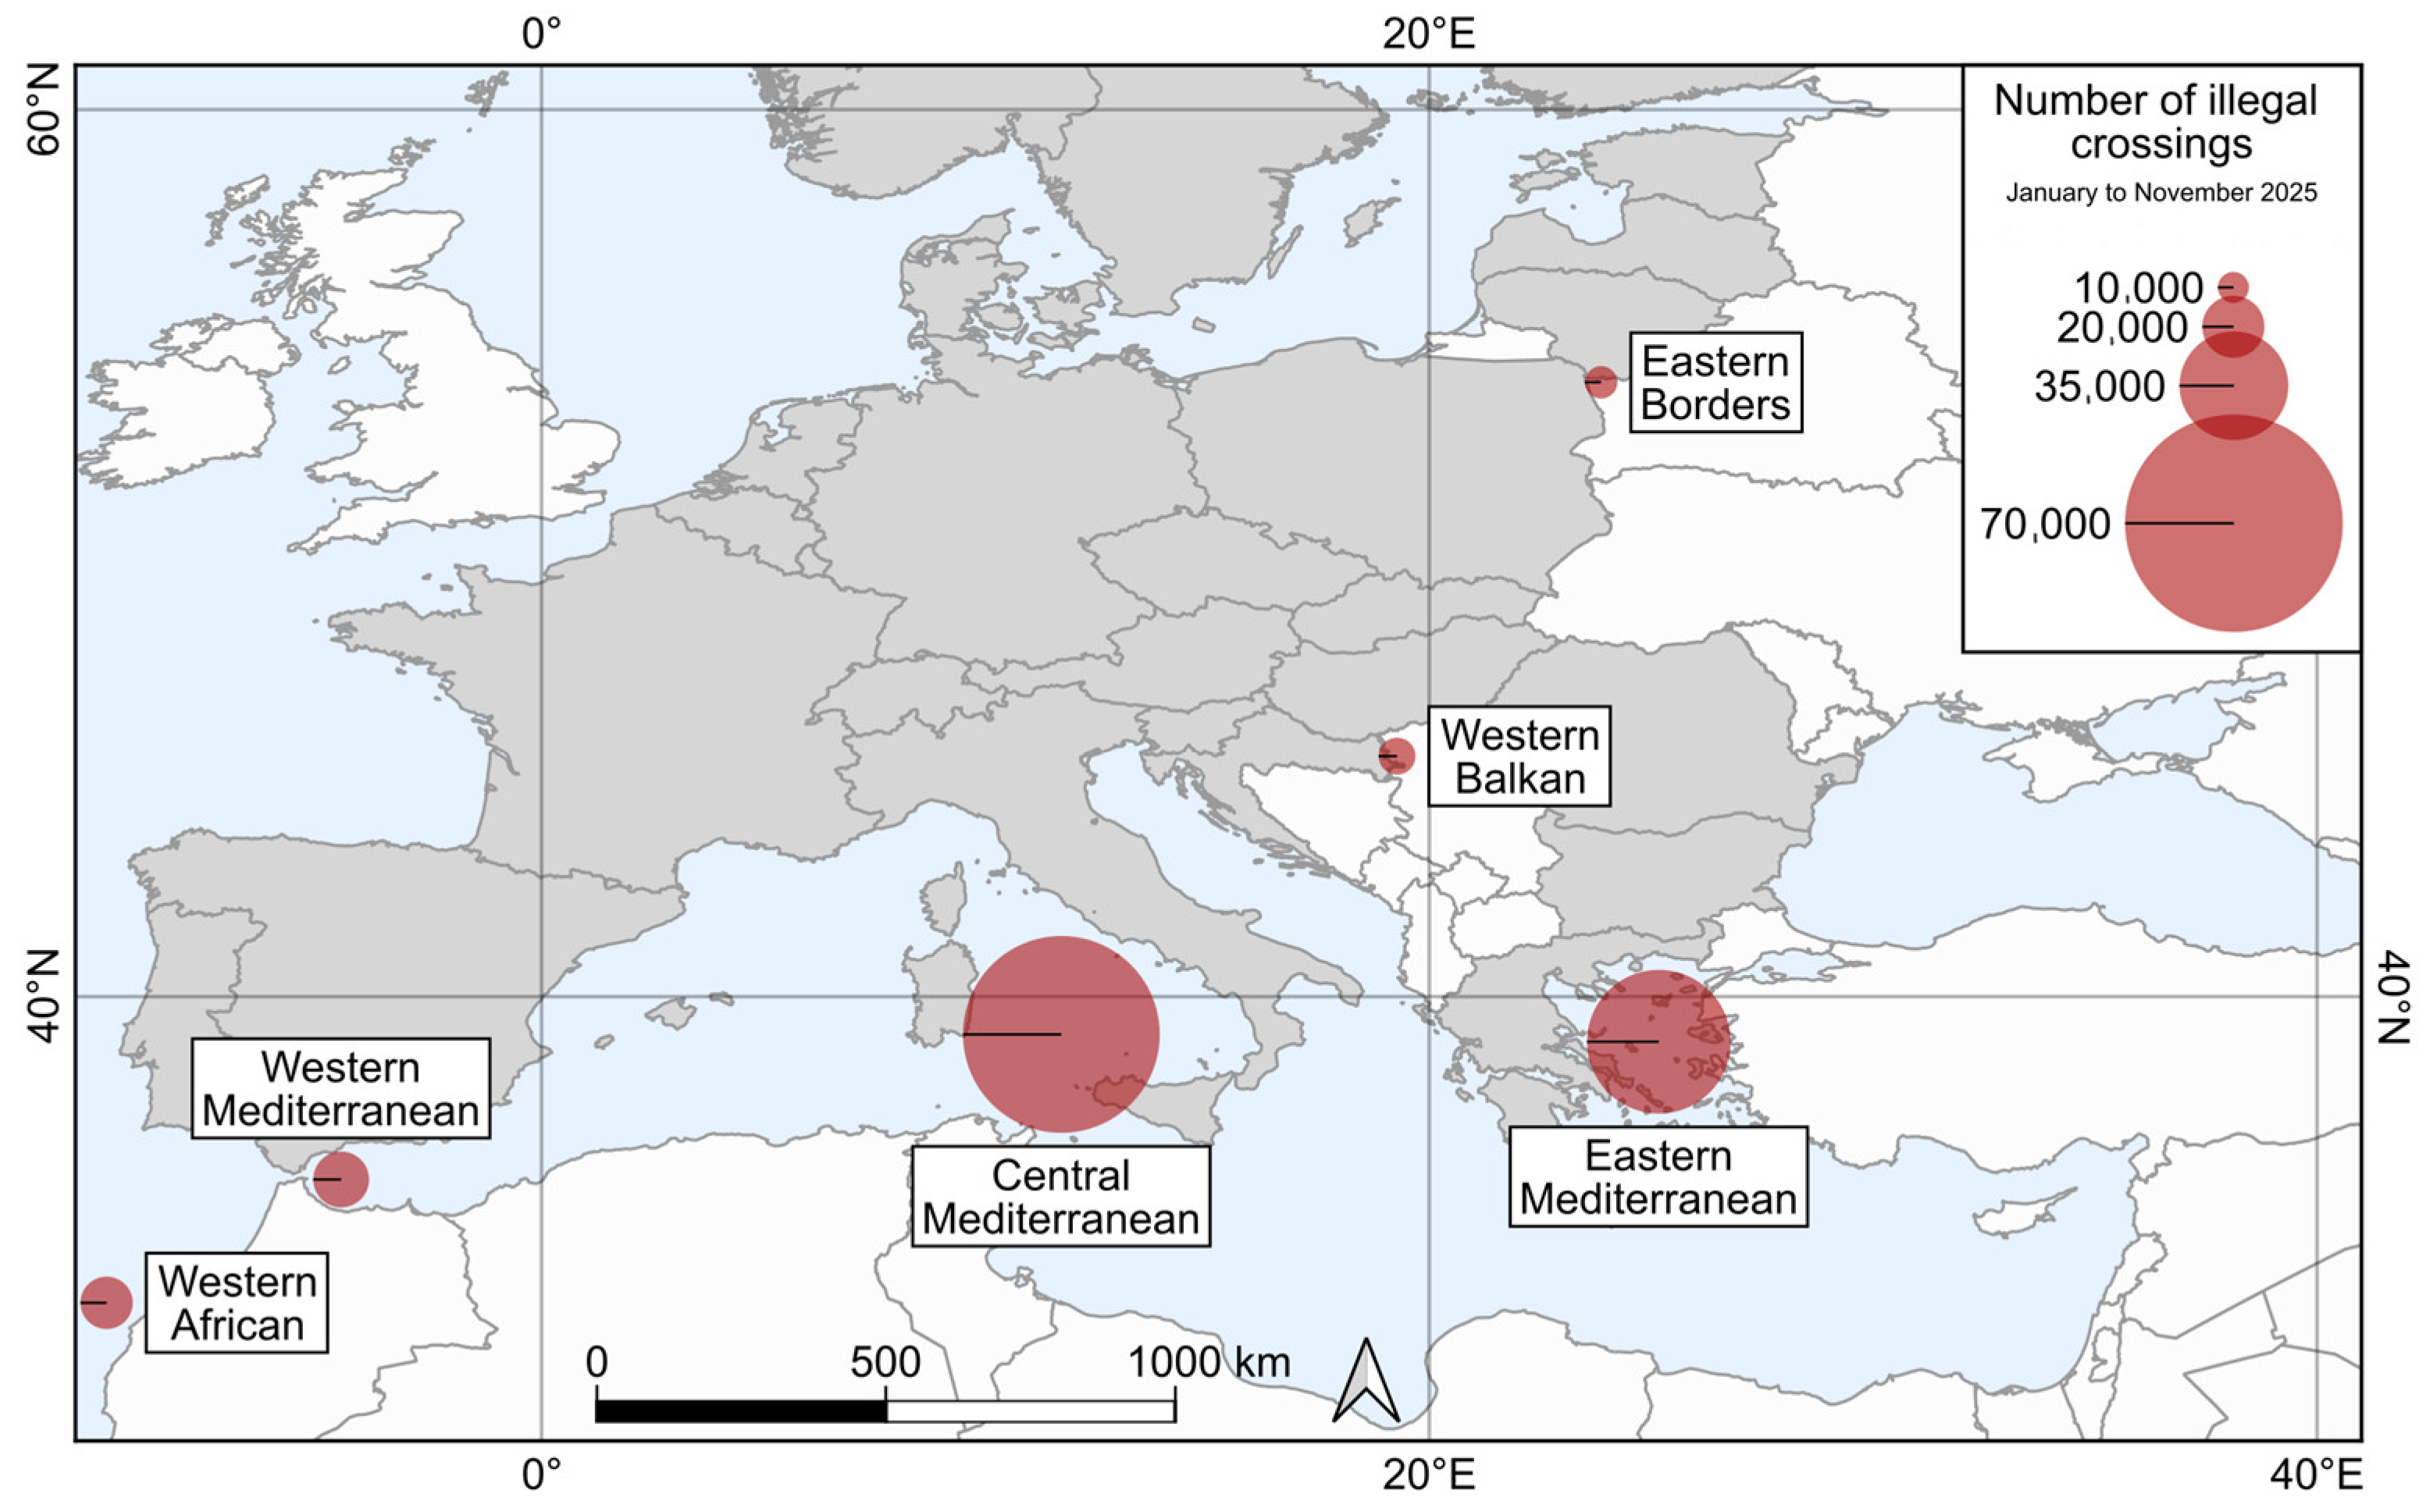
Croatia is the EU entry point for the Western Balkan migratory route, which is one of the main migratory corridors into Europe and includes Bulgaria, Romania, Hungary, and Croatia at the land borders with countries from the Western Balkan region. Table 1 shows the number of illegal crossings on the Western Balkan and other primary EU migratory routes during the period 2015–2025. Figure 1 shows a map of primary EU migratory entry points and the number of detected illegal border crossings in 2025.
Table 1.
Detection of illegal border crossing across primary EU entry routes (2015–2025). Data adapted from [9].
Figure 1.
Primary EU migratory entry points and the number of detected illegal border crossings in 2025 [9].
The main objective of this study is to develop a GIS-based MCA model using the AHP to identify likely paths for illegal border crossings by immigrants. The AHP is one of the most advantageous weight determination methods for MCA, primarily due to its flexibility, transparency, and comprehensive structure [10]. By integrating EO data on land cover, slope, weather and distance to infrastructure with the AHP, this dynamic model can be easily adapted to real-time environmental and socio-political circumstances to predict high-risk border crossing zones for illegal migration. This methodology can be effectively integrated into existing GIS-based frameworks for border management to optimize sensor placement and enhance frontier and pre-frontier situational awareness.
2. Materials and Methods
2.1. Study Area
Croatia is a unique and complex study area for EO integration into border security management, due to its diverse and challenging topography and its geographic position as a gateway to the EU via the Western Balkan migration route. As a member of the Schengen Area since 2023, Croatia manages one of the longest external land borders of the EU, making it a focal point for security research and technological testing. This study focuses on the Croatian land borders, which total 2374.9 km [11]. Croatia shares external EU boundaries with three countries: Bosnia and Herzegovina (1011.4 km), Serbia (317.6 km), and Montenegro (22.6 km) [11]. Within the EU, on the land, it borders Hungary (355.5 km) and Slovenia (667.8 km) [11]. The Croatian borders encompass diverse continental, mountainous, and maritime environments. According to the Köppen–Geiger classification, the region is dominated by a temperate rainy climate, characterized by mean monthly temperatures ranging between −3 °C and 18 °C during the coldest months [12].
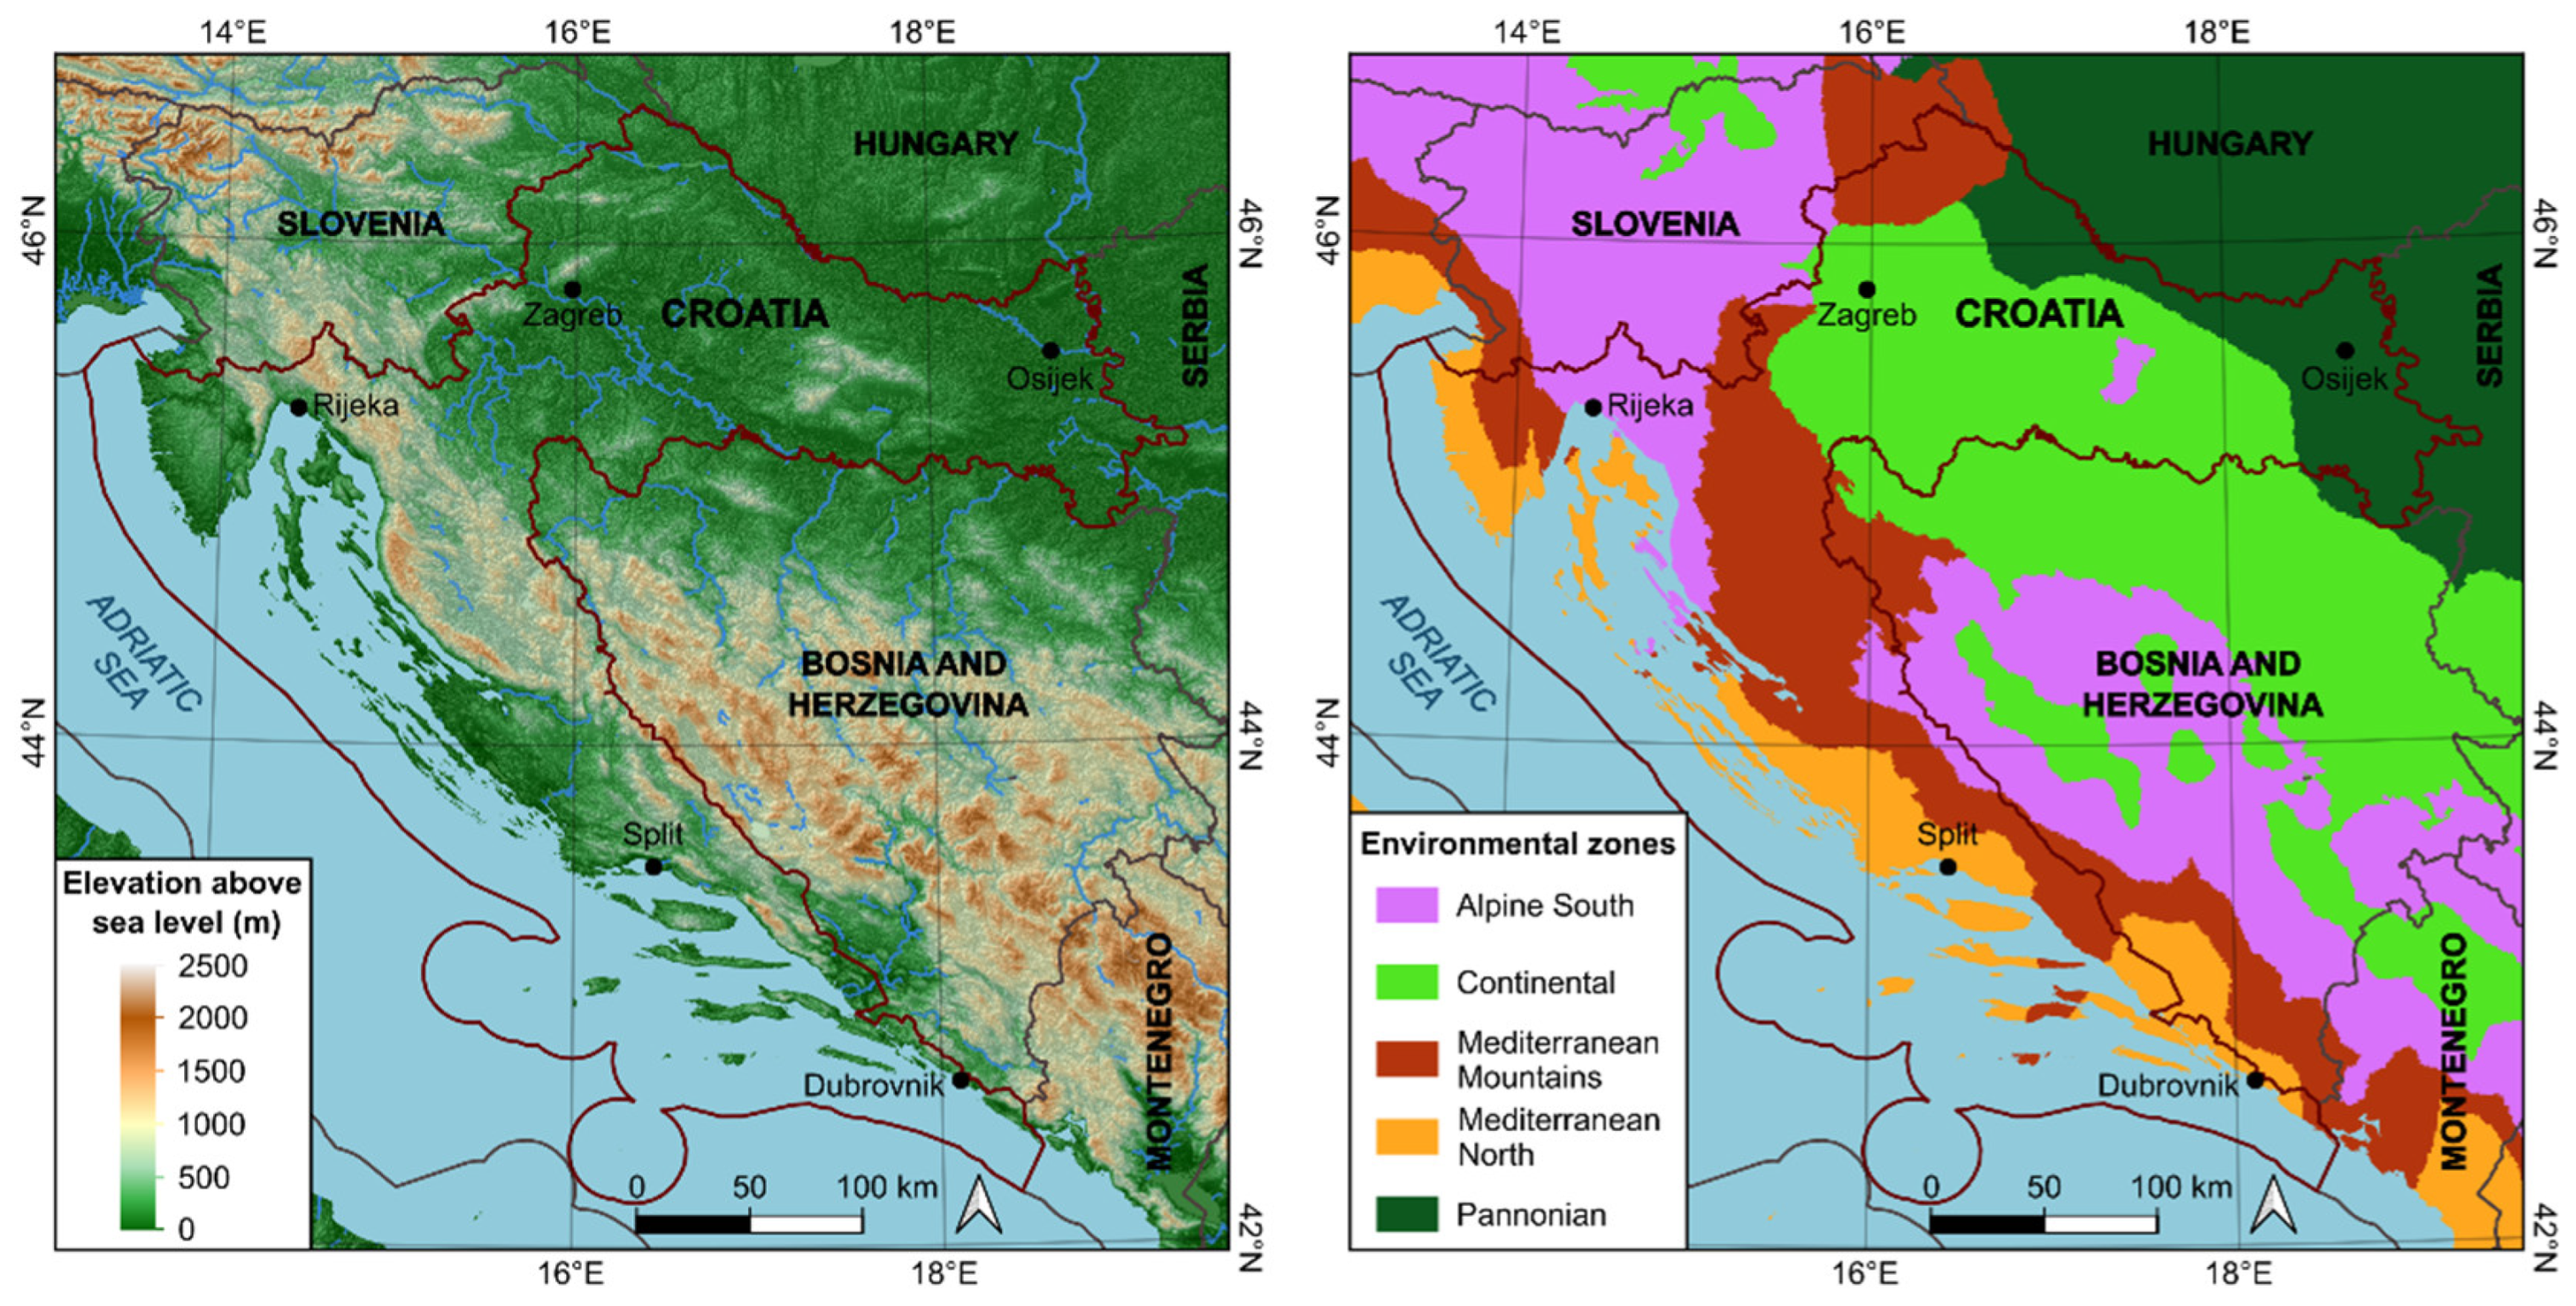
Croatia is primarily a transit country on the Western Balkan migratory route. Illegal migration flows originate mainly from the Middle East and North Africa, with final destinations in Western and Northern Europe [9]. Pressure on the border with Bosnia and Herzegovina is particularly high. The border areas include the dense forests and rugged karst terrain of the Dinarides. Large sections of the Croatian external EU border are defined by rivers (Sava, Drava, Danube, and Una). A regional map of Croatia, integrating digital elevation model (DEM) and climate classification, is shown in Figure 2. Although migrants rely heavily on transport, often organized by criminal groups, they mostly cross the border on foot. In this study, the 6 km area around the border line was considered for risk analysis of illegal border crossings, as this distance corresponds to about one hour of walking before and after crossing the border by an average person at an average speed. It should be noted that organized criminal groups use transportation to deliver migrants to these 6 km “drop-off” zones, after which the final crossing is typically performed on foot.
Figure 2.
Regional map of Croatia showing topography (left) [13] and climate zones (right) [13,14].
2.2. Criteria Definitions
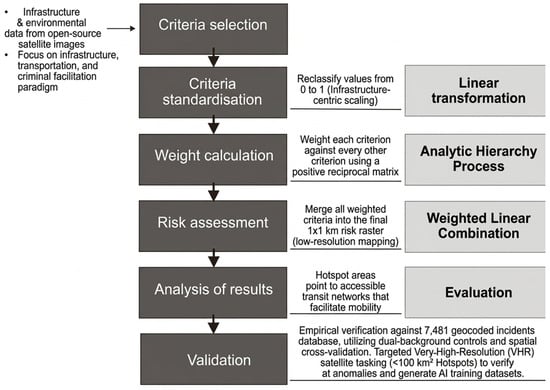
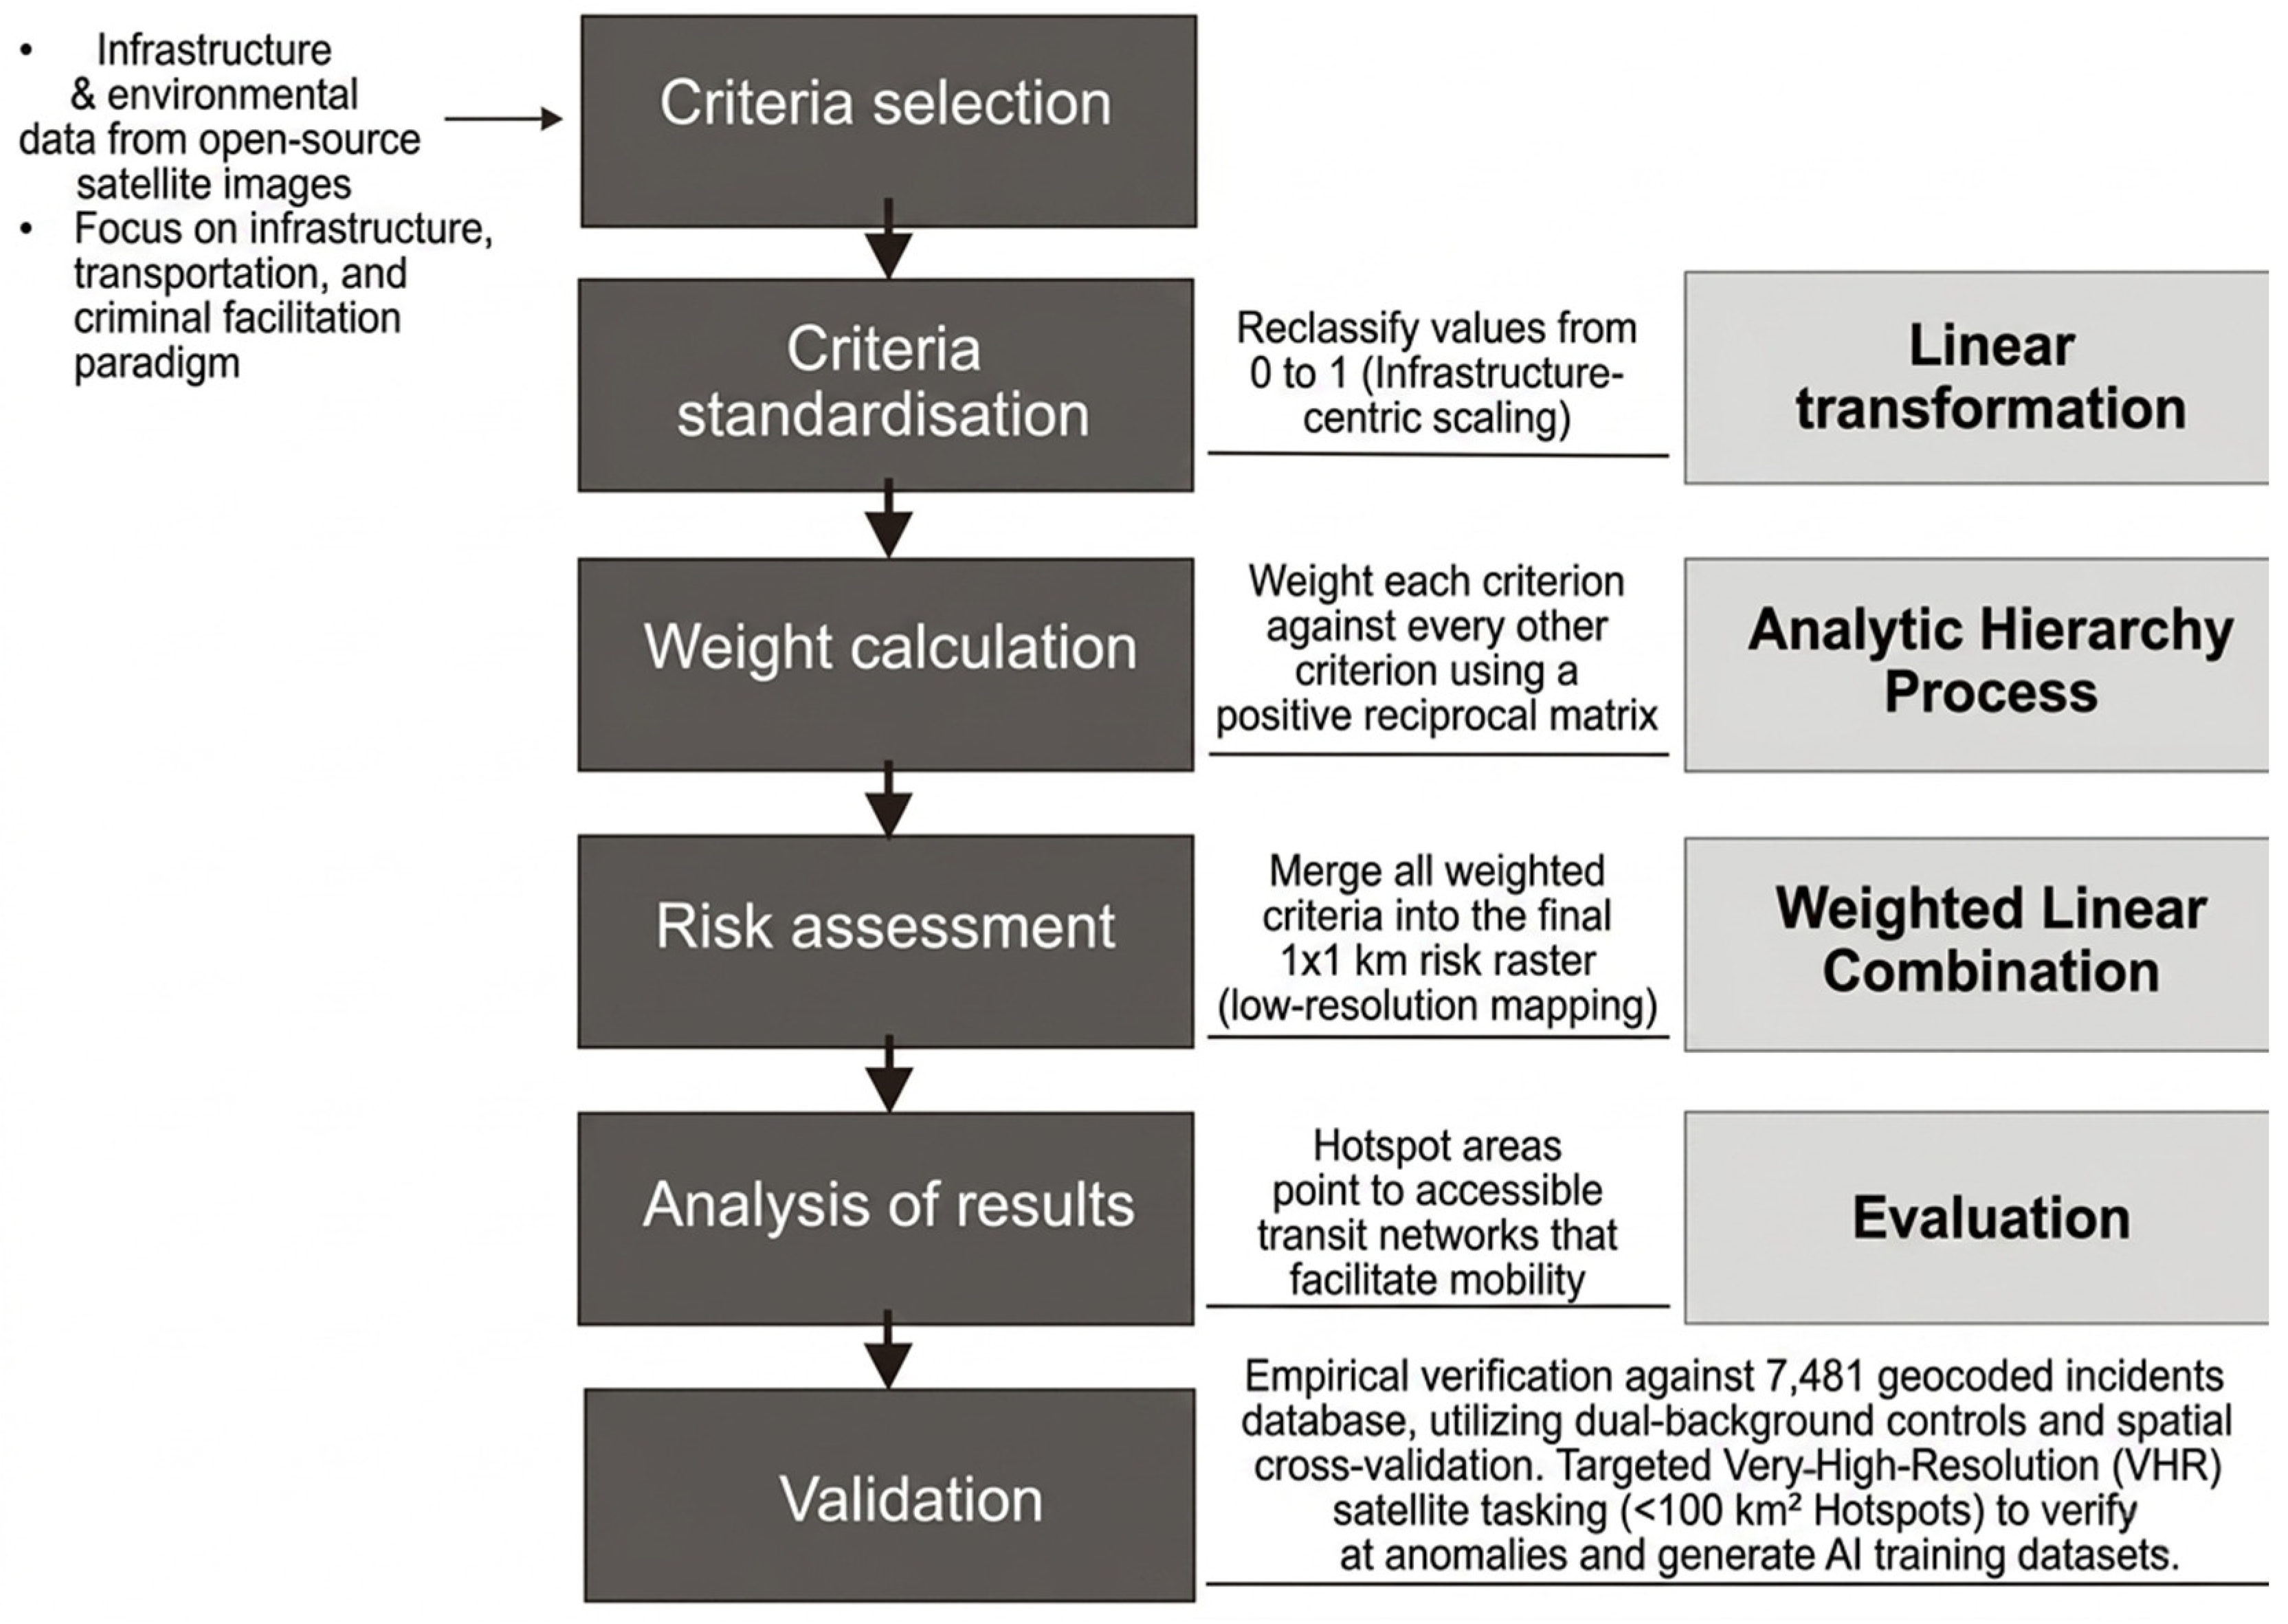
The risk analysis is based on a multi-criteria approach, categorized into transportation, human activity, and environmental factors. Proximity to infrastructure is considered a facilitator of mobility, while environmental factors serve as either barriers or seasonal deterrents. Figure 3 outlines the procedure for assessing the risk of illegal border crossing.
Figure 3.
Procedure for assessing the risk of illegal border crossing.
Table 2 lists the criteria, their descriptions, data sources, and units of measurement used to assess the risk of illegal border crossings. Key characteristics of the satellites considered in this study are presented in Table 3. Low-resolution imagery datasets were used for risk assessment analysis to determine areas with the highest risk of illegal border crossing, while high-resolution imagery datasets were used for pattern recognition indicating illegal migration activities (such as suspicious vans, tire tracks, tents, illegal campsites, and clusters of people).
Table 2.
The criteria selected to analyze the risk of illegal border crossings, their descriptions, data sources, and units of measurement.
Table 3.
Key characteristics of the satellites considered in the study.
2.3. Standardization and Risk Ranking
Standardization of criteria values was performed using the min–max linear transformation, in which a reclassified value between 0 and 1 suggested proportional risk, with values of 1 representing the highest modeled risk. The range of values for each selected risk-ranking criterion is detailed in Table 4. These values were derived by combining empirical data from historical crossing patterns with the expert judgment of three border security professionals from the Croatian Ministry of the Interior (MoI), each specializing in the evaluation and development of border risk strategies. While we acknowledge that an expert-driven AHP introduces inherent subjectivity, these decisions balance analytical data with extensive field experience. For example, the 6 km buffer for ‘Distance to roads’ corresponds to an average one-hour walking distance. Furthermore, while the existence of transportation infrastructure aids mobility, water bodies were considered as obstacles rather than facilitators of movement, and illegal migration generally occurs at a distance from urban centers. Table 5 provides a description of land cover categorized according to their assessed risk of illegal border crossing, where permanent water bodies and wetlands as natural barriers represent the lowest risk, tree cover and shrubland pose a moderate risk due to transit difficulty, and grasslands and built-up areas represent the highest risk due to ease of traversal and concealment opportunities.
Table 4.
Risk standardization thresholds. Numeric variables were scaled linearly to a range of 0 to 1.
Table 5.
Description of land cover criteria categorized according to risk of illegal border crossing.
Analytic Hierarchy Process
The AHP is a structured technique for organizing and analyzing complex decisions [10]. It is particularly useful for weighting qualitative factors (such as land cover) alongside quantitative ones (such as distance from infrastructure, slope, climatic variables). The AHP breaks the decision down into a hierarchy and uses pairwise comparisons to determine the relative importance of each element.
Weighting was determined via a pairwise comparison of a positive reciprocal matrix to establish the relative importance of each factor, where each element aij represents the relative importance of criterion i over criterion j [10]. Self-identity values were associated with high-risk factors in the pairwise comparison matrix, while reciprocal values were assigned to low-risk factors. After normalizing the matrix, the values were averaged across each row to obtain the weights (wj) assigned to each criterion. To ensure these weights are logical, a consistency analysis was conducted. The consistency of each pairwise comparison was evaluated by the Consistency Ratio (CR) (1), using the Consistency Index (CI) (2) and the Random Consistency Index (RI) [10]:
where λ is the average value of the consistency vector and n is the number of parameters. RI values were predefined by Saaty [10], depending on the number of compared criteria in the pairwise comparison matrix. The acceptable value of CR is 0.10, while higher values indicate that revision and modification of the pairwise matrix should be conducted [10].
To produce a comprehensive risk analysis map for illegal border crossings, a spatial data synthesis was performed by using a Weighted Linear Combination (WLC) aggregation equation [10], which integrates the derived criteria weights (wj) with normalized spatial datasets (xj) from the GIS layers as detailed in Table 4 and Table 5:
Each 1 × 1 km pixel was assigned a risk score (Si) (3). The 1 km2 spatial resolution was used as the primary unit of analysis to ensure compatibility with the diverse open-source layers utilized in this study. This resolution aligns with the data completeness and spatial granularity, which varies across different non-urbanized and urbanized regions. At the same time, it considers the scale of regional border patrol operations and spatial uncertainty inherent in tracking border crossing data. It should be noted that environmental variables were treated as predictors rather than constraints. This decision was made to reflect the reality of facilitated border crossings, where traditional geographic obstacles are routinely mitigated by criminal facilitators, meaning no single physical factor serves as an absolute deterrent in the presence of sufficient external resources. Researchers wishing to treat specific features as absolute barriers can easily integrate Boolean constraints into this model.
2.4. Sensitivity Test
Sensitivity analysis is essential for validating the robustness of AHP-based methods. Criteria weights involve subjective judgments, creating considerable uncertainty, especially when the pairwise comparison matrix is based solely on expert opinion. A one-at-a-time (OAT) sensitivity analysis was conducted to validate the developed GIS-MCA with the AHP method described above. OAT sensitivity analysis involved changing one criterion’s weight by multiplying it by a chosen value, effectively simulating a change in the domain expert’s ranking of the criteria’s importance. After normalizing the new weight vector, the WLC procedure was applied to create a new risk score map. These steps were repeated for all criteria. The resulting risk score maps were then compared with the original risk score map by deriving spatial statistics.
2.5. Validation Methodology
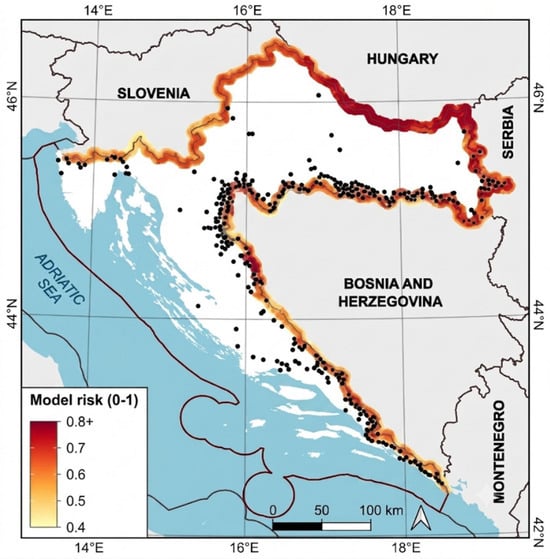
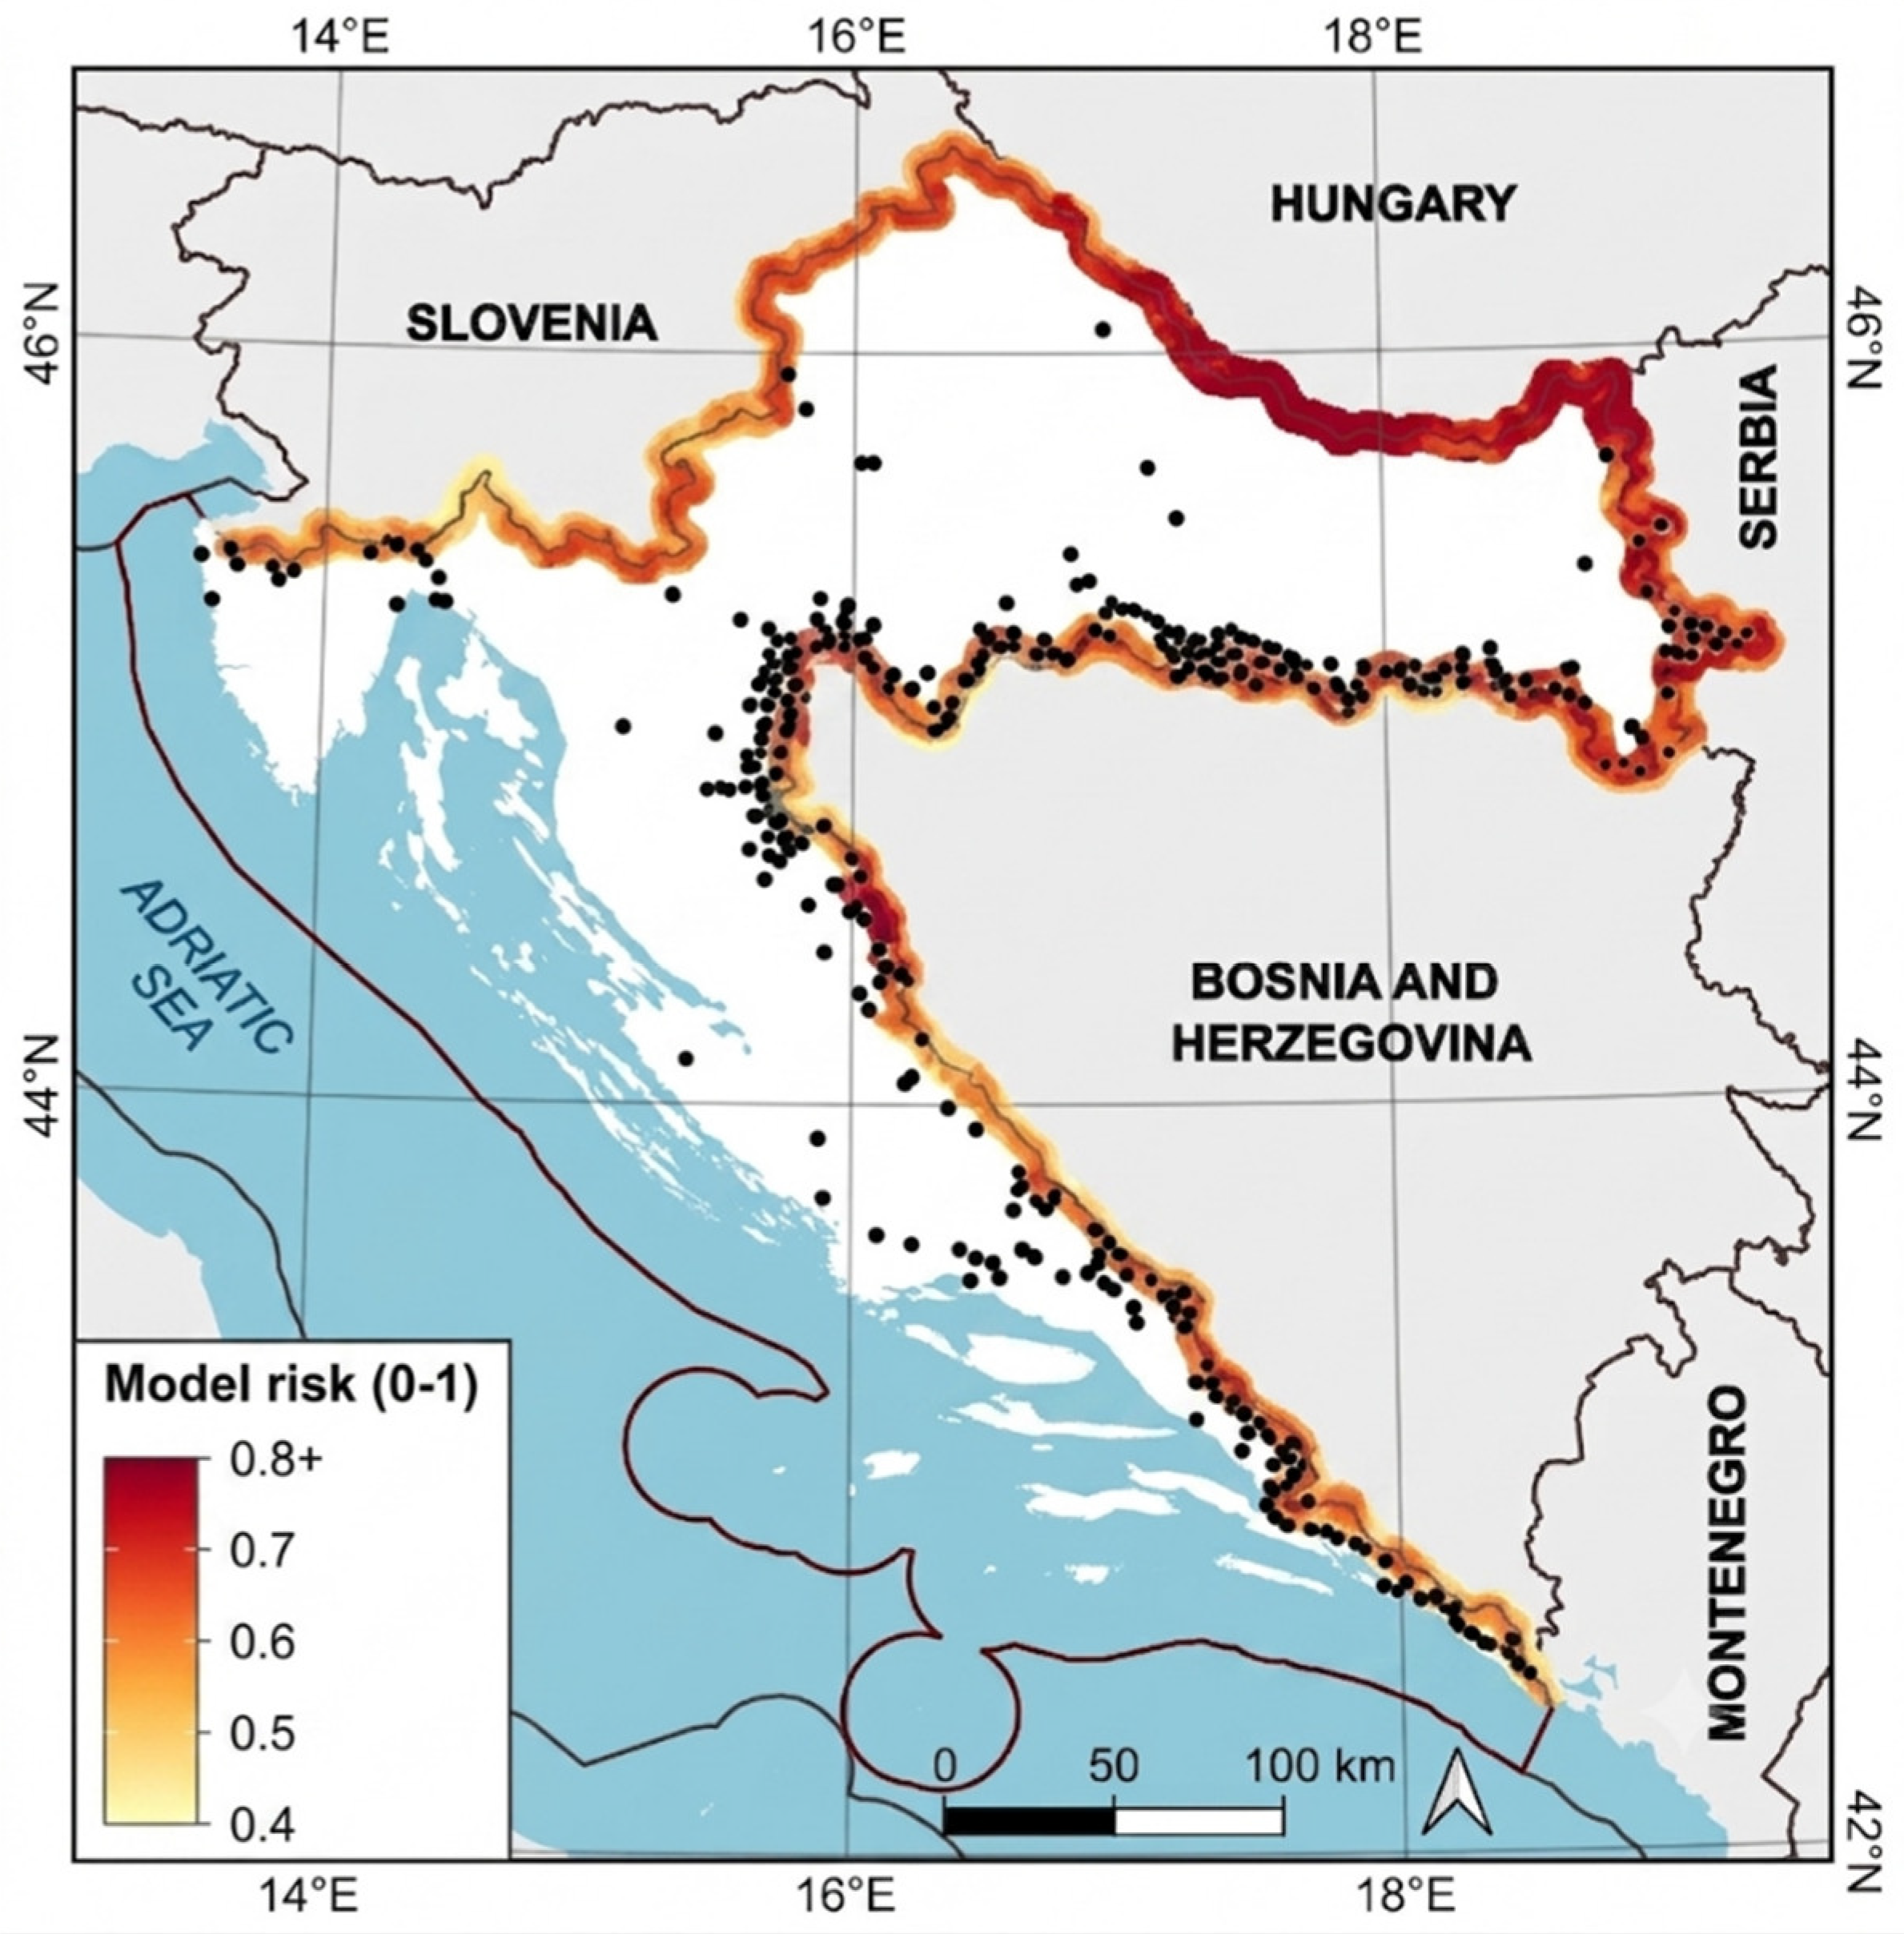
The continuous 1 × 1 km risk surface (0_Risk_10 km.tif, EPSG:3765, 17,229 valid cells, risk 0.36–0.87, domain mean 0.64) was validated with a database obtained by a detection-vs-background design against a MOI dataset on illegal border crossings from 2025 to 26 with an input of 391 geocoded settlements (Figure 4 and Supplementary Material Table S1). Of these, 218 settlements (representing 7481 detections) fell inside the scored domain and were included in the core metrics, using detection counts as weights. The remaining 173 inland locations (3172 detections) fell outside the border buffer and were excluded. Background points substituted the lack of real recorded absences with 10,000 random points within the domain, plus a stricter target-group background restricted to within 15 km of detections (controls border segment effort bias). Every metric was computed separately per dataset and per background.
Figure 4.
Validation points over the 1 × 1 km risk surface. MOI interior places outside the scored domain are excluded from the core metric.
Historical Very-High-Resolution (VHR) commercial imagery (Maxar GeoEye-1, Maxar WorldView-2, Maxar WorldView-3, Pléiades, and Pléiades Neo satellites), obtained via Google Earth (open source) and the UP42 platform [15] (commercial) available through the ESA Network of Resources Programme [16], was used to detect potentially suspicious vans, tents, illegal campsites, vehicle tracks, or clusters of people in areas identified as high risk for illegal border crossing. The images were of “Display” or “Map-Ready Pansharpened” quality, with a ground sampling distance (GSD) ranging from 0.31 to 0.82 m. Additionally, car and truck detection algorithms available via the UP42 platform were used where applicable. Table 6 provides a brief description of the satellites that supplied imagery for this study. It should be noted that besides satellite revisit frequencies, the continuous efficacy of satellite imagery is restricted by cloud cover, dense canopy/seasonal vegetation occlusion, and civilian activities. Furthermore, the ethical implications surrounding fundamental human rights and data confidentiality within operational border-monitoring frameworks should be openly and objectively addressed. Such data should be used only for predictive intelligence to support the enhancement of border security awareness, not for individual tracking or profiling.
Table 6.
Technical specifications and sensor characteristics of the VHR satellite platforms utilized in this study.
The required area for imagery requested from the UP42 was 5 km2 for Pléiades Neo and 1 km2 for the others. Pléiades Neo and Pléiades imagery were available in “Display” quality. Processing included: (a) Geometric processing—Orthorectified, (b) Radiometric processing—Display, (c) 6-band—Pansharpened (deep blue, RGB, red edge, and NIR) for Pléiades Neo, or 4-band—Pansharpened (RGB and NIR) for Pléiades. Maxar WorldView-3, Maxar WorldView-2, and Maxar GeoEye-1 imagery was unavailable in this format, so “Map-Ready Pansharpened” quality was requested. Processing included: (a) Geometric processing—Orthorectified, (b) Radiometric processing—Display, (c) 8-band—Pansharpened (RGB, NIR, red edge, coastal blue, and yellow) for WorldView-3 and WorldView-2, or 4-band—Pansharpened (RGB and NIR) for GeoEye-1.
3. Results
3.1. GIS-AHP Integration
The derived AHP weights, summarized in Table 7, indicate that transportation is the most significant factor (0.326), followed by distance to buildings (0.217) and land cover (0.157). Environmental factors such as precipitation and temperature had lower, yet still significant, secondary impacts. The CR for the primary criteria was calculated as 0.08 (Table 8), and 0.01 for the transportation sub-criteria (Table 9). Both values are below the 0.10 threshold, confirming the reliability of the weightings. The highest sensitivity was observed within the “distance to buildings” criterion when it was subjected to a negative weight perturbation of 30% (reduced to 70% of its baseline value). Even in this case, the effect was minor. The mean absolute difference between the perturbed and original pixel-wise risk scores was 0.0236, while the maximum absolute difference across all pixels was 0.0484. These changes did not shift the locations of the highest-risk zones. Perturbations to other criteria produced even smaller differences. Sensitivity analysis demonstrated that the model remained stable, showing no significant deviations when primary weights were varied by ±30%.
Table 7.
AHP weight factors.
Table 8.
Pairwise comparison matrix for major criteria classes.
Table 9.
Pairwise comparison matrix for individual criteria within the transportation class.
Risk Analysis Map
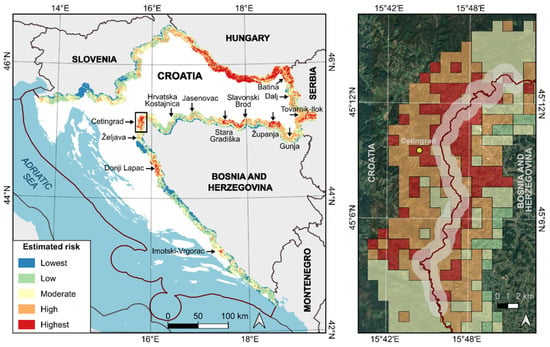
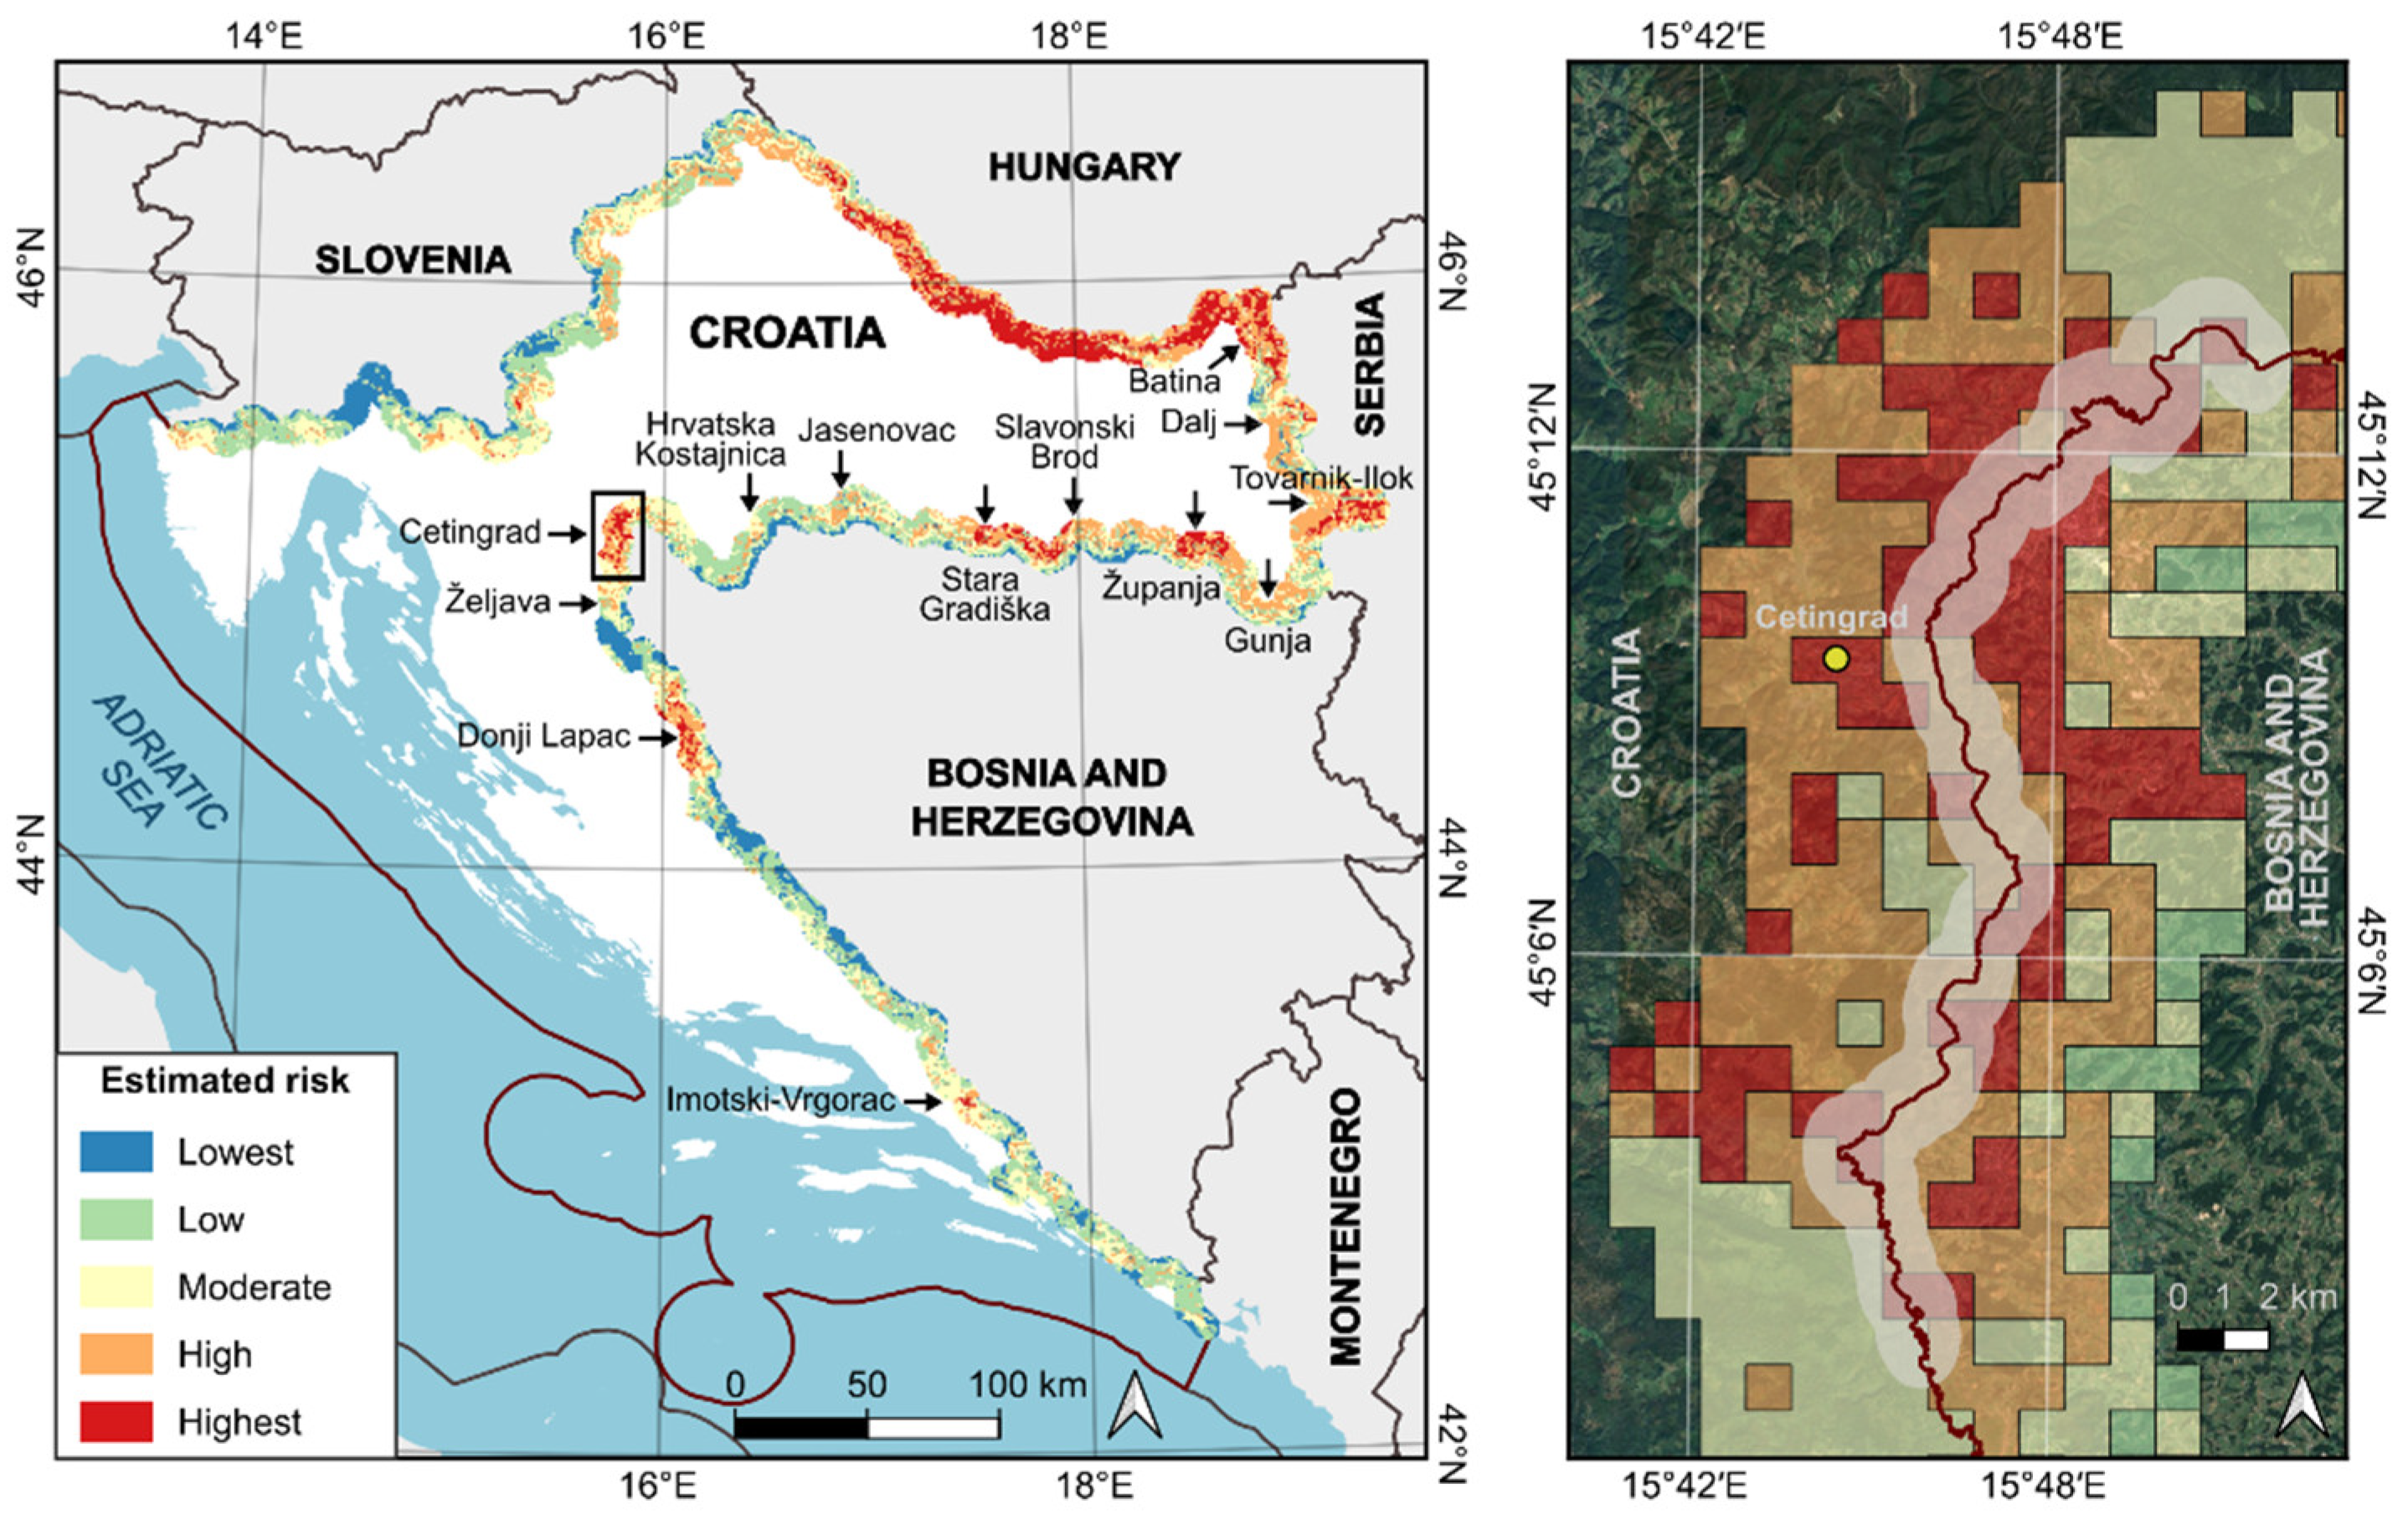
The final output of the GIS-MCA model is a raster map showing areas ranked by risk for illegal border crossings, with the highest risk areas marked in red (Figure 5). Risk was evaluated by combining standardized values and criteria weights. The inset in Figure 5 presents an example of a 2 km wide polygon (1 km on each side of the border) recommended for close monitoring of illegal crossings of the EU’s external border using both ground and remote sensing methods. The 1 × 1 km map resolution used for risk calculation is highly effective for strategic resource allocation identifying which border sectors require intensified VHR satellite tasking or ground patrols.
Figure 5.
Risk analysis map for illegal border crossing (calculated using GIS-MCA with AHP). Resolution 1 × 1 km. Developed on QGIS, HTRS96/TM platform. Arrows indicate sectors with increased risk of illegal border crossing. Inset figure shows identified high-risk zone for illegal border crossings within the Cetingrad sector.
3.2. Validation
The two upper risk classes (risk ≥ 0.677, high + highest) cover 35% of the domain yet contain 53% of MOI detection sites (53% weighted by detection count). The single highest class (≥0.75) covers 11% of the domain and holds 17% of MOI detections. This is a more than 1.5× enrichment over the area share.
Threshold-based agreement statistics were derived by discretizing the continuous risk surface at two model-defined cut-offs, with the resulting confusion matrix reported in Table 10. The primary threshold of 0.677 corresponds to the moderate–high class boundary of the model’s classification scheme and was thus fixed a priori, independently of the validation data; a second, stricter threshold isolates the highest-risk class at ≥0.75. The data-optimal threshold that maximizes the True Skill Statistic (max-TSS) is also reported, but is interpreted only as an upper bound, as it is tuned on the same points against which it is evaluated. Because the validation is detection-versus-background, true negatives correspond to background cells rather than to verified absences, and the matrices are therefore to be read as a measure of how strongly the elevated-risk zones concentrate recorded crossings, rather than as a per-cell prediction of crossing versus no-crossing.
Table 10.
Confusion matrix and performance metrics across model risk thresholds and background configurations.
Positive skill is obtained at the a priori class boundary. Under the bias-controlled (target-group) background, the elevated-risk zone recovers 53% of detection sites at 70% specificity (TSS = 0.24). The TSS is positive across every dataset–background–threshold combination (range 0.01–0.24), indicating performance above random throughout, and increases consistently from the domain-wide to the target-group background, mirroring the improvement observed in the threshold-free Boyce index. The agreement is necessarily conservative: Cohen’s κ remains low (≤0.03), and the high specificity at the highest-risk threshold (0.89–0.94) is accompanied by low sensitivity (0.12). Both effects follow directly from the structure of the study domain, which represents a narrow near-border band in which model risk is elevated almost everywhere. This compresses the dynamic range available to any hard threshold and inflates the background base rate. The threshold-independent metrics (Boyce index and cumulative capture) are therefore regarded as the principal evidence of model performance, with the confusion matrices presented as a complementary summary that is consistent with them; positive skill is obtained at a threshold defined by the model itself, and that skill is strengthened under the stricter, bias-controlled comparison.
The performance of the risk model against the detection dataset is summarized in Table 11, where the dataset is evaluated against both a domain-wide and a bias-controlled (target-group) background. Five complementary indicators are reported: the Continuous Boyce Index (CBI), which is threshold-free and appropriate for detection-only data; the Receiver Operating Characteristic Area Under the Curve (AUC), alongside its precision–recall analog (AUC-PR), both calculated using a detection-versus-background framework; the spatial block cross-validation AUC (block-CV AUC); and a Mann–Whitney U test comparing risk distributions between detection sites and background points, utilizing rank-biserial correlation as the effect size. As no verified absences exist, all discrimination measures quantify the degree to which recorded crossings are concentrated in higher-risk locations relative to the surrounding domain, rather than the prediction of individual crossing events.
Table 11.
Summary of continuous performance indicators against domain-wide and target-group backgrounds.
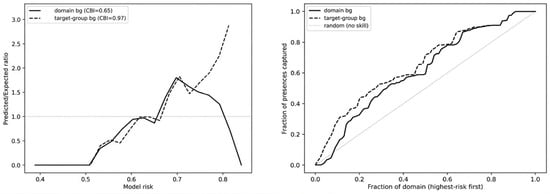
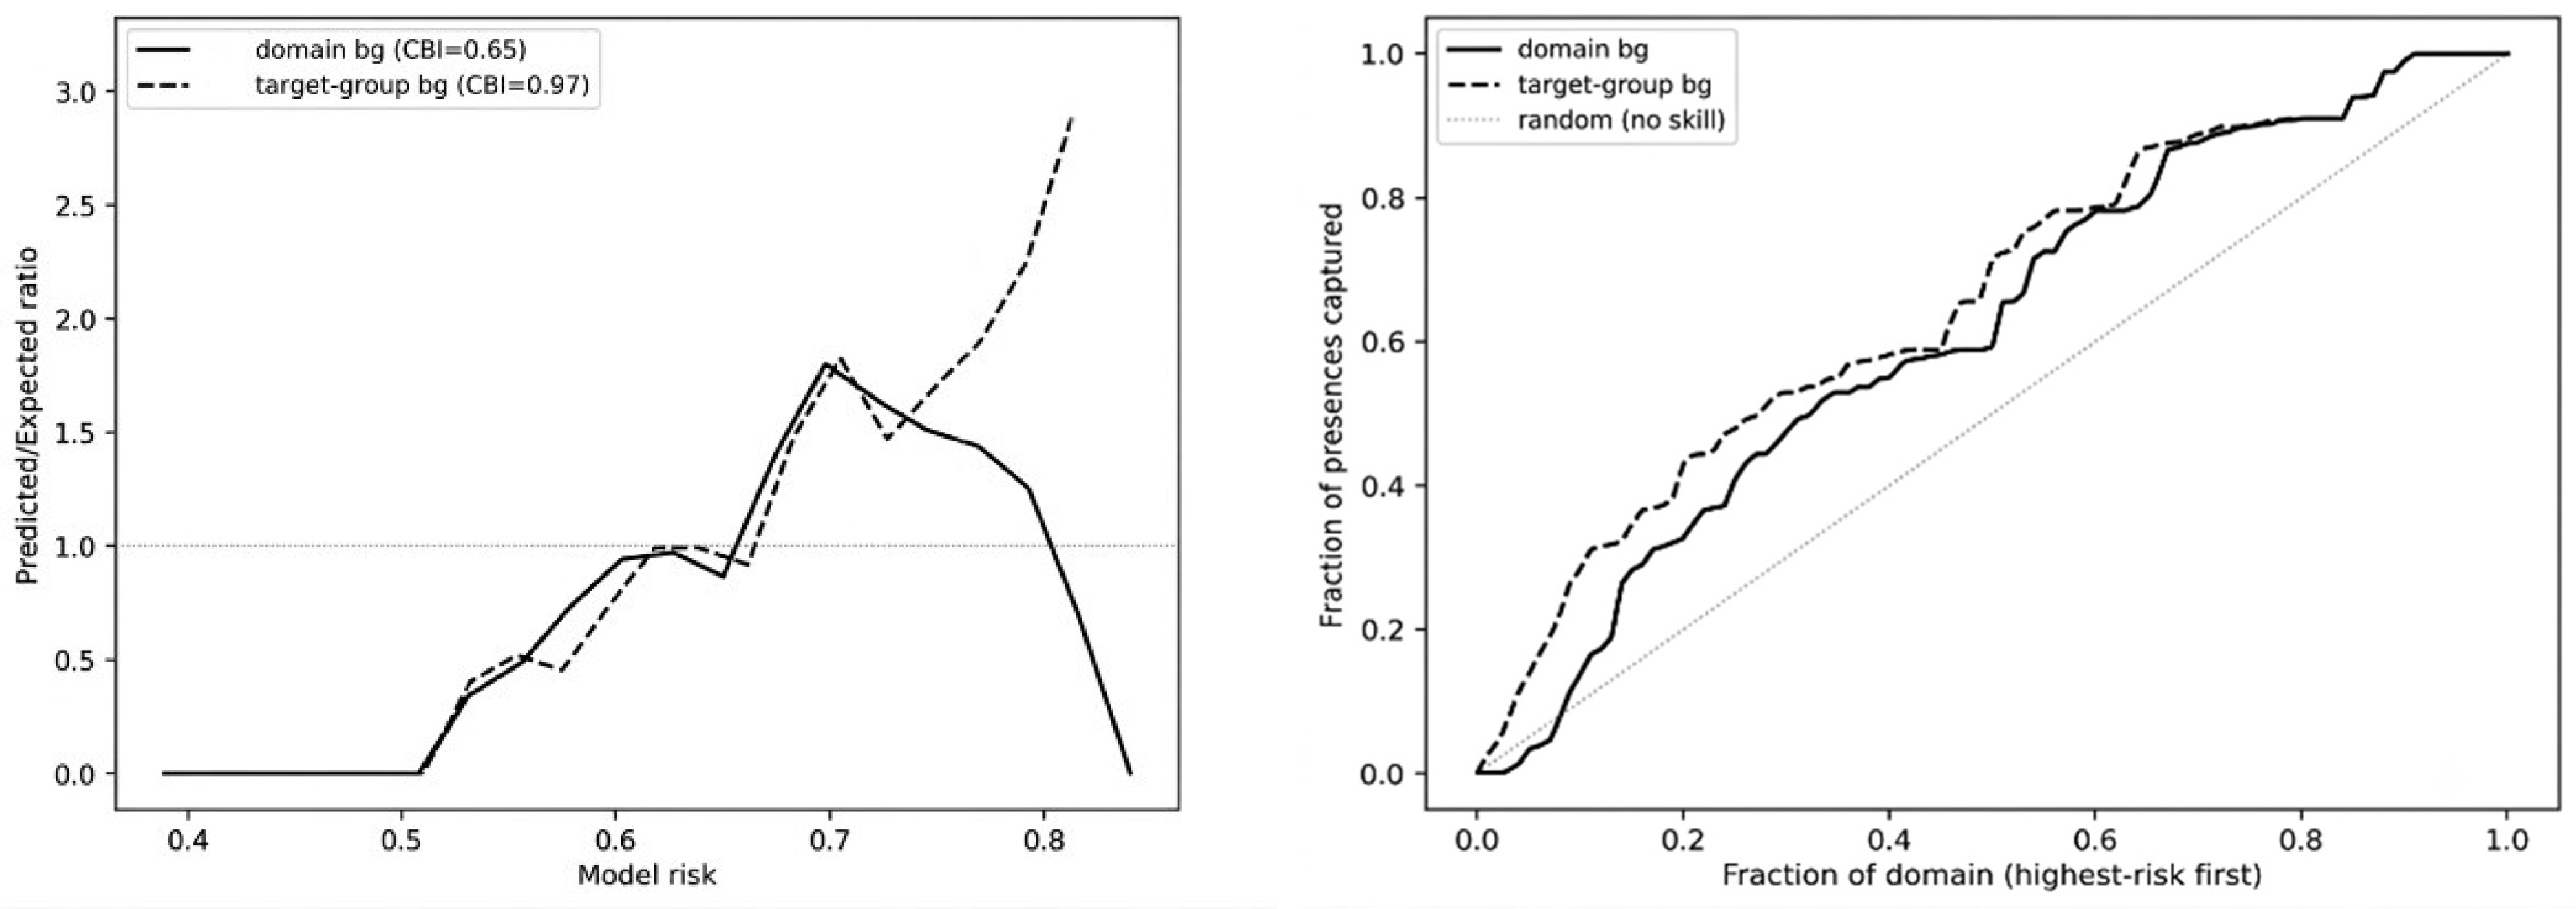
A consistent and statistically significant association between modeled risk and the location of recorded crossings is obtained. Risk at detection sites is higher than at background in every configuration (Mann–Whitney p ranging from 2 × 10⁻⁸ to 1 × 10⁻¹⁴; rank-biserial correlation 0.22–0.30), and the Continuous Boyce Index is positive throughout (0.65–0.97), against a null expectation of approximately zero, indicating that the predicted/expected ratio increases monotonically with risk. Discrimination measured by the AUC is moderate (0.61–0.65) and remains essentially unchanged under spatial block cross-validation (0.60–0.64), which demonstrates that the signal is not an artefact of spatial autocorrelation among the clustered detection points. The low AUC-PR values (0.026–0.036) are a direct consequence of the very low prevalence of detections relative to the large background sample and do not indicate poor performance; they are reported for completeness. Every indicator improves from the domain-wide to the target-group background. Most markedly, the CBI rises from 0.65 to 0.97. This confirms that the association persists, and indeed strengthens, when the comparison is restricted to the border segments where crossings were actually recorded and the effects of uneven sampling effort are thereby reduced. Figure 6 (left) presents the Boyce predicted-to-expected (P/E) ratio curves across the continuous risk distribution of the study domain, which ranges from a minimum of 0.36 to a maximum of 0.87. This metric evaluates model calibration specifically for detection-only data by determining whether the density of recorded border crossings increases monotonically alongside the predicted risk scores. Complementarily, Figure 2 (right) shows cumulative capture curves showing how much of the total recorded crossing activity is caught at progressively larger portions of the study domain, starting with the highest-risk areas.
Figure 6.
Boyce P/E curves (left) showing a monotonic increase for target-group bg, indicating strong model calibration. Cumulative capture curves (right) remain consistently above the random, no-skill diagonal, with the bias-controlled target-group configuration exhibiting a steeper, superior capture rate.
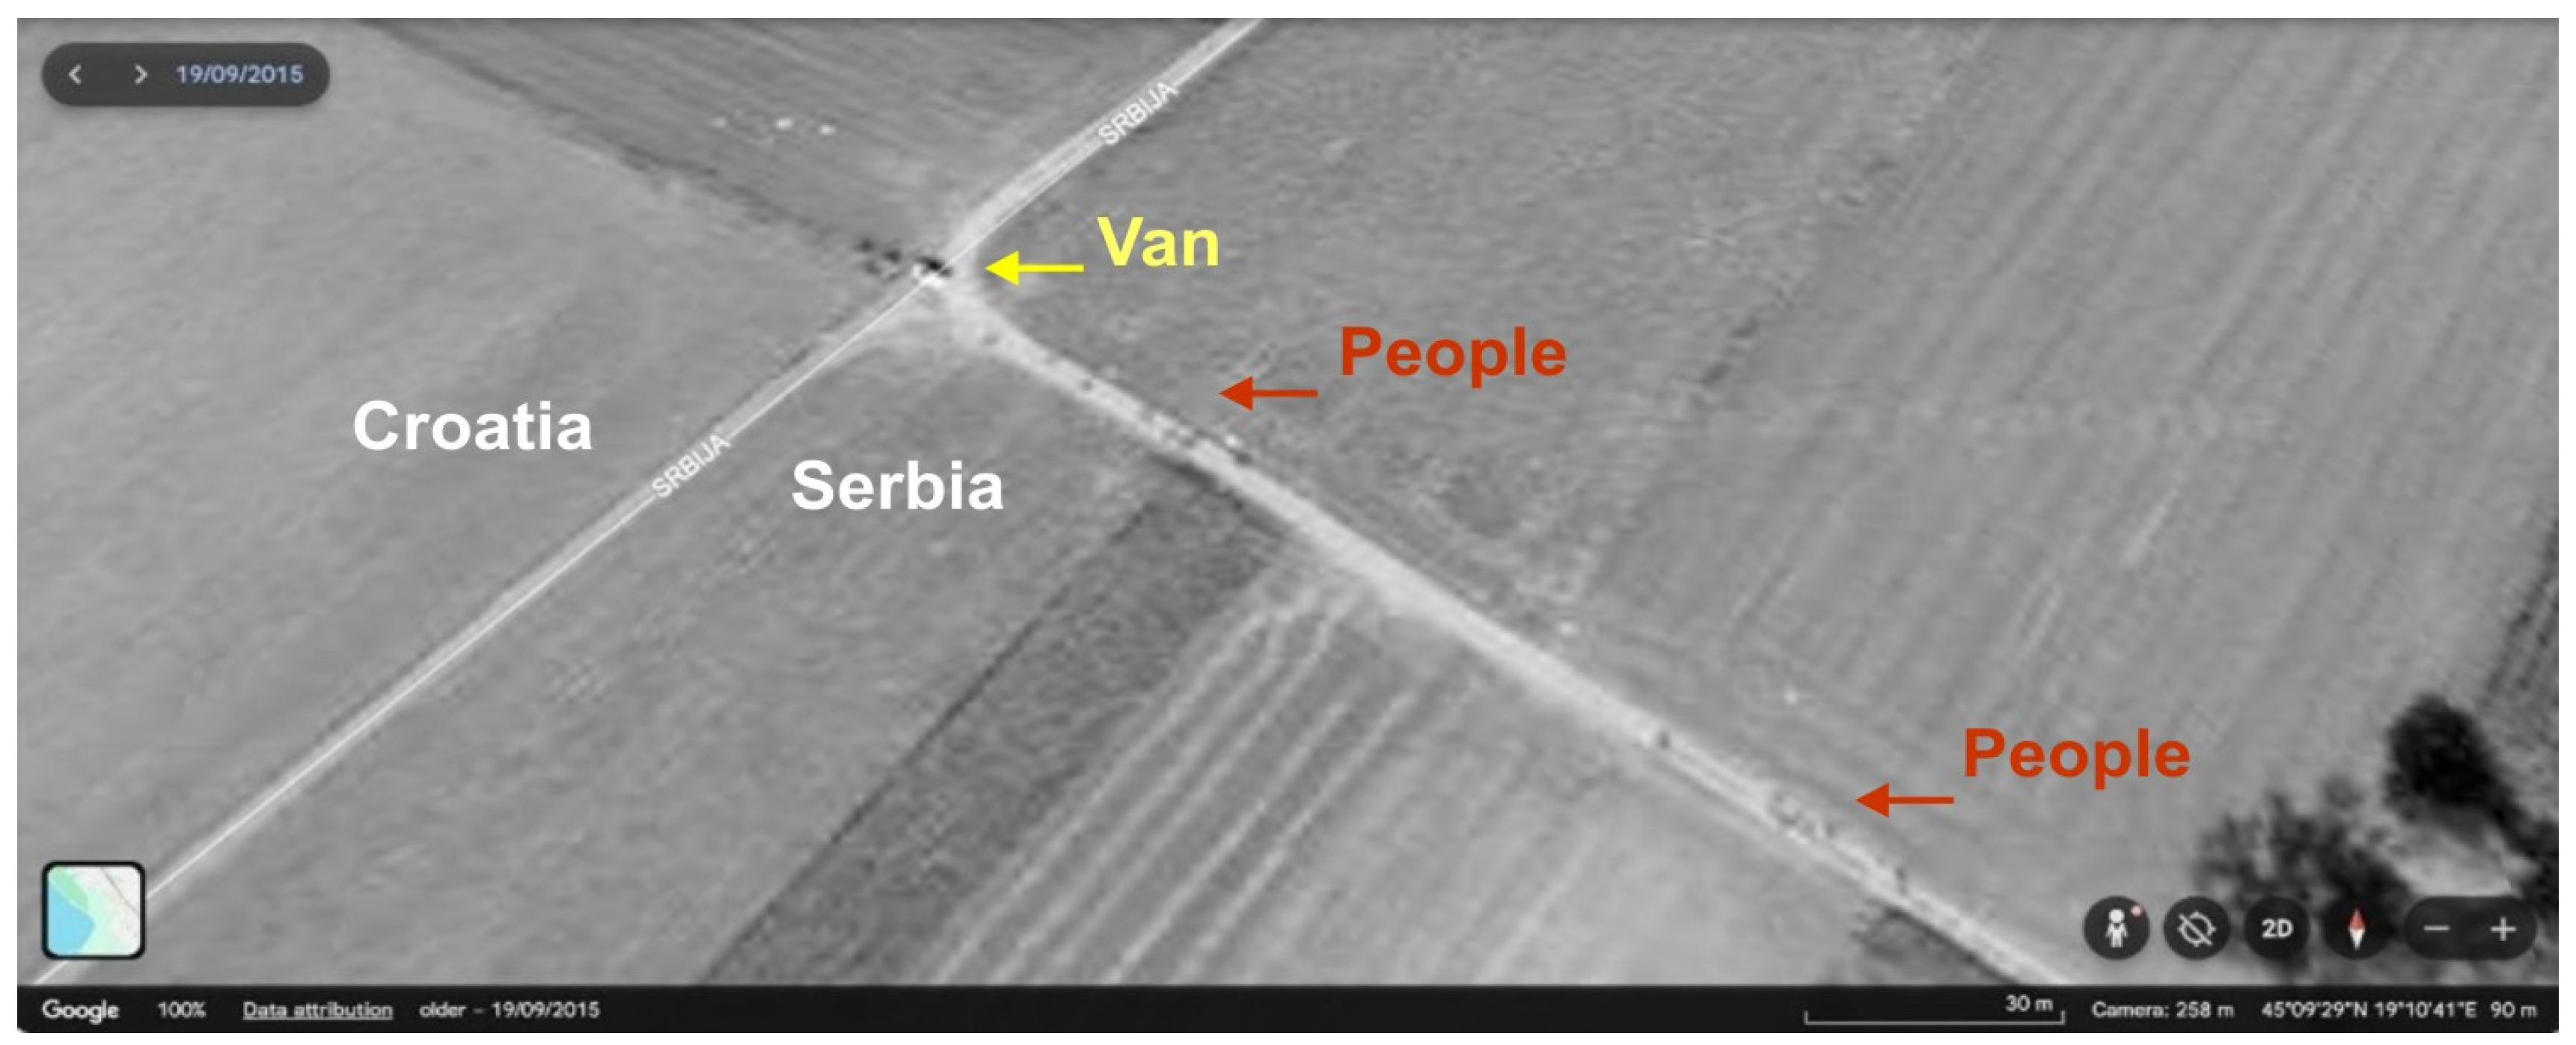
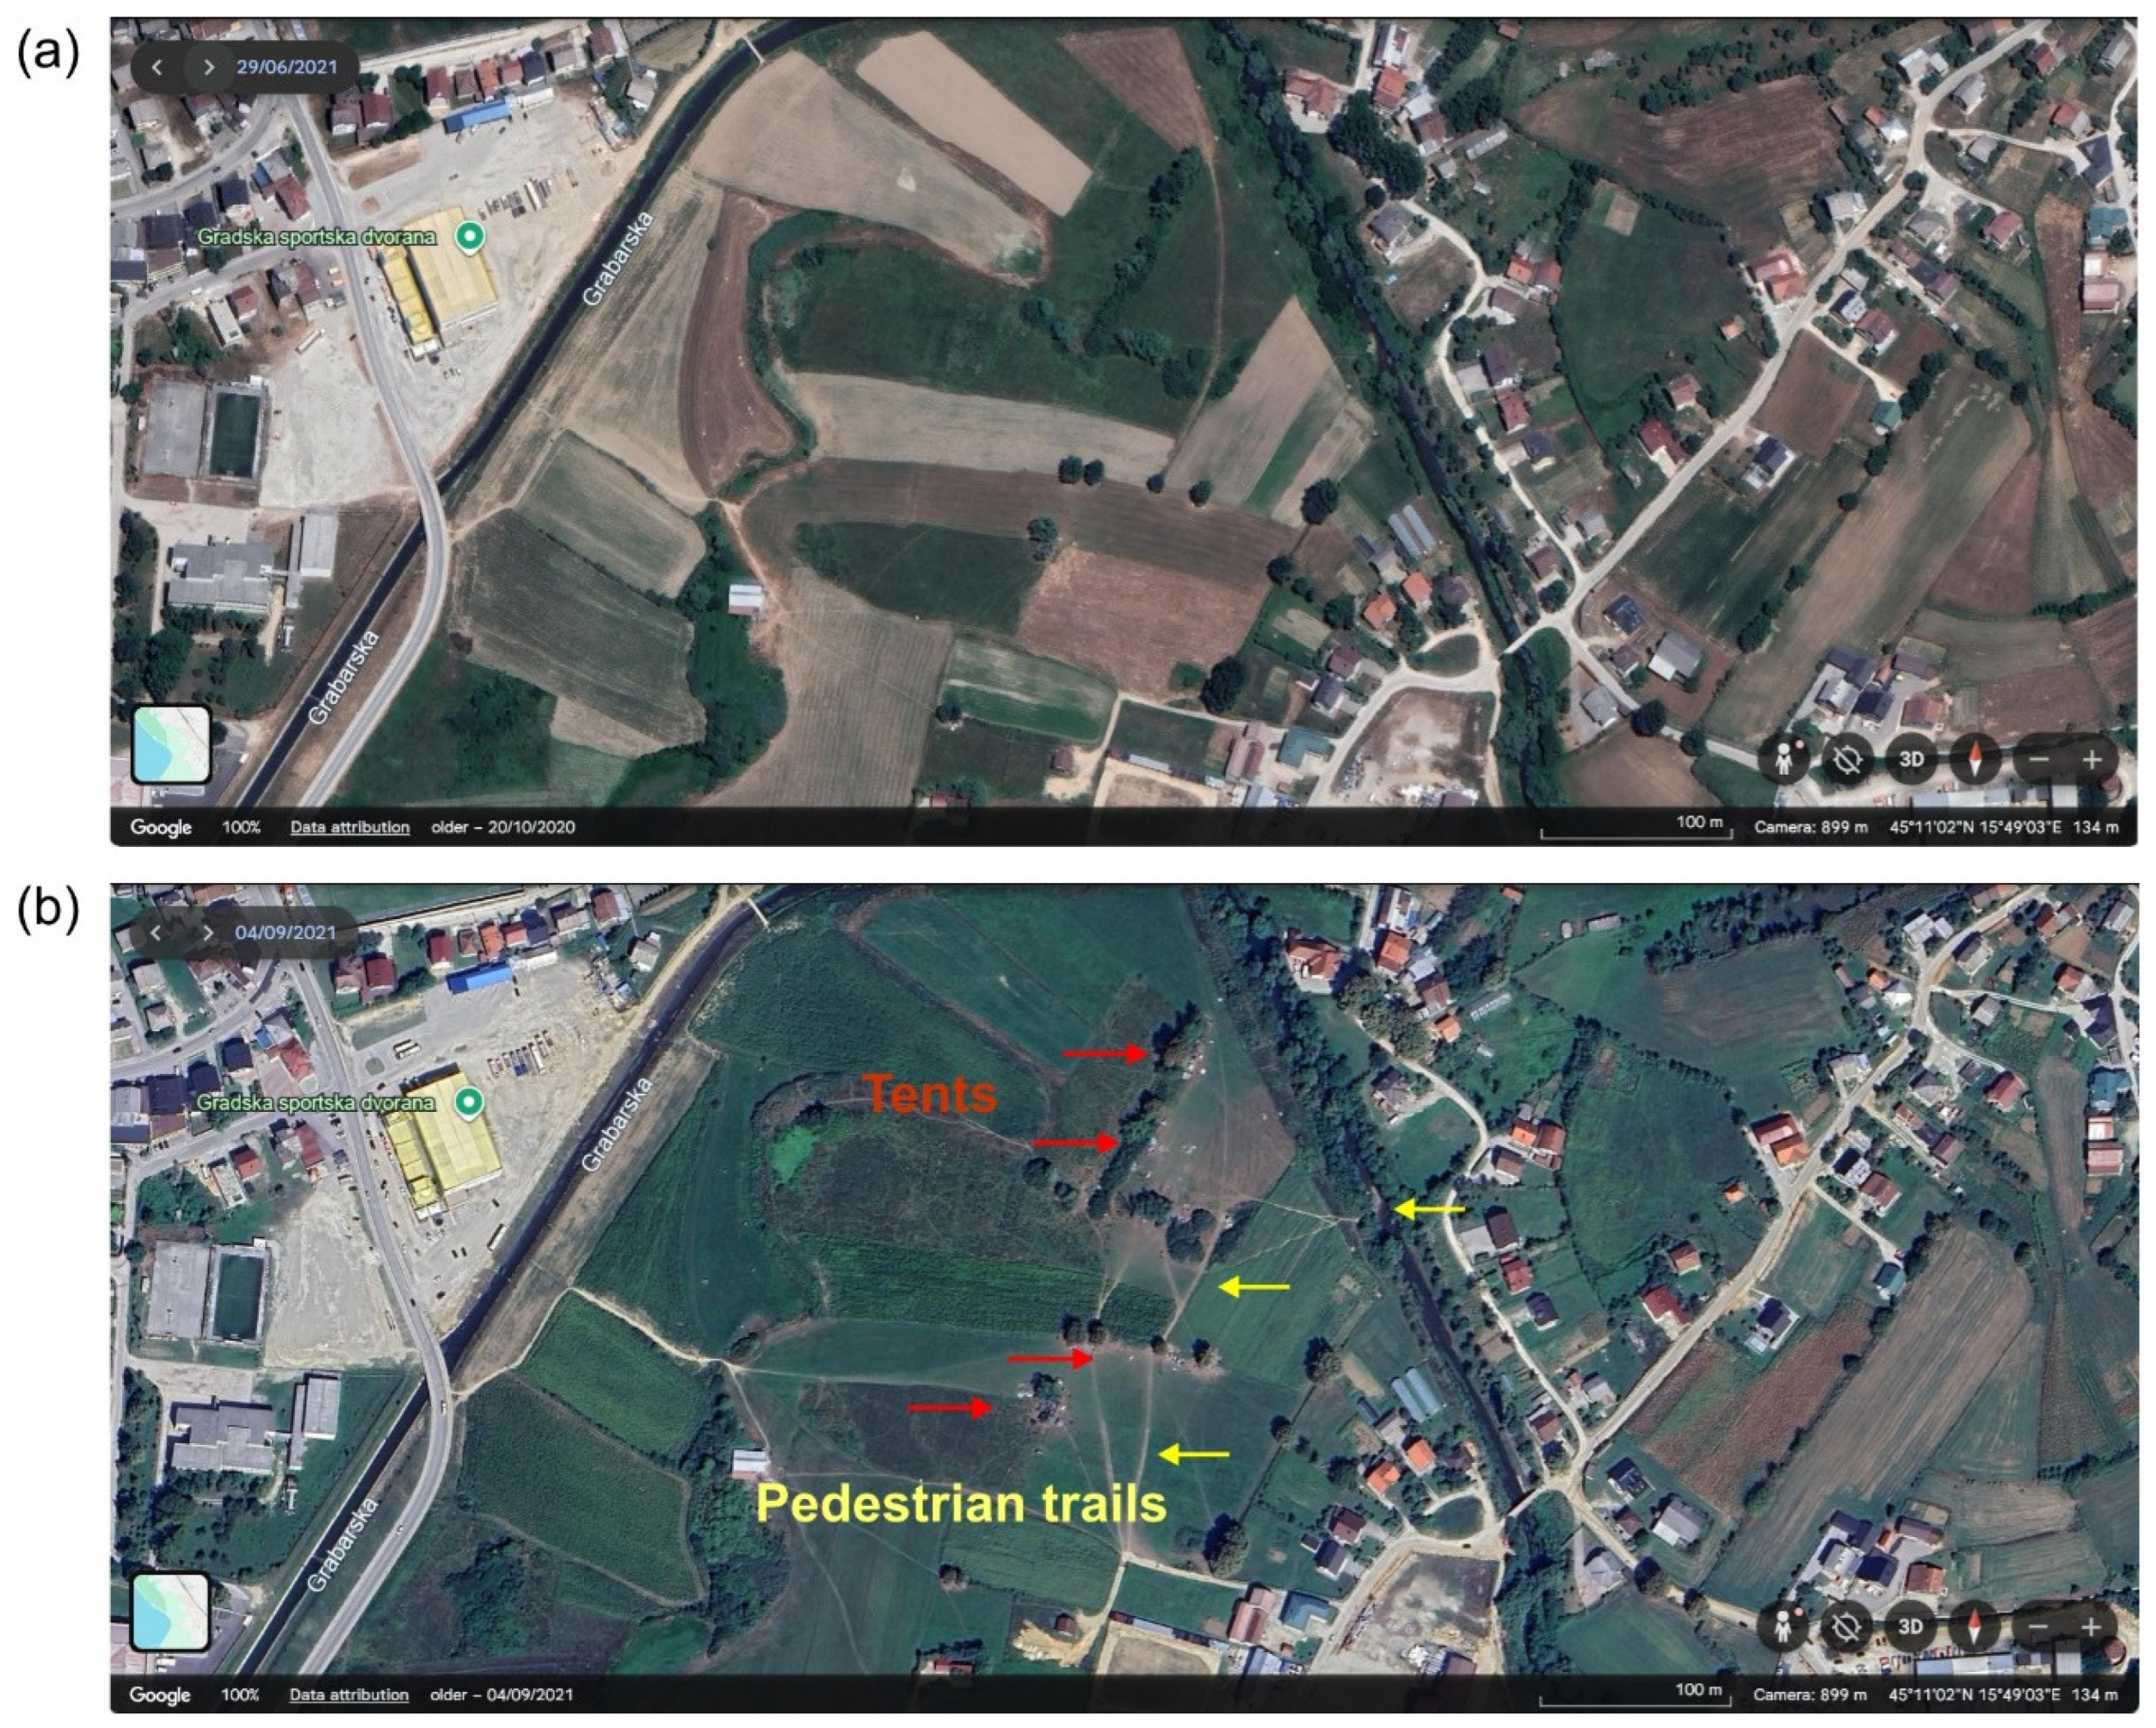
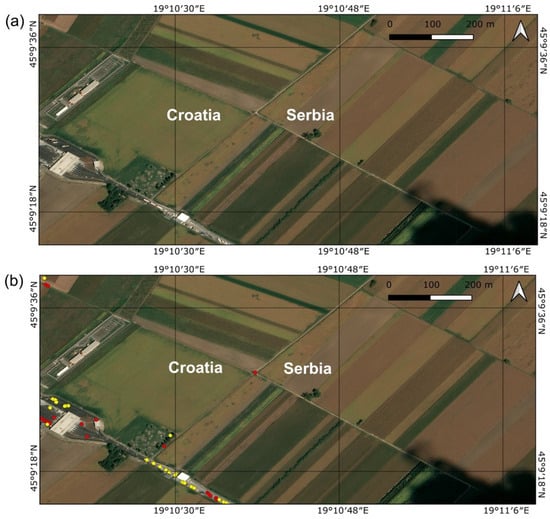
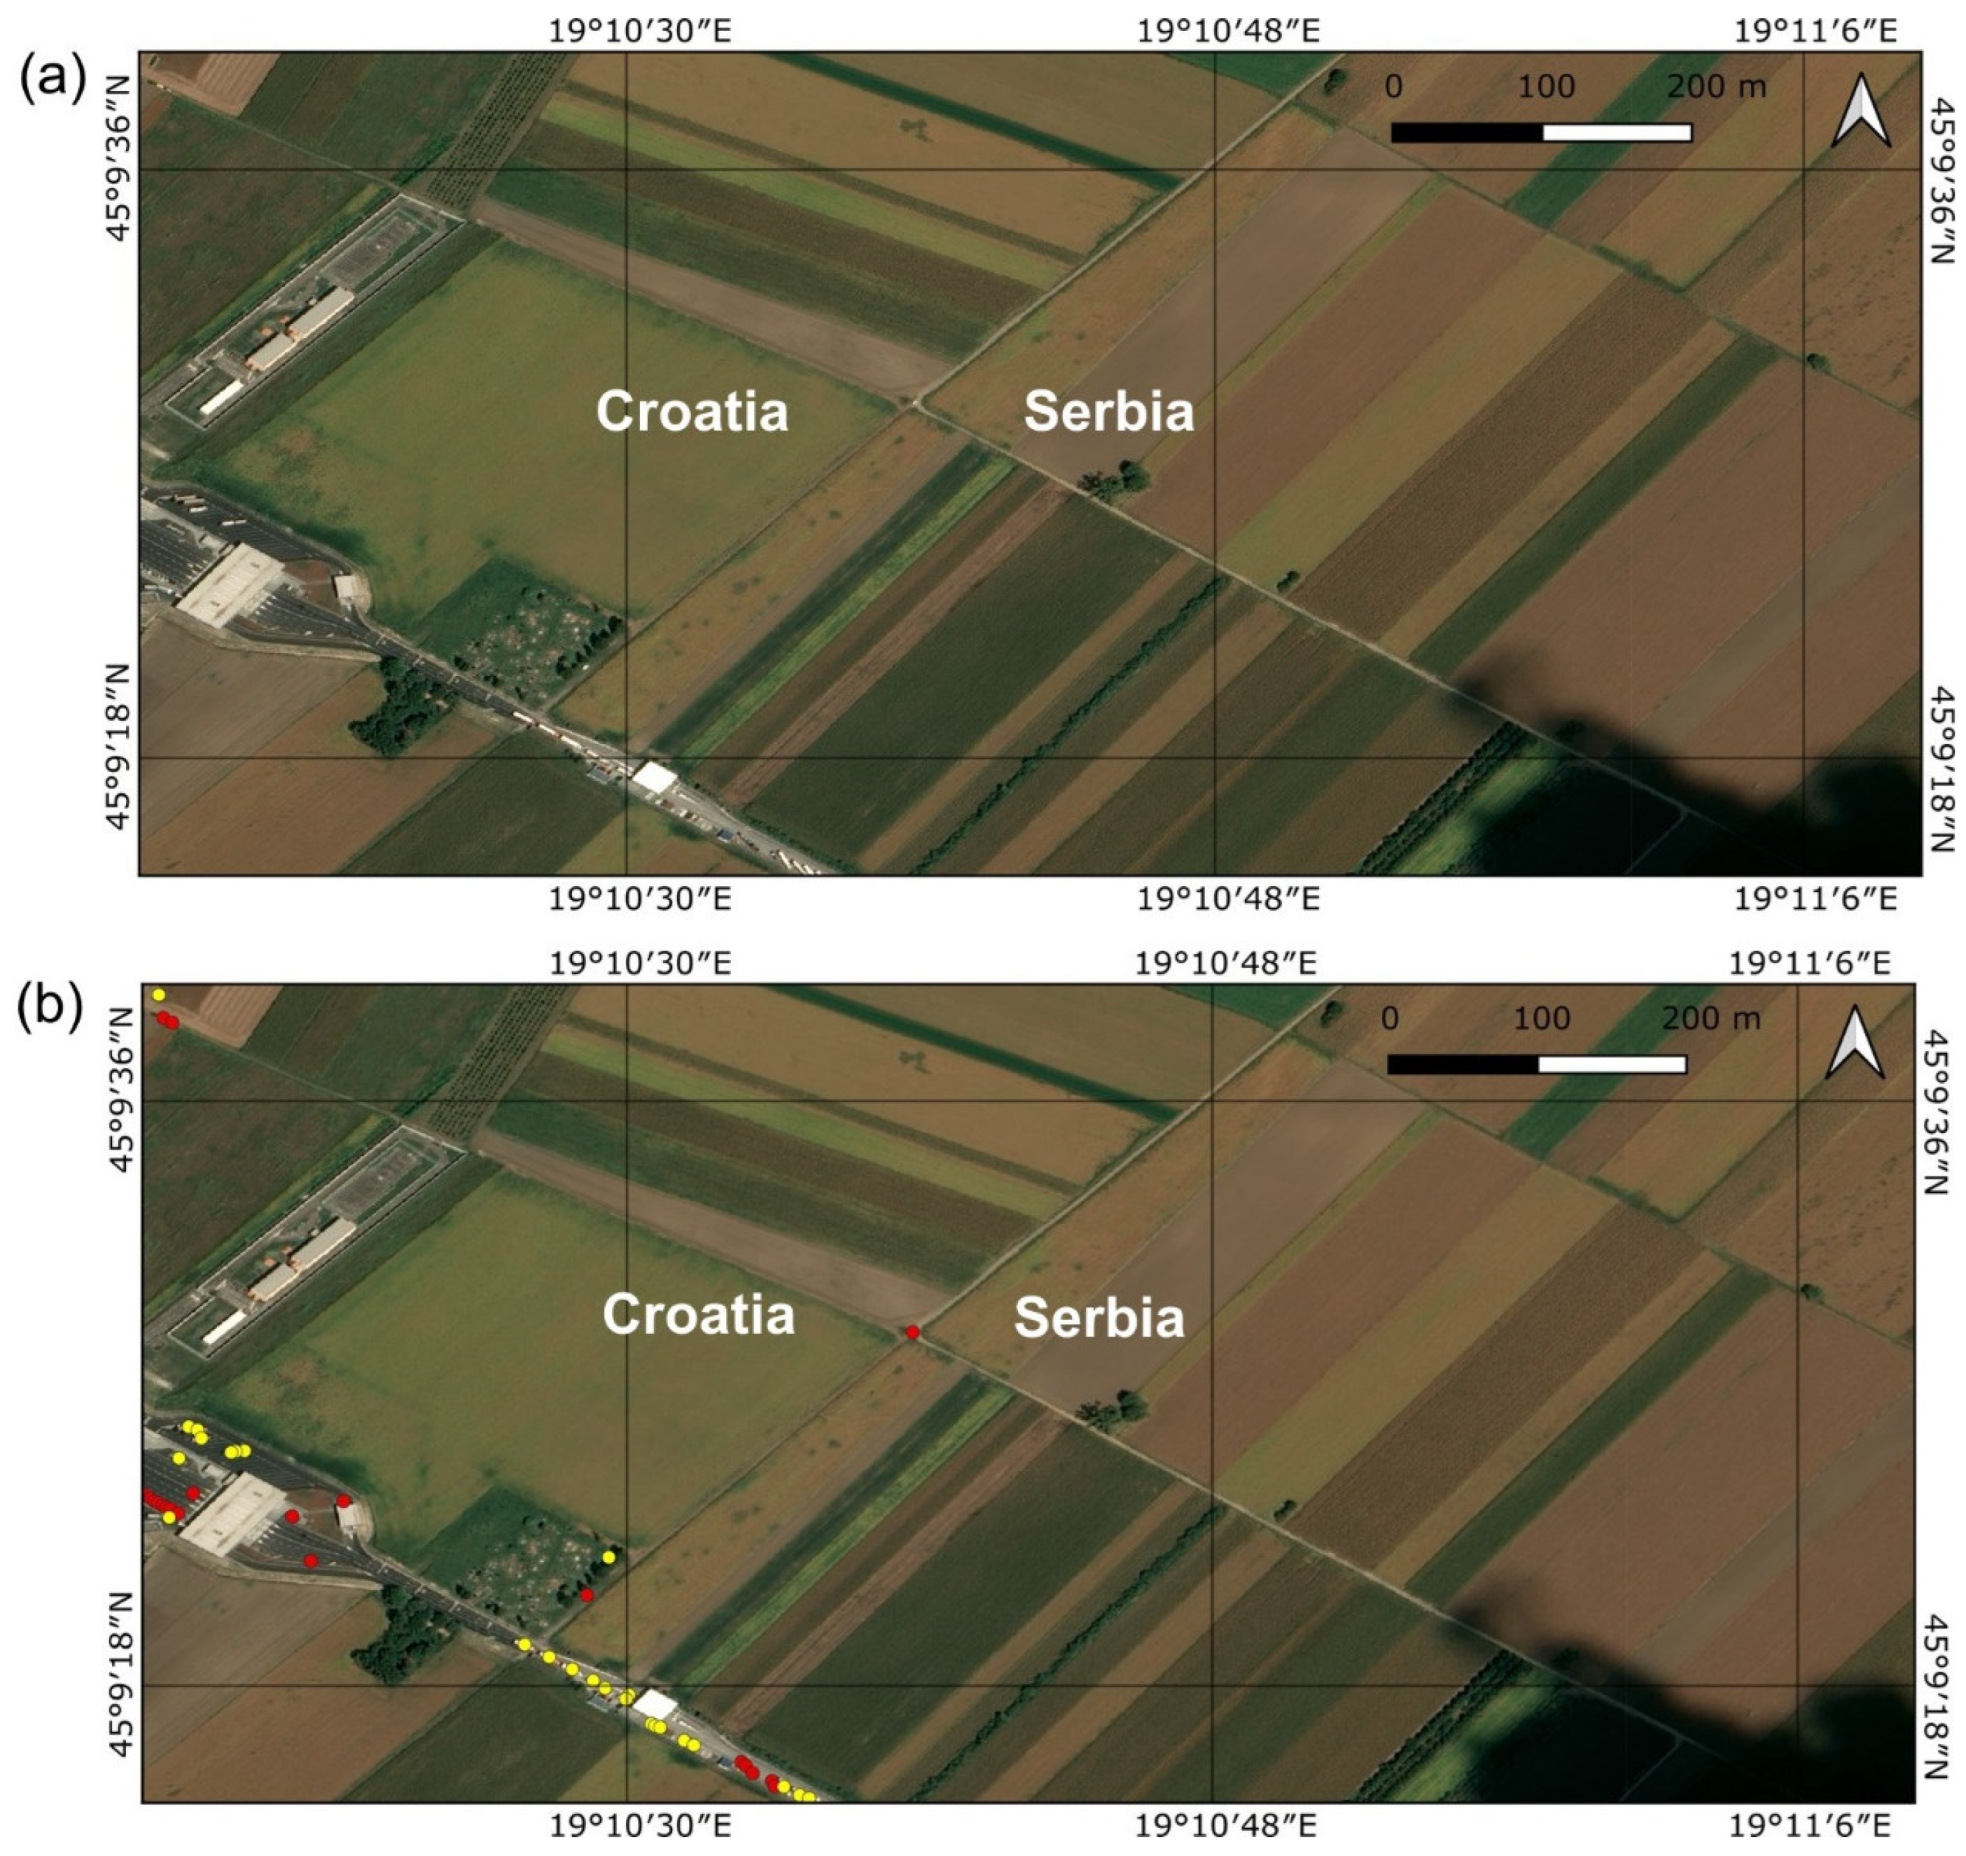
The Google Earth and UP42 platforms were used to obtain high-resolution historical satellite images, dating from 2015 to 2025, from Maxar GeoEye-1, Maxar WorldView-2, Maxar WorldView-3, Pléiades, and Pléiades Neo satellites, representing potential illegal immigration activities (Figure 7, Figure 8, Figure 9 and Figure 10). Verification was performed to provide training data for AI algorithms to autonomously detect anomalies and assess risks associated with illegal migration. An example of automatic cars and tracks detection analysis conducted by algorithms from the UP42 platform is shown in Figure 11.
Figure 7.
Van approached by a group of people on the Croatian–Serbian border, near the border crossing Tovarnik, 19 September 2015. (Source: Google Earth/Maxar, 50 cm VHR imagery.)
Figure 8.
Evolution of an informal migrant camp near the city of Velika Kladuša, Bosnia and Herzegovina, close to the Maljevac border crossing (Cetingrad border sector) in 2021. (a) Baseline imagery from 29 June 2021, prior to the establishment of the illegal migrant camp; (b) 4 September 2021, showing the emergence of the illegal migrant camp, including visible tents and pedestrian trails. (Source: Google Earth/Airbus, 30 cm VHR imagery.)
Figure 9.
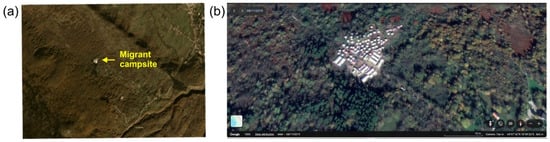
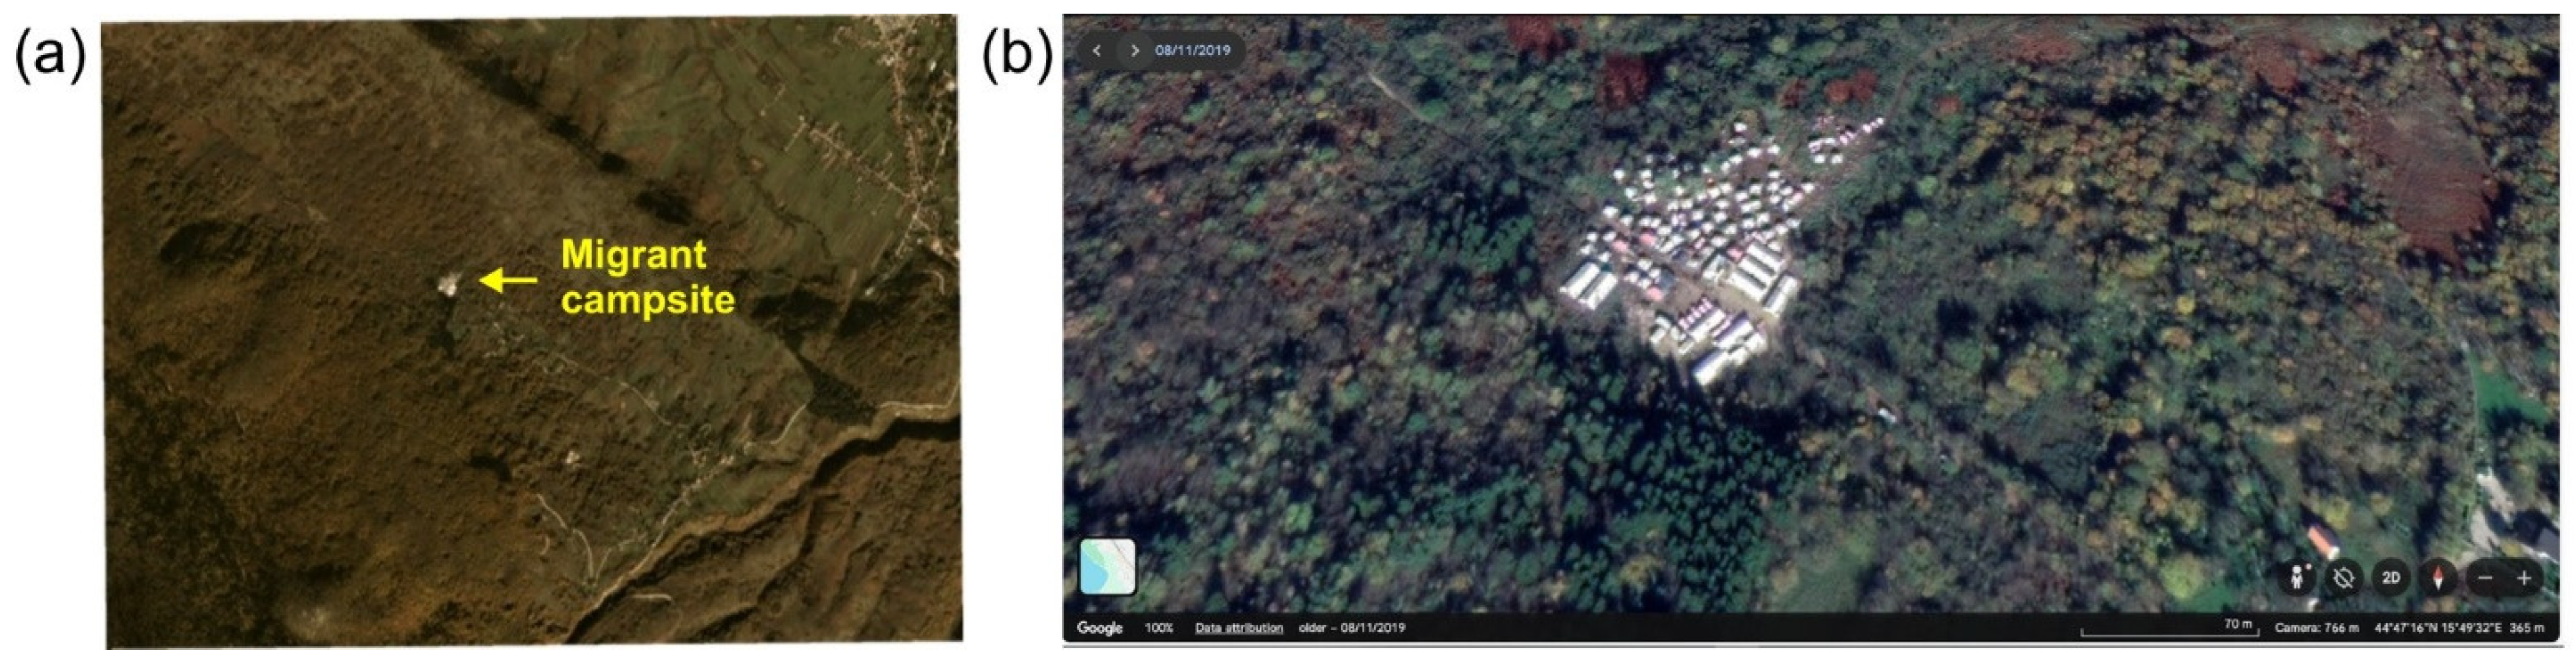
Migrant campsite Vučjak near the Ličko Petrovo Selo border crossing (Željava border sector) on 8 November 2019, Croatia–Bosnia and Herzegovina border. Comparison of (a) PlanetScope 3.5 m low-resolution image and (b) Google/Airbus 0.5 m VHR image.
Figure 10.
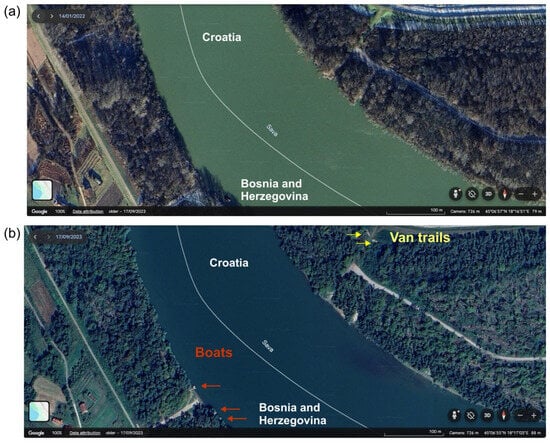
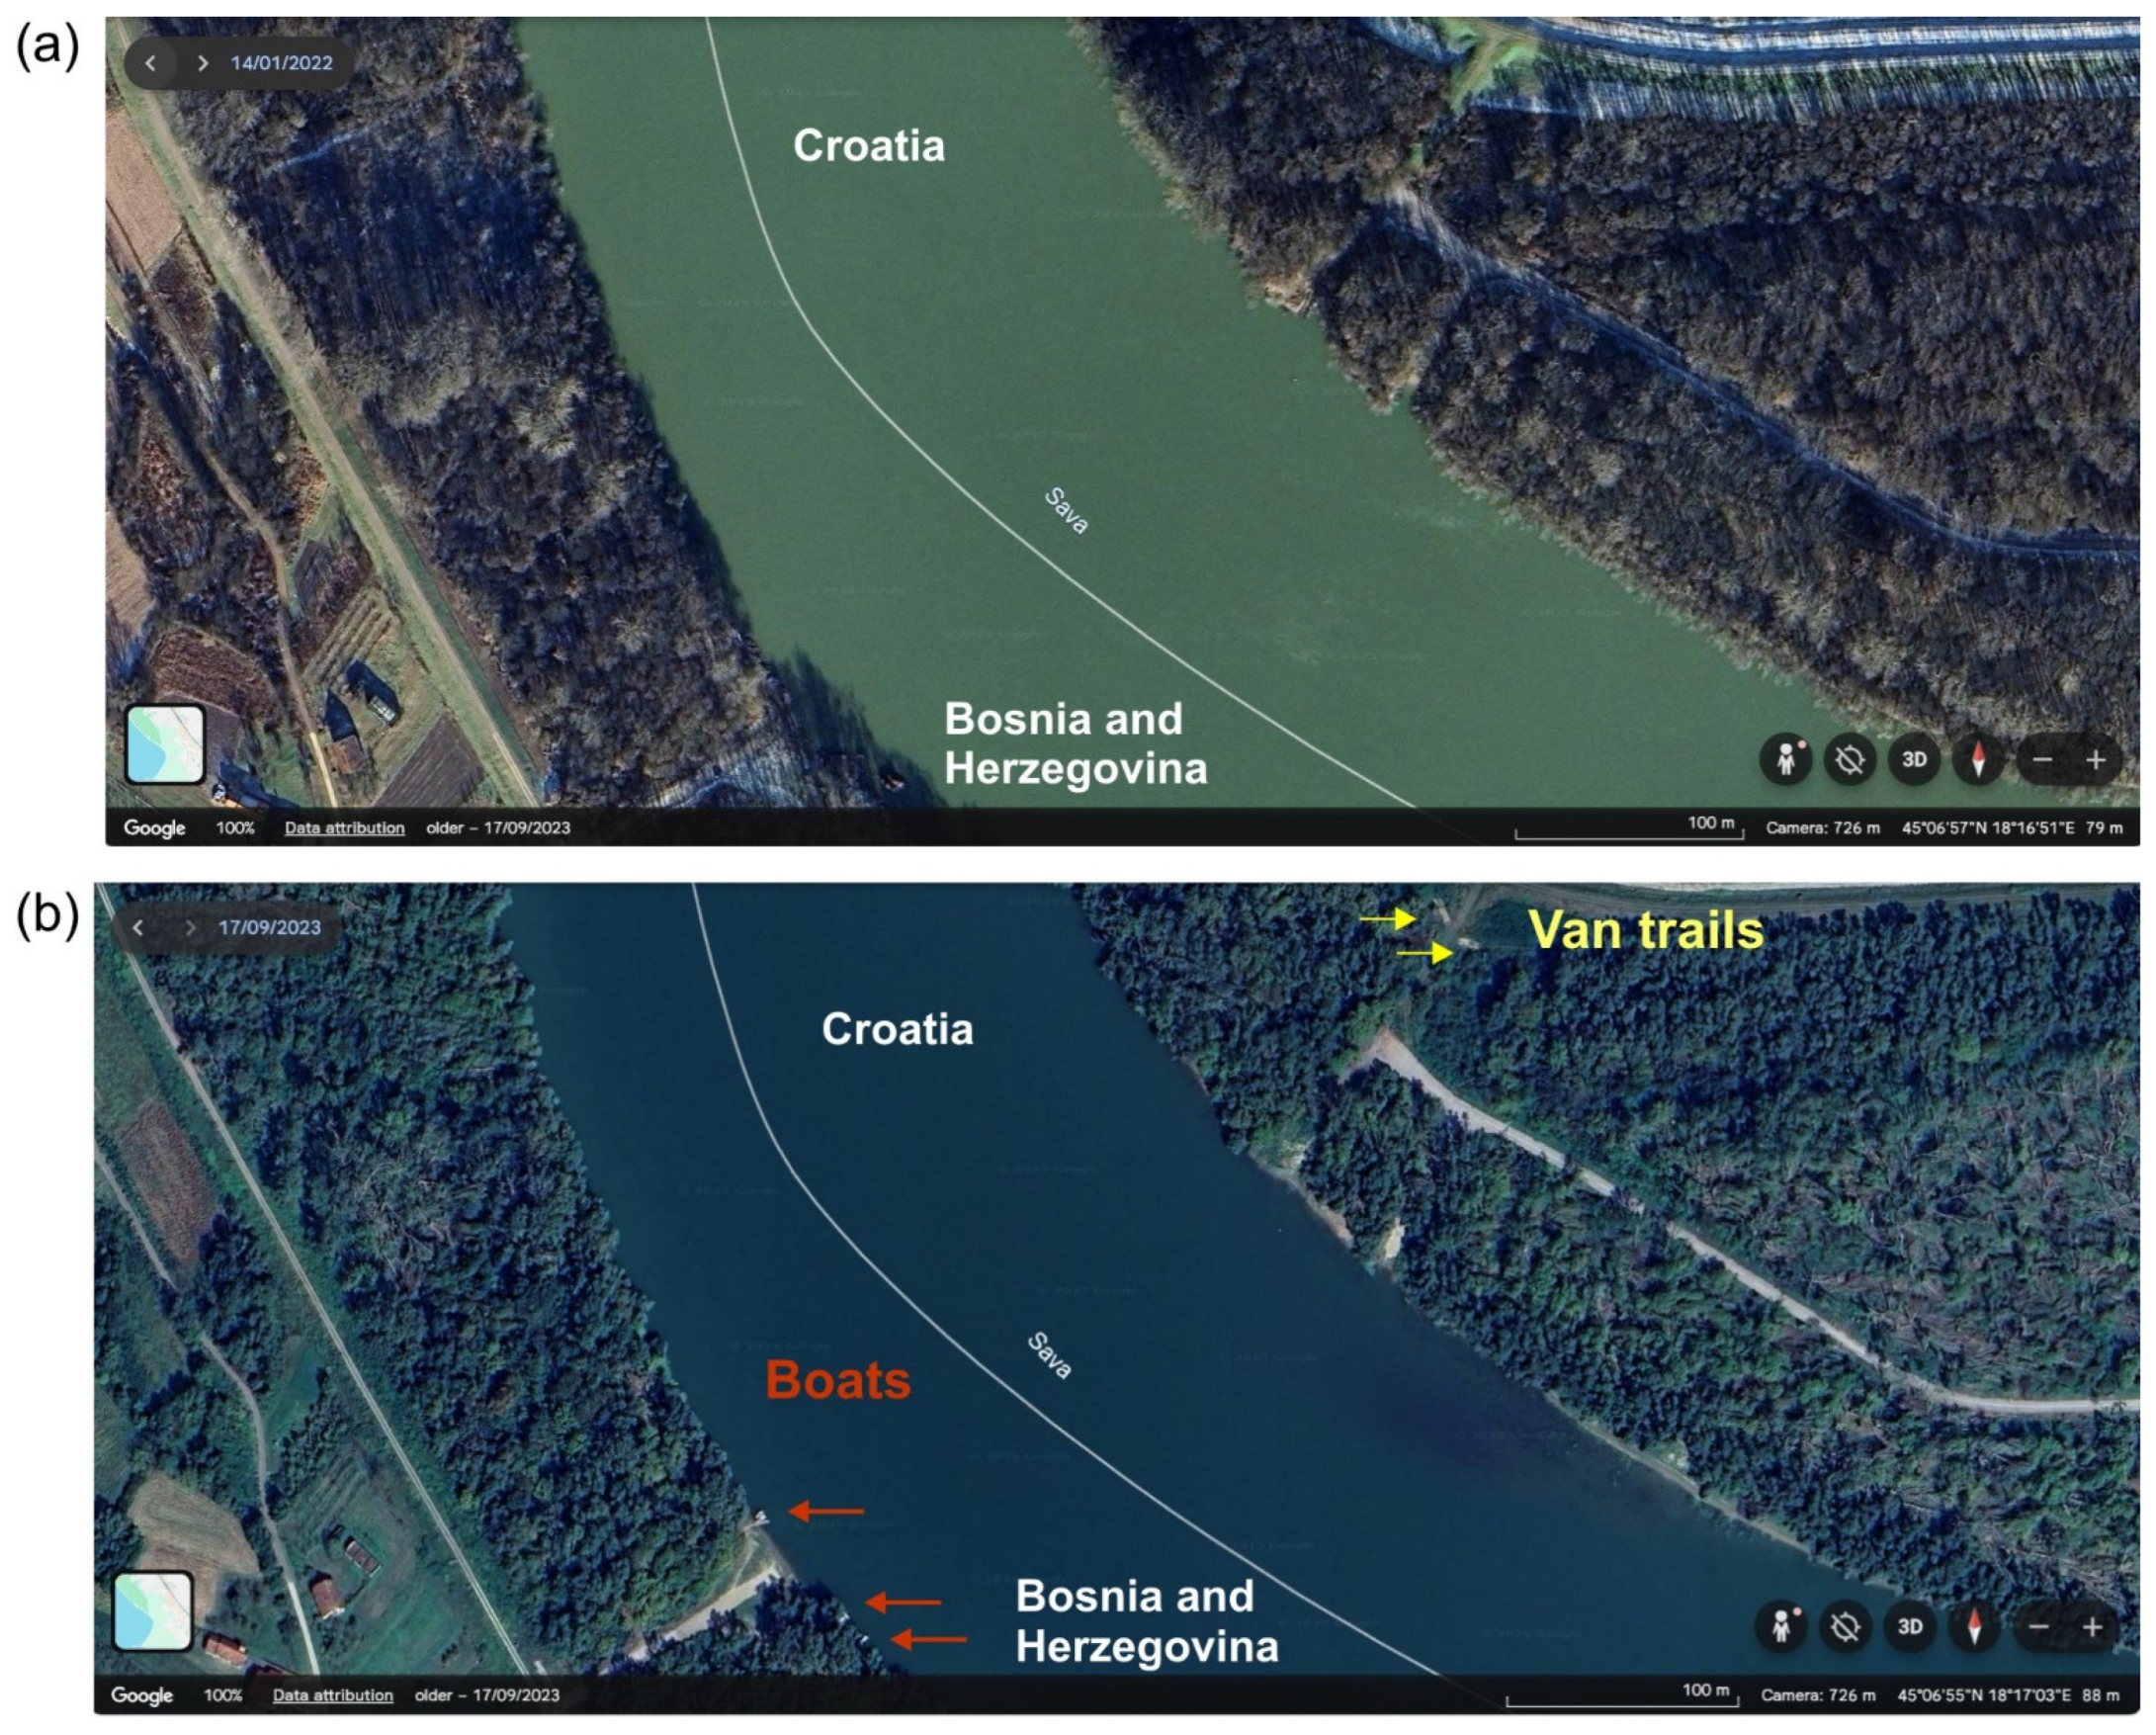
Svilaj (border sector Slavonski Brod, Bosnia and Herzegovina–Croatia border): (a) 14 January 2022, showing a baseline state with no detectable river boats or van trails; (b) 17 September 2023, showing the presence of boats and recently formed van trails leading towards the riverbank (Source: Google Earth/Airbus 0.5 m VHR image).
Figure 11.
Automatic cars and trucks detection at the Tovarnik border crossing (Croatia–Serbia border) on 3 September 2016, was performed using an algorithm available via the ESA NOR and the UP42 platform. (a) Original baseline image. (b) Post-processing results, where red and yellow dots indicate identified cars and trucks, respectively. The cars and trucks detection algorithm accurately identified 90% of vehicles on the main and side roads. (Source: Pléiades 0.3 m VHR image.)
4. Discussion
The presented results demonstrate that the integration of remote sensing, GIS-MCA, and the AHP provides a robust framework for the near-real-time monitoring of illegal migration. A key strength of this approach is the dynamic nature of risk analysis, which enables updates from open-source, low-resolution satellite imagery and new geospatial layers to reflect changing environmental conditions on the ground.
Direct observation of illegal migration is possible by tasking VHR satellites such as Maxar’s satellites (30–50 cm resolution, 25 km2 order limitation), Pléiades (50 cm resolution, 100 km2 order limitation), Pléiades Neo (30 cm resolution, 100 km2 order limitation), BlackSky (83 cm resolution, a scene) [17], Satellogic (70 cm resolution, 50 km2 order limitation) [18], and others. Since VHR satellites have a limited swath (around 10 km), it would be very difficult to monitor the whole border area. However, VHR remote monitoring can be restricted to polygons with areas up to 100 km2, determined by risk analysis as hotspots for illegal border crossing. The current bottleneck for remote border monitoring is a relatively long delivery time and high cost of VHR satellite images, but this situation is rapidly improving with the growing number of private companies offering the VHR remote sensing service. While previous studies have shown that it is possible to use remote sensing to detect tents and shelters in refugee camps [19,20] or human trails [21], in this study, we have shown that in addition to tents, illegal camps, and pedestrian and van trails, it is possible to detect suspicious cars, tracks, river boats and clusters of people and hese features are clearly distinguished from haystacks or herds of animals. This shows possibilities to use VHR remote sensing in various fields such as:
- Agricultural sector: Farmers, ranchers, and livestock management companies (for haystacks and cattle recognition, monitoring herd health, tracking movements), e.g., [22,23].
- Emergency services, search and rescue: For rapidly identifying vehicles, tents, campsites, and clusters of people in disaster zones or remote areas, e.g., [24,25,26].
- Law enforcement and security agencies: For surveillance, crowd monitoring, and identifying suspicious activity or unauthorized encampments, e.g., [27,28].
- Environmental monitoring and conservation: For tracking human activity in protected areas (campsites, vehicles) or monitoring wildlife (cattle, if wild or feral), e.g., [29,30].
- Urban planning and infrastructure management: For traffic analysis (vans, cars) or assessing land use (campsites), e.g., [31,32,33,34].
- Event organizers: For managing crowd density and identifying parking or camping areas, e.g., [35,36].
- Technology developers and researchers: Companies or academic institutions working on computer vision, AI, and autonomous systems can use these validated recognition models to build more sophisticated applications.
4.1. FRONTEX Initiatives for Monitoring Migrations of People by Using EO Technologies
Research conducted under the EU FP6 GMOSS Network of Excellence (2004–2008), including the development of the “border permeability model” [7], provided the scientific and technical foundation for what later became the European Border Surveillance system program, EUROSUR, established in 2013 [37]. EUROSUR is led by the EU Border and Coast Guard Agency, FRONTEX. One of EUROSUR’s objectives is to improve the situational awareness and response capability of EU Member States (MSs) in illegal migration through the network of National Coordination Centers (NCCs). Within the framework of EUROSUR, FRONTEX also provides MSs with near-real-time information from satellites. The satellite data are managed by the Copernicus Border Surveillance (CBS) program [38]. CBS generates, collects, and manages in situ satellite data and collects in situ data from external data providers. The datasets used for CBS risk assessment analysis are listed in Appendix A, Table A1, Table A2, Table A3 and Table A4 [38].
While current institutional reporting frameworks governed by FRONTEX, EUROSUR, and CBS provide valuable broad-scale situational awareness, these established frameworks inherently exhibit major operational information gaps when deployed for tactical, localized border management as listed below:
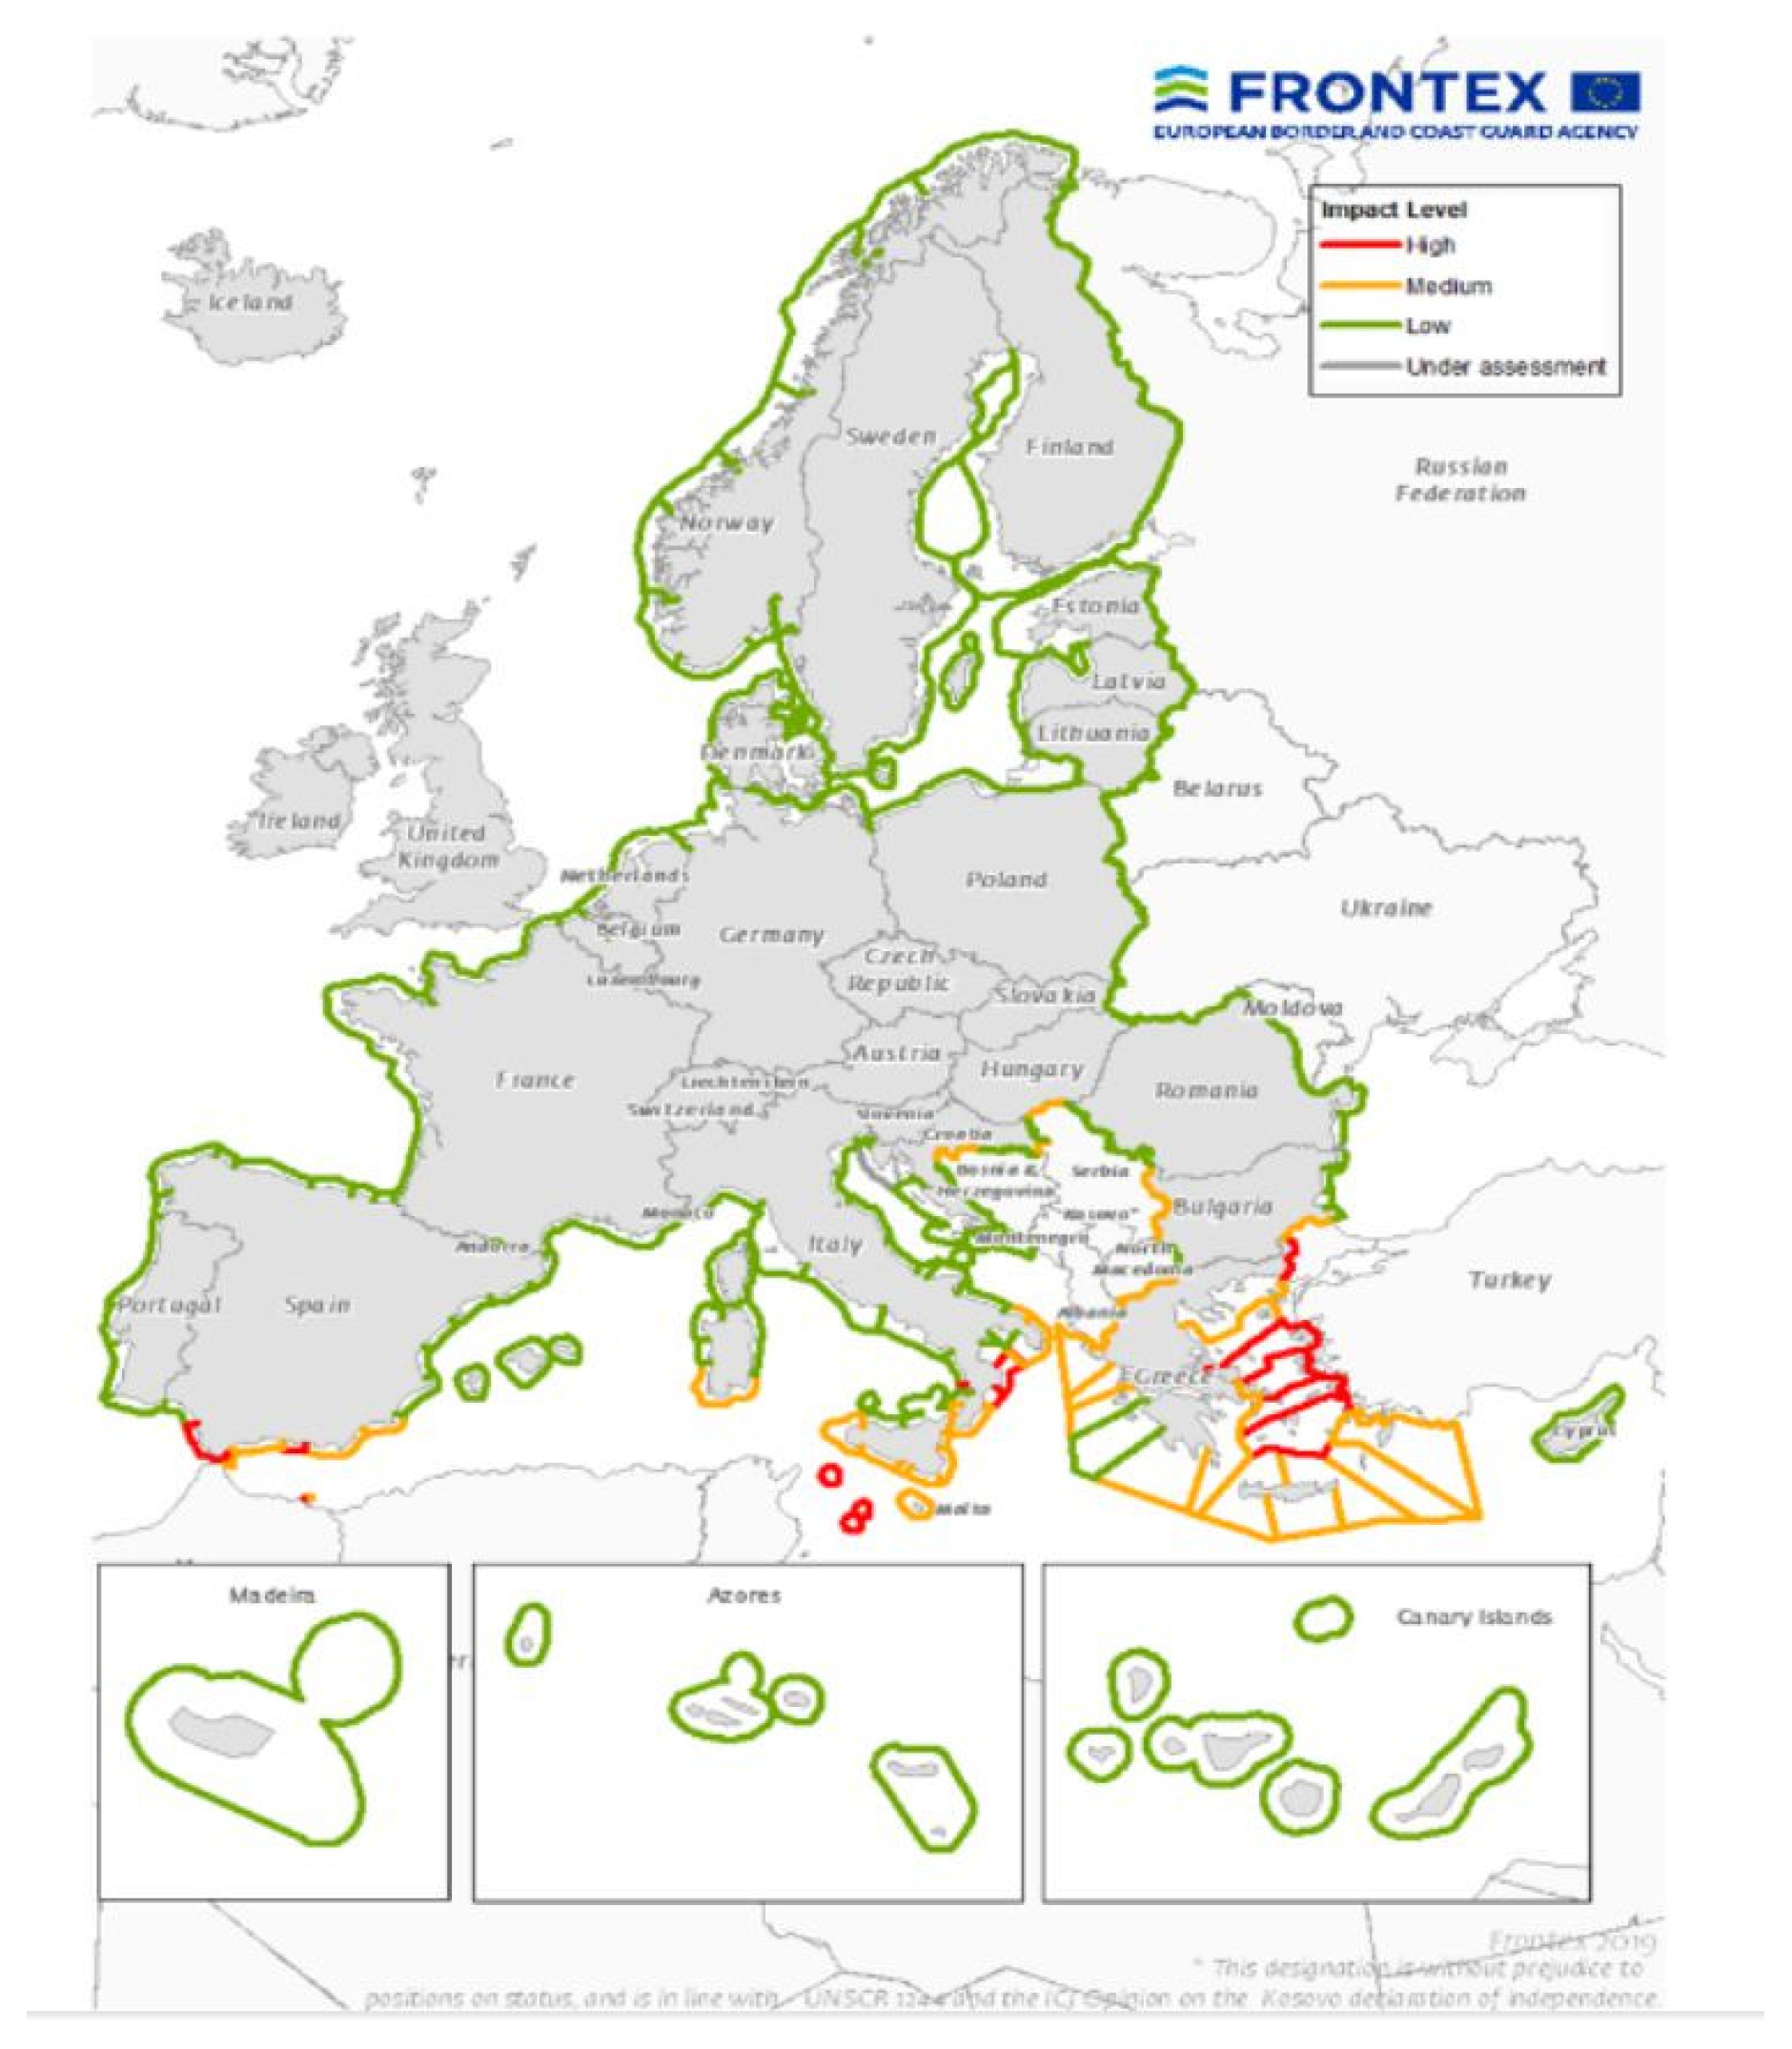
FRONTEX produces the “impact-level map” (Figure 12), which visualizes EU external border sectors under high, medium and low risk of illegal border crossings for actual year [37]. Because these risk designations are based retroactively on historical detection figures from the previous year, they fail to account for highly fluid, real-time adjustments in migratory corridors.
Figure 12.
FRONTEX impact-level map for EU’s external borders for 2019 [37].
While CBS utilizes extensive in situ and satellite datasets (e.g., CLMS, CGLS, and administrative border vectors), these layers lack the analysis required to identify exact crossing points in non-urbanized or rugged terrains.
Consequently, while FRONTEX impact-level maps effectively support the European Commission’s high-level budget allocations and treaty-level interventions, they lack the granular, actionable intelligence local border police forces need to optimize daily patrol deployments and manage immediate resource constraints.
As is shown in Table 1, the number of illegal migrants highly fluctuates from year to year at all migration routes. The Central Mediterranean was under the highest pressure in the period 2015–2025, and the Western Balkan Route was often among the top two routes. The year 2015, with 1.8 million detected illegal migrants on EU entry, was the year with the unprecedently high flow of migrants, which consequently led to the EU migrant crisis with significant social and political repercussions [39]. Since 2017, the EU total number of detected migrants has stabilized between 150,000 and 385,000; however, at the Western Balkan route, this number fluctuated from 5000 to 145,000.
The risk analysis model developed in this study is dynamic and adaptable to various border management requirements across the European region. For example, data on dynamic environmental components such as snow cover and river water levels can be updated every five days using open-source satellite data. VHR satellite monitoring can be tasked for areas identified by the model as hotspots. Thus, the developed model fits well within the existing FRONTEX framework and can provide additional valuable information to border police forces, who can use this information to allocate resources for ground control more effectively.
4.2. Risk Analysis Model
Compared to the permeability model [7], the risk analysis model presented in this study has identified more sectors with an increased risk of illegal border crossings at the Croatian external EU borders. These refined results incorporate insights from Croatian NCC representatives, who observed a recent shift in the migration paradigm. Their findings indicate that migrants are increasingly relying on modern technologies and the assistance of organized crime networks. Therefore, the concept of “hiding”, which was the priority criterion in the permeability model, is given less weight in our risk analysis, while the existing infrastructure and the possibility of transportation to the desired destination after crossing the border on foot become more important. Similarly, water bodies cannot be considered a disadvantage if migrants are assisted by criminal groups in crossing such obstacles. The paradigm shift in migration was also noted in the FRONTEX Strategic Risk Analysis Report (2024) [8], which states that over 90% of illegal migrants use smuggling services for part or all of their journey to the EU. With the increasing availability of encrypted communications, blockchain-based transactions, and sophisticated surveillance systems, smugglers are expected to modify their operations to enhance efficiency and avoid detection. It is important to understand the risk analysis methodology utilized by FRONTEX, as its results are used by the EC to justify budget allocation for border security enhancement. The EC has stated in its official document that it will apply the “risk analysis criteria” to distribute more resources to the MSs with the highest priorities [40].
4.2.1. Risk Analysis Model Validation
Validation shows that the risk analysis model developed in the presented study works as intended, consistently assigning higher risk scores to actual illegal crossing sites that would occur by chance. The association is statistically unambiguous, meaning risk at detection sites exceeds that at background in every configuration (Mann–Whitney p between 2 × 10⁻⁸ and 1 × 10⁻¹⁴, with rank-biserial effect sizes of 0.22–0.30). Beyond mere significance, the model is well calibrated in the sense that risk and the density of recorded crossings increase together. The Continuous Boyce Index (CBI) is positive across both configurations, scoring 0.65 for the domain-wide background and rising to 0.97 under the stricter, bias-controlled target-group background. Driven by monotonically rising P/E curves against a null expectation of approximately zero, these results demonstrate that the model’s calibration strengthens significantly when controlling for spatial sampling bias. Discrimination, by contrast, is more modest (area under the curve 0.61–0.65), as is to be expected when the metric is computed against background rather than verified absences and when the entire study domain is a near-border zone of inherently elevated risk. Nonetheless, this discrimination is genuine, since it is largely unchanged under spatial block cross-validation (within 0.01–0.06 of the resubstitution estimate) and therefore not a product of the spatial clustering of the detection data. The model further outperforms a randomized null surface and a distance-to-water baseline on every metric. The appropriate interpretation of these results is consequently one of spatial concordance rather than point prediction: the risk surface reliably concentrates risk where independent evidence of crossing activity exists, which is the property required of an operational prioritization tool, but it does not, and is not intended to, forecast the occurrence of individual crossing events. However, low specificity at low thresholds is structural because the whole domain is a near-border high-risk band (border proximity is a model facilitator), so almost all pixels are scored as “elevated risk”. It is why the target-group background (which holds border segment constant) is the more informative comparison.
The stability of these results was assessed through a series of sensitivity analyses. To control the spatial clustering of the detection points, which can inflate apparent discrimination, the evaluation was repeated under spatial block cross-validation, with detections assigned to 40 km blocks and each block scored from the remaining data. The area under the curve was essentially unchanged relative to the resubstitution estimate (e.g., 0.60 versus 0.61 under the domain-wide background), indicating that the observed performance is not an artefact of spatial autocorrelation. The influence of the positional uncertainty of the MOI records, which are geocoded to settlement centroids and may therefore be displaced by more than the grid resolution from the true location, was examined by extracting risk not only at the centroid but also as the maximum and mean within 1 km and 2 km neighborhoods. The area under the curve increased from 0.61 at the centroid to 0.74 and 0.78 for the maximum within 1 km and 2 km respectively, while the neighborhood mean remained near 0.57, indicating that the centroid-based estimate represents a conservative lower bound and that performance improves substantially once the known coordinate uncertainty is considered. Sensitivity to the definition of the background was addressed by reporting every metric under both a domain-wide and a stricter target-group background, the conclusions strengthening rather than weakening under the latter (the Continuous Boyce Index rising from 0.65 to 0.97). All random procedures used a fixed seed, and all filters, sample sizes and thresholds are documented to ensure reproducibility.
4.2.2. Limitations and Uncertainties
Several limitations bound the interpretation of these results. Firstly, the validation is detection-only. The dataset does not record verified absences, so all discrimination metrics are detection-vs-background and quantify concentration of risk relative to the near-border domain, not the model’s ability to predict individual crossings. Furthermore, the dataset carries sampling and effort bias (patrol deployment and reporting) and is not a random sample of true crossings. Because MOI expert judgment informed the AHP weights, MOI detections are a semi-dependent test. Because the evaluated domain is restricted to a narrow band along the border, the distance-to-border variable as a model facilitator is structurally low everywhere. This artificially inflates risk scores across the domain, creating a ‘border-proximity artifact.’ We addressed this by drawing background points from the same near-border zone, ensuring a more rigorous and appropriate background comparison.
4.3. Future Directions
In this study, the AHP was used to derive criteria weights from structured pairwise comparisons. Future iterations of this predictive framework can be advanced through three primary methodological enhancements: (i) transitioning from standard AHP to Fuzzy AHP will allow the model to explicitly capture and defuzzify expert input imprecision by utilizing triangular fuzzy numbers, thereby increasing robustness against subjective uncertainty [41]; (ii) replacing the linear hierarchy of the AHP with an ANP framework will support the modeling of non-linear features and complex interdependencies, though it demands higher computational resources [42]; and (iii) incorporating a randomized shortest paths framework will enable all-to-all pixel connectivity mapping. This produces corridor heatmaps that can serve as post-processing filters to further refine high-priority monitoring polygons.
The model developed in this study is highly transferable because it relies on global open-source datasets (OpenStreetMap, ESA WorldCover, Copernicus DEM) rather than local proprietary data. To apply the model elsewhere, researchers would need to adjust the local vector layers (e.g., specific road networks) while maintaining the same satellite-derived environmental raster. As this study serves as a proof of principle, the weights derived from Croatian NCC experts are context-specific. Transferring the model would require a new AHP session with local stakeholders to reflect regional priorities. By maintaining a modular structure, the model acts as a template that can be recalibrated for any terrestrial border where spatial data are available.
While the current study provides a robust validation of the model along the Croatian border, it is important to acknowledge that the universality of this approach across the EU external borders and broader Western Balkan region remains to be tested. Future research should focus on cross-regional validation in key transit Western Balkan countries such as Bosnia and Herzegovina, Serbia, and Hungary. While this study identifies general migration patterns, future iterations should aim to incorporate high-resolution spatial characteristics, such as identifying urban or rural hubs where migrants are gathered by facilitators, mapping the specific routes used by criminal groups to bypass traditional surveillance, and analyzing the tactical selection of crossing points based on shifting enforcement patterns. Integrating these behavioral and organizational data into the risk assessment criterion system would allow the model to move beyond environmental and geographic anomalies towards a more comprehensive pre-frontier intelligence analysis of organized border crossings.
5. Conclusions
A comprehensive review of the scientific literature, technical reports, and consultations with the MoI confirms that remote sensing is not yet standard practice in illegal migration monitoring. However, rapid advancements in EO technologies, combined with AI-driven change detection, are positioning remote sensing as an indispensable tool for enhancing frontier and pre-frontier situational awareness. This study introduces a remote sensing-driven risk assessment framework that extracts environmental variables directly from open-source satellite imagery. The operational value of the proposed model is demonstrated by the following key findings:
- Transportation infrastructure and proximity to buildings emerged as the most critical predictors of illegal migration corridors, yielding dominant model weights of 0.326 and 0.217, respectively. Secondary environmental variables include land cover, distance to water bodies, terrain slope, cold days, warm days, snow days, and annual precipitation.
- Quantitative testing using 7481 geocoded historical incidents demonstrated the model’s high predictive accuracy and robust calibration, achieving a CBI of up to 0.97 when rigorously controlling for spatial autocorrelation and patrol effort bias.
- The model is highly adaptable, allowing border authorities to integrate new GIS layers and update dynamic variables using near-real-time satellite observations.
- The resulting 1 × 1 km resolution risk map provides localized, data-driven information that enables border security forces to optimize daily patrol deployments and maximize resource efficiency.
- By focusing VHR satellite collection directly on model-predicted hotspots, the methodology successfully isolated anomalies as specific indicators of illegal migratory activities, such as suspicious vans, river boats, tire tracks, tents, informal campsites, and human clusters, which were easily distinguished from background civilian and agricultural activities.
This research demonstrates that integrating GIS-MCA and the AHP supplements traditional border operations with invaluable, data-driven pre-intelligence.
Supplementary Materials
The following supporting information can be downloaded at: https://www.mdpi.com/article/10.3390/ijgi15070304/s1, Table S1: Detections of illegal migrants 2025 and 2026_gps locations.
Author Contributions
Conceptualization, Jasmina Obhođaš and Dorijan Radočaj; methodology, Dorijan Radočaj and Jasmina Obhođaš; validation, Branimir Radun, Bruno Ćaleta and Tea Teskera; formal analysis, Dorijan Radočaj, Andrija Vinković, Andrew Dolan and Tarzan Legović; investigation, Jasmina Obhođaš, Andrew Dolan, Gordon Campbell, Mara Knežević, Slobodan Marković, and Gilio Toić Sintić; writing original draft preparation, Jasmina Obhođaš; review and editing, All; supervision, Jasmina Obhođaš and Maria Michela Corvino; project administration, Jasmina Obhođaš and Maria Michela Corvino. All authors have read and agreed to the published version of the manuscript.
Funding
This research was funded by ESA project PO 4000144391_ HR3_12_EBSEC; ESANoR project ID 5727jt via UP42 platform; and ESA Third Part Mission project PP0106972 via Airbus OneAtlas.
Data Availability Statement
The datasets generated in the current study are available at https://zenodo.org/records/18515729 (version 1 published on 7 February 2026); doi:10.5281/zenodo.18515728 (posted on 21 May 2026).
Acknowledgments
We are thankful to Francesco Cantore and Diego Alarcon Diaz from UP42 for their help in using the UP42 platform. The authors have reviewed and edited the output and take full responsibility for the content of this publication.
Conflicts of Interest
Author Branimir Radun, Bruno Ćaleta and Tea Teskera were employed by Oikon Ltd. The remaining authors declare that the research was conducted in the absence of any commercial or financial relationships that could be construed as a potential conflict of interest.
Correction Statement
This article has been republished with a minor correction to the existing affiliation information. This change does not affect the scientific content of the article.
Abbreviations
The following abbreviations are used in this manuscript:
| AHP | Analytic Hierarchy Process |
| ANP | Analytic Network Process |
| AUC | Area Under the Receiver Operating Characteristic Curve |
| AUC-PR | Area Under the Precision–Recall Curve |
| block-CV AUC | Spatial Block Cross-Validation Area Under the Curve |
| C3S | Copernicus Climate Change Service |
| CBI | Continuous Boyce Index |
| CBS | Copernicus Border Surveillance |
| CEMS | Copernicus Emergency Management Service |
| CGLS | Copernicus Global Land Service |
| CI | Consistency Index |
| CLC | Copernicus Land Cover |
| CLMS | Copernicus Land Monitoring Service |
| COP-DEM | Copernicus Digital Elevation Model) |
| CR | Consistency Ratio |
| CSCDA | Copernicus Space Component Data Access |
| CSS | Copernicus Security Service |
| DEM | Digital Elevated Model |
| EO | Earth Observation |
| EUROSUR | The European Border Surveillance system |
| EU/SAC | EU/Schengen Associated Countries |
| FAHP | Fuzzy AHP |
| FN | False Negative |
| FP | False Positive |
| FRONTEX | The European Border and Coast Guard Agency |
| GHLS | Global Human Settlement Layer |
| GLC | Global Land Cover |
| GIS | Geographic Information Systems |
| JRC | Joint Research Centre |
| KNMI | Royal Netherlands Meteorological Institute |
| LiDAR | Light Detection and Ranging |
| maxTSS | Maximum True Skill Statistic |
| MCA | Multi-Criteria Analysis |
| MoI | Ministry of Interior |
| MSs | Member States |
| MWU p | Mann–Whitney U test p-value |
| NCCs | National Coordination Centers |
| NOR | Network of Resources |
| OAT | One-at-a-time |
| OGC | Open Geospatial Consortium |
| RI | Random Consistency Index |
| TN | True Negative |
| TP | True Positive |
| TSS | True Skill Statistic |
| VHR | Very-High-Resolution |
| WLC | Weighted Linear Combination |
Appendix A
Table A1.
Applied Copernicus-funded in situ datasets [38].
Table A2.
Applied non-Copernicus-funded datasets [38].
Table A3.
Additional in situ reference data (updates and special focus on the 25 km zone of both sides of the EU/SAC external borders) [38].
Table A4.
Real-time or near-real-time data (occasional, EU/SAC and neighboring countries) [35].
References
- Greenhill, K.M. Open Arms Behind Barred Doors: Fear, Hypocrisy and Policy Schizophrenia in the European Migration Crisis. Eur. Law J. 2016, 22, 317–332. [Google Scholar] [CrossRef] [Scilit]
- Gladysh, M.; Sychov, V. The Influence of the Migration Crisis of 2015 on the EU Migration Policy. Stud. Eur. 2020, 24, 9–23. [Google Scholar] [CrossRef] [Scilit]
- Bossong, R.; Carrapico, H. (Eds.) EU Borders and Shifting Internal Security: Technology, Externalization and Accountability; Springer International Publishing: Cham, Switzerland, 2016; pp. 1–238. [Google Scholar]
- Earth Observation for Border Management. FRONTEX. 2025. Available online: https://www.frontex.europa.eu/assets/Publications/General/2025-12-05_Earth_Observation_for_Border_Management.pdf (accessed on 1 January 2026).
- Palmer, C. Very low Earth orbit satellites promise greater resolution…and less privacy. Engineering 2025, 46, 6–8. [Google Scholar] [CrossRef] [Scilit]
- Zeung, G.; Pesaresi, M. (Eds.) Global Monitoring for Security and Stability (GMOSS)—Integrated Scientific and Technological Research Supporting Security Aspects of the European Union; OPOCE: Luxembourg, 2007; p. JRC41424. [Google Scholar] [CrossRef] [PubMed]
- Stephenne Massart, N.; Pesaresi, M. Spatial Permeability Model at the European Union Land Border; European Commission: Brussels, Belgium, 2006; p. JRC34442. [Google Scholar]
- FRONTEX Strategic Risk Analysis Report 2024. Available online: https://prd.frontex.europa.eu/wp-content/uploads/strategic-risk-analysis-2024-report.pdf (accessed on 1 January 2026).
- FRONTEX Migratory Routes 2025. Available online: https://www.frontex.europa.eu/what-we-do/monitoring-and-risk-analysis/migratory-routes/migratory-routes/ (accessed on 1 January 2026).
- Saaty, T.L.; Vargas, L.G. Models, Methods, Concepts & Applications of the Analytic Hierarchy, 2nd ed; International Series in Operations Research & Management Science; Springer International Publishing: Cham, Switzerland, 2012; Volume 175, pp. 1–345. [Google Scholar] [CrossRef] [Scilit]
- Jurić, K. Statistical information 2011. In Geographical and Meteorological Data; Ostroški, L., Ed.; Croatian Bureau of Statistics: Zagreb, Croatia, 2011; p. 12. [Google Scholar]
- Climate of Croatia. Croatian Meteorological and Hydrological Service, 2026. Available online: https://meteo.hr/klima_e.php?section=klima_hrvatska¶m=k1 (accessed on 2 January 2026).
- Available online: https://ec.europa.eu/eurostat/web/gisco/geodata/digital-elevation-model/eu-dem (accessed on 1 January 2026).
- Metzger, M.J.; Bunce, R.G.H.; Jongman, R.H.G.; Mücher, C.A.; Watkins, J.W. A climatic stratification of the environment of Europe. Glob. Ecol. Biogeogr. 2005, 14, 549–563. [Google Scholar] [CrossRef] [Scilit]
- UP42 Earth Observation Platform. Available online: https://up42.com/ (accessed on 3 January 2026).
- ESA Initiative Network of Resources. Available online: https://nor-discover.org/ (accessed on 3 January 2026).
- BlackSky Spectra. Available online: https://blacksky.com/technology/ (accessed on 5 January 2026).
- Satellogic. Available online: https://satellogic.com/technology/satellites/ (accessed on 5 January 2026).
- Avtar, R.; Kouser, A.; Kumar, A.; Singh, D.; Misra, P.; Gupta, A.; Yunus, A.P.; Kumar, P.; Johnson, B.A.; Dasgupta, R.; et al. Remote Sensing for International Peace and Security: Its Role and Implications. Remote Sens. 2021, 13, 439. [Google Scholar] [CrossRef] [Scilit]
- Meisner, R.; Lang, S.; Erland Jungert, E.; Almer, A.; Tiede, D.; Sparwasser, N.; Mertens, K.; Göbel, R.; Blaschke, T.; De la Cruz, A.; et al. Data Integration and Visualization for Crisis Applications. In Remote Sensing from Space; Jasani, B., Pesaresi, M., Schneiderbauer, S., Zeug, G., Eds.; Springer: Heidelberg, Germany, 2009; pp. 141–160. [Google Scholar] [CrossRef] [Scilit]
- Stephenne, N.; Magoni, R.; Laneve, G. From Real Time Border Monitoring to a Permeability Model. In Remote Sensing from Space; Jasani, B., Pesaresi, M., Schneiderbauer, S., Zeug, G., Eds.; Springer: Heidelberg, Germany, 2009; pp. 239–259. [Google Scholar] [CrossRef] [Scilit]
- Laradji, I.; Rodriguez, P.; Kalaitzis, F.; Vazquez, D.; Young, R.; Davey, E.; Lacoste, A. Counting Cows: Tracking Illegal Cattle Ranching from High-Resolution Satellite Imagery. arXiv 2020, arXiv:2011.07369. [Google Scholar] [CrossRef] [Scilit]
- Mücher, C.A.; Los, S.; Franke, G.J.; Kamphuis, C. Detection, identification and posture recognition of cattle with satellites, aerial photography and UAVs using deep learning techniques. Int. J. Remote Sens. 2022, 43, 2377–2392. [Google Scholar] [CrossRef] [Scilit]
- Thoreau, M.; Wilson, F. SaRNet: A Dataset for Deep Learning Assisted Search and Rescue with Satellite Imagery. arXiv 2021, arXiv:2107.12469. [Google Scholar] [CrossRef] [Scilit]
- Mazzanti, P.; Scancella, S.; Virelli, M.; Frittelli, S.; Nocente, V.; Lombardo, F. Assessing the Performance of Multi-Resolution Satellite SAR Images for Post-Earthquake Damage Detection and Mapping Aimed at Emergency Response Management. Remote Sens. 2022, 14, 2210. [Google Scholar] [CrossRef] [Scilit]
- Růžičková, K.; Růžička, J.; Skřejpková, K.; Chaloupková, H.; Svobodová, I. Advanced Division of Search Areas for Missing Persons in Non-Urban Environments. ISPRS Int. J. Geo-Inf. 2025, 14, 352. [Google Scholar] [CrossRef] [Scilit]
- Wu, T.; Xia, L.; Wu, W.; Ma, J. The Application of High-resolution Remote Sensing and Change Detection Technologies in Law Enforcement and Supervision of Land Resources. J. Geo-Inf. Sci. 2016, 18, 962–968. [Google Scholar]
- Xiao, T.; Wang, Q.; Lu, P.; Huang, T.; Tong, X.; Atkinson, P.M. Crowd Detection Using Very-Fine-Resolution Satellite Imagery. arXiv 2025, arXiv:2504.19546. [Google Scholar] [CrossRef] [Scilit]
- Wu, Z.; Zhang, C.; Gu, X.; Duporge, I.; Hughey, L.F.; Stabach, J.A.; Skidmore, A.K.; Hopcraft, J.G.C.; Lee, S.J.; Atkinson, P.M.; et al. Deep learning enables satellite-based monitoring of large populations of terrestrial mammals across heterogeneous landscape. Nat. Commun. 2023, 14, 3072. [Google Scholar] [CrossRef] [Scilit] [PubMed]
- Wang, H.; Tang, Y.; Jing, L.; Li, H.; Ding, H.; Dou, C. Multi-source remote sensing data for monitoring natural reserves: A case study on the Shaanxi Hanzhong crested ibis National Nature Reserve, China. Int. J. Digit. Earth 2025, 18, 2528655. [Google Scholar] [CrossRef] [Scilit]
- Gomes, A.M.; Sousa, A.M.; Carvalho, M.W.; Sousa, W.D.; Silva, M.V.; André, G.; Medeiros, A.D.; Silva, J.L.; Oliveira-Júnior, J.F.; Machado, N.A. Assessment of Land Degradation in the State of Maranhão to Support Sustainable Development Goal 15.3.1 in the Agricultural Frontier of MATOPIBA, Brazil. ISPRS Int. J. Geo-Inf. 2025, 14, 356. [Google Scholar] [CrossRef] [Scilit]
- Guo, Z.; Xu, H.; Lin, Q. Automated Identification and Spatial Pattern Analysis of Urban Slow-Moving Traffic Bottlenecks Using Street View Imagery and Deep Learning. ISPRS Int. J. Geo-Inf. 2025, 14, 351. [Google Scholar] [CrossRef] [Scilit]
- Li, M.; Stein, A. Mapping Land Use from High Resolution Satellite Images by Exploiting the Spatial Arrangement of Land Cover Objects. Remote Sens. 2020, 12, 4158. [Google Scholar] [CrossRef] [Scilit]
- Li, X.; Men, F.; Lv, S.; Jiang, X.; Pan, M.; Ma, Q.; Yu, H. Vehicle Detection in Very-High-Resolution Remote Sensing Images Based on an Anchor-Free Detection Model with a More Precise Foveal Area. ISPRS Int. J. Geo-Inf. 2021, 10, 549. [Google Scholar] [CrossRef] [Scilit]
- Sirmacek, B.; Reinartz, P. Automatic Crowd Analysis from Very High Resolution Satellite Images. Int. Arch. Photogramm. Remote Sens. Spat. Inf. Sci. 2011, XXXVIII-3/W22, 221–226. [Google Scholar] [CrossRef] [Scilit]
- Zambanini, S.; Loghin, A.M.; Pfeifer, N.; Soley, E.M.; Sablatnig, R. Detection of Parking Cars in Stereo Satellite Images. Remote Sens. 2020, 12, 2170. [Google Scholar] [CrossRef] [Scilit]
- EUROSUR. Available online: https://home-affairs.ec.europa.eu/policies/schengen/eurosur_en (accessed on 15 January 2026).
- Copernicus Border Surveillance Program. Available online: https://insitu.copernicus.eu/resources/library/copernicus-security-service-border-surveillance-state-of-play-report-2024/@@download/file (accessed on 5 January 2026).
- Menjívar, C.; Ruiz, M.; Immanuel Ness, I. (Eds.) The Oxford Handbook of Migration Crises; Oxford University Press: New York, NY, USA, 2019; pp. 1–918. [Google Scholar] [CrossRef] [Scilit]
- Horii, S. The effect of Frontex’s risk analysis on the European border controls. Eur. Politics Soc. 2016, 17, 242–258. [Google Scholar] [CrossRef] [Scilit]
- Emrouznejad, A.; Ho, W. (Eds.) Fuzzy Analytic Hierarchy Process, 1st ed.; Chapman and Hall/CRC Press: Boca Raton, FL, USA, 2017; pp. 1–430. [Google Scholar] [CrossRef] [Scilit]
- Ishizaka, A.; Nemery, P. Analytic Network Process. In Multi-Criteria Decision Analysis, Methods and Software, 1st ed.; Ishizaka, A., Nemery, P., Eds.; John Wiley & Sons: Oxford, UK, 2013; pp. 59–80. [Google Scholar] [CrossRef] [Scilit]

Disclaimer/Publisher’s Note: The statements, opinions and data contained in all publications are solely those of the individual author(s) and contributor(s) and not of MDPI and/or the editor(s). MDPI and/or the editor(s) disclaim responsibility for any injury to people or property resulting from any ideas, methods, instructions or products referred to in the content. |
© 2026 by the authors. Published by MDPI on behalf of the International Society for Photogrammetry and Remote Sensing. Licensee MDPI, Basel, Switzerland. This article is an open access article distributed under the terms and conditions of the Creative Commons Attribution (CC BY) license.