


Abstract
Wind power development is accelerating globally, leading to an imminent large-scale retirement of wind turbines and increasing the need for recycling infrastructure. This study proposes an integrated framework for recycling center site selection by combining Geographic Information System (GIS), AHP–CRITIC weighting, and Super-Efficiency Data Envelopment Analysis (DEA). A hierarchical GIS indicator system is constructed by incorporating environmental, locational, and social compatibility factors, including elevation, slope, land use, transportation accessibility, proximity to wind farms, and population-related constraints. GIS performs Euclidean distance, kernel density, and weighted overlay analyses to identify suitable areas, while indicator weights are determined through a hybrid subjective–objective approach. A Super-Efficiency DEA model is then applied, using labor and land costs as inputs and annual decommissioning quantities as output, to evaluate and rank candidate sites, with higher-ranked sites regarded as reliable locations. A case study in Xilingol, Inner Mongolia, verifies the method’s effectiveness. The proposed framework supports scientific planning for wind turbine recycling and promotes sustainable wind energy development.
1. Introduction
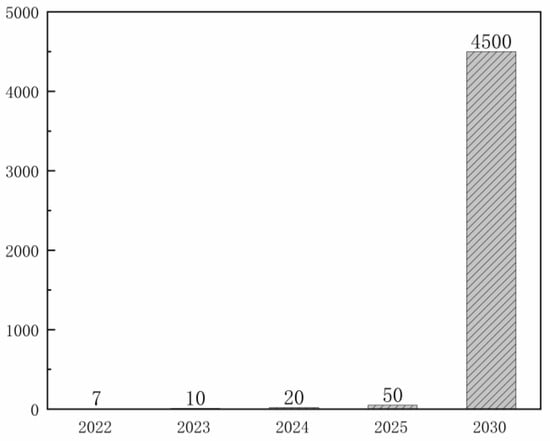
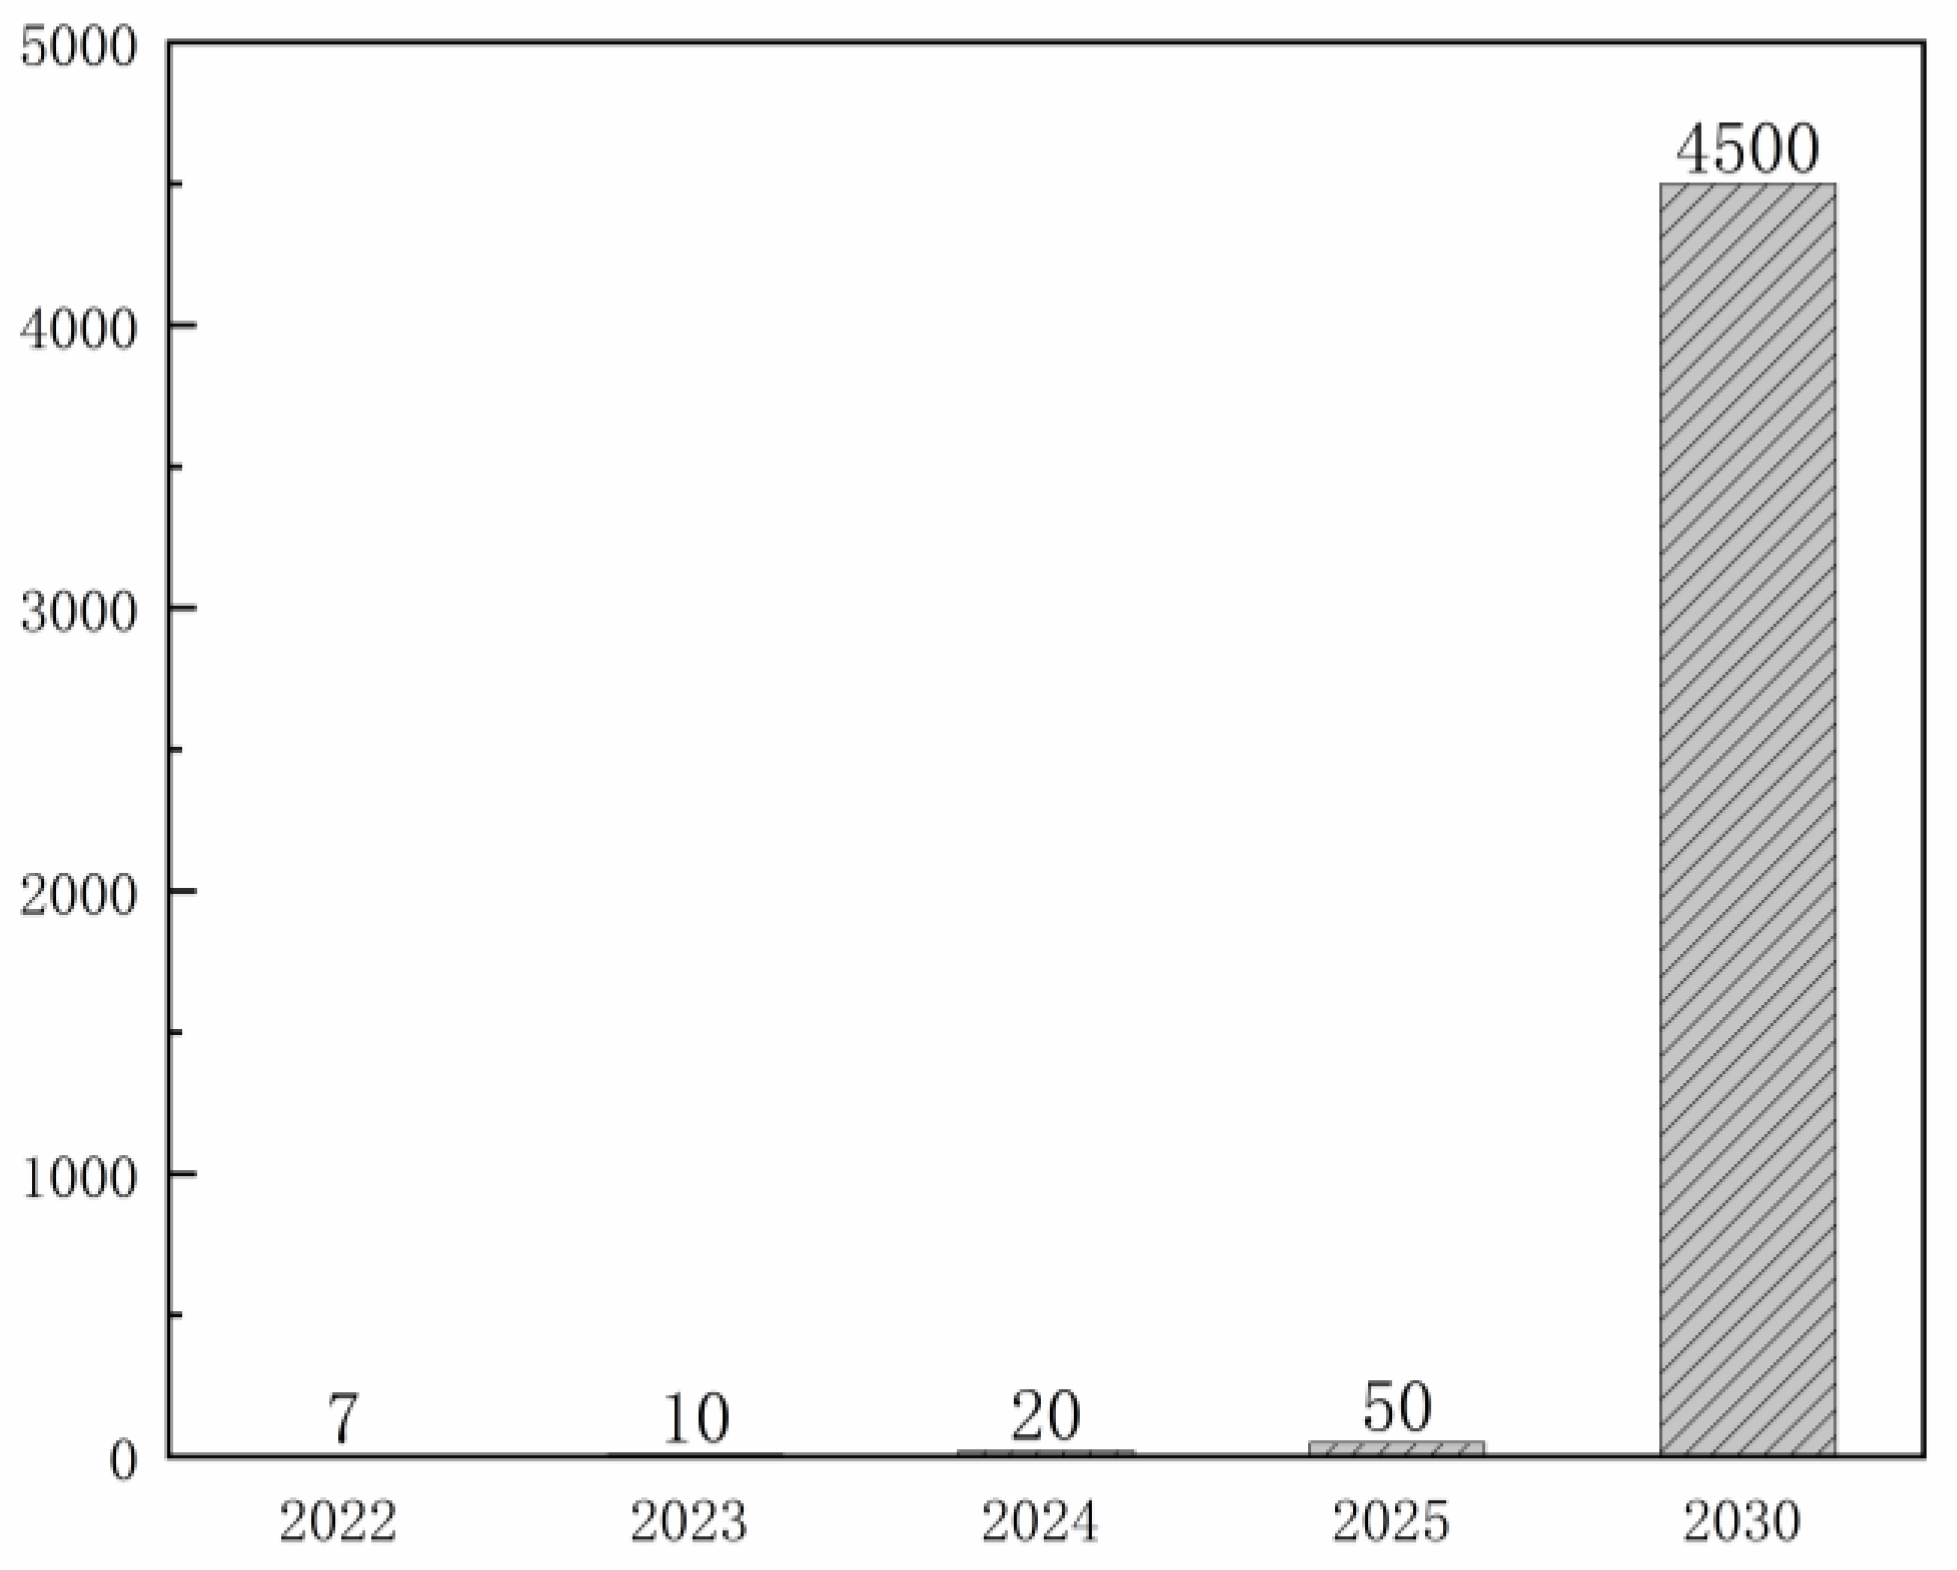
With the implementation of the dual carbon strategy in China, new opportunities emerge for the green transition. Among them, green power is an important part of the dual carbon strategy. According to the Statistics Bureau of the Inner Mongolia, China, wind power generation in Inner Mongolia reached 164.3 billion kilowatt-hours in 2024, accounting for as much as 17.55% of the national total. Although the wind power sector in Inner Mongolia develops rapidly, many wind turbines that were put into operation around the year 2000 are about to reach their designed lifespan of 20 to 25 years, which will lead to the first large-scale retirement wave of wind turbines in 2025 across the region and the country (Figure 1). The treatment of wind turbine blades and the recycling of wind turbine units are matters of urgent concern.
Figure 1.
The cumulative number of decommissioned wind turbine units.
From the perspective of decommissioned wind farm treatment, there are three main approaches: continuing operation after renovation, extending service life by turbine replacement, and site closure [1,2,3]. Most wind farms in China use imported turbines from Europe and the United States. Due to technical incompatibility with domestic systems, renovation is often unfeasible. Therefore, operation with replacement and site closure are more consistent with the context of China. For the disposal of decommissioned wind turbines, there are three main methods: mechanical crushing, chemical recycling, and thermal recycling [4]. End-of-life wind turbines contain recyclable metals, concrete, cables, and composite blades, among which composite blade materials are relatively difficult to recycle. Improper treatment may cause land occupation, secondary waste, and additional environmental pressure. Therefore, the site selection of wind turbine recycling centers should consider not only economic efficiency, but also transportation accessibility, environmental constraints, land-use compatibility, and recycling demand. Processed waste can facilitate the recycling of rare earth elements [5,6] and the reuse of materials, such as in cement production [7]. Chinese regulations explicitly prohibit the illegal disposal of waste through landfilling or random dumping. Against this backdrop, establishing wind turbine recycling centers becomes a critical initiative. The site selection of these centers requires scientific and rational planning, as it directly impacts operational efficiency and cost-effectiveness. Moreover, these centers perform a variety of core functions, including multi-mode blade processing such as mechanical, chemical and thermal recycling methods, component maintenance and remanufacturing, and material circulation. Such functional diversity significantly increases the complexity of site selection.
At present, the problem of decommissioned wind turbines is becoming increasingly urgent. Existing studies mostly focus on the recycling and utilization of wind turbine resources, the optimization of wind turbine recycling processes [8,9,10], and the circular economy of decommissioned wind turbines [11]. However, there remain significant research gaps in the infrastructure planning involved in recycling. An unreasonable geographical layout of recycling centers may lead to several risks. First, due to the extremely large size of decommissioned wind turbine blades, transportation over long distances in non-standard networks can lead to significantly higher logistics costs. Second, recycling processes such as chemical treatment and pyrolysis may generate high thermal loads and environmental emissions, which should be considered in recycling-center planning. Third, the downstream transportation cost from the recycling center to the customer site needs to be reasonably controlled when the recyclable resources generated from the recycling of wind turbines are resold. Therefore, the scientific planning of the location of the wind turbine recycling center plays a crucial role in the entire wind turbine recycling process.
To address this issue, this study proposes an integrated site-selection framework for wind turbine recycling centers, aiming to identify suitable candidate regions and further support recycling infrastructure planning in Xilingol, Inner Mongolia.
2. Literature Review
2.1. Wind Turbine Recycling
With the rapid expansion of global wind power capacity, the large-scale decommissioning of wind turbines becomes an emerging environmental and technical challenge. Current research on wind turbine recycling mainly concentrates on three areas: recycling technologies, material reuse, and policy design. In terms of technology, mechanical, thermal, and chemical recycling methods are extensively studied [12,13,14,15]. Mechanical recycling is regarded as a cost-effective and energy-efficient approach suitable for large-scale glass fiber reinforced plastic (GFRP) treatment [16,17]. Zhang et al. [11] proposed a mechanical recycling strategy that uses water jet cutting and roller grinding to convert GFRP waste into high-aspect-ratio rebars. Cheng et al. [18] and Hao et al. [19] further optimized physical and chemical recycling processes to enhance efficiency, energy performance, and product value. From the perspective of material reuse, Mao et al. [20] established a multi-stage model showing that recycled fiber-reinforced polymer (FRP) fibers can significantly improve the tensile and bending properties of concrete, providing theoretical support for their large-scale application in construction. From a policy perspective, Zhao et al. [21] employed game-theoretic and circular economy models to quantify the effects of subsidies and technological investment on industrial coordination and recycling profitability. In addition to recycling technologies and material reuse, some studies have begun to examine the spatial distribution and reverse logistics of end-of-life wind turbine blades. Delaney et al. [22] proposed an integrated geospatial approach to assess the spatiotemporal distribution of decommissioned wind turbine blades and support repurposing decisions. Rentizelas et al. [23] optimized the reverse supply network design for circular economy pathways of wind turbine blades in Europe, considering waste suppliers, processing facilities, and downstream reuse. Liu et al. [24] compared the economic feasibility of different end-of-life options for wind turbine blades and highlighted the cost differences among recycling pathways. Trivyza et al. [25] further investigated reverse supply network design for end-of-life wind turbine blades under different policy scenarios, involving material flows, recycling facility locations, and capacities.
2.2. Geographic Information System Site Selection
Geographic Information System (GIS) has been widely applied in facility site selection because it can integrate multi-source spatial data and evaluate the spatial suitability of candidate areas [26]. In GIS-based decision-making, spatial factors such as land use, transportation accessibility, topography, environmental constraints, and proximity to sensitive areas are commonly used for suitability evaluation [27]. By converting different spatial factors into comparable suitability layers, GIS improves the transparency and operability of site-selection decisions. GIS-based methods have been widely used in waste-treatment, recycling, landfill, and infrastructure facility site selection. Aghad et al. [28] integrated fuzzy-AHP and GIS to evaluate solid waste disposal sites by considering spatial and environmental constraints. Hosseinzadeh et al. [29] applied GIS-AHP to municipal landfill site selection and considered land-use conditions, accessibility, and environmental sensitivity. Jonuzi et al. [30] used GIS-supported MCDA for urban infrastructure location planning, showing its applicability to facility-location problems involving accessibility and land-use compatibility. GIS-based methods have also been applied to renewable-energy facility site selection. Umoh et al. [31] used AHP-GIS for floating offshore wind site selection, while Shi et al. [32] combined GIS with AHP-TOPSIS for photovoltaic power plant site selection. Existing studies show that GIS combined with weighting or ranking methods has formed a relatively mature spatial suitability evaluation framework for facility site selection [33].
2.3. Data Envelopment Analysis Site Selection
Data Envelopment Analysis (DEA) is widely applied in facility-location studies as a non-parametric efficiency evaluation technique that measures the relative performance of decision-making units under multiple inputs and outputs [34,35,36]. In renewable energy planning, DEA is integrated with other MCDM techniques to enhance the robustness of site evaluation. Pambudi & Nananukul [37] applied a hierarchical fuzzy DEA to determine the most efficient wind farm sites in Indonesia. Wang et al. [38] combined DEA with grey MCDM to evaluate photovoltaic sites in Vietnam, while Saraji et al. [39] proposed a two-stage DEA–CRITIC–TOPSIS approach for solar farm selection in the Baltic region. Similarly, Shafii et al. [40] developed a GIS-based hybrid framework integrating DEA with BWM, TOPSIS, and GRA for nuclear power plant site selection in Indonesia. To further improve accuracy, several studies introduced multi-phase or hybrid DEA structures. Wang et al. [41] integrated DEA with a fuzzy MCDM framework (FAHP–F-CoCoSo) for wind energy planning in Indonesia. Raad and Rajendran [42] applied an SBM-DEA combined with regression and GIS for airport site selection, and Wang et al. [43] used a composite CI-DEA–IDOCRIW–MABAC model for optimizing logistics terminal locations. Extensions of DEA also emerged in uncertain or behavioral contexts. Memari et al. [44] introduced a fuzzy DEMATEL–ANP–ZDEA model, Karuppiah et al. [45] employed a grey DEA–AHP–COPRAS method, and Wang & Chao [46] incorporated bounded rationality into geothermal site assessment. In addition, Wang et al. [47] applied prospect theory to DEA for offshore wave–wind selection, while Sharma and Sarin [48] and Sharma et al. [49] combined DEA with TOPSIS and clustering to handle large-scale solar PV decisions.
Taken together, existing studies provide useful support for this research from three aspects: wind turbine recycling studies clarify recycling technologies, material reuse, and reverse logistics; GIS-based site-selection studies provide tools for spatial suitability screening under land-use, accessibility, and environmental constraints; and DEA-based studies offer methods for evaluating the input–output efficiency of candidate alternatives. However, these streams are usually discussed separately. For the site selection of wind turbine recycling centers, both spatial suitability and operational efficiency need to be considered because decommissioned components are large, difficult to transport, and closely related to wind farm distribution, transport accessibility, land cost, labor cost, and downstream demand. Therefore, this study integrates GIS-based candidate-area screening with Super-Efficiency DEA-based efficiency evaluation to support the selection of wind turbine recycling center locations.
3. Methodology
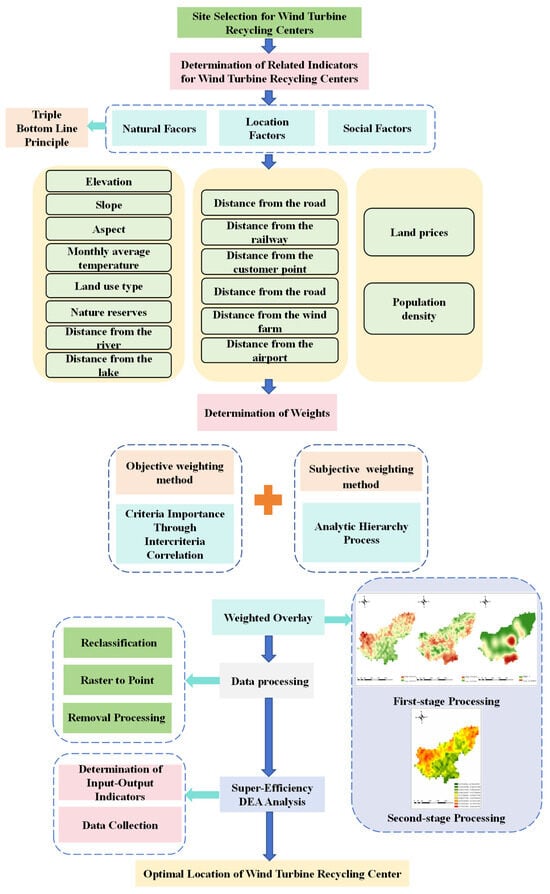
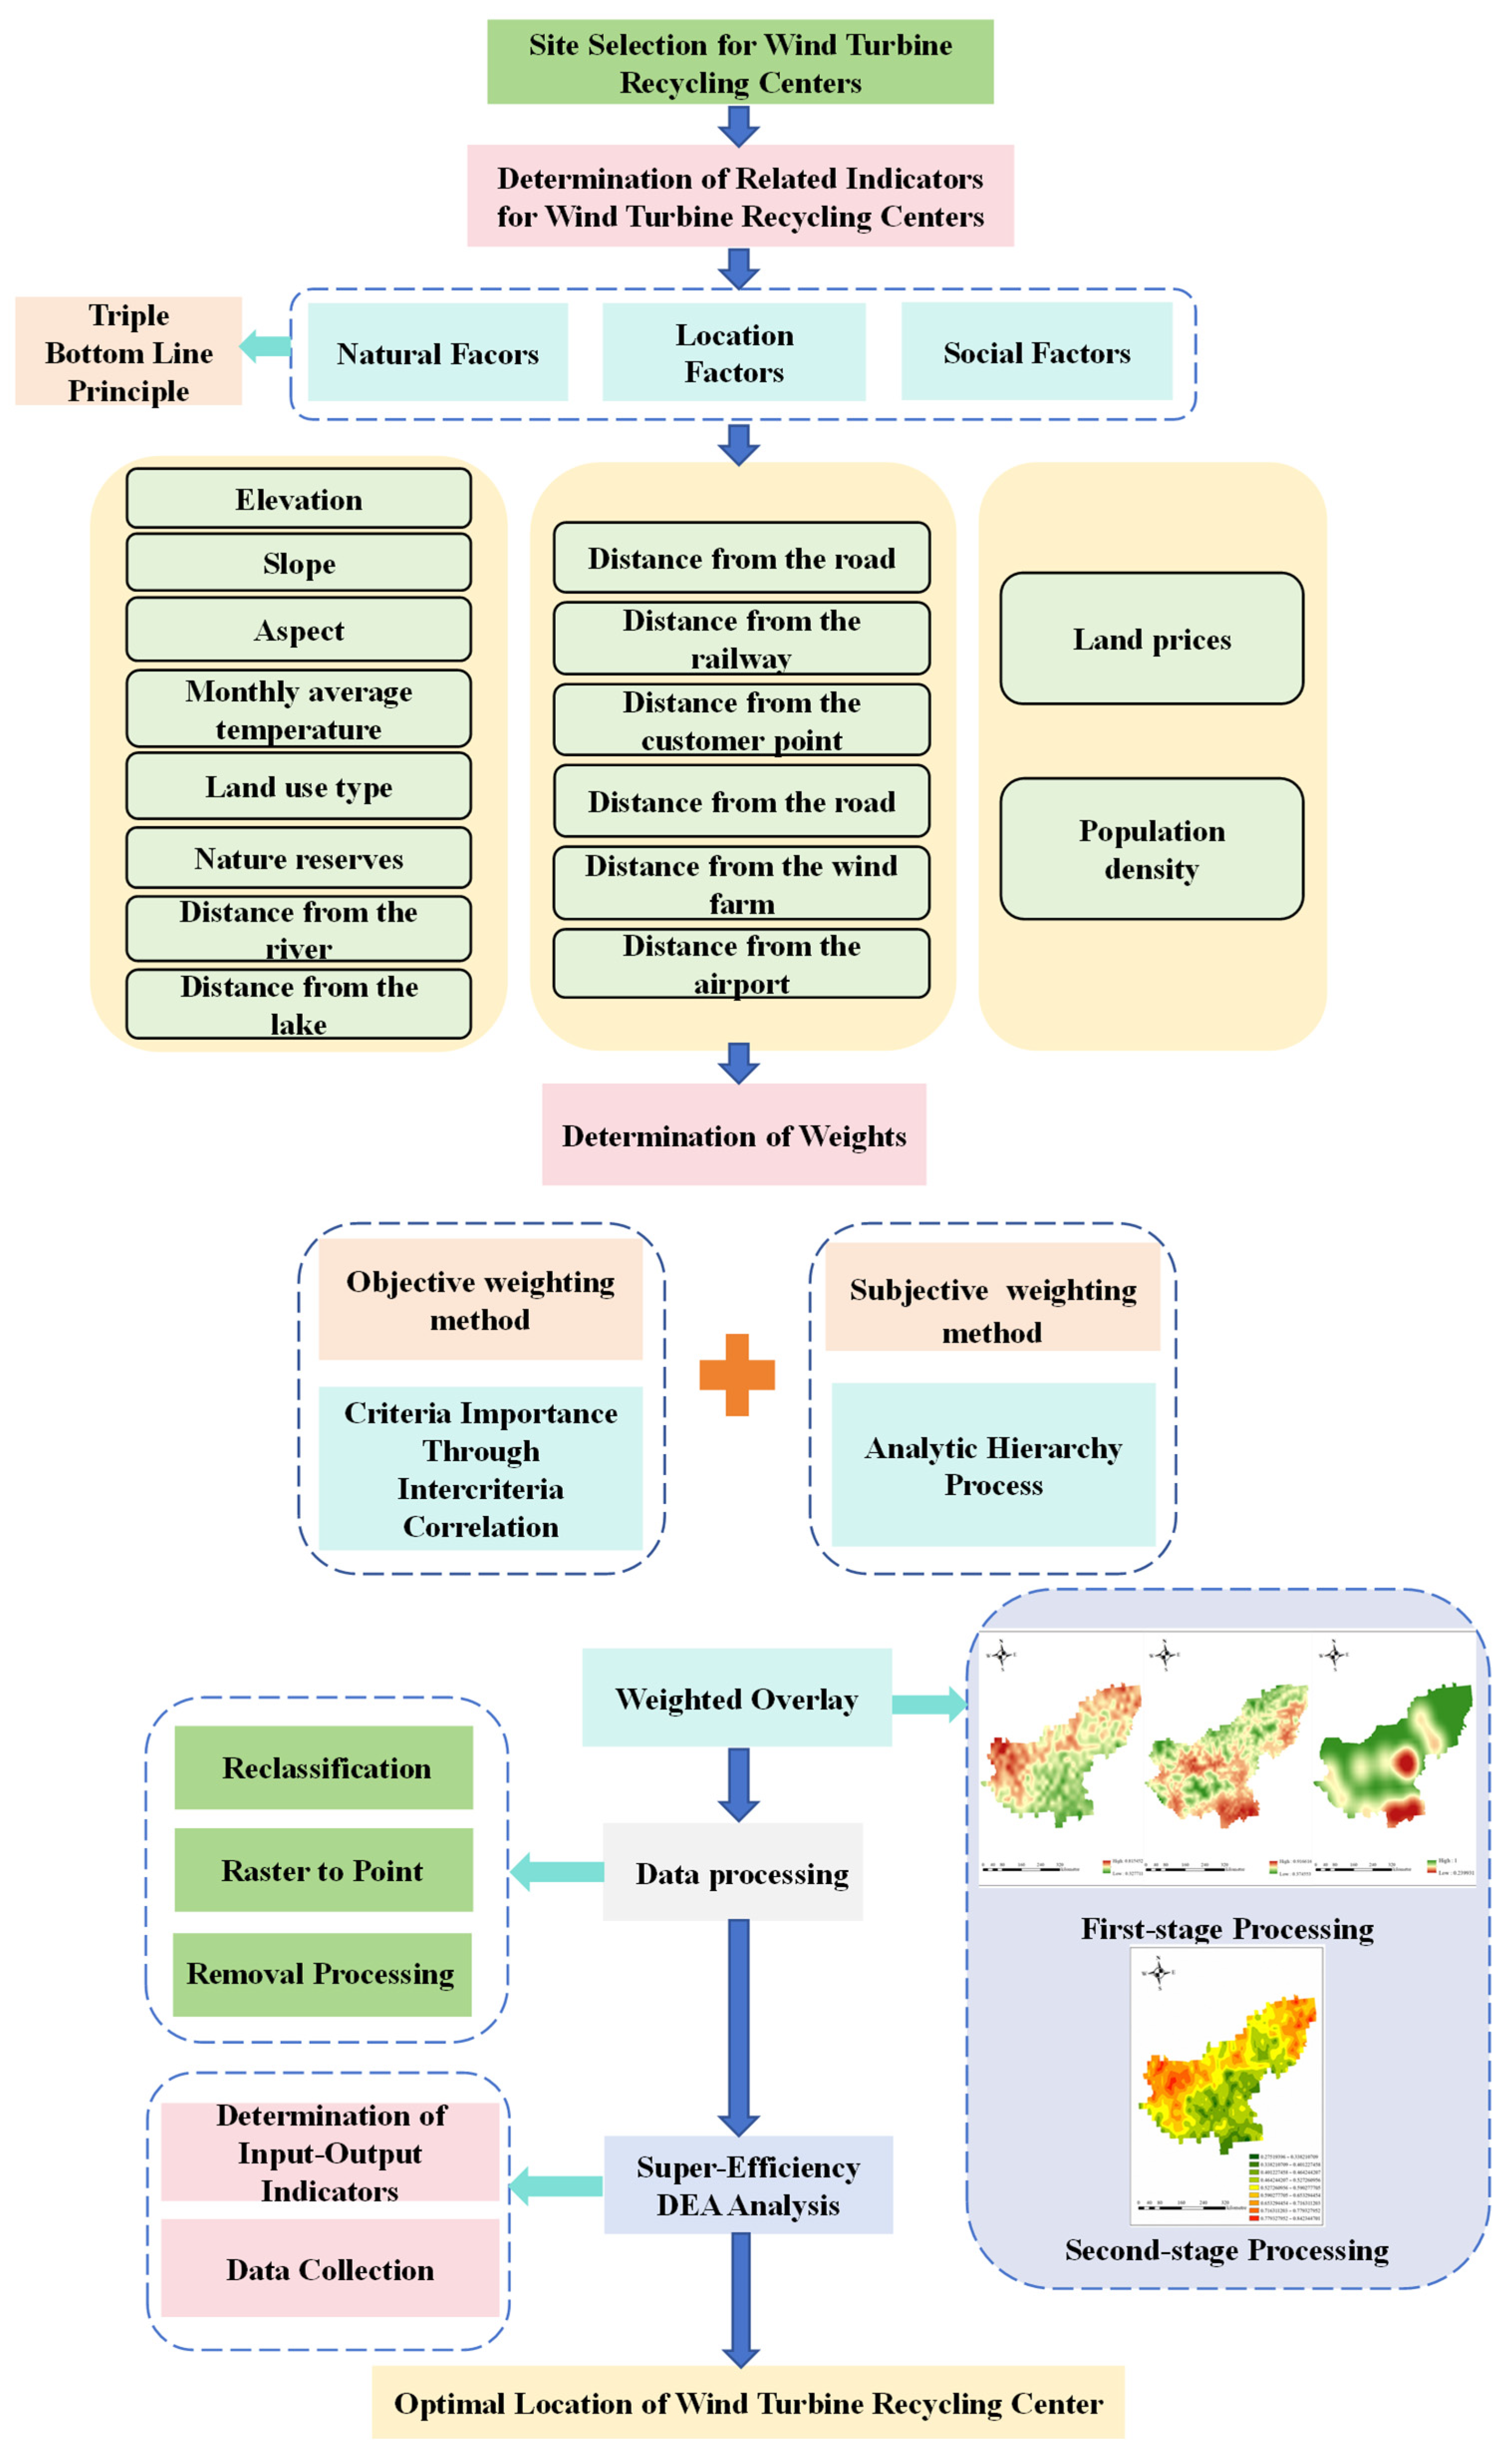
The proposed study follows an integrated GIS–DEA framework. In the GIS stage, spatial indicators are processed and standardized to generate suitability layers, and AHP and CRITIC are used only for weight determination within the weighted overlay analysis. Specifically, AHP is used to determine the weights of the target-layer categories, while CRITIC is used to calculate the weights of the measurable indicator layer. Based on the weighted overlay results, highly suitable candidate regions are extracted. In the DEA stage, the Super-Efficiency DEA model is used to evaluate and rank the candidate regions according to input–output efficiency. The overall technical roadmap of the proposed GIS–DEA framework is shown in Figure 2. All GIS operations were performed using ArcGIS 10.8 (Esri, Redlands, CA, USA), and the CRITIC weighting and Super-Efficiency DEA calculations were implemented in MATLAB R2023a (MathWorks, Natick, MA, USA).
Figure 2.
Technical Roadmap.
3.1. GIS Analysis Methods
GIS analysis is used to process spatial data, generate indicator layers, and screen candidate sites for subsequent efficiency evaluation. Considering the characteristics of wind turbine recycling center site selection, this study incorporates natural, locational, and social factors such as wind farm distribution, topography, road accessibility, downstream customers, and land use. Multi-source spatial data are first unified through coordinate system transformation, data clipping, and format conversion, and are then converted into comparable raster layers, as shown in Table 1.
Table 1.
GIS Spatial Processing Methods.
Different GIS spatial analysis methods are applied according to the data type of each indicator. For point and linear features such as wind farms, downstream customer points, roads, and airports, Euclidean distance analysis is used to generate distance rasters and measure the spatial proximity between each location and the target facilities.
where denotes the Euclidean distance from raster cell to target feature , and denotes the location coordinates of the target feature.
For clustered point or polygon data, such as densely populated areas and land prices, kernel density estimation is used to generate a spatial density surface, and its general form can be expressed as:
where denotes the kernel density estimate at location , is the number of samples, is the bandwidth, is the kernel function, and is the location of the sample point.
Since the selected indicators differ in units, value ranges, and suitability directions, all raster indicators are standardized before weighted overlay analysis. In this study, three types of processing are adopted. First, for positive indicators, where larger values or higher grades indicate higher suitability, Fuzzy Membership is used to convert the original raster values into standardized suitability scores ranging from 0 to 1 according to Equation (3). Second, for negative indicators, where larger values indicate lower suitability, inverse linear normalization is applied according to Equation (4), and the calculation is implemented in ArcGIS 10.8 using the Raster Calculator. Third, constraint indicators, such as nature reserves and unsuitable land-use types, are processed through reclassification and mask extraction before overlay analysis.
where denotes the standardized value of the indicator, denotes the original indicator value, and and denote the maximum and minimum values of the indicator, respectively.
After obtaining the standardized results of all indicators, weighted overlay is performed by combining them with their corresponding weights to generate a comprehensive suitability map of the study area. The calculation is as follows:
where denotes the comprehensive suitability value, denotes the weight of the indicator, denotes the standardized raster value of the indicator, and denotes the total number of indicators.
Based on the comprehensive suitability results, highly suitable areas are further reclassified and extracted, and an initial set of candidate sites is generated through raster-to-point conversion, as shown in Table 2.
Table 2.
GIS Analysis and Candidate Site Screening.
Through this process, the site selection problem in continuous space is transformed into a screening problem over a finite set of candidate regions, thereby providing input for the subsequent Super-Efficiency DEA evaluation.
3.2. Weight Determination Method
The weighting process is conducted at two levels. First, AHP is used to determine the weights of the target layer, including natural factors, location factors, and social factors. Second, CRITIC is used to determine the objective weights of the indicator layer within each target-layer category. In the GIS overlay process, the CRITIC weights are first used to generate the suitability map of each target-layer category, and the AHP weights are then used to combine the three target-layer suitability maps into the final comprehensive suitability map.
3.2.1. AHP
AHP is used to determine the relative importance of the target-layer categories based on expert judgment [50]. In this study, the target layer includes natural factors, location factors, and social factors. The judgment matrix is constructed according to expert scoring, and the consistency test is conducted to ensure the reliability of the obtained target-layer weights.
3.2.2. CRITIC
CRITIC is used to determine the objective weights of the indicator layer within each target-layer category [51]. After the spatial indicator raster data are obtained through GIS processing, they are imported into MATLAB R2023a for CRITIC calculation. CRITIC evaluates indicator importance according to data variation and conflict among indicators, thereby improving the objectivity of indicator-layer weight determination.
The CRITIC method first standardizes the original indicator data to eliminate the influence of dimensional differences. For a positive indicator, the standardized value is calculated as
For a negative indicator, the standardized value is calculated as
where is the original value of the indicator for the i-th sample, and and are the extreme values of the indicator across all samples.
After standardization, the contrast intensity of each indicator is measured by its standard deviation. A larger standard deviation indicates that the indicator has stronger discriminating ability across the evaluated samples and contains more information. The standard deviation of indicator is expressed as
where denotes the sample size, and represents the mean of the standardized values of indicator .
To reflect the degree of conflict among indicators, the Pearson correlation coefficient is introduced. If an indicator has a lower correlation with the others, it provides more independent information and should therefore be assigned a higher weight. The correlation coefficient between indicators and is given as
Based on the contrast intensity and conflict degree, the information content of indicator is calculated as
where denotes the total number of indicators.
Finally, the information content is normalized to obtain the objective weight of each indicator:
where denotes the weight of indicator . Through this procedure, indicators with greater variation and lower redundancy are assigned relatively higher weights. In this study, the CRITIC-derived indicator-layer weights are further combined with the target-layer weights obtained from the subjective weighting method, so as to form the complete weighting system for subsequent GIS weighted overlay analysis. The resulting weights are then used to generate the comprehensive suitability evaluation results of candidate regions.
3.3. Super-Efficiency DEA
After the GIS-based suitability analysis, highly suitable areas are extracted and treated as candidate regions for further evaluation. Although GIS can identify spatially favorable areas, it cannot determine the relative efficiency of candidate regions in terms of input–output performance. Therefore, a Super-Efficiency DEA model is introduced to rank the candidate regions and identify the optimal location for the wind turbine recycling center. In this study, each candidate region is regarded as a decision-making unit (DMU), with land cost and labor cost taken as input variables and annual decommissioning quantity taken as the output variable.
The Super-Efficiency DEA model is an extension of the traditional DEA framework. Its main advantage is that the evaluated DMU is excluded from the reference set, allowing efficient units to obtain scores greater than 1 and thus enabling further ranking among efficient candidates. This feature is particularly important in the present study, because multiple candidate regions may all appear efficient after the initial GIS screening [52].
For DMU , the input-oriented Super-Efficiency DEA model can be expressed as follows:
where represents the number of DMUs, each of which has types of inputs and types of outputs, denotes the quantity of the input for the DMU , refers to the quantity of the output for the DMU , and the efficiency of the DMU is to be evaluated.
If , the DMU is super-efficient and can be further ranked; if , the DMU lies on the efficiency frontier; if , the DMU is relatively inefficient. Based on the calculated Super-Efficiency values, the candidate regions are ranked, and the region with the highest value is identified as the optimal location for the wind turbine recycling center. This step further refines the GIS screening results from the perspective of input–output efficiency.
4. Case Study and Results
4.1. Overview of the Study Area
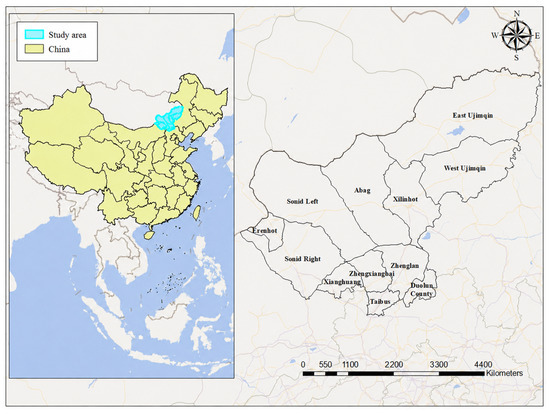
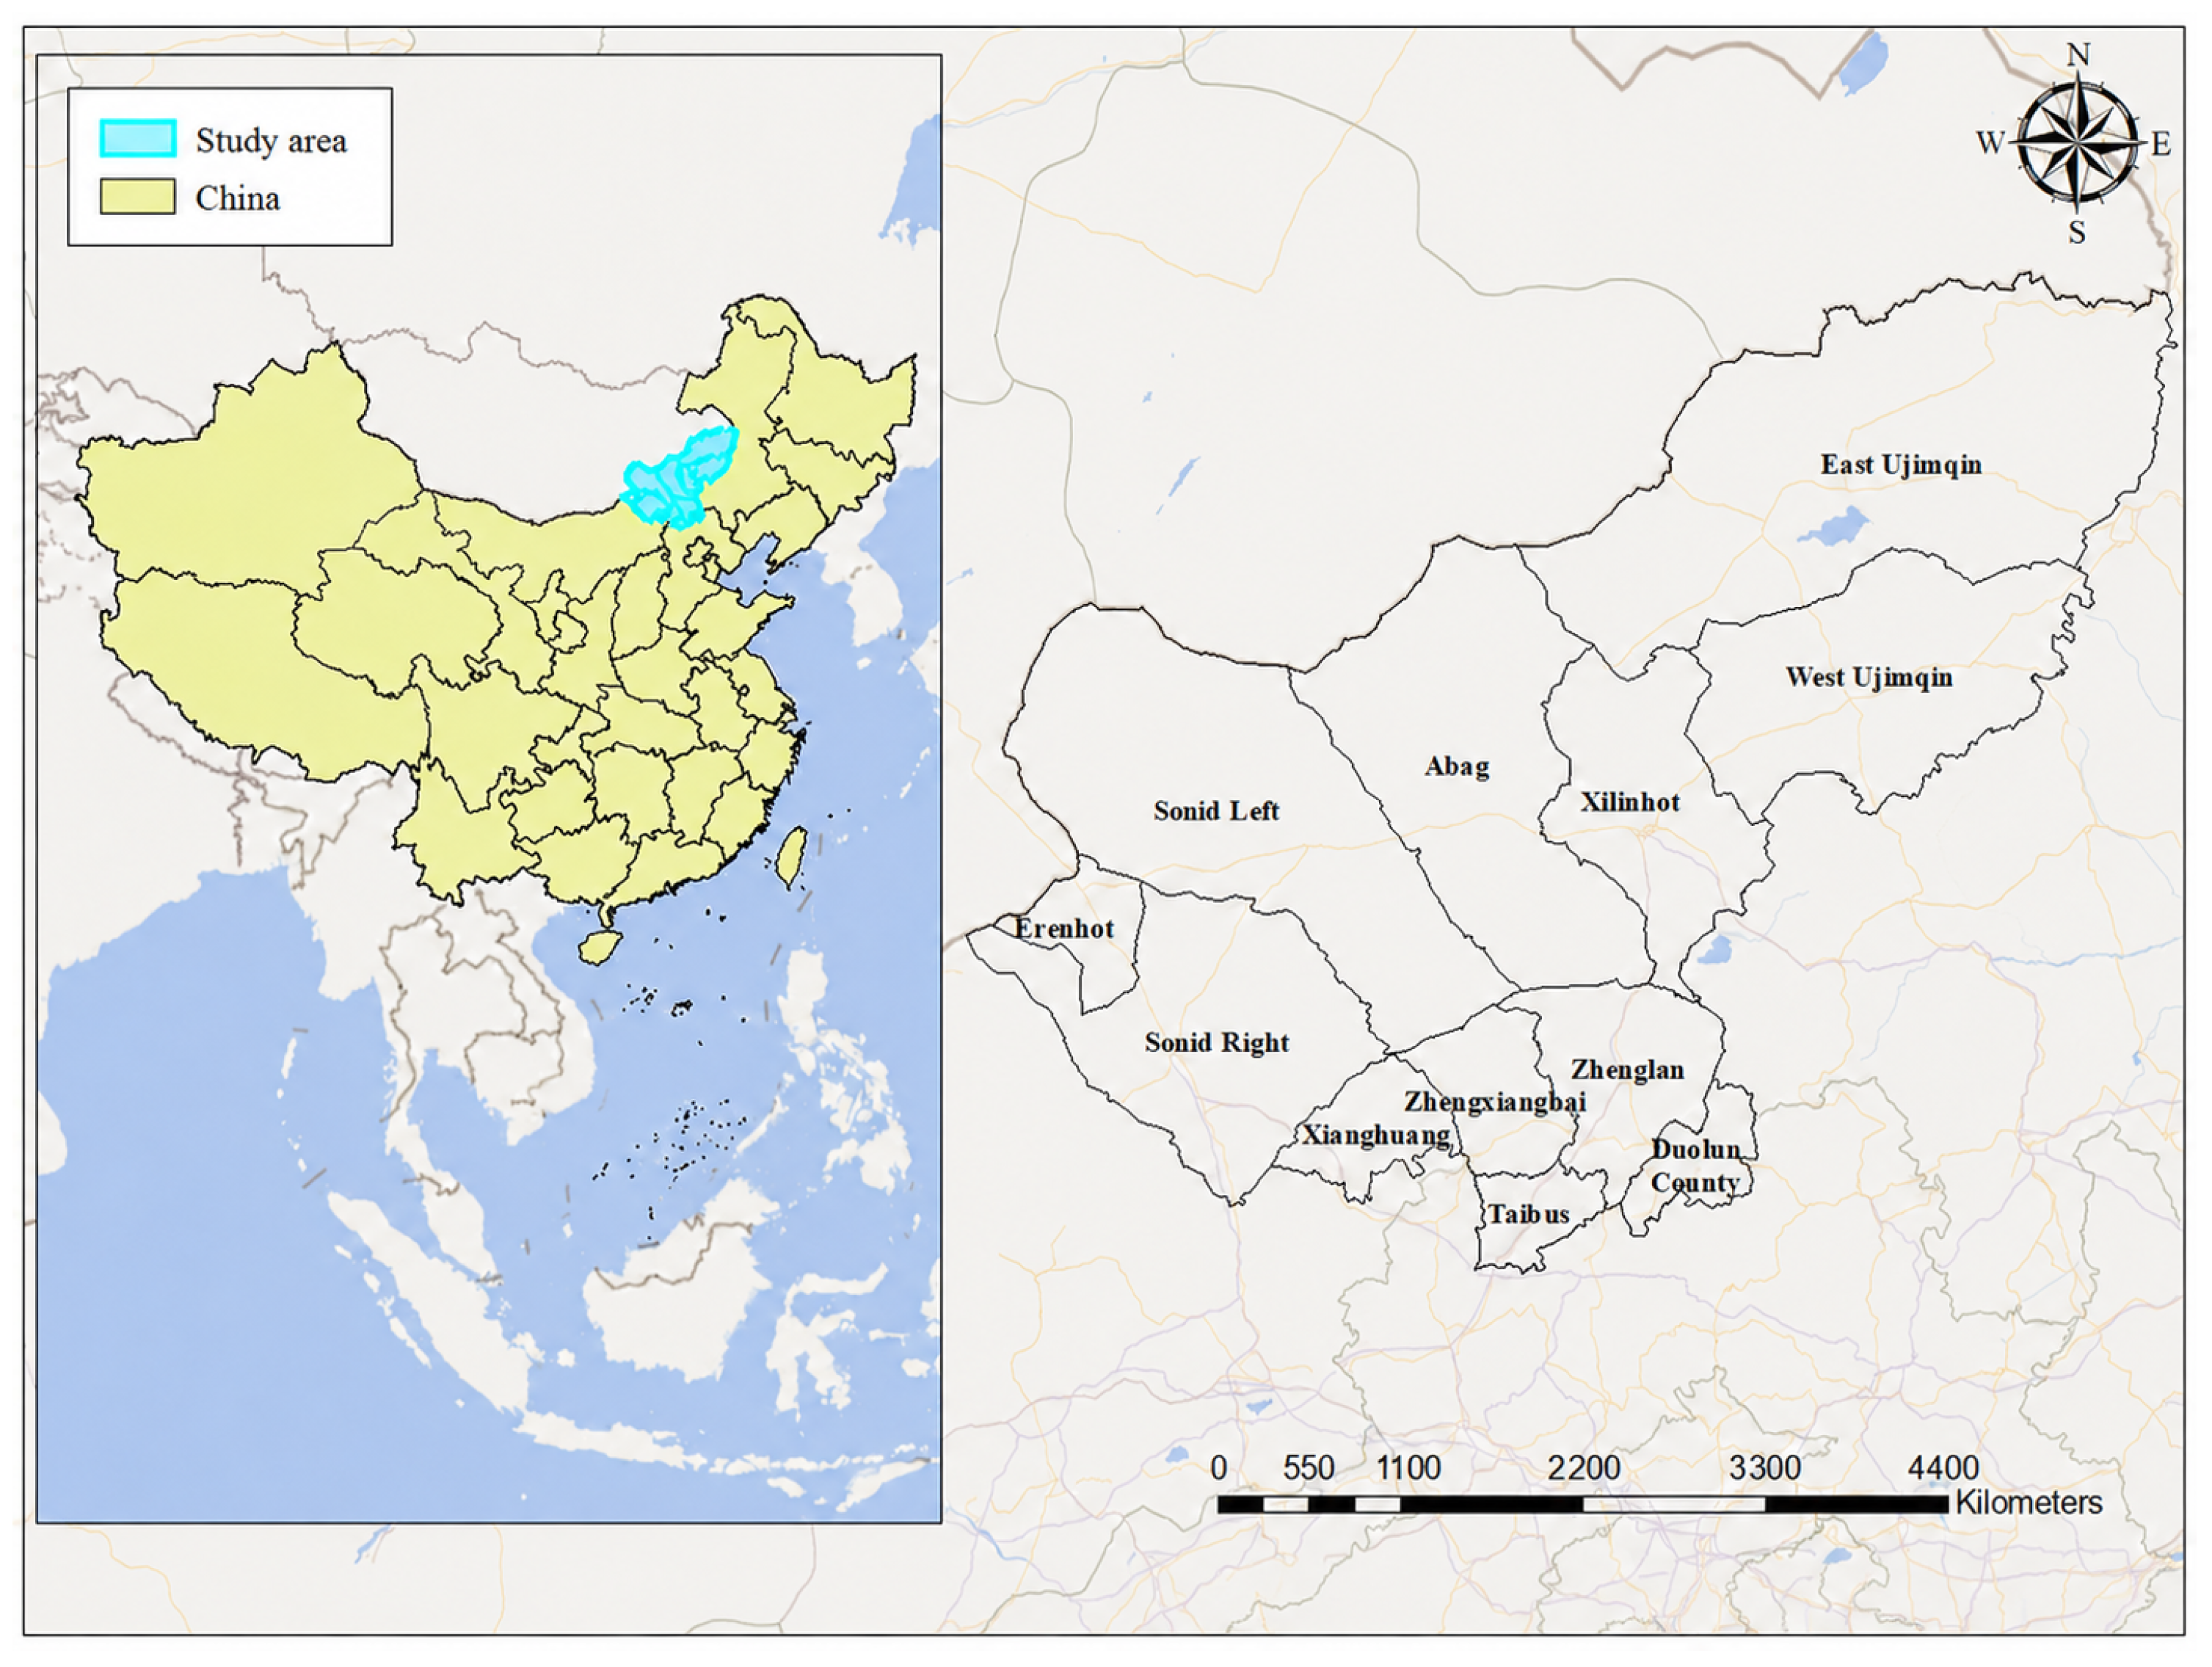
Xilingol is located in central Inner Mongolia, with an average annual wind speed of 3.2 m/s. It has wind energy reserves of more than 50 million kW, accounting for approximately 50% of the total in Inner Mongolia and 20% of the national total. Its exploitable wind energy capacity also exceeds 50 million kW (Figure 3). Figure 3 is displayed using the GCS_WGS_1984 geographic coordinate system.
Figure 3.
Location Map of the Study.
Xilingol is rich in wind and solar resources and is one of the few Class I high-quality wind and solar resource areas in China. However, with the coming large-scale retirement of wind turbines, Xilingol still lacks specialized and localized recycling and processing centers for decommissioned wind turbines. Therefore, selecting an appropriate location for a wind turbine recycling center in Xilingol has important practical significance.
4.2. Data and Indicators
4.2.1. Source and Processing of Data
A large number of raster and vector data are involved in the GIS-based location analysis. Among them, digital elevation data (e.g., slope and aspect) are from the Geospatial Data Cloud; the annual mean temperature data were obtained from WorldClim at approximately 1 km resolution and represent long-term monthly averages for 1970–2000. The annual mean temperature layer was calculated by averaging the twelve monthly rasters; administrative area planning data are from the National Geographic Information Public Service Platform; land use types, rivers, and lakes data are from the National Earth System Science Data Center; road network data are from OpenStreetMap; and coordinate information of airports, wind farms, and customer points are from the Amap Open Platform and Baidu Map Open Platform. All spatial data were unified under GCS_WGS_1984 and projected into WGS 1984 UTM Zone 50N for spatial analysis (Table 3).
Table 3.
Data Sources.
All raster layers were unified to a common spatial resolution of 1 km for the weighted overlay analysis.
4.2.2. Indicator System Construction
The site selection of wind turbine recycling centers is similar to the site selection of solid waste recycling and treatment facilities, as both require consideration of construction conditions, transportation accessibility, environmental constraints, and social compatibility. Based on the literature review and the characteristics of wind turbine recycling activities, this study constructs a hierarchical indicator system for GIS-based suitability analysis. The Triple Bottom Line (TBL) principle is used only as an auxiliary basis for organizing the target layer and classifying the corresponding indicator layer [53,54]. The target layer includes natural factors, location factors, and social factors, and the indicator layer translates these categories into measurable spatial variables for GIS processing. Table 4 summarizes the selected indicators and their rationale.
Table 4.
Wind Turbine Recycling Center Location Indicators.
The suitability direction of each indicator is defined according to its expected influence on the GIS-based suitability evaluation. Positive indicators indicate that larger values or more favorable standardized conditions improve site suitability, whereas negative indicators indicate that larger values reduce site suitability or increase construction, operational, environmental, or social constraints. Constraint indicators, such as land use type and nature reserves, are used to restrict or exclude unsuitable areas before weighted overlay analysis. Through standardization, all indicators are converted into comparable suitability layers, and areas with higher comprehensive suitability values are retained as candidate areas for subsequent evaluation.
4.3. GIS-Based Suitability Analysis Results
4.3.1. Spatial Distribution of Original Indicators
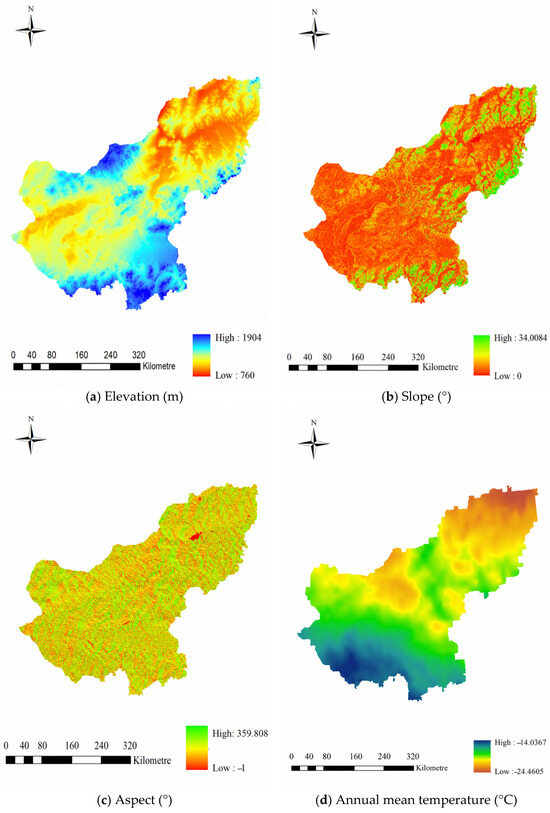
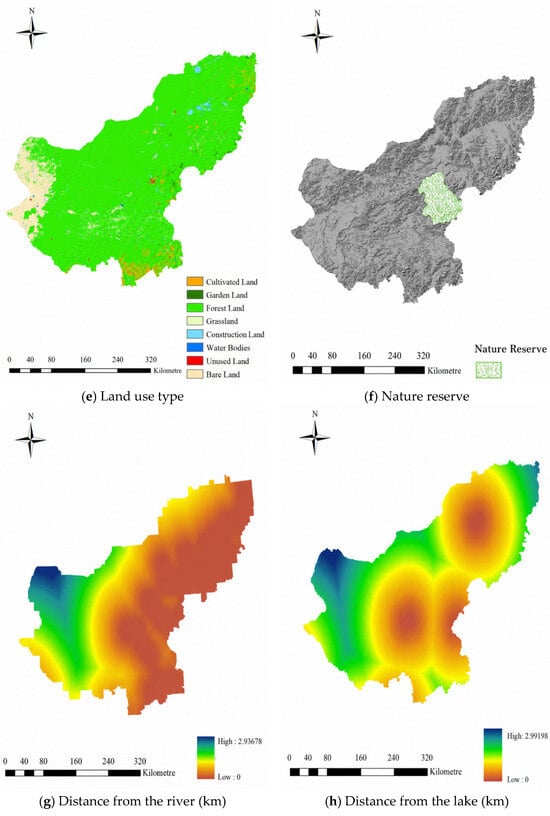
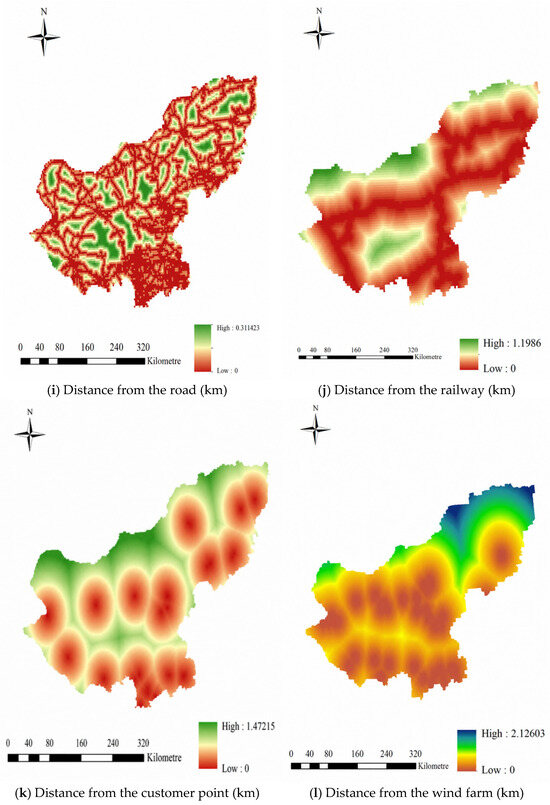
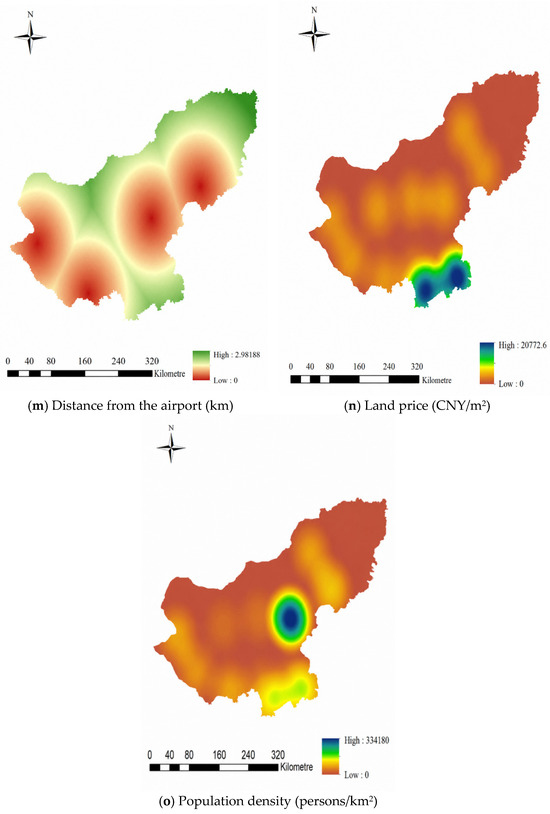
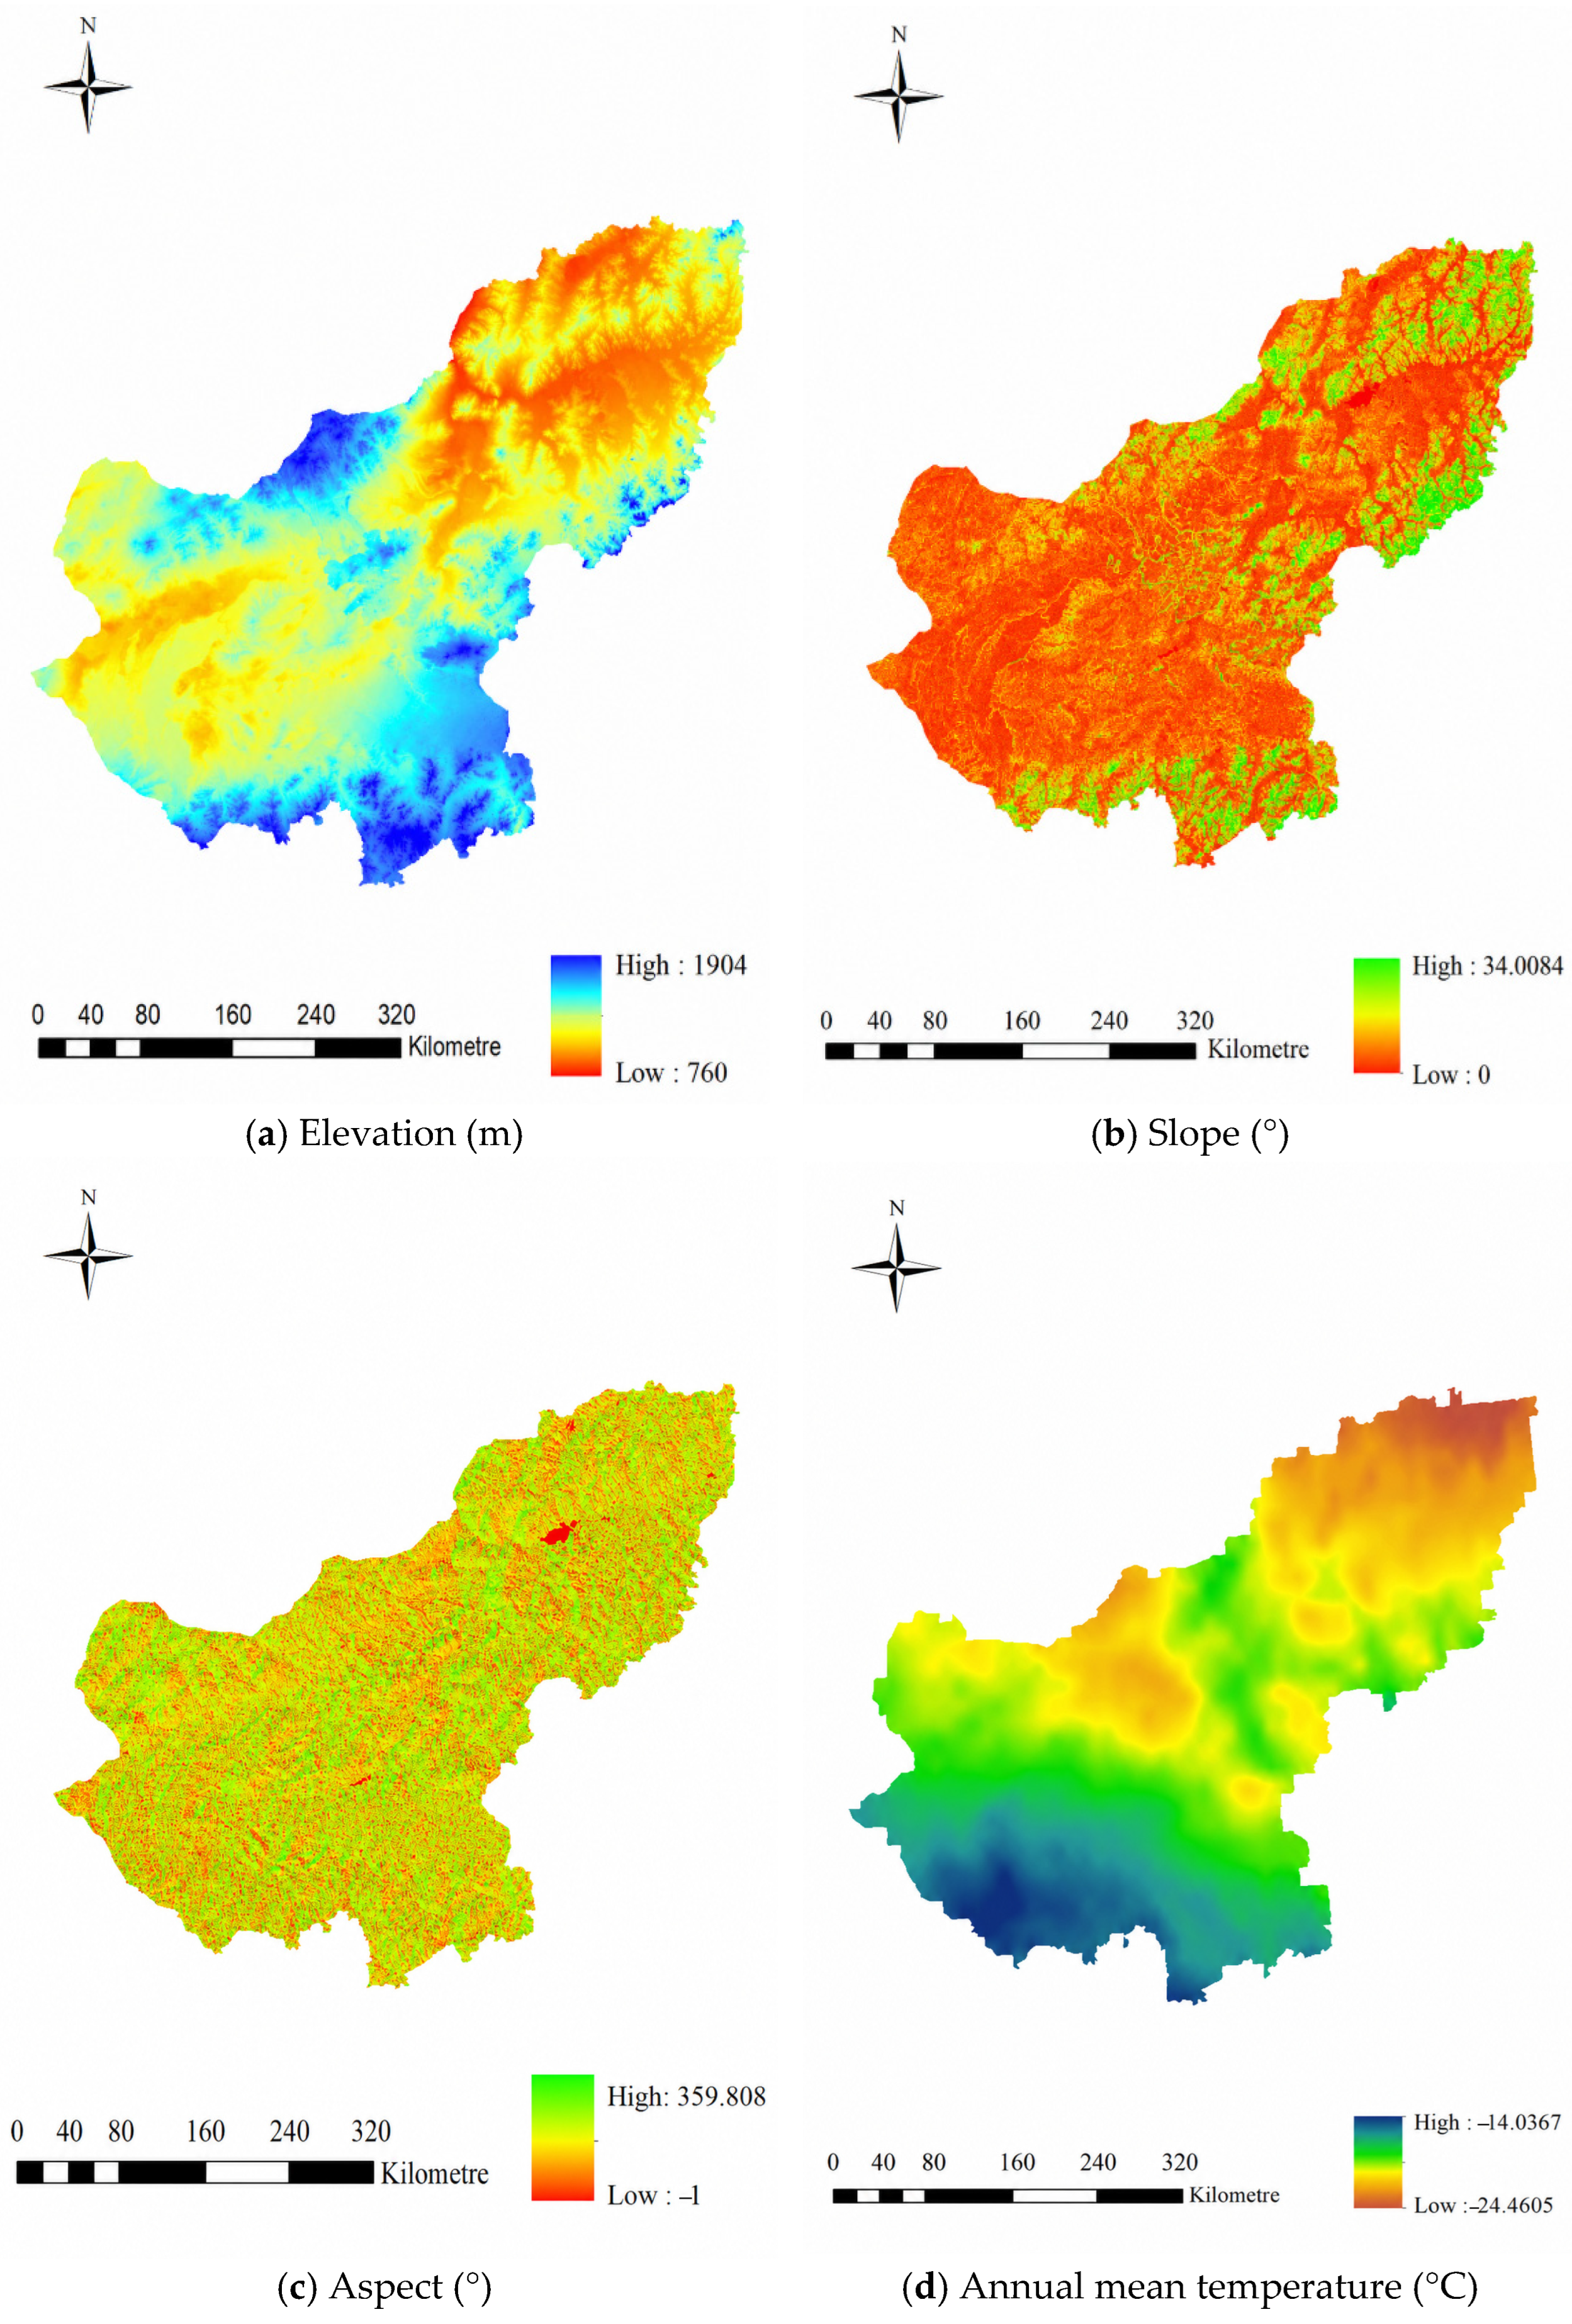
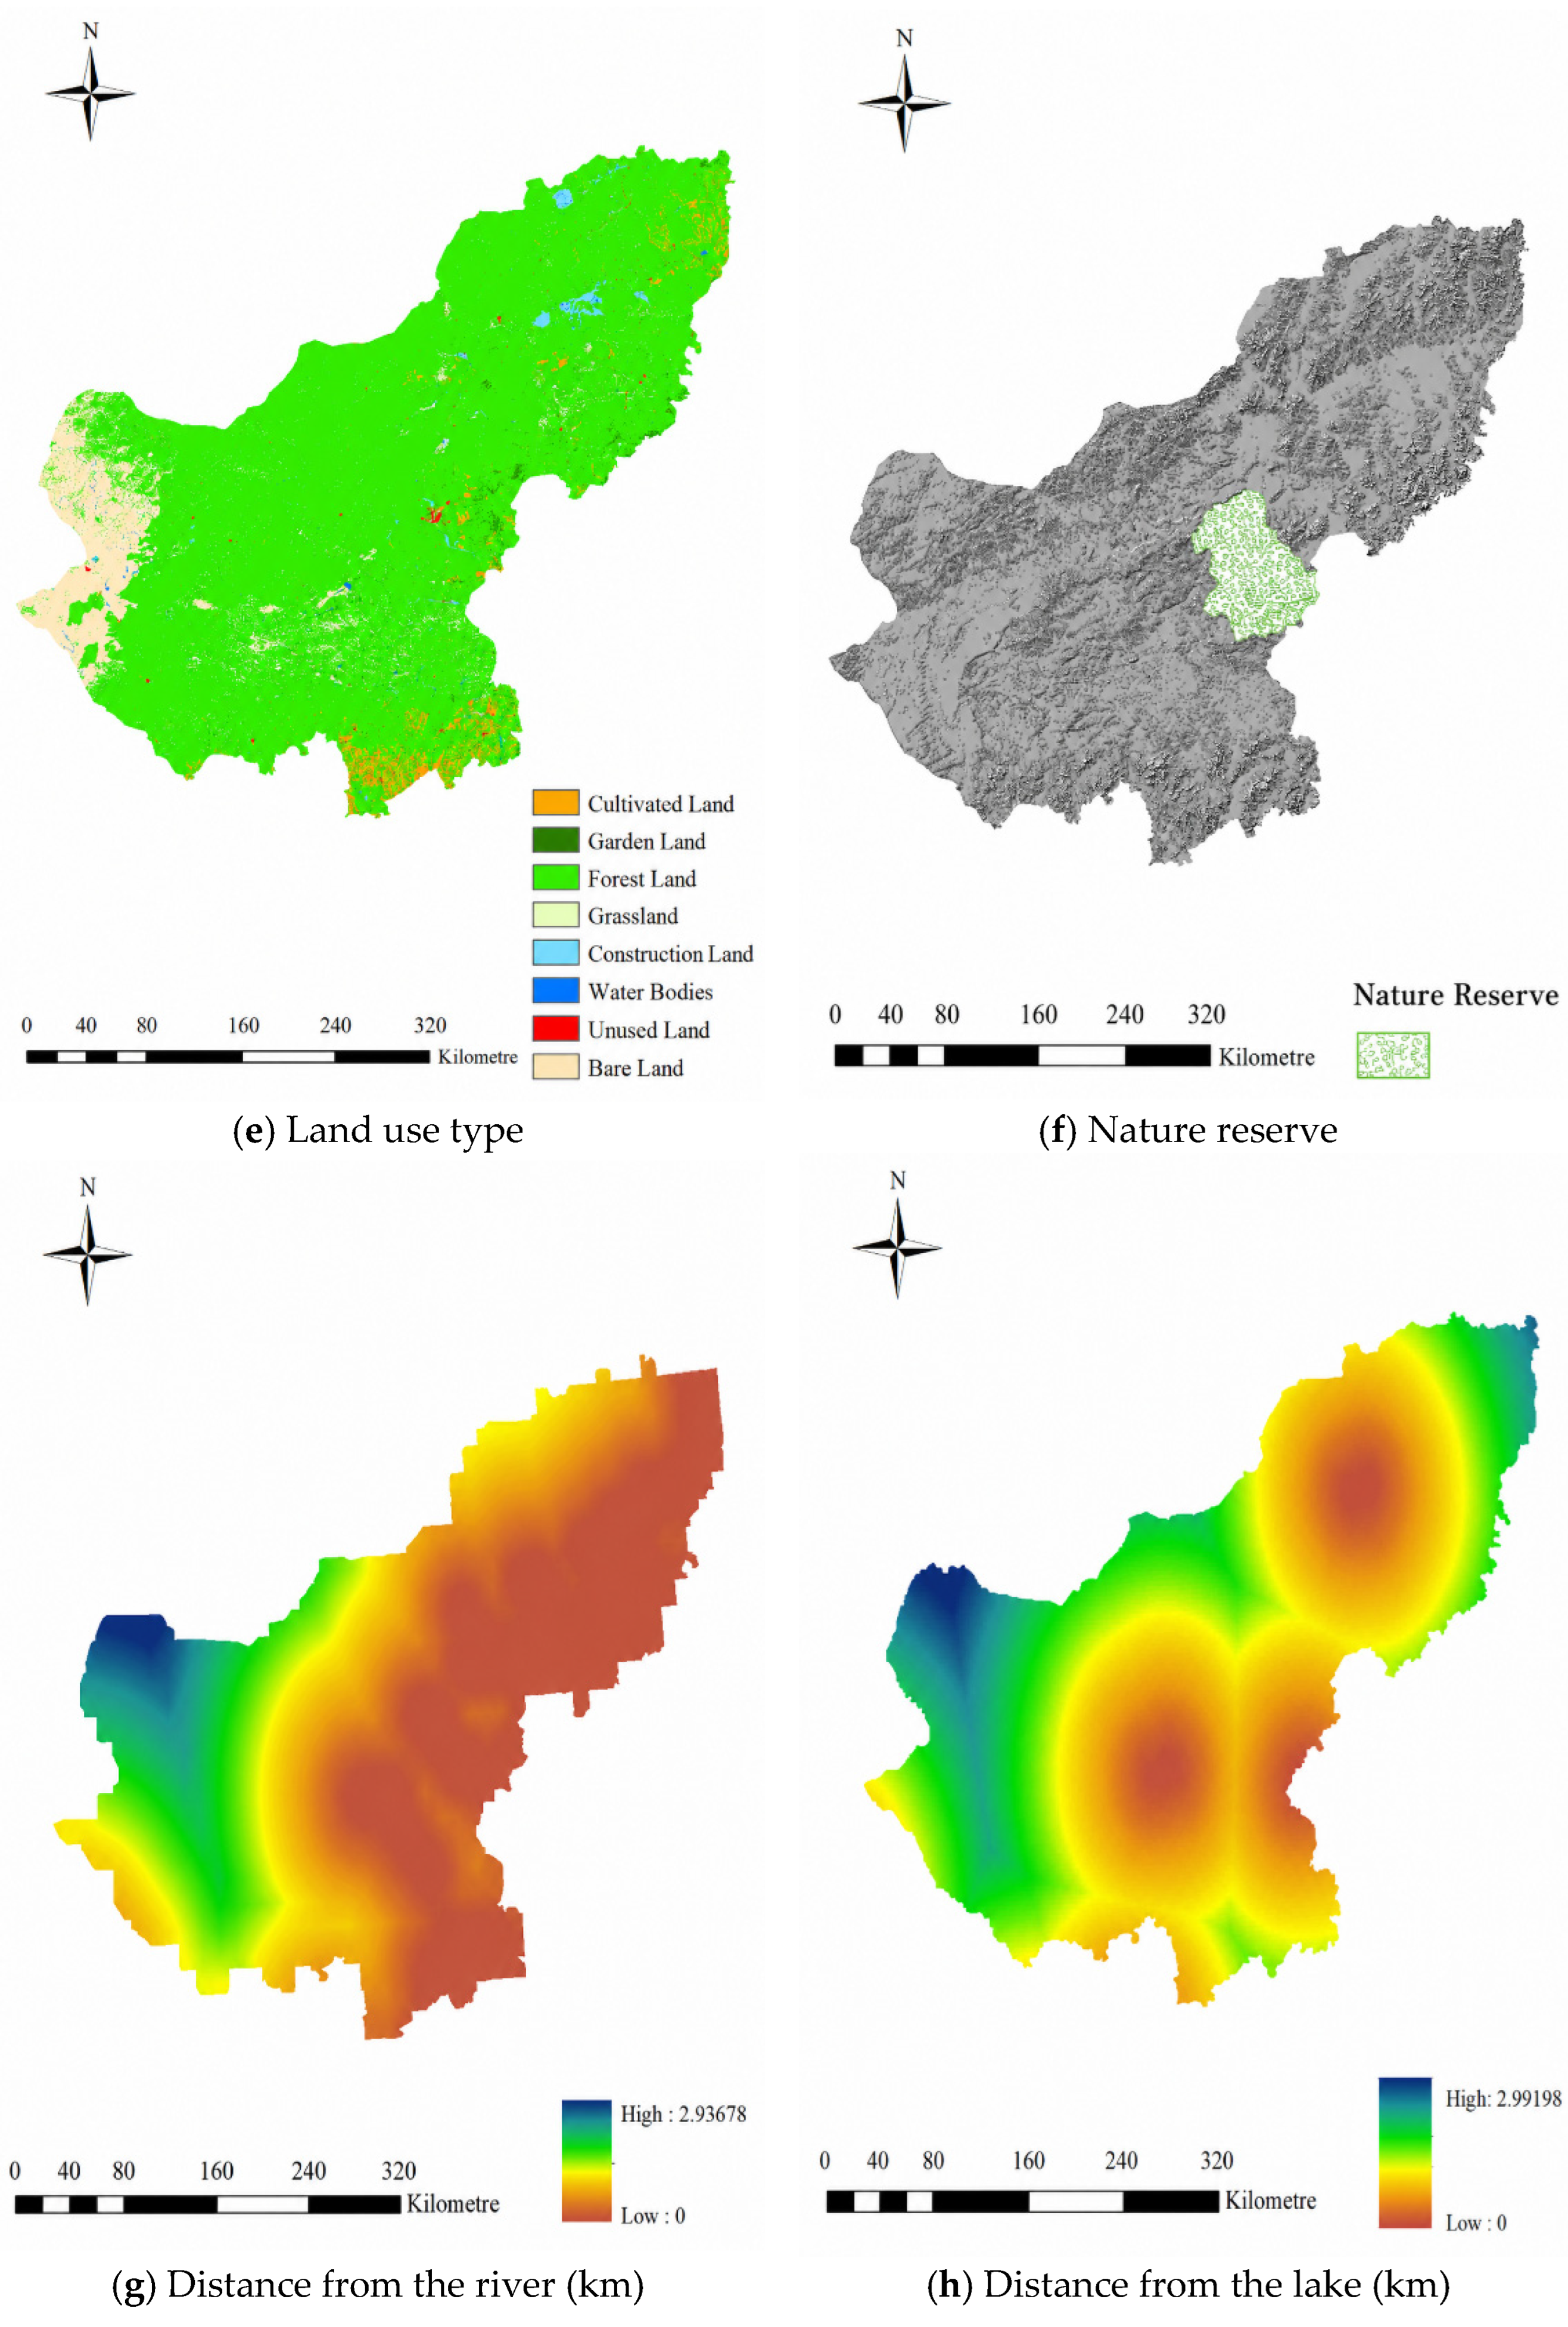
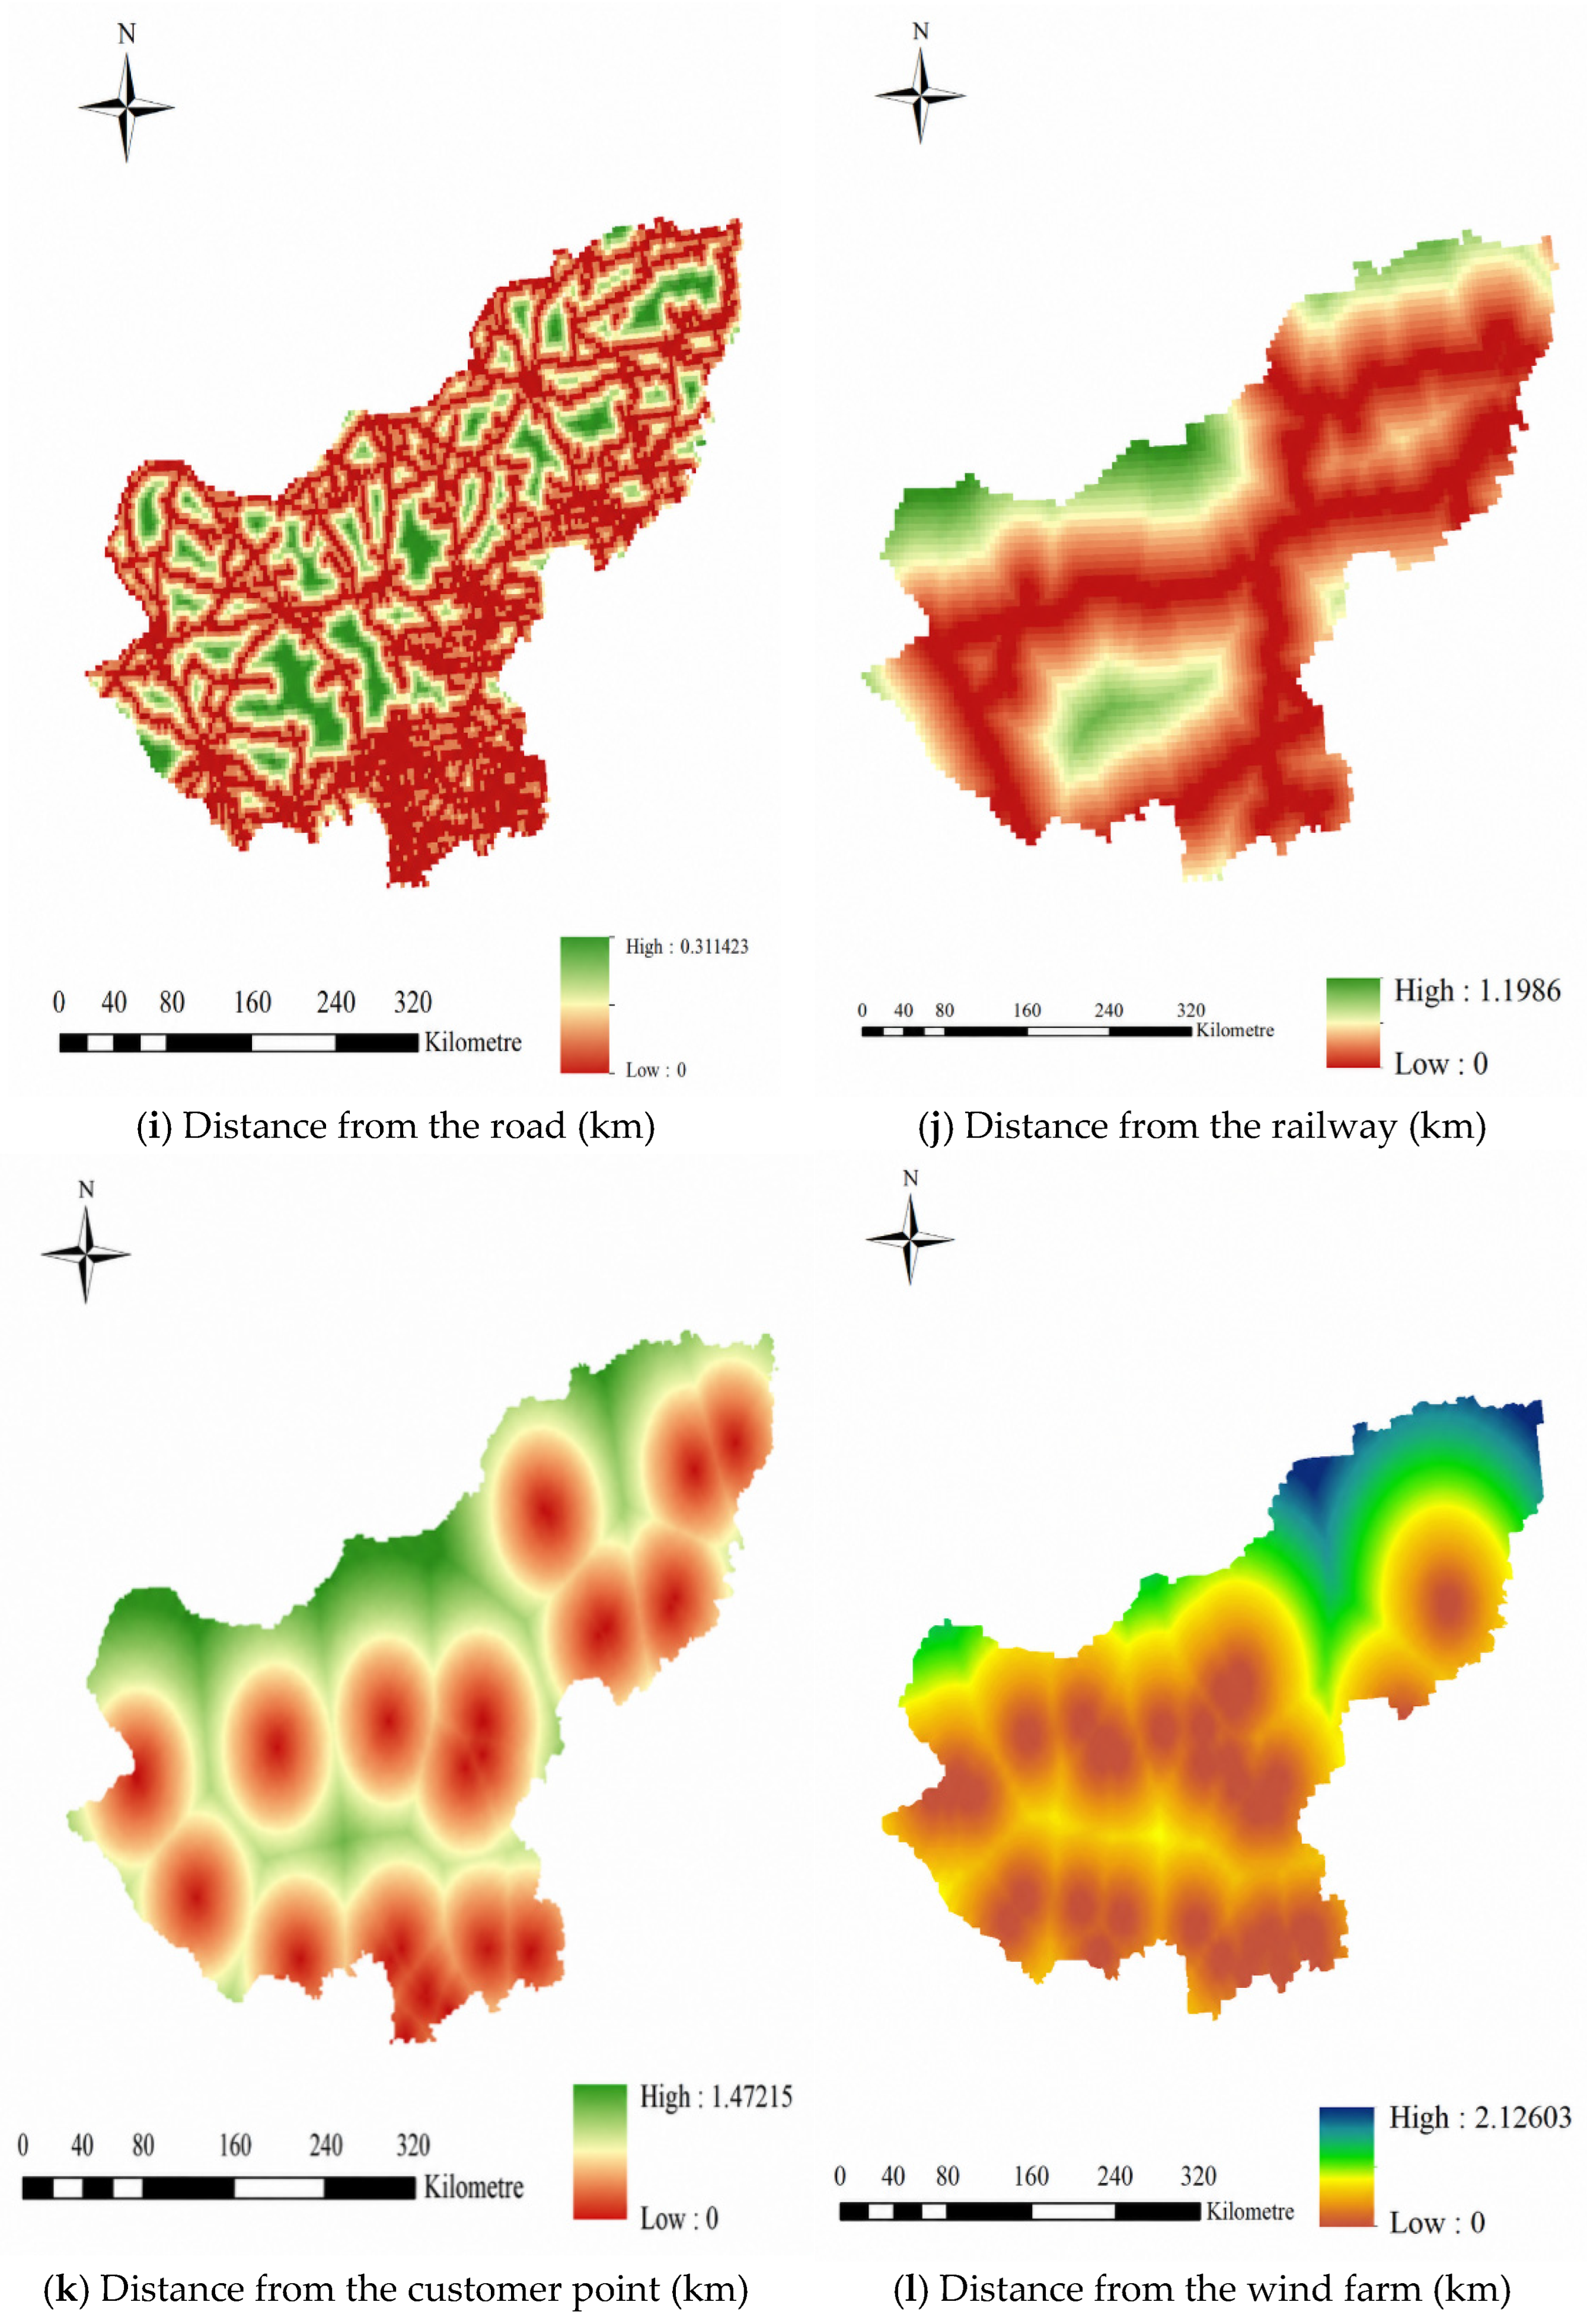
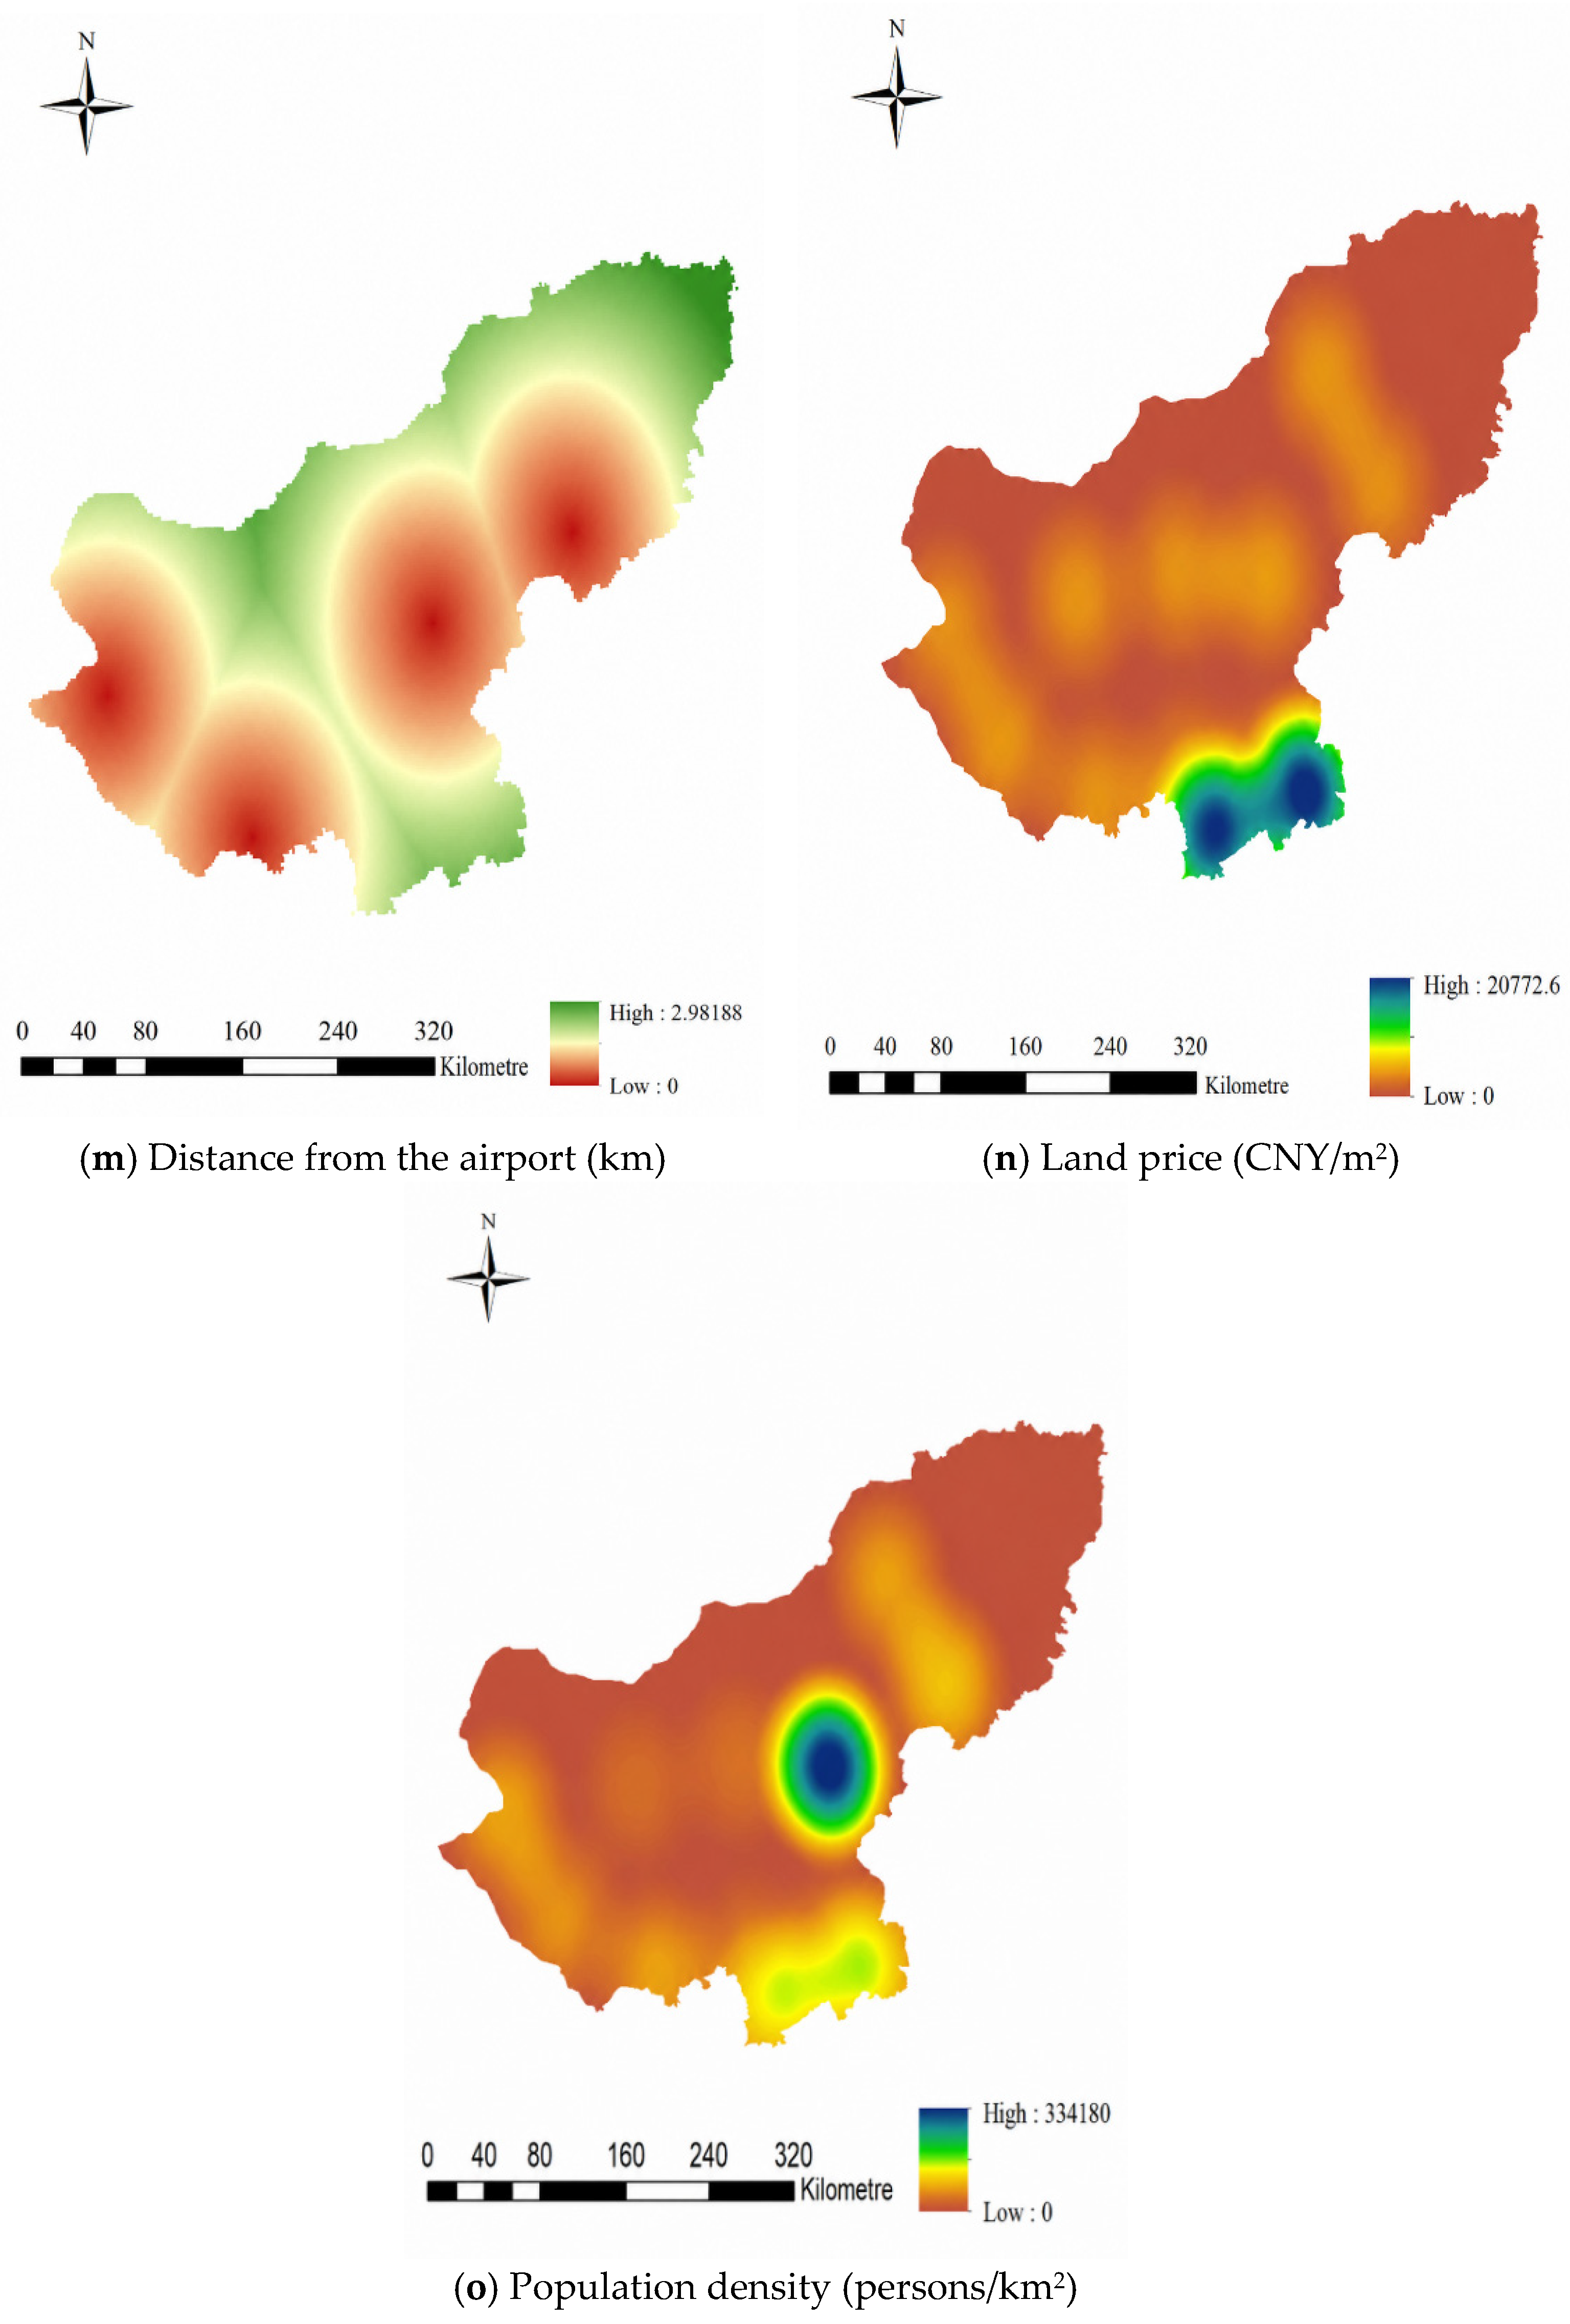
The collected metric data are processed and analyzed in ArcGIS. First, the coordinate system of the distance type indicators is converted to a projection coordinate system. The longitude and latitude coordinates of major wind farms in Xilingol, downstream customer points for wind turbine product recycling, and the airport are collected, and Euclidean distance analysis is performed to obtain corresponding indicator maps. Then, the locations, population and land prices of each city in Xilingol are collected. Kernel density analysis is conducted to generate population density and land price heat maps. Finally, the processed indicator maps are compiled to prepare for the next step. As shown in Figure 4a–h, the natural-factor maps include elevation, slope, aspect, annual mean temperature, land use type, nature reserves, distance from the river, and distance from the lake. Figure 4i–m present the location-factor maps, including distance from the road, railway, customer point, wind farm, and airport, while Figure 4n–o show the social-factor maps of land price and population density.
Figure 4.
Spatial Information Map of Indicators.
4.3.2. Weight Determination Results
The weighting process is conducted at two levels. First, AHP is used to determine the weights of the target layer, including natural factors, location factors, and social factors. Second, the CRITIC method is used to determine the objective weights of the indicator layer within each target-layer category. In this way, expert judgment is used to reflect the relative importance of broad site-selection dimensions, while data-driven weighting is used to measure the information content and differentiation ability of measurable indicators.
Subjective Weighting Method (Analytic Hierarchy Process)
AHP is used to calculate the weights of the target layer, including natural factors, location factors, and social factors. Experts were selected based on their academic background and professional experience in logistics systems, GIS spatial analysis, environmental assessment, circular economy, industrial resource management, wind energy technology, and sustainable logistics. Their profiles, including gender, degree, and professional field, are presented in Table 5.
Table 5.
Profile of experts.
The judgment matrix constructed based on the scores from invited experts is shown in Table 6. The 1–9 scale method was used for scoring. The normalized weight table is calculated as presented in Table 7, and the results of the consistency test are given in Table 8.
Table 6.
Judgment Matrices.
Table 7.
Normalized Weights.
Table 8.
Consistency Test.
The consistency ratio of 0.005, which is less than 0.1, passes the consistency test.
The CRITIC Method Determines the Weights
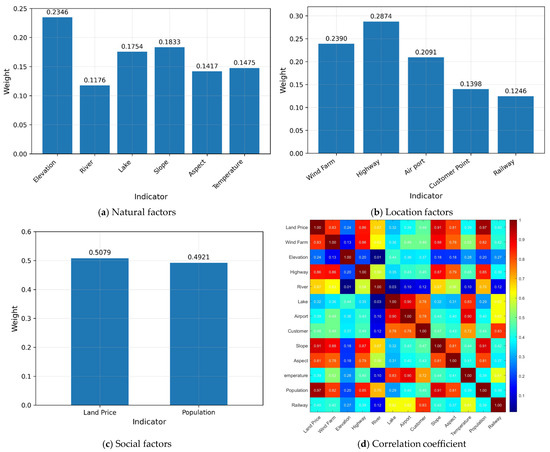
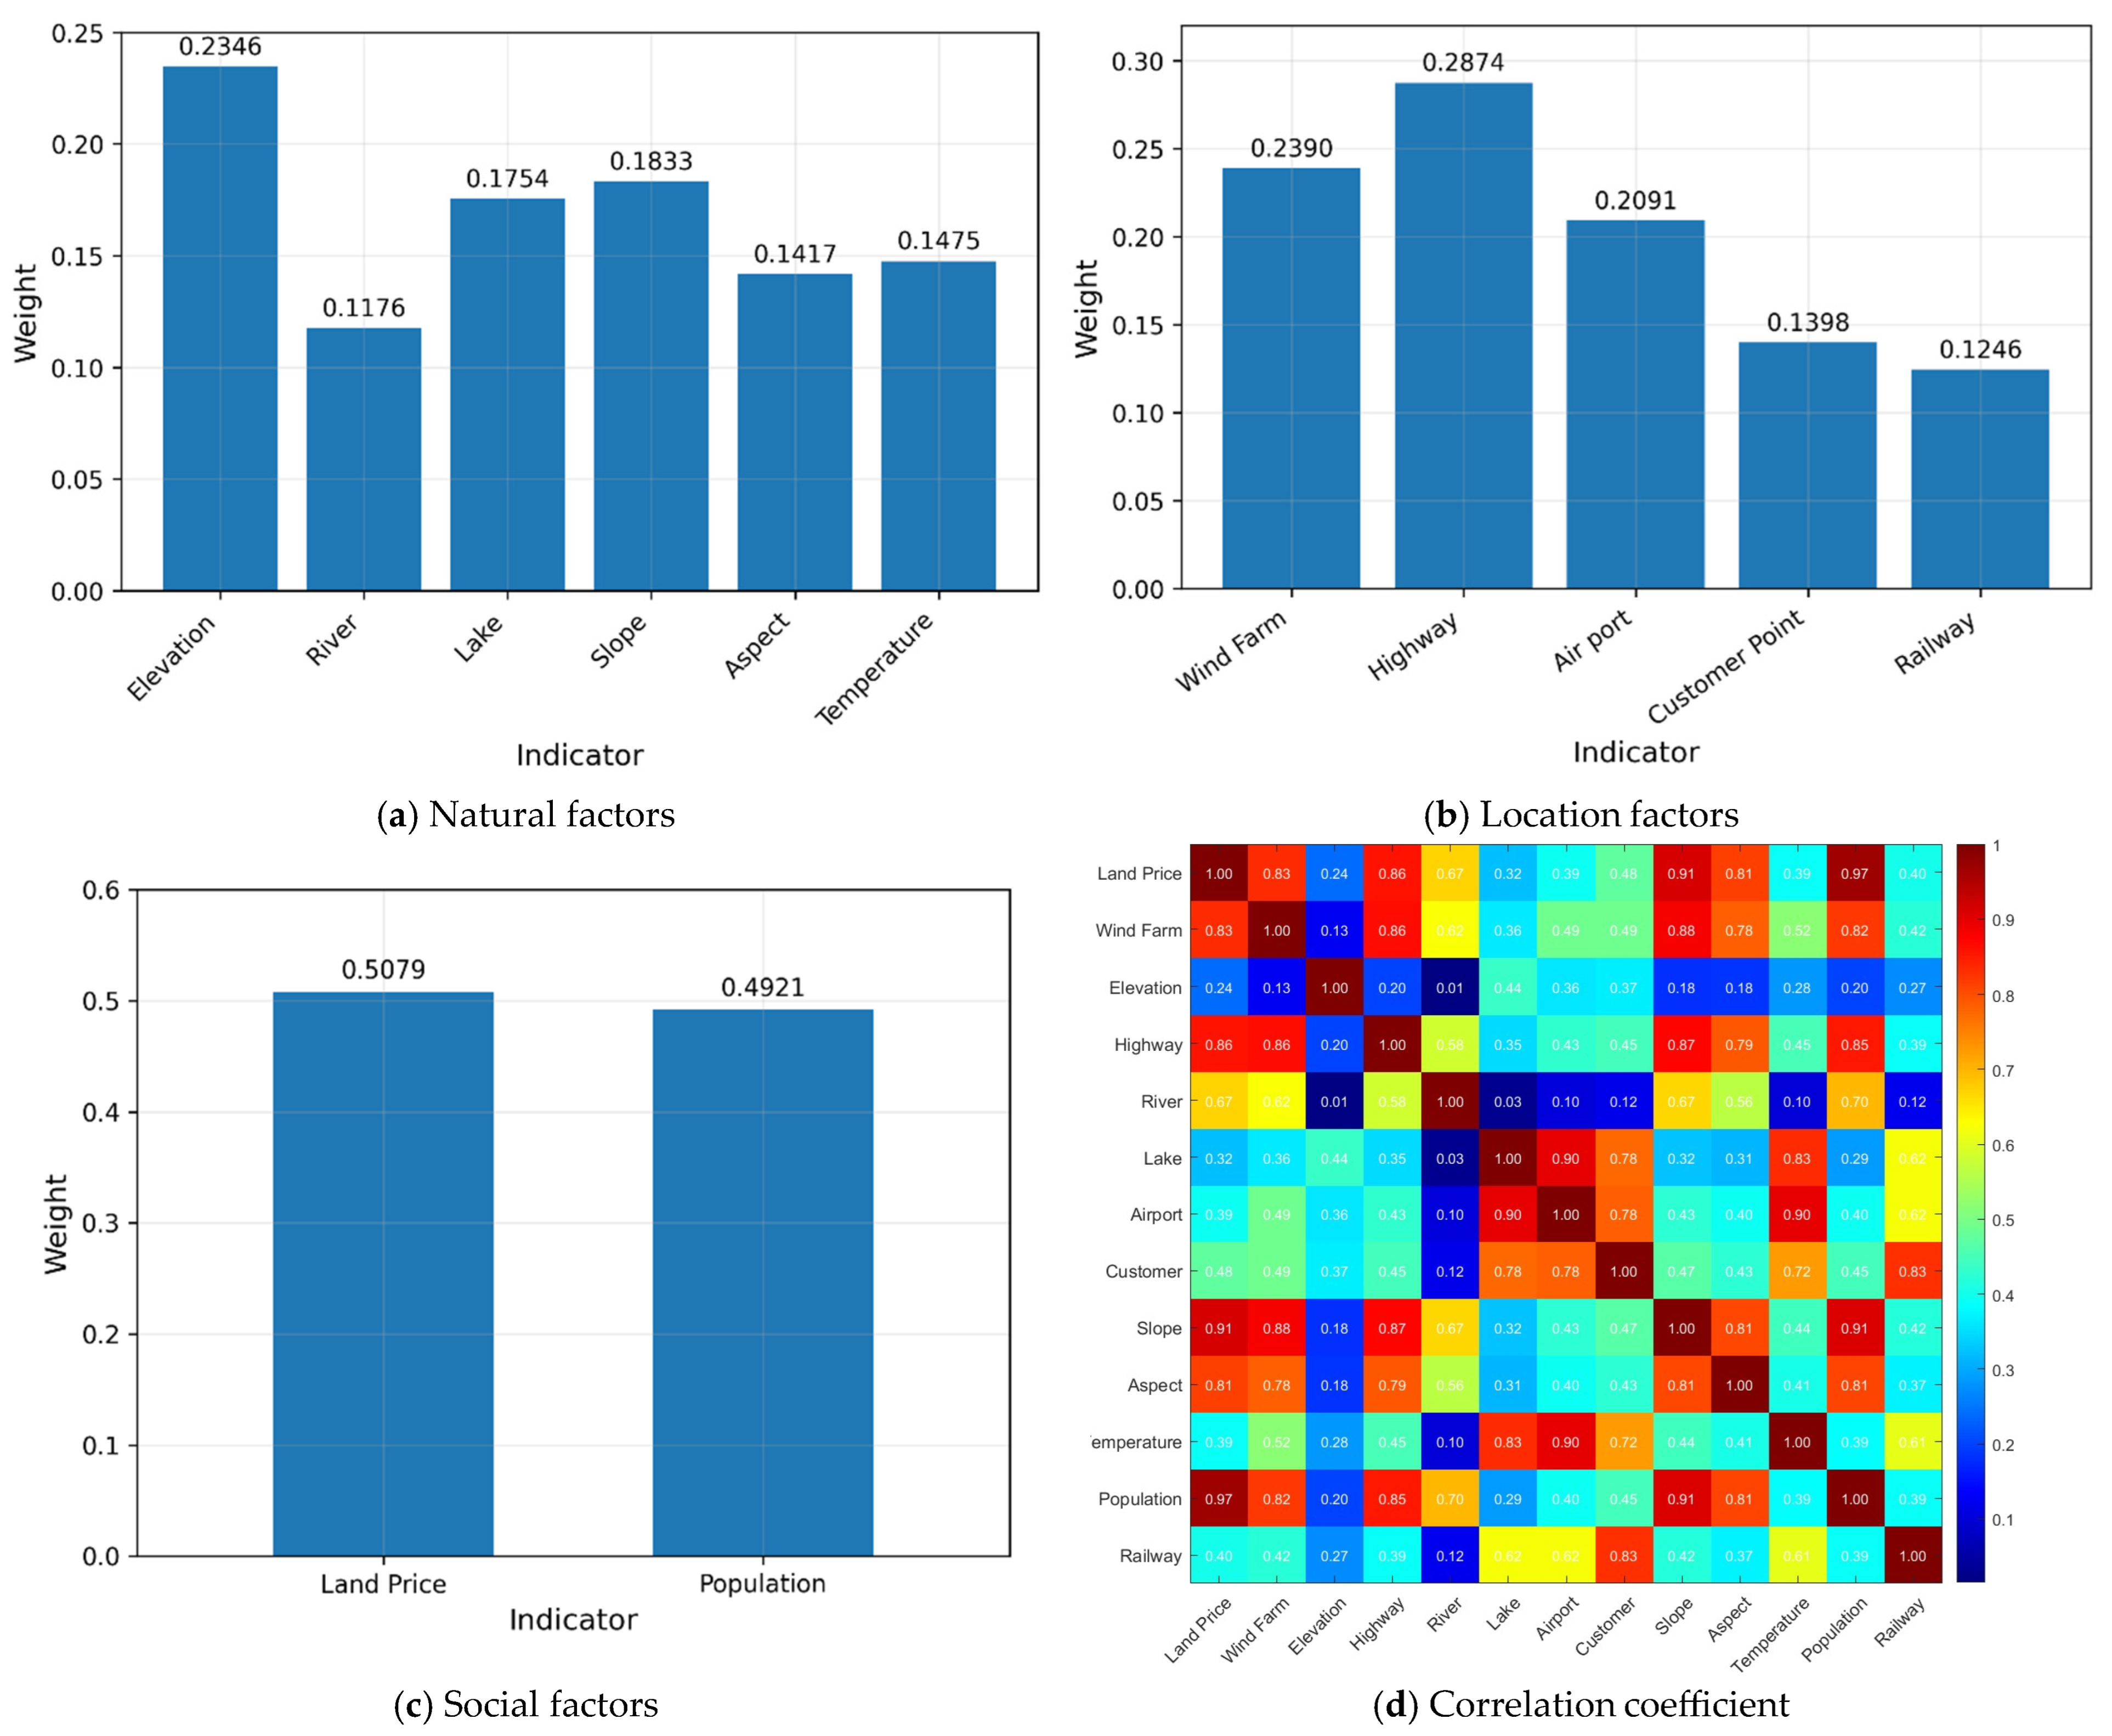
Based on the spatial information raster map of indicators obtained in Section 4.3.1, the raster data are imported into MATLAB R2023a and the CRITIC method is implemented. Figure 5a–c show the weight distributions of natural factors, location factors, and social factors, respectively, while Figure 5d presents the correlation coefficient heatmap. CRITIC determines the indicator-layer weights, which are combined with the AHP-derived target-layer weights to obtain the final comprehensive weights shown in Table 9.
Figure 5.
Plot of Weights and Correlation Coefficients.
Table 9.
Weight Table.
The correlation coefficient heatmap shows that most selected indicators have low correlations, while only a few indicators show relatively high correlations. However, these indicators represent different spatial constraints and operational considerations in the site-selection process. Therefore, they were retained to preserve the completeness of the indicator system.
4.3.3. Normalization and Weighted Overlay Results
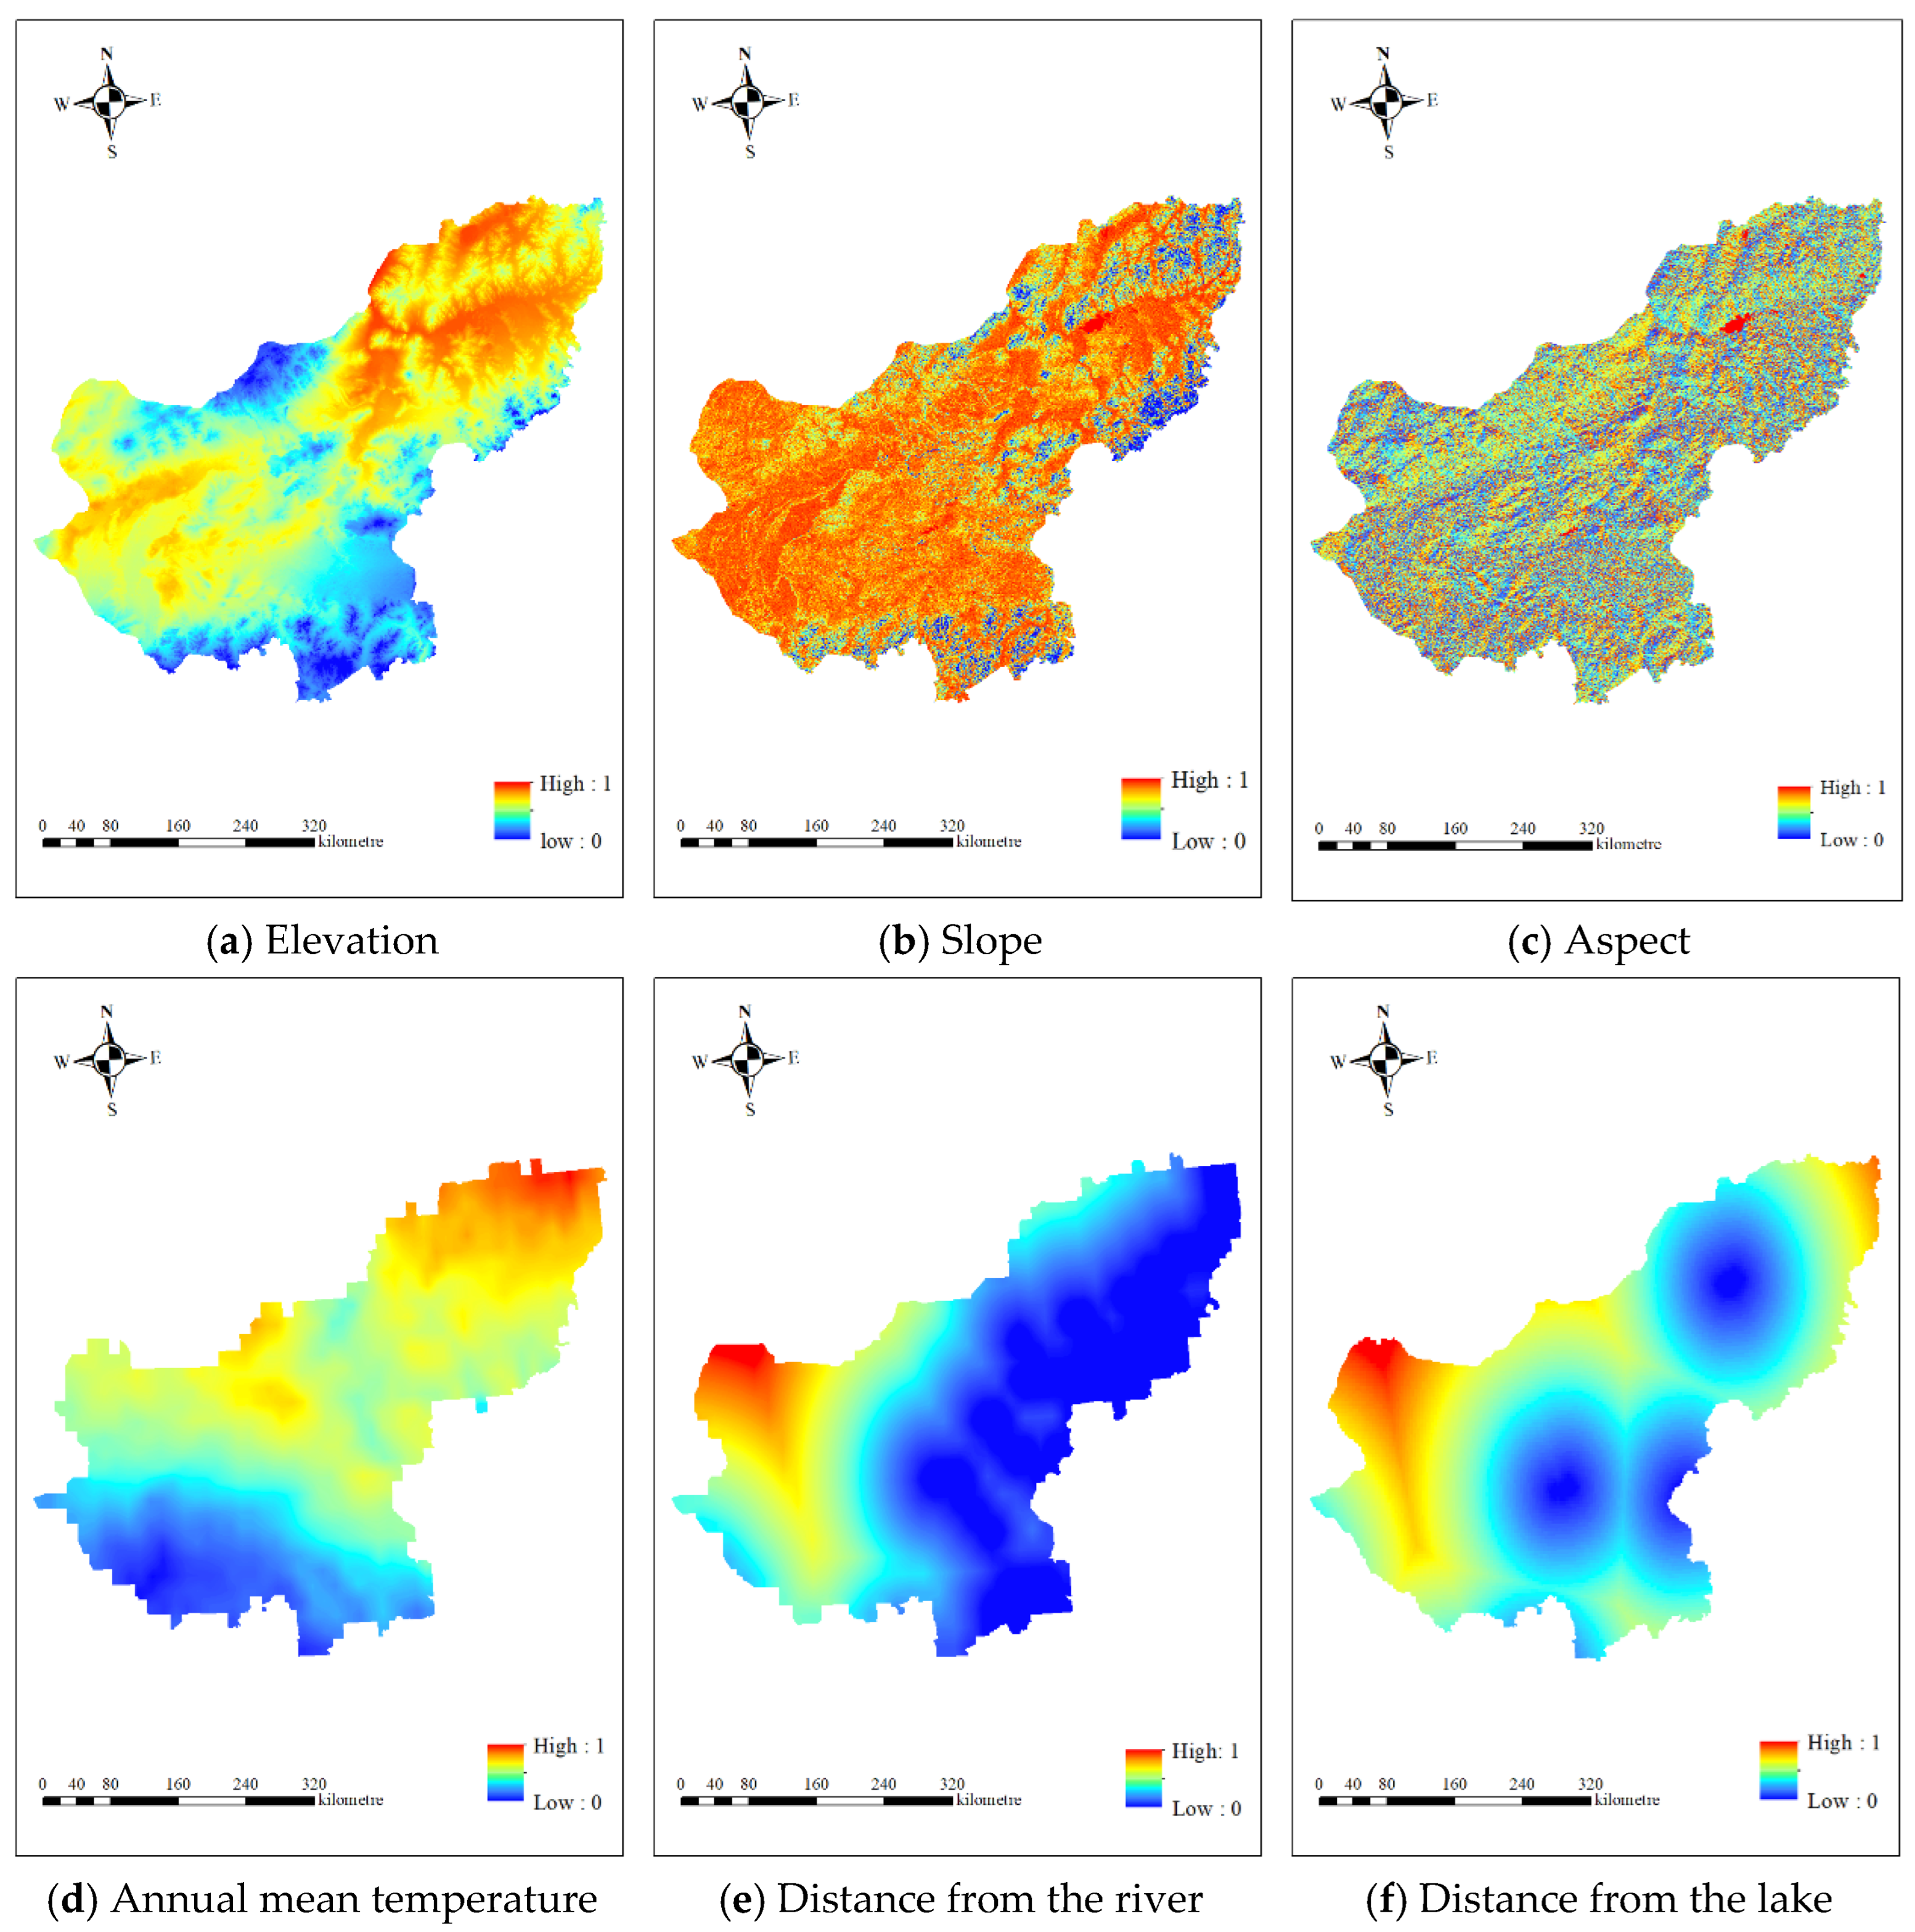
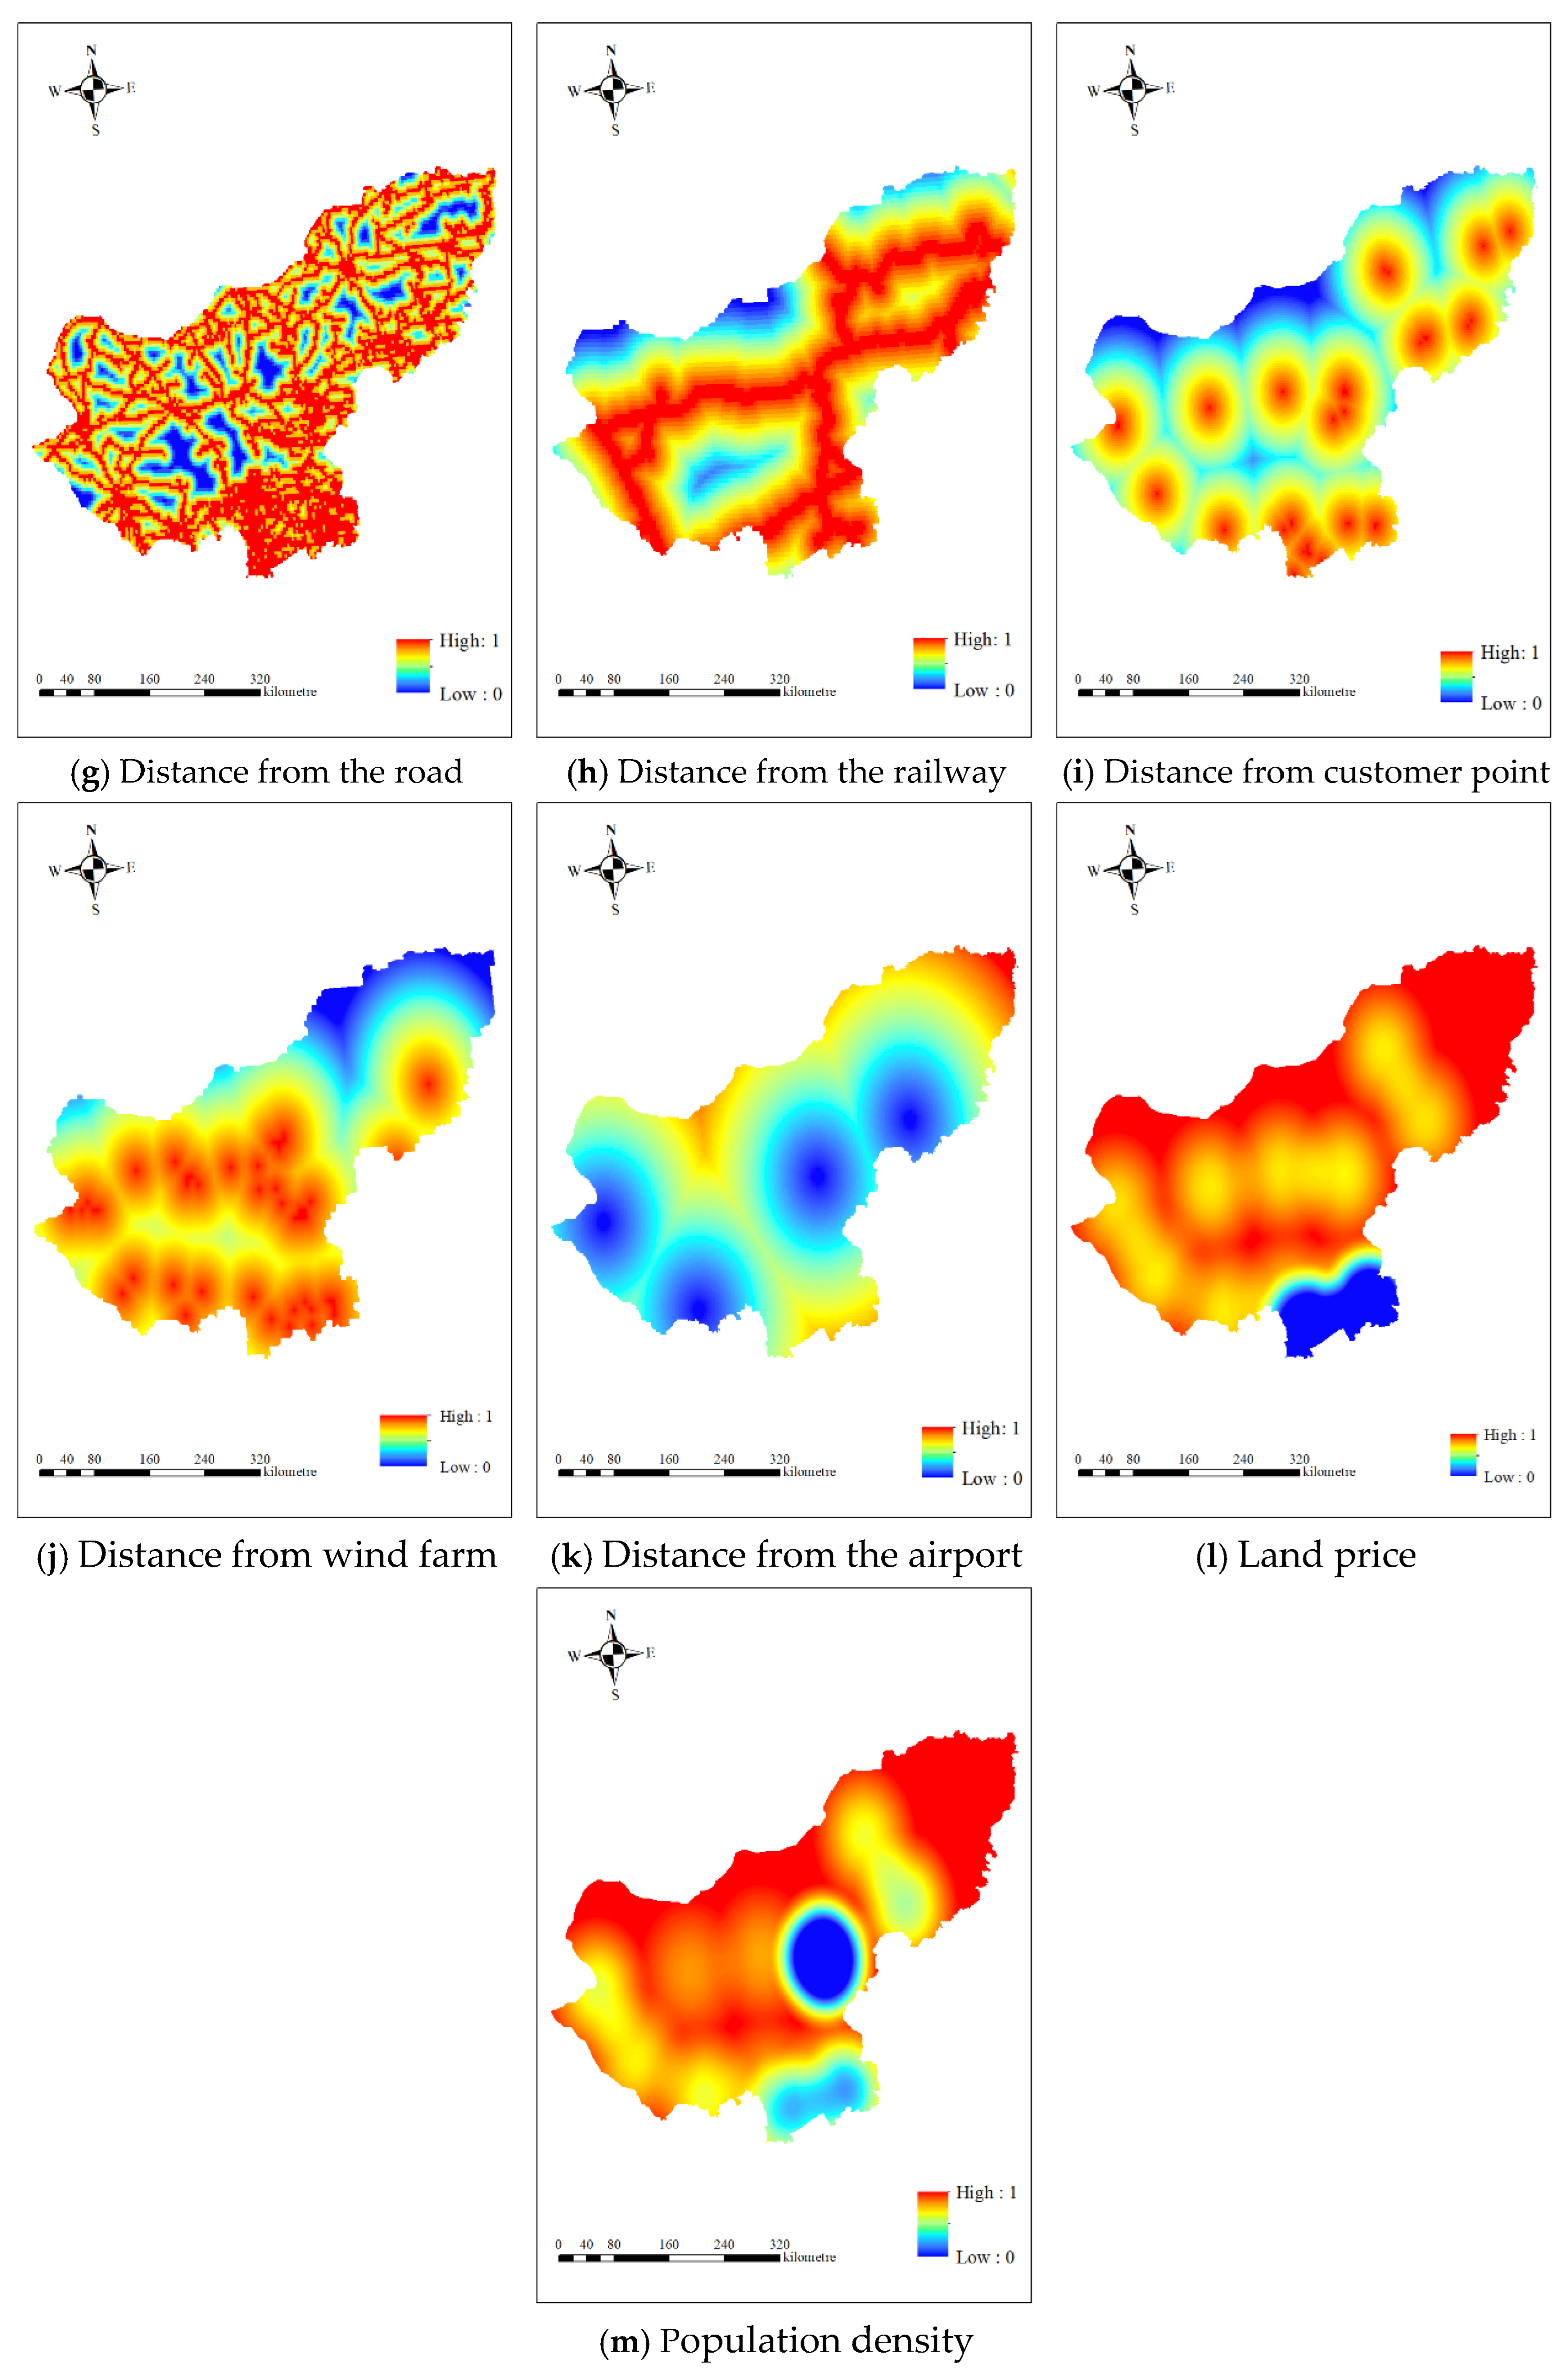
Because the indicators differ in dimensions and suitability directions, all indicator layers were standardized in ArcGIS before weighted overlay analysis. Positive indicators were standardized using Fuzzy Membership, while negative indicators were standardized by inverse linear normalization implemented through the Raster Calculator. The normalized indicator maps are provided in Appendix A, Figure A1. Normalization only rescales the indicators to comparable 0–1 suitability scores without changing their spatial patterns.
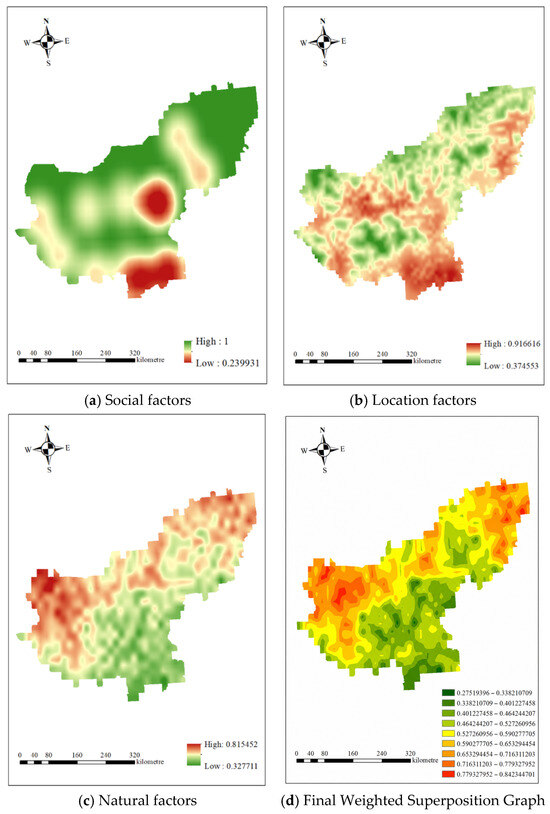
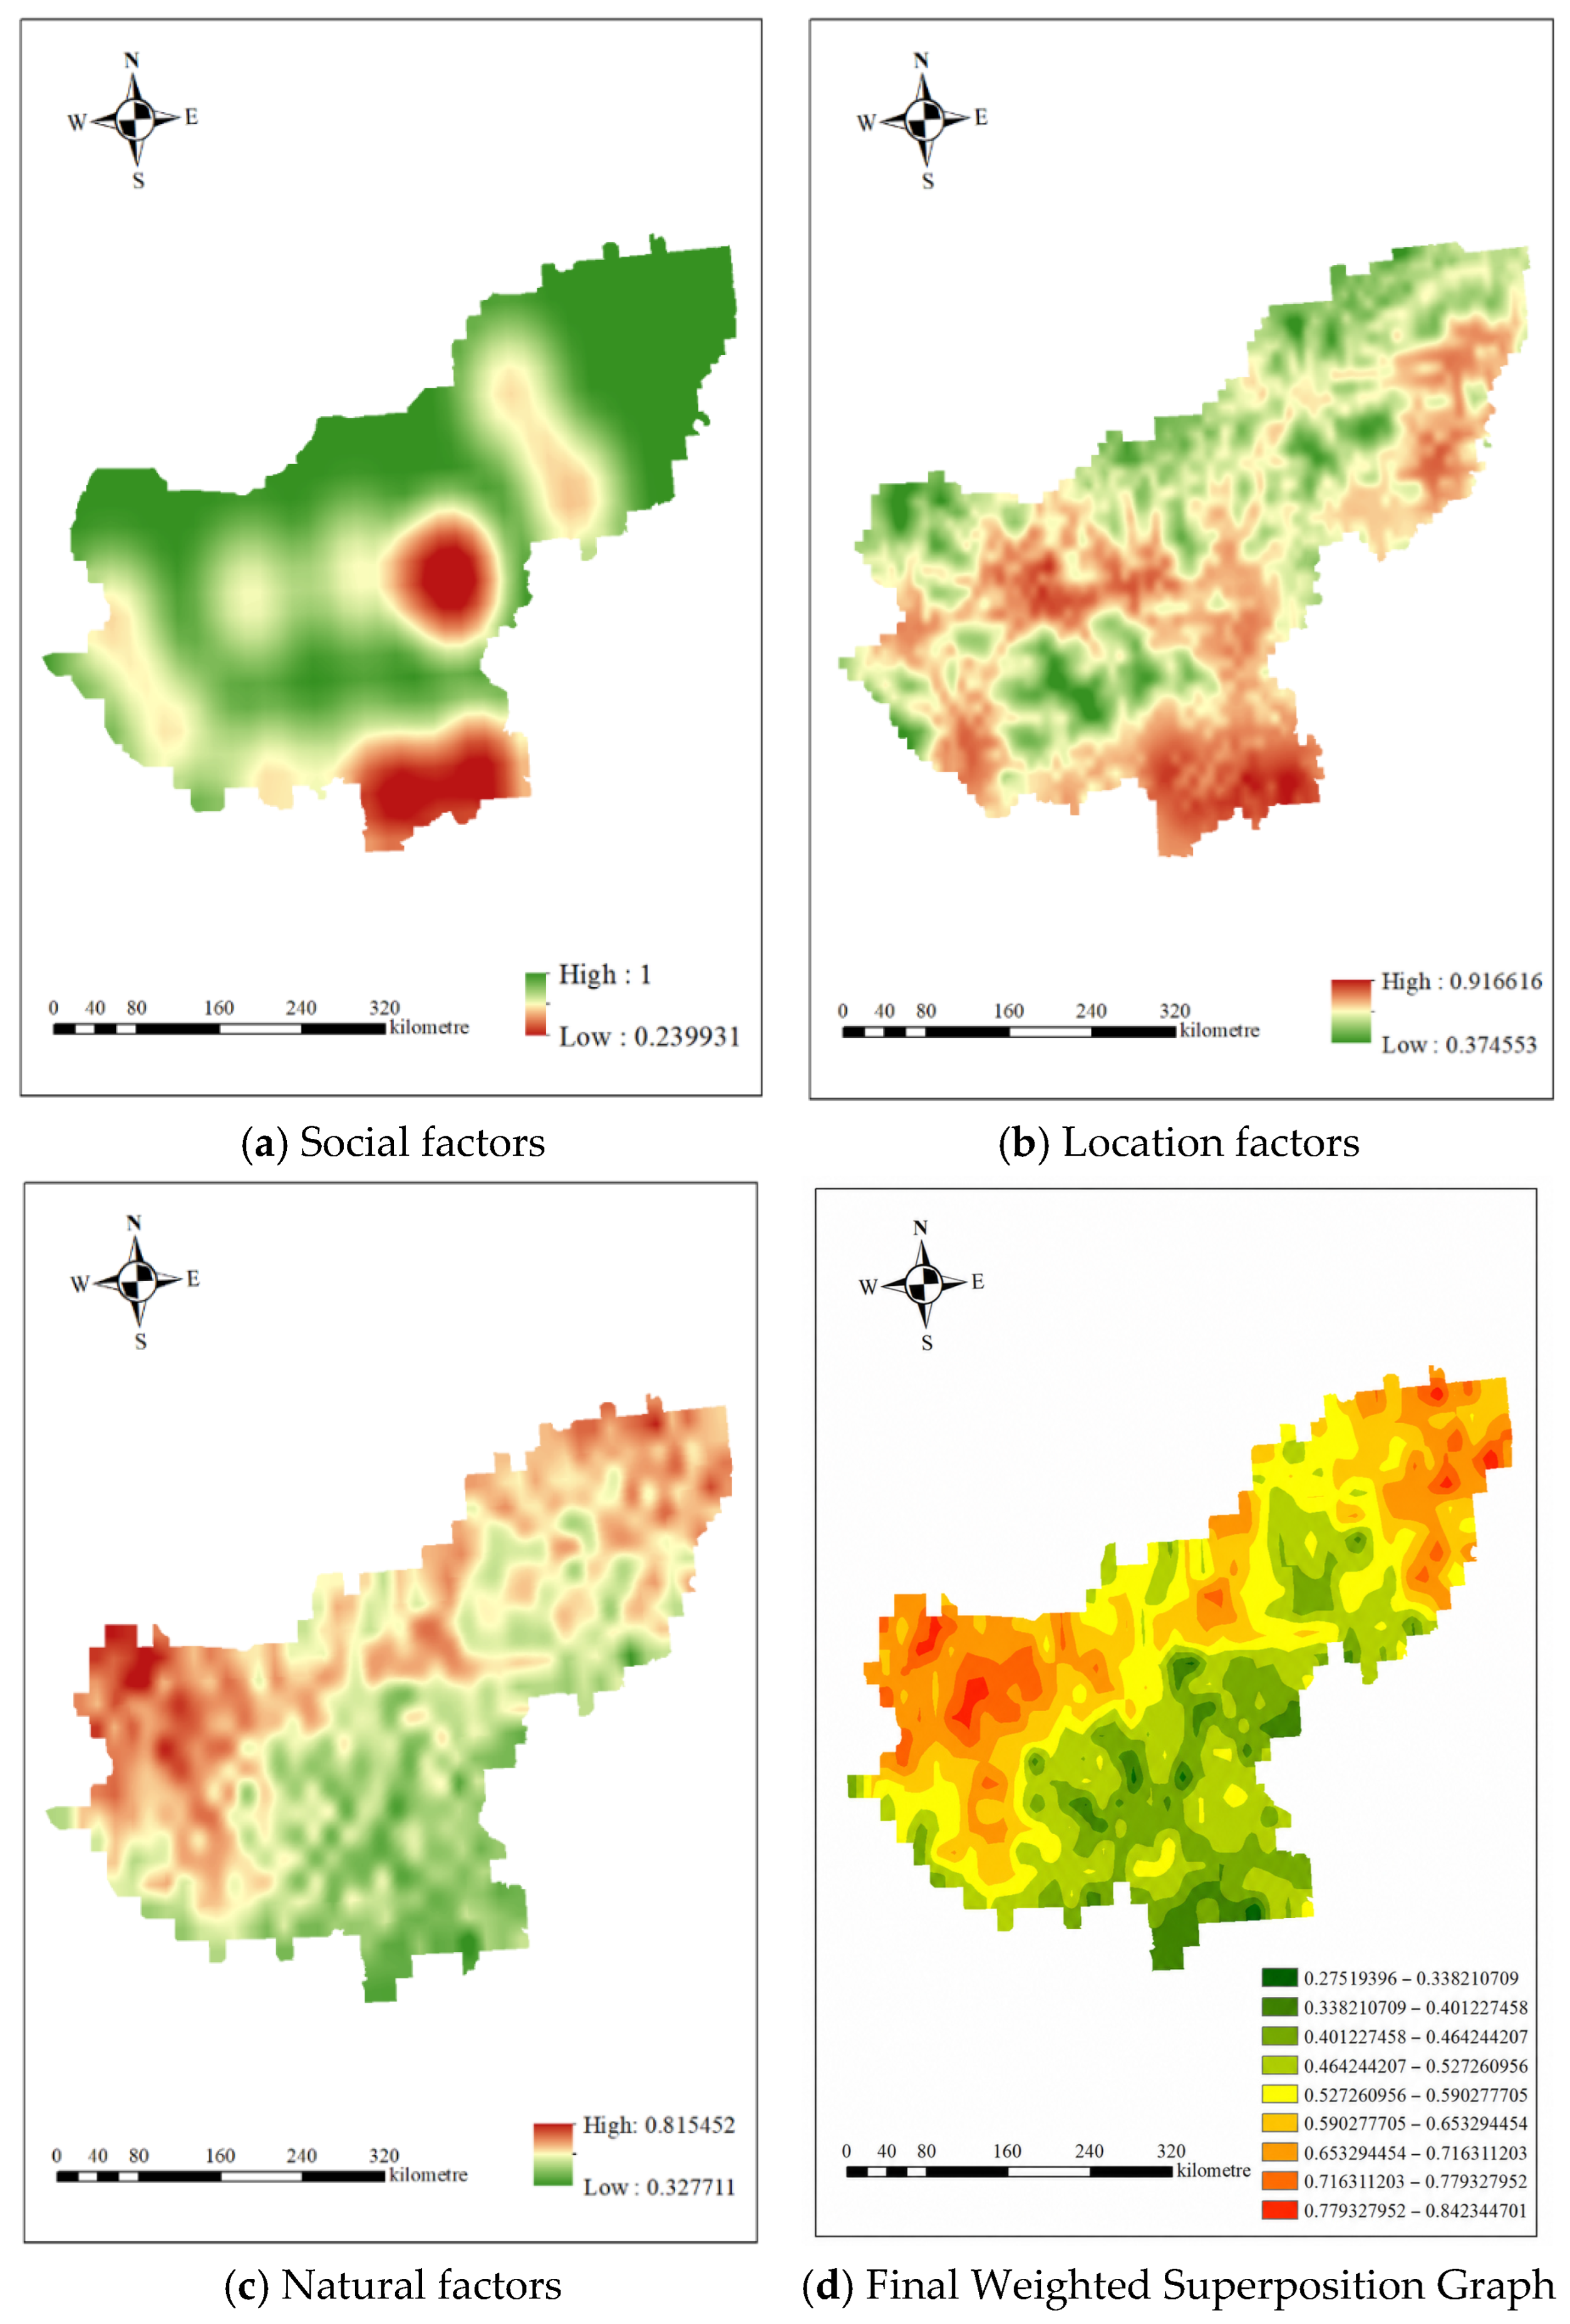
The weighted overlay results of the social, location, and natural factors, together with the final weighted superposition graph, are shown in Figure 6a–d, respectively.
Figure 6.
Weighted overlay results of target layers and final suitability map.
4.3.4. Extraction Results of Highly Suitable Areas
Extraction of Highly Suitable Areas
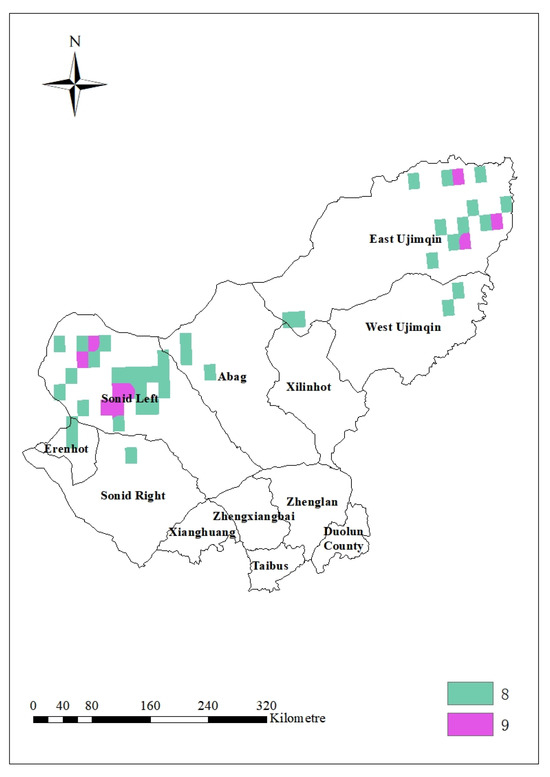
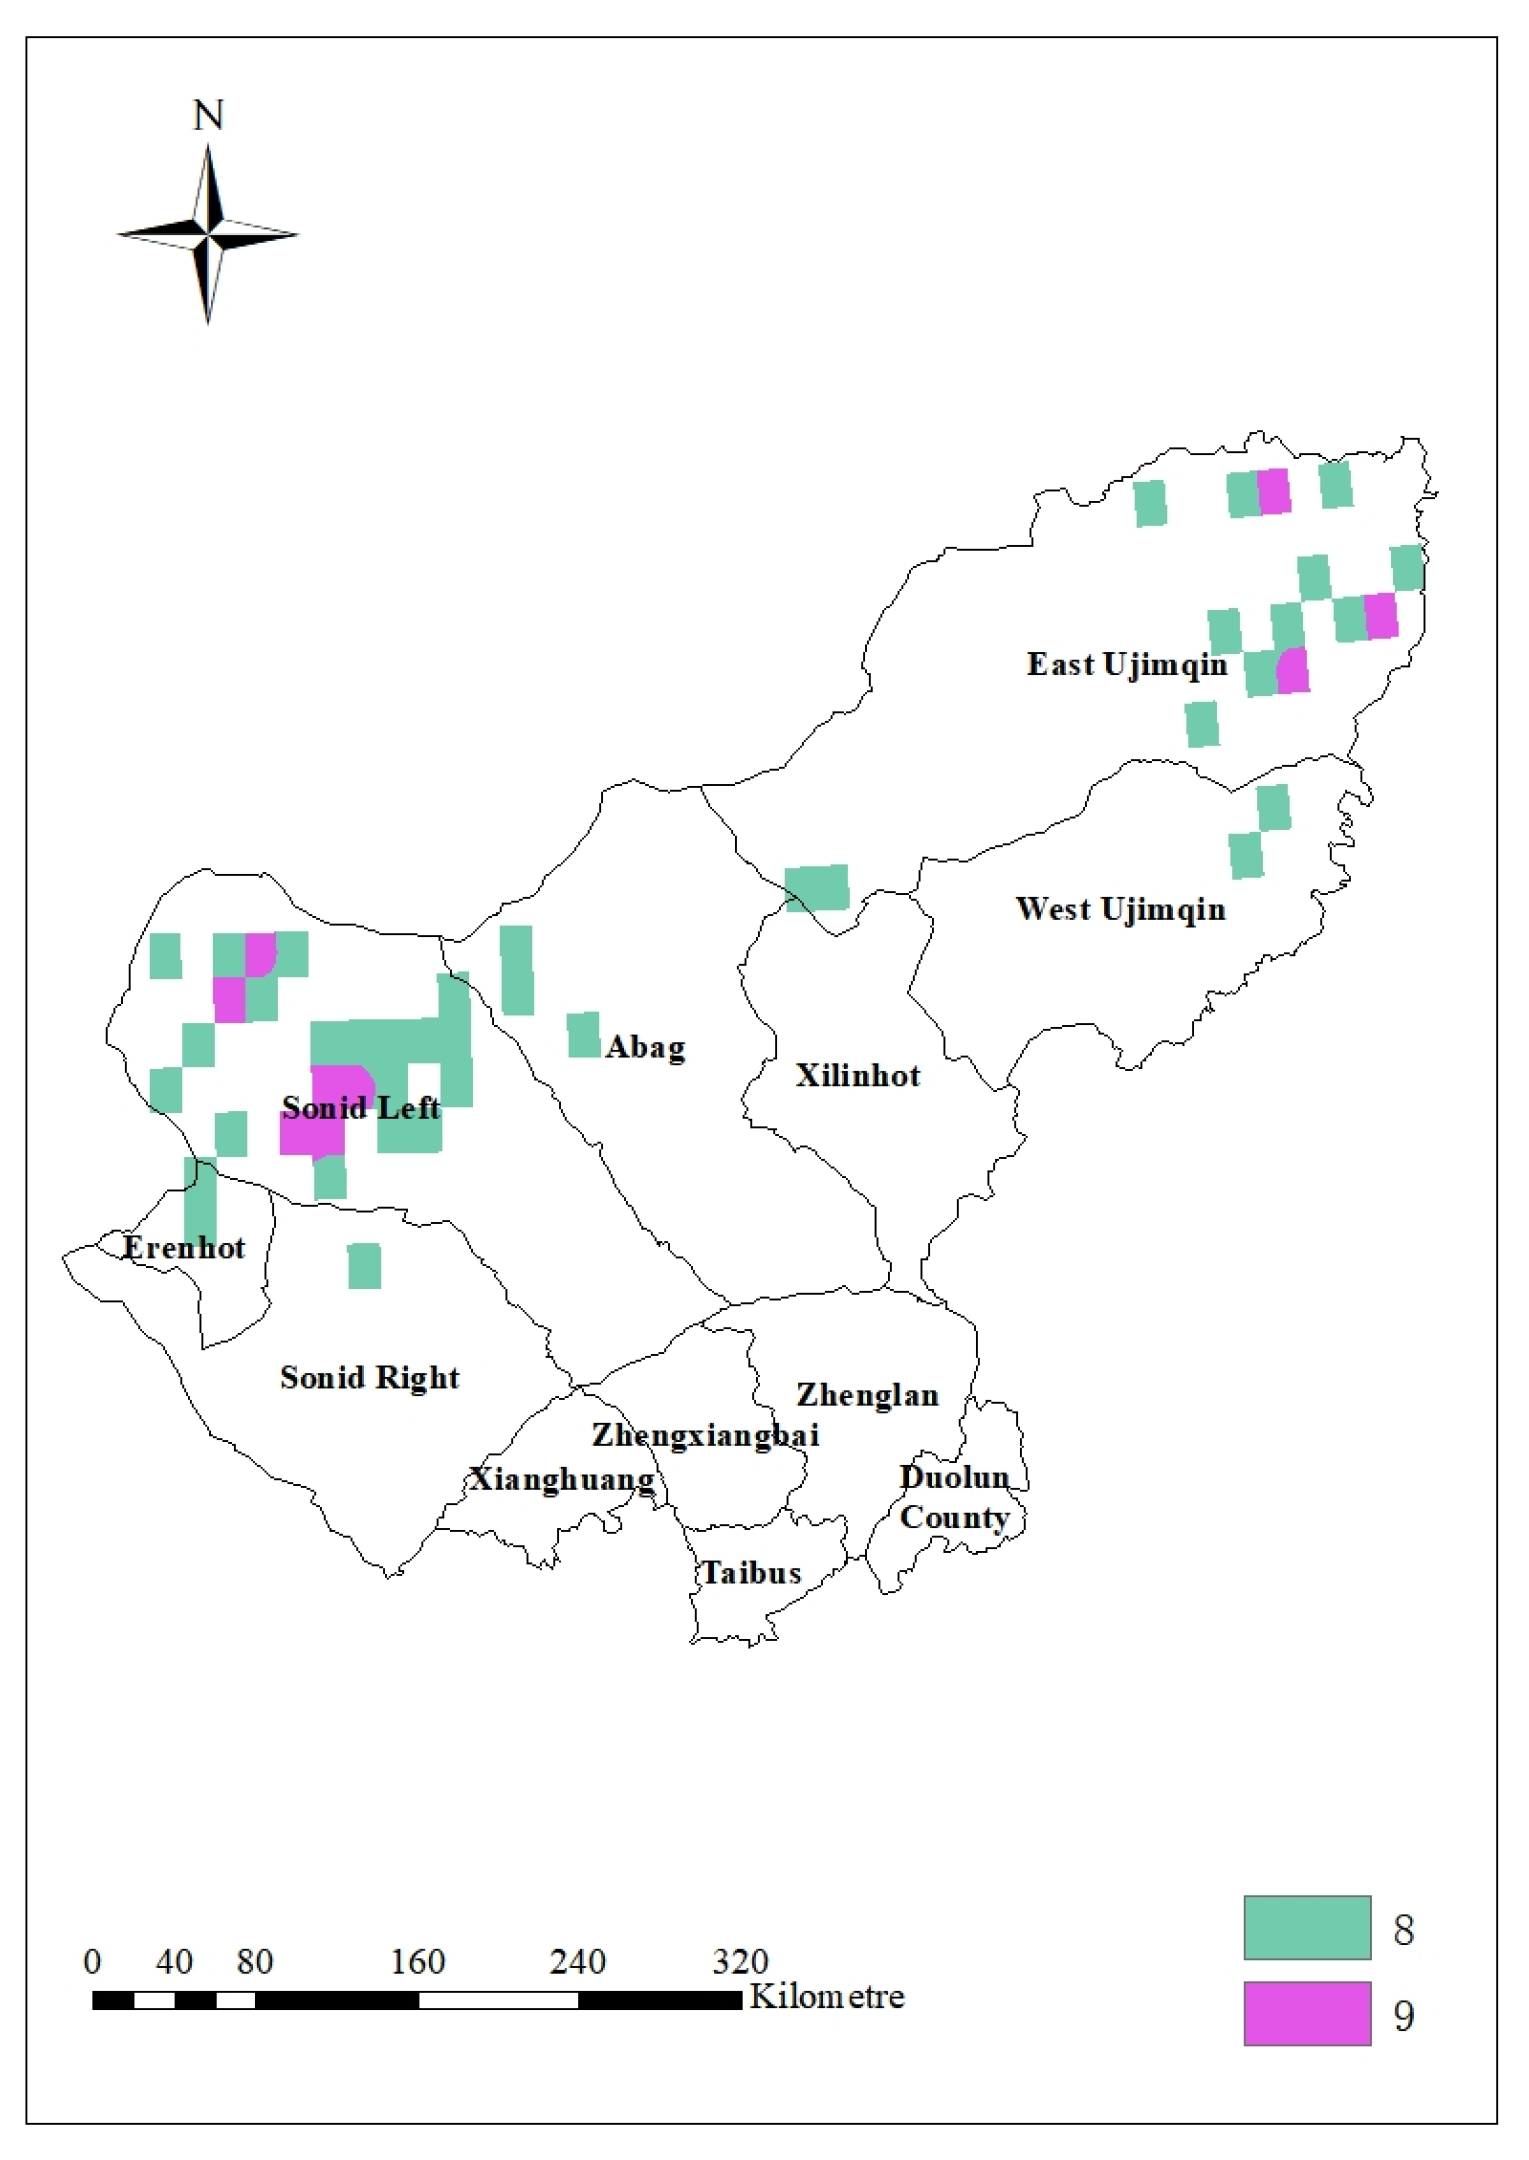
The final suitability map was reclassified into nine grades using the equal-interval classification method, with higher grades representing higher suitability. Since the GIS stage is used for candidate-area screening rather than final site determination, only retaining the highest grade may exclude potentially feasible areas too early. Therefore, grades 8 and 9 were retained as highly suitable areas. This threshold ensures that the extracted areas have high spatial suitability while maintaining a sufficient number of candidate regions for the subsequent Super-Efficiency DEA evaluation, as shown in Figure 7.
Figure 7.
Extraction of highly suitable areas.
Generation and Screening of Final Candidate Points
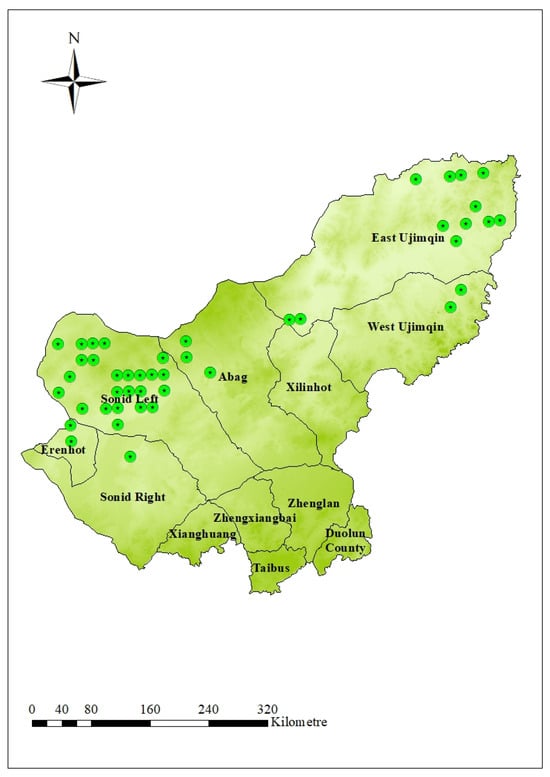
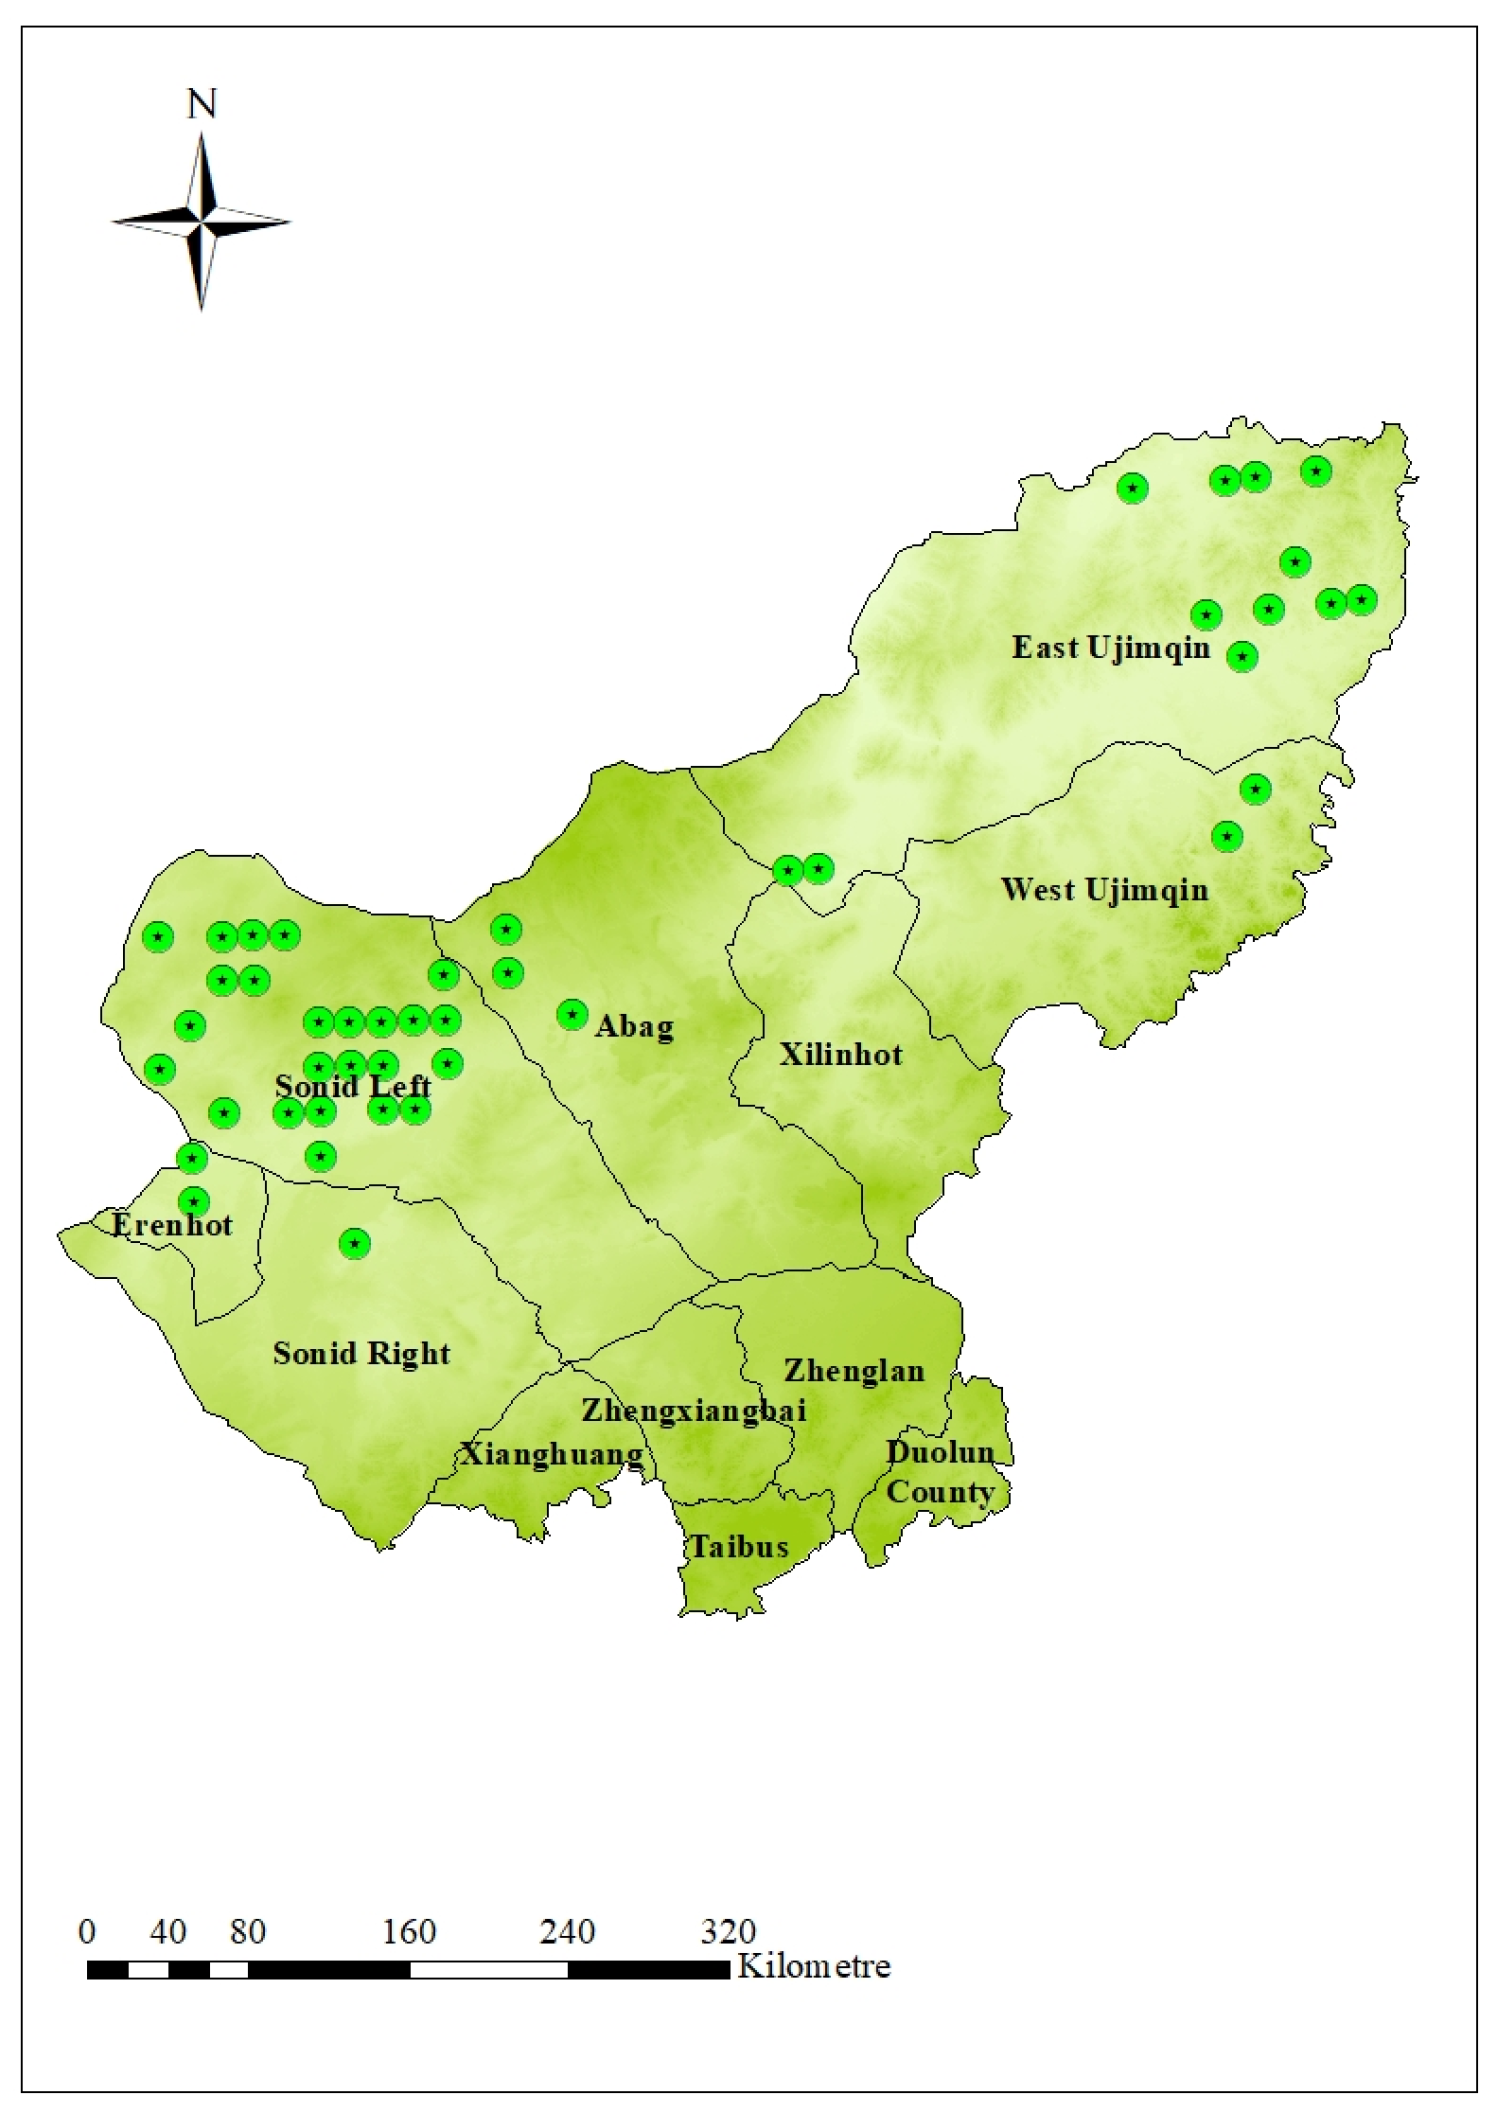
The extracted highly suitable raster regions were converted into point features and overlaid with the county-level administrative boundary, nature reserve, and land-use layers. Points located within strictly protected nature reserves and unsuitable land-use areas, such as residential zones and water bodies, were excluded. The remaining points were identified as the final candidate points in highly suitable areas (Figure 8).
Figure 8.
Final candidate points in highly suitable areas.
4.4. Super-Efficiency DEA Results
Based on the distribution map of highly suitable areas obtained in the previous section and the map of Xilingol, it is found that the wind turbine recycling centers can be established in East Ujimqin, West Ujimqin, Erenhot, Sonid Right, Sonid Left, Abag, and other areas. Labor cost and land cost are selected as inputs, and the annual wind turbine retirement volume is selected as the output for DEA efficiency evaluation. Finally, the most suitable area for establishing a wind turbine recycling center is obtained.
Potential Site Efficiency Assessment
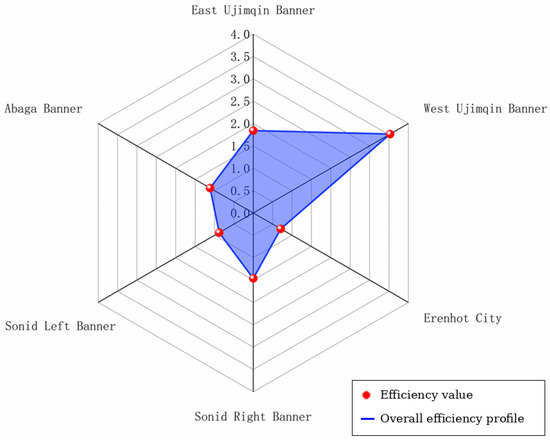
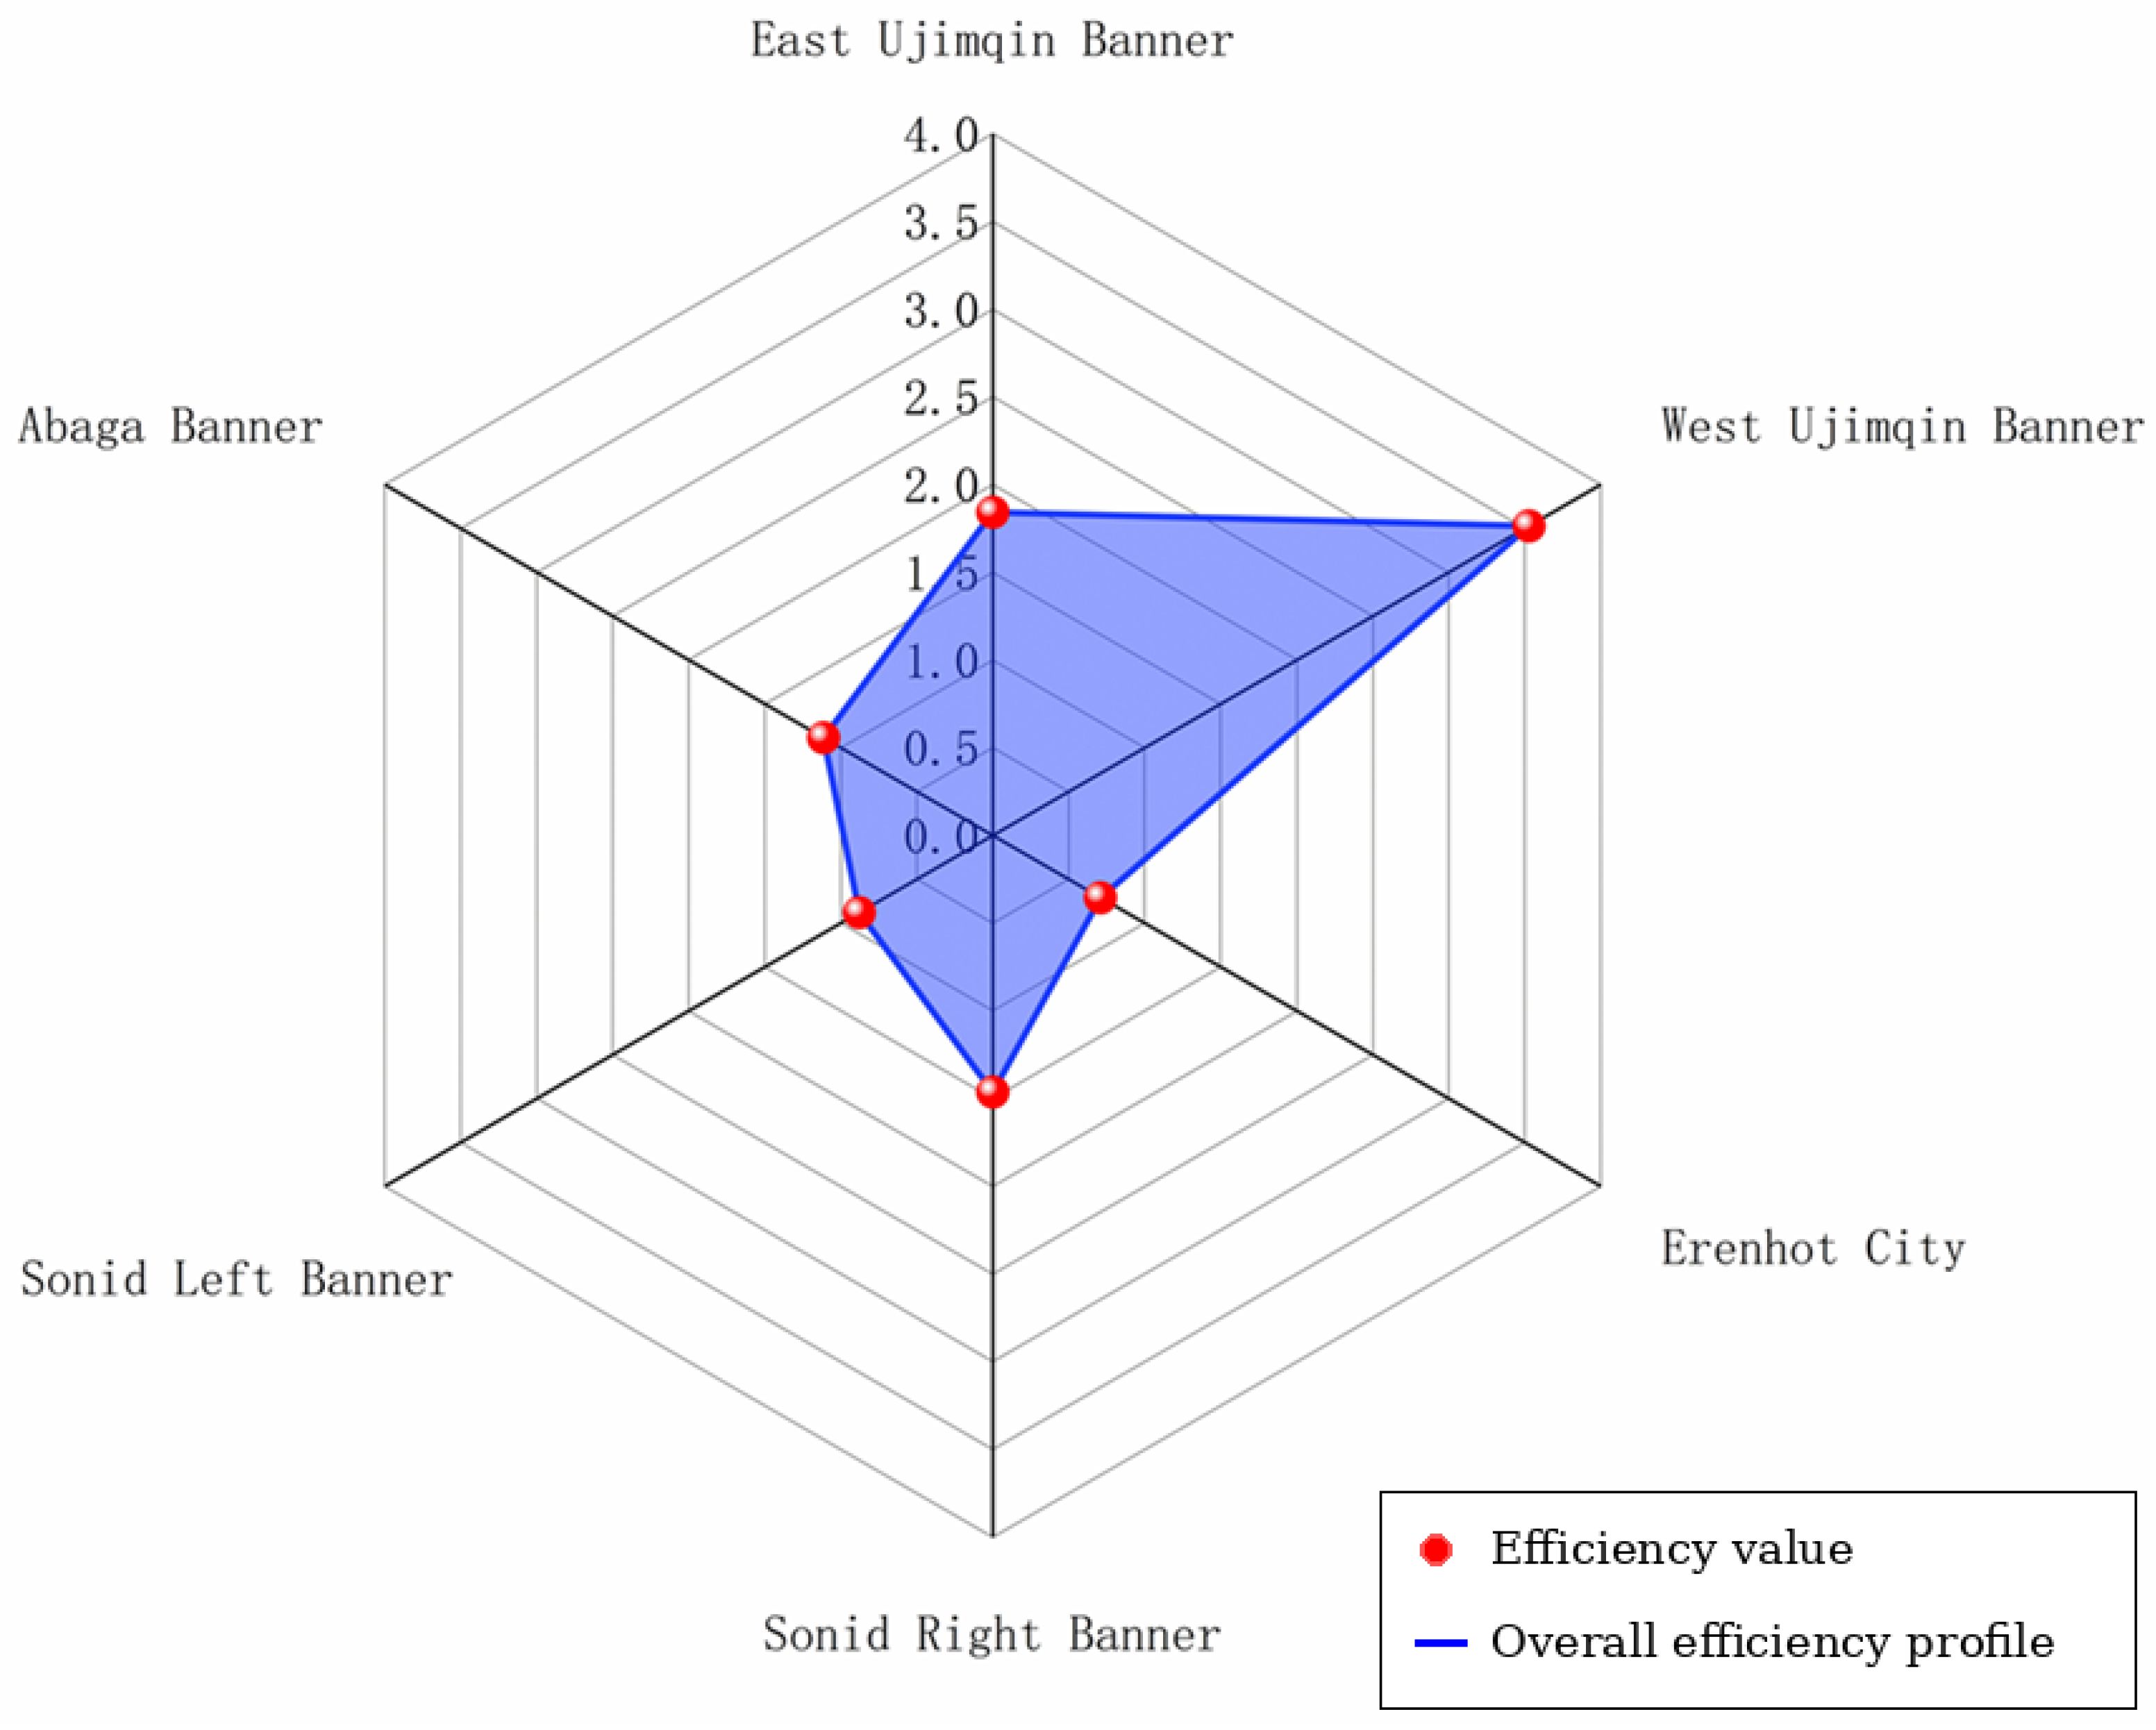
The prices of Class II industrial land are collected for DMUs including East Ujimqin, West Ujimqin, Erenhot, Sonid Right, Sonid Left, and Abag, as the establishment of the wind turbine recycling centers falls under Class II industrial land. The monthly minimum labor price and the annual decommissioning quantity of wind turbines (calculated based on the number of wind turbines in each region) serve as input data (Table 10), and the Super-Efficiency DEA analysis is implemented using MATLAB R2023a, and the final efficiency values are shown in Figure 9.
Table 10.
Input–Output Table.
Figure 9.
Alternative Site Efficiency Values.
The Super-Efficiency values of each region are ranked as shown in Table 11. The results indicate that West Ujimqin achieves the highest Super-Efficiency score (3.528), followed by East Ujimqin (1.841), Sonid Right (1.462), Abag (1.113), Sonid Left (0.879), and Erenhot (0.709). In the Super-Efficiency DEA model, values greater than 1 denote that a DMU surpasses the efficiency frontier and can be ranked, whereas values below 1 indicate relative inefficiency.
Table 11.
Ranking of Super-Efficiency Values.
4.5. Sensitivity Analysis
To evaluate the robustness of the weighting results, a sensitivity analysis was conducted by adjusting the target-layer weights. The original weights were used as the baseline scenario. In each alternative scenario, the weight of one target-layer category was increased or decreased by 10%, while the remaining weights were adjusted proportionally to keep the total weight equal to 1.
For each scenario, the weighted overlay analysis was repeated in ArcGIS, and highly suitable areas were extracted using the same reclassification criteria. The initial candidate points generated from these areas were compared before spatial infeasibility removal. The number of overlapping initial candidate points and the spatial distribution of highly suitable areas were used to evaluate the stability of the results.
As shown in Table 12, the number of initial candidate points ranged from 41 to 54 under different weighting scenarios, while the overlap rate with the baseline scenario remained between 86.96% and 100.00%. This indicates that moderate changes in the target-layer weights did not substantially affect the spatial distribution of highly suitable areas, suggesting acceptable robustness of the GIS-based suitability results.
Table 12.
Sensitivity scenarios of target-layer weights.
4.6. Discussion
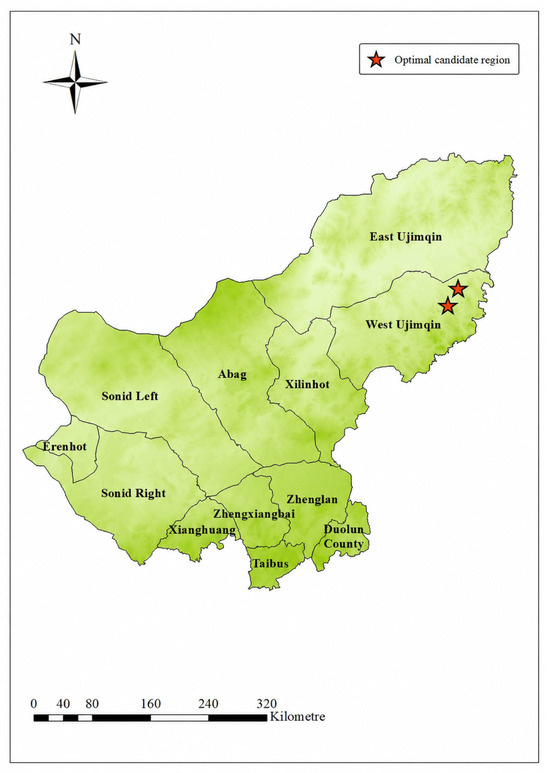
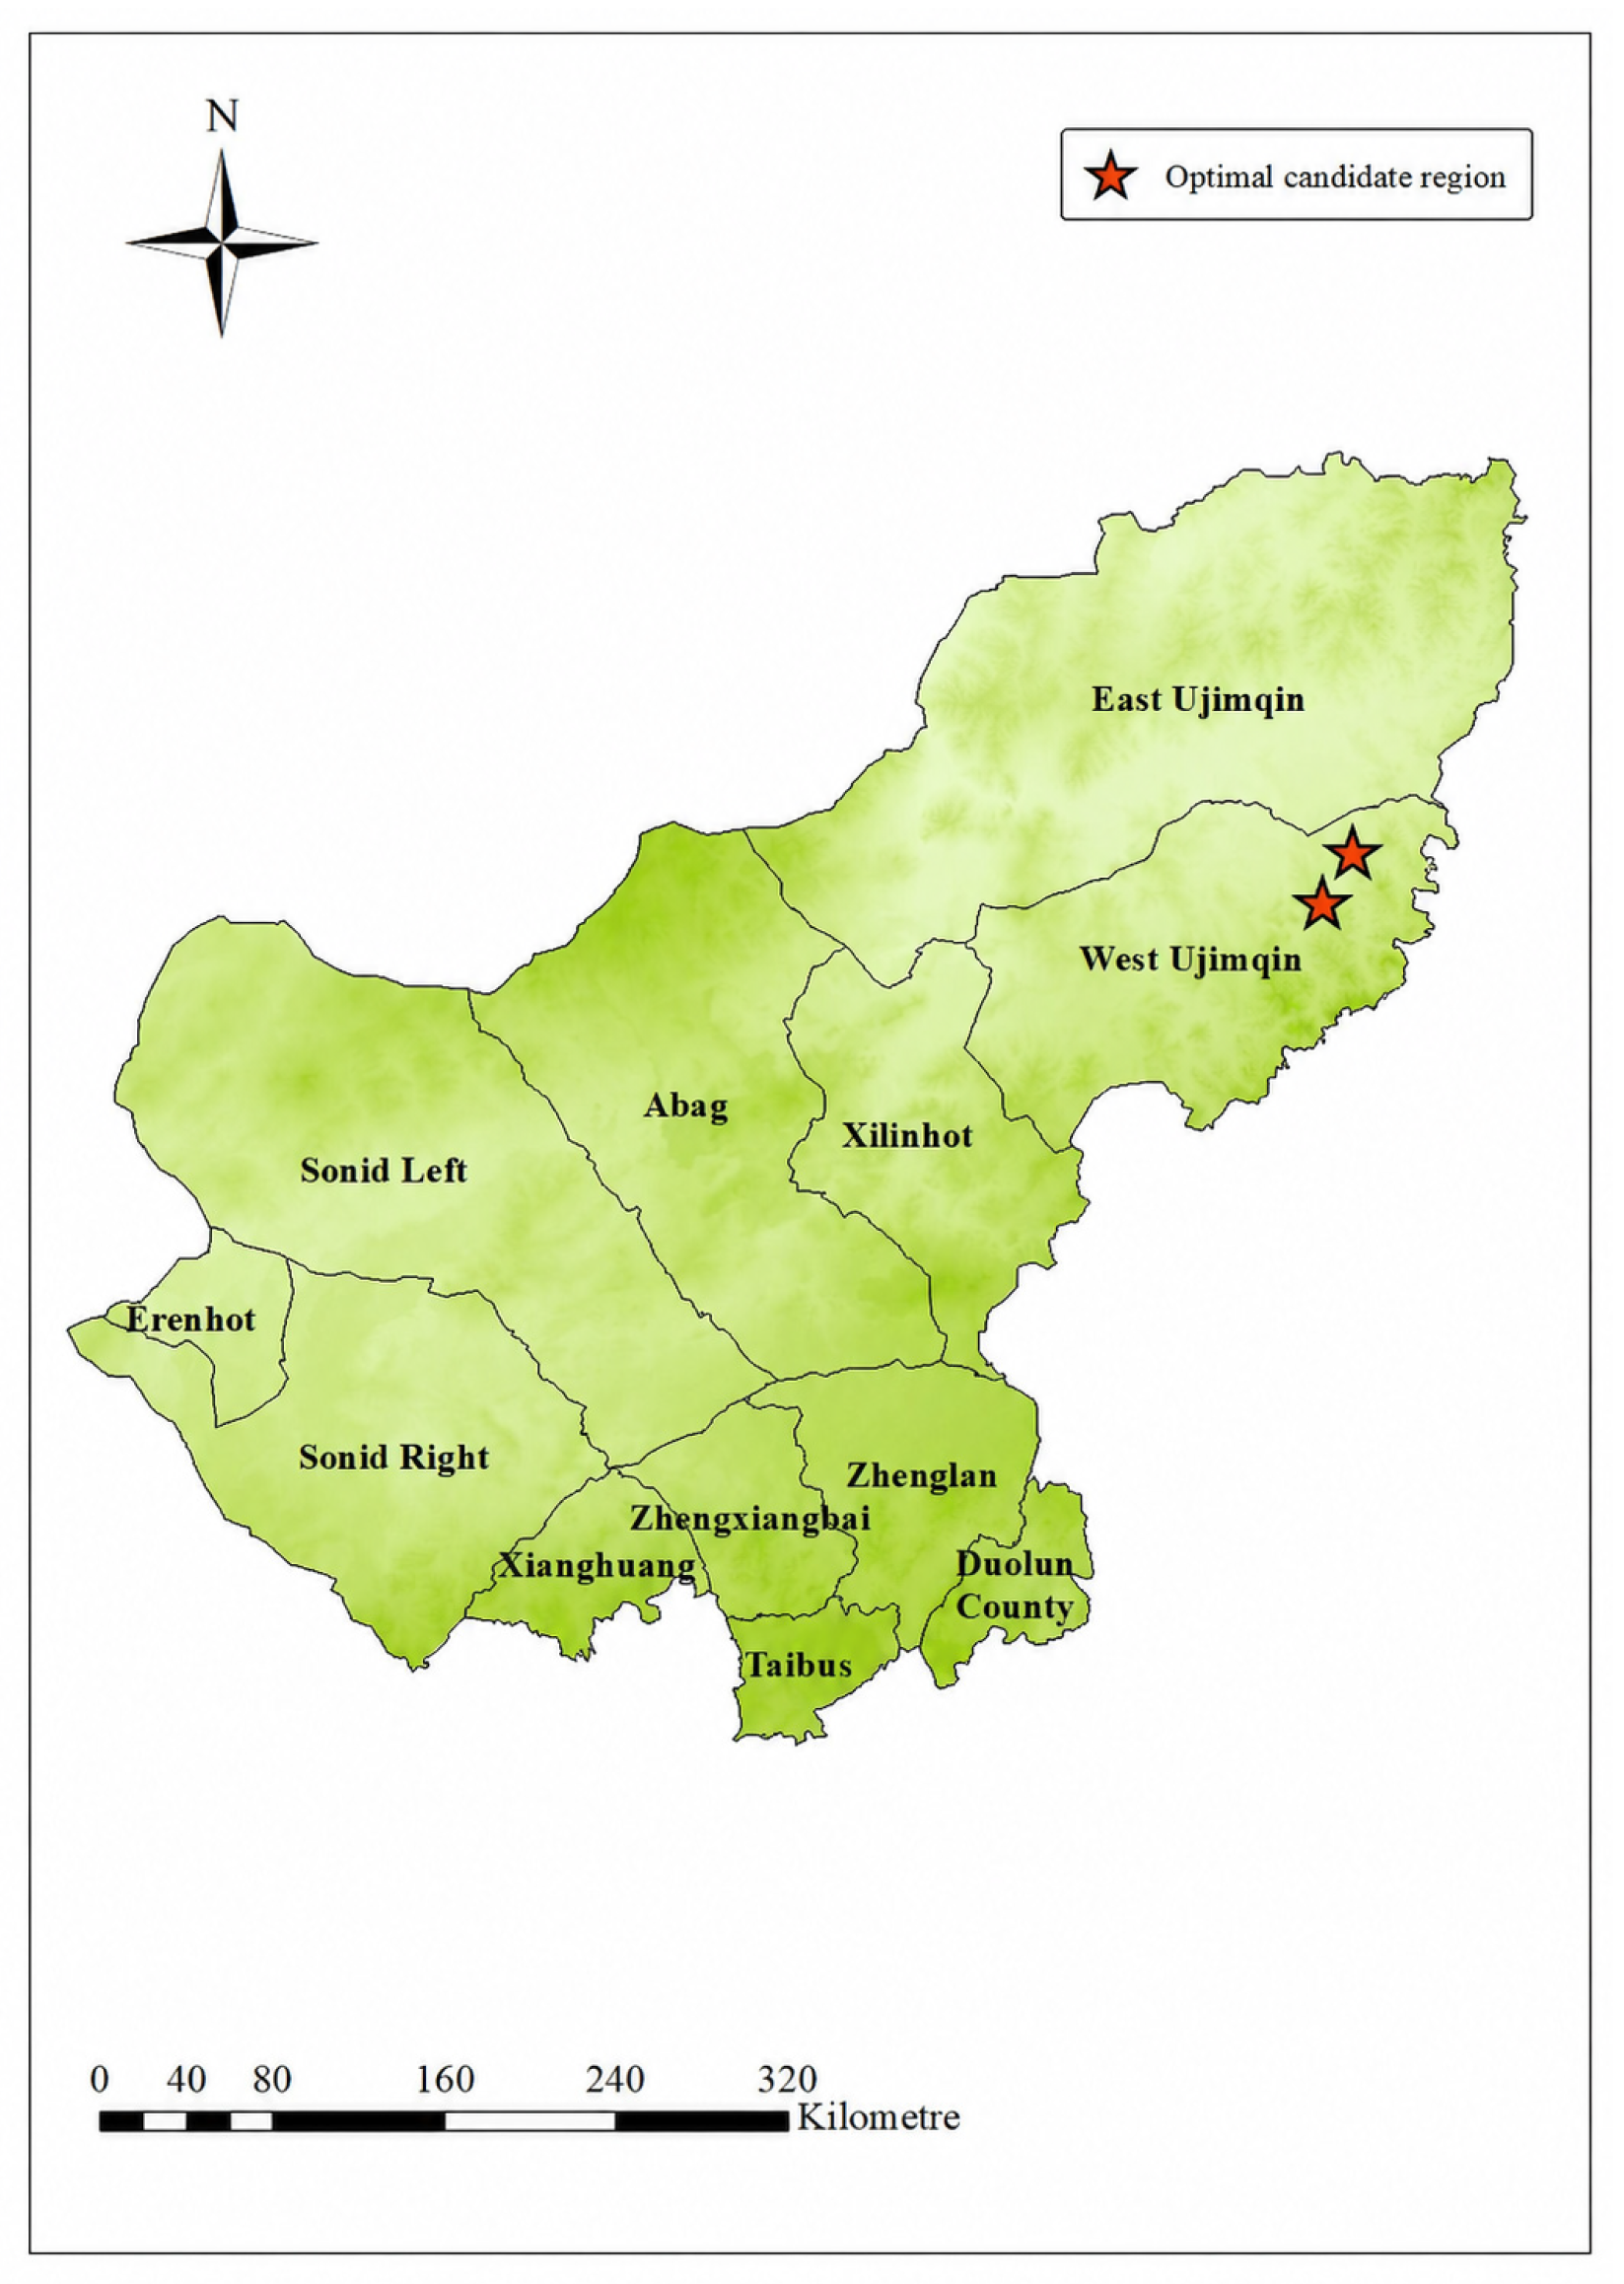
In the previous section, the efficiency ranking of each region is determined using the Super-Efficiency DEA model. Among all regions, West Ujimqin achieves the highest efficiency value (3.528), indicating the greatest potential for the construction of a wind turbine recycling center. Therefore, West Ujimqin is selected as the candidate region for establishing the recycling center.
Several potential sites are identified in West Ujimqin (Figure 10), and their latitude and longitude coordinates are determined using the ArcGIS Calculate Geometry tool (Table 13). The final decision on the number of recycling centers to be constructed in this region should further consider regional policy guidelines and practical development needs.
Figure 10.
Optimal Candidate Region.
Table 13.
Candidate Sites’ Coordinates.
West Ujimqin is identified as the preferred region because it is included in the highly suitable areas extracted through GIS screening and obtains the highest Super-Efficiency DEA value among the candidate regions. The weighting results show that natural factors receive the highest target-layer weight, followed by location factors and social factors. At the indicator layer, elevation, slope, distance from road, distance from wind farm, and land price receive relatively high weights within their respective categories. This indicates that the final result is consistent with the spatial suitability logic of the weighting process and is further supported by the DEA efficiency ranking. The government can select one of the two candidate sites within West Ujimqin as the construction location based on local conditions (Table 13).
5. Conclusions
This study proposed an integrated site-selection method for wind turbine recycling centers by combining GIS-based spatial suitability analysis, AHP–CRITIC weighting, and Super-Efficiency DEA.
(1) In the initial GIS-based site selection stage, a hierarchical indicator system was constructed using natural factors, location factors, and social factors. Euclidean distance analysis, kernel density analysis, weighted overlay, reclassification, and raster conversion were then used to identify highly suitable candidate regions in Xilingol. (2) In weight calculation for weighted overlay, AHP and the CRITIC methods were applied to the target layer and indicator layer, respectively. AHP reflects expert judgment at the target-layer level, while CRITIC captures data variation and conflict at the indicator-layer level, thereby improving the objectivity of the weighting process. (3) For the candidate sites shortlisted in the initial screening, the Super-Efficiency DEA model, which addressed the limitation of traditional DEA models where efficiency was capped at one, was employed to rank their operational efficiency. From the ranking results, West Ujimqin emerges as the optimal choice, with an efficiency score of 3.528, due to its favorable input–output efficiency under the Super-Efficiency DEA model.
Furthermore, to facilitate the practical implementation of wind turbine recycling centers, the study accurately obtained the coordinate information of the optimal site by using the Calculate Geometry tool in GIS. This provided a clear geographical reference for subsequent engineering planning and construction. Theoretically, this study constructed a multi-method integrated scientific site selection system, offering a methodological paradigm for similar infrastructure site selection research. Practically, the model effectively filled the gap in site selection critical infrastructure within decommissioned wind turbine recycling networks, providing solid support for future wind turbine recycling.
Although this study provides a systematic framework for wind turbine recycling center site selection, it does not fully consider the temporal dynamics of decommissioning volumes. Future research will incorporate time-series prediction for dynamic planning and offer policy recommendations for sustainable recycling development.
Author Contributions
Ruian Zhao: Conception and design, Methodology, Analysis and Interpretation of the data, Writing—original draft, Visualization. Jianwei Ren: Supervision, Validation, Funding acquisition, Revising content and editing. Xinyu Xiang: Investigation, Validation, Revising content and editing. Yu Du: Software, Editing. Yuan Zhou: Revising content and editing. All authors have read and agreed to the published version of the manuscript.
Funding
This work was supported by the National Natural Science Foundation of China under Grant [72262024], the Natural Science Foundation of Inner Mongolia Autonomous Region of China under Grant [2025MS07030], and the Inner Mongolia Autonomous Region Graduate Research Innovation Project under Grant [KC2025011S].
Institutional Review Board Statement
Not applicable.
Informed Consent Statement
Informed consent was obtained from all experts involved in the study.
Data Availability Statement
The data that support the findings of this study are available from the corresponding author, J.W. Ren, upon reasonable request.
Acknowledgments
The authors sincerely thank the Academic Editor and anonymous reviewers for their constructive comments and suggestions, which helped improve the quality of this manuscript.
Conflicts of Interest
The authors declare no conflicts of interest.
Appendix A
Figure A1.
Normalized maps of indicators. Note: Values range from 0 to 1, with higher values indicating higher suitability.
References
- Doukas, H.; Arsenopoulos, A.; Lazoglou, M.; Nikas, A.; Flamos, A. Wind repowering: Unveiling a hidden asset. Renew. Sustain. Energy Rev. 2022, 162, 112457. [Google Scholar] [CrossRef] [Scilit]
- Leite, G.N.P.; Weschenfelder, F.; Farias, J.G.; Ahmad, K. Economic and sensitivity analysis on wind farm end-of-life strategies. Renew. Sustain. Energy Rev. 2022, 160, 112402. [Google Scholar]
- Beauson, J.; Laurent, A.; Rudolph, D.P.; Jensen, J.P. The complex end-of-life of wind turbine blades: A review of the European context. Renew. Sustain. Energy Rev. 2022, 155, 111847. [Google Scholar] [CrossRef] [Scilit]
- Shen, Y.; Apraku, S.E.; Zhu, Y. Recycling and recovery of fiber-reinforced polymer composites for end-of-life wind turbine blade management. Green Chem. 2023, 25, 9644–9658. [Google Scholar] [CrossRef] [Scilit]
- Jaeger, A.; Miao, Z.C.; Weyand, S. Recovering rare-earth magnets from wind turbines: A potential analysis for Germany. Energies 2025, 18, 2436. [Google Scholar] [CrossRef] [Scilit]
- Alcaraz, L.; Rodríguez-Largo, O.; Barquero-Carmona, G.; Berja, A.; Quesada, A.; López, F.A. Recovery of rare earths from end-of-life NdFeB permanent magnets from wind turbines. ChemSusChem 2025, 18, e202402237. [Google Scholar] [PubMed]
- Jasinska, D.; Dutkiewicz, M. Waste management of wind turbine blades: A review of recycling methods and applications in cementitious composites. Sustainability 2025, 17, 805. [Google Scholar] [CrossRef] [Scilit]
- Kramer, K.J.; Abrahamsen, A.B.; Beauson, J.; Hansen, U.E.; Clausen, N.E.; Velenturf, A.P.; Schmidt, M. Quantifying circular economy pathways of decommissioned onshore wind turbines: The case of Denmark and Germany. Sustain. Prod. Consum. 2024, 49, 179–192. [Google Scholar] [CrossRef] [Scilit]
- Tyurkay, A.; Kirkelund, G.M.; Macas Lima, A.T. State-of-the-art circular economy practices for end-of-life wind turbine blades for use in the construction industry. Sustain. Prod. Consum. 2024, 47, 17–36. [Google Scholar]
- Sproul, E.G.; Khalifa, S.A.; Ennis, B.L. Environmental and economic assessment of wind turbine blade recycling approaches. ACS Sustain. Resour. Manag. 2024, 2, 39–49. [Google Scholar] [CrossRef] [Scilit] [PubMed]
- Zhang, Y.; Van Caneghem, J.; Pontikes, Y.; Granata, G.; Lessard, L.; Van Vuure, A.W. Environmental and economic assessment of mechanical recycling of end-of-life wind turbine blades into rebars and comparison with conventional disposal routes. Compos. Part A Appl. Sci. Manuf. 2025, 190, 108711. [Google Scholar]
- Rani, M.; Choudhary, P.; Zafar, S. A review on recycling and reuse methods for carbon fiber/glass fiber composites waste from wind turbine blades. Compos. Part B Eng. 2021, 215, 108768. [Google Scholar] [CrossRef] [Scilit]
- Du, C.B.; Jin, G.; Cheng, Y. Zero-waste recycling of fiber/epoxy from scrap wind turbine blades for effective resource utilization. Polymers 2022, 14, 5408. [Google Scholar] [PubMed]
- Mumtaz, H.; Sobek, S.; Werle, S. An experimental investigation and process optimization of the oxidative liquefaction process as the recycling method of the end-of-life wind turbine blades. Renew. Energy 2023, 211, 269–278. [Google Scholar]
- Khalid, M.Y.; Arif, Z.U.; Hossain, M.; Umer, R. Recycling of wind turbine blades through modern recycling technologies: A road to zero waste. Renew. Energy Focus 2023, 44, 373–389. [Google Scholar] [CrossRef] [Scilit]
- Hu, Y.; Zhang, Y.; Li, Y.; Wang, Y.; Li, G.; Liu, X. Wind turbine blade recycling: A review of the recovery and high-value utilization of decommissioned wind turbine blades. Resour. Conserv. Recycl. 2024, 210, 107813. [Google Scholar] [CrossRef] [Scilit]
- Bledzki, A.; Urbaniak, M.; Köhler, M. Reusing and recycling of composite wind turbine blades. A review of current practices and prospects. Part 3. Various proposals offered by small and middle companies. Przem. Chem. 2024, 103, 241–250. [Google Scholar]
- Cheng, L.; Chen, R.; Yang, J.; Chen, X.; Yan, X.; Gu, J.; Liu, Z.; Yuan, H.; Chen, Y. Mechanisms, technical optimization, and perspectives in the recycling and reprocessing of waste wind turbine blades: A review. Renew. Sustain. Energy Rev. 2025, 218, 115834. [Google Scholar] [CrossRef] [Scilit]
- Hao, C.; Zhao, B.; Guo, X.; Zhang, S.; Fei, M.; Shao, L.; Liu, W.; Cao, Y.; Liu, T.; Zhang, J. Mild chemical recycling of waste wind turbine blade for direct reuse in production of thermoplastic composites with enhanced performance. Resour. Conserv. Recycl. 2025, 215, 108159. [Google Scholar] [CrossRef] [Scilit]
- Mao, K.; Liu, Q.; Yu, T.; Zhang, S.; Tan, Z.; Zhang, G.; Shi, F.; Cao, P. Analytical modeling of tensile and flexural performance of concrete reinforced with recycled FRP-fiber from wind turbine blades. J. Build. Eng. 2025, 99, 111651. [Google Scholar]
- Zhao, Y.; Wang, M.; Lin, J.; Liu, W.; Chen, L.; Wang, Z.; Sun, B.; Li, X. Exploring recycling strategies for retired wind turbine blades: The impact of policy subsidies and technological investments using a game-theoretic approach. J. Clean. Prod. 2025, 490, 144628. [Google Scholar] [CrossRef] [Scilit]
- Delaney, E.L.; McKinley, J.M.; Megarry, W.; Graham, C.; Leahy, P.G.; Bank, L.C.; Gentry, R.C. An integrated geospatial approach for repurposing wind turbine blades. Resour. Conserv. Recycl. 2021, 170, 105601. [Google Scholar] [CrossRef] [Scilit]
- Rentizelas, A.; Trivyza, N.; Oswald, S.; Siegl, S. Reverse supply network design for circular economy pathways of wind turbine blades in Europe. Int. J. Prod. Res. 2022, 60, 1795–1814. [Google Scholar]
- Liu, P.; Meng, F.; Barlow, C.Y. Wind turbine blade end-of-life options: An economic comparison. Resour. Conserv. Recycl. 2022, 180, 106202. [Google Scholar] [CrossRef] [Scilit]
- Trivyza, N.L.; Tuni, A.; Rentizelas, A. Towards circularity in the wind industry: Optimal reverse supply network design under various policy scenarios. Waste Manag. 2025, 191, 294–307. [Google Scholar] [PubMed]
- Al-Abadi, A.M.; Handhal, A.M.; Abdulhasan, M.A.; Ali, W.L.; Hassan, J.J.; Al Aboodi, A.H. Optimal site selection of large photovoltaic solar farms at Basrah governorate, Southern Iraq using hybrid GIS-based Entropy-TOPSIS and AHP-TOPSIS models. Renew. Energy 2025, 241, 122308. [Google Scholar]
- Placide, G.; Lollchund, M.R. Wind farm site selection using GIS-based mathematical modeling and fuzzy logic tools: A case study of Burundi. Front. Energy Res. 2024, 12, 1353388. [Google Scholar]
- Aghad, M.; Manaouch, M.; Sadiki, M.; Pham, Q.B.; Al Karkouri, J. Integrating fuzzy-AHP and GIS for solid waste disposal site selection in Kenitra province, NW Morocco. Environ. Monit. Assess. 2024, 196, 537. [Google Scholar] [CrossRef] [Scilit] [PubMed]
- Hosseinzadeh, F.; Momeni, A.; Bagheri, R. Site selection for municipal solid waste landfill in coastal area by combining GIS-AHP methods: A case study in east of Mazandaran Province, Iran. Iran. J. Sci. Technol. Trans. Civ. Eng. 2024, 48, 511–524. [Google Scholar]
- Jonuzi, E.; Alkan, T.; Durduran, S.S.; Selvi, H.Z. Using GIS-supported MCDA method for appropriate site selection of parking lots: The case study of the city of Tetovo, North Macedonia. Int. J. Eng. Geosci. 2024, 9, 86–98. [Google Scholar] [CrossRef] [Scilit]
- Umoh, K.; Hasan, A.; Kenjegaliev, A. Combined AHP-GIS methodology for floating offshore wind site selection in South Africa. Ocean Eng. 2025, 317, 120037. [Google Scholar]
- Shi, F.; Li, X.; Li, M.; Bai, B. Site selection strategy for photovoltaic power plants construction on gangue hills: An integrated method based on GIS and AHP-TOPSIS. Energy Strategy Rev. 2025, 59, 101722. [Google Scholar] [CrossRef] [Scilit]
- Sahin, G.; Koç, A.; van Sark, W. Multi-criteria decision making for solar power-wind power plant site selection using a GIS-intuitionistic fuzzy-based approach with an application in the Netherlands. Energy Strategy Rev. 2024, 51, 101307. [Google Scholar]
- Zarrin, M.; Brunner, J.O. Analyzing the accuracy of variable returns to scale data envelopment analysis models. Eur. J. Oper. Res. 2023, 308, 1286–1301. [Google Scholar]
- Wang, Z.; Zelenyuk, V. Data envelopment analysis: From foundations to modern advancements. Found. Trends Econom. 2024, 13, 170–282. [Google Scholar] [CrossRef] [Scilit]
- Arunyanart, S. Performance evaluation of facility locations using integrated DEA-based techniques. Heliyon 2024, 10, e32430. [Google Scholar] [CrossRef] [Scilit] [PubMed]
- Pambudi, G.; Nananukul, N. A hierarchical fuzzy data envelopment analysis for wind turbine site selection in Indonesia. Energy Rep. 2019, 5, 1041–1047. [Google Scholar] [CrossRef] [Scilit]
- Wang, C.-N.; Dang, T.-T.; Nguyen, N.A.-T.; Wang, J.-W. A combined DEA and grey-based MCDM for solar PV power plant site selection: A case study in Vietnam. Energy Rep. 2022, 8, 1124–1142. [Google Scholar]
- Saraji, M.K.; Streimikiene, D.; Suresh, V. A novel two-stage multicriteria decision-making approach for selecting solar farm sites: A case study. J. Clean. Prod. 2024, 444, 141198. [Google Scholar]
- Shafii, M.A.; Fitriyani, D.; Muldarisnur, M.; Nugraha, R.; Chairulloh, A.; Abdullah, A.G.; Mahmudah, R.S.N. Integration of multiple decision-making methods with GIS for nuclear power plants site selection in Bangka Belitung, Indonesia. Ain Shams Eng. J. 2025, 16, 103487. [Google Scholar]
- Wang, C.-N.; Chung, Y.-C.; Wibowo, F.D.; Dang, T.-T.; Nguyen, N.A.-T. The planning of best site selection for wind energy in Indonesia: A synergistic approach using DEA and fuzzy MCDM. Energies 2025, 18, 4176. [Google Scholar]
- Raad, N.G.; Rajendran, S. A hybrid robust SBM-DEA, multiple regression, and MCDM-GIS model for airport site selection: Case study of Sistan and Baluchestan Province, Iran. Transp. Eng. 2024, 16, 100235. [Google Scholar]
- Wang, J.; Wen, J.; Pajić, V.; Andrejić, M. Optimizing cross-dock terminal location selection: A multi-step approach based on CI-DEA–IDOCRIW–MABAC for enhanced supply chain efficiency: A case study. Mathematics 2024, 12, 736. [Google Scholar] [PubMed]
- Memari, P.; Mohammadi, S.S.; Jolai, F.; Ghaderi, S.F. Sustainability assessment of renewable energy site location using a combinatorial decision-making model under uncertainty and data reliability. Int. J. Syst. Sci. Oper. Logist. 2023, 10, 2121624. [Google Scholar]
- Karuppiah, K.; Sankaranarayanan, B.; Ali, S.M.; Marimuthu, U. Integrated approach for offshore wind turbine site selection: Implications for sustainability in power supply chain. Energies 2024, 17, 3419. [Google Scholar] [CrossRef] [Scilit]
- Wang, C.-N.; Chao, T.-L. Evaluating Taiwan’s geothermal sites: A bounded rationality DEA approach. Mathematics 2024, 12, 2477. [Google Scholar] [PubMed]
- Wang, C.-N.; Nguyen, H.K.; Nhieu, N.L.; Hsu, H.P. A prospect theory extension of DEA model for wave-wind energy site selection in New Zealand. Manag. Decis. Econ. 2024, 45, 539–553. [Google Scholar]
- Sharma, T.; Sarin, A. Multi-criteria decision making for solar site selection in Punjab, India: An evaluation of site suitability using hybrid MCDM techniques towards the goal of sustainable energy development. Results Eng. 2025, 27, 106288. [Google Scholar] [CrossRef] [Scilit]
- Sharma, P.; Mehlawat, M.K.; Gupta, P.; Pamucar, D. Cluster-based decision making: A novel approach for handling large-scale alternatives in rooftop solar PV site selection. Artif. Intell. Rev. 2025, 58, 113. [Google Scholar]
- Saaty, T.L. A scaling method for priorities in hierarchical structures. J. Math. Psychol. 1977, 15, 234–281. [Google Scholar] [CrossRef] [Scilit]
- Diakoulaki, D.; Mavrotas, G.; Papayannakis, L. Determining objective weights in multiple criteria problems: The CRITIC method. Comput. Oper. Res. 1995, 22, 763–770. [Google Scholar] [CrossRef] [Scilit]
- Andersen, P.; Petersen, N.C. A procedure for ranking efficient units in data envelopment analysis. Manag. Sci. 1993, 39, 1261–1264. [Google Scholar] [CrossRef] [Scilit]
- Elkington, J. Partnerships from cannibals with forks: The triple bottom line of 21st century business. Environ. Qual. Manag. 1998, 8, 37–51. [Google Scholar]
- Kaur, H.; Singh, S.P. Sustainable infrastructure site selection using an integrated GIS-MCDM approach based on the triple bottom line framework. J. Clean. Prod. 2021, 297, 126567. [Google Scholar]

Disclaimer/Publisher’s Note: The statements, opinions and data contained in all publications are solely those of the individual author(s) and contributor(s) and not of MDPI and/or the editor(s). MDPI and/or the editor(s) disclaim responsibility for any injury to people or property resulting from any ideas, methods, instructions or products referred to in the content. |
© 2026 by the authors. Published by MDPI on behalf of the International Society for Photogrammetry and Remote Sensing. Licensee MDPI, Basel, Switzerland. This article is an open access article distributed under the terms and conditions of the Creative Commons Attribution (CC BY) license.