


Abstract
Multi-window map interfaces are widely used in geospatial monitoring systems and map-based analytical environments, where users must rapidly locate task-relevant information across multiple spatial displays. Designing visual cues and display conditions that effectively support visual search in such environments remains an important challenge for map interface design. This study examines how luminance contrast and highlighting influence visual search performance in multi-window map interfaces. A within-subject eye-tracking experiment was conducted using five highlighting conditions (No Highlighting as the control condition, Outer Border Highlighting, Text Highlighting, Title-Bar Highlighting, and Background Highlighting) and three luminance-contrast levels (low, medium, and high). Behavioral performance (accuracy and reaction time) and eye-movement measures (total viewing duration, fixation count, saccade count, and time to first fixation) were analyzed to evaluate how perceptual visibility and visual cue structures affect spatial information search. Results show that higher luminance contrast improved accuracy and reduced reaction time, although differences between medium and high contrast were small, suggesting that performance stabilized once a sufficient visibility threshold was reached. All highlighting conditions facilitated search relative to the control condition, with background and title-bar highlighting producing the most efficient gaze behavior and earlier target acquisition. A significant interaction between luminance contrast and highlighting was also observed, indicating that structured highlighting mitigates the performance costs associated with low contrast. Eye-movement evidence further indicates that region-based cues guide attention at the level of spatial interface regions rather than simply increasing local salience. These findings provide empirical guidance for improving spatial information retrieval efficiency in multi-window geospatial interfaces.
1. Introduction
Multi-window map interfaces are widely used in geospatial monitoring systems, urban digital-twin dashboards, and command-and-control platforms where spatial information must be monitored across multiple map windows. Efficient detection of task-relevant information in such environments remains a critical challenge for map interface design. In many geospatial monitoring and analysis interfaces, users first identify a spatial location on a central map and subsequently retrieve related information from surrounding interface panels, requiring coordinated visual search across distributed windows. Operators must maintain situational awareness while selecting task-relevant information from multiple spatially distributed sources, requiring continuous coordination between perceptual visibility and attentional control. To address these demands, interface designers have developed a range of visual-guidance strategies intended to improve target detection and reduce unnecessary search across distributed map windows. Two widely applied design factors in this regard are highlighting and luminance contrast, both of which have been shown to strongly influence visual search performance in complex displays [1,2,3]. Recent research in geospatial interface design has also explored multimodal cueing strategies to support information localization across distributed map windows, such as spatialized auditory cues that facilitate cross-window attention guidance [4].
Compared with a single full-screen display presented on the same physical monitor, the defining characteristic of a multi-window map interface lies not in the presence of eye movements but in how visual information is spatially organized and accessed. In a single-window display, visual search is performed within a continuous and unified spatial reference frame. In contrast, multi-window interfaces fragment the visual field into multiple bounded perceptual regions. This segmentation creates discrete “information islands”, requiring users to repeatedly disengage attention from one region, re-orient across windows, and re-anchor search in a new local context [5,6]. Such fragmentation increases attentional switching costs and may disrupt holistic spatial representation during cross-region search [7]. The unique cognitive challenge introduced by the multi-window format lies in the need to coordinate attention across fragmented spatial regions while maintaining spatial correspondence between the central map and distributed peripheral information panels. This process requires not only cross-window attentional switching but also continuous integration of map-based spatial information with panel-based attribute information during task execution. In particular, multi-window map interfaces typically adopt a central-map-plus-side-panels layout, in which the central map provides the primary spatial reference and surrounding panels present associated attribute information, status indicators, or analytical details related to mapped targets. This structure introduces a map-specific search process: users must first identify the target location on the map and subsequently retrieve corresponding information from distributed peripheral panels. Although this map-specific, two-stage search process has not been directly examined in the existing literature, it can be reasonably derived and theoretically extended from prior research on spatial fragmentation and cross-region attentional switching in graphical user interfaces [7], as well as from studies on attentional demands and spatial correspondence requirements in spatially distributed display layouts [5]. Related work has also examined coordinated multi-view environments in geospatial interfaces. For example, Golebiowska et al used eye-tracking to evaluate how users interact with coordinated views such as maps, parallel coordinate plots, and tables [8]. Their findings highlight the importance of visual coordination across multiple panels, which is closely related to the present study’s focus on attentional guidance in multi-window geospatial environments.
Highlighting has been widely recognized as an effective means of capturing attention and facilitating information retrieval, as visual features that increase salience can guide attentional selection during search [3]. In cognitive terms, such manipulations alter the priority structure of the visual field, thereby influencing how candidate locations compete for selection during visual search. Empirical studies further demonstrate that well-designed highlighting techniques can shorten search time, reduce workload, and improve decision accuracy in applied display environments [1]. From a theoretical perspective, salient feature signals (including highlighting manipulations) can increase attentional priority within guided search accounts, biasing the competition for selection toward target locations [3,9]. Depending on its implementation, highlighting can engage different perceptual mechanisms, including: feature-based highlighting (e.g., text color or boldface), which supports rapid filtering at early visual stages [10,11]; and region-based highlighting (e.g., background or title-bar highlighting), which facilitates spatial organization and reduces uncertainty [12,13]. However, no consensus has yet emerged regarding which form of highlighting is most effective for attentional guidance, particularly in multi-window map interfaces where numerous visual elements compete for attention across spatially distributed and hierarchically organized regions. Similar effects have also been reported in educational visualization environments, where visual cues improve attention allocation and task performance [14,15]. These studies indicate that cueing effects are not limited to a single task domain, although their applicability to multi-window operational interfaces remains unclear. However, the structural and cognitive demands of multi-window operational interfaces differ substantially from those of linear instructional environments.
While highlighting represents one mechanism for directing attention, another fundamental factor influencing perceptual efficiency is luminance contrast, defined as the difference in luminance between a target and its background. Luminance contrast directly constrains visibility, discriminability, and the signal-to-noise ratio of the target [16,17]. Higher luminance contrast has been shown to enhance perceptual salience and to steepen psychometric response functions for detection and identification, thereby reducing search time and error rates [18,19]. For safety-critical displays, standards and human factors guidance consistently emphasize the need for sufficient contrast to support legibility and rapid event recognition (International Organization for Standardization [20,21,22]. Thus, luminance contrast operates primarily as a perceptual constraint on information encoding, determining whether stimuli can be efficiently processed before attentional selection mechanisms take effect.
In practical interface design, visibility constraints imposed by luminance contrast coexist with diverse highlighting styles. As illustrated in Figure 1, modern multi-window map interfaces incorporate several commonly used highlighting styles, including outer border highlighting, text highlighting, title-bar highlighting, and background highlighting, while luminance contrast often varies across windows and functional regions as part of visual design strategies. However, these approaches are not standardized, which raises important questions regarding their relative effectiveness in guiding users’ visual attention. Outer borders primarily enhance contour salience, whereas background or title-bar treatments introduce region-based segmentation and spatial framing, consistent with principles of perceptual grouping and common-region organization [2,12,13]. Text highlighting, in contrast, modifies intrinsic target features such as letterform contrast or weight, thereby strengthening feature-based selection mechanisms [9,10,23]. These stylistic differences are likely to produce distinct attentional consequences [11,24]. Because these techniques operate through different perceptual pathways—feature enhancement, spatial grouping, and boundary segmentation—they may shape attention in fundamentally different ways.
Figure 1.
Representative examples of the multi-window map interface and typical highlighting styles. (a) Examples of the multi-window map interface with title-bar highlighting (red box for illustration only), (b) Outer Border Highlighting, (c) Text Highlighting, (d) Title-Bar Highlighting, and (e) Window Background Highlighting.
Accordingly, the present study focuses on two complementary design dimensions that directly correspond to these cognitive demands: luminance contrast and highlighting style. In addition, the four highlighting styles examined in this study were selected based on a preliminary review and comparative analysis of real-world interface design cases in map dashboards, monitoring systems, and command-and-control displays to ensure ecological relevance and practical representativeness. Consequently, it remains unclear how perceptual constraints and attentional cueing jointly shape the allocation of visual processing during search, particularly in multi-window environments where multiple sources compete simultaneously for selection. Despite their widespread use, there is limited systematic evidence regarding how different highlighting styles compare in search efficiency or how their effects interact with luminance contrast in multi-window map interfaces. Prior research has often examined single visual-emphasis variables in isolation, such as typographic contrast in word recognition tasks [23], region-based highlighting effects in controlled visual selection paradigms [13], or display enhancement techniques evaluated as standalone design interventions [25]. Such studies are typically conducted in controlled or simplified environments, consistent with the analytic approach commonly adopted in applied attention research [2]. However, this reductionist tradition provides limited insight into how multiple emphasis strategies interact with fundamental visibility factors like luminance contrast in realistic multi-window map interfaces, where these design dimensions coexist and jointly shape visual search behavior. As a result, the combined effects of highlighting style and luminance contrast remain insufficiently understood in applied interface contexts.
This limitation underscores the need for systematic investigations that directly compare multiple highlighting styles under varying luminance conditions to derive evidence-based implications for critical monitoring environments. To address this need, the present study systematically compares five experimental conditions, including No Highlighting (control condition), Outer Border Highlighting, Text Highlighting, Title-Bar Highlighting, and Background Highlighting—crossed with three luminance-contrast levels (low, medium, and high) in a within-subjects eye-tracking experiment. Behavioral performance (accuracy and reaction time) was analyzed alongside eye-movement measures (total viewing duration, total fixation count, saccade count and time to first fixation) to characterize attentional guidance and visual efficiency at both outcome and process levels. This design enables a systematic evaluation of how visual emphasis strategies support spatial information search in multi-window geospatial interfaces.
2. Theoretical Background and Literature Review
2.1. Highlighting and Attentional Guidance
Highlighting has long been recognized as an effective visual enhancement technique for directing attention and facilitating information retrieval [25]. Within the Guided Search model [3,9], highlighting introduces externally provided priority cues that bias visual selection toward task-relevant regions. Empirical research has shown that highlighting can improve detection accuracy, reduce workload, and accelerate decision-making in complex visual environments [26]. Recent interface-level studies further confirm that visual highlighting continues to guide gaze allocation even under multitasking and cognitive-load conditions, demonstrating measurable differences in predicted attentional salience within complex visual layouts [27].
Depending on its implementation, different highlighting styles may engage distinct perceptual mechanisms that modulate attentional allocation. For example, text-based highlighting (e.g., changes in text color, font weight, or luminance) usually operates at the feature-processing level and enhances local salience during early visual filtering [10,11]. This type of highlighting strengthens figure–ground contrast and accelerates label or word recognition, particularly under conditions of high information density [23]. Region-based highlighting (e.g., background shading or title-bar emphasis) facilitates perceptual grouping and spatial organization through common-region and area-based segregation principles [12,13]. Subtle background tinting or luminance overlays help delineate functional boundaries, reduce spatial uncertainty, and improve target detectability [1]. Contemporary CHI research likewise shows that visual saliency varies systematically across interface types, suggesting that interface-driven visual emphasis may influence attention distribution [28]. Border-based highlighting (e.g., outer borders, contour lines, or enclosure boxes) provides clear spatial framing around the target area. It channels visual attention toward relevant windows or panes while minimizing unnecessary scanning, thereby reducing search latency [1]. Panel-based highlighting (e.g., emphasis on title bars or entire window headers) operates at a higher structural level of the interface. It reinforces perceptual segregation among panes and supports context-based cueing in multi-window environments [29]. Overall, these highlighting styles reflect distinct visual strategies that influence salience, grouping, and spatial guidance. Their graphical composition, including effective area, luminance bandwidth, and spatial extent, may interact with luminance contrast through area-ratio mechanisms, thereby shaping visual search efficiency and attentional dynamics in multi-window map interfaces. The extent of these differences, however, has not been systematically examined in multi-window interface contexts.
2.2. Luminance Contrast and Perceptual Salience
Luminance contrast, defined as the brightness difference between a target and its surrounding background, is a fundamental determinant of visibility, discriminability, and legibility [16,17]. Previous research has demonstrated that increasing luminance contrast enhances perceptual salience and improves visual detectability [18,19,30]. Neurophysiological evidence further suggests that visual cortical responses scale with stimulus contrast, with higher contrast increasing early sensory response strength within the visual processing hierarchy [31]. These perceptual mechanisms provide the functional basis upon which contrast operates in applied display and interface environments. Rather than implying a single optimal value, the application of luminance contrast in real display environments involves context-dependent trade-offs. Recent studies indicate that higher luminance contrast can improve visual performance by enhancing effective signal visibility and perceptual sensitivity under real display conditions, thereby supporting more reliable target detection [32,33]. At the same time, ergonomics research has demonstrated that excessively strong luminance differences or sharp contrast gradients may introduce discomfort, glare, or visual fatigue in visually dense task environments [34,35]. These findings together support a bounded-optimal interpretation in which luminance contrast should be sufficiently high to enhance perceptual salience, yet not extreme enough to cause visual fatigue or distractive dominance. Importantly, prior studies have typically examined contrast as an independent display parameter, optimizing brightness or contrast settings in isolation [36,37]. In complex multi-window map interfaces, however, contrast variations coexist with multiple forms of highlighting, creating conditions in which perceptual visibility and attentional cueing may interact rather than operate separately. How different luminance-contrast levels modulate the effectiveness of specific highlighting styles during visual search therefore remains insufficiently understood.
2.3. Interaction Mechanisms and Eye-Tracking Evidence
Although highlighting and luminance contrast both influence visual attention, their joint effects may not be strictly additive but may operate through partially different attentional mechanisms. Luminance contrast primarily modulates bottom-up perceptual salience by increasing the physical discriminability of a target, whereas highlighting introduces task-relevant cues that bias selection in a more goal-directed manner [24]. Because these mechanisms influence different aspects of visual selection and guidance, their interaction may either reinforce or compete with one another depending on spatial layout and task demands. Empirical work has begun to report combined effects of visual variables such as color, contrast, and figure–ground relationships on search efficiency [38]. Prior human-factors research has examined visual highlighting as an attentional cue and luminance contrast as a determinant of display visibility, but these factors have typically been investigated as separate design dimensions rather than as interacting components within interface search tasks [25,39]. Consequently, existing findings provide limited insight into how these factors function when embedded in multi-window layouts where functional grouping, hierarchy, and window segmentation simultaneously shape visual search. A key limitation of prior research is that performance outcomes, such as reaction time or accuracy, cannot reveal how attention is distributed during search. Similar behavioral improvements may arise from distinct processes, including faster perceptual encoding, more efficient guidance of gaze, or reduced exploratory scanning. Distinguishing among these possibilities therefore requires process-level evidence capable of capturing how attention unfolds during search. Eye-tracking provides such evidence by directly recording fixation locations, dwell time, and scan paths as observers interact with visual displays [40,41]. In interface and visualization research, eye-tracking metrics such as total fixation count, total viewing duration, and scan-path structure are widely used to evaluate layout efficiency, information discoverability, and user attention distribution across functional regions [42,43].
In the present study, total viewing duration (TVD), total fixation count (TFC), and saccade count (SC) were selected as complementary process-level indicators of visual search efficiency. Specifically, TVD was used to capture the temporal investment and sustained attentional allocation devoted to task-relevant interface regions, TFC was used to reflect the frequency of attentional sampling and fixation events, and SC was used to characterize the dynamic structure and transition intensity of scan paths across functional windows. These measures were intentionally retained as complementary rather than reducible to a single unified metric, as each reflects a distinct dimension of attentional processing during multi-window search. In addition, other eye-tracking metrics, such as pupil diameter, were not included as primary measures in the present study because luminance contrast was one of the main experimental variables. Given that pupil size is highly sensitive to luminance changes, including these measures could introduce physiological responses directly driven by the visual manipulation itself and therefore reduce the interpretability of attentional effects under investigation [44,45].
These measures enable researchers to assess how specific interface design strategies influence the spatial organization of visual search rather than merely its overall speed or accuracy. Fixation duration reflects the cognitive effort required to interpret interface elements, whereas saccade patterns reveal how users navigate between functional regions during goal-directed search [40]. Visualization techniques such as heatmaps further illustrate the spatial distribution of attention, with warmer colors indicating denser attentional allocation [46]. By linking behavioral outcomes with these process-level indicators, eye-tracking enables a more precise examination of how luminance contrast and highlighting contribute to perceptual visibility, attentional guidance, and overall search organization. This capability makes eye-tracking particularly suitable for investigating the interaction between highlighting style and luminance contrast in complex multi-window map interfaces.
3. Research Objectives and Hypotheses
Building on the literature reviewed above, the present study aims to examine how perceptual visibility and attentional structuring jointly regulate visual search processing in complex multi-window environments. Prior research has demonstrated that each factor independently affects perceptual salience and task performance; however, far less is known about how they function together under realistic interface conditions where multiple visual cues coexist. Because luminance contrast primarily affects perceptual visibility while highlighting provides structured attentional guidance, their combined use may lead to facilitative or competing effects depending on how visual information is organized. To examine these relationships, this study integrates behavioral measures (accuracy and reaction time) with eye-tracking indicators that capture the spatial and temporal dynamics of visual attention during search.
Based on these considerations, the following hypotheses were formulated:
H1.
Luminance contrast will significantly affect visual search performance, with lower contrast associated with reduced efficiency relative to higher contrast levels.
H2.
Highlighting styles will differentially influence attentional guidance. Region-based highlighting (e.g., background and title-bar highlighting) is expected to facilitate earlier target acquisition and more efficient visual scanning than feature-based highlighting and the no highlight control condition.
H3.
Luminance contrast and highlighting style will interact in shaping visual search behavior, with highlighting expected to exert stronger facilitative effects under lower contrast conditions.
4. Materials and Methods
4.1. Participants
Thirty-five university students (16 males, 19 females; aged 18–26 years, M = 21.4) participated in the study. All reported normal or corrected-to-normal vision and no history of color vision deficiency. Participants had no prior experience with similar visual search experiments. Participation was voluntary, and all participants provided written informed consent prior to participation. Participants could withdraw at any time. All data were anonymized before analysis. The study was conducted in accordance with the ethical guidelines of the institution. Participants received monetary compensation of 40–50 CNY for their participation.
4.2. Apparatus
The experiment was conducted in an eye-tracking laboratory using a standardized eye-tracking setup, as shown in Figure 2. Participants were seated approximately 60 cm from a 21.5-inch LCD monitor (HP Inc., Palo Alto, CA, USA; 1920 × 1080 pixels) positioned at eye level. To ensure precise implementation of luminance contrast manipulations, chromaticity coordinates, and luminance values of all stimulus colors were measured using a Konica Minolta CS-200 chroma meter (Konica Minolta, Tokyo, Japan). The device was calibrated prior to measurement to verify the intended luminance ratios across experimental conditions. Ambient illumination in the laboratory was maintained at approximately 300 lx to ensure stable viewing conditions across participants.
Figure 2.
Schematic representation of the visual search task in the multi-window map interface. The target window is indicated by green highlighting. The red box (for illustration only) was not part of the actual display.
Eye movements were recorded using a Tobii Pro Fusion 250 desktop eye tracker (Tobii AB, Stockholm, Sweden) with a sampling rate of 250 Hz. A standard nine-point calibration procedure was performed prior to the experiment to ensure data accuracy and stability.
Both behavioral responses and eye-movement data were collected and synchronized using ErgoLAB 3.3.5 (Kingfar Technologies, Beijing, China), which was also used for trial segmentation, area-of-interest (AOI) definition, and extraction of gaze metrics such as total viewing duration, total fixation count, and saccade count.
4.3. Experimental Design
The experiment employed a 5 × 3 within-subject design to examine how highlighting style and luminance contrast jointly influence visual search performance in multi-window map interfaces. All participants experienced every experimental condition, and trial order was randomized to minimize sequence and learning effects.
4.3.1. Highlighting Style
The first independent variable was Highlighting Style, comprising five conditions: No Highlighting (control), Outer Border Highlighting, Title-Bar Highlighting, Background Highlighting, and Text Highlighting. These styles were designed to operationalize distinct mechanisms of attentional guidance grounded in perceptual and cognitive theory. Specifically, Text Highlighting represents feature-based enhancement, consistent with models of feature-guided attention in which visual selection is influenced by local contrast, color, or typographic salience [10,11]. Outer Border Highlighting introduces boundary-based segmentation, aligning with principles of perceptual enclosure and spatial delimitation that can constrain attentional spread [12,47] but does not establish a unified spatial region. Background Highlighting establishes a continuous surface surrounding the target window, promoting common-region grouping and facilitating object-based attentional selection [12,13,48]. Title-Bar Highlighting emphasizes hierarchical window structure, providing a region-defining cue that may guide attention at the level of spatial units rather than isolated features. In addition to their theoretical grounding, similar forms of visual emphasis have been implemented in applied interface and interaction contexts, including boundary marking, background shading, structural cueing, and textual enhancement in monitoring and learning environments [49,50,51,52]. These prior implementations informed the graphical realization of the highlighting conditions used in the present study. Collectively, these manipulations span local feature enhancement, boundary-based segmentation, and spatial region definition, enabling systematic comparison of alternative attentional-guidance mechanisms within a unified multi-window context [53,54]. The five highlighting conditions are illustrated in Figure 3.
Figure 3.
Examples of the five highlighting conditions used in the experiment. From left to right: (a) No Highlighting (control), (b) Outer Border Highlighting, (c) Title-Bar Highlighting, (d) Window Background Highlighting, and (e) Text Highlighting. All examples are shown under the high-contrast condition for illustration purposes only. The color shown in the figure represents one chromatic realization of the highlighting and was used to implement luminance contrast levels.
For theoretical clarity, the five highlighting conditions were conceptually organized into three attentional categories. No Highlighting served as a baseline control condition without externally introduced visual emphasis. Text Highlighting and Outer Border Highlighting were classified as feature-based highlighting, as they enhanced local feature contrast or boundary salience without establishing a unified spatial region. In contrast, Background Highlighting and Title-Bar Highlighting were categorized as region-based highlighting, as they introduced spatially extended or structurally defined visual regions that may guide object- or region-level attentional selection. These conceptual categories were used to structure theoretical interpretation rather than to define statistical contrasts in the experimental model.
4.3.2. Luminance Contrast
The second independent variable was Luminance Contrast, with three levels defined by contrast ratios of 6:1 (low), 12:1 (medium), and 18:1 (high). This range was selected to reflect commonly recommended contrast values for visual display environments while spanning perceptually meaningful differences in visibility (International Organization for Standardization [17,20]. Prior experimental research on interface legibility and icon recognition has employed comparable contrast ranges when examining visual search efficiency and visual fatigue [38,55,56]. Following established photometric calibration procedures used in applied perception and visual search research [37,57], three foreground luminance levels (60, 120, and 180 cd/m2) were combined with a constant background luminance of 10 cd/m2. This manipulation ensured controlled variation in signal strength while maintaining consistent background conditions across all experimental stimuli.
To realize these luminance contrasts under realistic interface design conditions, chromatic color combinations were used instead of purely achromatic black–white pairings. Achromatic polarity is rarely employed in contemporary digital interfaces, particularly in monitoring dashboards and control-room systems that rely on dark-themed visual environments. Accordingly, blue and black were selected to represent two commonly used dark-interface palettes in real monitoring environments. Background color was treated as a control factor rather than an experimental variable, allowing the findings to generalize across typical dark-themed displays rather than being tied to a specific chromatic setting. The two background palettes (blue and black) were presented with equal frequency across luminance conditions.
Chromatic realizations (white, yellow, and green) were used to implement the required luminance levels and were counterbalanced across trials; color itself was not treated as an experimental factor. These color instances enabled precise photometric calibration while maintaining ecological plausibility consistent with real-world interface coding practices. Ambient illumination in the laboratory was maintained at approximately 300 lx to ensure stable viewing conditions across participants. Chromatic realizations were counterbalanced across trials so that no specific hue was systematically associated with a given luminance level. This design ensured that the manipulation targeted photometric contrast while minimizing confounding attributable to hue-specific processing differences.
The physical realization of the luminance contrast manipulation is detailed in Table 1, which reports measured CIE 1931 (x, y) coordinates, CIE L*a*b* values, and luminance for each stimulus instance.
Table 1.
Photometric properties of stimulus colors used to implement luminance-contrast conditions. Values represent measured CIE 1931 (x, y) chromaticity coordinates, CIE L*a*b* parameters, and luminance (cd/m2). L*, a*, and b* refer to the CIE L*a*b* color space, representing lightness, green–red, and blue–yellow dimensions, respectively.
4.3.3. Stimulus Combination and Spatial Assignment
The experimental stimuli were constructed by crossing five highlighting conditions, three luminance-contrast levels, two background colors, and two cue colors, yielding a total of 60 stimulus instances (5 × 3 × 2 × 2). Background color and cue color were incorporated as implementation factors to support an ecologically plausible realization of the luminance-contrast manipulation, rather than being treated as independent experimental variables. Accordingly, the highlighting styles illustrated in Figure 3 represent the graphical realization of the target window under each experimental condition within the multi-window layout shown in Figure 4. During the experimental procedure, participants were presented with the corresponding foreground–background display conditions as the actual display manifestation of the luminance contrast manipulation, while the spatial layout and task workflow remained unchanged across trials.
Figure 4.
Illustration of the foreground–background color combinations used in the experiment, comprising two background colors (black and blue) and three luminance-contrast levels (high 18:1, medium 12:1, and low 6:1). The corresponding foreground luminance values were 180, 120, and 60 cd/m2, respectively. Highlighting was manipulated separately at the target-window level and is therefore not shown. The letters shown in the windows are used as abstract stimuli for the visual search task and are included here for illustration purposes only.
In each trial, only one target window among the sixteen peripheral windows was highlighted according to the assigned experimental condition, while all non-target windows remained visually identical and unhighlighted. Target locations were assigned using a pseudo-randomization procedure across the sixteen peripheral window positions, with approximately balanced distribution across the major spatial regions to reduce positional bias and minimize anticipatory scanning strategies.
4.4. Stimuli
The stimuli consisted of simulated multi-window map interfaces developed to approximate visually dense monitoring environments commonly found in supervisory and analytical tasks. Each interface consisted of a central map panel and sixteen peripheral windows symmetrically arranged on the left and right sides. The central map panel presented the target letter to be matched, whereas the peripheral windows constituted the distributed search field. Within these windows, alphanumeric characters were presented using a uniform typographic format. This abstract symbolic stimulus design was intentionally adopted to isolate pre-semantic visual attention mechanisms while maintaining strict control over low-level visual properties such as typography, contrast, and spatial layout.
A total of 60 stimulus instances were generated to cover all highlighting × contrast combinations, and their presentation order was randomized separately for each participant to avoid repetition-driven learning effects. On each trial, a predefined target character was randomly selected from a set of alphanumeric characters and appeared in one of the peripheral windows. To ensure experimental control, interface layout, spatial configuration, typography, and information density were held constant across all trials. The visual emphasis applied to the target window varied according to the highlighting and luminance-contrast conditions defined in the experimental design. The target cue presented in the central map panel adopted the same luminance specification as the corresponding condition to maintain perceptual consistency. To prevent spatial bias in visual search, target locations were counterbalanced across the four quadrants of the interface (upper-left, lower-left, upper-right, lower-right). The target appeared with equal probability in each quadrant and on both left and right regions of the display, ensuring a spatially balanced distribution of search demands. Stimuli were created using Figma (version 116.15.15) and rendered at a fixed resolution to maintain consistent visual angles across participants.
4.5. Procedure
The experiment consisted of a practice phase (5 trials) and a formal experimental phase (60 trials). The practice phase was used to familiarize participants with the visual layout, response rules, and timing structure, and its data were not included in subsequent analyses. Each trial followed a fixed temporal sequence. First, a blank instruction screen was presented briefly to mark the beginning of the trial. This was followed by a central fixation cross displayed for 1000 ms to stabilize gaze and provide a common starting point for eye-movement recording. Immediately afterward, the stimulus interface was presented and remained on screen for up to 3000 ms. The 3000 ms response window was determined as a task-level temporal constraint intended to encompass the full sequence of target localization, cross-window comparison, decision-making, and motor response. Pilot observations indicated that response times in the most demanding condition approached approximately 2200 ms, which supported the selection of a 3000 ms upper limit to ensure sufficient response time while maintaining experimental efficiency. If no response was made within the 3000 ms response window, the trial was recorded as a timeout error, and the experiment automatically proceeded to the next trial. A target letter was initially displayed in the central map panel as a spatial search cue. Participants were then required to locate the corresponding letter in one of the sixteen peripheral windows surrounding the map. This task structure was intentionally designed to simulate a core cross-window information integration process commonly found in geospatial monitoring interfaces, in which analysts first identify a target location or cue on the central map and subsequently retrieve corresponding attribute information from surrounding panels. Participants were required to locate the matching letter in one of the sixteen windows surrounding the central map panel as quickly and accurately as possible. Participants pressed the “A” key when the target appeared in a window on the left side and the “L” key when it appeared on the right side, providing a consistent spatial-response mapping. Highlighting style and luminance-contrast conditions were fully randomized within participants. The ordering of trials differed for each participant to minimize sequence and learning effects. Short rest opportunities were provided between blocks when needed to reduce visual fatigue. The entire session, including calibration, practice, and formal trials, lasted approximately 20 min. The sequence of events within a trial is illustrated in Figure 5.
Figure 5.
Experimental procedure illustrating the sequential steps within a visual search trial. The fixation cross (“+”) indicates the central fixation phase, allowing participants to stabilize their gaze before stimulus presentation. The letters represent abstract stimuli used in the visual search task. The target window is indicated by highlighting. The red box (for illustration only) was not part of the actual display.
5. Results
5.1. Data Preparation and Modeling Approach
Behavioral and eye-tracking data were processed and analyzed using RStudio (2025.05.0+496) with the lme4 package [58] for mixed-effects modeling. To account for the repeated-measures structure of the within-subject design, mixed-effects models were employed for all dependent variables.
Accuracy (ACC), a binary outcome (correct/incorrect), was analyzed using logistic mixed-effects models with fixed effects of Highlighting Style (5 conditions), Luminance Contrast (3 levels), and their interaction. Participants were included as random intercepts to account for repeated observations within individuals. Only correct trials were retained for reaction time (RT) and eye-tracking analyses (8.04% of trials excluded). RTs exceeding ±3 median absolute deviations (MADs) from each participant’s median were excluded as outliers (7.3% of correct trials), a robust procedure commonly used in response-time analyses.
Reaction time (RT, in seconds) and four eye-tracking measures, including total viewing duration (TVD, in seconds), total fixation count (TFC), saccade count (SC), and time to first fixation (TTFF), were analyzed using linear mixed-effects models. The same fixed-effects structure consisting of Highlighting Style, Luminance Contrast, and their interaction was specified for all models, with random intercepts for participants.
Model comparisons were performed via likelihood-ratio tests (χ2), which statistically evaluate whether adding a predictor (e.g., the interaction term) significantly improves model fit relative to a simpler model. In the results reported below, ΔAIC refers to the difference in Akaike Information Criterion between a candidate model and a reference (typically simpler) model. A negative ΔAIC indicates that the candidate model with the additional term provides a better fit to the data, whereas a positive ΔAIC suggests that the added complexity does not improve fit sufficiently to justify the extra parameters. Thus, in our reporting, a negative ΔAIC supports the inclusion of the corresponding factor or interaction.
Post hoc pairwise comparisons were conducted using the emmeans package. All comparisons were adjusted using the Tukey method, a conservative approach that controls the family-wise error rate across multiple comparisons. Simple-effects analyses for significant interactions were performed using Bonferroni correction.
5.2. Behavioral Performance
Means and standard deviations of accuracy and reaction time across experimental conditions are presented in Table 2. The results of Tukey-adjusted multiple comparisons are summarized in Table 3 and Table 4, where grouping letters indicate statistically homogeneous subsets among conditions. Descriptive statistics in Table 2 reflect observed values, whereas the multiple-comparison results are derived from the mixed-effects models to control for subject-level variability.
Table 2.
Means and standard deviations of accuracy and reaction time (RT, s) for each level of highlighting condition and luminance contrast (collapsed across the complementary factor).
Table 3.
Tukey-adjusted multiple comparisons of accuracy and reaction time across highlighting conditions.
Table 4.
Tukey-adjusted pairwise comparisons for accuracy and reaction time across different luminance contrasts.
5.2.1. Accuracy
A logistic mixed-effects analysis revealed a significant main effect of Highlighting Style on accuracy (ΔAIC = −53.67, LLR χ2(4) = 61.67, p < 0.001). Post hoc comparisons indicated that all four highlighting conditions produced significantly higher accuracy than the No Highlighting condition (all p < 0.001). A significant main effect of Luminance Contrast was also observed (ΔAIC = −6.23, LLR χ2(2) = 10.232, p = 0.0059). Accuracy was higher under the high-contrast condition than under the low-contrast condition (p < 0.001), whereas the medium-contrast condition did not differ reliably from either level. Importantly, a significant interaction between Highlighting Style and Luminance Contrast emerged (ΔAIC = −32.89, LLR χ2(8) = 48.888, p < 0.001).
Simple-effects analyses indicated that contrast-related differences were most pronounced in the Title-Bar Highlighting and Background Highlighting conditions, where accuracy under low contrast was significantly lower than under high contrast. In the remaining highlighting conditions, accuracy differences across contrast levels did not reach statistical significance. Figure 6 presents the mean accuracy across experimental conditions, with panel (a) showing the effect of Highlighting Style and panel (b) showing the effect of Luminance Contrast.
Figure 6.
Mean search accuracy as a function of (a) highlighting condition and (b) luminance contrast. Values are estimated marginal means collapsed across the complementary factor. Error bars represent ±1 SE.
5.2.2. Reaction Time
A linear mixed-effects analysis revealed a significant main effect of Highlighting Style on reaction time (ΔAIC = −696, LLR χ2(4) = 704.030, p < 0.001). Reaction times differed reliably across the five highlighting conditions. A significant main effect of Luminance Contrast was also observed (ΔAIC = −31, LLR χ2(2) = 35.056, p < 0.001). Participants responded more slowly under the low-contrast condition (M = 1.66 s, SD = 0.90) than under both the medium-contrast (M = 1.39 s, SD = 0.62) and high-contrast conditions (M = 1.45 s, SD = 0.73). Importantly, a significant interaction between Highlighting Style and Luminance Contrast was found (ΔAIC = −35.8, LLR χ2(8) = 51.745, p < 0.001), indicating that the magnitude of contrast-related differences varied depending on the highlighting implementation. Bonferroni-adjusted simple-effects analyses showed that longer reaction times under low contrast were most evident in the No Highlighting and Text Highlighting conditions, whereas response-time differences across contrast levels were not statistically reliable in the remaining highlighting conditions. These effects are illustrated in Figure 7.
Figure 7.
Mean reaction time (RT) as a function of (a) highlighting condition and (b) luminance contrast. Values are estimated marginal means collapsed across the complementary factor. Error bars represent ±1 SE.
The interaction pattern is illustrated in Figure 8. Notably, the detrimental effect of low luminance contrast on reaction time was most pronounced in the No Highlighting condition, whereas all highlighting conditions attenuated this contrast-related cost, with structurally defined highlighting (Title-Bar and Background) showing the strongest mitigation. Differences between medium and high luminance contrast were comparatively small across most highlighting styles, suggesting that once a functionally sufficient level of visibility was achieved, further increases in contrast appeared to yield limited improvements in response efficiency.
Figure 8.
Interaction between Highlighting Style and Luminance Contrast on reaction time (RT). Values represent estimated marginal means from the linear mixed-effects model. Error bars indicate ±1 SE.
5.2.3. Control Analyses of Display-Level Color Realizations
Although foreground and background colors were not treated as experimental factors in the primary analyses, supplementary mixed-effects models were conducted to verify that the main effects were not driven by specific chromatic realizations. Accordingly, foreground chromatic realizations and background palette were entered as implementation-level covariates in robustness analyses, rather than as theoretical predictors. For accuracy, the inclusion of foreground color did not improve model fit relative to the intercept-only model (ΔAIC = +1.52, LLR χ2(1) = 0.49, p = 0.485). Adding background color likewise failed to yield improvement (ΔAIC = +1.19, LLR χ2(1) = 0.81, p = 0.369), and introducing their interaction produced no additional explanatory value (ΔAIC = +1.98, LLR χ2(1) = 0.01, p = 0.908). These results indicate that task success was not reliably influenced by chromatic realization. For reaction time, color factors yielded statistically significant but quantitatively modest effects. Introducing foreground color improved model fit relative to the intercept model (ΔAIC = −34.9, LLR χ2(1) = 36.95, p < 0.001) and adding background color produced a further reduction (ΔAIC = −30.9, LLR χ2(1) = 32.86, p < 0.001). Allowing their interaction resulted in only a comparatively small additional improvement (ΔAIC = −2.2, LLR χ2(1) = 4.22, p = 0.040). Although this interaction reached conventional statistical significance, its incremental contribution to model fit was limited in magnitude. Importantly, inclusion of the color interaction did not change the pattern of the primary fixed effects, as the direction and statistical significance of luminance contrast and highlighting style remained consistent across model specifications. Taken together, these analyses suggest that chromatic realization exerted minor implementation-level influences on baseline processing speed without altering the structural effects of luminance contrast and highlighting. The primary experimental conclusions therefore remain robust to variations in display-level color instantiation.
5.3. Eye-Tracking Measures
The means and standard deviations of the eye-movement measures for each level of the independent variables are presented in Table 5. Tukey-adjusted multiple comparisons based on estimated marginal means derived from the linear mixed-effects models are summarized in Table 6 and Table 7.
Table 5.
Mean and standard deviation of Total Viewing Duration (TVD), Total Fixation Count (TFC, N) and Saccade Count (SC, N) for each level of the independent variables.
Table 6.
Tukey-adjusted comparisons of TVD, TFC, and SC across highlighting conditions.
Table 7.
Tukey-adjusted comparisons of TVD, TFC, and SC across luminance-contrast levels.
5.3.1. Total Viewing Duration
A linear mixed-effects analysis revealed significant main effects of both Luminance Contrast (ΔAIC = −30.50, LLR χ2(2) = 34.48, p < 0.001) and Highlighting Style (ΔAIC = −527.1, LLR χ2(4) = 580.179, p < 0.001) on total viewing duration.
Across contrast conditions, both high and medium contrast were associated with significantly shorter viewing durations than low contrast (both p < 0.001), whereas differences between medium and high contrast were not statistically reliable (p > 0.05). This pattern indicates that improvements in perceptual visibility primarily occurred when contrast increased from low to high, rather than showing incremental gains across all levels.
Highlighting Style also modulated gaze duration. TVD was shortest in the Background Highlighting condition, followed by Title-Bar Highlighting, Text Highlighting, and Outer Border Highlighting, all of which yielded shorter viewing times than the No Highlighting condition (all p < 0.001). These results indicate that region-level and hierarchical highlighting more effectively reduced sustained visual processing demands. The pattern is illustrated in Figure 9.
Figure 9.
Total Viewing Duration (TVD) as a function of (a) highlighting condition and (b) luminance contrast. Values represent estimated marginal means from the mixed-effects model. Error bars indicate ±1 SE.
A significant interaction between Highlighting Style and Luminance Contrast was observed (ΔAIC = −34.7, LLR χ2(8) = 50.728, p < 0.001). Simple-effects analyses showed that low contrast resulted in longer viewing durations than high contrast in the No Highlighting, Text Highlighting, and Title-Bar Highlighting conditions (p < 0.05), whereas contrast differences were not significant in the Outer Border or Background Highlighting conditions. This indicates that strong structural highlighting can partially compensate for reduced luminance contrast. These reductions in visit duration reflect not only improved perceptual clarity but also more efficient attentional guidance toward structurally emphasized regions.
5.3.2. Total Fixation Count
Analysis of total fixation count (TFC) likewise revealed significant main effects of Luminance Contrast (ΔAIC = −10.70, LLR χ2(2) = 14.769, p < 0.001) and Highlighting Style (ΔAIC = −602.2, LLR χ2(4) = 610.199, p < 0.001).
Participants produced more fixations under low contrast than under high contrast (p < 0.001), indicating greater search effort when perceptual discriminability was reduced. Differences involving the medium-contrast level were not statistically significant (p > 0.05). Fixation behavior also varied across highlighting conditions. Tukey-adjusted post hoc comparisons further confirmed significant differences in total fixation count (TFC) across the five highlighting conditions (Table 6). The estimated marginal means formed distinct Tukey groupings (E, D, C, B, A), indicating that all highlighting conditions differed significantly from one another. This pattern suggests that more structurally organized highlighting cues may anchor visual selection more efficiently than boundary-only emphasis. The pattern is illustrated in Figure 10.
Figure 10.
Total fixation count (TFC) as a function of (a) highlighting condition and (b) luminance contrast. Values represent estimated marginal means. Error bars indicate ±1 SE.
A significant interaction was observed (ΔAIC = −146.9, LLR χ2(8) = 162.887, p < 0.001). Under No Highlighting, Outer Border Highlighting, and Text Highlighting, low contrast elicited more fixations than high contrast (p < 0.05). In contrast, the Title-Bar Highlighting condition showed the reverse trend, with fewer fixations under low contrast (p < 0.001), suggesting that the presence of a structurally emphasized region modified how luminance contrast influenced fixation behavior. No contrast effect emerged in the Background Highlighting condition. This reduction in total fixation count indicates a transition from exploratory search to guided selection.
The interaction pattern for total fixation count (TFC) mirrored the response-time findings. Under low luminance contrast, fixation counts increased substantially in the absence of highlighting, whereas all highlighting conditions reduced exploratory sampling, with Title-Bar and Background highlighting producing the lowest fixation counts. Differences between medium-contrast and high-contrast levels were comparatively small, indicating that once perceptual visibility was sufficient, additional contrast had a limited influence on search sampling behavior. The pattern is illustrated in Figure 11.
Figure 11.
Interaction between Highlighting Style and Luminance Contrast on Total Fixation Count (TFC). Values represent estimated marginal means from the linear mixed-effects model. Error bars indicate ±1 SE.
5.3.3. Saccade Count
Saccade count showed a similar but more selective pattern. Significant main effects were found for Luminance Contrast (ΔAIC = −15.70, LLR χ2(2) = 19.73, p < 0.001) and Highlighting Style (ΔAIC = −478.5, LLR χ2(4) = 486.609, p < 0.001). Low contrast elicited more saccades than high contrast (p < 0.001), indicating broader scanning behavior when targets were less visually salient. Across highlighting conditions, the fewest saccades occurred in Background Highlighting, followed by Title-Bar Highlighting, Text Highlighting, and Outer Border Highlighting, mirroring the TVD pattern and suggesting reduced exploratory search when global or hierarchical cues were present. The interaction between Highlighting Style and Luminance Contrast was also significant (ΔAIC = −37.7, LLR χ2(8) = 53.748, p < 0.001).
Low contrast increased saccade frequency in the No Highlighting and Text Highlighting conditions (p < 0.05), whereas no reliable contrast effects were observed for the remaining highlighting styles (p > 0.05). This indicates that luminance contrast primarily modulates scanning behavior when guidance cues are weak or locally defined. Changes in saccadic activity suggest that highlighting reshaped scan organization rather than merely reducing visual workload. The pattern is illustrated in Figure 12.
Figure 12.
Saccade count (SC) as a function of (a) highlighting condition and (b) luminance contrast. Values represent estimated marginal means. Error bars indicate ±1 SE.
5.3.4. Spatial Redistribution of Visual Attention
To complement the quantitative eye-movement metrics, heatmap visualizations were examined to reveal how interface manipulations reshaped the spatial organization of visual attention. The heatmaps were generated using aggregated fixation data across all participants within each experimental condition, such that warmer regions indicate greater cumulative fixation duration at the group level. To avoid bias associated with a single display, several structurally comparable interfaces were sampled to provide representative examples of gaze behavior.
(1) Effect of Highlighting Style
Figure 13 illustrates representative gaze heatmaps for the five highlighting styles. In the No Highlighting condition, gaze patterns were spatially diffuse, with fixations dispersed across multiple interface regions, consistent with exploratory visual search rather than guided selection. In contrast, highlighting conditions produced more spatially concentrated fixation clusters surrounding the target region, indicating guided visual selection. Among the highlighting styles, Background Highlighting and Title-Bar Highlighting showed the strongest attentional convergence, characterized by tightly localized fixation distributions near the task-relevant area. Outer Border Highlighting exhibited comparatively broader spatial spread, suggesting weaker structural guidance. These spatial patterns are consistent with the reductions in TVD, TFC, and SC, and suggest that highlighting changed how attention was distributed across the interface, not just how long participants looked at it.
Figure 13.
Representative gaze heatmaps drawn from five typical interface stimuli under each highlighting condition. Heatmap colors indicate fixation intensity, with warmer colors representing greater cumulative fixation duration aggregated across participants. The letters represent abstract stimuli without semantic meaning. The foreground–background color combinations shown in the interface reflect one possible chromatic realization used to implement the stimuli in the experiment.
(2) Effect of Luminance Contrast
Figure 14 presents representative gaze heatmaps for the three luminance-contrast levels. Under low contrast, gaze distributions were more dispersed across the interface, indicating increased exploratory processing due to reduced perceptual discriminability. As contrast increased, fixation patterns became progressively more concentrated around the target location, reflecting enhanced perceptual salience and a reduced need for broad visual scanning. This transition from diffuse to concentrated gaze organization suggests that luminance contrast facilitates target localization primarily through bottom-up visibility enhancement, complementing the structurally guided effects produced by highlighting. The spatial evidence is consistent with the reductions observed in RT and eye-movement metrics, providing converging support for H1 that luminance contrast significantly shapes visual search behavior.
Figure 14.
Representative gaze heatmaps drawn from three typical interface stimuli under low, medium, and high luminance-contrast levels. Heatmap colors indicate fixation intensity, with warmer colors representing greater cumulative fixation duration aggregated across participants. The letters represent abstract stimuli without semantic meaning. The foreground–background color combinations shown in the interface reflect one possible chromatic realization used to implement the stimuli in the experiment.
5.3.5. Temporal Dynamics of Target Acquisition
To further examine how interface manipulations influenced the temporal dynamics of visual selection, Time to First Fixation (TTFF) to the target-window AOI was analyzed. Significant main effects were found for Luminance Contrast (ΔAIC = −21.4, LLR χ2(2) = 25.333, p < 0.001) and Highlighting Style (ΔAIC = −806.4, LLR χ2(4) = 814.49, p < 0.001). The interaction between Highlighting Style and Luminance Contrast was also significant (ΔAIC = −30.9, LLR χ2(8) = 46.825, p < 0.001). TTFF decreased markedly across highlighting conditions, from 1.80 s in the No Highlighting condition to 0.53 s in the Background Highlighting condition, indicating substantially faster attentional capture when visual emphasis was applied closer to the target region. Intermediate highlighting styles showed a graded reduction in TTFF, suggesting that increasingly explicit visual cues progressively accelerated target acquisition.
By contrast, luminance contrast produced a weaker effect on TTFF. The low-contrast condition yielded longer latencies (1.20 s), whereas medium-contrast and high-contrast conditions showed comparable values (≈1.0 s), indicating that contrast primarily affected perceptual discriminability rather than continuously guiding attention. These findings suggest that highlighting and luminance contrast influence visual search through partially distinct mechanisms. Highlighting operates as an externally instantiated spatial cue that increases stimulus-driven attentional prioritization toward specific interface regions, thereby accelerating target acquisition. In contrast, luminance contrast primarily modulates perceptual discriminability by altering signal strength, facilitating detection once attention is allocated rather than directly guiding its spatial deployment. This temporal pattern is illustrated in Figure 15.
Figure 15.
Mean time to first fixation (TTFF) to the target-window AOI across highlighting conditions and luminance contrast. Values represent estimated marginal means. Error bars indicate ±1 SE. (a) Highlighting Condition; (b) Luminance Contrast.
To further understand what occurred after attention reached the target, gaze duration within the same target-window AOI was inspected. While TTFF reflects how rapidly attention arrived at the target, AOI visit duration represents the extent of post-acquisition processing required to verify the target once detected.
Title-Bar Highlighting produced substantially longer AOI dwell times (0.47 s) than other conditions (≈0.25 s), suggesting increased post-acquisition verification due to cue–target misalignment, as the highlight emphasized a structural region (the title-bar) rather than directly marking the target itself. This form of global structural cueing appears to organize the search space but does not eliminate the need for confirmation within the target region. In contrast, Background Highlighting yielded the shortest AOI dwell time (0.21 s), indicating more direct perceptual guidance and reduced verification demands once the target was located.
A similar pattern was observed across luminance-contrast levels, where low contrast elicited longer AOI dwell durations (0.39 s), consistent with increased perceptual uncertainty requiring additional confirmation. Together, these findings indicate that interface manipulations influenced not only when attention arrived at the target but also how information was processed after acquisition, reflecting differences in post-acquisition processing demands.
6. Discussion
The present study investigated how highlighting styles and luminance contrast jointly influence visual search performance in multi-window map interfaces. While both design factors are widely applied in operational interfaces, they are often examined independently. Behavioral and eye-movement results revealed a consistent pattern in which performance improved from low to medium and high luminance-contrast levels, indicating that increased luminance contrast enhanced perceptual efficiency but produced diminishing differences once adequate visibility was achieved. Relative to the No Highlighting condition, all highlighting implementations facilitated more efficient search behavior, confirming the functional role of visual emphasis as an attentional aid rather than a purely decorative feature. Among the four highlighting styles, region-based forms (Background and Title-Bar highlighting) were associated with more focused viewing patterns and reduced visual exploration, whereas contour- and feature-based forms (Outer Border and Text highlighting) showed comparatively weaker guidance. These findings indicate that the two factors contribute through partially distinct mechanisms: luminance contrast primarily determines perceptual visibility, whereas highlighting structures the spatial organization of attention across distributed interface regions. This pattern suggests that visual search performance in multi-window environments depends on the interplay between perceptual visibility and attentional organization. Whereas luminance contrast constrains the detectability of interface information, highlighting provides structural cues that guide the allocation of attention across spatially distributed information sources.
6.1. Luminance Contrast as a Perceptual Foundation for Search Efficiency (H1)
Consistent with H1, luminance contrast significantly influenced visual search efficiency by establishing the perceptual conditions necessary for reliable target discrimination. The results showed a clear performance decrement under the low luminance-contrast condition, reflected in both reduced accuracy and longer reaction times, whereas medium and high luminance-contrast levels yielded comparable performance. This pattern suggests the emergence of a functional visibility band rather than a sharp threshold: once luminance contrast reached a level sufficient to ensure perceptual clarity, further increases yielded limited additional benefit. The Tukey-adjusted comparisons support this interpretation. Accuracy was significantly higher in the high-contrast condition than in the low-contrast condition, while the medium-contrast condition did not differ reliably from either. A similar pattern emerged for reaction time, where participants responded significantly more slowly under low luminance contrast, but medium and high contrast formed a statistically homogeneous subset. Thus, the primary functional distinction lay between suboptimal luminance contrast and a functionally sufficient contrast range, rather than among progressively higher contrast levels.
This finding aligns with classical visibility theory, demonstrating that luminance contrast governs detection thresholds [16] and with contemporary accounts describing contrast as a constraint on early sensory coding [17]. Psychophysical investigations likewise established that luminance differences govern the minimum discriminable signal required for reliable perception [59]. Once stimuli operate within a perceptually sufficient range, attentional and organizational factors are expected to play a more influential role in shaping search performance. Evidence from applied display research further supports this interpretation. Related findings from applied ergonomics also suggest that visual performance improvements tend to plateau once contrast exceeds an optimal functional range [17,38]. For example, studies on visual display terminals report that visual acuity and subjective display quality improve as luminance contrast increases up to approximately 8:1–11:1, beyond which additional contrast no longer yields proportional performance gains [60,61]. The present pattern, in which medium (12:1) and high (18:1) contrast levels produced comparable outcomes, is consistent with the notion of such an apparent performance plateau region.
This interpretation is further supported by the eye-movement measures. Low luminance contrast was associated with longer total viewing durations and increased fixation and saccade counts, indicating more extensive visual sampling when perceptual discriminability was reduced. In contrast, medium-contrast and high-contrast conditions produced comparable gaze behavior, suggesting that once visibility fell within a functionally adequate range, the search no longer required additional exploratory processing. Taken together, the results indicate that luminance contrast mainly affected whether information could be efficiently discriminated, whereas differences in highlighting were more closely related to how attention was organized across windows.
6.2. Highlighting Styles as Attentional Structuring Mechanisms (H2)
In contrast to the perceptual role of luminance contrast, highlighting styles primarily influenced how attention was organized across interface regions as conceptualized in attentional guidance frameworks [3,19] and applied models of visual attention [2,62]. At the behavioral level, all four highlighting conditions showed clear performance advantages over the No Highlighting baseline in both accuracy and reaction time, suggesting that the introduction of visual emphasis facilitated search. However, the magnitude of improvement differed systematically across styles. Background Highlighting (mean RT = 1.04 s) and Title-Bar Highlighting (1.10 s) yielded the fastest performance, whereas Text Highlighting (1.32 s) and Outer Border Highlighting (1.70 s) showed more moderate gains, indicating that not all emphasis strategies guided attention equally effectively. Eye-movement evidence clarified how these differences emerged. Region-based highlighting substantially reduced total fixation counts, saccade frequency, and time to first fixation to the target window, indicating earlier attentional capture and less exploratory scanning. By contrast, Text and Outer Border highlighting showed weaker reductions in these measures, suggesting that they enhanced local salience without fully reorganizing the spatial deployment of attention. These differences suggest that highlighting strategies introducing a visible region (e.g., Background or Title-Bar conditions) function differently from those applied only to localized features or boundaries.
One explanation for these differences can be grounded in Gestalt theory, which emphasizes that perceptual organization is strongly shaped by grouping principles such as common region [12]. Background Highlighting creates a continuous surface behind the target window, while Title-Bar Highlighting establishes a partially enclosed region, both of which can promote perceptual grouping within that space. Related studies have shown that perceptual grouping can facilitate information processing in interface environments by improving comprehension accuracy and reaction time through proximity- and similarity-based organization [63]. In contrast, Outer Border Highlighting provides only a boundary cue, and Text Highlighting alters local features without defining a coherent spatial structure. Prior research on interface organization similarly shows that grouping information into visually coherent blocks improves search efficiency and reduces perceptual fragmentation in dense displays [64,65]. In the present context, the region-like surfaces introduced by Background Highlighting—and, to a lesser extent, the partial enclosure created by Title-Bar Highlighting—may therefore facilitate earlier perceptual structuring of the target window.
This pattern is also consistent with object-based theories of attention, which propose that attentional selection often operates on perceptual objects rather than isolated features [47]. Under this account, highlighting that visually marks an area of the window, such as the Background Highlighting conditions, may allow the entire window to be selected as a single attentional unit. Experimental studies show that attention shifts more efficiently within perceived objects than between unrelated regions [66,67,68]. According to Chen [48], a perceptual object is defined by uniform connectedness and closed boundaries, which together support object-based attentional selection. Title-Bar Highlighting introduces a visually distinct region at the top of the window but does not create a fully enclosed surface. It therefore functions primarily as a region-based spatial cue that structures the search space rather than transforming the entire window into a single perceptual object. In contrast, Background Highlighting, which fills the entire window area with a continuous visual surface, more closely approximates the conditions for object-based selection, potentially allowing the whole window to be attended to as a single unit [67].
A third explanation can be considered from an applied human-factors perspective, where interface structure is understood to influence the allocation of limited attentional resources [2]. In multi-window environments, users must continually decide which spatial container to inspect. Area-based emphasis, which introduces a filled visual region rather than a thin contour or local feature change, such as Background Highlighting or the filled Title-Bar, may externalize this structure and reduce the need for sequential evaluation across competing windows. Studies in interface ergonomics and visual layout design have similarly shown that clearly segmented regions support faster information localization and reduce visual search demands in complex interfaces [22,69]. Functionally grouped icons and compact panel layouts have been shown to reduce task completion time in complex interfaces [70].
Differences in post-acquisition dwell time provide converging behavioral evidence for these interpretations, suggesting that highlighting styles influenced not only where attention was directed but also how efficiently targets were verified once located. Taken together, these findings suggest that the observed differences among highlighting styles reflect how each supports perceptual grouping, object-based attentional selection, and the management of attentional resources. Background and Title-Bar highlighting showed the strongest facilitation, followed by Text highlighting, whereas Outer Border highlighting provided comparatively limited benefit relative to the No Highlighting condition. Notably, while both Background and Title-Bar highlighting facilitated search, they may do so through different mechanisms: Background Highlighting approximates object-based selection, whereas Title-Bar Highlighting functions as a region-based spatial cue. Rather than functioning solely as salience enhancements, these forms of highlighting appear to assist users in structuring attention across multiple windows, a role that may be especially relevant in visually dense multi-window environments.
6.3. Interaction Between Visibility and Attentional Guidance (H3)
The observed interaction between luminance contrast and highlighting indicates that perceptual visibility and attentional organization jointly shape visual search performance rather than acting as independent factors. When luminance contrast was reduced, structured highlighting helped maintain search efficiency, suggesting a complementary relationship between sensory clarity and the availability of spatial guidance cues. Such a relationship is consistent with classical human-factors accounts proposing that performance in complex tasks depends on the coordination of perceptual and cognitive resources rather than on a single limiting factor [22,71]. Recent evidence indicates that structural organization can moderate the cognitive impact of visual complexity. Zhang et al. showed that complexity impaired performance only under disordered conditions, whereas this effect disappeared when stimuli were visually ordered [72]. A more cautious interpretation is that structured visual organization can reduce processing costs associated with increased informational load, supporting the view that organizational cues may compensate for perceptual difficulty. This suggests that, under degraded visibility, region-defining highlighting may functionally substitute for luminance contrast by restructuring the spatial distribution of attentional priority. Under conditions of degraded sensory input, additional organizational cues, such as region-defining highlighting that visually groups interface elements, can compensate by reducing attentional uncertainty, whereas when visibility is already sufficient, their relative contribution becomes smaller.
This interpretation also aligns with Guided Search theory [9,19], which conceptualizes visual search as the outcome of interacting bottom-up and top-down influences operating simultaneously rather than sequentially. Consistent with this framework, the present results indicate that luminance contrast operates primarily at the level of perceptual visibility, whereas highlighting functions as a mechanism for structuring attentional allocation across interface regions. These mechanisms appear to combine dynamically, with attentional structuring playing a larger role when visual clarity is reduced. The interaction was reflected in systematic changes in gaze behavior. Under low luminance contrast, fixation and saccade counts increased markedly in conditions lacking strong structural cues, whereas region-based highlighting mitigated these increases. In contrast, the Title-Bar Highlighting condition exhibited a reverse pattern, with fewer fixations under low contrast. This finding suggests that when perceptual visibility was degraded, participants may have relied more strongly on the salient structural boundary provided by the title bar. Rather than engaging in broad perceptual sampling, attention appeared to be constrained to a predefined spatial region defined by the highlighted structural cue. Such a pattern is consistent with a shift from contrast-driven perceptual sampling toward structurally anchored search. Importantly, this effect does not imply improved perceptual clarity per se; instead, the title-bar cue may function as a spatial anchor under conditions of uncertainty, guiding attentional allocation when sensory input is less reliable. Eye-movement measures further indicate that the interaction reflected differences in search strategy rather than simple changes in perceptual speed. Variations in fixation distribution and viewing duration suggest that participants adjusted how they sampled information across windows depending on the availability of contrast and structural cues. Eye-tracking has long been recognized as a sensitive method for linking attentional theory with applied interface evaluation because it captures the spatial and temporal allocation of processing during task performance [40].
These findings support the view that effective interface design in multi-window environments depends on balancing perceptual visibility with mechanisms that guide attentional selection, particularly under conditions where visual signals alone may be insufficient. Importantly, the behavioral and eye-tracking results showed highly convergent patterns in the present study, with conditions associated with shorter response times generally also accompanied by reduced total viewing duration (TVD), lower total fixation count (TFC), and fewer saccades (SC), further supporting the appropriateness of the selected eye-tracking measures for characterizing overall visual search efficiency. The present findings should therefore be interpreted within the context of a task paradigm that preserves the core map-to-panel cross-window integration workflow commonly observed in real-world geospatial monitoring interfaces. Given that multiple highlighting conditions may co-occur in real-world applications, future research should further examine how concurrent visual cues interact in shaping attentional competition and visual search efficiency in complex multi-window environments.
7. Design Implications
The present findings translate into several practical implications for the design of multi-window map interfaces commonly used in geospatial monitoring and analytical environments, where spatial information retrieval often requires users to perform visual search across multiple interface panels. First, luminance contrast should be treated as a prerequisite for perceptual accessibility rather than as a primary means of attentional guidance. The results showed that performance deteriorated markedly under low luminance contrast but differed only marginally between the medium-contrast and high-contrast levels, indicating that once a functionally sufficient visibility threshold is reached, further increases yield limited benefit. Designers should therefore prioritize achieving adequate contrast for reliable discrimination rather than continuously increasing contrast intensity.
Second, highlighting should be applied as a structural cue for organizing attention across interface regions, not merely as a local feature enhancement. Region-based highlighting methods, such as Background and Title-Bar emphasis, produced more efficient search behavior and more focused gaze patterns than Text or Outer Border highlighting. These results suggest that highlighting is most effective when it clarifies spatial structure and delineates functional units or windows within the interface.
Third, effective multi-window design requires balancing perceptual visibility with attentional organization. Increasing luminance contrast improves the visibility of interface elements, whereas structurally meaningful highlighting helps reduce exploratory scanning by guiding attention toward task-relevant regions. Treating these two factors as complementary design strategies rather than independent visual adjustments may support more efficient visual search in complex operational interfaces. In practice, effective multi-window map interfaces should support both perceptual clarity and efficient spatial orientation, allowing users to identify relevant information quickly without unnecessary cross-window search. Furthermore, structured highlighting may partially compensate for reduced perceptual visibility in geospatial monitoring interfaces, helping maintain efficient visual search when contrast conditions cannot be fully optimized.
8. Limitations and Future Research
The present findings should be interpreted in light of several methodological limitations. First, luminance contrast was operationalized using chromatic interface elements consistent with contemporary dark-themed interface designs. Although this approach improved ecological realism, chromaticity was not manipulated independently, and its contribution cannot be fully separated from luminance-based effects. In addition, the selected contrast levels were intended to reflect practical interface configurations rather than to densely sample the full psychophysical continuum. Therefore, the current findings primarily inform applied design ranges rather than perceptual threshold modeling.
Another limitation concerns the abstraction of the stimulus content and task structure. The use of single English letters was intended to preserve strict experimental control and isolate pre-semantic visual attention mechanisms, following established visual search paradigms that employ simplified symbolic stimuli to minimize semantic and contextual confounds [73,74]. However, real-world geospatial monitoring interfaces typically involve semantically richer content, such as labels, numerical values, icons, and short textual descriptions. In addition, dynamic interface elements (e.g., animations and video) as well as variations in the structural outline of the central map display may further influence attentional allocation and visual search strategies in practical multi-window environments. Similarly, although the present task preserves the core cross-window integration sequence commonly observed in geospatial interfaces, namely the process of identifying a target cue on the central map and subsequently retrieving corresponding information from surrounding panels, it remains a controlled abstraction of real-world monitoring behavior, which is consistent with established human-factors approaches distinguishing controlled task paradigms from ecologically complex operational environments [2]. The current paradigm does not yet fully capture more continuous observation demands, dynamic content updates, semantic reasoning, or user-driven exploratory behaviors that are often present in practical monitoring scenarios. In addition, the present study adopted a relatively dense 16-window layout, and the current findings should therefore be interpreted primarily within high-density multi-window interface contexts. Future studies should further examine whether the observed effects generalize to layouts with fewer windows and different panel densities.
A further limitation relates to the highlighting manipulation itself. In the present study, different highlighting strategies inherently differ in their spatial extent and structural level, such as feature-level versus region-level emphasis. These differences arise directly from their design morphology and attentional-guidance function, which is broadly consistent with prior visual attention research showing that both salience strength and spatial extent jointly influence attentional priority and search efficiency [19,75]. In this sense, highlighting extent was treated as part of the functional design of visual emphasis rather than as a separately controlled variable. At the same time, real-world multi-window interfaces may also involve additional saliency mechanisms, including animation, dynamic content changes, border flashing, and adaptive window resizing.
Future research should further examine the robustness of the present findings under semantically richer interface content, longer observation durations, more continuous monitoring tasks, area-matched cueing paradigms, and more diverse saliency strategies in ecologically rich multi-window interface settings.
9. Conclusions
This study investigated how highlighting style and luminance contrast jointly influence target search performance in multi-window map interfaces through combined behavioral and eye-tracking measures. The findings show that the two design dimensions contribute through distinct but interacting mechanisms. Luminance contrast primarily determines perceptual accessibility, affecting how easily targets can be visually identified within the interface, whereas highlighting organizes the spatial deployment of attention, shaping how efficiently users navigate across distributed interface regions. The results further demonstrate that improving visibility alone does not fully account for performance differences once an adequate contrast level is achieved. Instead, highlighting strategies that define coherent visual regions facilitate earlier attentional capture, reduce exploratory scanning, and support more efficient target verification. These findings indicate that visual search in multi-window environments is governed by the coordination of perceptual and attentional processes rather than by a single dominant factor.
By integrating perspectives from visual psychophysics and attentional guidance research, this study extends prior work on visual search beyond single-interface paradigms and provides empirical evidence for how visual emphasis functions in structurally complex interface environments. The results underscore the importance of designing not only for visibility but also for the organization of attention when developing information-dense digital systems that require efficient monitoring and decision-making. These findings contribute to geospatial visualization research by showing how visual emphasis strategies can support more efficient spatial information search in multi-window map interfaces used in geospatial monitoring and analytical environments.
Author Contributions
Conceptualization, Jing Zhang and Liyu Hu; Methodology, Jing Zhang, Liyu Hu and Yu Zhang; Software, Xuanyi Kuang; Validation, Jing Zhang, Liyu Hu and Yunqi Zhu; Formal analysis, Liyu Hu and Jing Zhang; Investigation, Liyu Hu, Jing Zhang, Yunqi Zhu and Xuanyi Kuang; Resources, Yu Zhang, Wa Gao and Jingjing Li; Data curation, Liyu Hu, Yunqi Zhu and Xuanyi Kuang; Writing—original draft preparation, Liyu Hu, Jing Zhang and Yunqi Zhu; Writing—review and editing, Liyu Hu, Jing Zhang, Yu Zhang and Jingjing Li; Visualization, Xuanyi Kuang and Yunqi Zhu; Supervision, Jing Zhang and Wa Gao; Project administration, Jing Zhang; Funding acquisition, Jing Zhang. All authors have read and agreed to the published version of the manuscript.
Funding
This paper was supported by the National Natural Science Foundation of China (Grant No. 72201128).
Institutional Review Board Statement
The study protocol was reviewed and approved by the ethics review committee of the institution (protocol code No. 2025018; approval date: 17 January 2025). All participants took part voluntarily and provided informed consent prior to participation. All procedures were conducted in accordance with the ethical standards of the institution and the Declaration of Helsinki, with appropriate measures taken to protect participants’ rights, interests, and privacy.
Informed Consent Statement
Informed consent was obtained from all subjects involved in the study.
Data Availability Statement
The original contributions presented in this study are included in the article. Further inquiries can be directed to the corresponding author.
Acknowledgments
We would like to thank all participants for taking the time to patiently complete the experimental content and the College of Furnishings and Industrial Design for providing the experimental site.
Conflicts of Interest
The authors declare no conflicts of interest.
Correction Statement
This article has been republished with a minor correction to the references. This change does not affect the scientific content of the article.
References
- Yeh, M.; Wickens, C.D. Attentional Filtering in the Design of Electronic Map Displays: A Comparison of Color Coding, Intensity Coding, and Decluttering Techniques. Hum. Factors 2001, 43, 543–562. [Google Scholar] [CrossRef] [Scilit] [PubMed]
- Wickens, C.D.; Goh, J.; Helleberg, J.; Horrey, W.J.; Talleur, D.A. Attentional Models of Multitask Pilot Performance Using Advanced Display Technology. In Human Error in Aviation; Routledge: Abingdon, UK, 2009; p. 21. [Google Scholar]
- Wolfe, J.M.; Horowitz, T.S. Five factors that guide attention in visual search. Nat. Hum. Behav. 2017, 1, 0058. [Google Scholar] [CrossRef] [Scilit] [PubMed]
- Zhang, J.; Zhu, X.; Tang, W.; Ge, W.; Zhang, Y.; Chen, D.; Li, J. Enhancing alarm localization in multi-window map interfaces with spatialized auditory cues: An eye-tracking study. ISPRS Int. J. Geo-Inf. 2026, 15, 69. [Google Scholar] [CrossRef] [Scilit]
- Jang, J.; Bell Trickett, S.; Schunn, C.D.; Gregory Trafton, J. Unpacking the temporal advantage of distributing complex visual displays. Int. J. Hum. -Comput. Stud. 2012, 70, 812–827. [Google Scholar] [CrossRef] [Scilit]
- Wickens, C.D.; McCarley, J.S. Applied Attention Theory; CRC Press: Boca Raton, FL, USA, 2008. [Google Scholar]
- Putkonen, A.; Jiang, Y.; Zeng, J.; Tammilehto, O.; Jokinen, J.P.P.; Oulasvirta, A. Understanding visual search in graphical user interfaces. Int. J. Hum.-Comput. Stud. 2025, 199, 103483. [Google Scholar] [CrossRef] [Scilit]
- Golebiowska, I.; Opach, T.; Rod, J.K. For your eyes only? Evaluating a coordinated and multiple views tool with a map, a parallel coordinated plot and a table using an eye-tracking approach. Int. J. Geogr. Inf. Sci. 2017, 31, 237–252. [Google Scholar] [CrossRef] [Scilit]
- Wolfe, J.M. Guided search 2.0: A revised model of visual search. Psychon. Bull. Rev. 1994, 1, 202–238. [Google Scholar] [CrossRef] [Scilit] [PubMed]
- Treisman, A.; Gelade, G. A feature-integration theory of attention. Cogn. Psychol. 1980, 12, 97–136. [Google Scholar] [CrossRef] [Scilit] [PubMed]
- Wolfe, J.M.; Horowitz, T.S. What attributes guide the deployment of visual attention and how do they do it? Nat. Rev. Neurosci. 2004, 5, 495–501. [Google Scholar] [CrossRef] [Scilit] [PubMed]
- Palmer, S.E. Common region: A new principle of perceptual grouping. Cogn. Psychol. 1992, 24, 436–447. [Google Scholar] [CrossRef] [Scilit] [PubMed]
- Huang, L.; Pashler, H. A Boolean map theory of visual attention. Psychol. Rev. 2007, 114, 599–631. [Google Scholar] [CrossRef] [Scilit] [PubMed]
- She, L.; Wang, Z.; Tao, X.; Lai, L. The Impact of Color Cues on the Learning Performance in Video Lectures. Behav. Sci. 2024, 14, 560. [Google Scholar] [CrossRef] [Scilit] [PubMed]
- Wei, S.; Lei, Q.; Chen, Y.; Xin, Y.P. The Effects of Visual Cueing on Students with and without Math Learning Difficulties in Online Problem Solving: Evidence from Eye Movement. Behav. Sci. 2023, 13, 927. [Google Scholar] [CrossRef] [Scilit] [PubMed]
- Blackwell, H.R. Contrast Thresholds of the Human Eye. J. Opt. Soc. Am. 1946, 36, 624–643. [Google Scholar] [CrossRef] [Scilit] [PubMed]
- Pelli, D.G.; Bex, P. Measuring contrast sensitivity. Vis. Res. 2013, 90, 10–14. [Google Scholar] [CrossRef] [Scilit] [PubMed]
- Carrasco, M. Visual attention: The past 25 years. Vis. Res. 2011, 51, 1484–1525. [Google Scholar] [CrossRef] [Scilit] [PubMed]
- Wolfe, J.M. Guided Search 6.0: An updated model of visual search. Psychon. Bull. Rev. 2021, 28, 1060–1092. [Google Scholar] [CrossRef] [Scilit] [PubMed]
- ISO 9241-303; Ergonomics of Human-System Interaction—Part 303: Requirements for Electronic Visual Displays. International Organization for Standardization: Geneva, Switzerland, 2011. Available online: https://www.iso.org/standard/57992.html (accessed on 14 January 2026).
- ISO 9241-11:2018; Ergonomics of Human-System Interaction—Part 11: Usability: Definitions and Concepts. International Organization for Standardization: Geneva, Switzerland, 2018. Available online: https://www.iso.org/standard/63500.html (accessed on 14 January 2026).
- Sanders, M.S.; McCormick, E.J. Human Factors in Engineering and Design, 7th ed.; McGraw-Hill: Columbus, OH, USA, 1993. [Google Scholar]
- Näsänen, R. Spatial frequency bandwidth used in the recognition of facial images. Vis. Res. 1999, 39, 3824–3833. [Google Scholar] [CrossRef] [Scilit] [PubMed]
- Itti, L.; Koch, C. Computational modelling of visual attention. Nat. Rev. Neurosci. 2001, 2, 194–203. [Google Scholar] [CrossRef] [Scilit] [PubMed]
- Smallman, H.S.; St John, M. Naïve realism: Misplaced faith in realistic displays. Ergon. Des. 2005, 13, 6–13. [Google Scholar] [CrossRef] [Scilit]
- St. John, M.; Smallman, H.S. Staying Up to Speed: Four Design Principles for Maintaining and Recovering Situation Awareness. J. Cogn. Eng. Decis. Mak. 2008, 2, 118–139. [Google Scholar] [CrossRef] [Scilit]
- Das, A.; Wu, Z.; Skrjanec, I.; Feit, A.M. Shifting Focus with HCEye: Exploring the Dynamics of Visual Highlighting and Cognitive Load on User Attention and Saliency Prediction. Proc. ACM Hum.-Comput. Interact. 2024, 8, 1–18. [Google Scholar] [CrossRef] [Scilit]
- Leiva, L.A.; Xue, Y.; Bansal, A.; Tavakoli, H.R.; Köroğlu, T.; Du, J.; Dayama, N.R.; Oulasvirta, A. Understanding Visual Saliency in Mobile User Interfaces. In Proceedings of the 22nd International Conference on Human-Computer Interaction with Mobile Devices and Services (MobileHCI ’20), Oldenburg Germany, 5–8 October 2020; ACM: New York, NY, USA, 2020; Article 3; pp. 1–12. [Google Scholar] [CrossRef] [Scilit]
- Gajos, K.Z.; Everitt, K.; Tan, D.S.; Czerwinski, M.; Weld, D.S. Predictability and accuracy in adaptive user interfaces. In Proceedings of the SIGCHI Conference on Human Factors in Computing Systems 2008, Florence, Italy, 5–10 April 2008; pp. 1271–1274. [Google Scholar] [CrossRef] [Scilit]
- Lin, H.-C.; Huang, K.-C. Effects of ambient illumination and screen luminance combination on character identification performance of desktop TFT-LCD monitors. Int. J. Ind. Ergon. 2006, 36, 211–218. [Google Scholar] [CrossRef] [Scilit]
- Reynolds, J.H.; Chelazzi, L. Attentional modulation of visual processing. Annu. Rev. Neurosci. 2004, 27, 611–647. [Google Scholar] [CrossRef] [Scilit] [PubMed]
- Na, N.; Suk, H.-J. Adaptive luminance contrast for enhancing reading performance and visual comfort on smartphone displays. Opt. Eng. 2014, 53, 113102. [Google Scholar] [CrossRef] [Scilit]
- Zhou, Y.; Shi, H.; Chen, Q.-W.; Ru, T.; Zhou, G. Investigation of the Optimum Display Luminance of an LCD Screen under Different Ambient Illuminances in the Evening. Appl. Sci. 2021, 11, 4108. [Google Scholar] [CrossRef] [Scilit]
- Glimne, S.; Brautaset, R.; Österman, C. Visual fatigue during control room work in process industries. Work. A J. Prev. Assess. Rehabil. 2020, 65, 903–914. [Google Scholar] [CrossRef] [Scilit] [PubMed]
- Meidan, R.; Bonneh, Y.S. Pattern-induced visual discomfort and its cumulative effects revealed by pupillary measures. Front. Hum. Neurosci. 2026, 19, 1723675. [Google Scholar] [CrossRef] [Scilit] [PubMed]
- Buchner, A.; Baumgartner, N. Text—Background polarity affects performance irrespective of ambient illumination and colour contrast. Ergonomics 2007, 50, 1036–1063. [Google Scholar] [CrossRef] [Scilit] [PubMed]
- Lin, C.; Ji, Z.; Lin, Y. Optimum display luminance and contrast polarity of desktop head-up display under office lighting level based on visual ergonomic study. Ergonomics 2024, 67, 1491–1503. [Google Scholar] [CrossRef] [Scilit] [PubMed]
- Shen, Z.; Zhang, L.; Li, R.; Hou, J.; Liu, C.; Hu, W. The effects of color combinations, luminance contrast, and area ratio on icon visual search performance. Displays 2021, 67, 101999. [Google Scholar] [CrossRef] [Scilit]
- Yeh, M.; Wickens, C.D. Display signaling in augmented reality: Effects of cue reliability and image realism on attention allocation. Hum. Factors 2001, 43, 355–365. [Google Scholar] [CrossRef] [Scilit] [PubMed]
- Rayner, K. Eye movements and attention in reading, scene perception, and visual search. Q. J. Exp. Psychol. 2009, 62, 1457–1506. [Google Scholar] [CrossRef] [Scilit] [PubMed]
- Holmqvist, K.; Nyström, M.; Andersson, R.; Dewhurst, R.; Jarodzka, H.; van de Weijer, J. Eye Tracking: A Comprehensive Guide to Methods and Measures; Oxford University Press: Oxford, UK, 2011; Available online: http://ukcatalogue.oup.com/product/9780199697083.do (accessed on 14 January 2026).
- Bylinskii, Z.; Borkin, M.A.; Kim, N.W.; Pfister, H.; Oliva, A. Eye fixation metrics for large scale evaluation and comparison of information visualizations. In Eye Tracking and Visualization: Foundations, Techniques, and Applications. ETVIS 2015; Burch, M., Chuang, L.L., Fisher, B., Schmidt, A., Weiskopf, D., Eds.; Springer: Berlin/Heidelberg, Germany, 2017; pp. 235–255. [Google Scholar] [CrossRef] [Scilit]
- Zagermann, J.; Pfeil, U.; Reiterer, H. Studying Eye Movements as a Basis for Measuring Cognitive Load. In Proceedings of the Extended Abstracts of the 2018 CHI Conference on Human Factors in Computing Systems, Montreal, QC, Canada, 21–26 April 2018; pp. 1–6. [Google Scholar] [CrossRef] [Scilit]
- Beatty, J.; Lucero-Wagoner, B. The pupillary system. In Handbook of Psychophysiology, 2nd ed.; Cacioppo, J.T., Tassinary, L.G., Berntson, G., Eds.; Cambridge University Press: Cambridge, UK, 2000; pp. 142–162. [Google Scholar]
- Mathôt, S. Pupillometry: Psychology, physiology, and function. J. Cogn. 2018, 1, 16. [Google Scholar] [CrossRef] [Scilit] [PubMed]
- Guo, F.; Ding, Y.; Liu, W.; Liu, C.; Zhang, X. Can eye-tracking data be measured to assess product design?: Visual attention mechanism should be considered. Int. J. Ind. Ergon. 2016, 53, 229–235. [Google Scholar] [CrossRef] [Scilit]
- Egly, R.; Driver, J.; Rafal, R.D. Shifting visual attention between objects and locations: Evidence from normal and parietal lesion subjects. J. Exp. Psychol. Gen. 1994, 123, 161–177. [Google Scholar] [CrossRef] [PubMed]
- Chen, Z. Object-based attention: A tutorial review. Atten. Percept. Psychophys. 2012, 74, 784–802. [Google Scholar] [CrossRef] [Scilit] [PubMed]
- Chen, A.; Xie, F.; Wang, J.; Chen, J. Intelligent Optimization Method of Human–Computer Interaction Interface for UAV Cluster Attack Mission. Electronics 2023, 12, 4426. [Google Scholar] [CrossRef] [Scilit]
- Wang, X.; Lin, L.; Han, M.; Spector, J.M. Impacts of cues on learning: Using eye-tracking technologies to examine the functions and designs of added cues in short instructional videos. Comput. Hum. Behav. 2020, 107, 106279. [Google Scholar] [CrossRef] [Scilit]
- Hu, J.; Zhang, J. The Effect of Cue Labeling in Multimedia Learning: Evidence From Eye Tracking. Front. Psychol. 2021, 12, 736922. [Google Scholar] [CrossRef] [Scilit] [PubMed]
- Grubert, A.; Righi, L.L.; Eimer, M. A unitary focus of spatial attention during attentional capture: Evidence from event-related brain potentials. J. Vis. 2013, 13, 9. [Google Scholar] [CrossRef] [Scilit] [PubMed]
- Nock, R.; Nielsen, F. Semi-supervised statistical region refinement for color image segmentation. Pattern Recognit. 2005, 38, 835–846. [Google Scholar] [CrossRef] [Scilit]
- Saeki, E.; Saito, S. Separating the effect of verbal cue on task-set activation into stimulus- and response-related processes: An eye-tracking study. Can. J. Exp. Psychol. Rev. Can. Psychol. Expérimentale 2023, 77, 45–56. [Google Scholar] [CrossRef] [Scilit] [PubMed]
- Ko, Y.-H. The effects of luminance contrast, colour combinations, font, and search time on brand icon legibility. Appl. Ergon. 2017, 65, 33–40. [Google Scholar] [CrossRef] [Scilit] [PubMed]
- Ming, C.; Wu, Z.; Gu, H.; Chen, C.; Zhang, Y. The effects of luminance contrast and color combination on icon cognitive performance. Color Res. Appl. 2022, 47, 498–506. [Google Scholar] [CrossRef] [Scilit]
- Xie, X.; Song, F.; Liu, Y.; Wang, S.; Yu, D. Study on the effects of display color mode and luminance contrast on visual fatigue. IEEE Access 2021, 9, 35915–35923. [Google Scholar] [CrossRef] [Scilit]
- Bates, D.; Mächler, M.; Bolker, B.; Walker, S. Fitting linear mixed-effects models using lme4. J. Stat. Softw. 2015, 67, 1–48. [Google Scholar] [CrossRef] [Scilit]
- De Fez, D.; Luque, M.J. Psychophysics in the ophthalmological practice—II. Contrast sensitivity. Ann. Eye Sci. 2022, 7, 11. [Google Scholar] [CrossRef] [Scilit]
- Zhu, Z.; Wu, J. On the standardization of VDT’s proper and optimal contrast range. Ergonomics 1990, 33, 925–932. [Google Scholar] [CrossRef] [Scilit]
- Wang, A.-H.; Chen, M.-T. Effects of polarity and luminance contrast on visual performance and VDT display quality. Int. J. Ind. Ergon. 2000, 25, 415–421. [Google Scholar] [CrossRef] [Scilit]
- Zhang, N.; Zhang, J.; Jiang, S.; Di, X.; Li, W. Moderating Effects of Visual Order in Graphical Symbol Complexity: The Practical Implications for Design. Appl. Sci. 2024, 14, 7592. [Google Scholar] [CrossRef] [Scilit]
- Ma, J. A study on perceptual design of hierarchical graphic information in interfaces based on gestalt principles. Appl. Sci. 2025, 15, 11327. [Google Scholar] [CrossRef] [Scilit]
- Tullis, T.S. The formatting of alphanumeric displays: A review and analysis. Hum. Factors 1983, 25, 657–682. [Google Scholar] [CrossRef] [Scilit] [PubMed]
- Beck, D.M.; Palmer, S.E. Top-down influences on perceptual grouping. J. Exp. Psychol. Hum. Percept. Perform. 2002, 28, 1071–1084. [Google Scholar] [CrossRef] [Scilit]
- Duncan, J. Selective attention and the organization of visual information. J. Exp. Psychol. Gen. 1984, 113, 501–517. [Google Scholar] [CrossRef] [PubMed]
- Greenberg, A.S.; Rosen, M.L.; Cutrone, E.; Behrmann, M. The effects of visual search efficiency on object-based attention. Atten. Percept. Psychophys. 2015, 77, 1544–1557. [Google Scholar] [CrossRef] [Scilit] [PubMed]
- Vecera, S.P.; Farah, M.J. Does visual attention select objects or locations? J. Exp. Psychol. Gen. 1994, 123, 146–160. [Google Scholar] [CrossRef] [PubMed]
- Shieh, K.-K.; Lin, C.-C. Effects of screen type, ambient illumination, and color combination on VDT visual performance and subjective preference. Int. J. Ind. Ergon. 2000, 26, 527–536. [Google Scholar] [CrossRef] [Scilit]
- Zhang, C.; Wei, D.P.; Ji, Y.; Chen, D.; Li, X.Y.; Gong, X.D. The influence of interface attributes and interaction elements on user performance and cognitive load in task interruption scenarios. Int. J. Ind. Ergon. 2025, 108, 103761. [Google Scholar] [CrossRef] [Scilit]
- Wickens, C.D. Multiple resources and performance prediction. Theor. Issues Ergon. Sci. 2002, 3, 159–177. [Google Scholar] [CrossRef] [Scilit]
- Zhang, N.; Zhang, J.; Jiang, S.; Ge, W. The Effects of Layout Order on Interface Complexity: An Eye-Tracking Study for Dashboard Design. Sensors 2024, 24, 5966. [Google Scholar] [CrossRef] [Scilit] [PubMed]
- Zimmer, U.; Roberts, K.C.; Harshbarger, T.B.; Woldorff, M.G. Multisensory conflict modulates the spread of visual attention across a multisensory object. NeuroImage 2010, 52, 606–616. [Google Scholar] [CrossRef] [Scilit] [PubMed]
- Tekli, J.; Issa, Y.B.; Chbeir, R. Evaluating touch-screen vibration modality for blind users to access simple shapes and graphics. Int. J. Hum. -Comput. Stud. 2018, 110, 115–133. [Google Scholar] [CrossRef] [Scilit]
- Nuthmann, A.; Clayden, A.C.; Fisher, R.B. The effect of target salience and size in visual search within naturalistic scenes under degraded vision. J. Vis. 2021, 21, 2. [Google Scholar] [CrossRef] [Scilit] [PubMed]
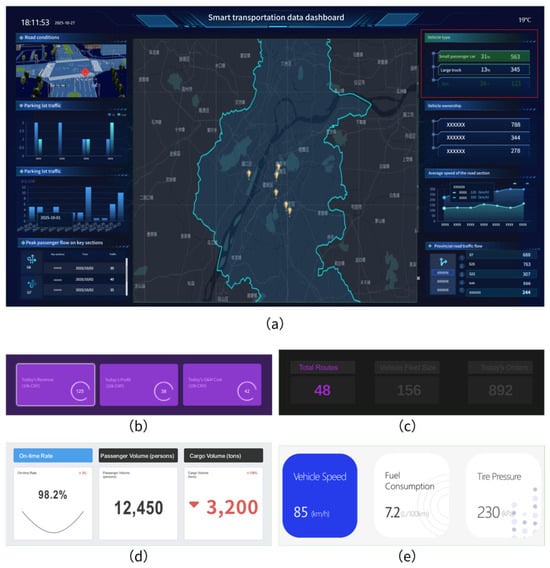
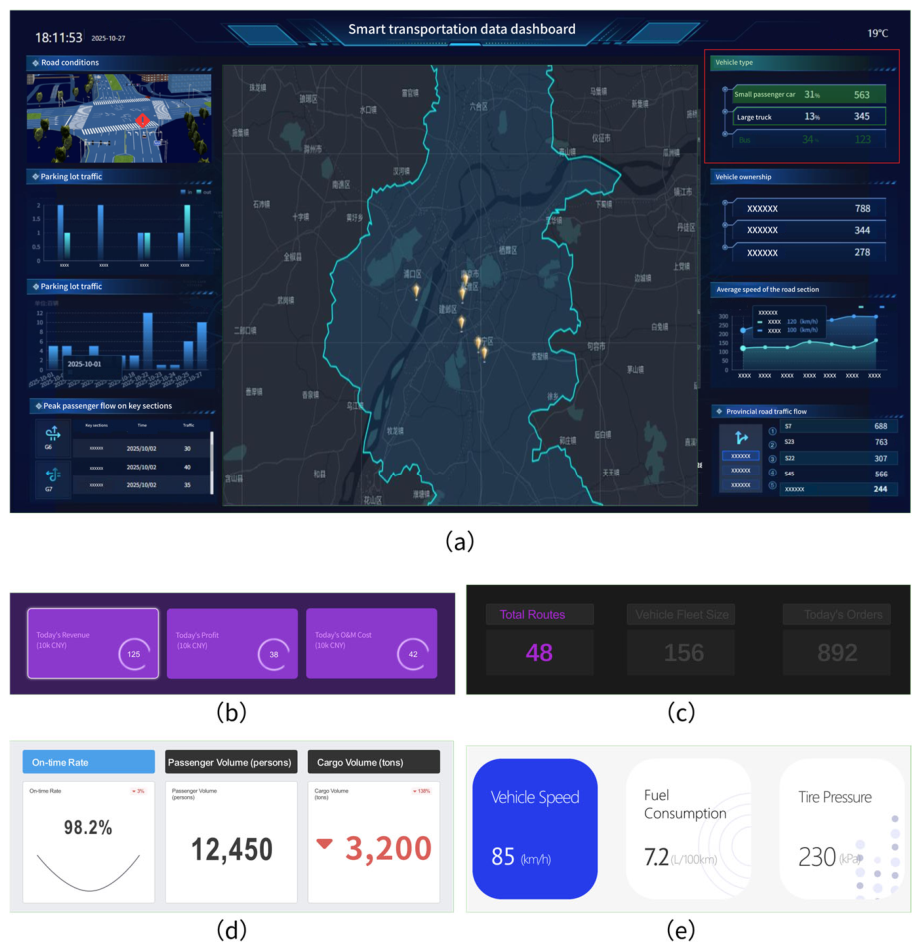
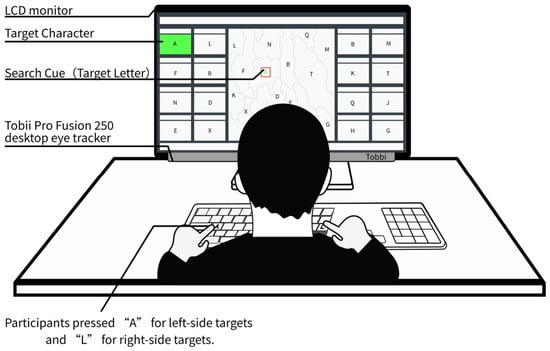
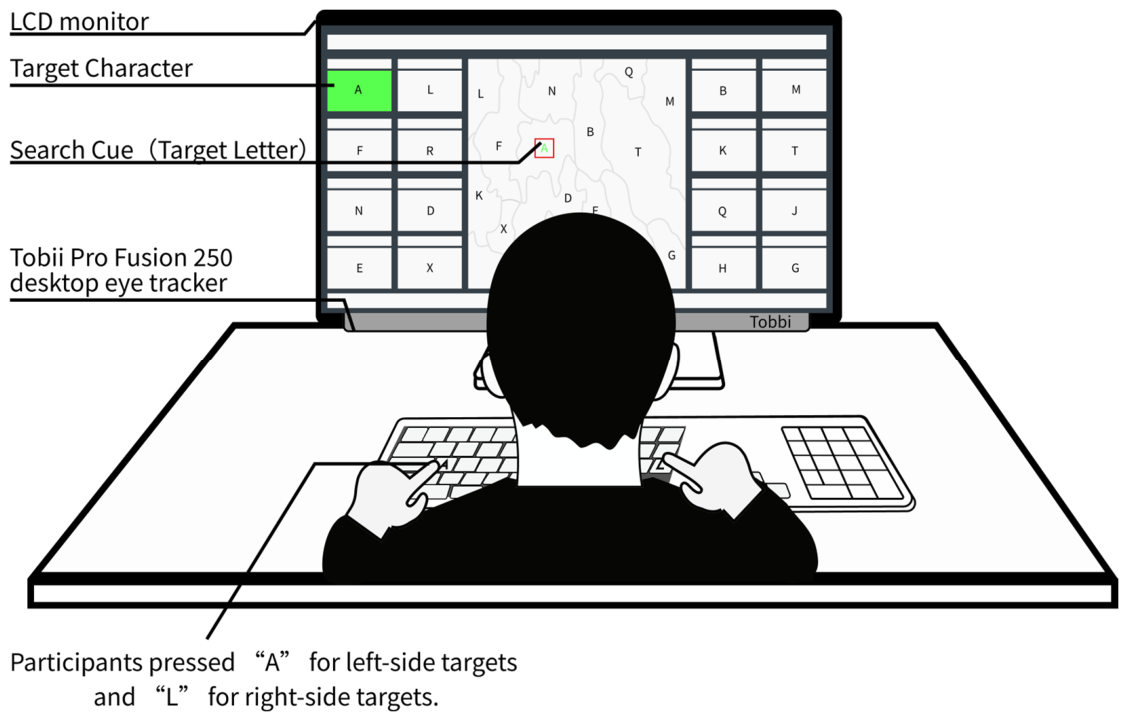


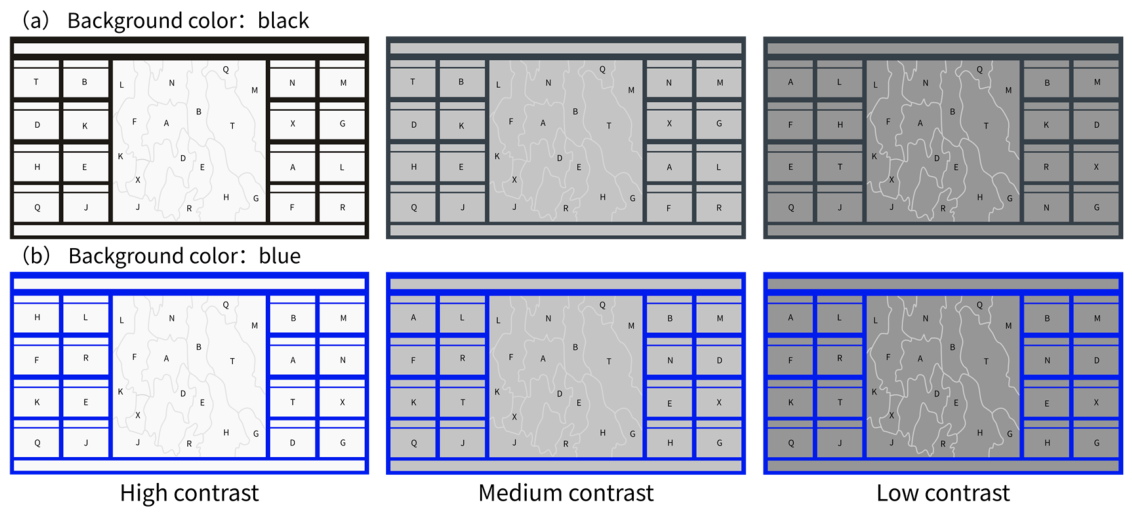
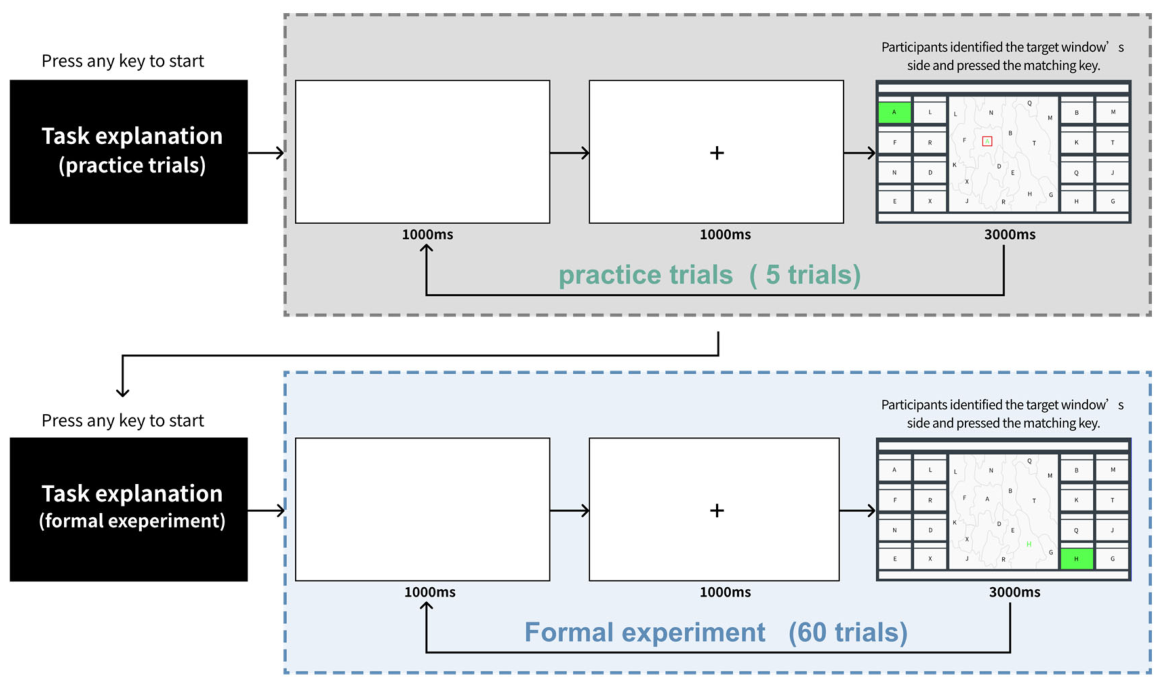
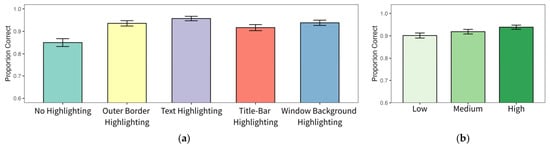
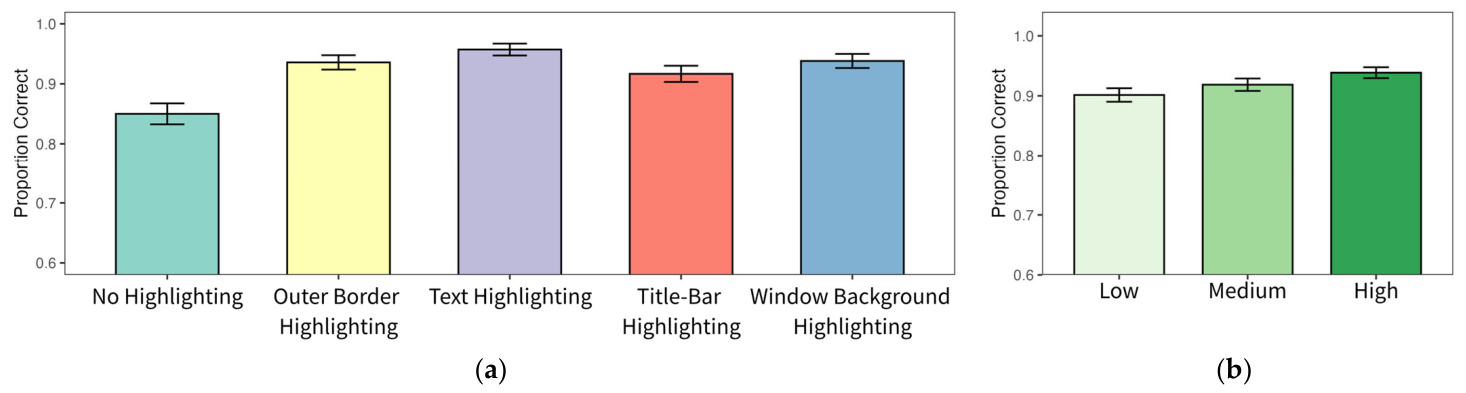
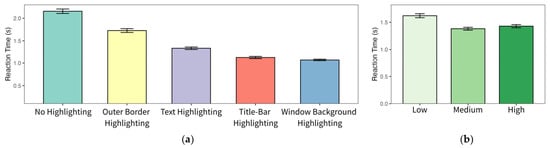
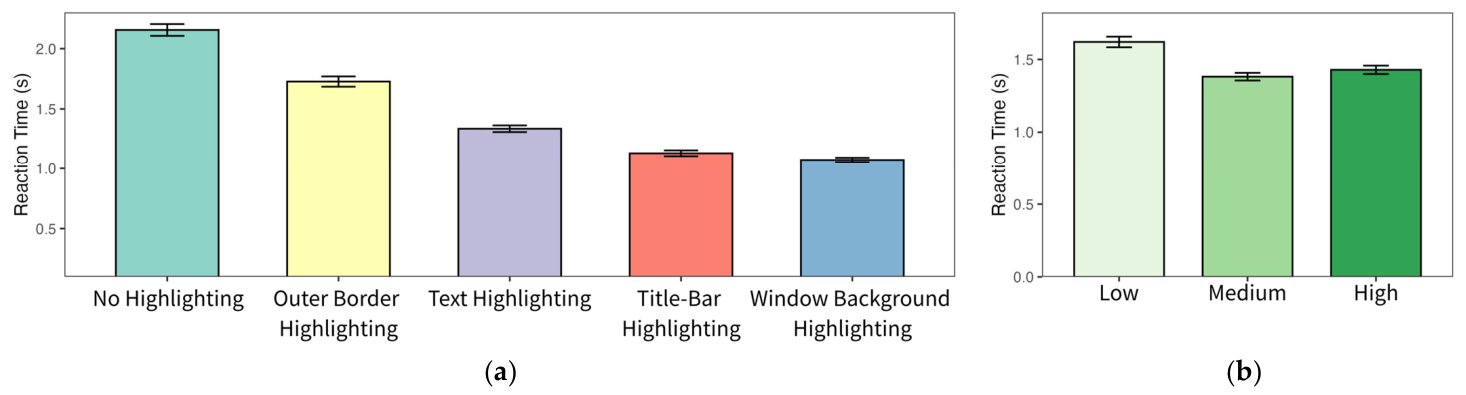
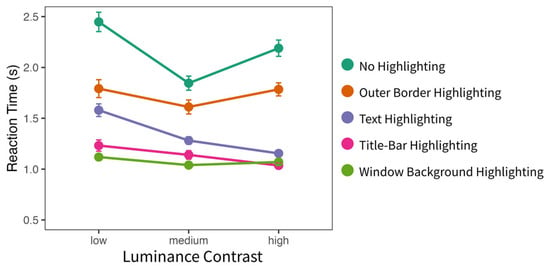
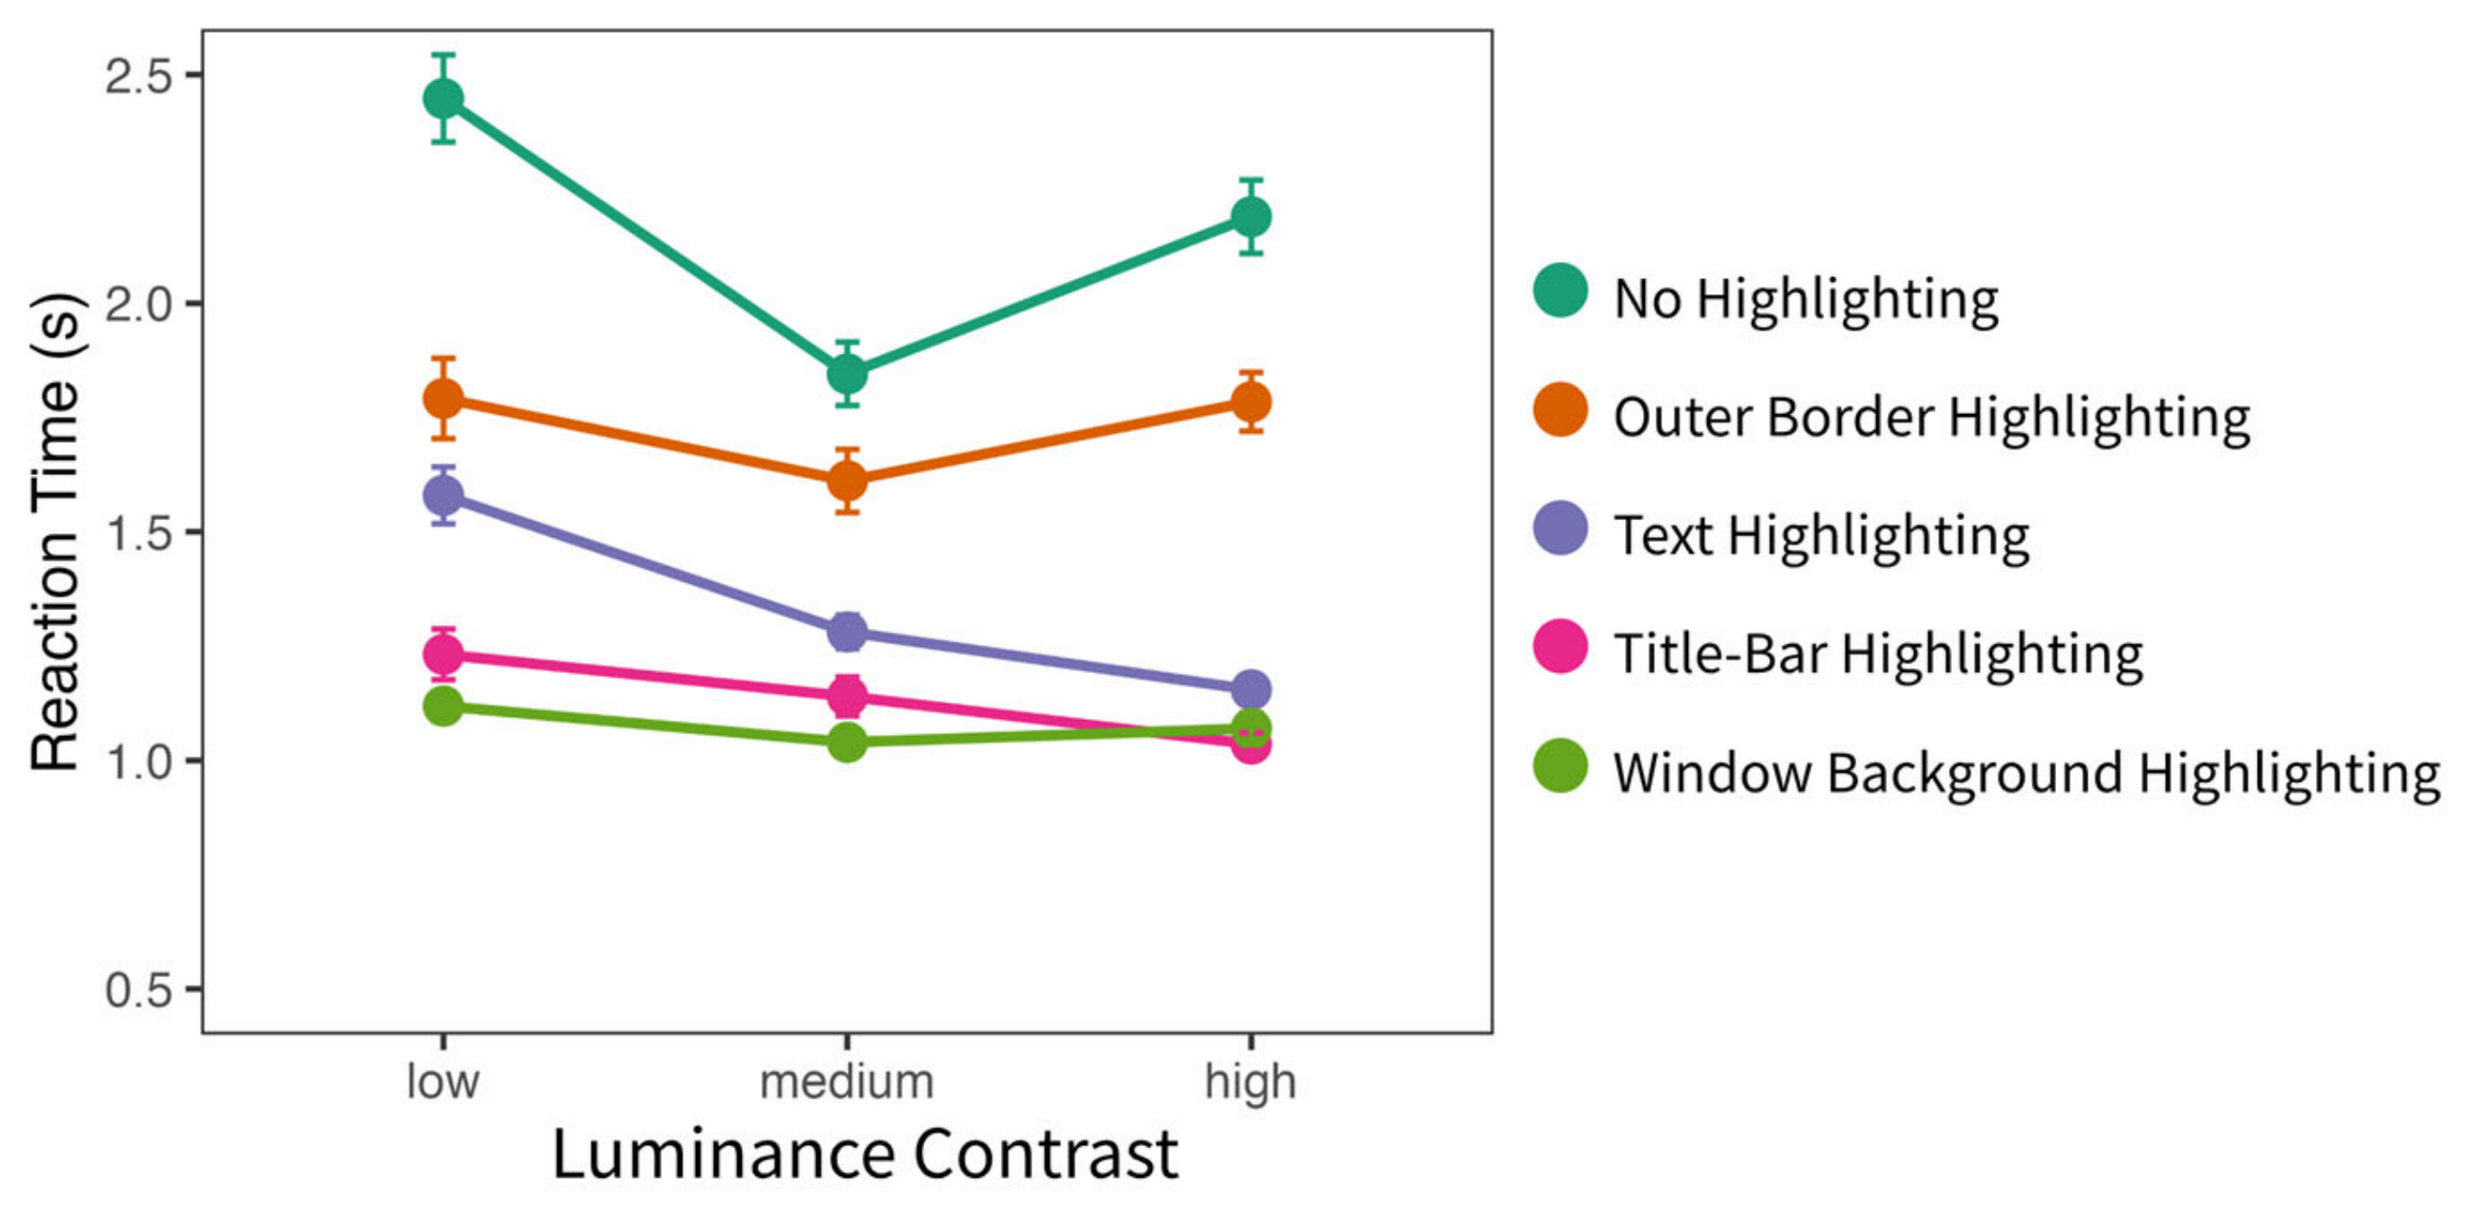
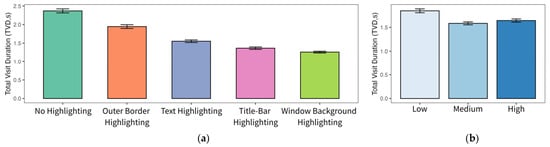
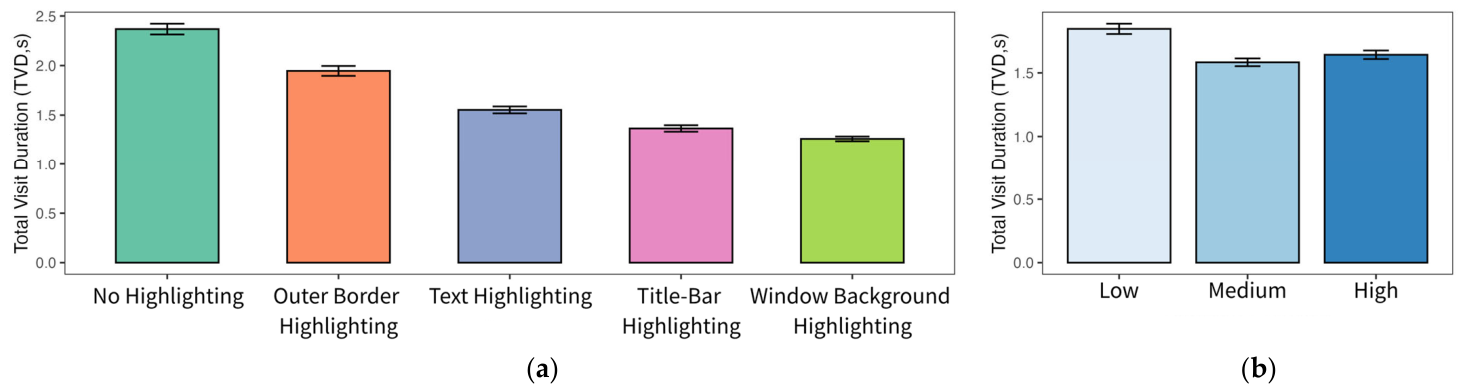
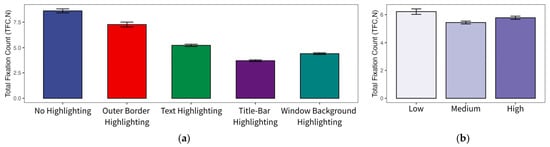
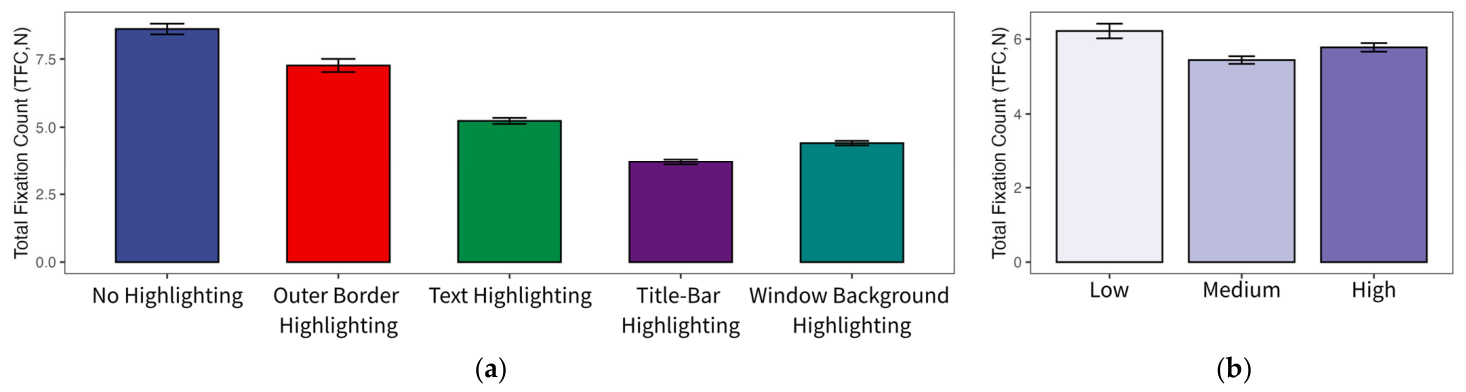
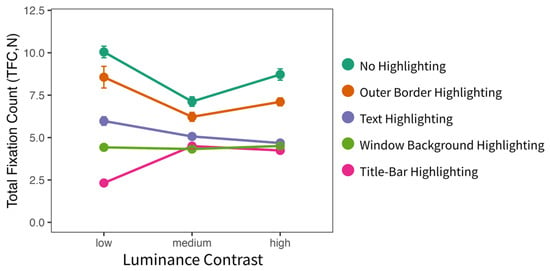
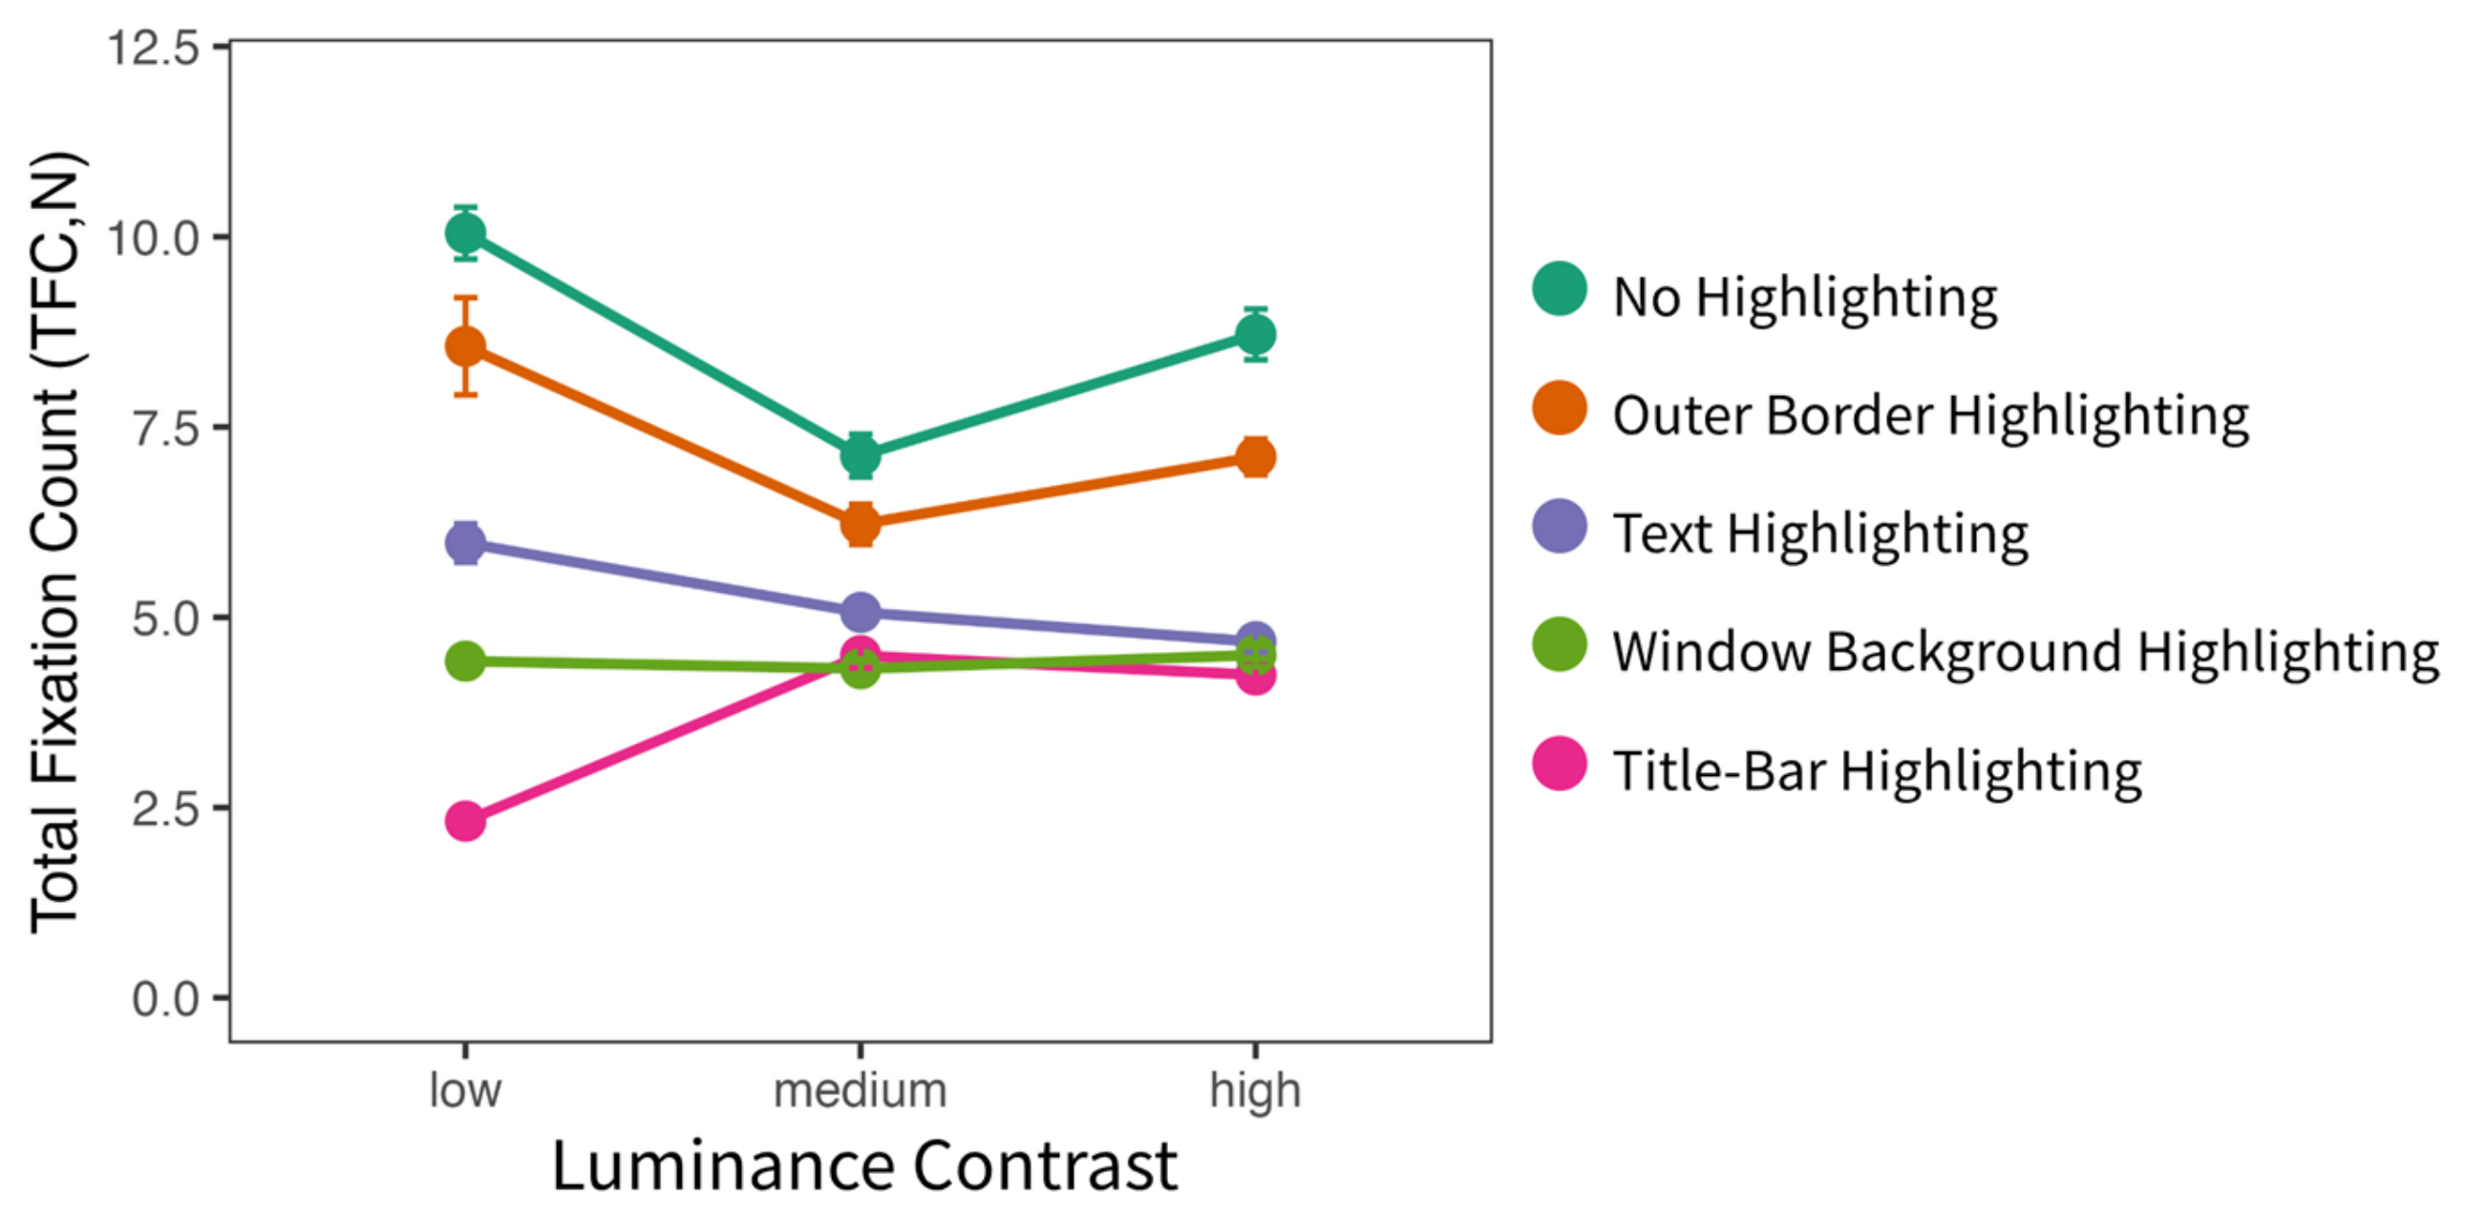
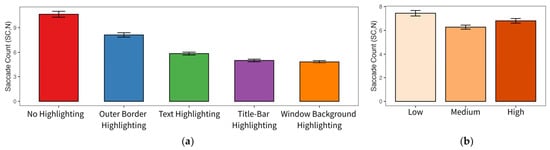
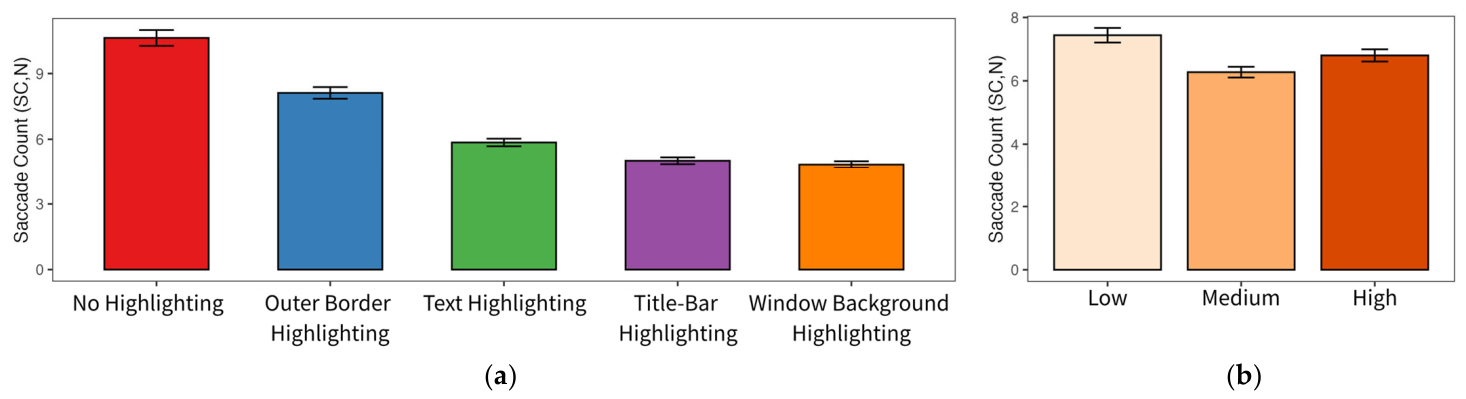
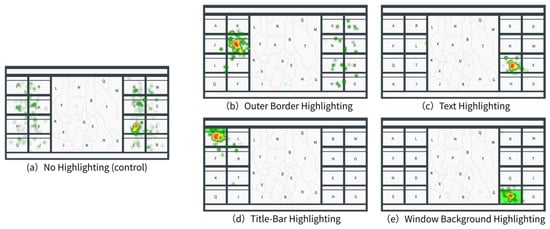
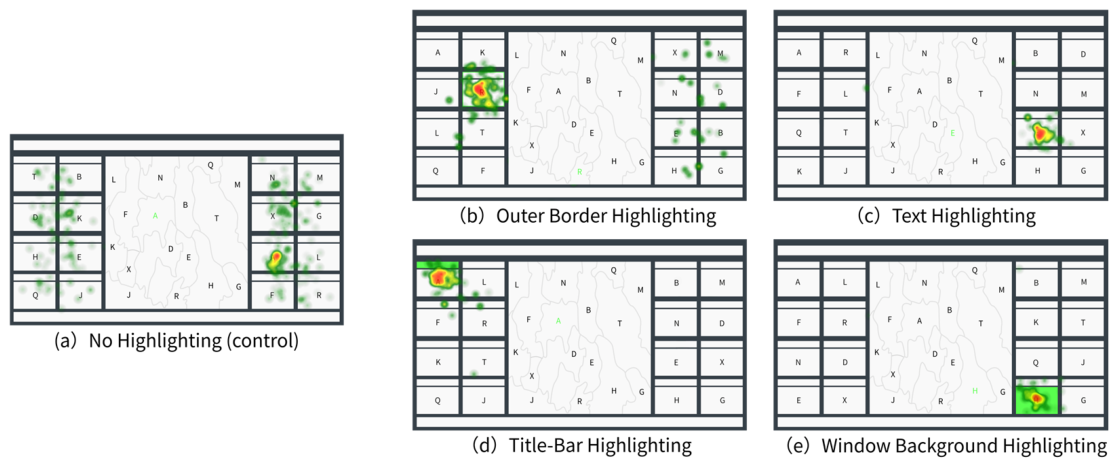
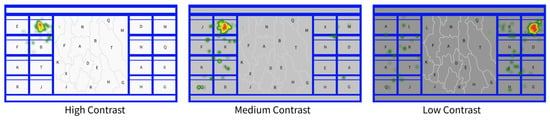
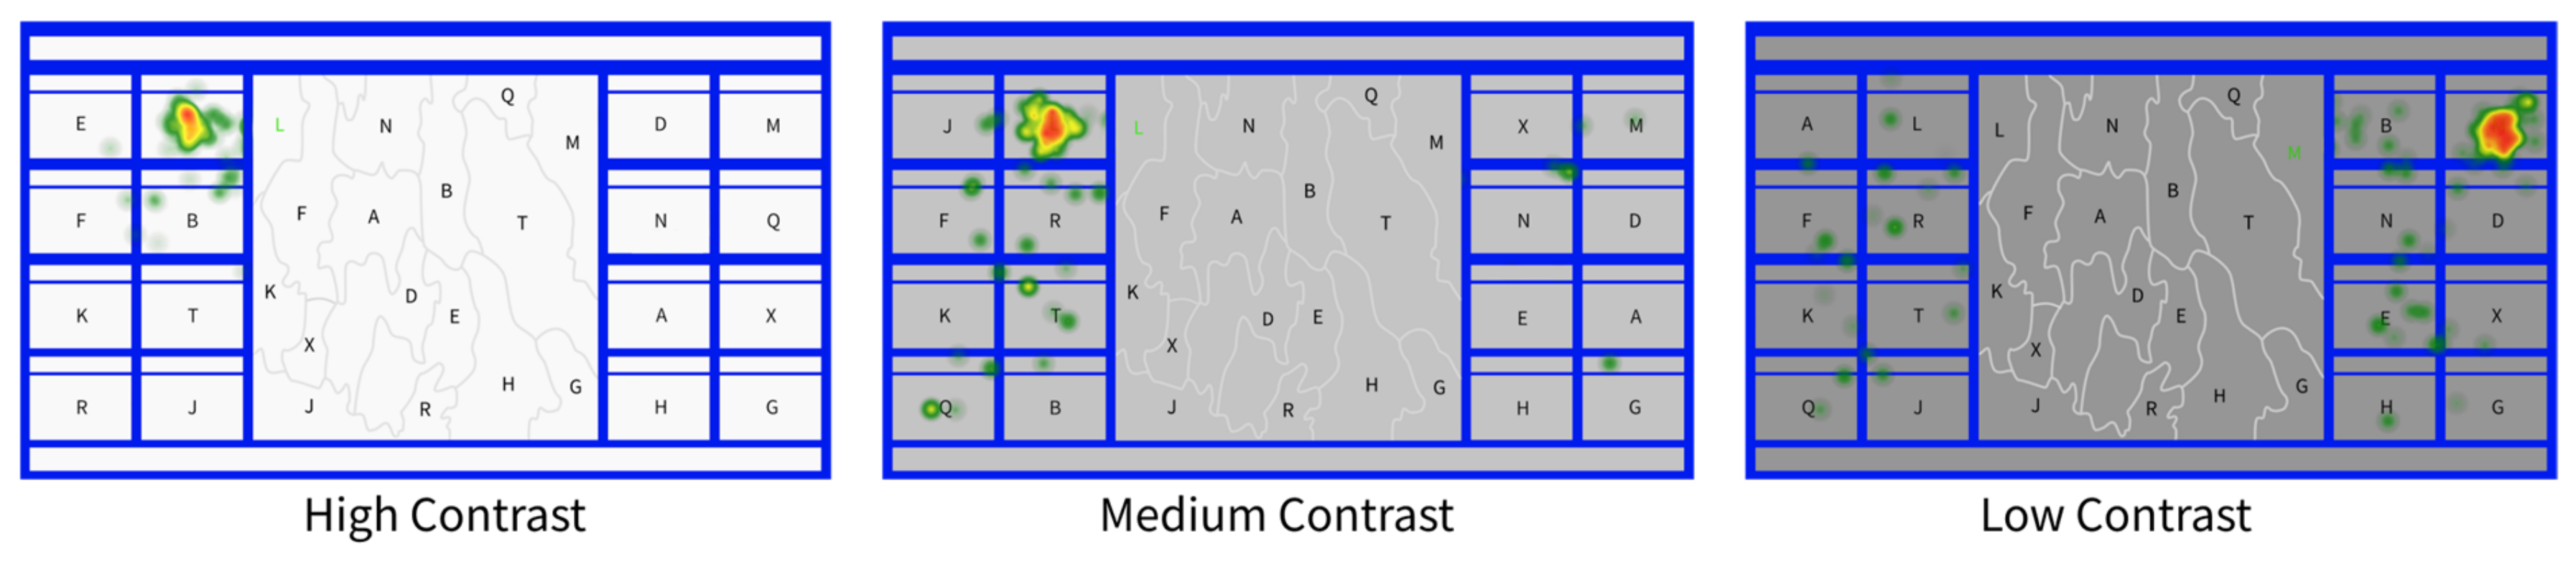
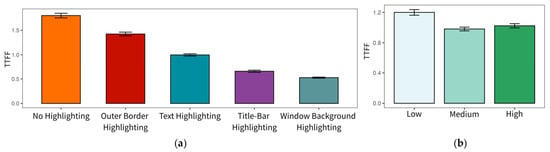
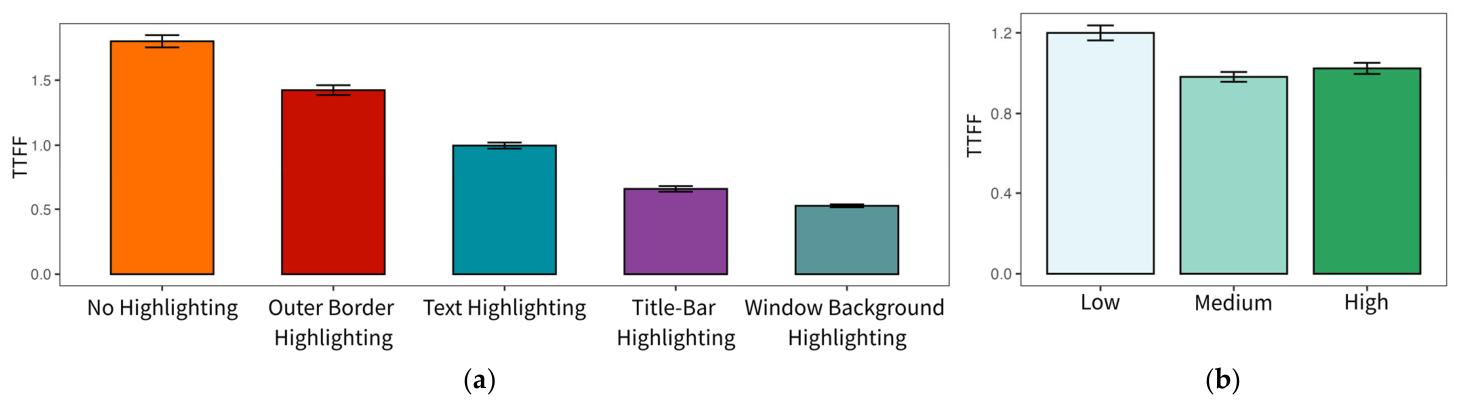

Disclaimer/Publisher’s Note: The statements, opinions and data contained in all publications are solely those of the individual author(s) and contributor(s) and not of MDPI and/or the editor(s). MDPI and/or the editor(s) disclaim responsibility for any injury to people or property resulting from any ideas, methods, instructions or products referred to in the content. |
© 2026 by the authors. Published by MDPI on behalf of the International Society for Photogrammetry and Remote Sensing. Licensee MDPI, Basel, Switzerland. This article is an open access article distributed under the terms and conditions of the Creative Commons Attribution (CC BY) license.