Article

Same Streets, Different Contexts: Personality-Based Differences in Cycling Willingness Revealed from Objective and Subjective Perspectives

1
School of Architecture, Tianjin University, Tianjin 300072, China
2
College of Horticulture and Forestry, Huazhong Agricultural University, Wuhan 430070, China
3
Bartlett School of Architecture, University College London, London NW1 9HZ, UK
*
Author to whom correspondence should be addressed.
ISPRS Int. J. Geo-Inf. 2026, 15(4), 179; https://doi.org/10.3390/ijgi15040179
Submission received: 19 February 2026 / Revised: 12 April 2026 / Accepted: 14 April 2026 / Published: 16 April 2026
(This article belongs to the Special Issue Innovative Mobility Services for Smart Cities)

Abstract

Against the backdrop of rising psychological stress and declining physical fitness in cities, how streetscape characteristics and Myers–Briggs Type Indicator (MBTI) personality traits jointly influence cycling willingness across different contexts remains underexplored. Using Shenzhen, China, as a case study, we integrated objective bicycle-sharing travel records from 2021 and subjective pairwise ratings of 1000 street-view images from 960 participants. Cycling willingness was extrapolated through the TrueSkill algorithm and a ResNet50-based model, while street view elements were extracted via DeepLabV3+ and summarized into five indicators. Multivariate regression and multifactor ANOVA were used to test main and moderating effects across six cycling contexts. Results show that (1) Objective cycling indicators and subjective willingness exhibit a pattern of lower values in the center and higher values in the periphery. (2) The Spatial Green Index, Sky Openness Index, Path Freedom Index, and Facility Accessibility Index are the main influencing factors, while the Interface Enclosure Index has the weakest and most context-dependent effect. (3) Intuition/Feeling traits are more salient in leisure and exploration, Judging/Thinking in fitness and transport, and Extraversion/Feeling in social and companion contexts. These findings provide evidence for optimizing urban street cycling spaces in a multi-context and personality-informed manner.

1. Introduction

Since the late 20th century, bicycle-sharing systems have been promoted worldwide and have rapidly expanded as a low-cost, environmentally friendly, and convenient mode of transport for short urban trips. They are widely regarded as an important component in alleviating traffic congestion and optimizing urban travel structures. By encouraging active travel, bicycle-sharing systems are also believed to increase residents’ levels of physical activity and generate positive health outcomes, contributing to reduced premature mortality and substantial public health benefits [1]. However, with the rapid pace of urban development and the continuous enhancement of motorized travel services, including taxis and ride hailing platforms, travelers have increasingly shifted their preferences toward more convenient motorized modes of transport. Against this backdrop, the frequency of bicycle-sharing use has declined in some cities, suggesting that traditional cycling and other low-carbon travel modes are facing growing substitution pressure. Meanwhile, the continued growth of motorized travel leads to higher energy consumption and carbon emissions, posing challenges to urban environmental quality and sustainable development goals [2]. Therefore, how to enhance individuals’ subjective willingness to engage in cycling through the optimization of urban street environments has become a pressing issue in public health and sustainable urban design research [3].
Existing research has demonstrated that leisure activities are associated with the visual environment [4], and that a well-designed street environment can attract people to engage in outdoor activities [5,6]. However, studies examining the relationship between street environments and public travel choice or willingness have often treated the public as a homogeneous group, or have primarily focused on traditional demographic distinctions such as gender, age, and differences between children and older adults. Recent studies have begun to emphasize that travel decisions are shaped by the joint influence of multiple factors, and that individuals differ substantially in how they prioritize time, convenience, safety, health, emotions, and environmental conditions. As a result, reliance on demographic variables alone is often insufficient to explain such fine-grained heterogeneity [7]. For example, even within the same age or gender group, individuals may exhibit markedly different cognitive styles and levels of environmental sensitivity, leading to divergent preferences regarding street comfort, tolerance for noise and crowding, route exploration tendencies, and acceptance of public transport contexts [8]. Personality traits or types therefore constitute an important complementary set of variables. Evidence from the transport behavior literature indicates that, after controlling for demographic factors such as age, gender, and income, personality traits—such as those captured by the Big Five—retain significant explanatory power for public transport use and cycling frequency, shaping individuals’ choices of travel contexts and their tolerance thresholds [9].
In this context, the Myers–Briggs Type Indicator (MBTI) provides a widely used personality typology framework that classifies individuals into 16 personality types based on four binary dimensions (eight personality traits): Extraversion–Introversion, Sensing–Intuition, Thinking–Feeling, and Judging–Perceiving. Personality traits can capture individual differences that are difficult to identify using demographic variables alone and have demonstrated independent explanatory power in certain travel behavior studies. For instance, extraverted individuals tend to prefer socially engaging and interactive settings, whereas introverted individuals are more inclined toward relatively solitary contexts. Owing to its high recognizability and practical communicability, MBTI has been frequently applied as a heuristic tool for personality stratification, enabling the exploration of differentiated mechanisms through which street elements influence public travel willingness, while also offering a more intuitive user-profiling perspective for planning and design practice [10]. Nevertheless, empirical studies that explicitly incorporate the MBTI framework into research on street environments and public travel choices remain scarce. This gap limits our understanding of how travel willingness varies across personality groups and constrains the development of fine-grained street optimization strategies tailored to diverse users [10].
In addition, although cycling is often defined primarily as a mode of commuting or physical exercise [11], in real-world settings it exhibits pronounced multifunctionality, frequently serving as a substitute for motorized commuting while simultaneously supporting leisure experiences, social interaction, and psychological regulation. Different orientations therefore entail distinct demands on environmental traits: commuting-oriented cycling emphasizes route continuity and travel efficiency, whereas leisure-oriented cycling relies more heavily on landscape quality and environmental comfort. Reducing cycling behavior to a single, homogeneous category risks overlooking the differentiated roles of streetscape visual elements across contexts [12]. Accordingly, it is necessary to adopt a refined behavioral classification framework to systematically identify how street visual elements influence different types of cycling behavior, thereby providing a theoretical basis for multi-context-oriented street optimization strategies.
Given the above considerations, this research takes Shenzhen, a major Special Economic Zone in China, as a case study and addresses three key research questions: (1) How do objective cycling behaviors and subjective cycling willingness differ in their spatial structures? (2) How does cycling willingness vary across MBTI personality types under different cycling contexts? (3) To what extent do street visual elements explain variations in cycling willingness, and how strong are the moderating effects of MBTI personality dimensions? This research aims to provide theoretical support for the optimization of urban street cycling spaces that accommodate multiple contexts and diverse population groups.

2. Literature Review

2.1. The Importance of Cycling for Physical and Mental Health

Cycling is recognized as a convenient, low-cost, and widely accessible form of physical activity. Given its relatively low barrier to participation and its compatibility with daily routines, it has been widely adopted as a mode of everyday exercise and routine travel. Existing research has shown that active commuting behaviors, particularly cycling, are closely associated with a range of physical health benefits. For instance, systematic reviews and meta-analyses have demonstrated that active commuting is linked to reduced risks of obesity, hypertension, and diabetes [13]. Large population-based studies further indicate that active commuting is associated with lower risks of cardiovascular disease and all-cause mortality, and may extend cardiovascular disease-free survival. Cycling to work has also been consistently linked to better self-rated health and lower body mass index [14]. Beyond these general physical health benefits, the potential contribution of cycling to brain health and cognitive function also deserves attention [15]. Evidence suggests that active travel, especially cycling and mixed cycling modes, is associated with a lower risk of all-cause dementia and with greater hippocampal volume, indicating that cycling may help maintain brain structural health and slow cognitive decline.
Beyond its physiological benefits, cycling has also been increasingly recognized for its positive effects on mental health [16]. As an outdoor form of physical activity, cycling not only enhances contact with the natural environment but also creates opportunities for social interaction through commuting, leisure, and community engagement [17]. In addition, both cycling and mixed active commuting have been associated with lower risks of depression and anxiety, with these associations appearing to exhibit a distance–response relationship [18]. This may be particularly relevant during life stages characterized by major transitions, such as retirement, widowhood, or the onset of chronic illness, when individuals may be more vulnerable to emotional instability, fatigue, loneliness, and psychological disequilibrium.

2.2. The Influence of the Built Environment on Cycling Behavior

Existing research generally suggests that the frequency, distance, and continuity of cycling behavior are closely associated with the urban built environment [19,20]. Both objective built-environment characteristics and perceived environmental factors jointly shape cycling flows, and these effects are often nonlinear [21]. Consistent with this, studies on cyclists’ subjective perceptions have shown that willingness to cycle is strongly influenced by perceptions of the street cycling environment, with public safety, traffic safety, and landscape esthetics identified as key dimensions underlying such variation [22]. At the same time, locations with a higher crash risk or those perceived as unsafe can substantially influence route choice, suggesting that disordered traffic conditions, strong perceived threats from motor vehicles, and uncertainty regarding safety all diminish willingness to cycle [23]. Similarly, low-quality, deteriorated, or oppressive street environments may discourage cycling by reducing comfort and weakening visual appeal [24].
By contrast, high-quality public and street-side open spaces are generally considered conducive to cycling. A systematic review found that street greenery positively influences active travel by improving esthetics, comfort, perceived safety, and opportunities for social interaction [25]. It further showed that greenery promotes walking and cycling by enhancing spatial quality and overall environmental experience. In parallel, causal inference studies have shown that vegetation cover significantly encourages cycling, whereas slope constrains it, highlighting the joint role of natural and built environmental characteristics in shaping cycling behavior. Moreover, separated bicycle lanes, clear road markings and traffic signs, smooth pavement, adequate road width, and calm traffic conditions all contribute to a more supportive cycling environment [26].

2.3. The Influence of Social Factors on Cycling Behavior

Beyond the built environment, sociodemographic characteristics and individual psychological traits are also important determinants of cycling behavior. Previous studies have shown that age, gender, educational attainment, income, body weight, and household structure influence whether individuals cycle, as well as their cycling frequency and travel distance [27,28]. In addition, gender differences have been observed in preferences for route characteristics related to cycling convenience [29], while socioeconomically disadvantaged and marginalized groups often face greater barriers associated with infrastructure quality and traffic safety [30]. Cycling purpose is another important factor shaping cycling behavior. Existing research indicates that the determinants and motivations of cycling, as well as other forms of active travel, vary across trip purposes rather than remaining constant between commuting and non-commuting contexts. Evidence from European cities further suggests that both individual and contextual factors exert purpose-specific effects. Although the motivations for choosing cycling share certain common features across purposes, their relative importance differs [28]. Nevertheless, most studies continue to treat cycling as a broad and undifferentiated behavior, and purpose-specific analyses remain limited.
In recent years, the role of psychological characteristics in cycling behavior has also received growing attention. Compared with traditional sociodemographic variables, psychological and sociocultural factors have shown independent explanatory value in some studies [31]. Using German national panel data, one study found that conscientiousness, extraversion, agreeableness, and neuroticism in the Big Five framework were associated with e-bicycle ownership, suggesting that personality may shape cycling-related decisions through preferences, lifestyle, and satisfaction [32]. Research on sensation seeking in urban cycling likewise suggests that understanding cyclists’ psychosocial characteristics is important for promoting safe and sustainable cycling [33]. Nevertheless, existing research on this topic remains limited, thereby constraining both theoretical advancement and practical application.

3. Study Area and Data Source

3.1. Study Area

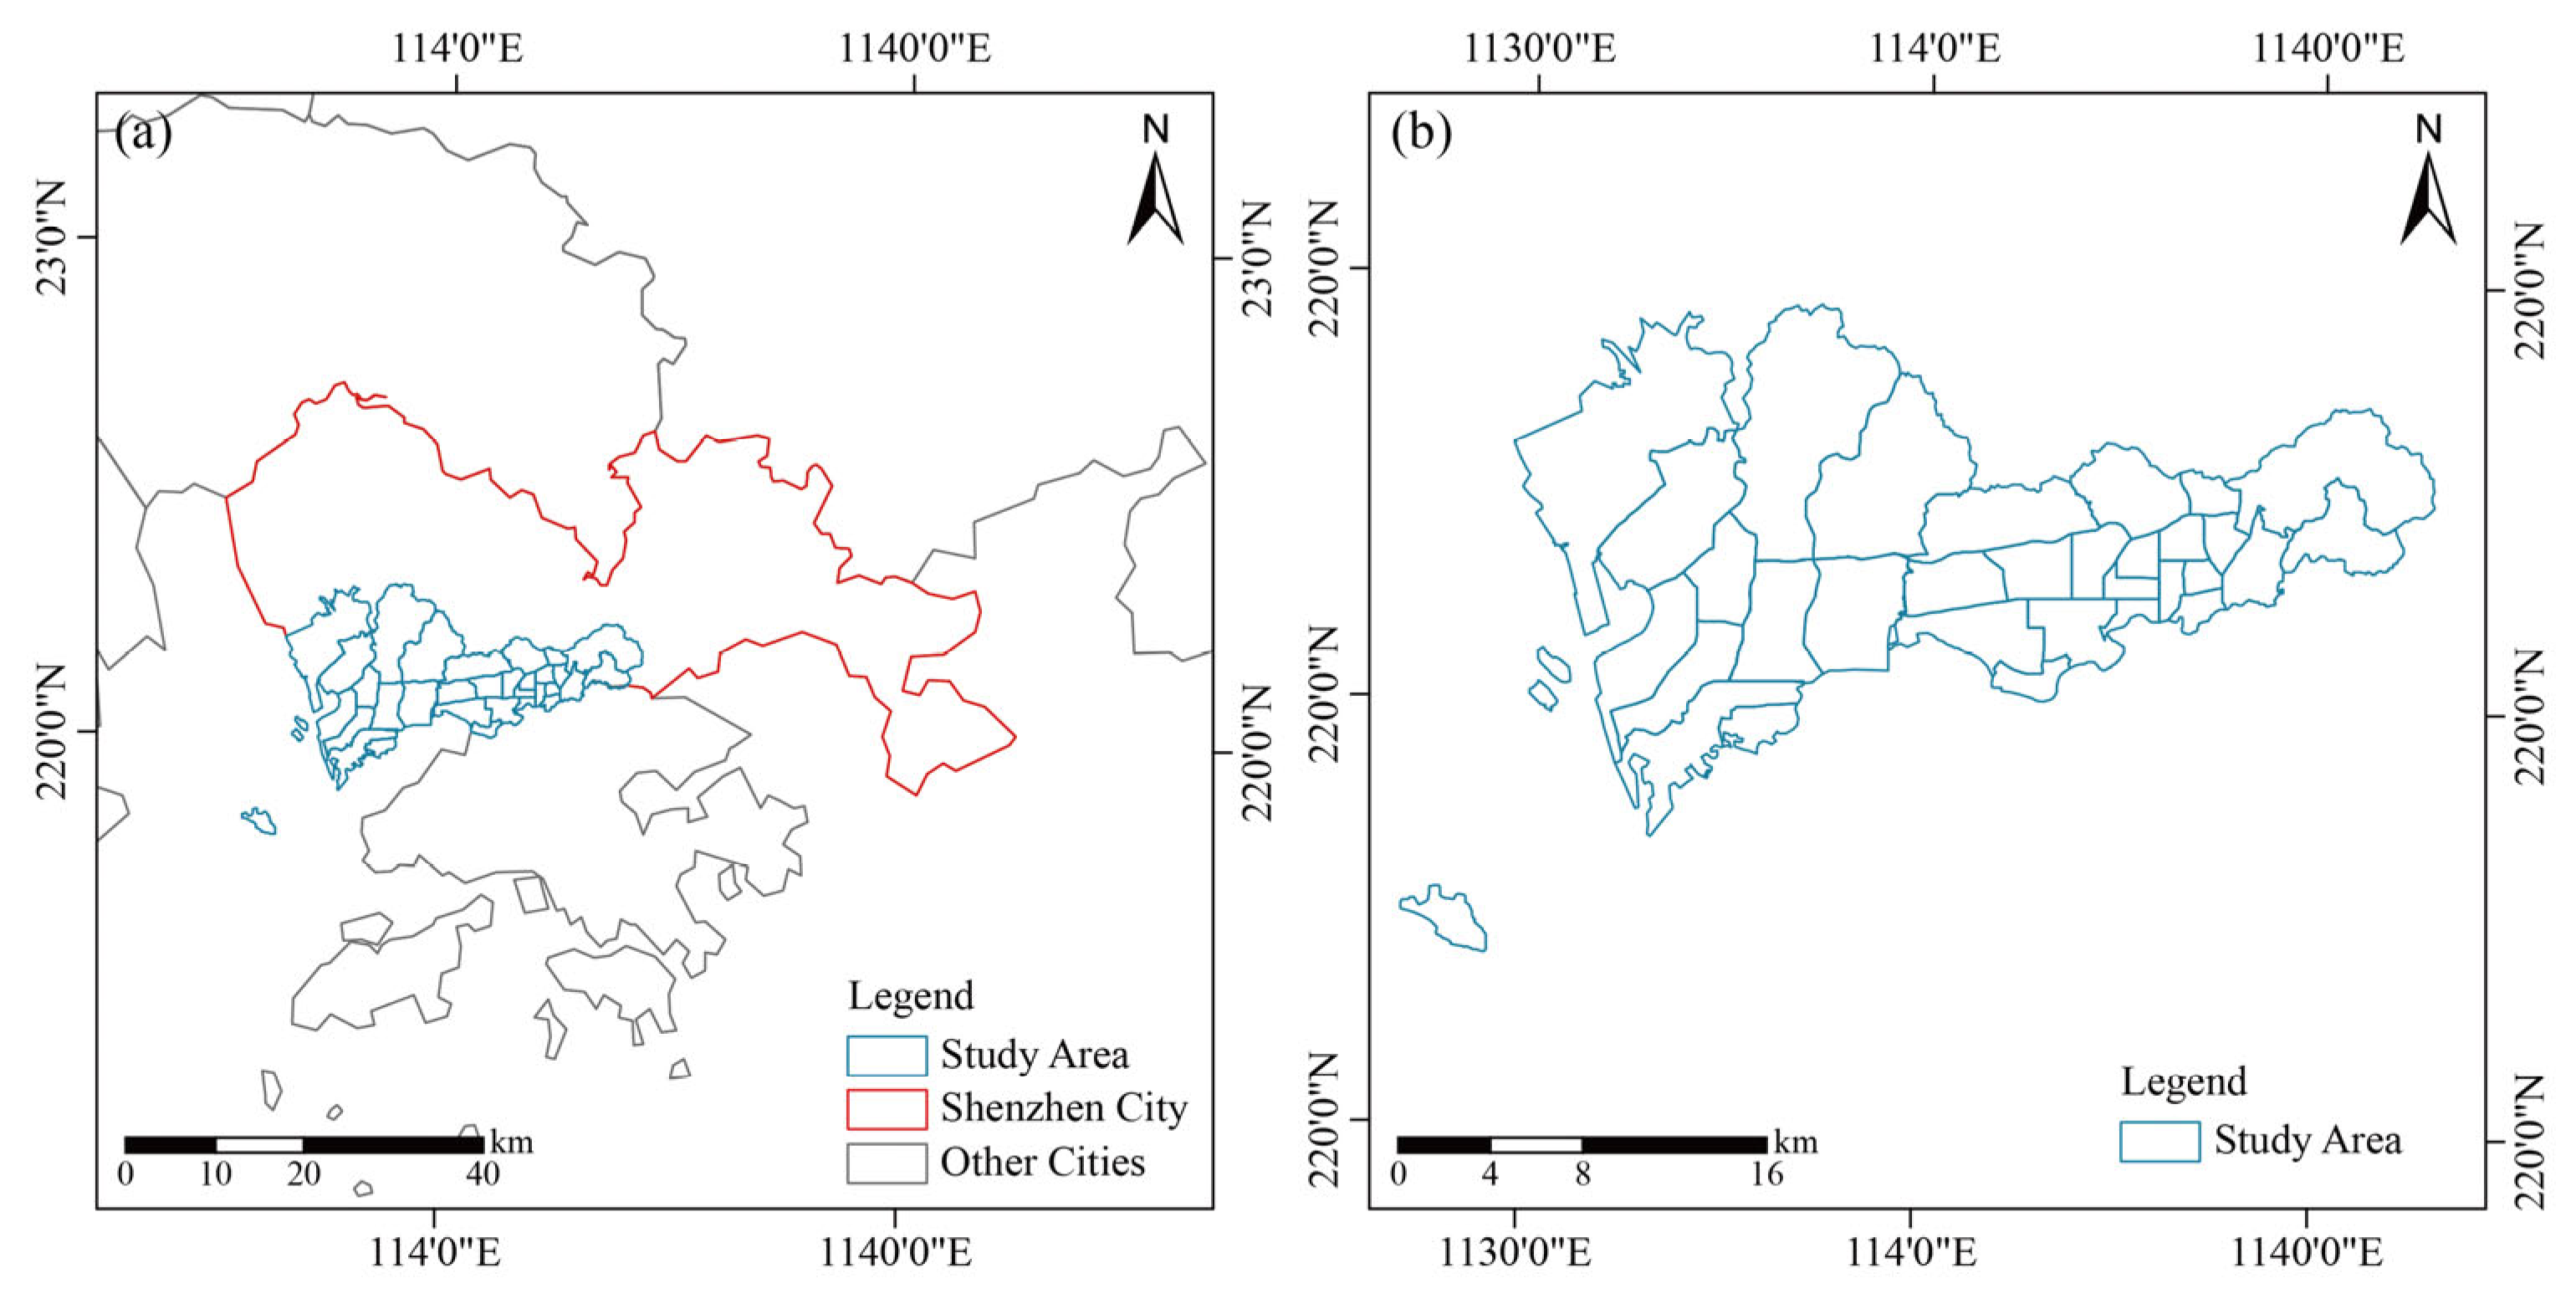
Shenzhen is a prefecture-level city in Guangdong Province, a sub-provincial city, a municipality with independent planning status, and a megacity in China, serving as the core city of the Shenzhen metropolitan area [34] (see Figure 1a). Currently, Shenzhen administers nine municipal districts with a permanent population of 17.99 million, among which Futian, Luohu, and Nanshan constitute the traditional central areas. The urban area of Shenzhen (see Figure 1b) was selected as the study area mainly because of its dual advantages in practical conditions and data availability. As a Special Economic Zone and a megacity in China, Shenzhen, especially its urban area, has a relatively high level of street construction and distinctive urban landscape characteristics, providing a strong foundation for research on the visual perception of street environments. At the same time, its fast-paced work and lifestyle, along with substantial physical and psychological stress, create stronger demands among residents for outdoor cycling as a form of health promotion and leisure [35]. In addition, bicycle-sharing is widely used and broadly distributed across Shenzhen, making it possible to obtain relatively complete cycling trajectory data [36]. More importantly, among Chinese cities where bicycle-sharing-related data are currently accessible, only a few major cities such as Shenzhen, Shanghai, and Beijing are represented, and the available data for Shenzhen are relatively the most recent. Therefore, Shenzhen is a more suitable empirical setting for this research.

3.2. Data Source

3.2.1. Shared Bicycle Travel Data

The shared bicycle travel data used in this research were obtained from the Shenzhen Municipal Government Open Data Platform. The dataset was provided by several free-floating bicycle-sharing companies, including Mobike, Ofo, Bluegogo, Ubike, and Xiaoming. It contains the latitude and longitude coordinates of trip origins and destinations, together with unique order IDs and the corresponding start and end times [35]. Data were collected for 12 April 2021 (weekday) and 25 April 2021 (weekend). Weather conditions during these periods were predominantly sunny or cloudy, and air quality remained favorable with low levels of pollution, thereby minimizing the potential influence of adverse environmental conditions, such as heavy rain, strong winds, or poor air quality.
Based on the start and end times and spatial coordinates of each bicycle-sharing order, several indicators were calculated for individual trips, including cycling distance, cycling duration, and cycling speed. First, travel distance was estimated as the shortest feasible cycling route on the street network rather than the spherical straight line distance between trip origins and destinations. Specifically, OpenStreetMap road network data were used to construct a bicycle accessible transport network for the study area. For each trip, the origin and destination coordinates were matched to their nearest nodes on the cycling network, and the shortest path distance between the two nodes was then computed by minimizing total edge length along the network. This procedure yields a network-constrained measure of cycling distance that more closely reflects actual travel conditions than Euclidean or great circle distance approximations. To ensure analytical accuracy, data-cleaning procedures proposed by Lv et al. [37] were applied, and trips with travel distances shorter than 100 m or durations shorter than 1 min were excluded to reduce errors caused by bicycle malfunctions or global positioning system (GPS) drift. Second, trip start and end times were standardized and the cycling duration was computed as the difference between them, expressed in minutes. Based on these measures, cycling speed was defined as the ratio of cycling distance to cycling duration (converted to hours), with units of kilometers per hour (km/h). In addition, the number of trip origins within the same street segment was aggregated and used as an indicator of cycling volume for subsequent analyses.

3.2.2. Street View Image Data

The street network data for 2021 were obtained from the OpenStreetMap (OSM) platform through the National Earth System Science Data Center (https://noda.ac.cn/datasharing/datasetDetails/62725e6a4984d37e565d7989) (accessed on 23 January 2026). These data were used as the spatial basis for subsequent street-view image acquisition. OSM provides high positional accuracy and a well-developed topological structure, including essential spatial traits such as road names, classifications, and geographic coordinates, thereby offering reliable support for the precision and comprehensiveness of street-level analysis [38]. Street-view images were collected using web-crawling scripts developed in Python 3.11.9 in conjunction with the Baidu Maps Open Platform API. Access was obtained through a personally authenticated developer account, and all data acquisition and usage complied with the Terms of Service and Street View usage regulations of the Baidu Maps Open Platform. Following previous studies [34,39], sample points were generated at regular 100 m intervals, and panoramic street view images from 2021 were collected at each sampling location. A total of 18,746 sampling points were initially generated, of which 1479 were excluded during cleaning, leaving 17,267 valid points (92.11%), which was considered sufficient for subsequent analysis.

4. Method

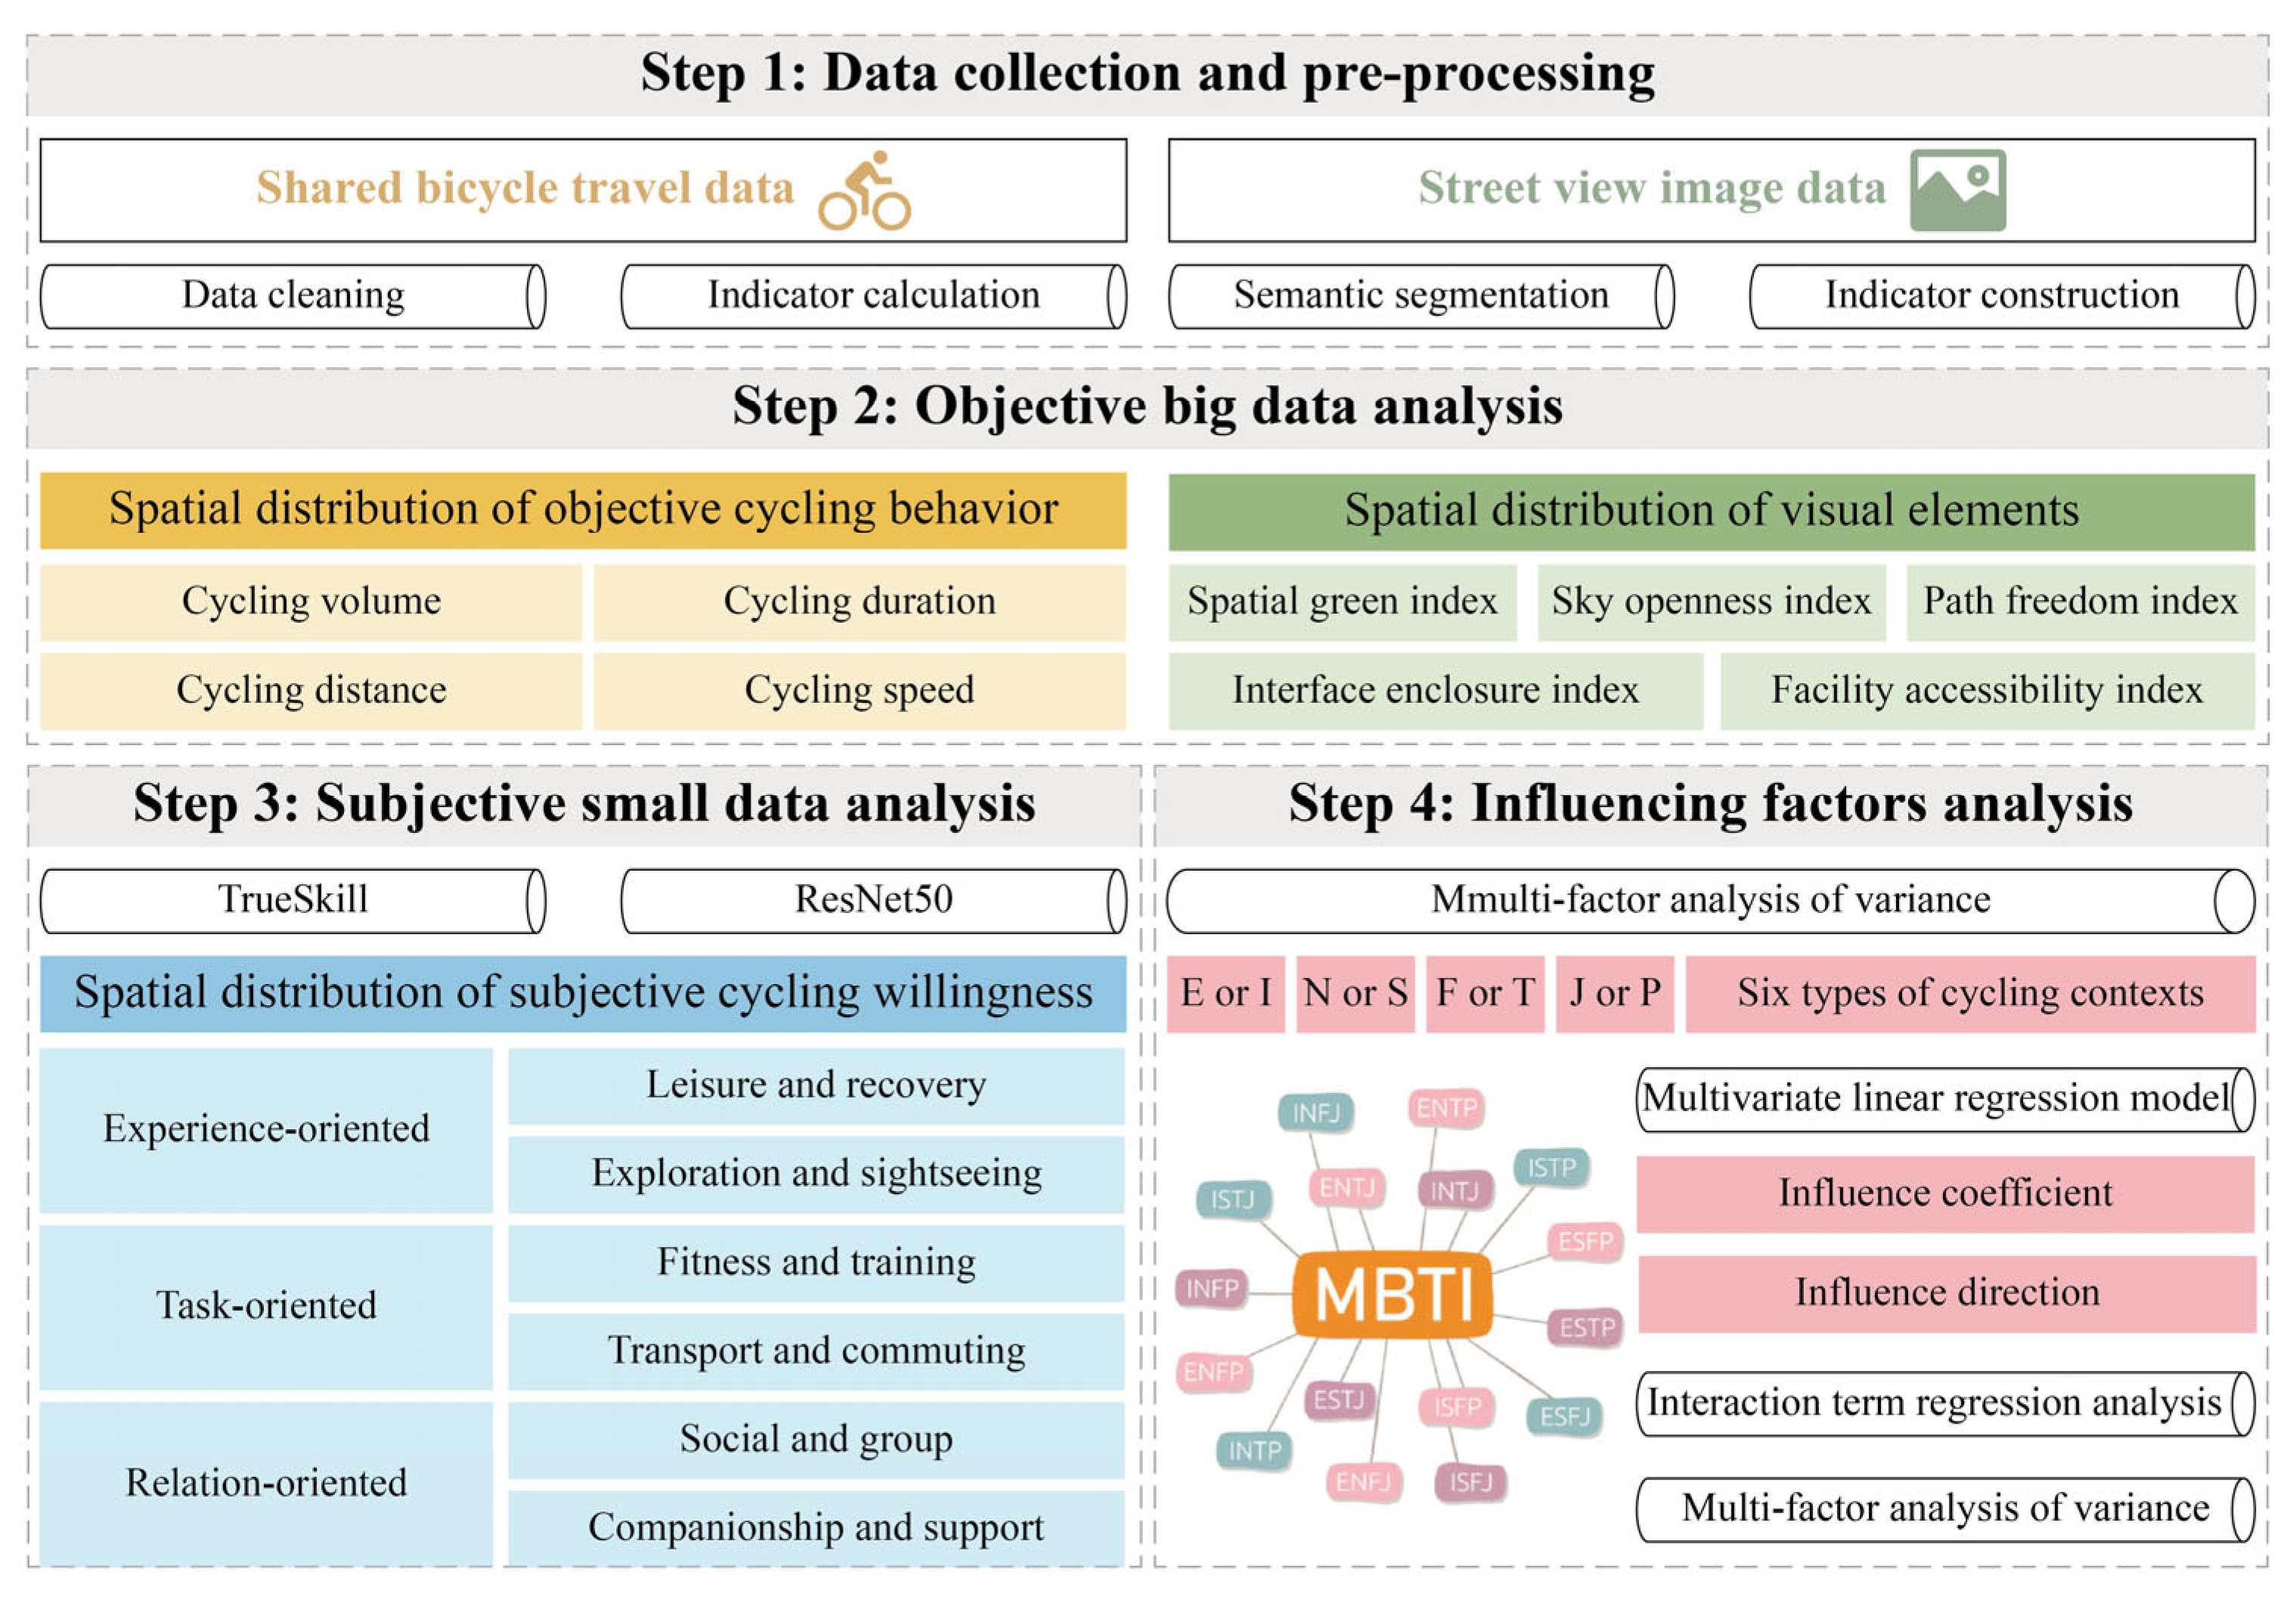
This research consists of four main steps (see Figure 2). First, shared bicycle travel data and street view image data are collected. Second, objective measurements of street characteristics and cycling activity were conducted using big data. Third, TrueSkill was used to derive subgroup-specific willingness scores, which were then used to train separate ResNet50 classifiers for each context-by-personality subgroup. Finally, by integrating the results of both objective and subjective measurements, the research systematically analyzes the mechanisms through which street spatial elements and individual characteristics influence cycling behavior.

4.1. Semantic Segmentation

A DeepLabV3+ semantic segmentation model pretrained on the open-source Cityscapes dataset was implemented on the Python 3.11.9 platform, with model parameters optimized using a grid search approach. Building upon the original DeepLabV3 architecture, DeepLabV3+ incorporates an additional decoder module to form an efficient encoder–decoder framework, enabling accurate identification of object boundaries and geometric features in complex street scenes while maintaining computational efficiency. The Cityscapes dataset provides fine-grained annotations for more than 30 categories of street elements, including roads, vehicles, and vegetation.

4.2. Indicator Construction

Based on existing research on street space quality [40,41,42] and the specific environmental characteristics of the urban area, and considering the instantaneous nature of street view image sampling, we excluded social factors like vehicles and pedestrians and focused solely on stable and reproducible spatial visual elements. Accordingly, five indicators were selected to evaluate street space quality (see Table 1): Spatial Green Index (SGI) [43], Sky Openness Index (SOI) [44], Interface Enclosure Index (IEI) [45], Path Freedom Index (PFI) [46] and Facility Accessibility Index (FAI) [47].

4.3. Willingness Scoring

Using Python 3.11.9 as the programming environment, a subjective evaluation system for street view images was developed based on the TrueSkill algorithm [48]. All participants completed an online MBTI assessment for screening purposes to ensure the validity and consistency of personality type classification. Compared with the Big Five framework, the dichotomous dimensions of MBTI enable clearer and more operational population segmentation, which helps identify differences in environmental perception and behavioral responses across groups, while also facilitating model training, result interpretation, and subsequent policy translation.
A total of 960 participants were recruited, with each of the 16 MBTI types represented by 60 individuals, and with overall balance maintained in terms of gender and age. All respondents were recruited from the urban area of Shenzhen, and their places of residence were relatively evenly distributed across different districts. A between-subjects experimental design was adopted, whereby each participant took part in pairwise comparison tasks for only one cycling context, in order to avoid fatigue and carryover effects associated with evaluating all six contexts sequentially. Participants of each MBTI type were randomly assigned to six context groups (n = 10 per group), corresponding to the six cycling contexts shown in Table 2. This ensured that each context group included 160 participants, with 10 participants from each of the 16 MBTI types. All participants had normal or corrected-to-normal vision, reported no color blindness or color vision deficiency, and provided informed consent prior to the experiment. Data were collected anonymously and used exclusively for scientific research purposes.
During the experiment, each group was asked to perform pairwise comparisons of two street view images randomly displayed on the interface, following a predefined question corresponding to the assigned cycling context. A total of 1000 street view images were first sampled to construct 500 unique image pairs. The same pair pool was used across all six cycling contexts. Within each MBTI-by-context subgroup, 10 participants each completed 50 randomly assigned pairwise comparisons without replacement at the individual level, resulting in 500 judgments per subgroup and 48,000 judgments in total across 96 subgroups. Each image pair was rated by multiple participants across subgroups, enabling subgroup-specific TrueSkill estimation.
The evaluation questions were as follows: (1) Leisure and recovery: When you wish to relax and relieve stress through cycling, in which of the following street environments would you be more willing to cycle? (2) Exploration and sightseeing: When you aim to explore the city and enjoy the surrounding scenery while cycling, in which street environment would you be more willing to cycle? (3) Fitness and training: When you use cycling as a form of daily exercise, in which street environment would you be more willing to cycle? (4) Transport and commuting: When you plan to substitute cycling for your daily commute, in which street environment would you be more willing to cycle? (5) Social and group: When you cycle with friends for social interaction, in which street environment would you be more willing to cycle? (6) Companionship and support: When you cycle to accompany others or provide support, in which street environment would you be more willing to cycle? Participants made their choices based on subjective willingness by selecting the left image, the right image, or indicating no preference between the two. Participants were instructed to make judgments based on their general willingness to cycle in the presented context, without considering immediate time constraints. In addition, the MBTI assessment was administered in a standardized indoor environment for all participants. The evaluation conditions were kept consistent across individuals, including adequate lighting and the absence of noticeable noise or unpleasant odors, thereby minimizing the potential influence of environmental disturbances on the assessment process.
After the subjective evaluation of all 1000 street view images was completed, the pairwise comparison results were aggregated and averaged, and relative ranking scores for each image were derived within the TrueSkill framework under 96 combinations formed by six contexts and 16 personality groups [49].

4.4. Model Prediction

Given the absence of readily available labeled datasets for different MBTI personality types and the impracticality of manually annotating tens of thousands of street view images, we adopted a methodological framework that combines small-scale manual labeling with large-scale model prediction. This approach is consistent with that used in previous studies, such as Zhu et al. [50], for scaling perceptual assessment from limited human-labeled samples to large image datasets.
The TrueSkill framework was implemented separately for each context and MBTI subgroup to estimate cycling willingness scores for the evaluated street view images, resulting in 96 sets of scores per image. These subgroup-specific scores were then used as training data to develop ResNet50 models [51,52], which were selected for their robust and stable performance in image classification tasks. The trained models were subsequently used to predict cycling willingness scores for the remaining street view images that had not been directly evaluated [53]. Specifically, the pairwise comparison outcomes were first converted into Q scores [52]. Images with intermediate Q scores were subsequently excluded, and the remaining images were labeled as positive or negative to form binary classification labels. The specific formulations are given in Equations (1) and (2):
Q h i g h = Q ¯ + σ
Q l o w = Q ¯ σ
where Q ¯ denotes the mean Q score of all images, and σ represents the standard deviation. Images with Q scores higher than Q h i g h or lower than Q l o w were labeled as positive or negative samples, respectively.
For model training, an ImageNet-pretrained ResNet50 was adopted as the backbone network, with the final fully connected layer replaced by a binary classifier. All street view images were resized to 2048 × 664 pixels and normalized before being randomly divided into training, validation, and test sets at a ratio of 70:15:15. The model was trained using the Adam optimizer, with an initial learning rate of 0.0001, a batch size of 32 and 50 epochs. The predicted probabilities of cycling willingness (ranging from 0 to 100%) obtained from the trained model were subsequently mapped onto a 0–10 scoring scale.
Based on the processed data, prediction accuracy during each iteration was quantified by comparing predicted values with ground truth using categorical cross-entropy loss ( L c ) and classification accuracy ( Acc ). Ultimately, in the ResNet50 model, the L c of the training set gradually decreased from an initial value of 0.81 to 0.04, while the Acc increased from 0.33 to 0.95. For the test set, the L c decreased from 0.70 to 0.03, and the Acc increased from 0.29 to 0.93, all indicating good model performance. Moreover, model performance was evaluated using AUC, precision, recall, and F1 score, while the confusion matrix was used to examine potential classification bias between high and low willingness samples. Generalizability was assessed through five-fold cross-validation, and probabilistic reliability was evaluated using calibration curves and the Brier score. A threshold sensitivity analysis was further conducted by reconstructing the labels using ±0.5σ, ±1σ, and ±1.5σ and retraining the model. The results showed minimal variation across folds, stable AUC and F1 score values, no evident systematic misclassification, and good calibration with a low Brier score. The main findings also remained largely unchanged under alternative threshold settings, confirming the robustness and reliability of the proposed framework.

4.5. Influencing Factors

To identify the mechanisms through which street environmental elements influence cycling willingness, this research constructs multivariate linear regression models for each of the six cycling contexts. Cycling willingness is specified as the dependent variable, while the streetscape visual indicators—SGI, SOI, IEI, PFI, and FAI—are included as independent variables to estimate their main effects and to compare their relative contributions while controlling for other elements. Building on this framework, interaction terms between street elements and MBTI personality dimensions are incorporated to examine whether personality traits moderate the relationships between streetscape features and cycling willingness. Interaction-based regression analyses are then used to assess moderating effects and to characterize differences in sensitivity to street visual elements across personality groups.

4.6. Statistical Analysis

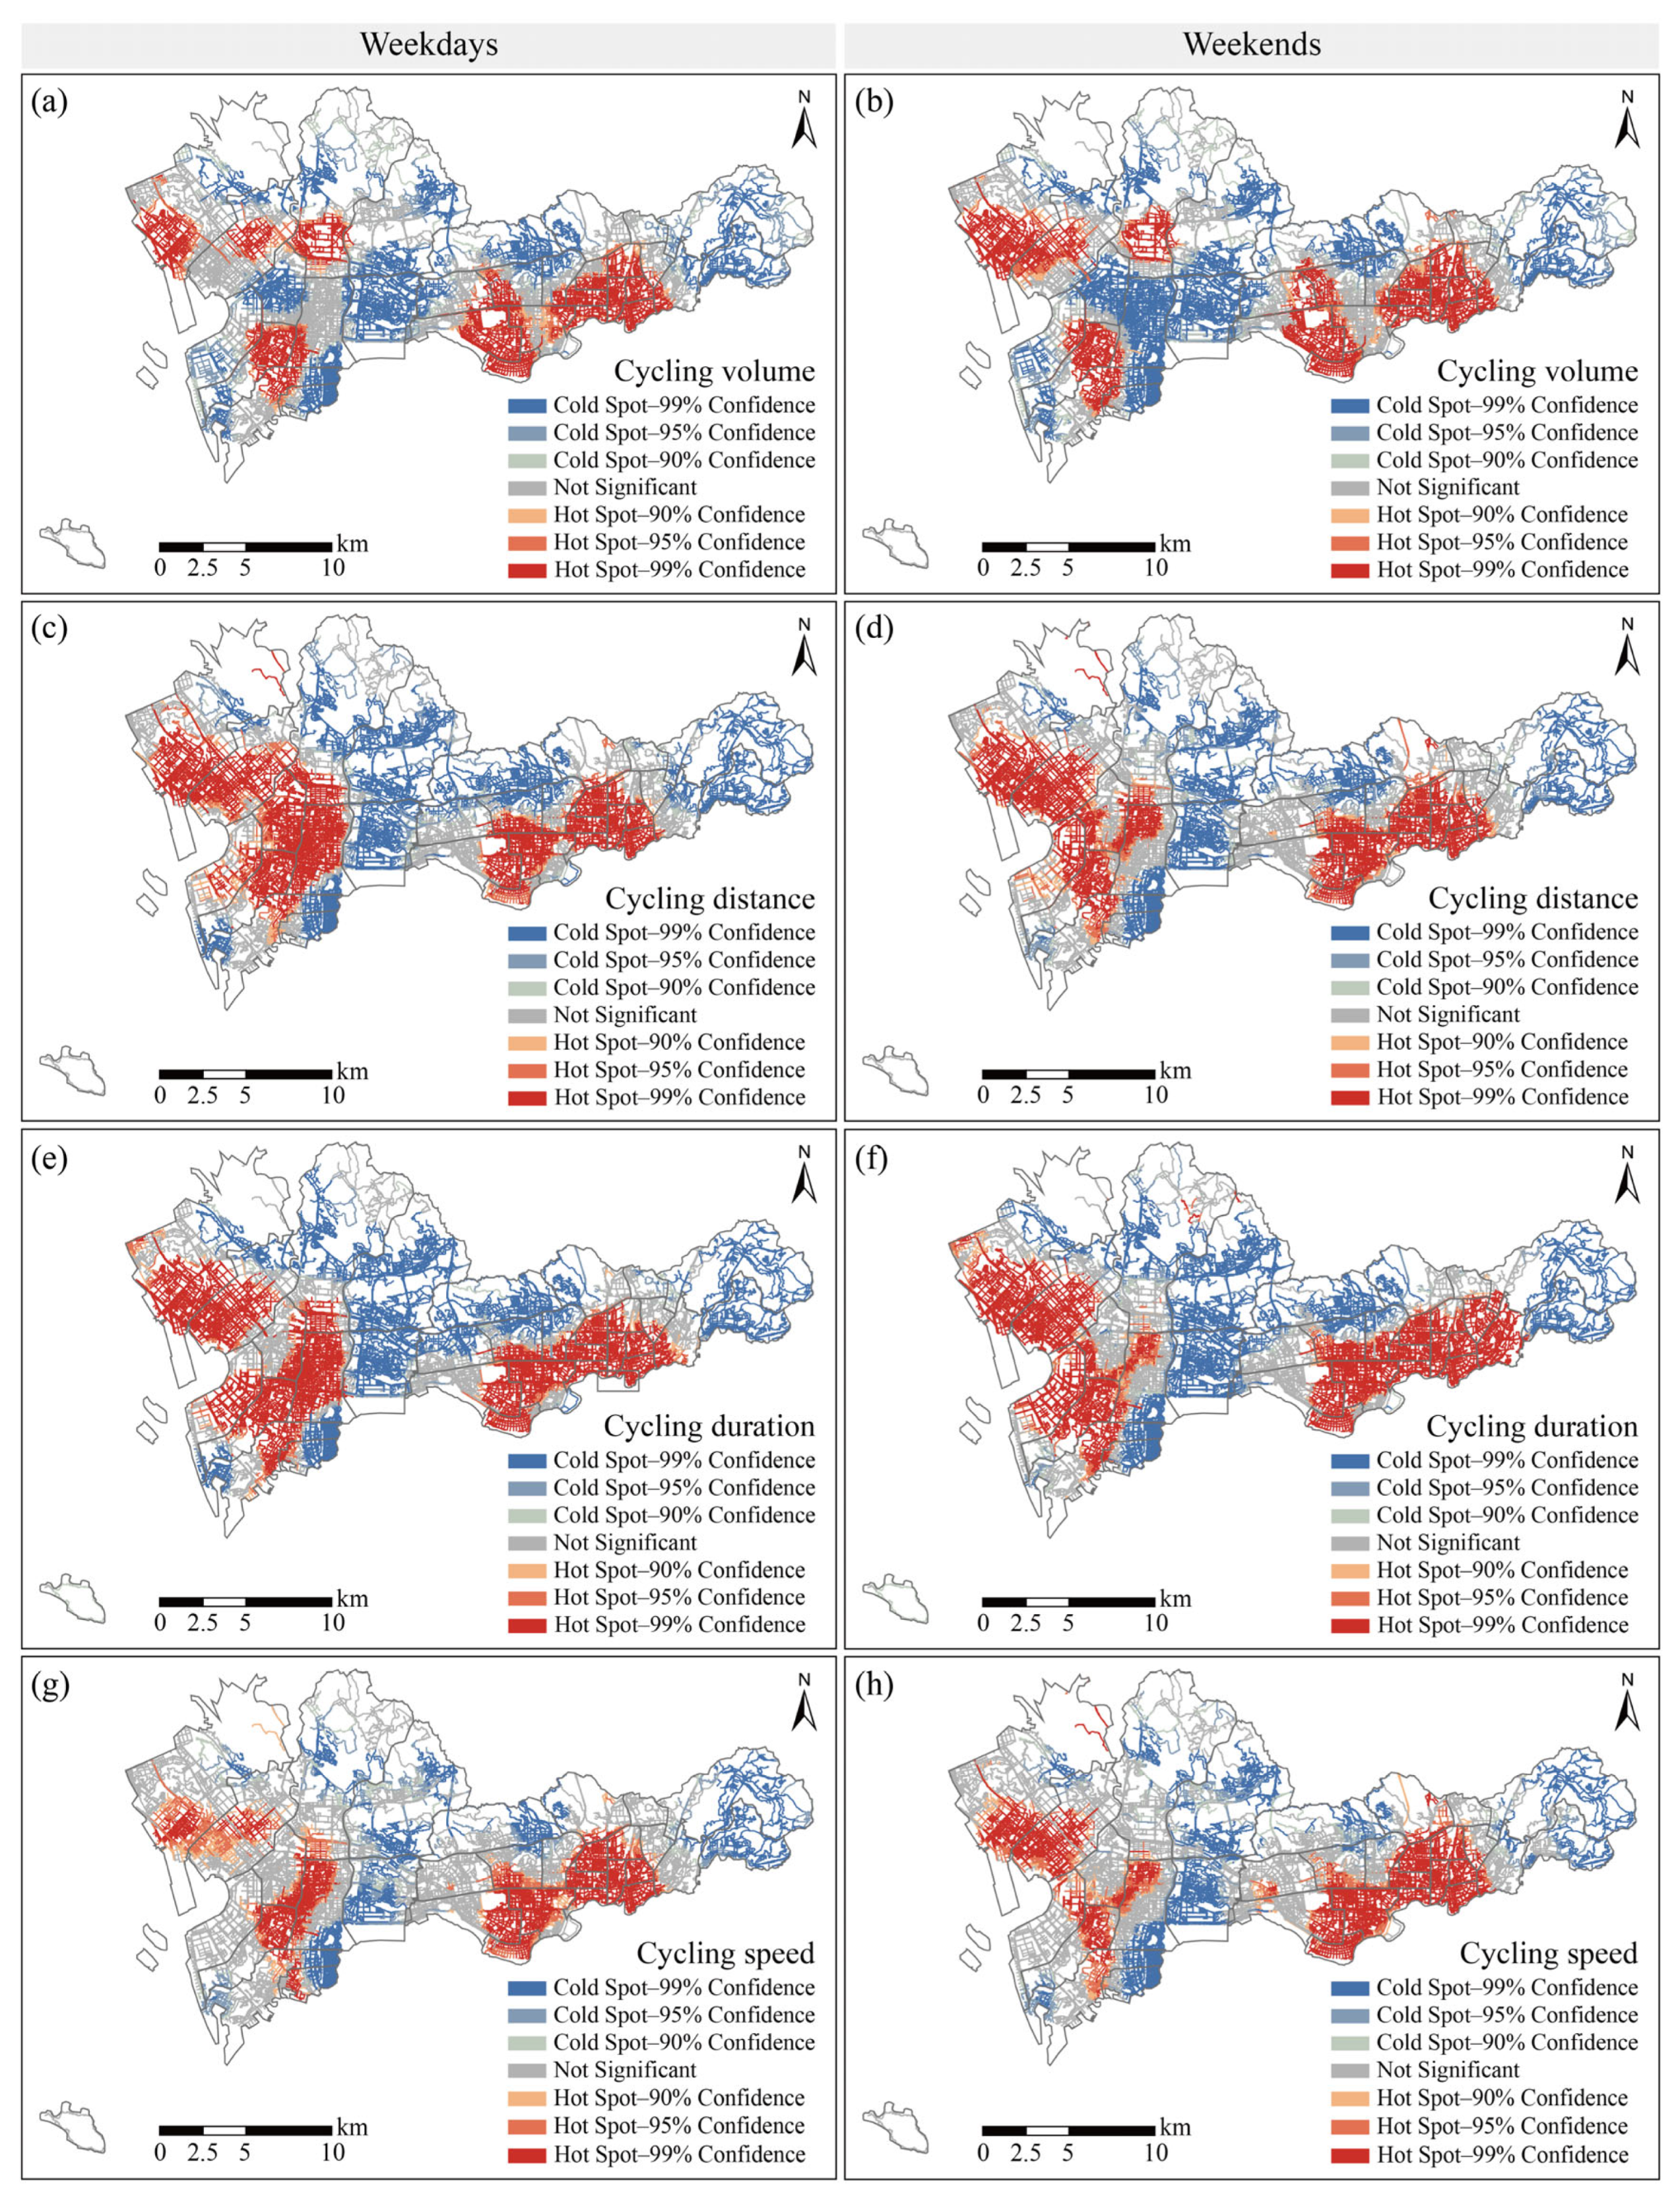
To examine the potential spatial dependence of cycling volume, Global Moran’s I was first employed to test the overall spatial autocorrelation. The results show that the Global Moran’s I values for cycling volume, cycling duration, cycling distance, and cycling speed are 0.284, 0.241, 0.219, and 0.127, respectively, with corresponding Z-scores of 11.37, 9.86, 8.94, and 5.42, all significant at p < 0.001. These findings indicate significant positive spatial autocorrelation for all four indicators. On this basis, Getis-Ord Gi hotspot analysis was further conducted to identify the locations of significant high- and low-value clusters and to generate the hot and cold spots maps.
A multifactor analysis of variance (ANOVA) was conducted to test whether cycling willingness differed significantly across the six cycling contexts and four MBTI dimensions. Because each participant completed 50 pairwise comparison tasks within one assigned context, the responses were first aggregated at the participant level. Specifically, the 50 judgments completed by each participant were summarized into a participant-level willingness tendency score, which served as the dependent variable in the ANOVA. Therefore, the unit of analysis was the participant (n = 960), rather than the individual pairwise judgment. Cycling context and the four MBTI dimensions (E/I, S/N, T/F, and J/P) were included as fixed factors to examine their main effects. This dimensional approach was adopted because the 16 MBTI types can be decomposed into four binary dimensions, allowing clearer interpretation of personality-related differences in cycling willingness.
Prior to model estimation, the assumptions of normality and homogeneity of variance were tested using the Shapiro–Wilk test and Levene’s test, respectively. In all cases (see Table 3), p-values exceeded 0.05, indicating that the data met the assumptions required for ANOVA. As shown in Table 3, the four MBTI dimensions all exhibited significant main effects on cycling willingness, including E/I (F = 17.01), S/N (F = 4.57), T/F (F = 10.43), and J/P (F = 6.30). Among these, the E/I dimension showed the largest between-group variation (sum of squares = 238.14). Cycling context also exerted a strong main effect (F = 89.99), indicating substantial variation in cycling willingness across different situational settings. The mean square error was 14.00.

5. Results

5.1. Spatial Distribution of Visual Elements

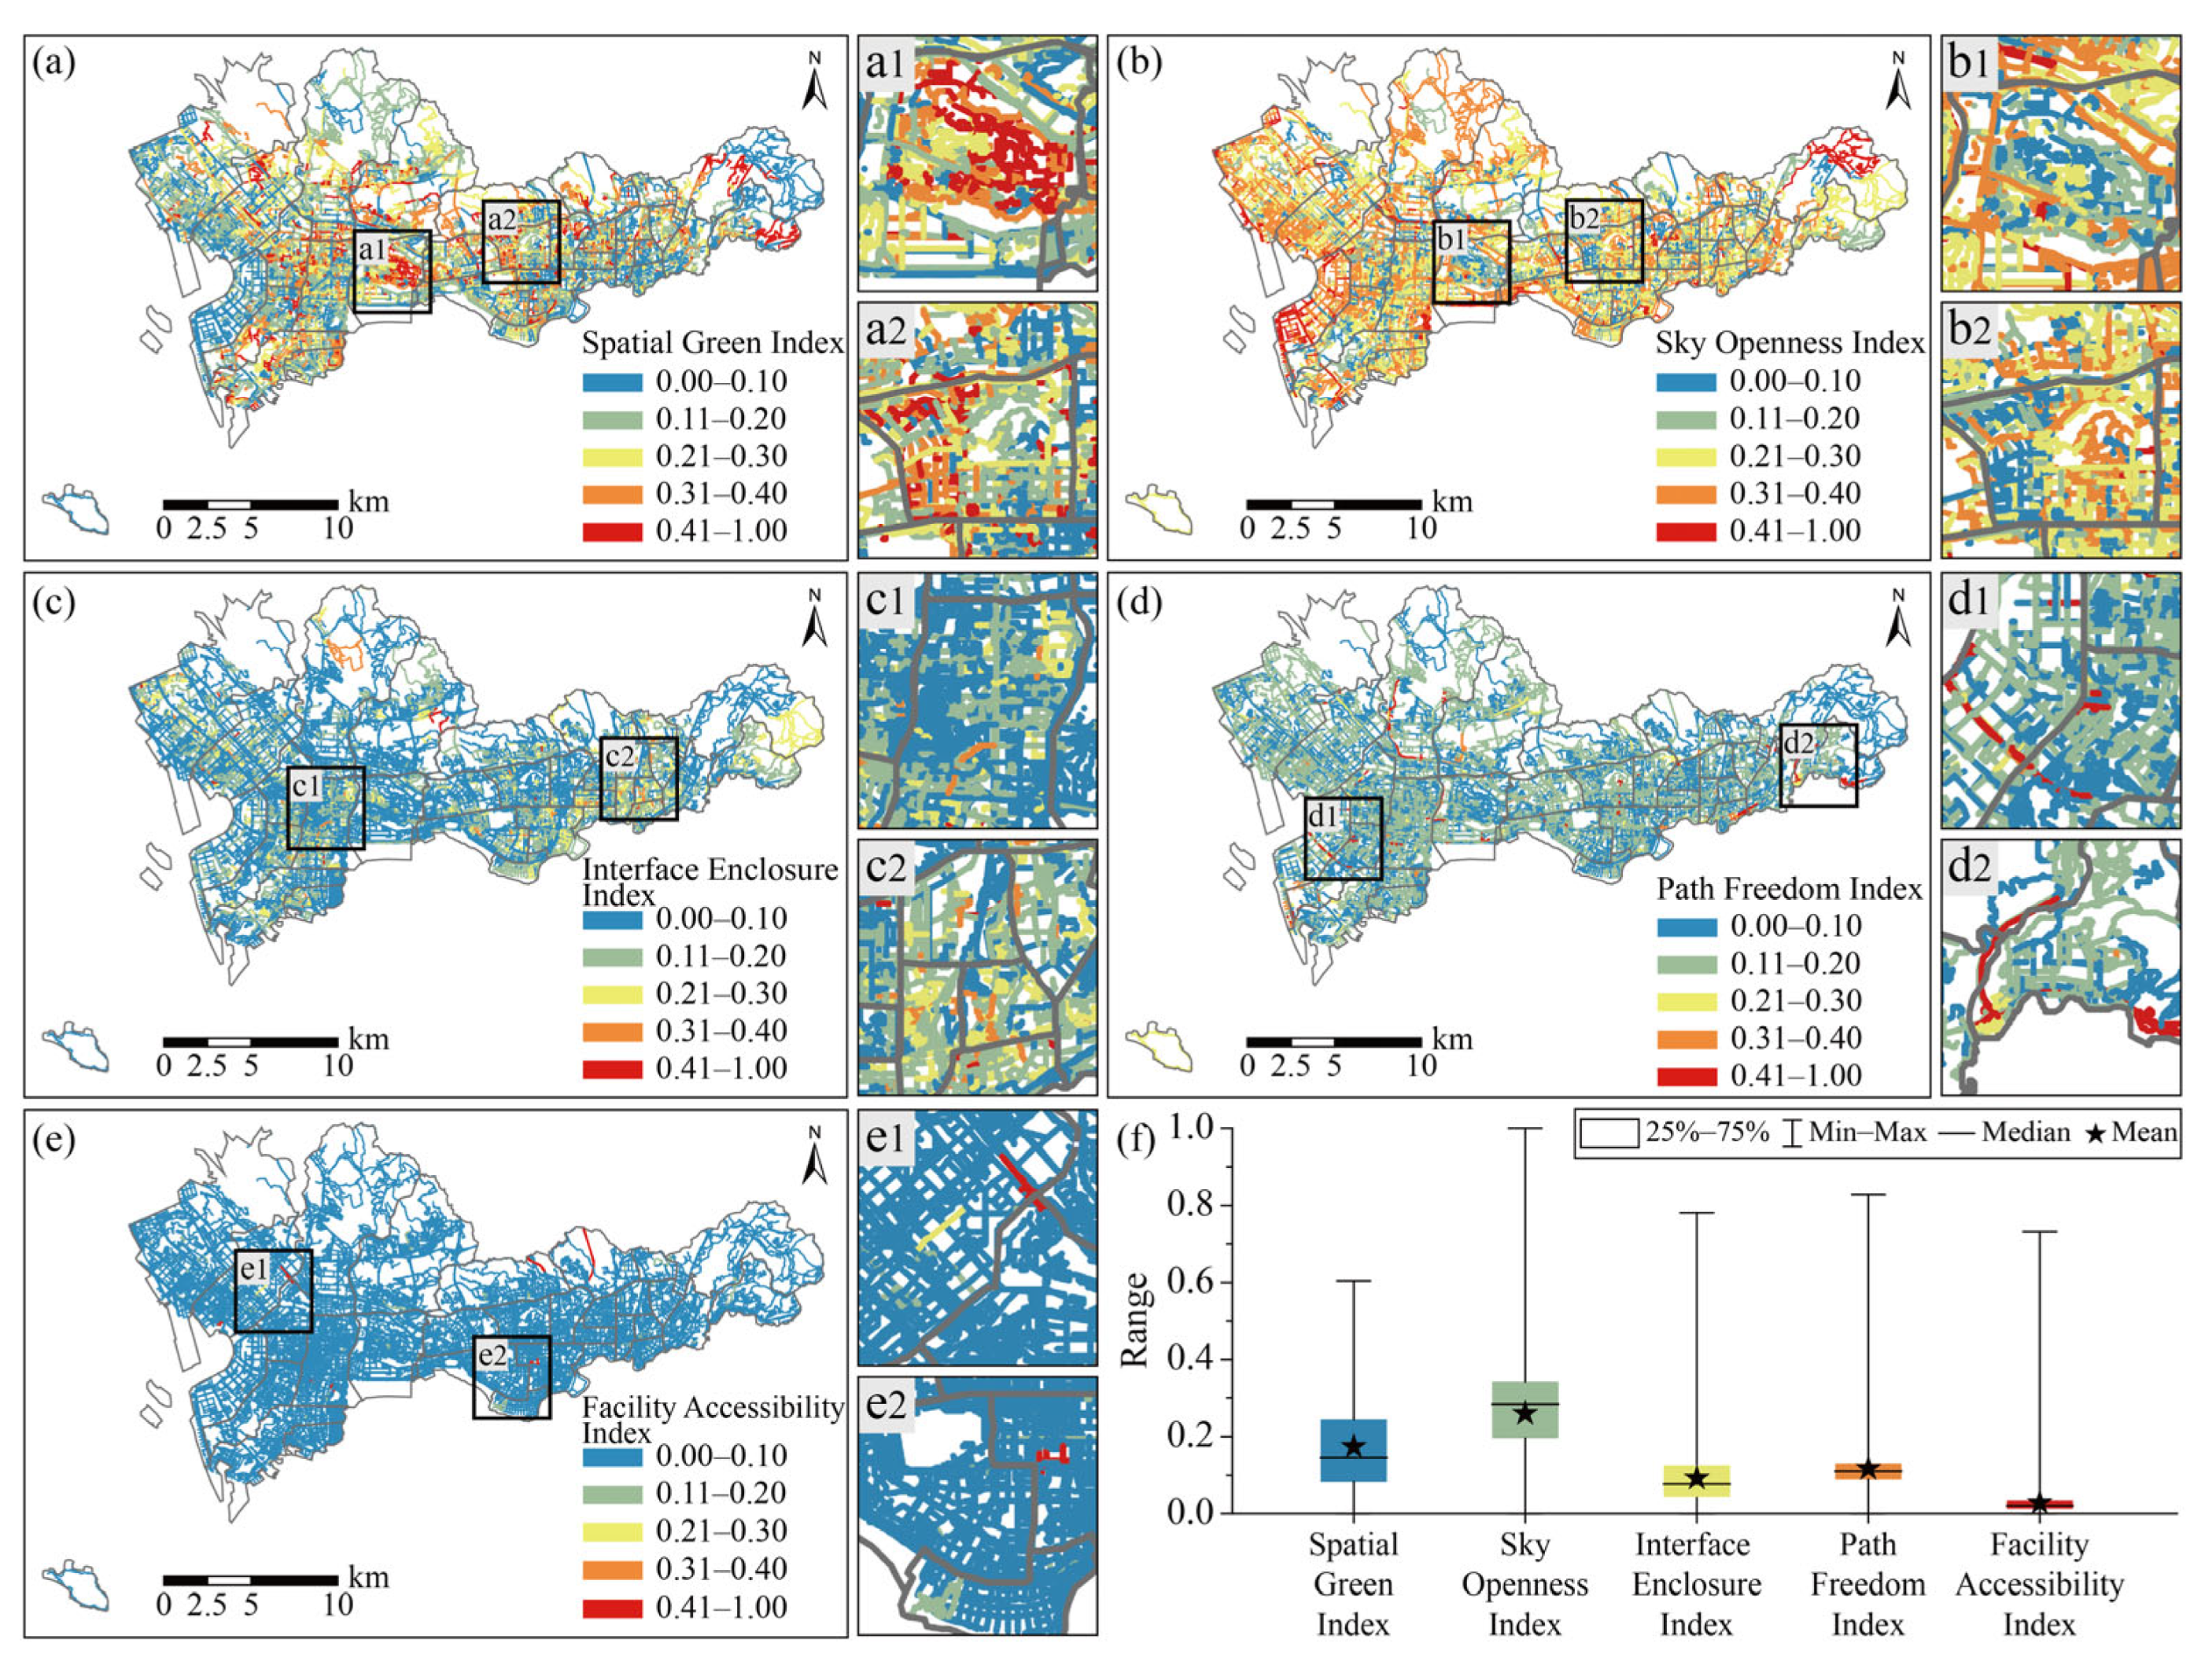
Figure 3 indicates strong spatial heterogeneity: SOI is predominantly peripheral, SGI is concentrated in central areas, and IEI, PFI, and FAI are generally low and locally distributed. Specifically, SOI exhibits the highest overall values and displays a spatial pattern characterized by lower levels in central areas and higher levels in peripheral zones, with pronounced high-value clusters particularly in the easternmost and westernmost parts of the study area (see Figure 3b). In contrast, SGI ranks second in overall magnitude and shows a center-high periphery-low distribution, forming extensive high-value clusters in the central areas, while only scattered pockets of extremely high values appear in peripheral areas such as the western region (see Figure 3a). IEI and PFI present relatively lower overall levels, with spatial patterns dominated by a mix of moderate, low, and very low values; higher and very high values are limited to a few localized street segments and do not form continuous distributions (see Figure 3c,d). By comparison, FAI remains generally low across the study area, with the majority of locations exhibiting very low values and only a small number of localized areas showing relatively higher levels (see Figure 3e).
Descriptive statistics (see Table 4) indicate that SOI and SGI account for relatively higher proportions, with SGI showing the greatest variability. IEI and PFI remain at moderate-to-low levels, while FAI is the lowest and most stable. In terms of mean values, SOI and SGI exhibit relatively higher proportions, with mean values of 0.26 and 0.17, respectively. In contrast, IEI and PFI show moderate-to-low average proportions, with mean values of 0.09 and 0.12, while FAI has the lowest overall proportion, with a mean of only 0.03. Regarding dispersion, SGI displays the greatest variability, with a standard deviation of 0.12 and values ranging from 0 to 0.60. Although SOI reaches the highest maximum value (1.00), its standard deviation is comparatively lower (0.11). By comparison, FAI exhibits the least variability, with a standard deviation of 0.03 and variance approaching zero.

5.2. Spatial Distribution of Objective Cycling Behavior

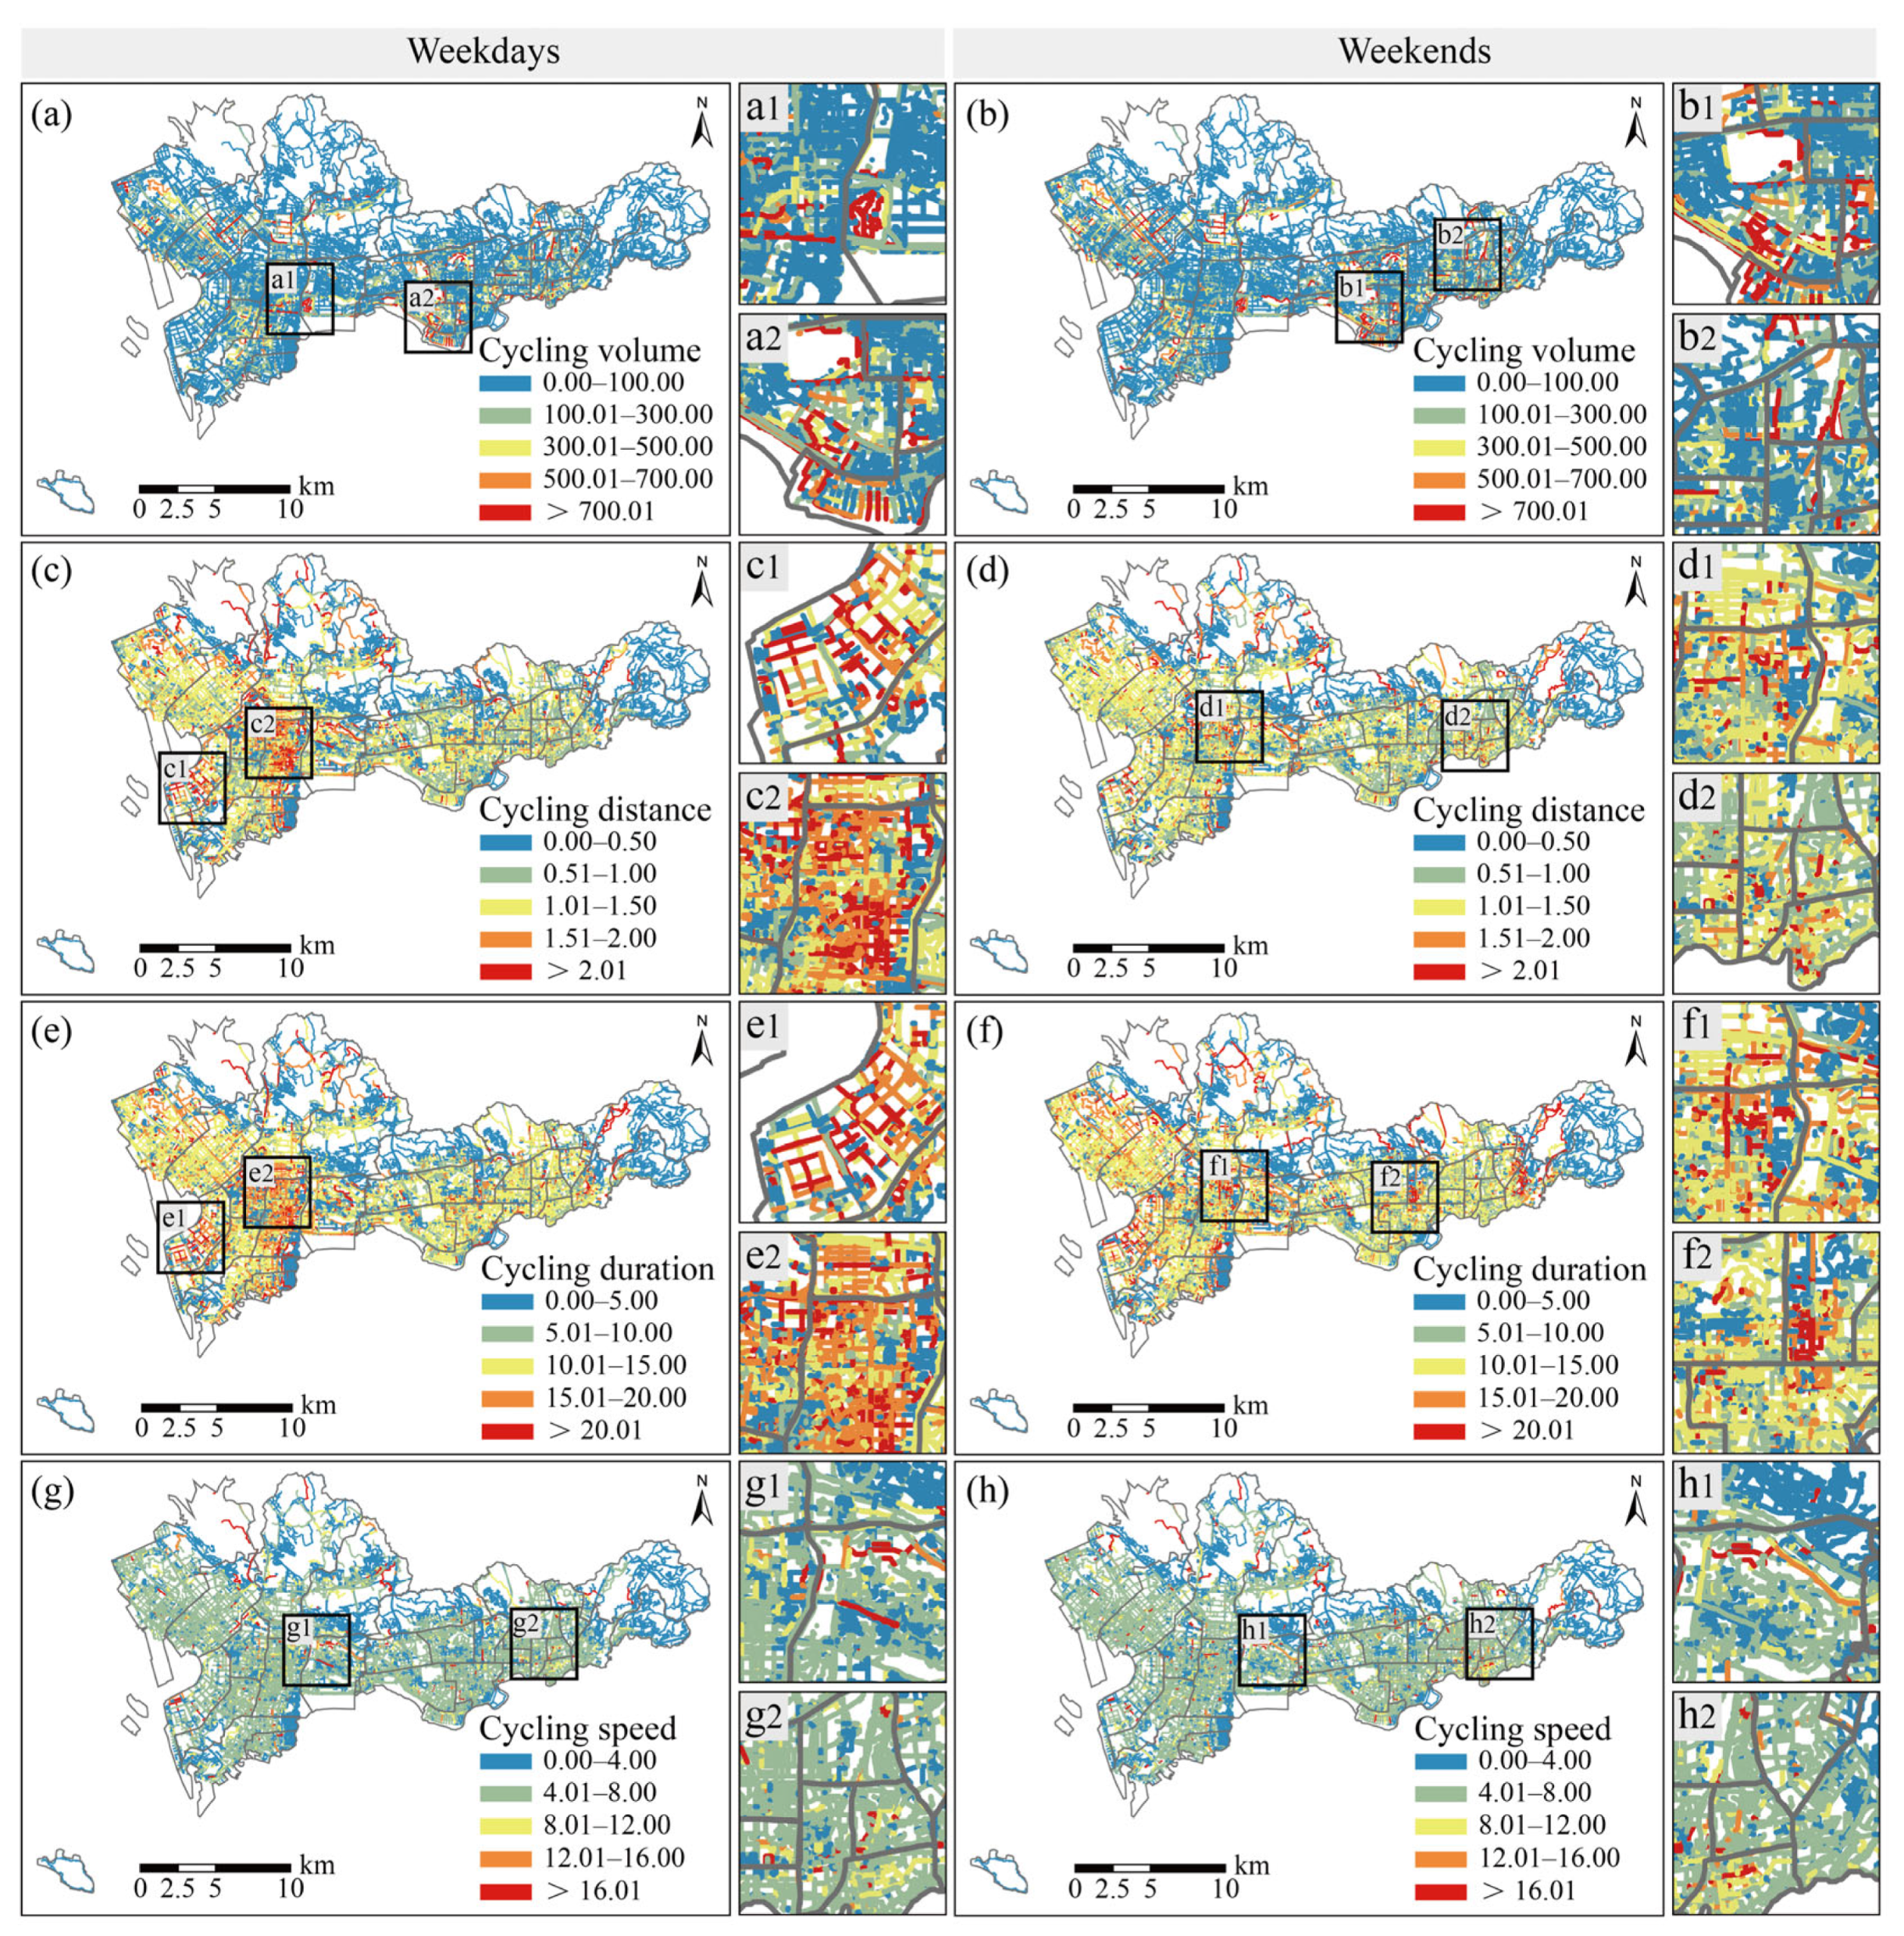
As shown in Figure 4, indicators generally display a center-high, periphery-low distribution. In particular, the southeastern part of the study area shows relatively higher cycling volume and cycling speed on weekends (see Figure 4a,b,g,h). By contrast, the western region exhibits longer cycling distances and durations on weekdays, with pronounced spatial clustering of local extreme high values (see Figure 4c–f). In addition, the northern peripheral areas maintain relatively low levels across all four indicators on both weekdays and weekends.
As shown in Figure 5a–h, the clusters of the indicators generally exhibit a center-cold, periphery-hot pattern, with particularly extensive concentrations of hot spots in the western and southeastern parts of the study area. In contrast, cold spot clusters are mainly concentrated in the central area and occupy a relatively large spatial extent.
As shown in Table 5, bicycle sharing travel in Shenzhen differs between weekdays and weekends in both magnitude and distribution. Weekend cycling demand is higher, with a mean cycling volume of 36.47 trips, compared with 32.84 trips on weekdays, as well as a higher maximum value and greater overall dispersion. At the trip level, mean cycling distance remains similar across the two periods, while mean cycling duration is slightly longer on weekends. Cycling speed is also higher on weekends in terms of both mean and maximum values, whereas its dispersion is greater on weekdays. Overall, the results indicate that weekend cycling is associated with higher demand and slightly more intensive travel, while weekday travel exhibits greater heterogeneity in speed.

5.3. Spatial Distribution of Subjective Cycling Willingness

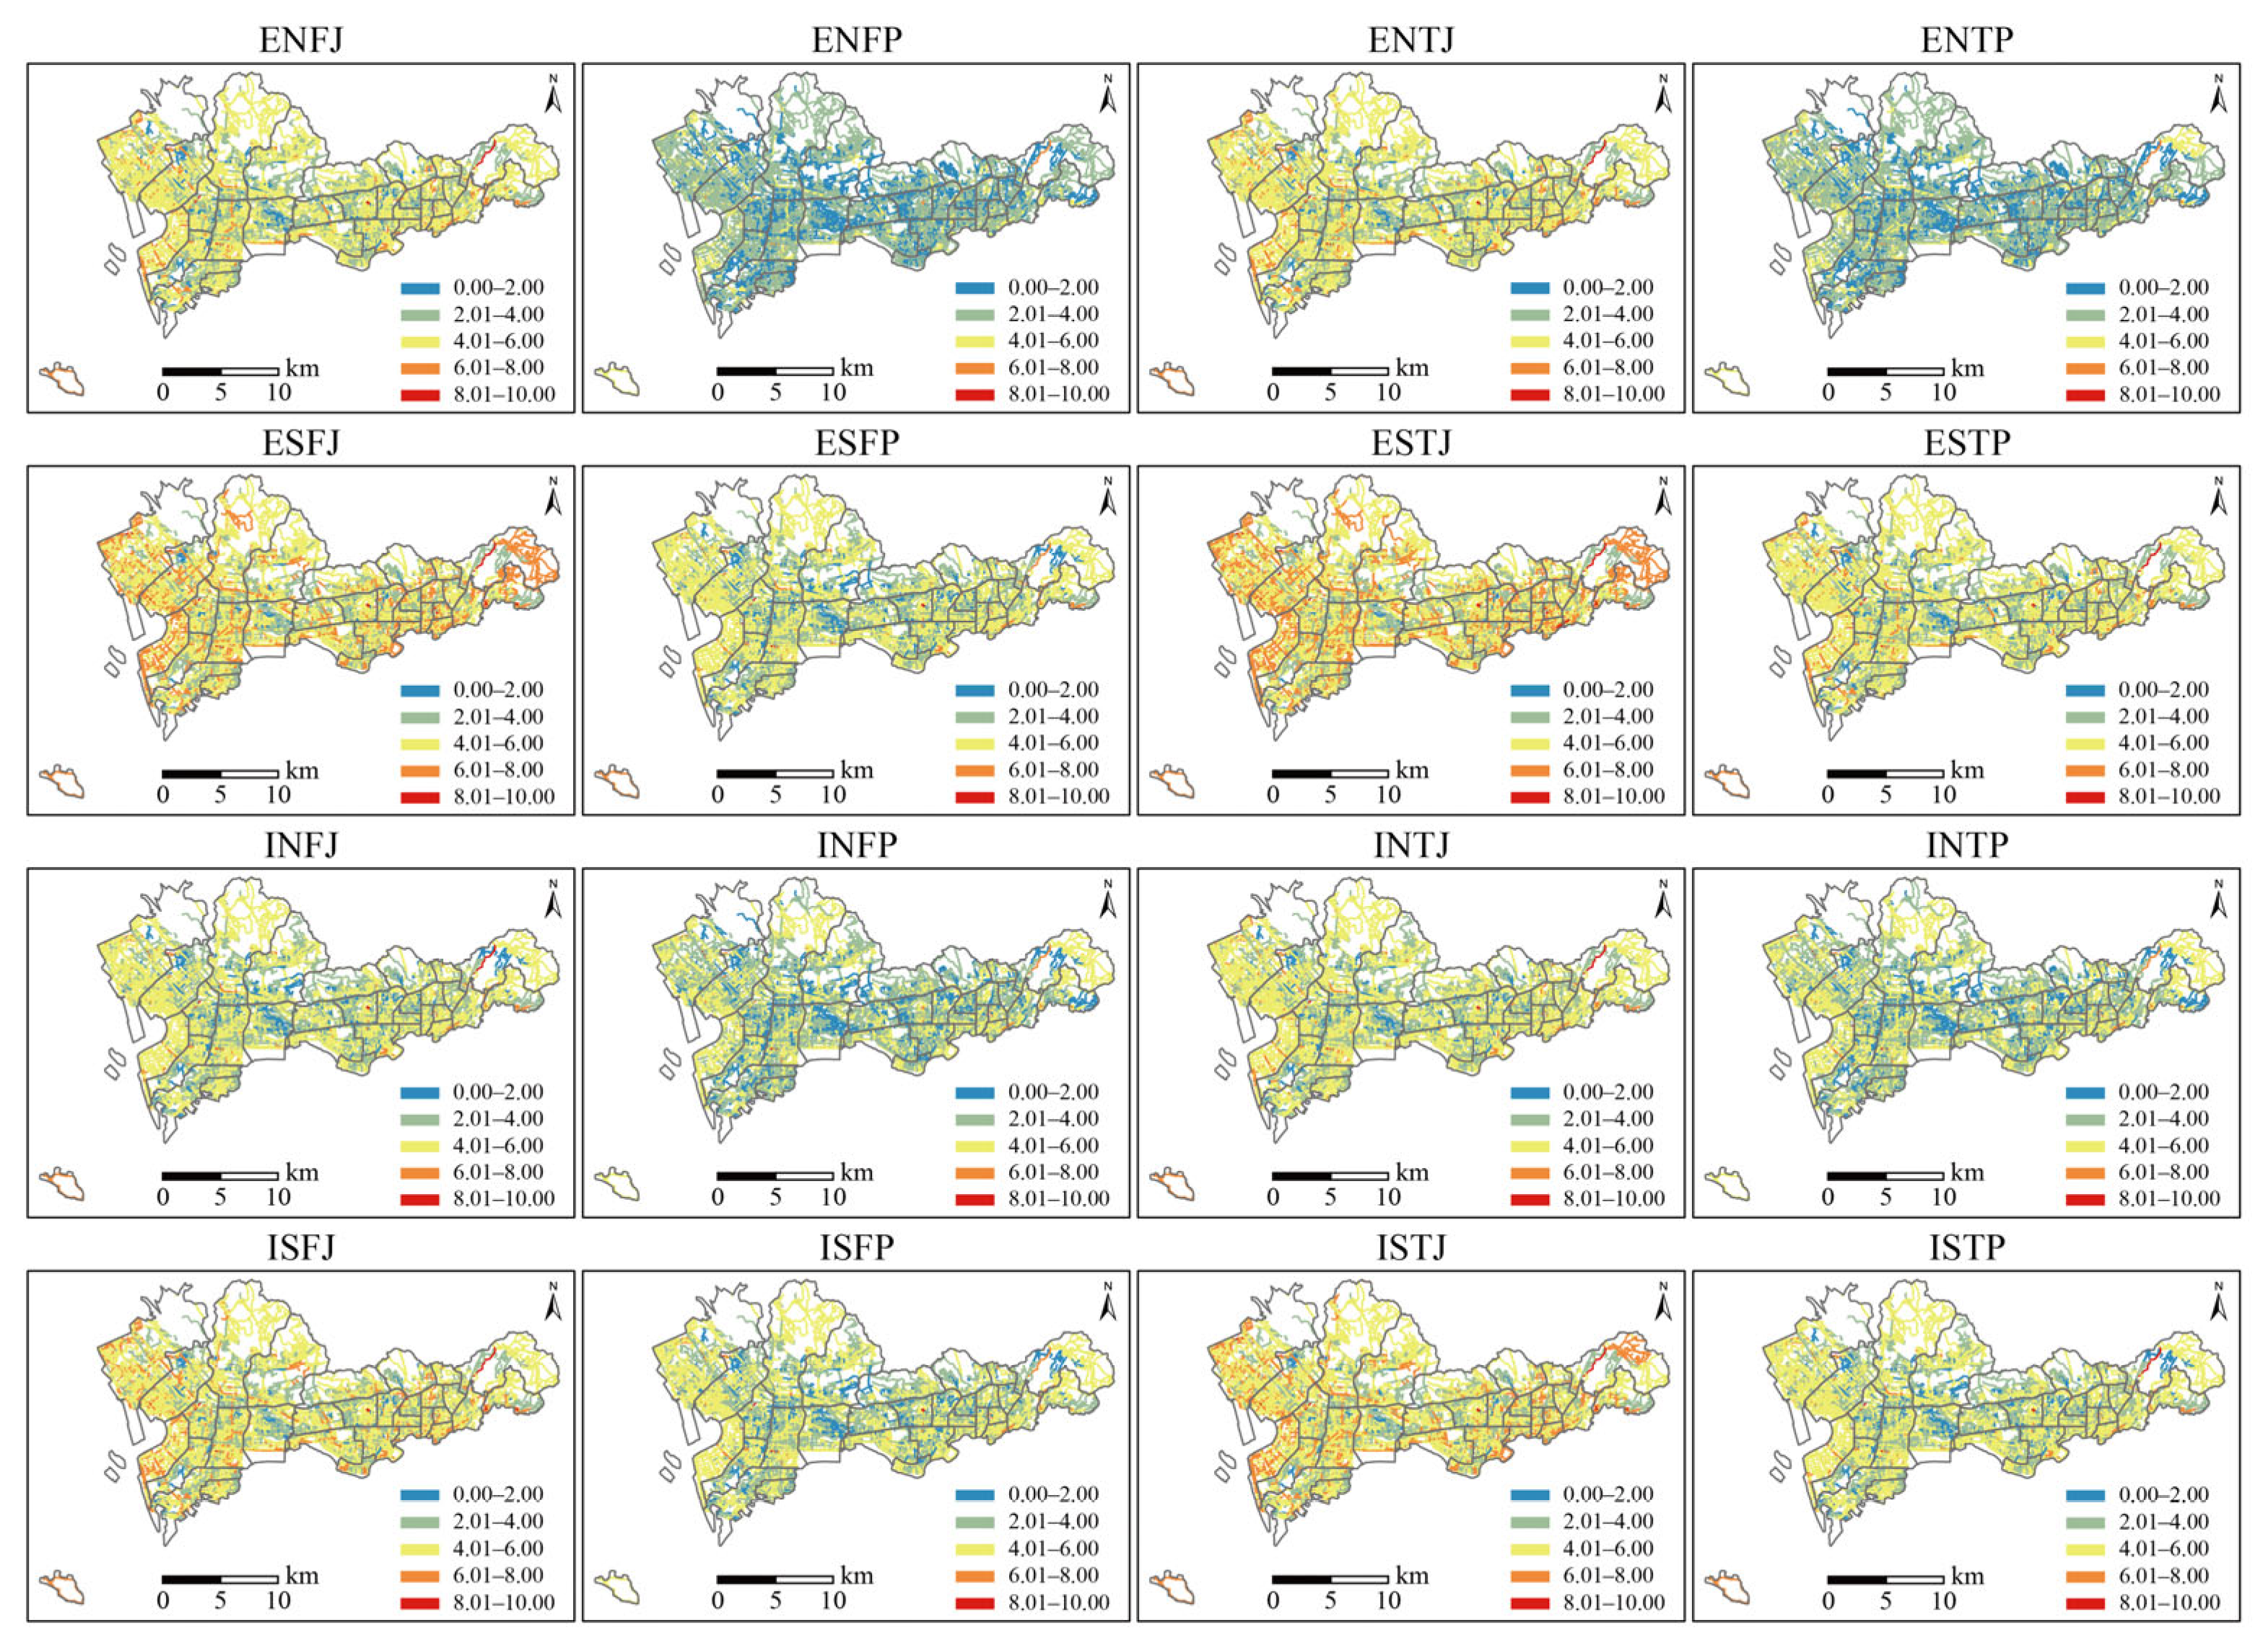
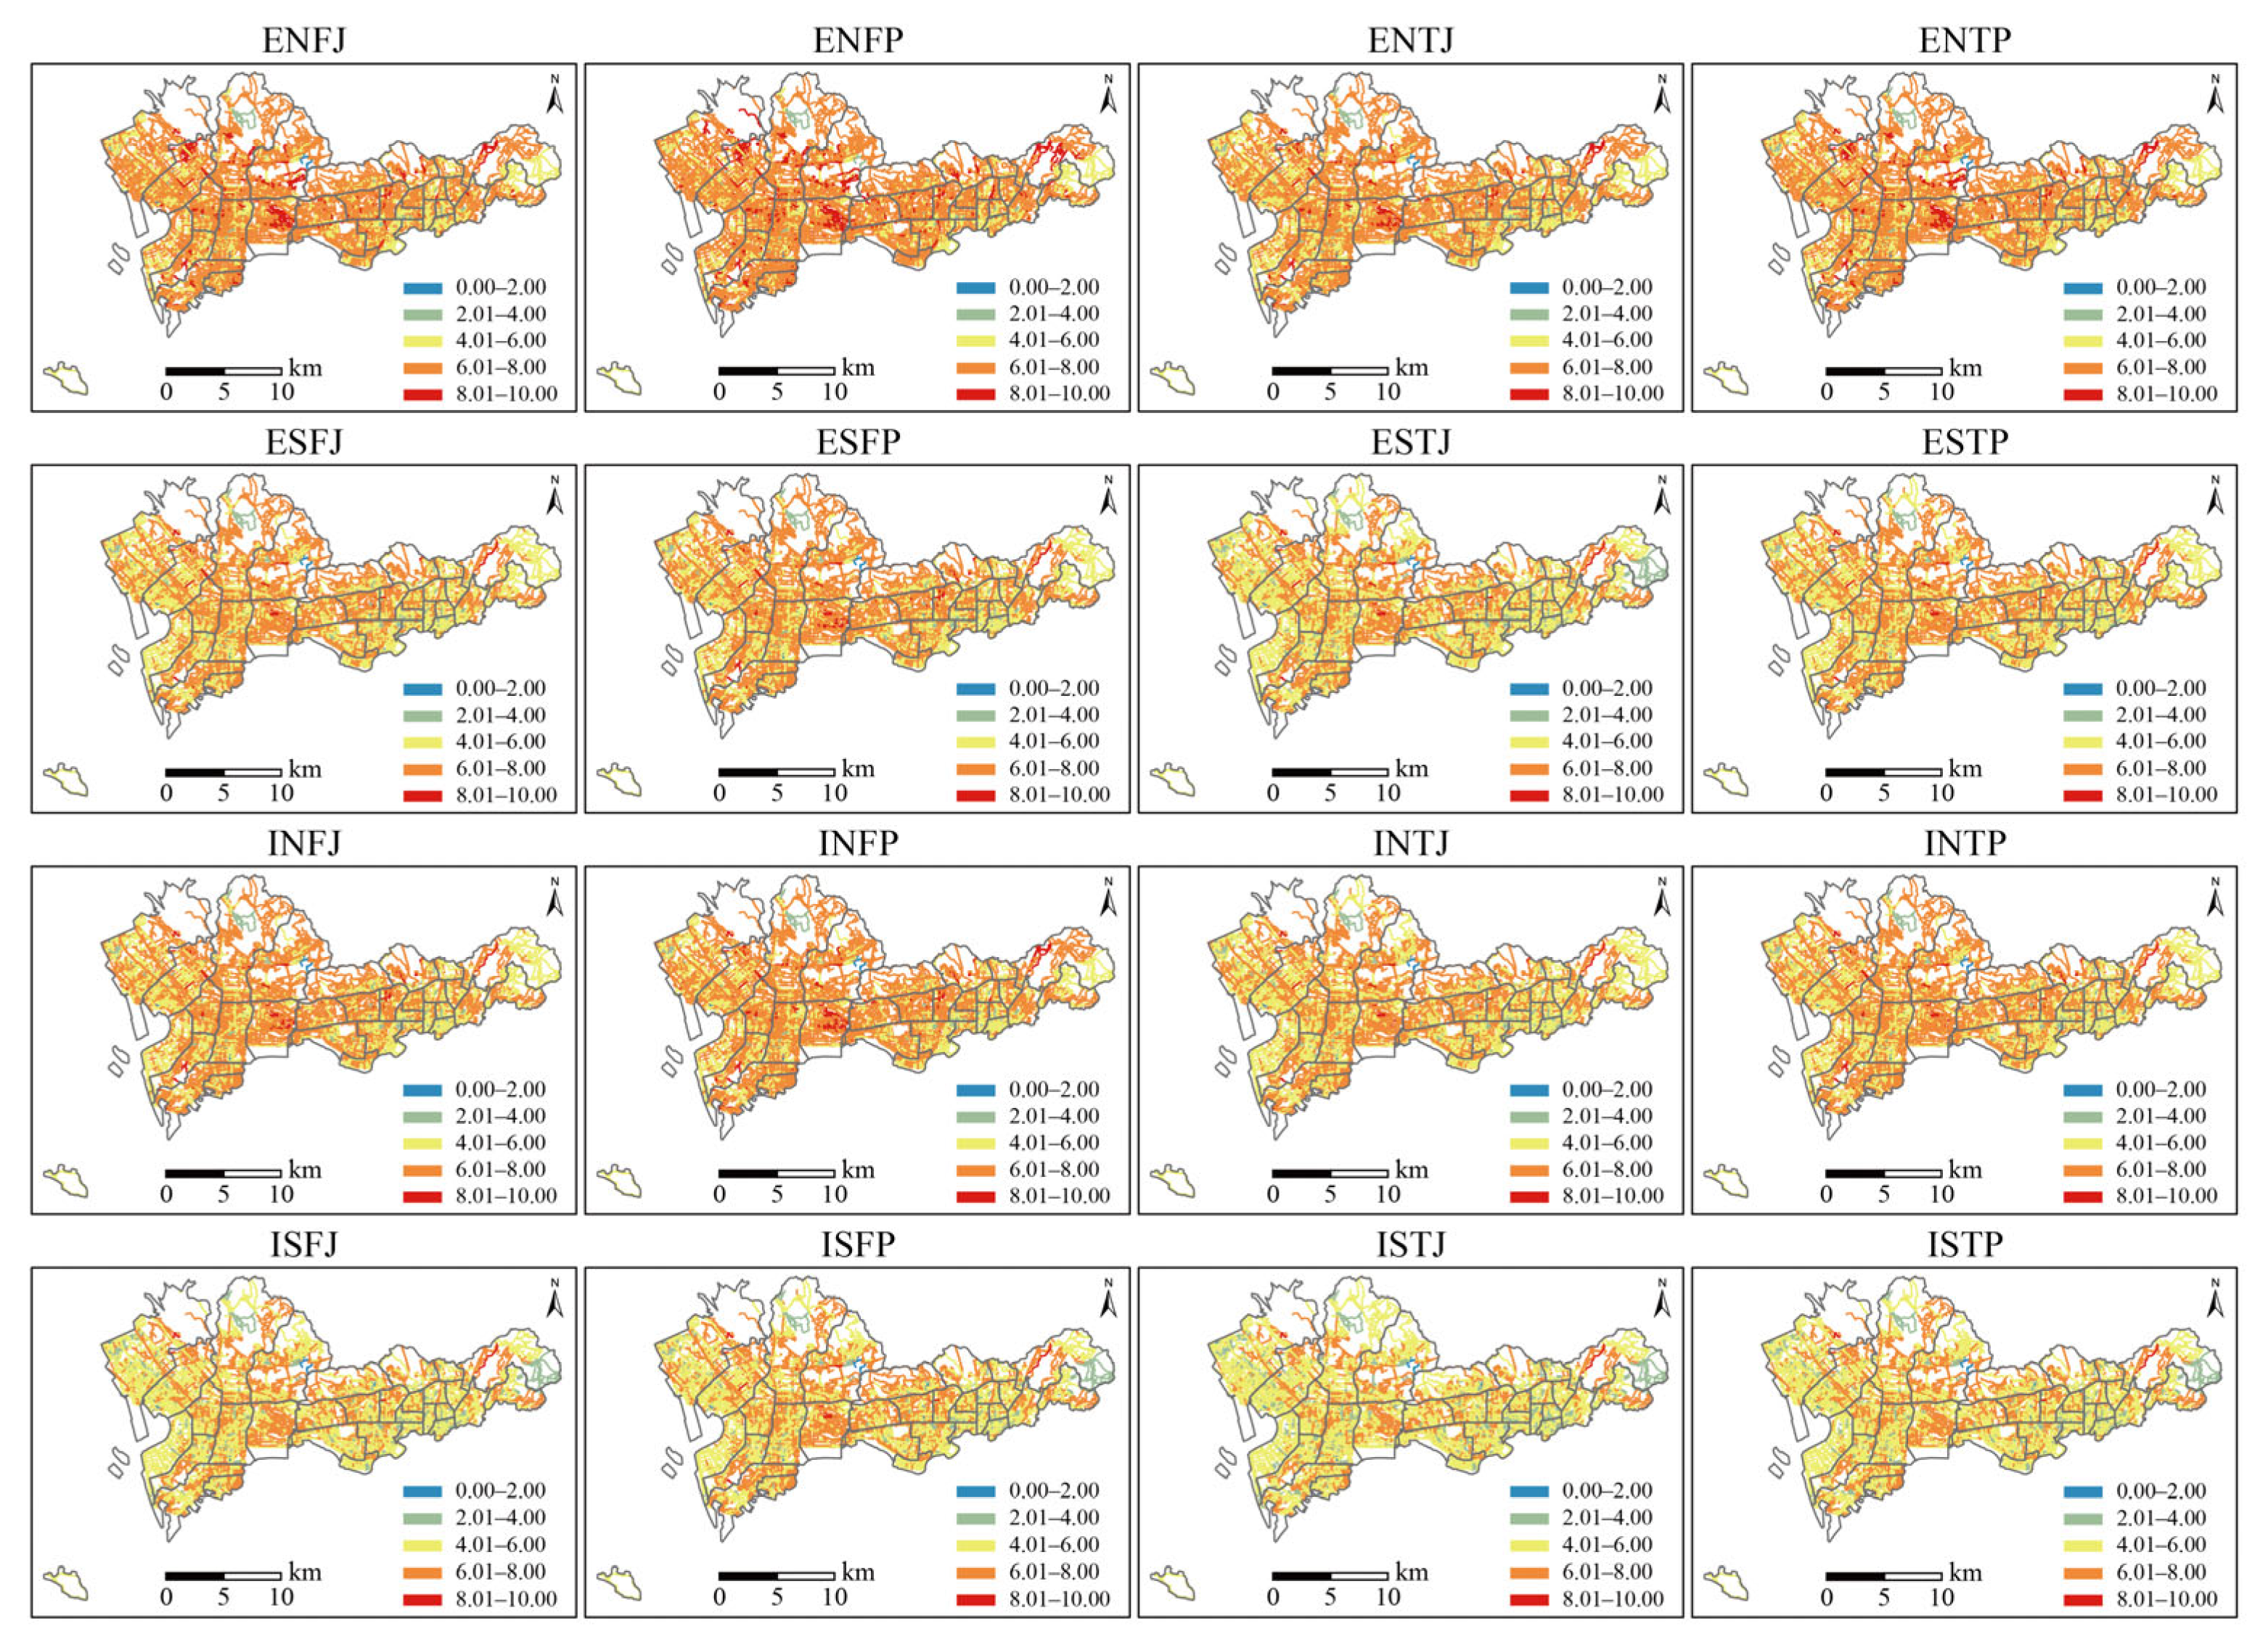
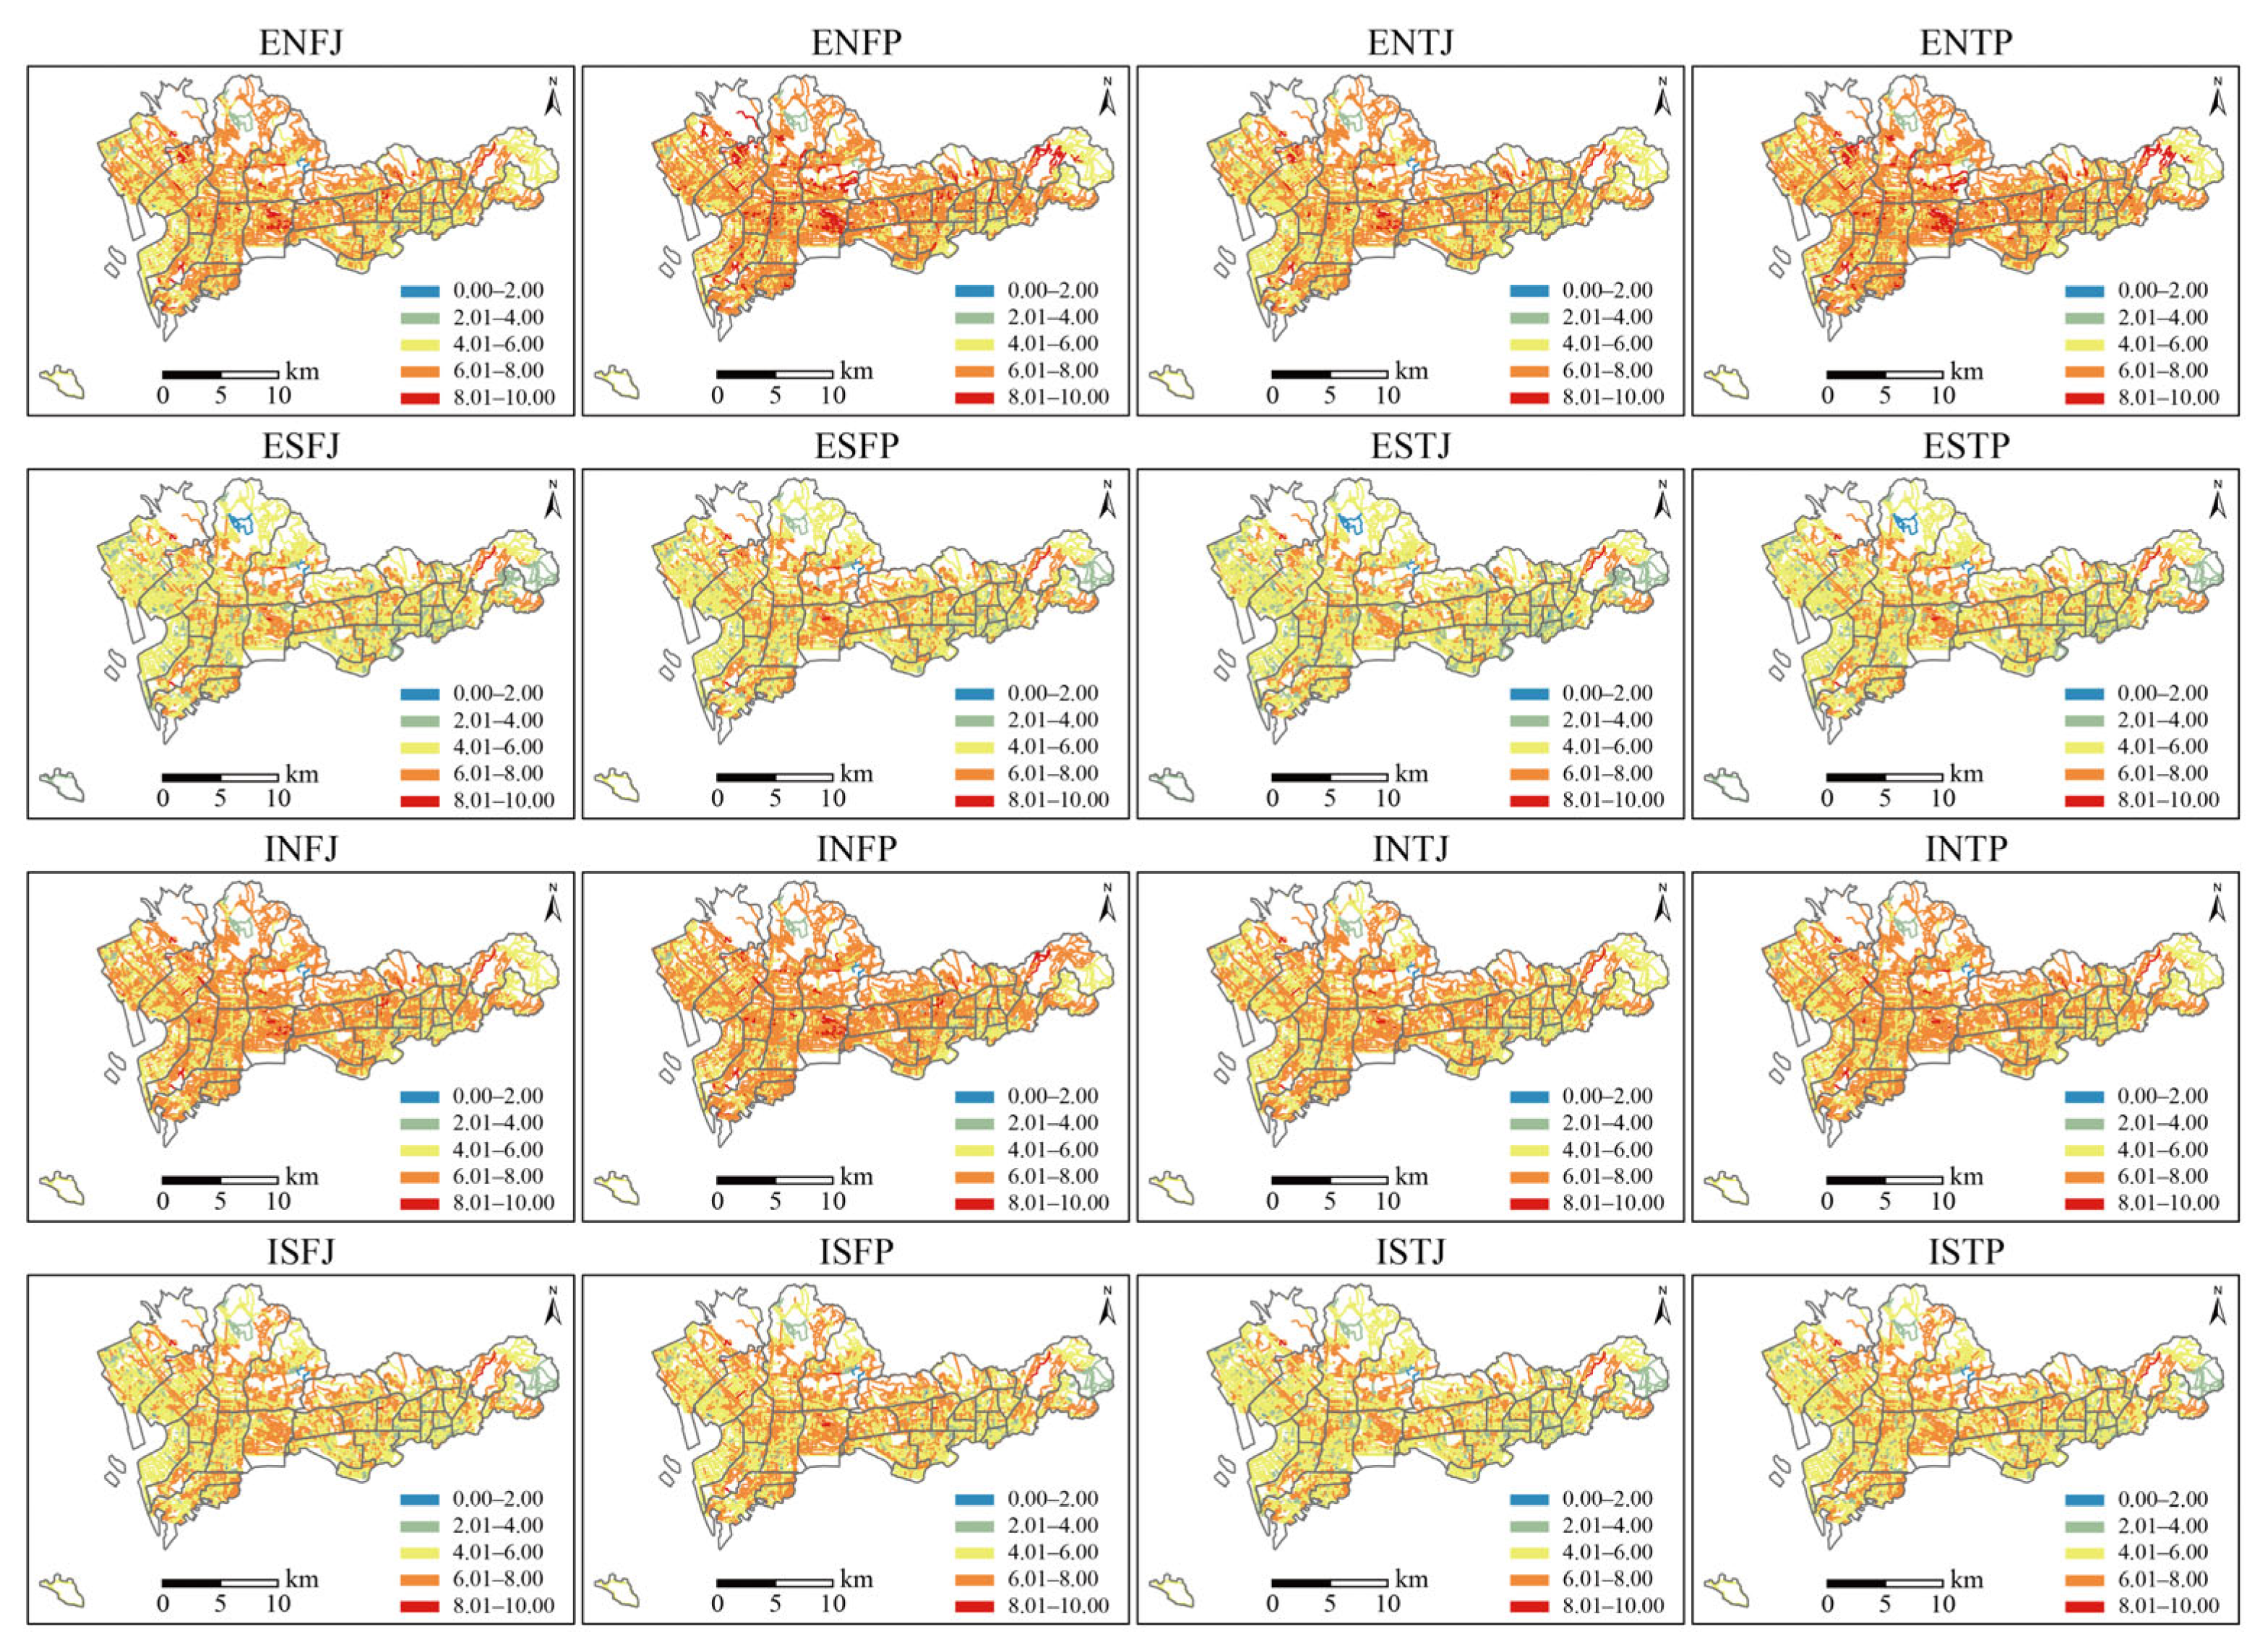
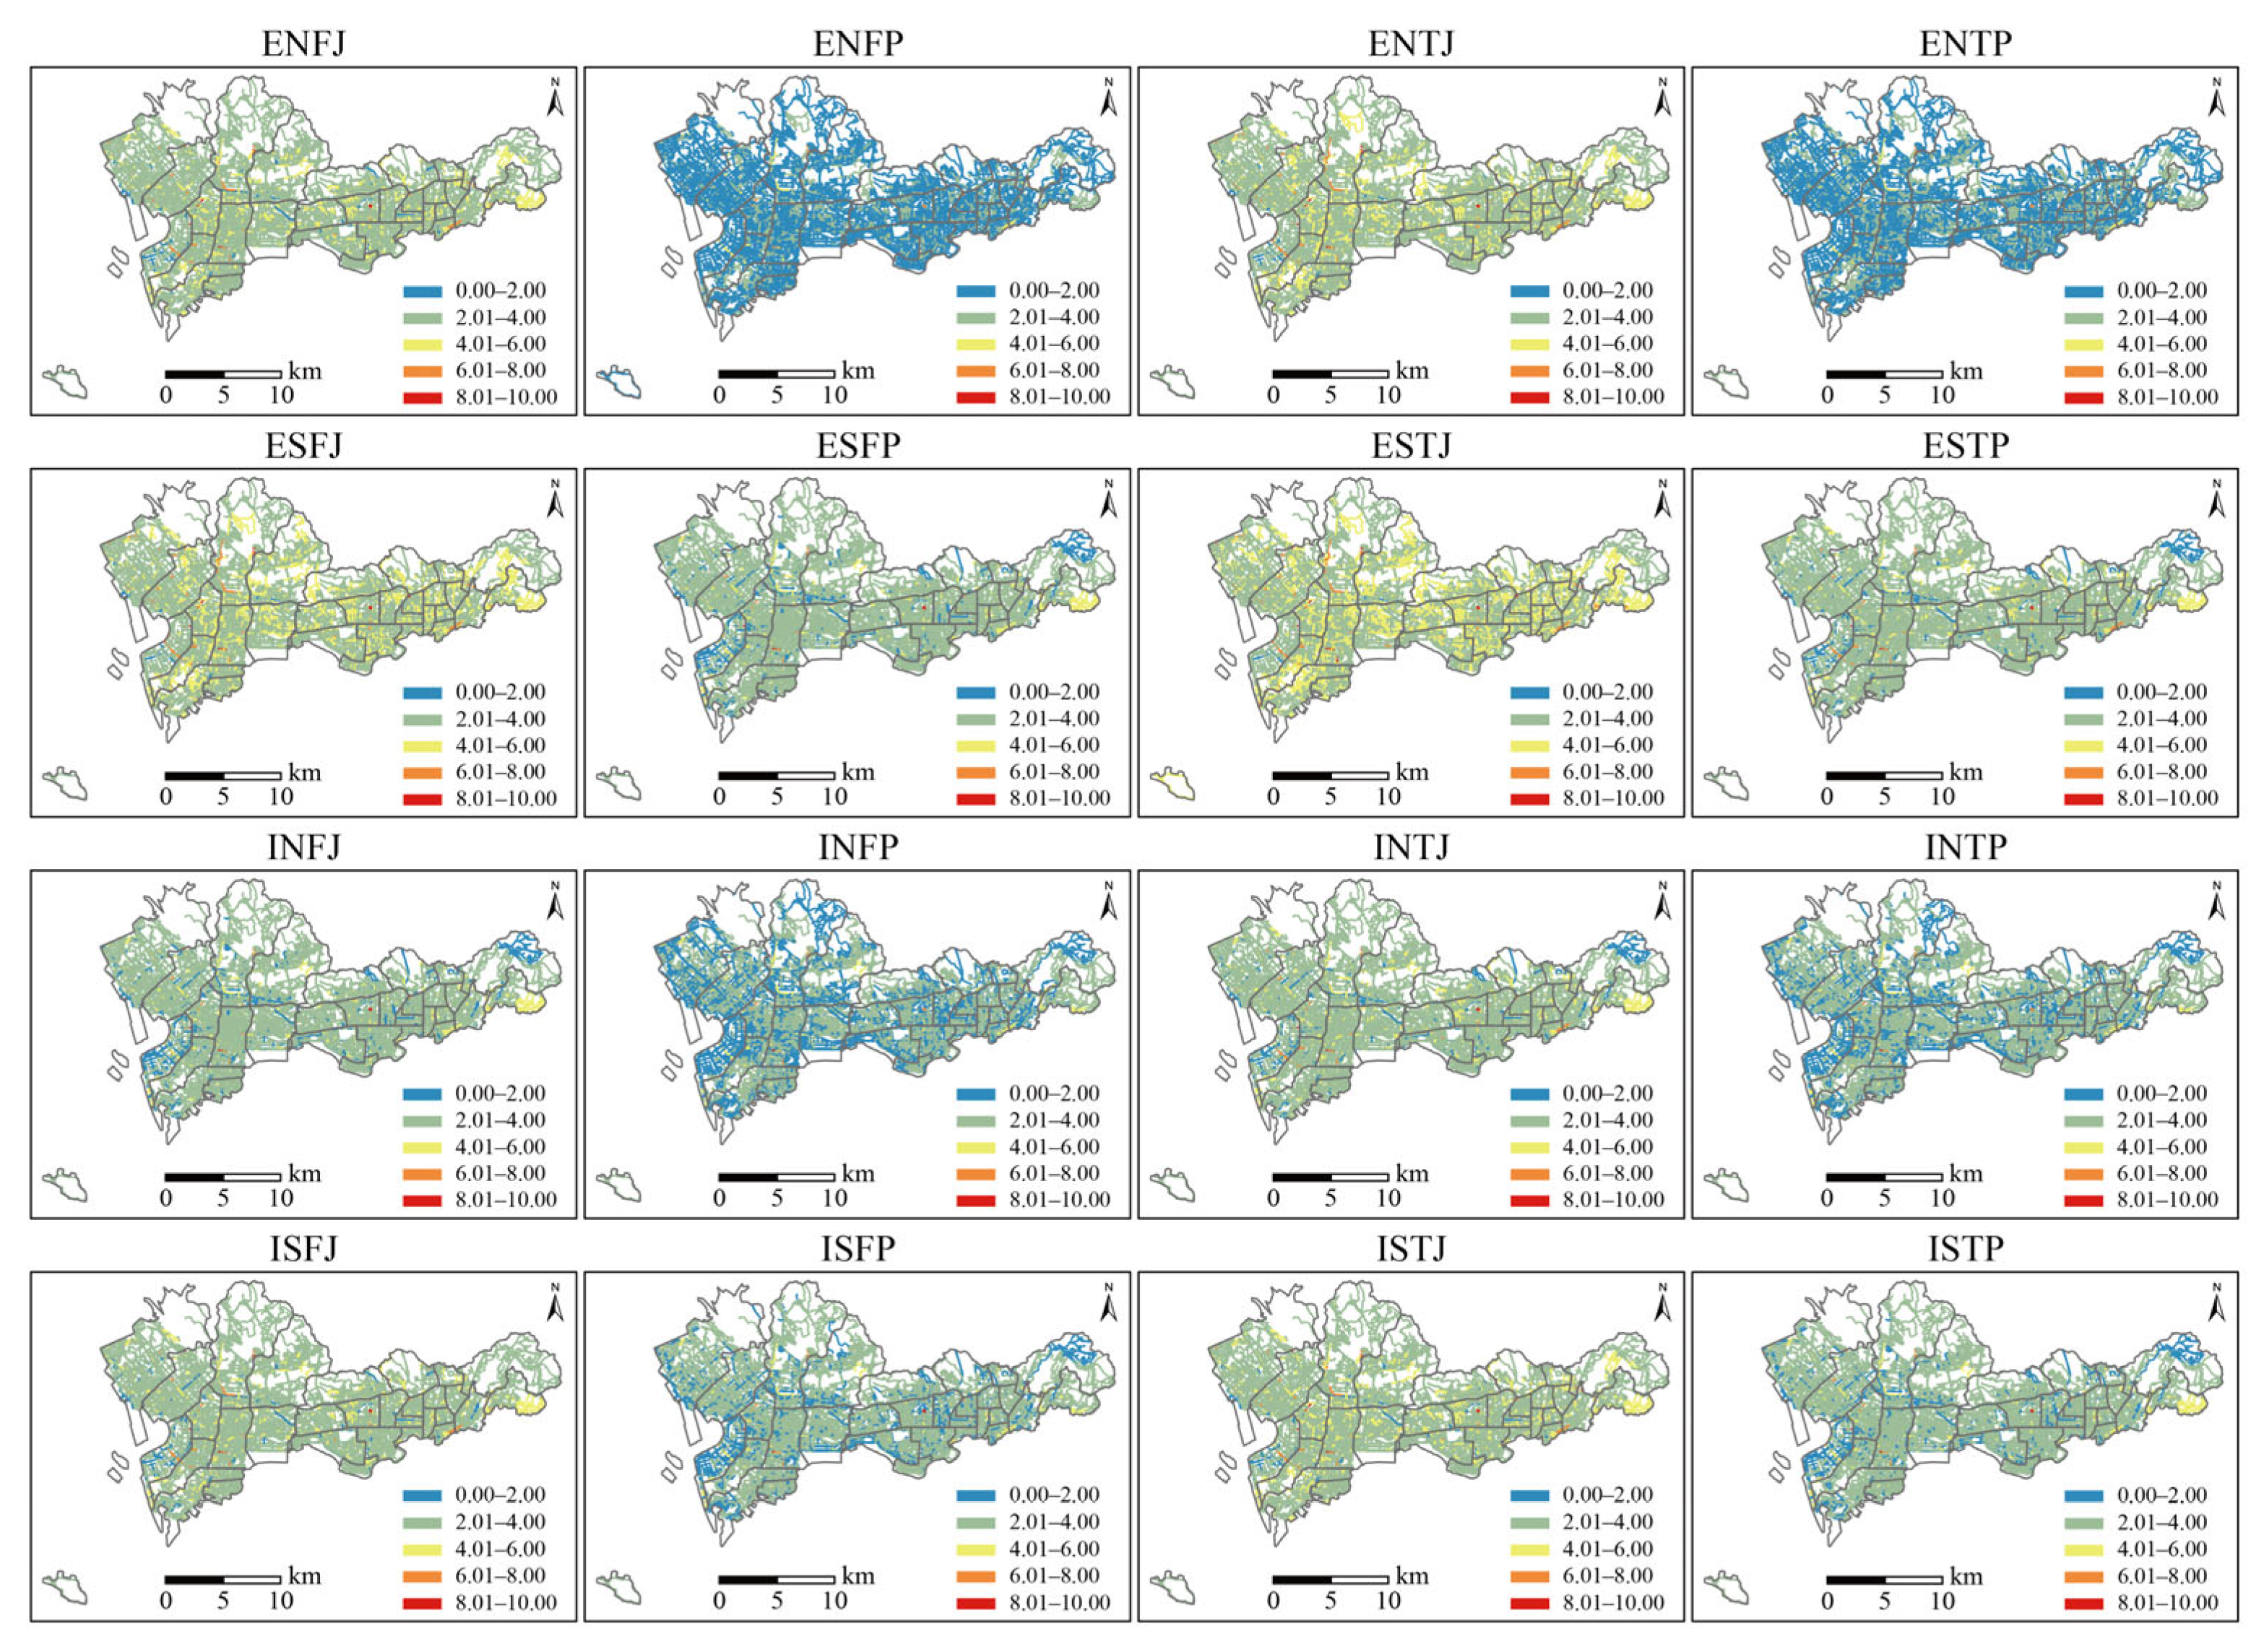
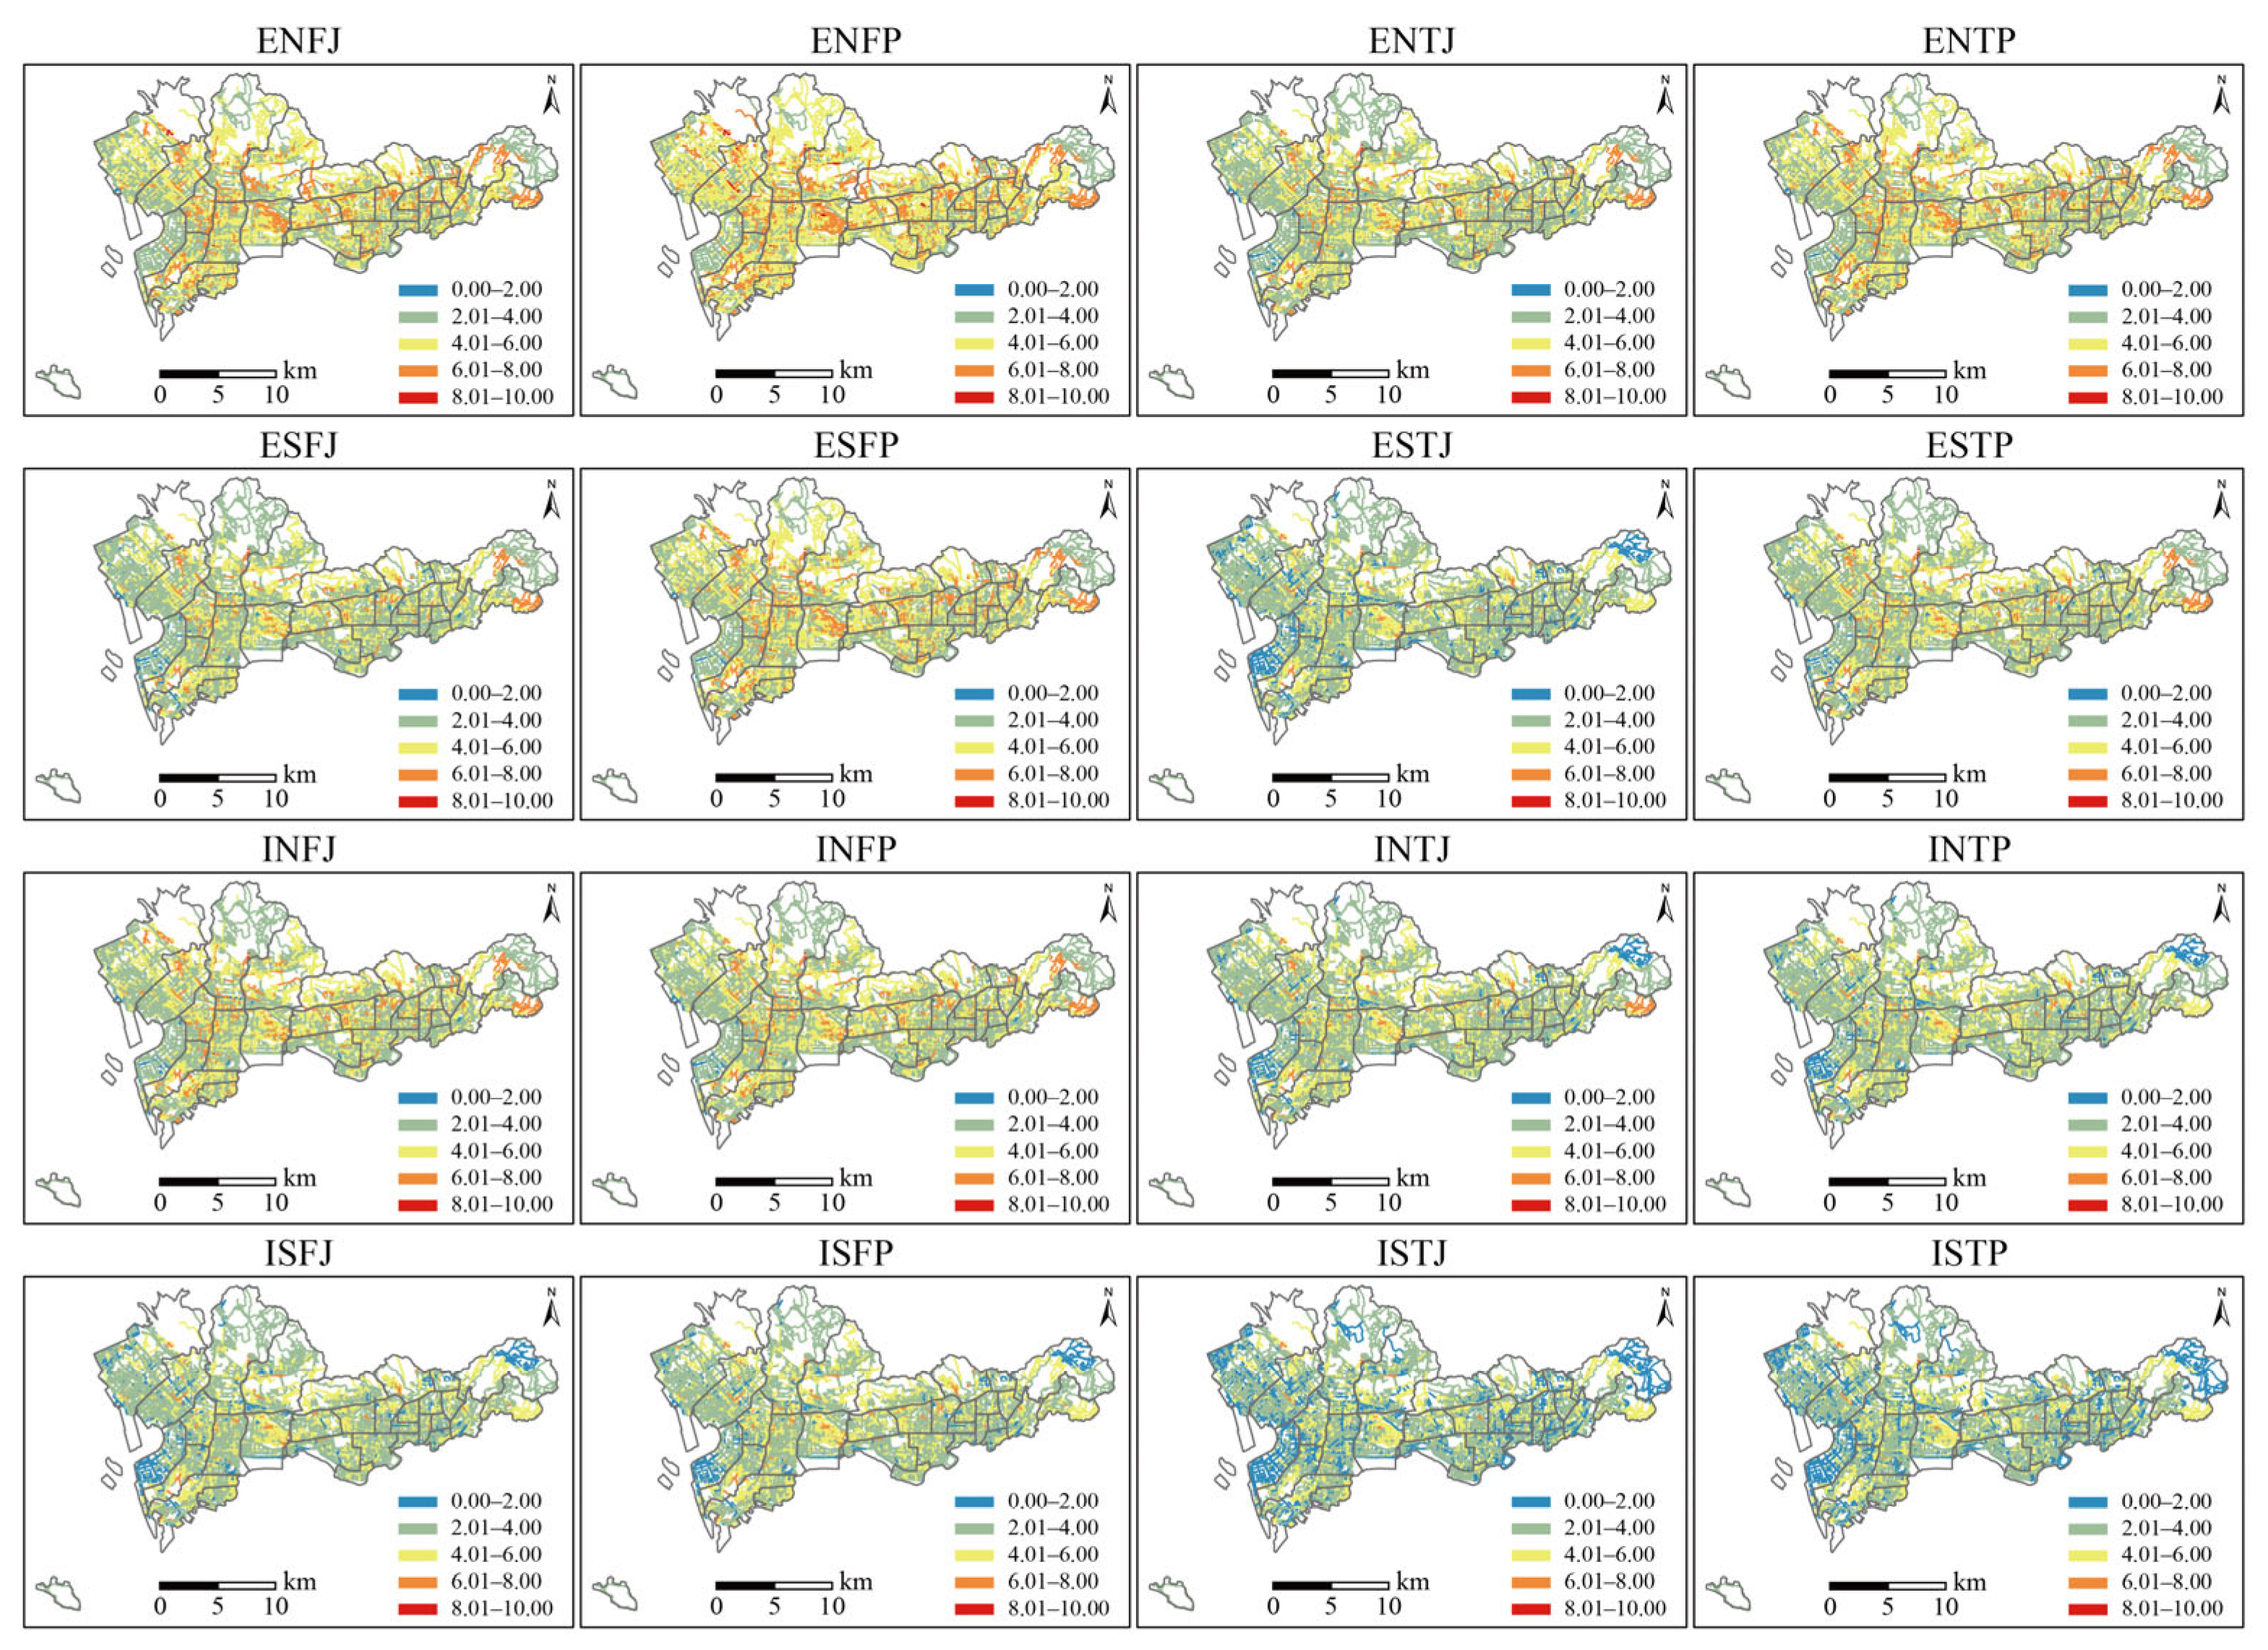
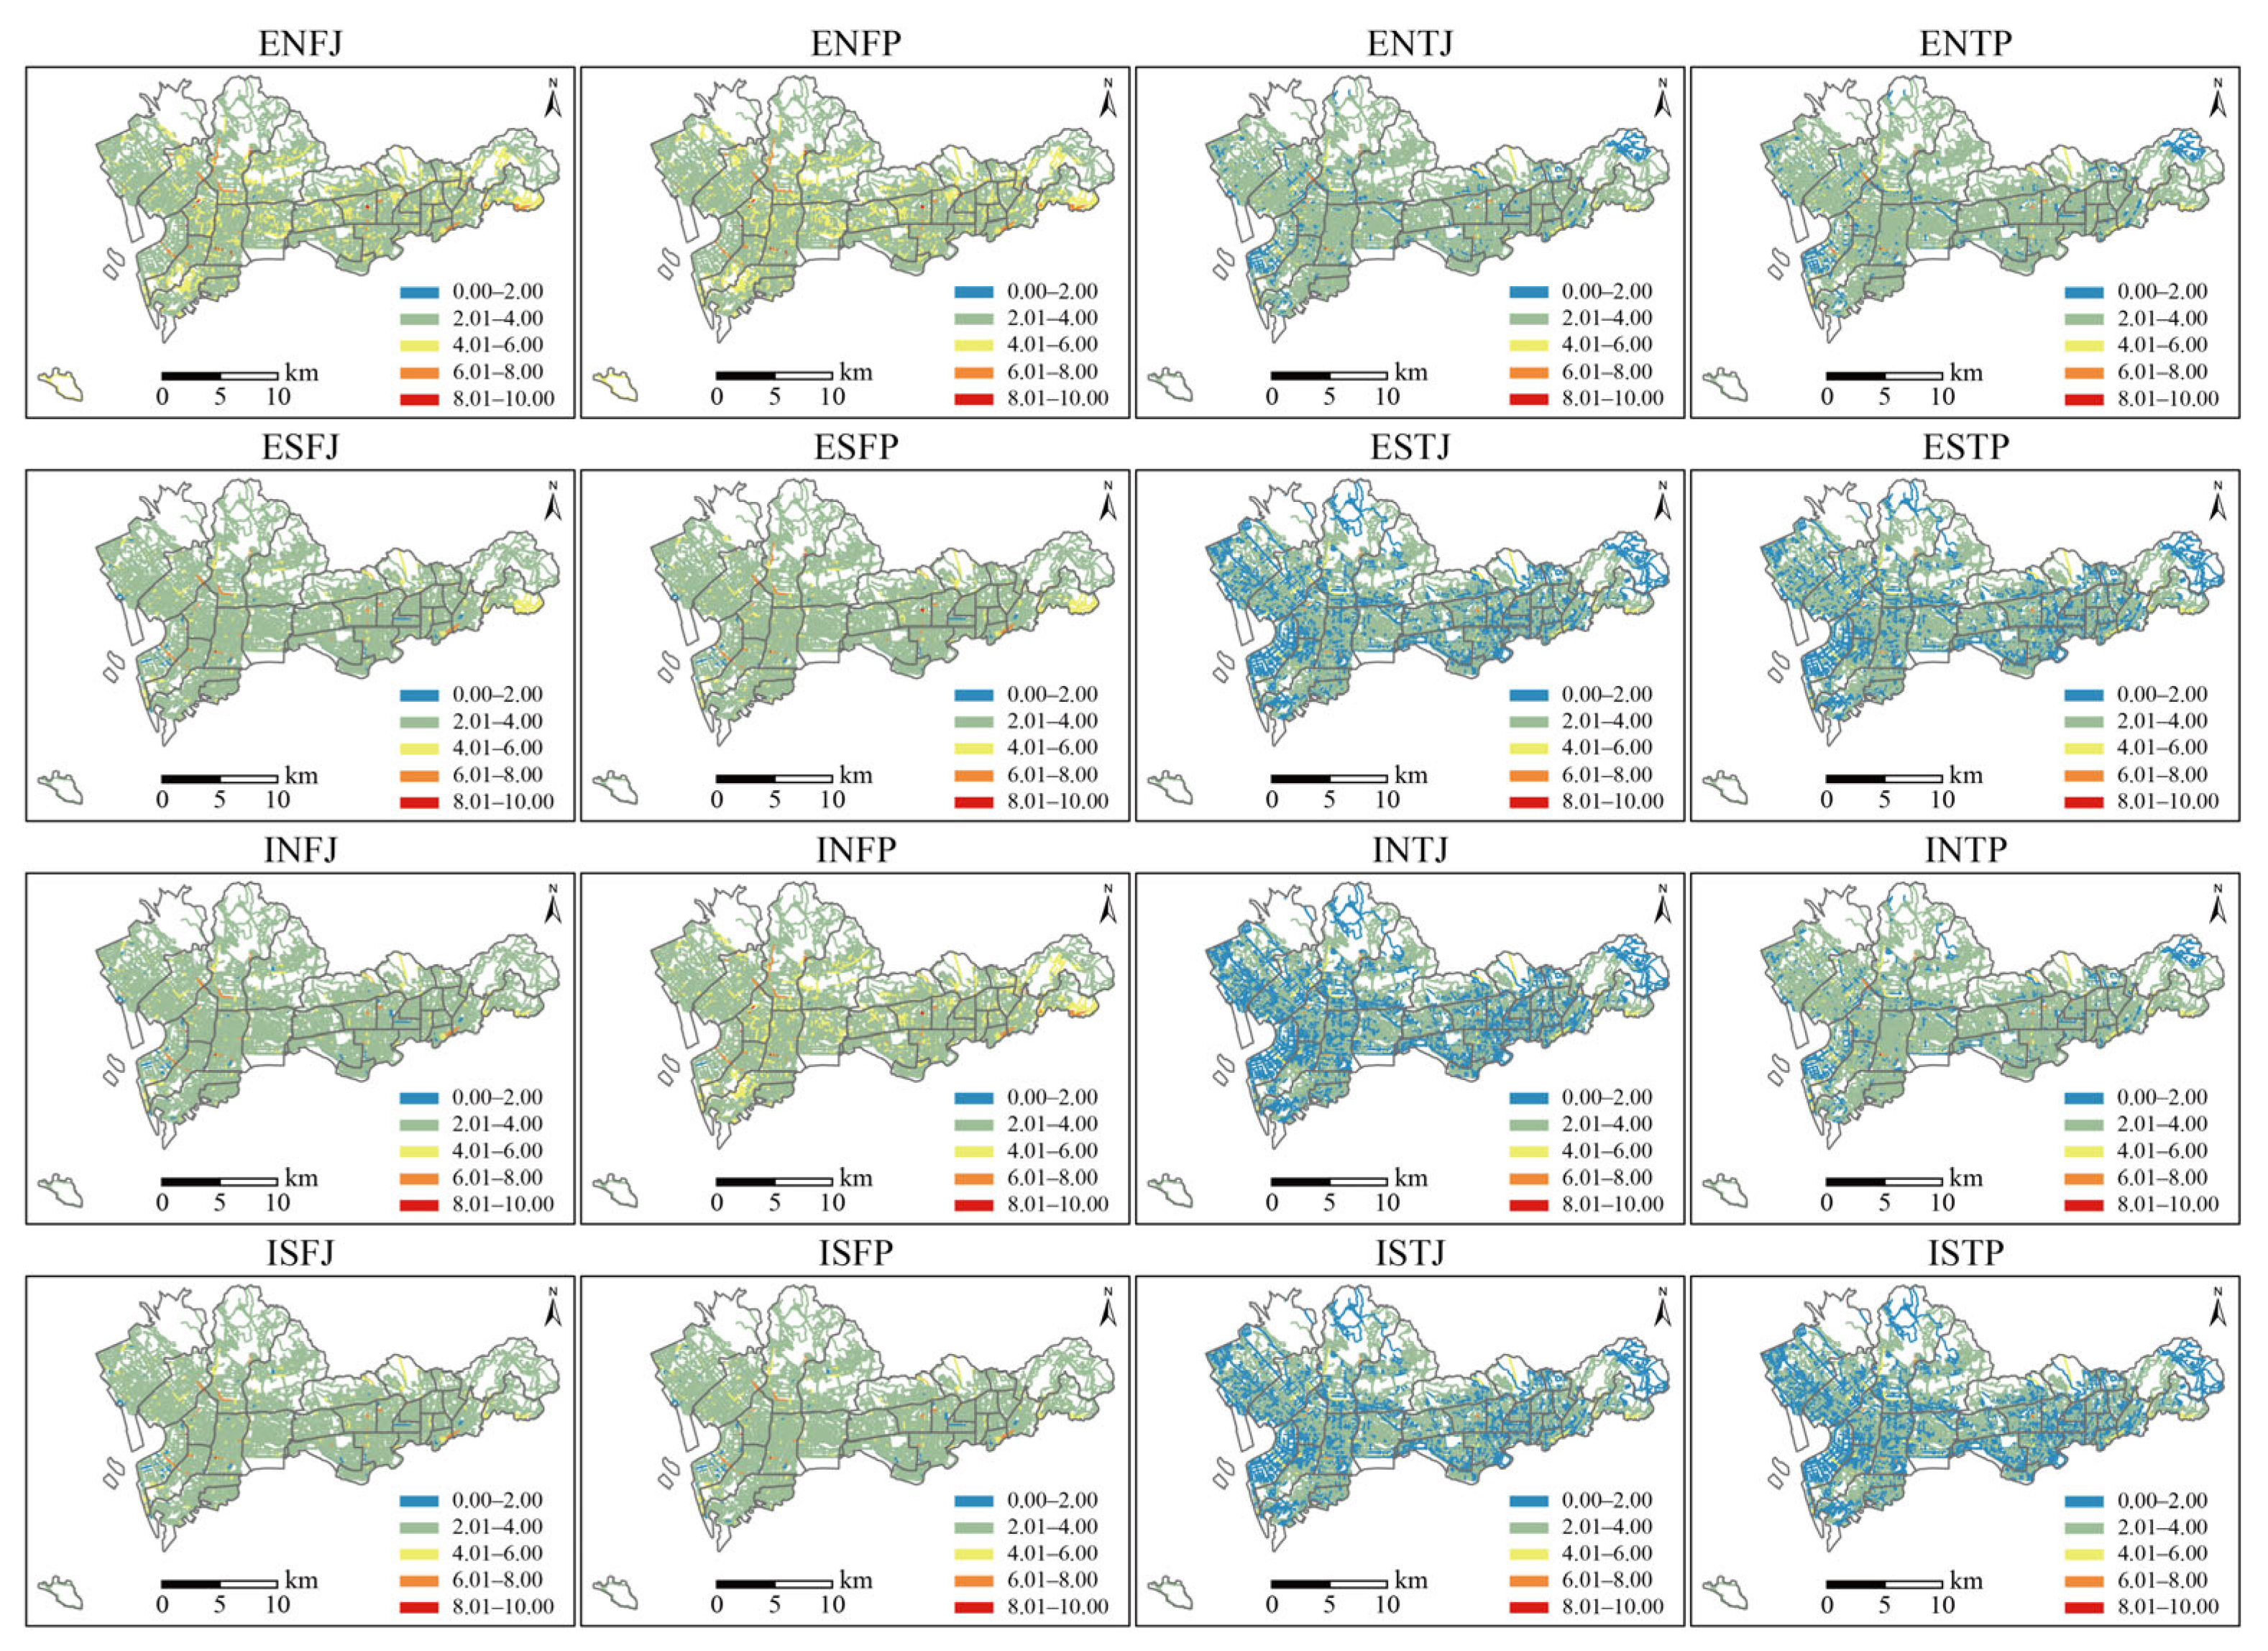
As shown in Figure 6, Figure 7, Figure 8, Figure 9, Figure 10 and Figure 11, cycling willingness across MBTI personality groups exhibits a consistent spatial pattern characterized by higher levels in central areas and lower levels in peripheral areas under all cycling contexts. Specifically, leisure and recovery as well as exploration and sightseeing display the highest levels of cycling willingness, followed by transport and commuting as well as social and group, whereas fitness and training as well as companionship and support show comparatively lower overall willingness. From a personality perspective, spatial distribution patterns are largely similar across MBTI types, with differences mainly manifested in the magnitude of willingness rather than in spatial structure. Specifically, across most contexts, E showed slightly higher mean willingness than I, although the magnitude of the difference was generally modest and became substantial mainly in the social and group context. In leisure and recovery, exploration and sightseeing, as well as social and group contexts, individuals with the N trait show higher willingness than those with the S trait, those with the F trait higher than those with the T trait, and those with the J trait lower than those with the P trait. In contrast, in fitness and training, transport and commuting, as well as companionship and support contexts, the opposite pattern is observed, with N lower than S, F lower than T, and J higher than P.
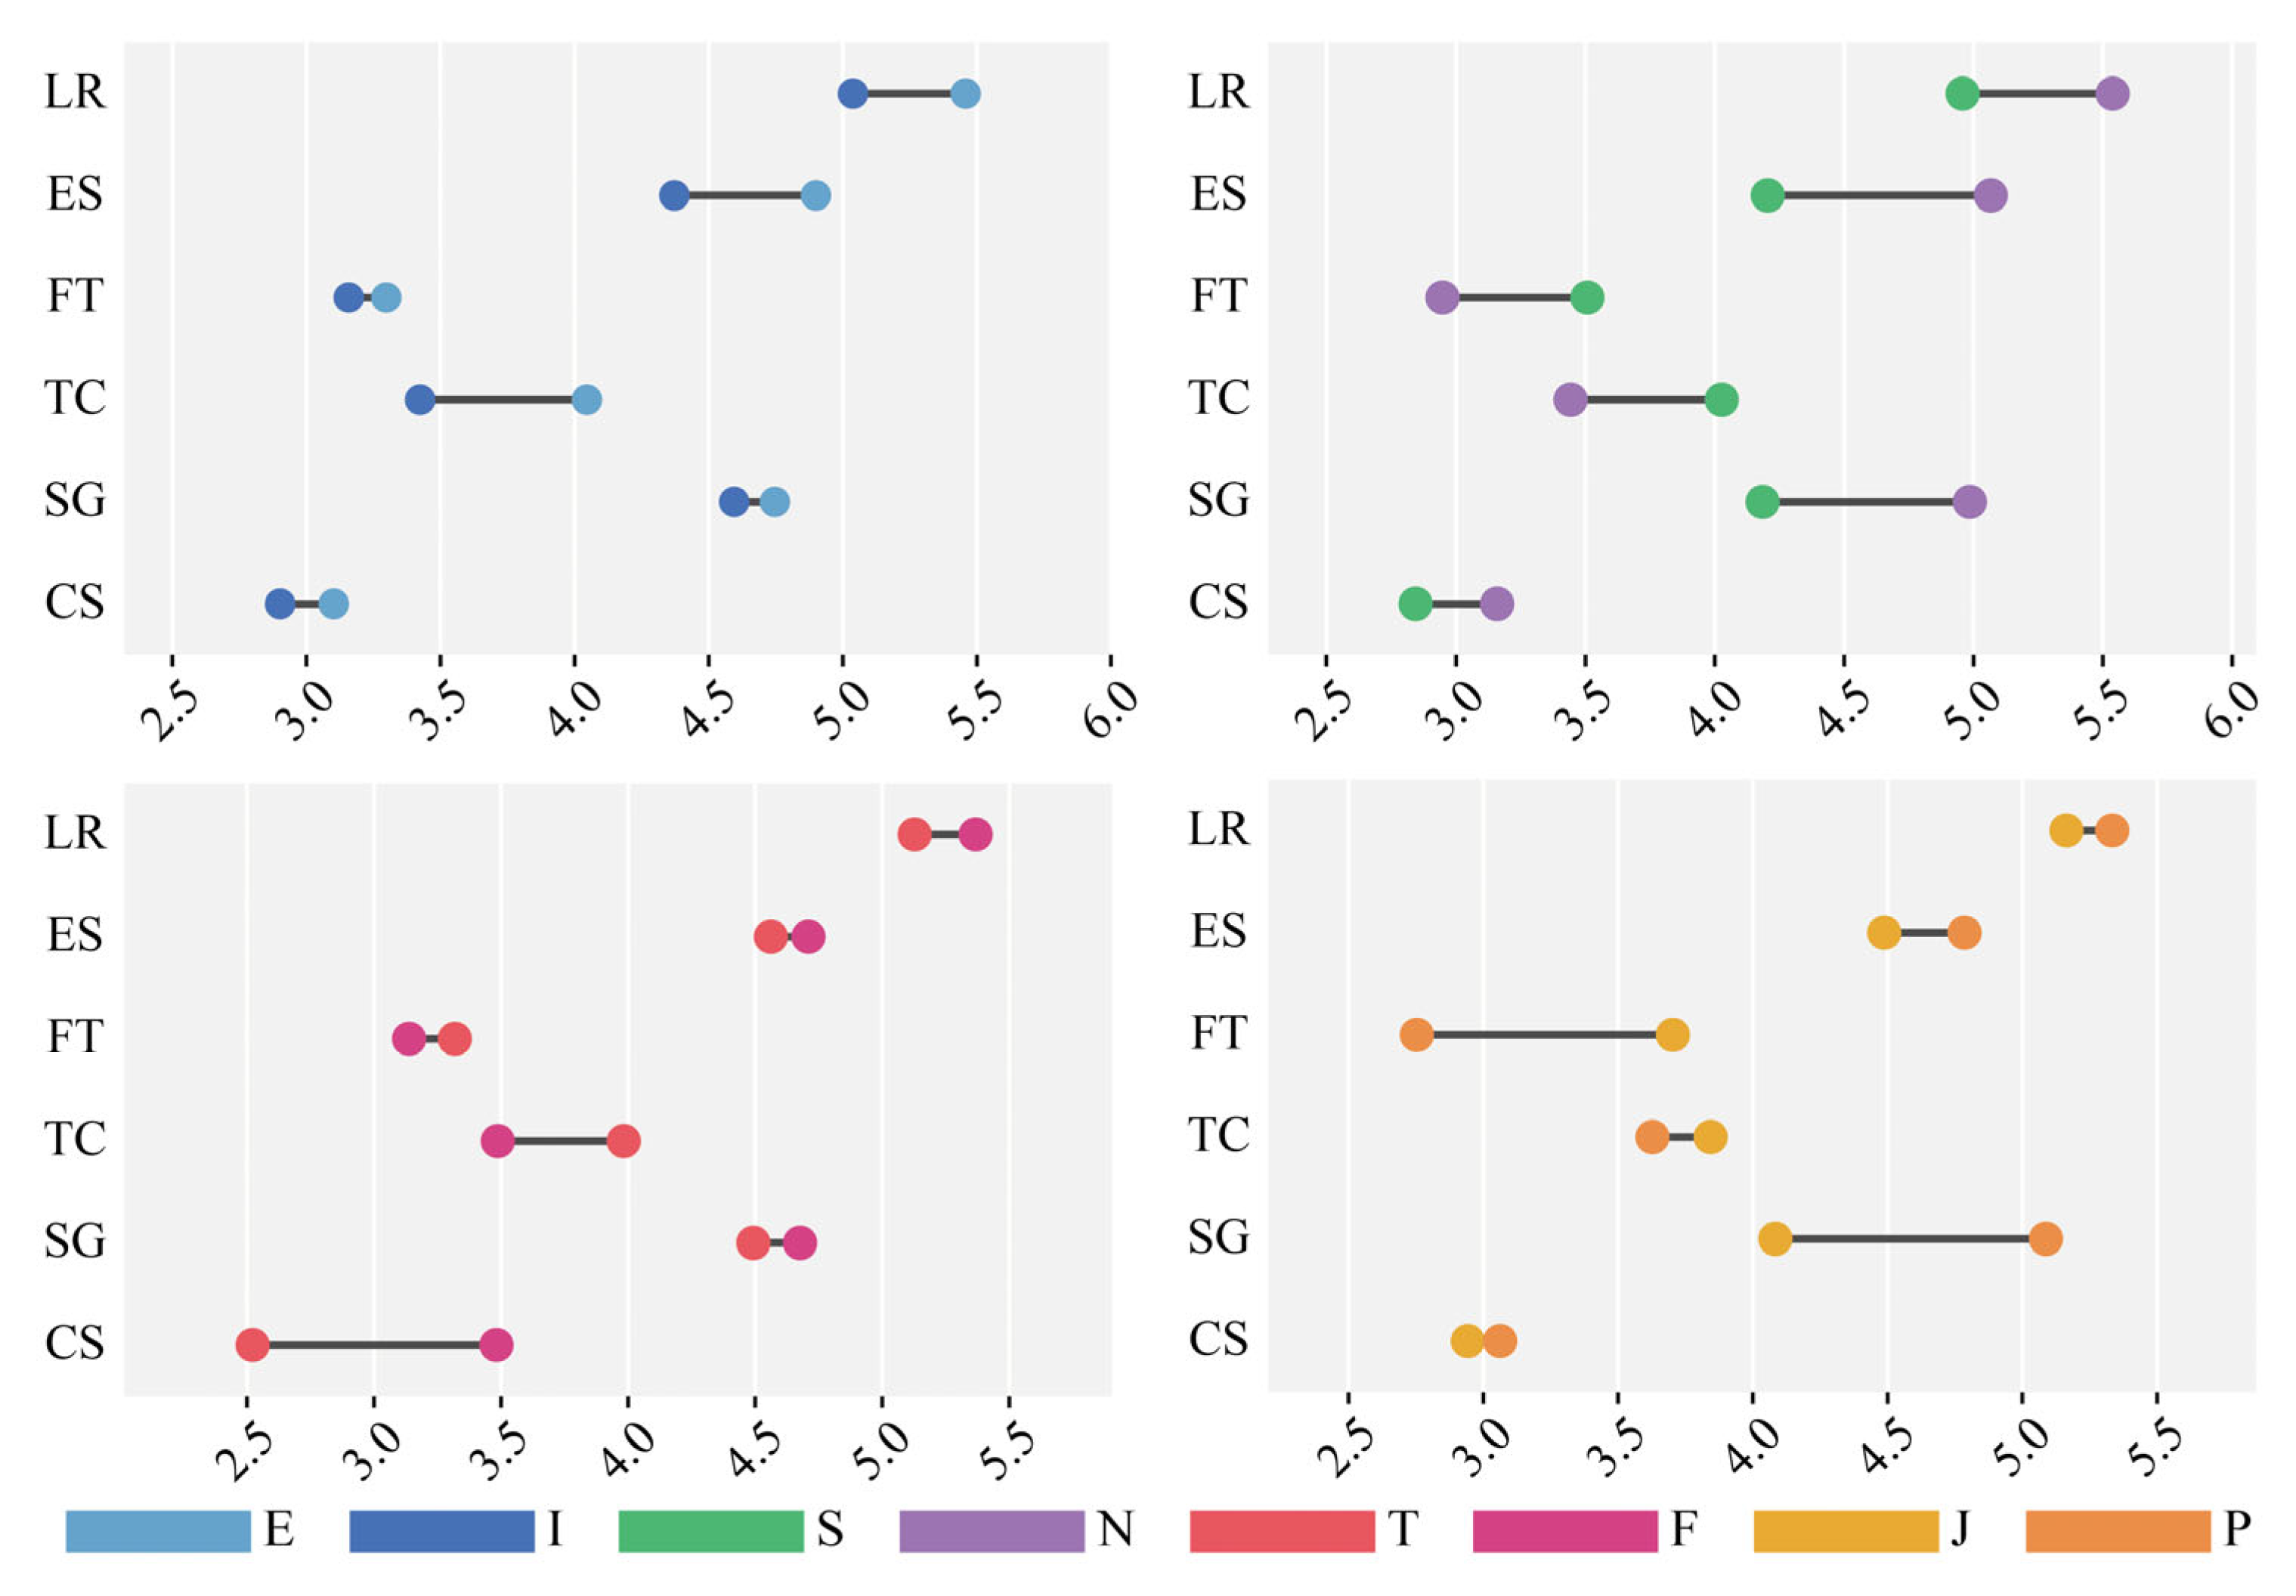
Across the six cycling contexts (Figure 12), the mean willingness scores differed across personality dimensions, although the magnitude of these differences varied by context and dimension. For E/I, E and I were generally comparable across contexts; the largest gap occurred in transport and commuting (E = 4.05, I = 3.42; Δ = 0.63), whereas their scores were almost identical in fitness and training. For the S/N dimension, contextual differences were more pronounced. In leisure and recovery and in exploration and sightseeing, N exceeded S by 0.58 and 0.86, respectively. In contrast, in fitness and training and in transport and commuting, S exceeded N by 0.56 and 0.80, respectively. For the T/F dimension, differences were generally moderate, with the largest divergence observed in companionship and support (F = 3.48, T = 2.52; Δ = 0.96), whereas most other contexts showed gaps of approximately 0.15–0.50. For the J/P dimension, the pattern was less consistent across contexts. J was markedly higher than P in fitness and training (Δ = 0.95), whereas P was markedly higher than J in social and group (Δ = 1.02).

5.4. Influencing Factors of Subjective and Objective Perspectives

As indicated in Table 6, under weekday conditions, IEI consistently exhibits the weakest influence across all cycling indicators, including cycling volume, duration, distance, and speed, whereas SGI, SOI, and PFI generally occupy higher tiers of influence. Among these, cycling volume and cycling speed show particularly strong sensitivity to SOI and PFI, while the effect of FAI remains moderate, falling between the high-impact elements and IEI. Under weekend conditions, the overall ranking of streetscape influences remains largely consistent with that observed on weekdays, although the relative importance of certain elements shifts across specific indicators. In particular, for cycling volume and cycling speed, SOI and PFI emerge as the most influential factors, with comparable effect magnitudes. Meanwhile, the relative importance of FAI increases across multiple indicators, whereas IEI continues to exhibit the weakest influence.
The results (Table 7) show that SGI, PFI, and FAI exhibit relatively stable positive effects across most cycling contexts, whereas the effect of SOI remains moderate overall, and the direction of IEI varies by context. Specifically, in the exploration and sightseeing as well as social and group contexts, SGI exerts the strongest influence, with coefficients of 12.47 and 15.01, respectively, substantially higher than in other contexts. In the fitness and training, transport and commuting, as well as companionship and support contexts, PFI shows comparatively higher effect sizes, with coefficients of 13.67, 10.65, and 13.60, respectively. Notably, IEI displays negative effects in the leisure and recovery as well as exploration and sightseeing contexts (−3.94 and −1.78), but shifts to positive effects in the remaining contexts, with coefficients ranging from 6.80 to 11.40. In addition, FAI demonstrates positive effects across all contexts and reaches relatively high levels in the social and group as well as companionship and support contexts, with coefficients of 10.01 and 10.20, respectively.
The interaction effect analysis indicates (Table A1, Table A2, Table A3, Table A4, Table A5 and Table A6) that personality traits exhibit strong context dependency in moderating the relationship between street elements and cycling willingness, while several relatively stable patterns can be identified overall. First, the moderating effects of SGI are primarily associated with the N and F traits and are most pronounced in the leisure and recovery as well as exploration and sightseeing contexts. For example, the coefficients of SGI × N reach 0.22 and 0.24 (p < 0.01), respectively. In contrast, this effect weakens substantially in task-oriented contexts and even becomes negative in some cases. Second, the moderating effect of SOI is most prominent among individuals with the J trait, particularly in the exploration and sightseeing and fitness and training contexts, where the interaction coefficients reach 0.26 and 0.13 (p < 0.01), indicating a stable coupling between spatial openness and preferences for structured environments. Third, the moderating effects of IEI display substantial variation in both direction and magnitude across contexts. In the fitness and training as well as transport and commuting contexts, IEI × J shows relatively strong positive effects (δ = 0.27 and 0.29, p < 0.01), whereas in the leisure and recovery as well as exploration and sightseeing contexts, interaction effects for certain traits (e.g., J and I) become negative, suggesting that the influence of spatial enclosure is strongly constrained by cycling purpose. Meanwhile, the moderating effects of PFI are mainly concentrated in the J and T traits and peak in the fitness and training as well as transport and commuting contexts, with coefficients of 0.31 (PFI × J) and 0.21 (PFI × T), respectively (p < 0.01). Finally, the moderating effects of FAI show consistent cross-context enhancement among individuals with the F trait, with particularly strong effects in the companionship and support as well as social and group contexts, where the coefficients of FAI × F reach 0.33 and 0.22 (p < 0.01), respectively, while moderating effects associated with other personality traits are comparatively weak.

6. Discussion

6.1. Interpretation of Heterogeneous Associations

Existing studies have primarily focused on the effects of demographic factors such as age and gender on cycling behavior, whereas our findings indicate that MBTI personality dimensions exhibit larger effect sizes in explaining differences in cycling willingness [54]. Although the Big Five remains the dominant framework in personality research, MBTI-style categorical distinctions may offer a more straightforward heuristic for segmenting users in applied transport planning contexts. In terms of transport behavior theory, this extends conventional explanations centered on socioeconomic attributes, the built environment, and travel costs by incorporating personality-based heterogeneity into the relationship between environmental perception and travel willingness.
In terms of research paradigm, this research moves beyond the conventional treatment of cycling as a single, homogeneous behavior by differentiating six cycling contexts based on distinct purposes, thereby systematically characterizing the heterogeneous mechanisms underlying cycling willingness across contexts. Moreover, by integrating large-scale objective bicycle-sharing data with subjective willingness data derived from streetscape perceptions, we conduct measurements from both objective and subjective perspectives, enabling a multidimensional examination of the factors influencing cycling behavior. These contributions provide new empirical evidence to support fine-grained street design and intervention strategies tailored to diverse population groups and cycling contexts.
In the leisure and recovery context, the interaction effects between N and SGI, as well as between F and FAI, are significantly amplified, indicating that cycling willingness in this context relies more heavily on personality mechanisms related to emotional restoration and meaning construction. Individuals with the N attribute are more sensitive to natural cues, and the sense of nature and restorative information conveyed by street greenery is more readily transformed into positive cycling motivation. In contrast, individuals with the F trait place greater emphasis on emotional experience and perceived support; facility accessibility helps reduce uncertainty and enhances the subjective feeling of being supported, thereby increasing their willingness to cycle [55]. By comparison, in contexts where the main effect of IEI is negative, the P trait exhibits a positive interaction effect, suggesting that perceiving-oriented individuals demonstrate stronger adaptability to ambiguous spatial boundaries. This finding is consistent with conclusions from environmental psychology, which suggest that N- and F-oriented individuals are more likely to derive restorative experiences from natural and supportive environments [56].
In the exploration and sightseeing context, the interaction between J and SOI is the most pronounced, whereas a clear negative interaction is observed between J and IEI, indicating that a structured cognitive style is particularly dependent on spatial visual cues. Psychological research suggests that individuals with the J trait cognitively prefer environments that are clear and predictable and tend to rely on spatial order to reduce information-processing load [57]. The visual openness captured by SOI enhances environmental legibility and the continuity of spatial logic, thereby strengthening cycling willingness among J-oriented individuals. By contrast, when IEI reflects a high degree of enclosure combined with unclear structural order, it may increase environmental uncertainty and cognitive load, making individuals with the J trait more prone to discomfort and a diminished sense of control [58].
In the fitness and training context, both IEI and PFI exhibit significant positive main effects, and stronger positive interactions are observed for the J, T, and S traits, reflecting the high dependence of this context on spatial structure and efficiency-relevant cues. Fitness-oriented activities are characterized by clear goals and stable rhythms, which are more likely to activate the task orientation and self-regulation mechanisms of J- and T-oriented individuals [59]. The sense of spatial boundary provided by IEI helps establish continuous movement paths and rhythm expectations, while the spatial scale and freedom of movement reflected by PFI directly influence the smoothness of action execution and perceived bodily control. These environmental cues align closely with the planning and efficiency preferences associated with the J and T traits. Meanwhile, individuals with the S trait rely more heavily on concrete and actionable perceptual cues; as a result, their fitness-related cycling willingness is more readily amplified in street environments with clear structure and well-defined spatial dimensions [60].
In the transport and commuting context, SGI exhibits a negative main effect, accompanied by a significant negative interaction between J and SGI. By contrast, under conditions where both IEI and PFI show positive main effects, positive interactions are more strongly concentrated among individuals with the J and T traits. This pattern reflects the emphasis of task-oriented cycling on time control and outcome certainty. One possible explanation is that in commuting-oriented judgments, visually greener environments may be perceived as less direct, less efficient, or less legible for rapid travel [61]. Conversely, the spatial definition and movement scale provided by IEI and PFI directly shape perceptions of route stability and efficiency, making these cues more readily incorporated into the rational decision-making processes of J- and T-oriented individuals.
In the social and group context, the interaction effects of the E trait with PFI and SOI are significantly strengthened, and the interaction between the F trait and FAI is also particularly pronounced, indicating that cycling willingness in this context is primarily driven by social motivation and emotional connection. Extraverted individuals rely more heavily on external stimulation and social interaction cues, and greater spatial openness and scale help reduce physical and psychological barriers in group activities, thereby enhancing participation willingness [62]. At the same time, individuals with the F trait are more sensitive to supportive and relational cues; the facility accessibility reflected by FAI is readily interpreted as social support and assurance for collective activities.
In the companionship and support context, the interaction between the F trait and FAI is the most pronounced, and stable positive interactions are also observed between the F trait and both PFI and SOI, indicating that cycling willingness in this context relies heavily on psychological mechanisms associated with emotional care and caregiving orientations [63]. Individuals with the F trait place greater emphasis on others’ feelings and relationship maintenance during decision-making, and the facility accessibility captured by FAI effectively reduces perceived risk and responsibility-related pressure during accompaniment, thereby substantially increasing cycling willingness. Moreover, favorable spatial scale and visual environments help enhance perceived safety and the quality of interaction during companionship activities, which explains the consistently positive moderating effects observed among individuals with the F trait. Related psychological research suggests that care-oriented personalities engaged in supportive behaviors are particularly sensitive to cues of environmental controllability and comfort, providing theoretical support for the prominent F-related interaction effects observed in the companionship and support context [64].

6.2. Practical Implications and Optimization Strategies

Given the fluid and largely uncontrollable nature of cycling purposes, and the fact that MBTI traits primarily moderate the magnitude, rather than the direction, of the effects of street visual elements, a functional-zoning-based and visual-element-oriented governance framework may therefore provide an appropriate basis for cycling-space optimization. On experience-oriented streets, priority should be given to increasing tree-canopy coverage, continuous hedges, flowering vegetation, and small stay-oriented green spaces, while reducing facade enclosure and improving sky visibility and overall environmental comfort, thereby better accommodating cyclists with stronger N and F traits. On task-oriented streets, optimization should focus on bicycle-lane width, physical separation from motorized traffic, roadside tree alignments, frontage orderliness, intersection visibility, and wayfinding systems, while reducing visual disturbance caused by disordered signage, illegal parking, and fragmented street interfaces, so as to better serve cyclists with stronger J and T traits. On relation-oriented streets, greater emphasis should be placed on seating, shading facilities, convenience and public-service nodes, pocket plazas, and slow-mobility signage to better support stopping, accompaniment, and everyday social interaction, particularly for cyclists with stronger E and F traits. Accordingly, street optimization should not aim at the uniform intensification of any single environmental feature, but at function-specific configurations of greenery, building frontages, open space, facility layout, and road-related elements, so as to improve environmental adaptability for different MBTI personality groups while maintaining safety and efficiency.

6.3. Research Limitations and Future Prospects

Although this study systematically examines the differentiated effects of street visual elements on objective cycling behaviors and subjective cycling willingness across different contexts and MBTI personality types, several limitations should be acknowledged. Firstly, MBTI is employed in this study as a tool for personality stratification. Although its typological classification provides considerable interpretive clarity and heuristic value for identifying group differences, it does not constitute a continuous psychological measurement in the strict psychometric sense. In particular, its dichotomous categorization may simplify nuanced individual differences and may not fully capture the complexity and continuity of personality traits. Therefore, the findings related to personality-based heterogeneity should be interpreted with appropriate caution. Future research could incorporate continuous trait models such as the Big Five framework for cross-validation, thereby enhancing the robustness and generalizability of the findings. Secondly, cycling willingness in this research is primarily derived from subjective evaluations under hypothetical contexts and has not been directly matched with individuals’ actual behavior. Subsequent studies could combine controlled cycling experiments or longitudinal behavioral data to further examine the relationship between stated willingness and revealed cycling behavior. Thirdly, due to inherent limitations in data availability, the most recent cycling data accessible for this research were from 2021, which may differ from current conditions. Future research should therefore incorporate more up-to-date data to further validate and extend the findings.

7. Conclusions

Using Shenzhen as a case study, this research systematically reveals the coupling relationships among street visual elements, cycling contexts, and personality traits. The results indicate that the objective regression outcomes and subjective willingness models are generally consistent in overall direction, although differences remain in the magnitude of effects and in the significance of certain elements. This suggests that streetscape preferences are broadly aligned with actual cycling behavior, while their translation into observed behavior may still be conditioned by structural factors such as destination distribution, road connectivity, demand density, and operational supply. Cycling context emerges as the primary structural variable explaining variations in cycling willingness, while personality dimensions provide a novel perspective and explanatory framework for understanding these differences. Cycling context as a six-level factor shows a significant main effect on willingness, and after controlling for street elements, the four MBTI dimensions retain independent main effects, demonstrating that personality-based stratification effectively captures behavioral preference differences embedded within contextual choices.
From an overall perspective, street visual elements exhibit a certain degree of stability in their effects on cycling willingness, yet their psychological meanings shift directionally across contexts. SGI, PFI, and FAI consistently promote cycling willingness in most contexts, reflecting the generally positive effects of natural visibility, spatial scale, and convenience. SOI exerts a moderate overall influence, whereas IEI exhibits pronounced contextual reversals, reducing cycling willingness in experience-oriented contexts while enhancing it in task and relation-oriented contexts. This finding suggests that the same spatial feature may be interpreted in fundamentally different ways depending on cycling purpose.
Furthermore, personality-based moderating effects are not evenly distributed but instead concentrate on a limited set of highly sensitive context–element–personality combinations. In experience-oriented cycling, individuals with N and F orientations are more likely to translate natural cues and facility convenience into motivations for restoration and experiential enjoyment. Task-oriented cycling relies more heavily on cues related to structural clarity and efficiency, thereby reinforcing the preferences of J-, T-, and S-oriented individuals. In contrast, relation-oriented cycling highlights the importance of extraversion in relation to open and activity-supportive spaces, as well as the heightened sensitivity of F-oriented individuals to supportive facilities.
Overall, this research demonstrates that cycling behavior is fundamentally a choice process jointly shaped by contextual goals, environmental cues, and individual psychological traits, thereby providing both theoretical and empirical foundations for fine-grained street design and mobility interventions tailored to multiple contexts and diverse population groups.

Author Contributions

Conceptualization, Chenfeng Xu; methodology, Chenfeng Xu and Yihan Li; software, Chenfeng Xu and Zhengyang Zou; validation, Yike Hu and Chenfeng Xu; formal analysis, Chenfeng Xu, Zibo Zhu, and Xing Geng; investigation, Chenfeng Xu and Zhengyang Zou; resources, Chenfeng Xu; data curation, Chenfeng Xu, Zhengyang Zou, and Yihan Li; writing—original draft preparation, Chenfeng Xu, Zibo Zhu, and Yihan Li; writing—review and editing, Chenfeng Xu and Yike Hu; visualization, Chenfeng Xu and Xing Geng; supervision, Chenfeng Xu; project administration, Yike Hu; funding acquisition, Chenfeng Xu. All authors have read and agreed to the published version of the manuscript.

Funding

This research was supported by the National Natural Science Foundation of China (NSFC) Key Project “Research on the Reconstruction of Contemporary Construction System Based on the Integrative Mechanism of ‘Architecture-Human-Environment’ in the Chinese Context” (Grant No. 52038007), awarded to Yike Hu.

Data Availability Statement

The data used to support the findings of this research are available from the corresponding author upon request.

Acknowledgments

The authors sincerely thank all the reviewers for their diligent efforts and insightful guidance.

Conflicts of Interest

The authors declare no conflicts of interest.

Abbreviations

The following abbreviations are used in this manuscript:
SGISpatial Green Index
SOISky Openness Index
IEIInterface Enclosure Index
PFIPath Freedom Index
FAIFacility Accessibility Index
LRLeisure and recovery
ESExploration and sightseeing
FTFitness and training
TCTransport and commuting
SGSocial and group
CSCompanionship and support
EExtraversion
IIntroversion
SSensing
NIntuition
TThinking
FFeeling
JJudging
PPerceiving

Appendix A

Table A1. Leisure and recovery cycling: street elements × personality traits.
AttributeSGI × AttributeSOI × AttributeIEI × AttributePFI × AttributeFAI × Attribute
E0.070.10−0.050.120.08
I−0.04−0.06−0.090.030.06
S−0.09−0.05−0.040.050.04
N0.220.080.03−0.020.07
F0.130.050.10−0.010.19
T0.020.02−0.080.11−0.06
J0.040.09−0.170.070.05
P0.050.030.15−0.040.02
Table A2. Exploration and sightseeing cycling: street elements × personality traits.
AttributeSGI × AttributeSOI × AttributeIEI × AttributePFI × AttributeFAI × Attribute
E0.060.11−0.030.090.07
I−0.03−0.04−0.080.020.05
S−0.12−0.06−0.050.040.03
N0.240.070.02−0.010.06
F0.050.040.06−0.070.10
T0.010.02−0.100.12−0.05
J0.080.26−0.140.130.09
P0.03−0.080.12−0.060.02
Table A3. Fitness and training cycling: street elements × personality traits.
AttributeSGI × AttributeSOI × AttributeIEI × AttributePFI × AttributeFAI × Attribute
E0.040.070.060.100.05
I−0.02−0.030.090.020.06
S0.060.040.180.110.04
N−0.07−0.050.04−0.060.03
F0.020.030.05−0.080.11
T0.050.060.160.19−0.02
J0.090.130.270.310.14
P−0.04−0.06−0.12−0.14−0.05
Table A4. Transport and commuting cycling: street elements × personality traits.
AttributeSGI × AttributeSOI × AttributeIEI × AttributePFI × AttributeFAI × Attribute
E−0.050.100.070.160.08
I−0.020.050.110.070.06
S−0.040.060.130.090.04
N0.120.080.180.140.10
F0.030.040.050.020.17
T−0.010.060.160.210.02
J−0.060.120.290.120.07
P0.020.03−0.080.050.05
Table A5. Social and group cycling: street elements × personality traits.
AttributeSGI × AttributeSOI × AttributeIEI × AttributePFI × AttributeFAI × Attribute
E0.150.190.080.260.13
I−0.04−0.060.120.070.06
S−0.030.020.100.050.04
N0.090.060.040.030.05
F0.060.100.060.080.22
T0.01−0.010.140.12−0.03
J−0.020.040.170.030.05
P0.050.08−0.090.060.07
Table A6. Companionship and support cycling: street elements × personality traits.
AttributeSGI × AttributeSOI × AttributeIEI × AttributePFI × AttributeFAI × Attribute
E0.030.060.050.040.07
I−0.010.020.100.030.06
S−0.020.030.110.060.04
N0.050.040.060.020.05
F0.120.140.090.160.33
T−0.030.010.150.12−0.08
J0.040.080.170.090.13
P00.02−0.070.050.06

References

  1. Clockston, R.L.M.; Rojas-Rueda, D. Health impacts of bike-sharing systems in the U.S. Environ. Res. 2021, 202, 111709. [Google Scholar] [CrossRef] [PubMed]
  2. Zhang, Y.; Fu, W.; Chao, H.; Mi, Z.; Kong, H. A comparative analysis of the potential of carbon emission reductions from shared micro-mobility. Sustain. Energy Technol. Assess. 2024, 72, 104088. [Google Scholar] [CrossRef]
  3. Guo, Y.; Yang, L.; Chen, Y. Bike share usage and the built environment: A review. Front. Public Health 2022, 10, 848169. [Google Scholar] [CrossRef]
  4. Yang, W.; Wu, C.; Zhang, Y.; Pan, Y.; Xie, X.; Tian, Z. Deciphering spatiotemporal patterns and mobility network of outdoor jogging utilizing large-scale GPS trajectory data. Cities 2025, 165, 106185. [Google Scholar] [CrossRef]
  5. Yang, W.; Fei, J.; Li, J.; Li, W.; Xie, X. Environmental determinants of dynamic jogging patterns: Insights from trajectory big data analysis and interpretable machine learning. Appl. Geogr. 2025, 178, 103596. [Google Scholar] [CrossRef]
  6. Yang, W.; Chen, H.; Fei, J.; Xie, X. The role of blue-green spaces in shaping leisure jogging: Explainable machine learning insights into jogging flow and duration. Travel Behav. Soc. 2025, 41, 101081. [Google Scholar] [CrossRef]
  7. Saheli, M.V.; Singleton, P.A.; Graul, A.R.H. Beyond time and cost: Exploring the importance of factors in travel mode choices. Travel Behav. Soc. 2025, 41, 101098. [Google Scholar] [CrossRef]
  8. Karatsoli, M.; Nathanail, E.; Basbas, S.; Cats, O. Crowdedness information and travel decisions of pedestrians and public transport users in the COVID-19 era: A stated preference analysis. Cities 2024, 149, 104973. [Google Scholar] [CrossRef]
  9. Roos, J.M.; Sprei, F.; Holmberg, U. Traits and transports: The effects of personality on the choice of urban transport modes. Appl. Sci. 2022, 12, 1467. [Google Scholar] [CrossRef]
  10. Zarate-Torres, R.; Correa, J.C. How good is the Myers-Briggs Type Indicator for predicting leadership-related behaviors? Front. Psychol. 2023, 14, 940961. [Google Scholar] [CrossRef]
  11. Huang, J.; Fang, C. Does shadow matter? Exploring the influence of shade provision on cycling activity from the perspective of urban climate resilience. Sustain. Cities Soc. 2026, 136, 107103. [Google Scholar] [CrossRef]
  12. Xu, H.; Jiang, Y.; Xue, T.; Wang, Z.; Fang, Y.; Huang, X. Exploring the impact of objective features and subjective perceptions of street environment on cycling preferences. Cities 2026, 168, 106434. [Google Scholar] [CrossRef]
  13. Wu, J.; Li, Q.; Feng, Y.; Bhuyan, S.S.; Tarimo, C.S.; Zeng, X.; Wu, C.; Chen, N.; Miao, Y. Active commuting and the risk of obesity, hypertension and diabetes: A systematic review and meta-analysis of observational studies. BMJ Glob. Health 2021, 6, e005838. [Google Scholar] [CrossRef]
  14. Lin, Y.; Yang, X.; Liang, F.; Huang, K.; Liu, F.; Li, J.; Xiao, Q.; Chen, J.; Liu, X.; Cao, J.; et al. Benefits of active commuting on cardiovascular health modified by ambient fine particulate matter in China: A prospective cohort study. Ecotoxicol. Environ. Saf. 2021, 224, 112641. [Google Scholar] [CrossRef]
  15. Hou, C.; Zhang, Y.; Zhao, F.; Lv, Y.; Luo, M.; Pan, C.; Ding, D.; Chen, L. Active travel mode and incident dementia and brain structure. JAMA Netw. Open 2025, 8, e2514316. [Google Scholar] [CrossRef]
  16. Friel, C.; Walsh, D.; Whyte, B.; Dibben, C.; Feng, Z.; Baker, G.; Kelly, P.; Demou, E.; Dundas, R. Health benefits of pedestrian and cyclist commuting: Evidence from the Scottish Longitudinal Study. BMJ Glob. Health 2024, 2, e001295. [Google Scholar] [CrossRef]
  17. Berrie, L.; Feng, Z.; Rice, D.; Clemens, T.; Williamson, L.; Dibben, C. Does cycle commuting reduce the risk of mental ill-health? An instrumental variable analysis using distance to nearest cycle path. Int. J. Epidemiol. 2024, 53, dyad153. [Google Scholar] [CrossRef]
  18. Fan, J.; Zhang, X.; Jia, X.; Fan, Z.; Yang, C.; Wang, Y.; Zhao, C.; Wang, N.; Shi, X.; Yang, Y. Association of active commuting with incidence of depression and anxiety: Prospective cohort study. Transl. Psychiatry 2025, 15, 39. [Google Scholar] [CrossRef]
  19. Wu, J.; Wang, B.; Wang, R.; Ta, N.; Chai, Y. Active travel and the built environment: A theoretical model and multidimensional evidence. Transp. Res. Part D Transp. Environ. 2021, 100, 103029. [Google Scholar] [CrossRef]
  20. Schön, P.; Heinen, E.; Manum, B. A scoping review on cycling network connectivity and its effects on cycling. Transp. Rev. 2024, 44, 912–936. [Google Scholar] [CrossRef]
  21. Gao, M.; Fang, C. Deciphering urban cycling: Analyzing the nonlinear impact of street environments on cycling volume using crowdsourced tracker data and machine learning. J. Transp. Geogr. 2025, 124, 104179. [Google Scholar] [CrossRef]
  22. Zeng, Q.; Gong, Z.; Wu, S.; Zhuang, C.; Li, S. Measuring cyclists’ subjective perceptions of the street riding environment using K-means SMOTE-RF model and street view imagery. Int. J. Appl. Earth Obs. Geoinf. 2024, 128, 103739. [Google Scholar] [CrossRef]
  23. Huber, S.; Lindemann, P.; Schröter, B. Safety and bicycle route choice: To what extent do accident risk and perceived safety influence bicycle route choice? Transp. Eng. 2024, 18, 100240. [Google Scholar] [CrossRef]
  24. Gao, M.; Fang, C. Decoding the impact of audiovisual street environment features on cycling volumes: Insights from street view imagery and machine learning. Transp. Res. Part A Policy Pract. 2025, 199, 104586. [Google Scholar] [CrossRef]
  25. Troped, P.J.; Brenner, P.S.; Wilson, J.S. Associations between the built and social environment and bike share, physical activity, and overall cycling among adults from Boston neighborhoods. J. Transp. Health 2023, 31, 101629. [Google Scholar] [CrossRef]
  26. Beirens, B.J.H.; Mertens, L.; Deforche, B.; Weghe, N.V.d.; Boussauw, K.; Dyck, D.V. Which street characteristics support cycling for transport among vulnerable groups in traffic: A think-aloud study in virtual reality. J. Transp. Geogr. 2024, 120, 103986. [Google Scholar] [CrossRef]
  27. Tortosa, E.V.; Lovelace, R.; Heinen, E.; Mann, R.P. Cycling behaviour and socioeconomic disadvantage: An investigation based on the English National Travel Survey. Transp. Res. Part A Policy Pract. 2021, 152, 173–185. [Google Scholar] [CrossRef]
  28. Charreire, H.; Rod, C.; Feuillet, T.; Piombini, A.; Bardos, H.; Rutter, H.; Compernolle, S.; Mackenbach, J.D.; Lakerveld, J.; Oppert, J.M. Walking, cycling, and public transport for commuting and non-commuting travels across 5 European urban regions: Modal choice correlates and motivations. J. Transp. Geogr. 2021, 96, 103196. [Google Scholar] [CrossRef]
  29. Rupi, F.; Freo, M.; Poliziani, C.; Postorino, M.N.; Schweizer, J. Analysis of gender-specific bicycle route choices using revealed preference surveys based on GPS traces. Transp. Policy 2023, 133, 1–14. [Google Scholar] [CrossRef]
  30. Braun, L.M. Barriers to cycling, barriers to health equity: Disparities in perceived cycling environments in the U.S. J. Cycl. Micromobility Res. 2025, 4, 100066. [Google Scholar] [CrossRef]
  31. Jahanshahi, D.; Costello, S.B.; Dirks, K.N.; van Wee, B. Biking and belonging: Understanding the role of socio-cultural influences on cycling in Auckland. Transp. Res. Part A Policy Pract. 2025, 199, 104599. [Google Scholar] [CrossRef]
  32. Poier, S.; Nikodemska-Wołowik, A.M.; Suchanek, M. Should I buy or should I go? The effect of the big five personality traits and satisfaction with life on E-bike ownership in Germany. Transp. Policy 2025, 162, 188–199. [Google Scholar] [CrossRef]
  33. Useche, S.A. Measuring sensation seeking in urban cyclists: Development and validation of the SSC scale. Transp. Res. Part F Traffic Psychol. Behav. 2025, 111, 45–59. [Google Scholar] [CrossRef]
  34. Guan, H.; Zhang, W.; Huang, B.; Xu, Y.; Hong, W. How urban street-scape visual features influence carbon emissions from residents visiting urban parks: A case study of Shenzhen, China. Landsc. Urban Plan. 2026, 266, 105531. [Google Scholar] [CrossRef]
  35. Zhang, T.; Tang, F.; Hu, Y.; Zhang, L.; Guo, Y. Shaping greener mobility: Impact of urban greening structure on time-dependent bike-sharing usage. Transp. Res. Part D Transp. Environ. 2025, 141, 104657. [Google Scholar] [CrossRef]
  36. Xia, T.; Cheng, Y.; Wei, X.; Zhang, J.; Yin, Y.; Qiu, M.; Mao, Y.; Xu, H.; Zhao, B.; Zhang, J. Cycling in the shade: Uncovering the spatiotemporal heterogeneity of building and vegetation shading on dockless bike-sharing usage during hot summer days. Landsc. Urban Plan. 2026, 267, 105538. [Google Scholar] [CrossRef]
  37. Lv, G.; Zheng, S.; Chen, H. Spatiotemporal assessment of carbon emission reduction by shared bikes in Shenzhen, China. Sustain. Cities Soc. 2024, 100, 105011. [Google Scholar] [CrossRef]
  38. Li, M.; Xu, C.; Hu, Y.; Zou, Z.; Wang, X.; Chen, F.; Feng, Z.; Zhu, Z.; Huang, H.; Geng, X.; et al. Spatiotemporal impact mechanisms of urban multidimensional form on land surface temperature: A case study of representative cities in five climate zones of China. Hum. Settl. Sustain. 2025, 1, 275–289. [Google Scholar] [CrossRef]
  39. Liu, L.; Gan, X.; Ren, Z.; Hang, J.; Zhang, X.; Ji, Y. Mapping approach for emotional response to urban visual environments based on street view images and EEG signals. Build. Simul. 2025, 18, 2697–2721. [Google Scholar] [CrossRef]
  40. Ma, S.; Wang, B.; Liu, W.; Zhou, H.; Wang, Y.; Li, S. Assessment of street space quality and subjective well-being mismatch and its impact, using multi-source big data. Cities 2024, 147, 104797. [Google Scholar] [CrossRef]
  41. Lu, S.; Oh, W.; Ooka, R.; Wang, L. Effects of Environmental Features in Small Public Urban Green Spaces on Older Adults’ Mental Restoration: Evidence from Tokyo. Int. J. Environ. Res. Public Health 2022, 19, 5477. [Google Scholar] [CrossRef]
  42. Rui, J. Measuring streetscape perceptions from driveways and sidewalks to inform pedestrian-oriented street renewal in Düsseldorf. Cities 2023, 141, 104472. [Google Scholar] [CrossRef]
  43. Huang, Y.; Sanatani, R.P.; Liu, C.; Kang, Y.; Zhang, F.; Liu, Y.; Duarte, F.; Ratti, C. No “true” greenery: Deciphering the bias of satellite and street view imagery in urban greenery measurement. Build. Environ. 2025, 269, 112395. [Google Scholar] [CrossRef]
  44. Shen, Z.; Xie, D.; Su, C. Street view image-based method for assessing the thermal environment in urban historic districts: A case study of Guangzhou’s arcade streets. Build. Environ. 2026, 288, 114022. [Google Scholar] [CrossRef]
  45. Ye, Y.; Li, T. Large-scale winter streetscape perception assessments via integrating street view images with generative AI technique. Build. Environ. 2026, 293, 114335. [Google Scholar] [CrossRef]
  46. Chen, N.; Wang, L.; Xu, T.; Wang, M. Perception of urban street visual color environment based on the CEP-KASS framework. Landsc. Urban Plan. 2025, 259, 105359. [Google Scholar] [CrossRef]
  47. Koo, B.W.; Hwang, U.; Guhathakurta, S. Streetscapes as part of servicescapes: Can walkable streetscapes make local businesses more attractive? Comput. Environ. Urban Syst. 2023, 106, 102030. [Google Scholar] [CrossRef]
  48. Liu, F.; Lu, Y.; Song, Q.; Qiu, W.; Liu, D. The association of subjective physical disorder and pedestrian volume: A big urban data and machine-learning approach. Comput. Environ. Urban Syst. 2025, 122, 102348. [Google Scholar] [CrossRef]
  49. Ye, X.; Wang, Y.; Dai, J.; Qiu, W. Generated nighttime street view image to inform perceived safety divergence between day and night in high density cities: A case study in Hong Kong. J. Urban Manag. 2024, 14, 379–401. [Google Scholar] [CrossRef]
  50. Zhu, K.; Gu, Y.; Zhang, Y.; Song, Y.; Guo, Z.; Yan, X.; Yao, Y.; Guan, Q.; Li, X. From street view imagery to the countryside: Large-scale perception of rural China using deep learning. Ann. Am. Assoc. Geogr. 2025, 115, 1720–1741. [Google Scholar] [CrossRef]
  51. Ma, H.; Li, J.; Ye, X. Deep learning meets urban design: Assessing streetscape aesthetic and design quality through AI and cluster analysis. Cities 2025, 162, 105939. [Google Scholar] [CrossRef]
  52. Song, M.; Xiao, Y. Does streetscape color matter for urban perceptions? A deep learning approach to street view images. Land Use Policy 2025, 155, 107581. [Google Scholar] [CrossRef]
  53. Wei, J.; Yue, W.; Li, M.; Gao, J. Mapping human perception of urban landscape from street-view images: A deep-learning approach. Int. J. Appl. Earth Obs. Geoinf. 2022, 112, 102886. [Google Scholar] [CrossRef]
  54. Francis, L.J.; Village, A. The Francis Psychological Type Scales (FPTS): Factor structure, internal consistency reliability, and concurrent validity with the MBTI. Ment. Health Relig. Cult. 2022, 25, 931–951. [Google Scholar] [CrossRef]
  55. Rui, J.; Xu, Y. Beyond built environment: Unveiling the interplay of streetscape perceptions and cycling behavior. Sustain. Cities Soc. 2024, 109, 105525. [Google Scholar] [CrossRef]
  56. Gholamzadehmir, M.; Sparks, P.; Farsides, T. Moral licensing, moral cleansing and pro-environmental behaviour: The moderating role of pro-environmental attitudes. J. Environ. Psychol. 2019, 65, 101334. [Google Scholar] [CrossRef]
  57. Jiang, W.; Li, Q.; Li, J.; Zhu, Z. Differentiated impacts of urban streetscapes on green mobility experiences. J. Asian Archit. Build. Eng. 2025, 11, 1–17. [Google Scholar] [CrossRef]
  58. Zhang, H.; Nijhuis, S.; Newton, C.; Tao, Y. Healthy urban blue space design: Exploring the associations of blue space quality with recreational running and cycling using crowdsourced data. Sustain. Cities Soc. 2024, 117, 105929. [Google Scholar] [CrossRef]
  59. Li, Y.; Tseng, H.; Yang, B.; Mills, M.E.C.; Yu, W. Personality preferences and stress perception among nursing students in different nursing programmes: A cross-sectional study. BMC Med. Educ. 2025, 25, 382. [Google Scholar] [CrossRef]
  60. Kaiser, F.G.; Merten, M.; Wetzel, E. How do we know we are measuring environmental attitude? Specific objectivity as the formal validation criterion for measures of latent attributes. J. Environ. Psychol. 2018, 55, 139–146. [Google Scholar] [CrossRef]
  61. Fischer, C.; Heider, J.; Taylor, J.E.; Schröder, A. Cognitive behavior therapy for driving fear: A pilot randomized controlled trial. Transp. Res. Part F Traffic Psychol. Behav. 2021, 83, 118–129. [Google Scholar] [CrossRef]
  62. Fabio, A.D.; Saklofske, D.H. The relationship of compassion and self-compassion with personality and emotional intelligence. Personal. Individ. Differ. 2021, 169, 110109. [Google Scholar] [CrossRef]
  63. Butt, S.; Sidorov, G.; Gelbukh, A. Interpretation of Myers–Briggs Type Indicator personality profiles based on ambivert continuum scale. Expert Syst. Appl. 2025, 264, 125689. [Google Scholar] [CrossRef]
  64. Sesker, A.A.; Strickhouser, J.E.; Luchetti, M.; Lee, J.H.; Aschwanden, D.; Terracciano, A.; Sutin, A.R. Cognition and the development of temperament from late childhood to early adolescence. J. Res. Personal. 2021, 95, 104163. [Google Scholar] [CrossRef] [PubMed]
Figure 1. Location of the study area: (a) Shenzhen; (b) urban area of Shenzhen.
Ijgi 15 00179 g001
Figure 2. Research framework.
Ijgi 15 00179 g002
Figure 3. Spatial distribution of street visual elements. (a) Spatial Green Index, (b) Sky Openness Index, (c) Interface Enclosure Index, (d) Path Freedom Index, (e) Facility Accessibility Index, and (f) boxplots of different indicators.
Ijgi 15 00179 g003
Figure 4. Spatial distribution of objective cycling indicators on weekdays and weekends: (a,b) Cycling volume, (c,d) Cycling distance, (e,f) Cycling duration, and (g,h) Cycling speed.
Ijgi 15 00179 g004
Figure 5. Spatial clustering of hot and cold spots for different indicators on weekdays and weekends: (a,b) Cycling volume, (c,d) Cycling distance, (e,f) Cycling duration, and (g,h) Cycling speed.
Ijgi 15 00179 g005
Figure 6. Spatial distribution of cycling willingness scores for leisure and recovery cycling context.
Ijgi 15 00179 g006
Figure 7. Spatial distribution of cycling willingness scores for exploration and sightseeing cycling context.
Ijgi 15 00179 g007
Figure 8. Spatial distribution of cycling willingness scores for fitness and training cycling context.
Ijgi 15 00179 g008
Figure 9. Spatial distribution of cycling willingness scores for transport and commuting cycling context.
Ijgi 15 00179 g009
Figure 10. Spatial distribution of cycling willingness scores for social and group cycling context.
Ijgi 15 00179 g010
Figure 11. Spatial distribution of cycling willingness scores for companionship and support cycling context.
Ijgi 15 00179 g011
Figure 12. Comparison of mean ratings across different MBTI traits in six contexts.
Ijgi 15 00179 g012
Table 1. Evaluation indicators and formulas of street space quality.
FormulaDescription
SGI   =   S vegetation S total   ×   100% (1)SGI reflects the proportion of visible greenery from cyclists’ street–level perspective.
SOI   =   S sky S total   ×   100% (2)SOI represents the proportion of the sky visible in cyclists’ field of view while cycling along the street.
IEI   = S curb + S fence + S guard   rail + S barrier + S wall + S building S total   ×   100 % (3)IEI captures the degree of spatial enclosure perceived by cyclists from surrounding interfaces like building facades and walls.
PFI   =   S road + S service   lane + S sidewalk + S bridge S total   ×   100% (4)PFI measures the relative spaciousness of cycling areas.
FAI   =   S facility S total   ×   100%(5)FAI reflects the ease with which cyclists can access daily–use facilities within the street environment.
Where S curb , S fence , S guard   rail , S barrier , S wall , S building , S road , S service   lane , S sidewalk , S bridge , S facility are the pixel areas of curb, fence, guard rail, barrier, wall, building, road, service lane, sidewalk, bridge, and different facilities (including traffic lights, traffic signs, poles, and related roadside elements) in the street view image, respectively, and S total is the total pixel area of the image.
Table 2. Behavioral motivations and characteristics across the six cycling contexts.
Primary DimensionSecondary DimensionBehavioral MotivationsBehavioral Characteristics
Experience-orientedLeisure and recovery (LR)Relaxation, stress relief, and enjoyment of the cycling processLow speed, frequent stops, flexible routes, landscape-oriented
Exploration and sightseeing (ES)Novelty seeking, place exploration, urban or natural experiencesHigh likelihood of detours or backtracking, photo stops, variable routes
Task-orientedFitness and training (FT)Fitness maintenance, physical conditioning, habitual trainingModerate and stable speed, relatively fixed routes, few stops, controllable time and distance
Transport and commuting (TC)Time saving, integration of commuting and exerciseClear goals, optimal routes, strong traffic constraints, minimal stopping
Relation-orientedSocial and group (SG)Social interaction, community participation, group activitiesPace influenced by the group, frequent interaction-related stops, preference for safer and controllable routes
Companionship and support (CS)Accompaniment, caregiving, assisting novices or parent–child interaction, emotional supportSpeed determined by the accompanied person, frequent stops, stronger risk avoidance, more conservative route choices
Table 3. Results of the multifactor ANOVA across different MBTI traits in six contexts.
SourceSum of SquaresDegrees of FreedomMean SquareFp
Intercept159,207.841159,207.8411,371.99<0.001 ***
E/I238.141238.1417.01<0.001 ***
S/N64.03164.034.570.033 *
T/F146.031146.0310.430.001 **
J/P88.17188.176.300.012 *
Cycling context6298.5451259.7189.99<0.001 ***
Error13,298.4195014
Note: The *, **, *** in the table represent significance levels: * p < 0.05, ** p < 0.01, *** p < 0.001.
Table 4. Descriptive statistics of area proportions for different street elements.
TypeMaximumMinimumMeanStandard DeviationMedianVariance
SGI0.6000.170.120.150.02
SOI1.0000.260.110.280.01
IEI0.7800.090.070.080.01
PFI0.8300.120.060.110.01
FAI0.7300.030.030.020.00
Table 5. Descriptive statistics of objective cycling indicators.
TypeVariableMaximumMinimumMeanStandard DeviationMedianVariance
WeekdaysCycling volume5986132.84121.76314,825.50
Cycling distance33.950.100.631.080.541.17
Cycling duration201.341.036.489.425.7188.74
Cycling speed29.841.913.626.9115.147.75
WeekendsCycling volume7284136.47128.95416,628.12
Cycling distance34.760.100.631.190.571.42
Cycling duration236.181.026.579.066.2382.08
Cycling speed33.921.9513.956.5415.742.77
Table 6. Regression coefficients of different visual elements affecting objective cycling behavior.
TypeVariableSGISOIIEIPFIFAI
WeekdaysCycling volume126.8149.2−39.8139.493.6
Cycling duration17.218.3−7.415.910.5
Cycling distance1.471.71−0.681.531.01
Cycling speed6.628.26−2.316.954.88
WeekendsCycling volume143.9164.1−44.7163.5102.8
Cycling duration16.318.05−6.115.911.1
Cycling distance1.261.39−0.421.430.83
Cycling speed7.258.3−1.128.716.02
Table 7. Coefficients of street elements influencing cycling willingness across different contexts.
ContextsSGISOIIEIPFIFAI
Leisure and recovery9.865.91−3.941.977.89
Exploration and sightseeing12.477.12−1.783.565.34
Fitness and training9.124.5611.4013.674.56
Transport and commuting−1.078.527.4510.655.32
Social and group15.015.007.5012.5110.01
Companionship and support8.505.106.8013.6010.20
Disclaimer/Publisher’s Note: The statements, opinions and data contained in all publications are solely those of the individual author(s) and contributor(s) and not of MDPI and/or the editor(s). MDPI and/or the editor(s) disclaim responsibility for any injury to people or property resulting from any ideas, methods, instructions or products referred to in the content.