


Abstract
Road traffic safety is central to socially resilient and sustainable cities, yet many middle-income countries lack harmonized subnational data on exposure, infrastructure, and enforcement. This study examines whether routinely available demographic composition can serve as a practical structural baseline for provincial traffic accident rates and as a diagnostic layer for richer safety models. Using official province–year data from Türkiye (2008–2019 and 2022–2024; n = 1215), demographic shares by sex, education, and age were treated as compositional inputs and transformed using isometric log-ratio (ILR) methods, with GDP per person included as a scalar covariate. A Tabular Residual Network (ResNet) was trained on the historical panel and evaluated on a post-period calibration/evaluation window (2022–2024), which was used for checkpoint selection and seed screening rather than as an independent held-out test set. Among the evaluated specifications, the ResNet seed-ensemble achieved the strongest performance on the 2022–2024 calibration/evaluation period (R2 = 0.5717), outperforming the best single-seed model (R2 = 0.5539), a province-specific last-value-carried-forward temporal heuristic based on 2019 values (R2 = 0.4779), tree-based tabular benchmarks (Random Forest: R2 = 0.1328; XGBoost: R2 = 0.0706), and pooled statistical reference models (linear: R2 = 0.1375; negative binomial: R2 = 0.0686; Poisson: R2 = −0.0634). Year-wise diagnostics indicated gradual temporal drift, suggesting that periodic recalibration or the inclusion of additional policy-relevant covariates is needed to preserve calibration. Overall, ILR-based compositional geodemography provides a scalable and interpretable baseline for traffic safety monitoring and prioritization in data-constrained settings.
1. Introduction
According to the World Health Organization [1], road traffic accidents cause approximately 1.19 × 10⁶ deaths annually and remain a leading cause of mortality among individuals aged 5–29 years. National statistics further illustrate the scale of the problem: in the United States alone, approximately 6.1 × 10⁶ crashes occurred in 2021, resulting in 2.4 × 10⁶ injuries and 42.9 × 10³ fatalities [2]. According to the Centers for Disease Control and Prevention (CDC) [3], the associated economic losses were approximately $470 billion in 2022. These figures highlight the global and societal significance of traffic safety challenges.
Traffic safety is typically analyzed through a “road system” perspective, emphasizing infrastructure, vehicle characteristics, traffic conditions, and environmental factors. However, at the province scale, traffic outcomes also reflect the structure of the population itself. Differences in age composition, educational attainment, and sex distribution influence mobility patterns, risk-taking behavior, and compliance with traffic rules, indicating that demographic characteristics function as structural correlates of traffic safety. This perspective is particularly relevant for middle-income countries, where 92% of global traffic fatalities occur despite accounting for only 60% of the world’s vehicles [1]. While traditional analyses focus on observable physical and operational factors, accident occurrence is also associated with behavioral and cognitive mechanisms—such as risk perception and rule adherence—which are, in turn, related to demographic structure. Accordingly, this study adopts a demography-first perspective, proposing that provincial accident rates can be usefully approximated from population composition, even under a parsimonious economic control such as GDP.
This approach is motivated by two considerations. First, demographic composition is a relatively stable and slowly evolving structural characteristic that may capture long-term behavioral patterns related to traffic participation. Second, many policy interventions—such as education campaigns, enforcement strategies, and driver training—target populations rather than infrastructure, making demographic structure relevant for descriptive monitoring and broad policy targeting. Accordingly, this study adopts a compositional modeling framework in which demographic variables are treated as parts of a constrained system and transformed using the isometric log-ratio (ILR) method. By isolating the demographic dimension while retaining GDP as a scalar control, the study evaluates whether population composition alone can explain substantial spatial variation in traffic accident rates under a time-forward calibration/evaluation framework (train: 2008–2019; calibration/evaluation: 2022–2024). Although prior studies have examined spatial variation in accident frequency [4], demographic structure has rarely been incorporated in a formally compositional framework, and this approach therefore extends traditional traffic safety modeling by linking accident outcomes to broader social-development characteristics.
1.1. Motivation and Research Gaps
Despite decades of research, the mechanisms underlying spatial variation in traffic accident occurrence remain incompletely understood. While many studies have focused on accident severity [5,6,7,8], fewer have examined why accident rates differ systematically across regions. Existing literature predominantly attributes accidents to driver behavior, vehicle characteristics, and infrastructure conditions [9,10,11,12], yet the role of population-level demographic structure remains underexplored, despite its influence on risk perception, compliance, and behavioral patterns.
This gap is particularly relevant in middle-income countries, where high accident burdens coincide with evolving demographic and mobility dynamics. Although accidents are typically framed as outcomes of driver–vehicle–road interactions, these interactions are also associated with underlying population characteristics. Indeed, driver misbehavior is widely recognized as a primary contributing factor [13], while environmental factors such as weather and visibility [14,15,16] and infrastructure conditions [17] further influence crash occurrence. However, these approaches remain largely focused on physical and operational determinants, with limited attention to the demographic structure underlying behavior at scale.
Recent advances in machine learning (ML) have enabled flexible modeling of transportation systems, including applications in crash analysis for vulnerable road users [18,19]. Nevertheless, these approaches largely rely on physical or operational variables, with limited integration of demographic structure in a statistically consistent manner. In particular, the compositional nature of demographic data is rarely addressed, potentially leading to biased or unstable inference when raw population shares are used directly.
To address these gaps, this study proposes a compositional machine learning framework that integrates isometric log-ratio (ILR) transformed demographic variables into a tabular deep-learning model. By doing so, it extends traffic safety modeling beyond traditional physical determinants toward a population-structured perspective, enabling more interpretable and policy-informative insights.
1.2. Contributions
This study makes four main contributions. First, it reframes provincial traffic safety as partially embedded in population structure and treats demographic composition as the primary modeling signal. Second, it introduces a compositional learning pipeline using ILR transformations to represent demographic variables in a statistically consistent manner. Third, it applies a regularized Tabular ResNet model to capture nonlinear relationships between demographic structure and accident outcomes under a time-forward calibration/evaluation design. Fourth, it provides an interpretable analysis based on gradient sensitivity to identify the dominant demographic balances influencing predictions.
Methodologically, the study integrates compositional data analysis with tabular deep learning, enabling demographic variables (age, education, and sex shares) to be represented as orthogonal balance coordinates via the ILR transform, thereby avoiding spurious dependence induced by the constant-sum constraint [20]. Model interpretation is conducted using gradient-based sensitivity analysis on the calibration/evaluation period (2022–2024). Related approaches in the literature include correlation-based factor screening in accident analysis [21], ensemble learning for crash trend modeling [22], and multimodal large-language-model forecasting of traffic accidents [23]. Distinct from these, the present study evaluates whether demographic composition can serve as a portable baseline estimator, with particular emphasis on the dominance of age- and education-based ILR coordinates and the secondary role of sex composition.
1.3. Scope
The analysis is based on official data from the Turkish Statistical Institute (TUIK), which follows United Nations and Eurostat standards, ensuring consistency and comparability across regions and years. The dataset comprises province–year observations for 81 provinces in Türkiye over the period 2008–2024, integrating demographic variables (sex, age, education), GDP per person, and traffic accident rates per million inhabitants. The accident rate serves as the dependent variable, while demographic variables form the primary explanatory set. GDP is included as a scalar control variable, whereas demographic inputs are represented as compositional structures using ILR balances [24].
The modeling framework follows a time-forward design, with 2008–2019 used for training, 2020–2021 excluded due to pandemic-related disruptions, and 2022–2024 used as a calibration/evaluation window. A Tabular Residual Network is employed to model the relationship between demographic composition and accident rates, and model interpretation is conducted using gradient-based sensitivity analysis.
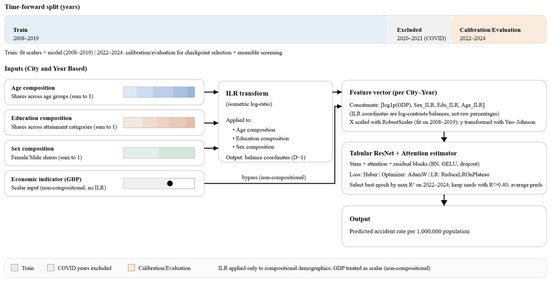
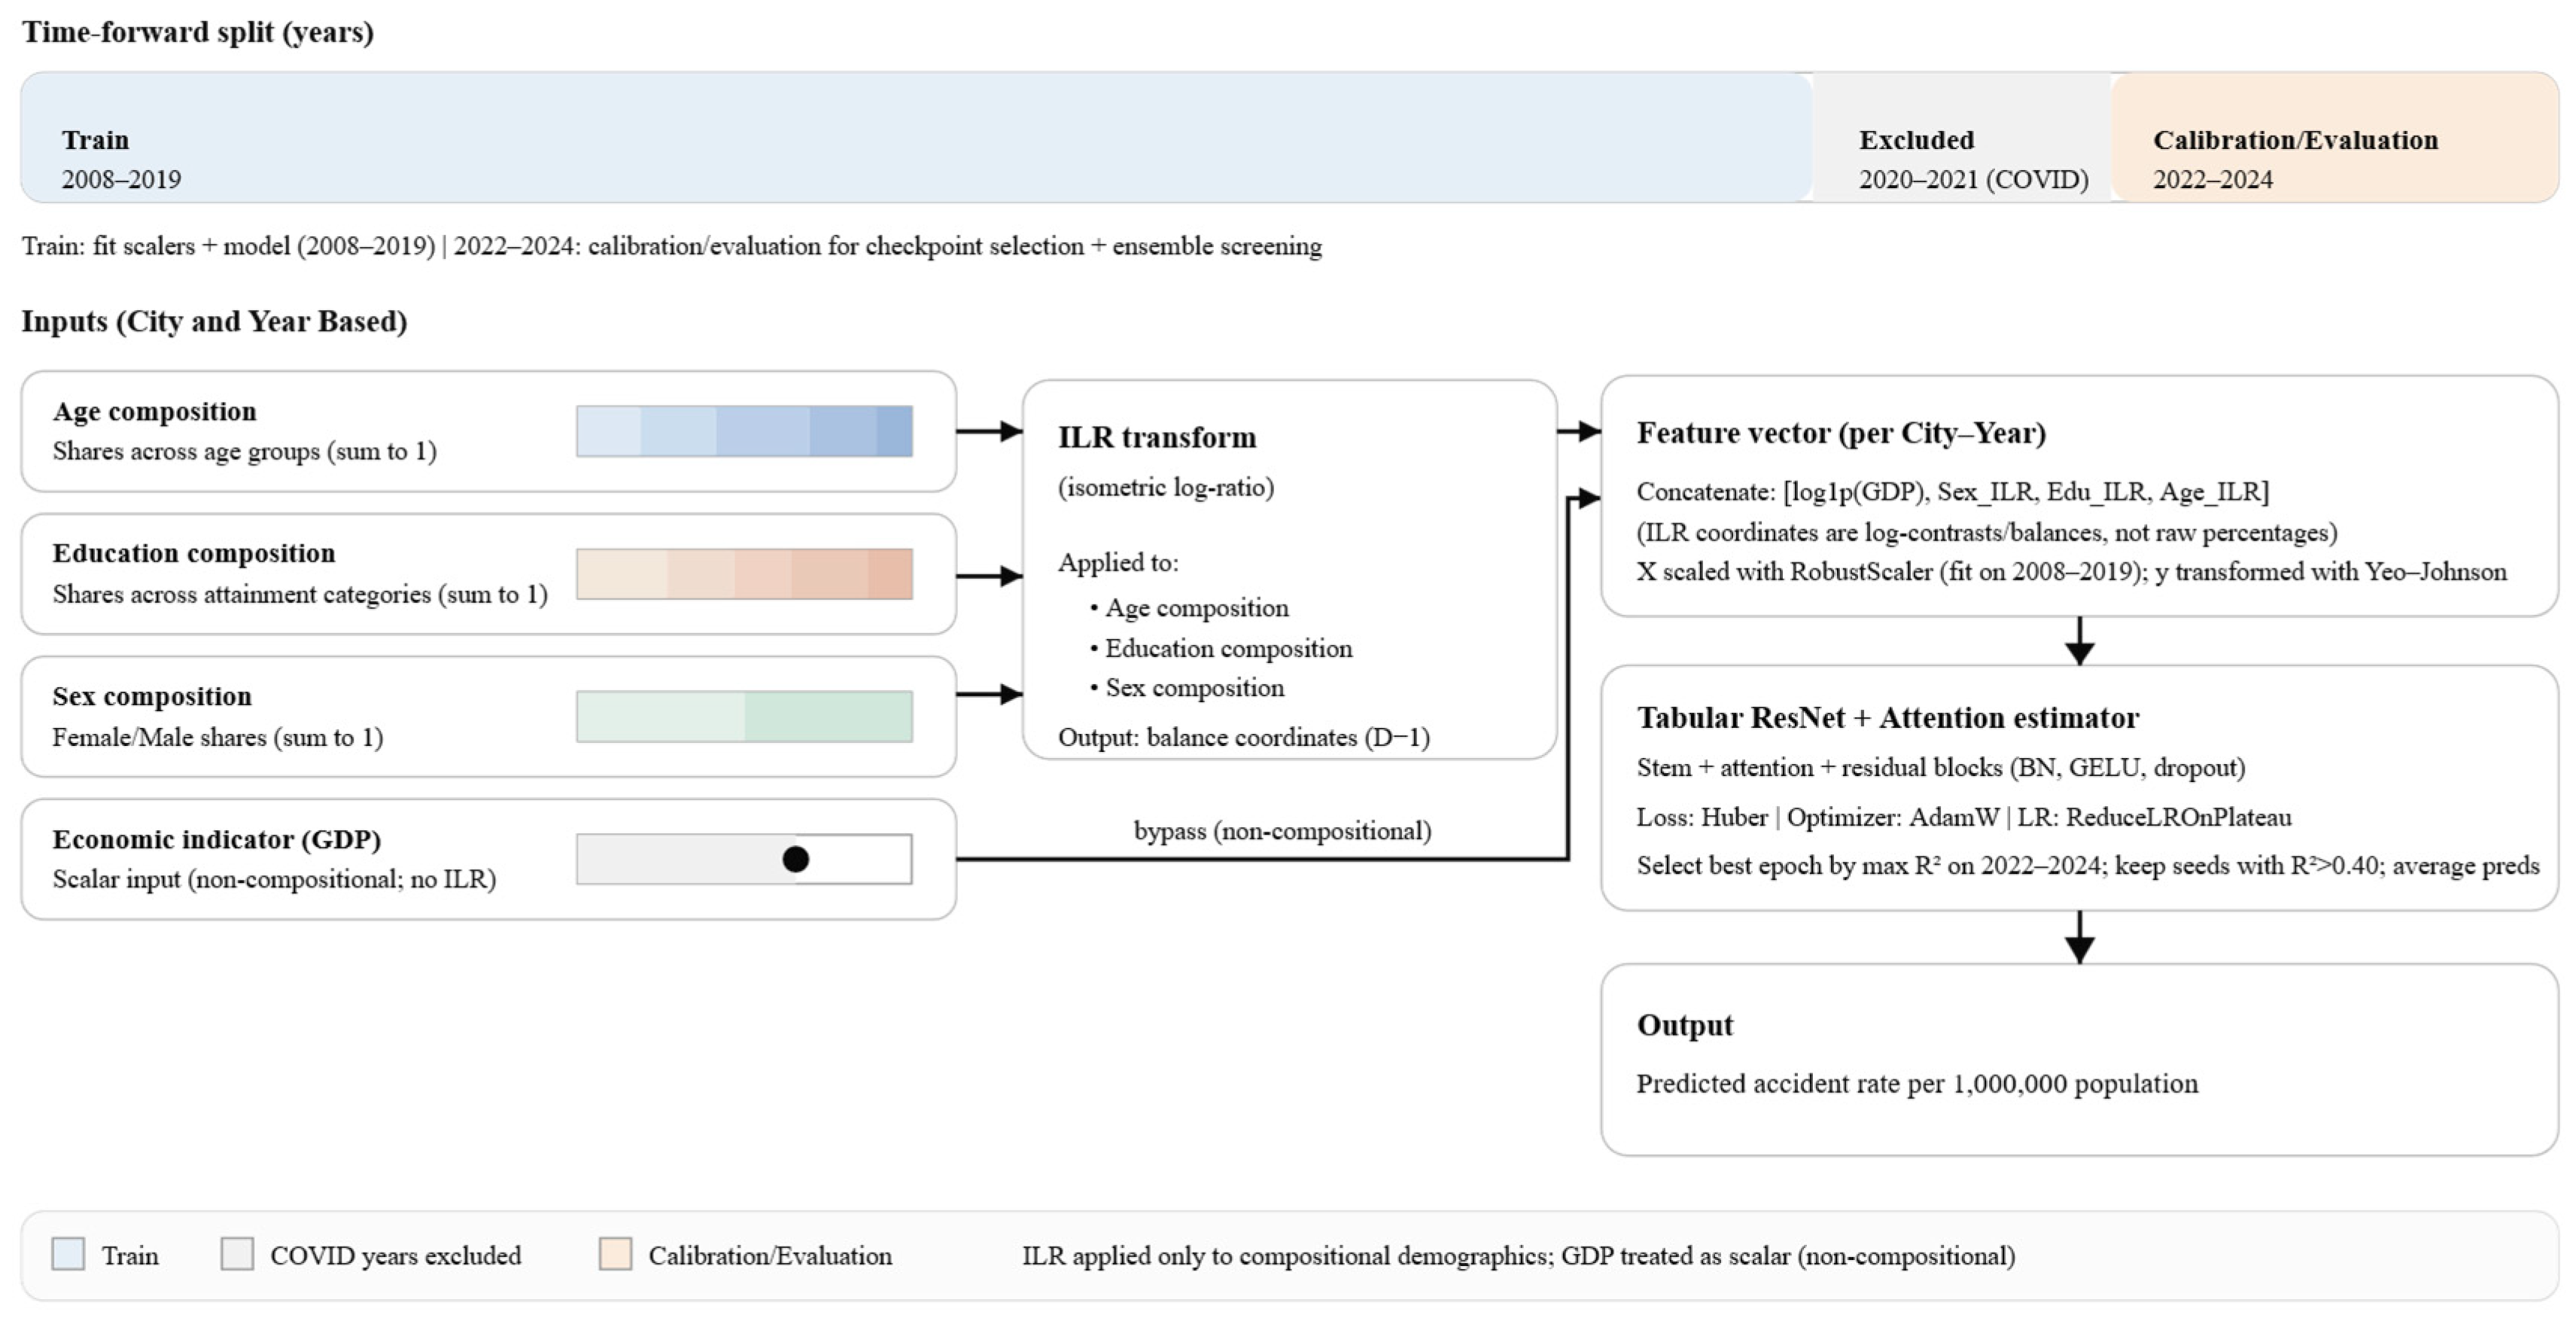
The remainder of the paper is organized as follows: Section 2 describes the dataset, variables, and methods used; Section 3 presents and discusses the findings; and Section 4 concludes with limitations and future directions. Figure 1 summarizes the overall analytical workflow.
Figure 1.
Study schematic: province–year panel, ILR-based demographic features, and time-forward validation.
As seen in Figure 1, the analysis is structured as a province–year panel in which demographic compositions (age, education, and sex) are treated as compositional data and mapped to ILR balance coordinates before modeling. GDP is included as a scalar covariate without ILR transformation.
2. Materials and Methods
This section provides detailed information on the study area, data collection, and preprocessing procedures. Türkiye is used as a representative middle-income country. Demographic variables, including sex, age, and education at the provincial level, were obtained from the national statistical database together with GDP per person. All data were integrated by year and province. Demographic variables were converted into population shares to form valid compositions, while GDP per person was included as a scalar covariate. The resulting province–year panel was matched with accident rates per million population and used to estimate a demography-based expected accident rate under a time-forward design.
2.1. Study Area and Properties
Türkiye was selected as a representative middle-income country [25] because low- and middle-income countries account for about 60% of the world’s vehicles but approximately 92% of road traffic deaths [1]. Türkiye has a population exceeding 85 million and a total land area of approximately km2. Administratively, the country is divided into 81 provinces, which constitute the spatial units of analysis in this study. The provincial structure exhibits substantial demographic and socioeconomic heterogeneity, making it suitable for examining regional variation in traffic accident rates.
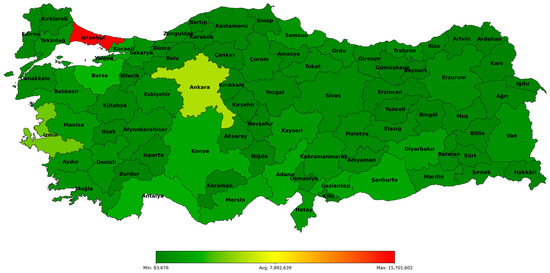
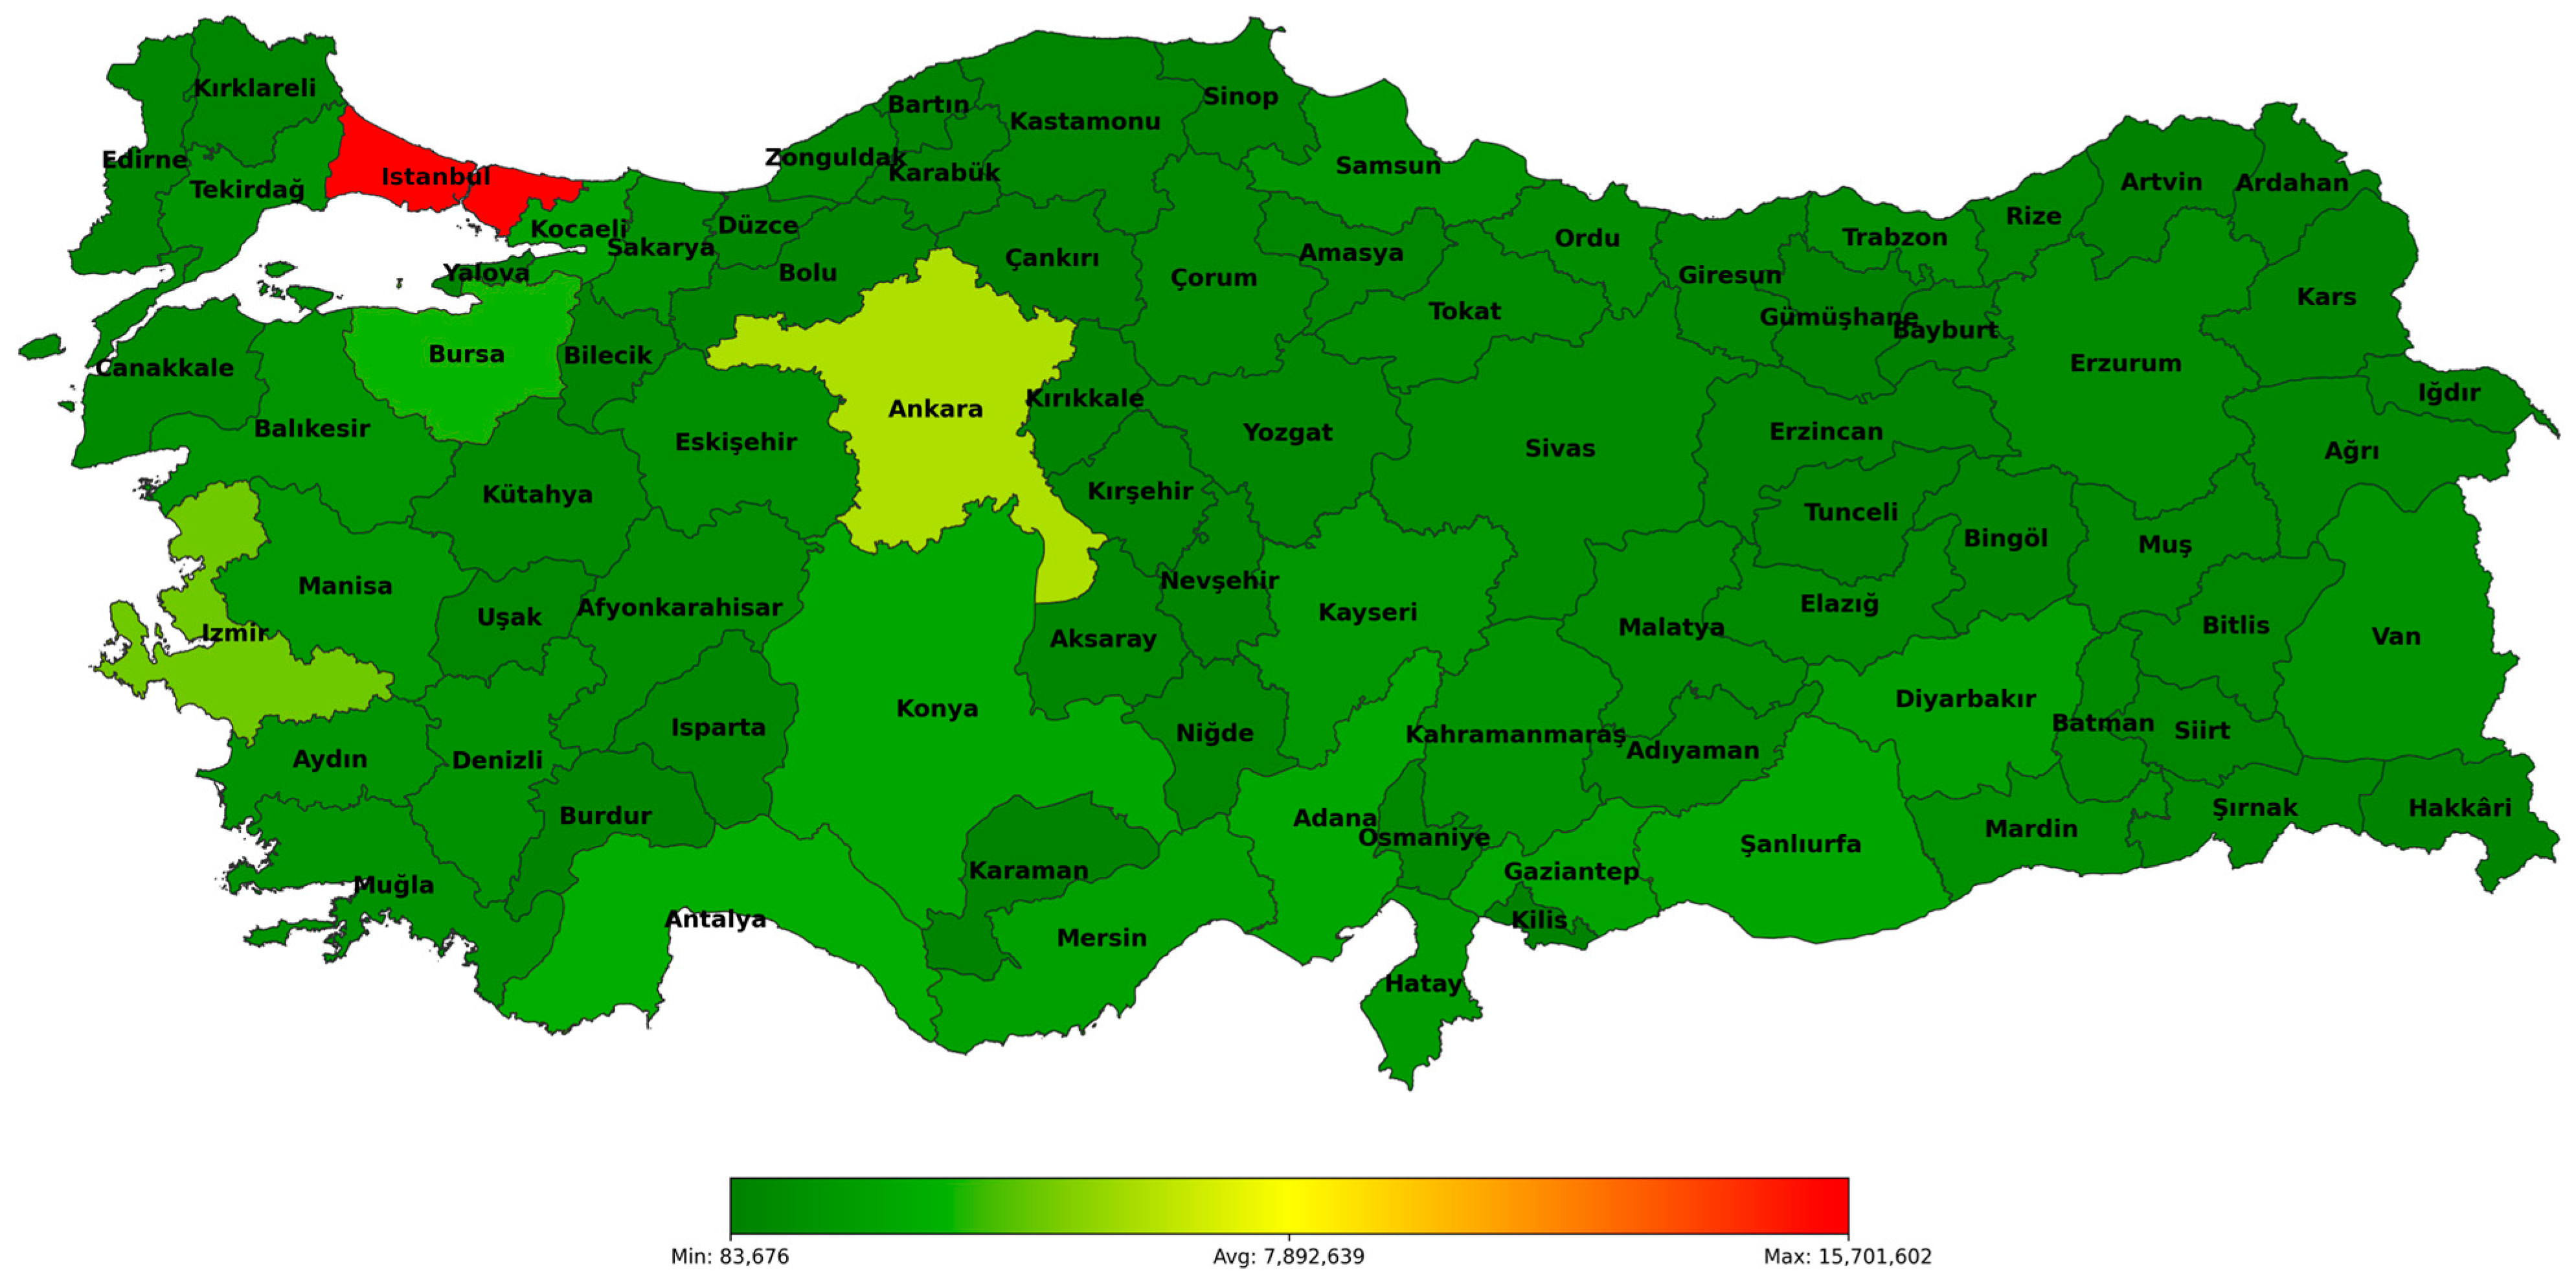
Figure 2 illustrates the spatial distribution of provinces and their population sizes. At the national level, the population structure reflects notable compositional characteristics: approximately 50.02% of the population is male, while about 8.97% consists of children younger than six years of age. The remaining population is distributed across multiple education and age categories, whose relative proportions vary considerably between provinces. These demographic proportions are summarized in Table 1 and form the basis for the compositional variables used in the subsequent analysis.
Figure 2.
Population distribution of all provinces in Türkiye.
Table 1.
Demographic distribution of the population.
2.2. Demographic and Accident Data
This study examines province-level variation in traffic accident risk using demographic composition and economic context in Türkiye. The dataset is assembled as a province–year panel for 81 provinces covering 2008–2024, using official statistics from the Turkish Statistical Institute (TUIK). The dependent variable is the traffic accident rate per million population (O1). The explanatory variables include population composition by sex (I1–I2), education (I3–I12), and age group (I13–I31), together with GDP per person (I32) as a scalar covariate. All demographic variables are converted into population shares (0–1) to form valid compositions and ensure comparability across provinces and years.
The education and age variables are modeled as separate compositional structures representing different demographic dimensions. While certain categories, such as “Pre-School (0–5 Age)”, may appear conceptually related to age groups, the education composition reflects formal attainment categories as reported in official statistics, including early-stage and unspecified (“Not Available”) entries. These categories are retained to preserve consistency with the source data and to maintain the compositional integrity of the dataset.
Accordingly, interpretation is conducted at the level of ILR balances, which represent contrasts between grouped categories, rather than at the level of individual components. This reduces sensitivity to overlap in individual categories while allowing the model to capture broader structural relationships.
Basic preprocessing is applied to ensure numeric consistency and completeness for modeling. GDP values are treated as numeric and preprocessed prior to modeling. GDP per person was transformed using log(1 + GDP) prior to model fitting. For model evaluation under the time-forward design described earlier, a strict split is used. Parameter definitions and codes are provided in Table 2.
Table 2.
Parameters and the codes for each parameter used in this study.
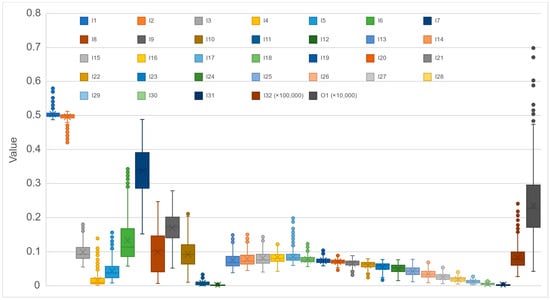
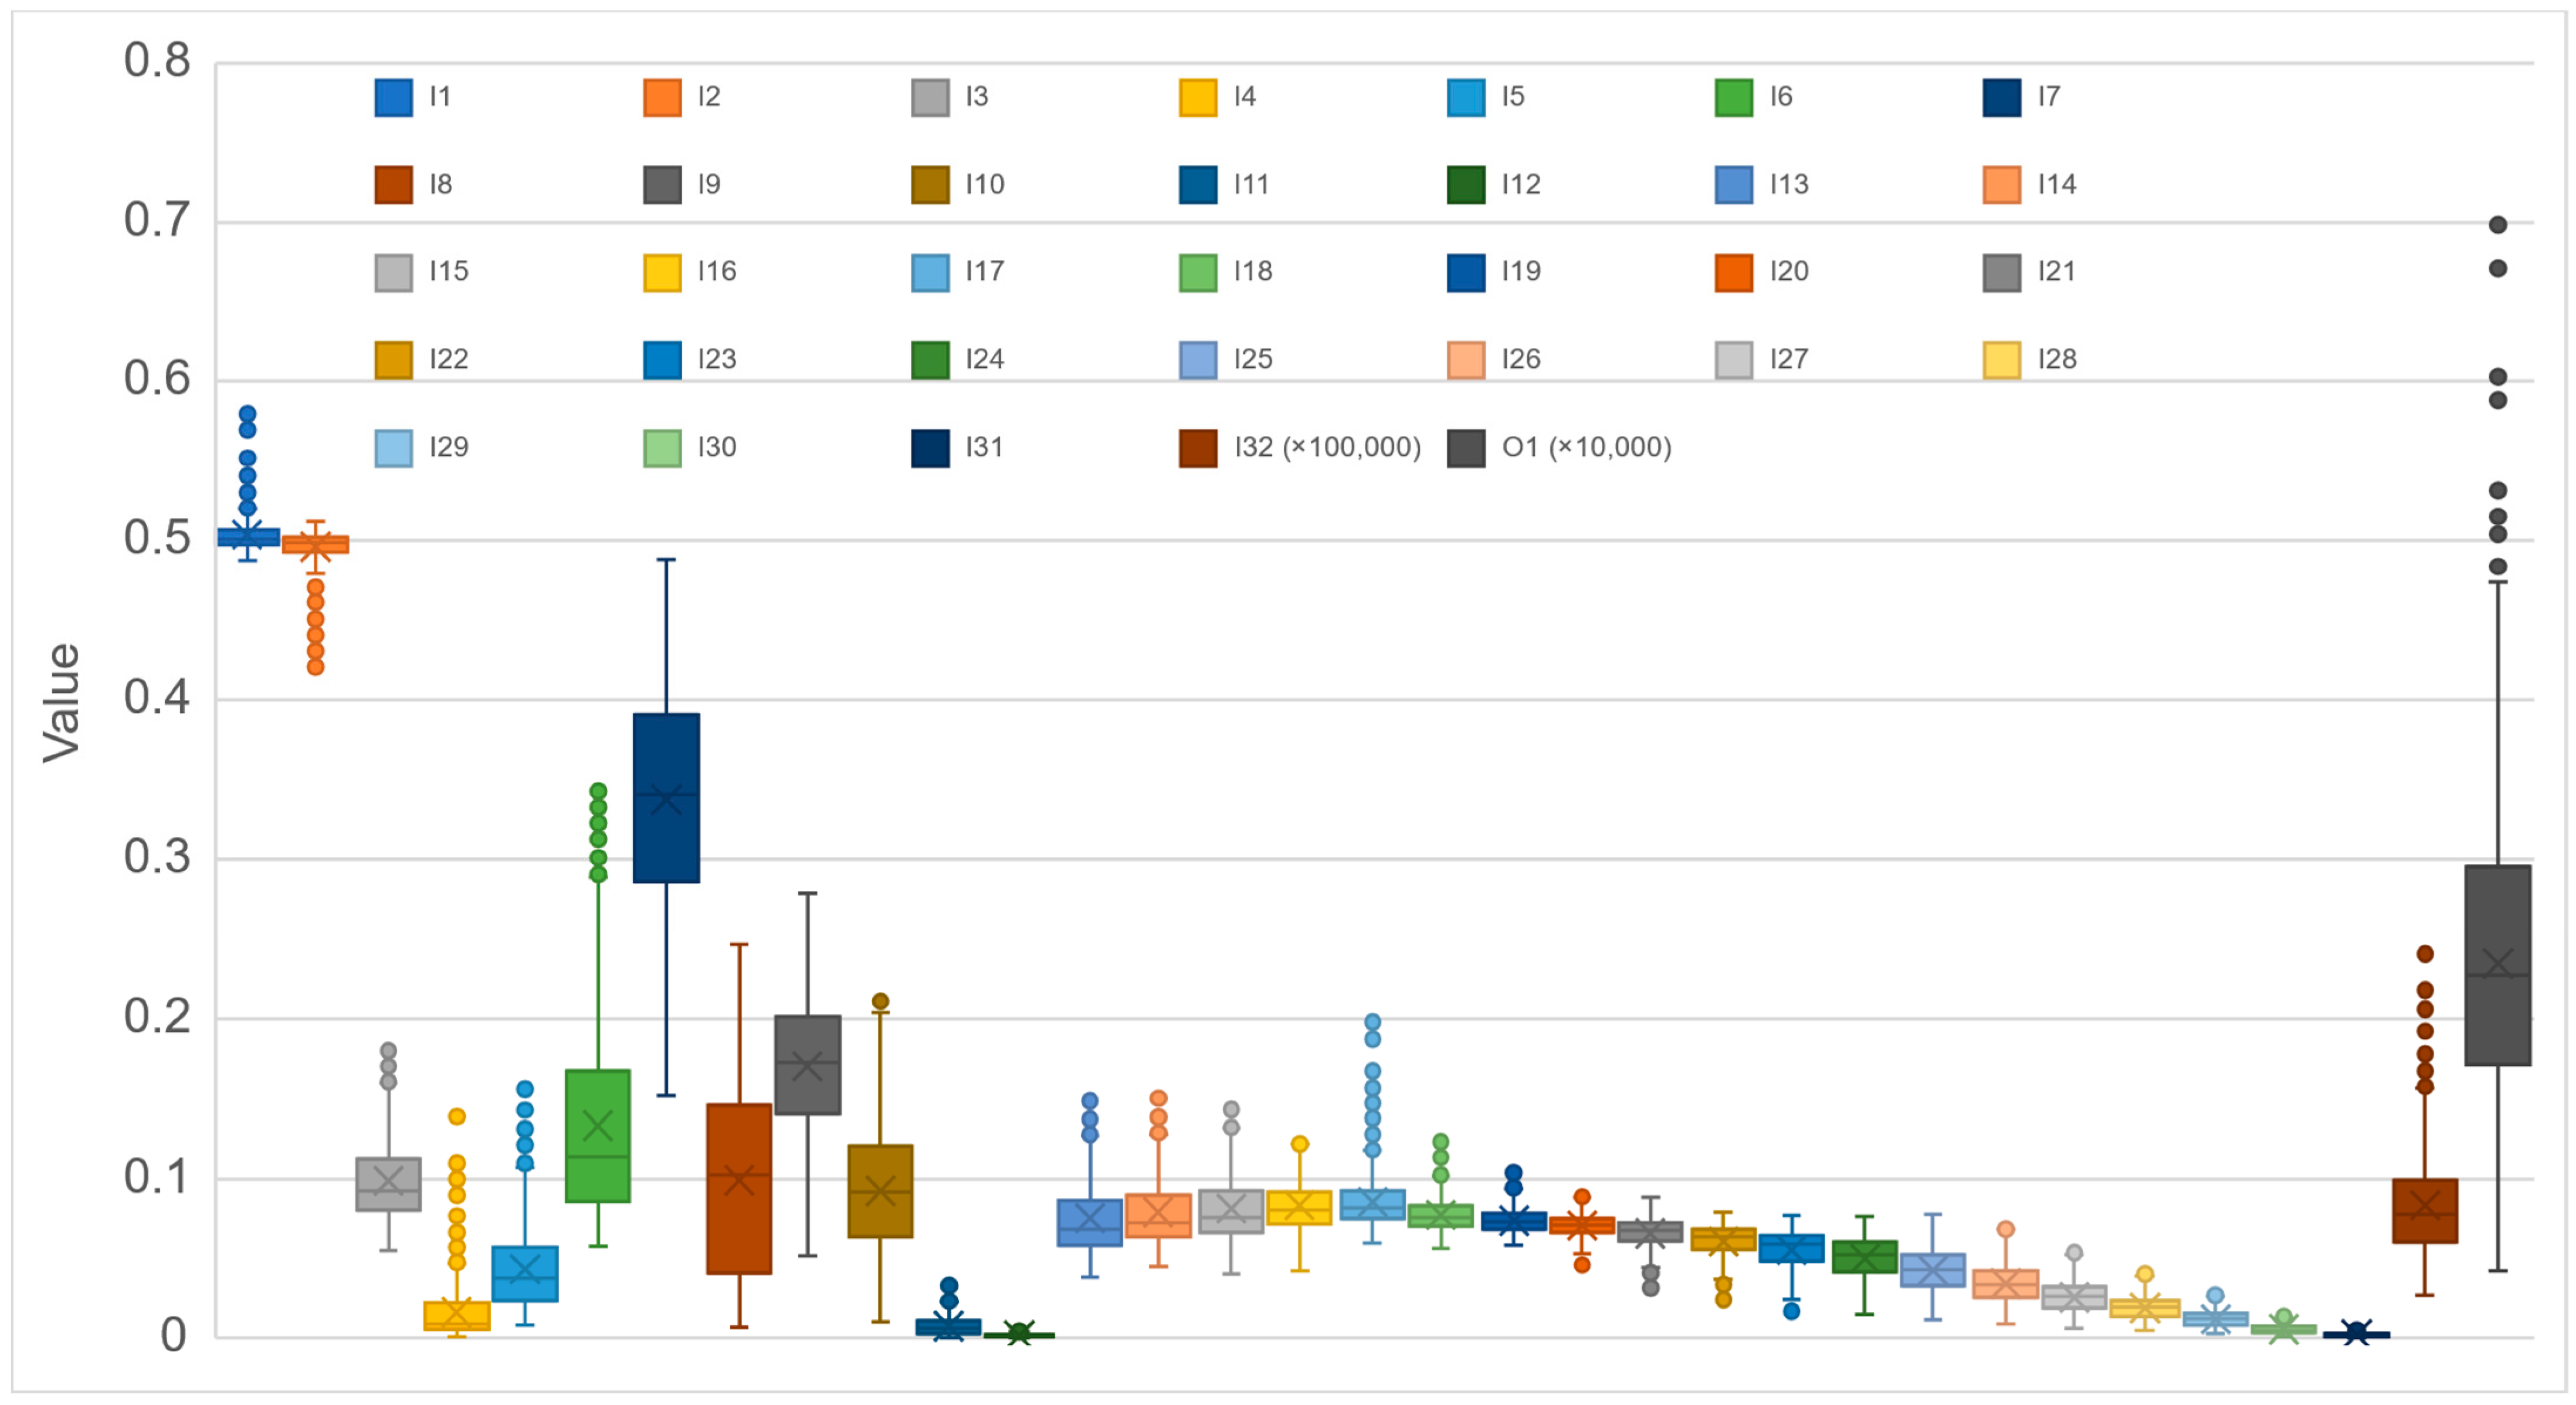
The model inputs consist of 32 variables (I1–I32), and the output is the accident rate per million population (O1). The dependent variable is defined as the total number of reported traffic accidents per million population, based on official TUIK statistics. The series includes all reported accidents and is not restricted to injury or fatal crashes. Summary statistics for all variables are reported in Table 3, and distributional variability across provinces and years is visualized in Figure 3. The years 2020–2021 were excluded due to the significant disruption caused by the COVID-19 pandemic, which affected mobility patterns, traffic volumes, and reporting dynamics. To maintain temporal consistency and avoid introducing regime-related noise into the training process, these years are omitted from the time-forward design. After excluding 2020–2021, the final modeling dataset contains 1215 province–year observations (81 provinces × 15 years: 2008–2019 and 2022–2024). A brief descriptive comparison also supported this exclusion. The yearly mean accident rate per million population dropped from 2388.96 in 2019 to 2021.43 in 2020, partially recovered to 2397.64 in 2021, and then rose back to 2466.69 in 2022. This pattern is consistent with 2020–2021 representing a disrupted transition period rather than a stable continuation of the pre-pandemic regime.
Table 3.
Statistical values of the dataset.
Figure 3.
Box and whisker graph of the parameters.
It should be noted that Table 1 presents national aggregate demographic proportions as a descriptive snapshot for Türkiye, whereas Table 3 later reports summary statistics across the unweighted province–year analytical panel used for modeling. Therefore, the values in the two tables are not expected to coincide exactly.
Figure 3 shows substantial variability across demographic and socioeconomic variables. Sex shares are tightly distributed around 0.5, while education variables exhibit greater dispersion, particularly for primary education. Age-group shares are relatively constrained, with older age groups showing smaller and more stable proportions. The accident rate displays high variability with upper-tail outliers, indicating heterogeneity across provinces.
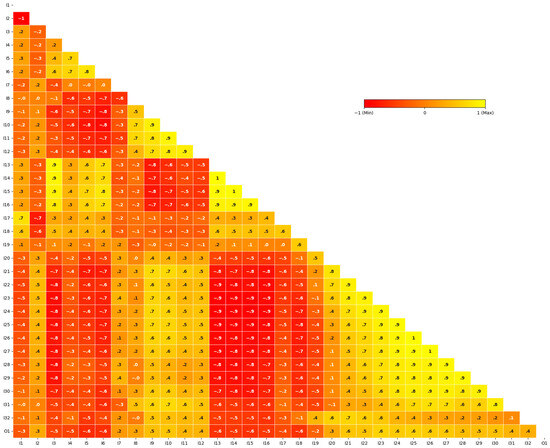
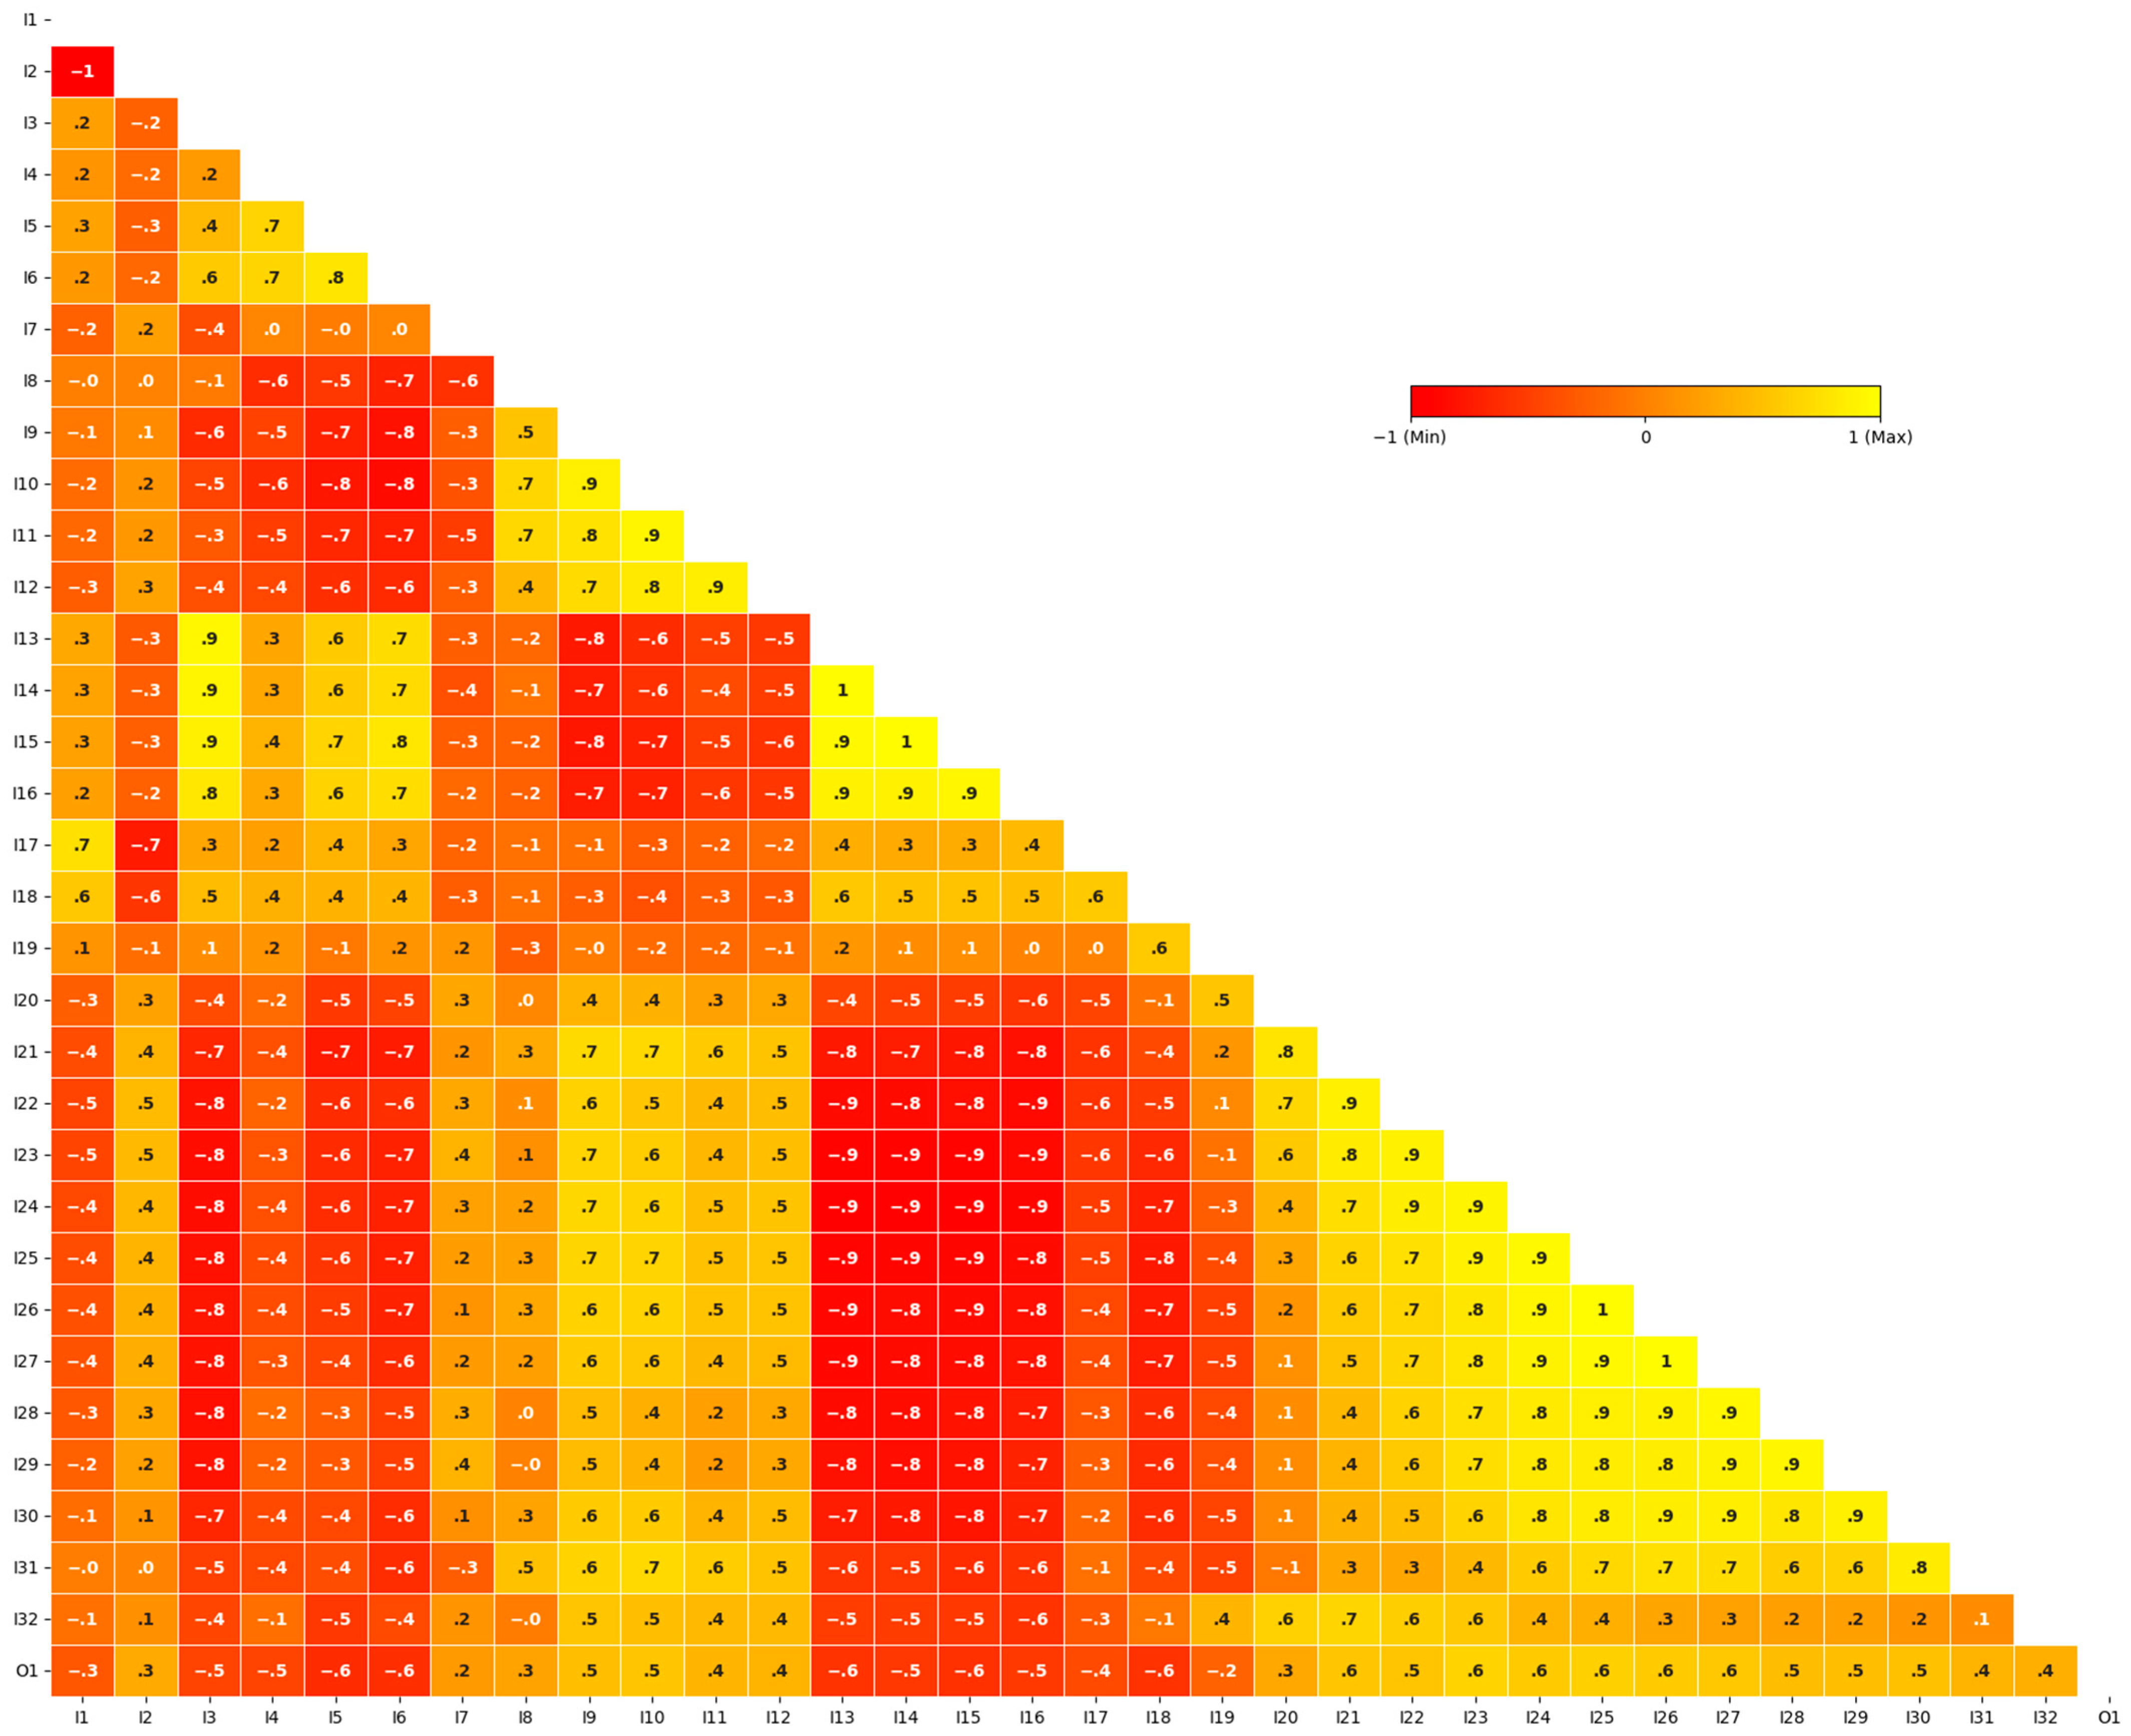
The correlation structure is shown in Figure 4. As indicated by the heat map, the sex variables are inversely related to each other. Younger age-group shares tend to be positively correlated with one another and negatively correlated with older age-group shares. Similarly, lower education categories, such as illiteracy and primary-school attainment, are negatively correlated with higher education levels. The heat map also suggests that the independent variables do not exhibit strong direct linear relationships with the dependent variable. These patterns support the use of data-driven modeling approaches to capture the underlying relationships among the variables.
Figure 4.
Correlation heat map of the parameters.
2.3. Data Preprocessing
The demographic variables described in Section 2.2 are expressed as population shares and therefore constitute compositional data, meaning that their components are constrained to be positive and to sum to unity within each category (sex, education, and age). Directly using such variables in regression or machine learning models can lead to spurious correlations and unstable parameter estimates due to the constant-sum constraint. To address this issue, all demographic compositions are transformed into an unconstrained Euclidean space prior to model fitting.
Specifically, population shares for sex, education level, and age group are transformed using the ILR transformation with a Helmert orthonormal basis. This transformation preserves the relative information contained in the compositions while producing orthogonal coordinates that are suitable for standard machine learning algorithms. Each demographic category is transformed independently, yielding separate sets of ILR balances for sex, education, and age. Prior to the ILR transformation, a small positive perturbation (ε = 10−6) was added to all compositional components to address zero and near-zero values, following standard practice in compositional data analysis. This ensures that the logarithmic transformation is well-defined and numerically stable, particularly for rare categories such as high education levels (e.g., PhD share) or extreme age groups (e.g., 90+). Given the small magnitude of ε, the relative structure of the compositions is preserved while avoiding undefined log-ratio operations.
Economic conditions are incorporated through GDP per person, which is first converted to numeric form. GDP per person was transformed using log(1 + GDP) to reduce skewness and improve numerical stability during model training. The variable exhibits right-skewness (mean = 8503.2, median = 7961.5), supporting this transformation. The transformed GDP variable is then used together with ILR-based demographic features.
The resulting ILR coordinates represent independent balance coordinates (log-contrasts) of the original parts, preserving relative information while mapping the simplex to Euclidean space. Sex composition yields one ILR coordinate, education yields nine, and age yields eighteen (Table 4). This transformation preserves relative information while enabling standard regression and deep-learning models to operate in Euclidean space.
Table 4.
Definition of ILR-transformed demographic features.
Each ILR coordinate represents a log-ratio contrast between a numerator group and a denominator group. Positive values indicate that the relative share of the numerator group is higher than that of the denominator group, while negative values indicate the opposite. The magnitude reflects the strength of this imbalance on a logarithmic scale. For example, a positive value of Age_ILR_10 indicates that the relative share of individuals aged 0–54 is higher compared to those aged 55–59, whereas a negative value indicates a relative dominance of the older age group. This is defined in Equation (1):
where denotes the geometric mean, and and are the number of parts in the numerator and denominator groups, respectively.
The final model input matrix is constructed by concatenating the log-transformed GDP with the ILR-transformed demographic balances. All input features are scaled using a RobustScaler fitted on the training period (2008–2019) and applied unchanged to 2022–2024. The target variable is transformed using a Yeo and Johnson [26] PowerTransformer for training and inverted back to the original scale for reporting. This preprocessing pipeline ensures numerical stability during training and avoids using calibration/evaluation-period information to fit the feature scaler.
2.4. Model Architecture and Training Procedure
To model the relationship between demographic–economic features and provincial traffic accident rates, a Tabular Residual Neural Network (Tabular ResNet) is employed. Residual architectures are well suited for tabular data as they enable the construction of deeper models while maintaining stable gradient flow and reducing the risk of performance degradation during training.
The ILR-transformed demographic variables provide an orthonormal representation of compositional data, in which each coordinate captures a balance between groups (e.g., age or education categories). This removes the constant-sum constraint and enables the model to operate in a Euclidean feature space. Within this framework, the network learns nonlinear interactions among compositional balances, while the attention mechanism allows adaptive weighting of ILR coordinates, emphasizing the most informative demographic contrasts. The residual structure further supports stable learning of these interactions.
Importantly, the architecture itself is not specifically designed for compositional data; rather, the ILR transformation ensures compatibility with standard deep learning models. While ILR eliminates perfect multicollinearity within each composition, correlations between different compositions (e.g., age and education structures) may still persist. These dependencies reflect underlying socio-demographic relationships and are learned implicitly by the model.
Although such correlations do not introduce instability due to regularization and nonlinear representation learning, they imply that individual ILR coordinates should be interpreted with caution, as their effects may reflect interactions across demographic dimensions rather than isolated contributions.
2.4.1. Network Architecture
The network receives as input the concatenated feature vector consisting of the log-transformed GDP and the ILR-transformed demographic balances derived from sex, education, and age compositions. The input layer projects this feature vector into a latent space of fixed dimensionality, followed by batch normalization to stabilize training.
The model architecture consists of an input projection layer followed by a hidden representation of dimension 128. A self-attention block based on scaled dot-product attention is applied to capture interactions between input features. This is followed by three residual fully connected blocks, each consisting of two linear layers with batch normalization, GELU activation, and dropout (rate = 0.2). The final prediction head comprises a two-layer fully connected network (128 → 64 → 1) with ReLU activation.
Dropout is applied within each residual block to mitigate overfitting and improve generalization. The final output layer maps the latent representation to a single continuous value representing the predicted traffic accident rate per million population.
2.4.2. Training Strategy
Training uses the Huber loss and the AdamW optimizer with a learning rate of 1 × 10⁻³ and weight decay of 0.015. A batch size of 32 was used, and training was conducted for a maximum of 3000 epochs with early stopping based on calibration-period performance. Learning rate is adapted using ReduceLROnPlateau. Under the time-forward design described earlier, predictions are generated for 2022–2024 every 10 epochs, and the checkpoint maximizing R2 on this window is retained for each seed. An ensemble is then formed by averaging predictions from seeds whose calibration/evaluation R2 exceeds 0.50. The threshold was selected as a pragmatic filter to exclude clearly underperforming initializations while retaining enough models for stable ensemble averaging. Because the best single-seed calibration/evaluation performances were in the 0.5 range (0.5539), R2 > 0.50 was adopted as a practical lower bound for retaining comparatively strong seeds while preserving enough models for stable ensemble averaging. An attention block is applied to the latent representation prior to the residual stack.
The target variable was transformed using the Yeo–Johnson transformation to reduce skewness and improve numerical stability during training. In addition, the Huber loss function was employed to provide robustness against potential outliers and residual noise that may persist after transformation. While the Yeo–Johnson transformation normalizes the overall distribution, the Huber loss further stabilizes training by reducing sensitivity to extreme residuals, particularly in heterogeneous regional data.
The baseline models were implemented as simple pooled reference specifications without extensive hyperparameter tuning, with the aim of providing transparent and interpretable comparisons. In contrast, the neural network model was calibrated using a seed-selection procedure on the calibration/evaluation period. Therefore, the comparison reflects differences in model flexibility and calibration strategy rather than strictly symmetric hyperparameter optimization.
To broaden the comparative benchmarking framework, three additional reference specifications were evaluated on the same 2022–2024 calibration/evaluation window. First, a province-specific last-value-carried-forward (LVDF) temporal heuristic was constructed by carrying each province’s 2019 accident rate forward to 2022–2024. Second, a Random Forest regressor was fitted on the 2008–2019 training period and evaluated on the 2022–2024 window. Third, an XGBoost regressor was trained and evaluated under the same temporal split. These added models were included to distinguish the proposed ResNet model from simple temporal persistence and from flexible nonlinear tabular learners. The implemented training and selection workflow is summarized in Algorithm 1 to make the calibration-driven checkpointing and seed-ensemble construction procedure explicit.
| Algorithm 1. Calibration-driven checkpointing, benchmark comparison, and diagnostic analysis (2022–2024) |
|
Algorithm 1 formalizes (i) periodic checkpointing during training, (ii) selecting the best checkpoint by 2022–2024 calibration R2, and (iii) forming the final ensemble by averaging only seeds that exceed the predefined calibration threshold. This clarifies the exact procedure used to produce the final ensemble predictions and the subsequent diagnostics.
A total of 15 candidate seeds were evaluated, of which 5 seeds satisfied the selection criterion (R2 > 0.50) on the calibration/evaluation period (2022–2024). The calibration-period R2 values ranged from 0.3514 to 0.5539, with a mean of 0.4595 and a standard deviation of 0.0625, indicating moderate variability across random initializations and supporting the use of threshold-based filtering for stable ensemble construction.
2.4.3. Model Evaluation
Model performance is summarized on the 2022–2024 calibration/evaluation window using RMSE and R2 computed on the inverse-transformed target scale. Because the 2022–2024 period is used for checkpoint selection and ensemble seed filtering, it is not treated as an independent test set; reported metrics therefore reflect calibration-period fit under temporal regime shift. To contextualize performance, results are compared against pooled statistical reference models, tree-based benchmarks, and a temporal heuristic evaluated on the same 2022–2024 window.
2.5. Model Interpretation Approach
To interpret the behavior of the selected Tabular ResNet model and to assess its robustness, a gradient-based sensitivity and residual analysis was conducted on the calibration/evaluation period (2022–2024). The analysis focuses on (i) identifying the most influential input components and (ii) diagnosing systematic error patterns across time and prediction magnitude.
2.5.1. Gradient-Based Sensitivity Analysis
Model sensitivity was quantified using gradient analysis, where partial derivatives of the predicted accident rate with respect to each standardized input feature were computed and averaged across the calibration/evaluation window. This approach provides a measure of how small changes in each input affect the model output.
2.5.2. Residual Structure and Diagnostic Analysis
Residual diagnostics were used to assess systematic bias and heteroskedastic behavior in model predictions. Residuals are defined as signed prediction errors (True − Predicted), where positive values indicate underprediction and negative values indicate overprediction. Diagnostic tools include residual-versus-prediction plots and empirical cumulative distribution functions (ECDFs).
2.5.3. Temporal Sensitivity and Year-Wise Error Behavior
Temporal patterns in prediction errors were analyzed using year-wise distributions of signed residuals to assess potential drift between the training period and the calibration/evaluation period.
2.6. Spatial Validation
To assess spatial dependence in both observed accident rates and model residuals, global Moran’s I statistics were computed using province-level contiguity weights based on queen adjacency. Moran’s I provides a measure of spatial autocorrelation, indicating whether similar values cluster geographically. Statistical significance for Moran’s I was assessed using permutation-based inference, and the residual map represents province-level mean residuals aggregated over the 2022–2024 calibration/evaluation period.
In addition, spatial patterns of model performance were evaluated using residual maps for the calibration/evaluation period (2022–2024), highlighting regions of systematic over- and under-prediction.
3. Results and Discussion
This section reports and discusses the calibration/evaluation-window performance (2022–2024) of the proposed Tabular ResNet ensemble against pooled statistical reference models—pooled Poisson (Poisson), pooled negative binomial (NegBin), and a pooled linear model—together with added tree-based and temporal benchmarks (Random Forest, XGBoost, and LVDF), all evaluated on the same 2022–2024 window. The goal is to compare accuracy and error behavior (bias, dispersion, temporal patterning, residual structure) to assess whether the model provides a reliable demography-expected accident-rate baseline for provinces.
To broaden the comparative benchmarking framework, Random Forest and XGBoost were added as flexible tabular reference models, and a province-specific last-value-carried-forward (LVDF) temporal heuristic based on 2019 values was included as a simple persistence benchmark. These additions allow the proposed ResNet model to be compared not only against pooled statistical reference models but also against nonlinear tabular learners and a simple temporal baseline on the same 2022–2024 calibration/evaluation window.
3.1. Overall Comparative Performance Across Models
Table 5 summarizes the distributional properties of signed prediction errors (True − Predicted) for all models on the 2022–2024 evaluation window. Two broad patterns emerge. First, positive mean/median imply net underprediction in accident rates in 2022–2024 (positive mean signed error), indicating a systematic shift between the 2008–2019 training regime and the evaluation window. Second, the Tabular ResNet ensemble yields the most favorable overall error profile among the evaluated specifications, with the smallest mean and median signed errors and a tighter dispersion than the added pooled, tree-based, and temporal benchmarks. This indicates that the nonlinear compositional-learning structure aligns more closely with the empirical relationship between demographic composition, GDP, and accident outcomes than the linear and pooled count-based reference models. Table 6 presents a consolidated comparison of all models across standard performance metrics on the calibration/evaluation period (2022–2024).
Table 5.
Signed prediction error summary (True − Predicted) for the 2022–2024 evaluation window.
Table 6.
Model performance comparison (2022–2024 calibration/evaluation period).
As seen in Table 5, the positive mean and median signed errors indicate systematic underestimation in 2022–2024 across all approaches. From a practical standpoint, underestimation is problematic because it can understate safety needs in high-risk provinces. Nevertheless, the Final Ensemble reduces this bias substantially (mean error = 229.6; median = 138.1) relative to the pooled statistical reference models, the added tree-based benchmarks, and the LVDF temporal heuristic, while also exhibiting the smallest mean and median signed errors overall. This combination—lower bias and tighter dispersion—makes the ensemble the most favorable demography-expected baseline among the evaluated specifications in the present setting.
Compared with the pooled statistical reference models, the added tree-based benchmarks, and the LVDF temporal heuristic, the Tabular ResNet demonstrates improved error symmetry and reduced dispersion. While the reference models generally show larger positive mean errors and ECDFs shifted further away from zero, the ResNet residual distribution remains closer to zero, indicating a closer fit on the 2022–2024 calibration/evaluation window.
These findings explain why the ResNet achieves higher calibration/evaluation-period explanatory power (R2) despite operating under a strict time-forward evaluation. The improvement is not driven by a small number of extreme predictions but by systematically lower bias and variance across the majority of observations.
3.2. Calibration and Distributional Behavior of Errors
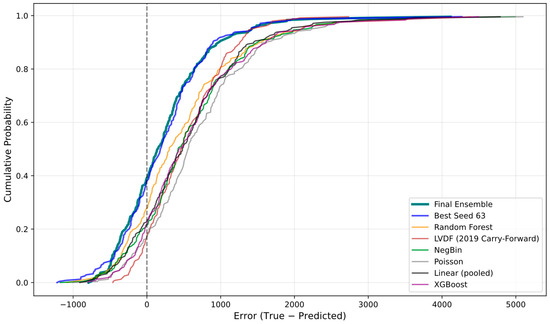
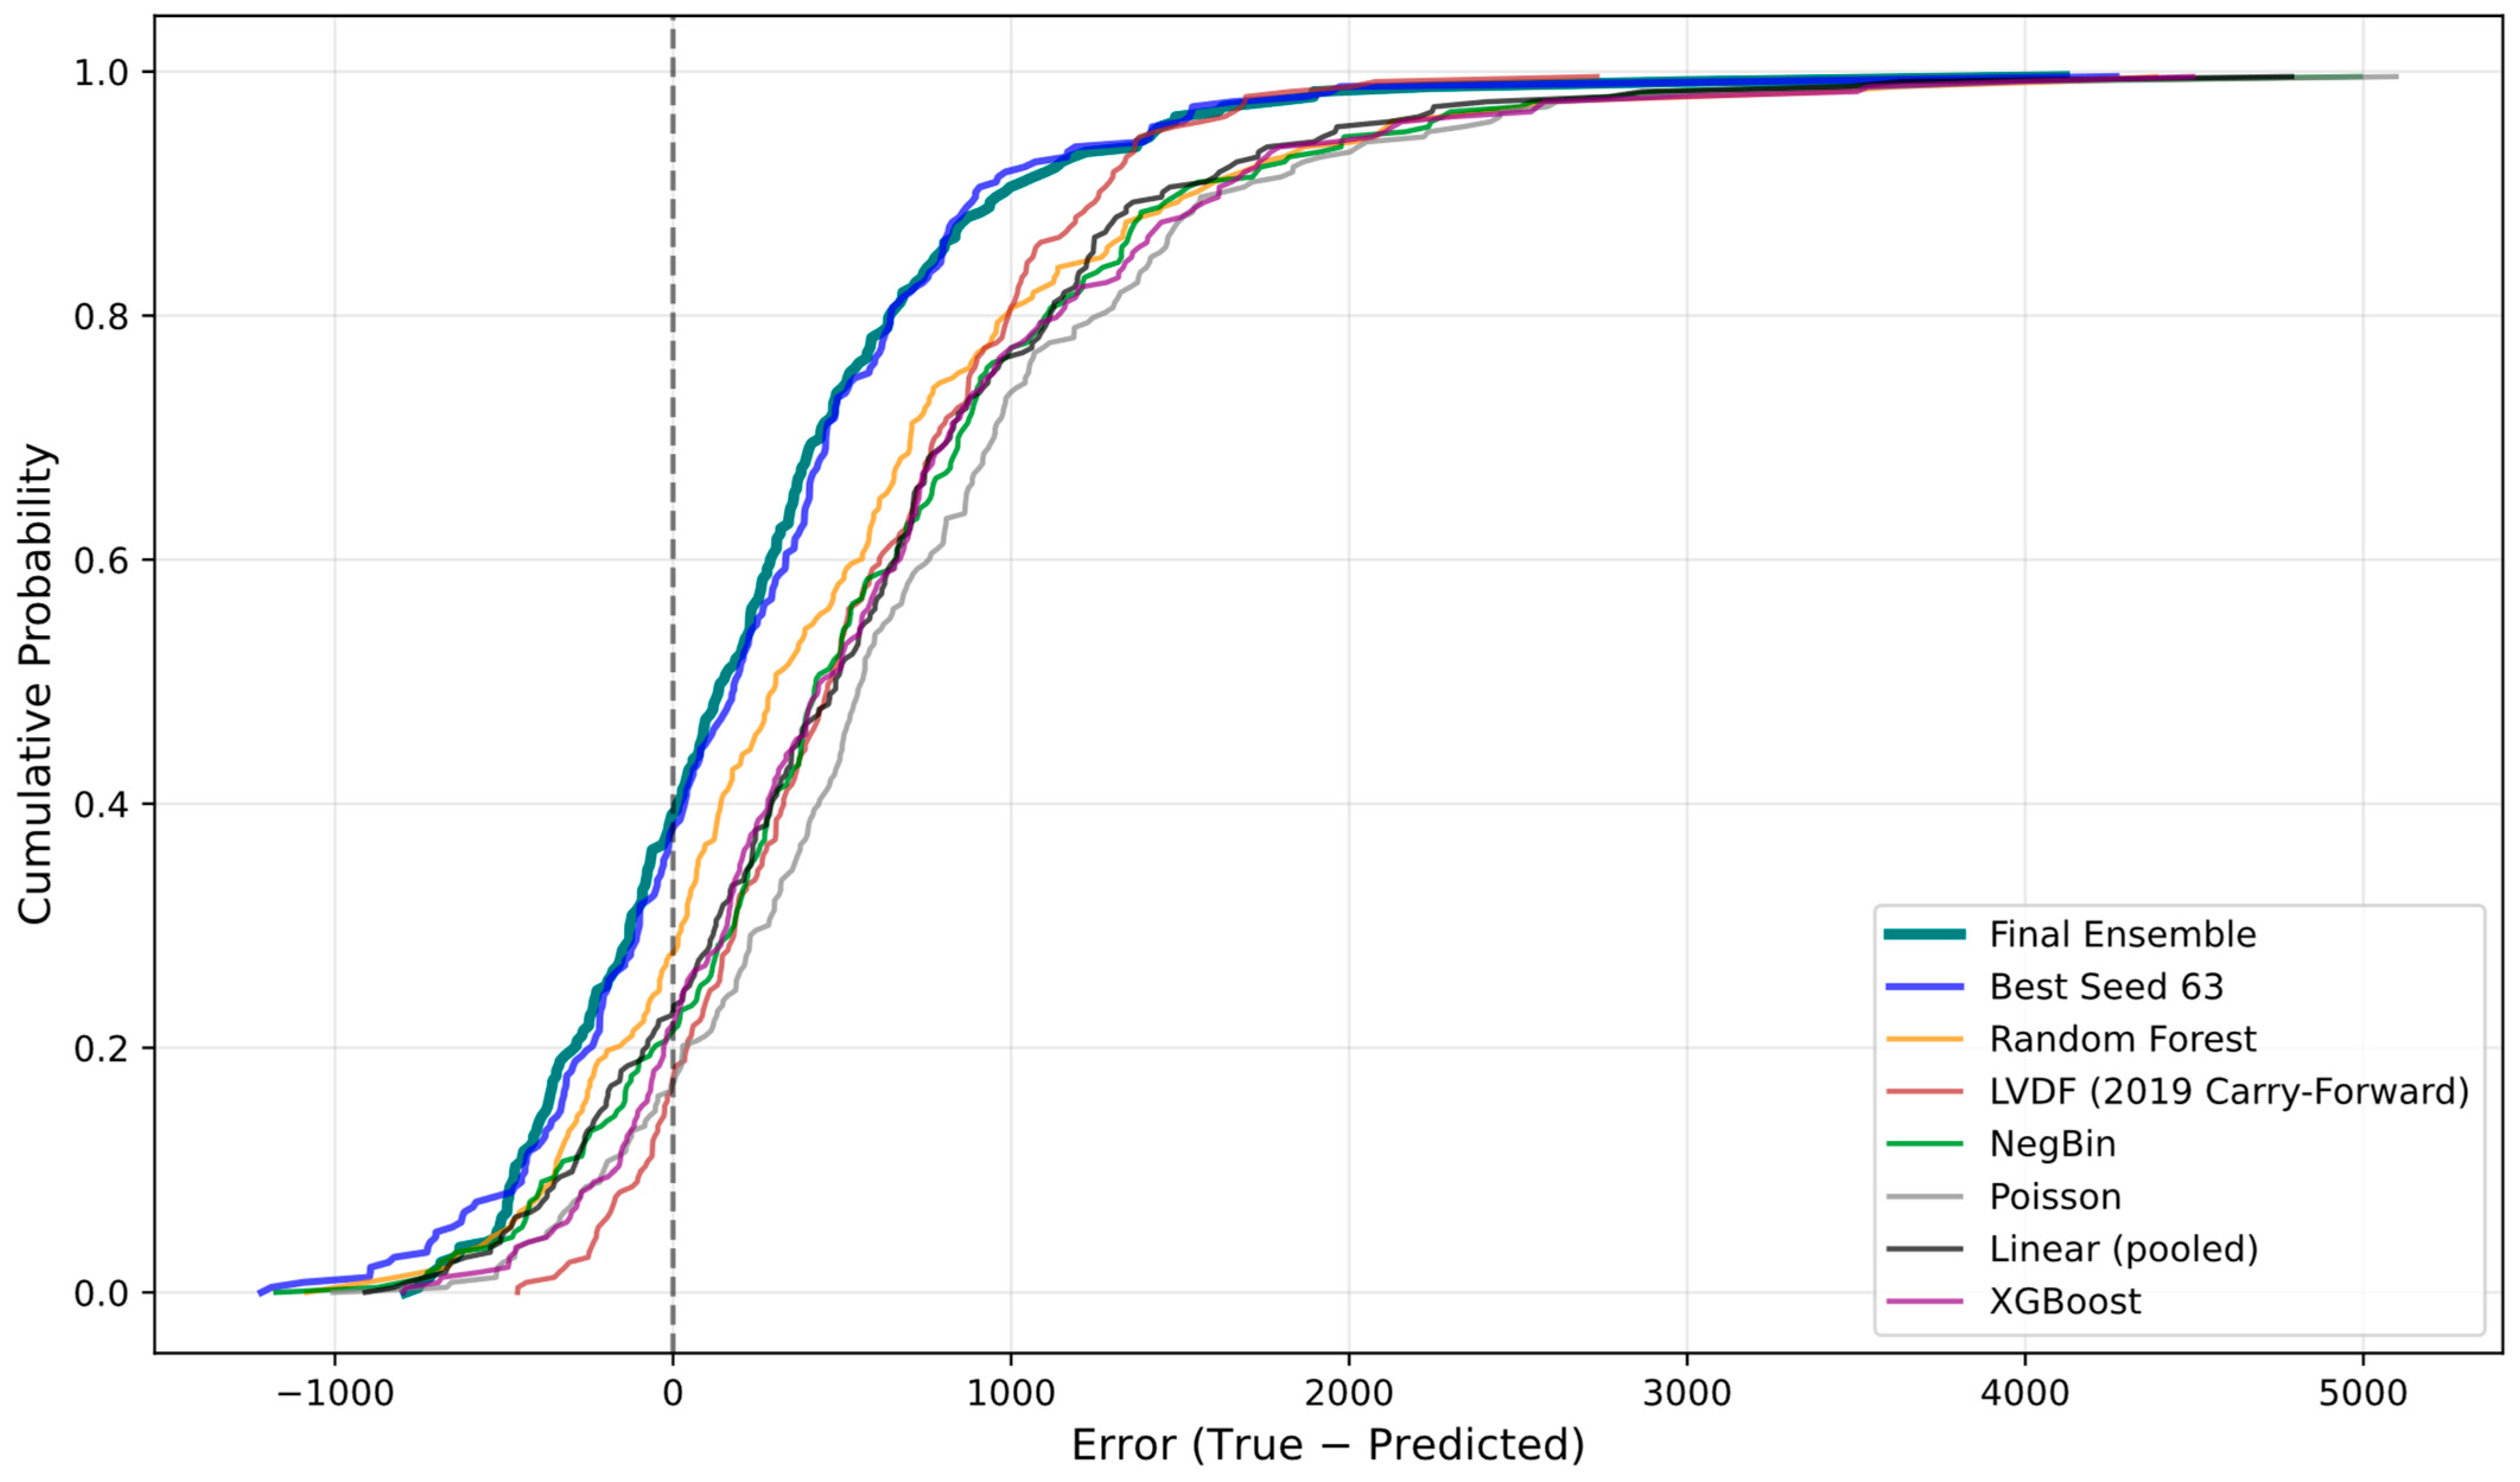
Average metrics alone can conceal whether performance gains are broad-based or driven by a subset of observations. To examine this, Figure 5 presents the empirical cumulative distribution function (ECDF) of signed prediction errors for the evaluated models. The Tabular ResNet ECDF rises sharply around zero, showing that a larger fraction of predictions fall within smaller error magnitudes. In contrast, the ECDFs of Poisson and NegBin are shifted substantially toward positive errors, consistent with the systematic underprediction already observed in Table 5. The Linear (pooled) and NegBin curves are nearly overlapping, indicating very similar error distributions (similar bias direction and dispersion). Both are right-shifted relative to the ensemble/Best Seed, implying more frequent positive errors (underprediction) and a heavier right tail. Among the pooled reference models, the linear and negative binomial specifications perform comparably, while Poisson appears slightly more right-shifted; the added tree-based and temporal benchmarks occupy intermediate positions between the pooled baselines and the final ensemble.
Figure 5.
ECDF of signed prediction errors (True − Predicted), 2022–2024 calibration/evaluation window, for the evaluated statistical, tree-based, temporal, and ResNet-based models.
As seen in Figure 5, the ECDF comparison shows that the ensemble/ResNet-based approach improves performance not only in average-error metrics but also in the distribution of errors: a larger share of province–year predictions fall within small signed-error ranges around zero. This concentration of probability mass near zero indicates more consistent error behavior across observations, which is advantageous for decision-making contexts that require stable model behavior rather than isolated gains in RMSE.
3.3. Demographic Sensitivity and Model Interpretation (Tabular ResNet)
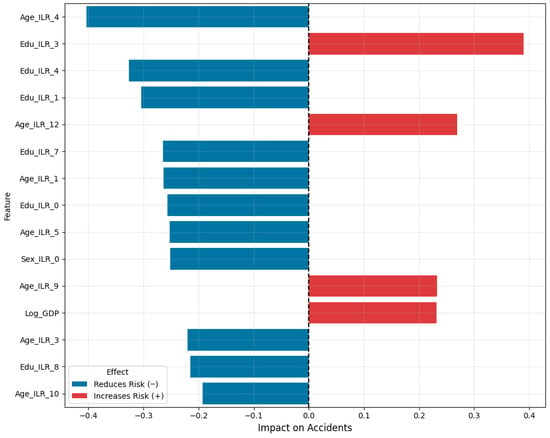
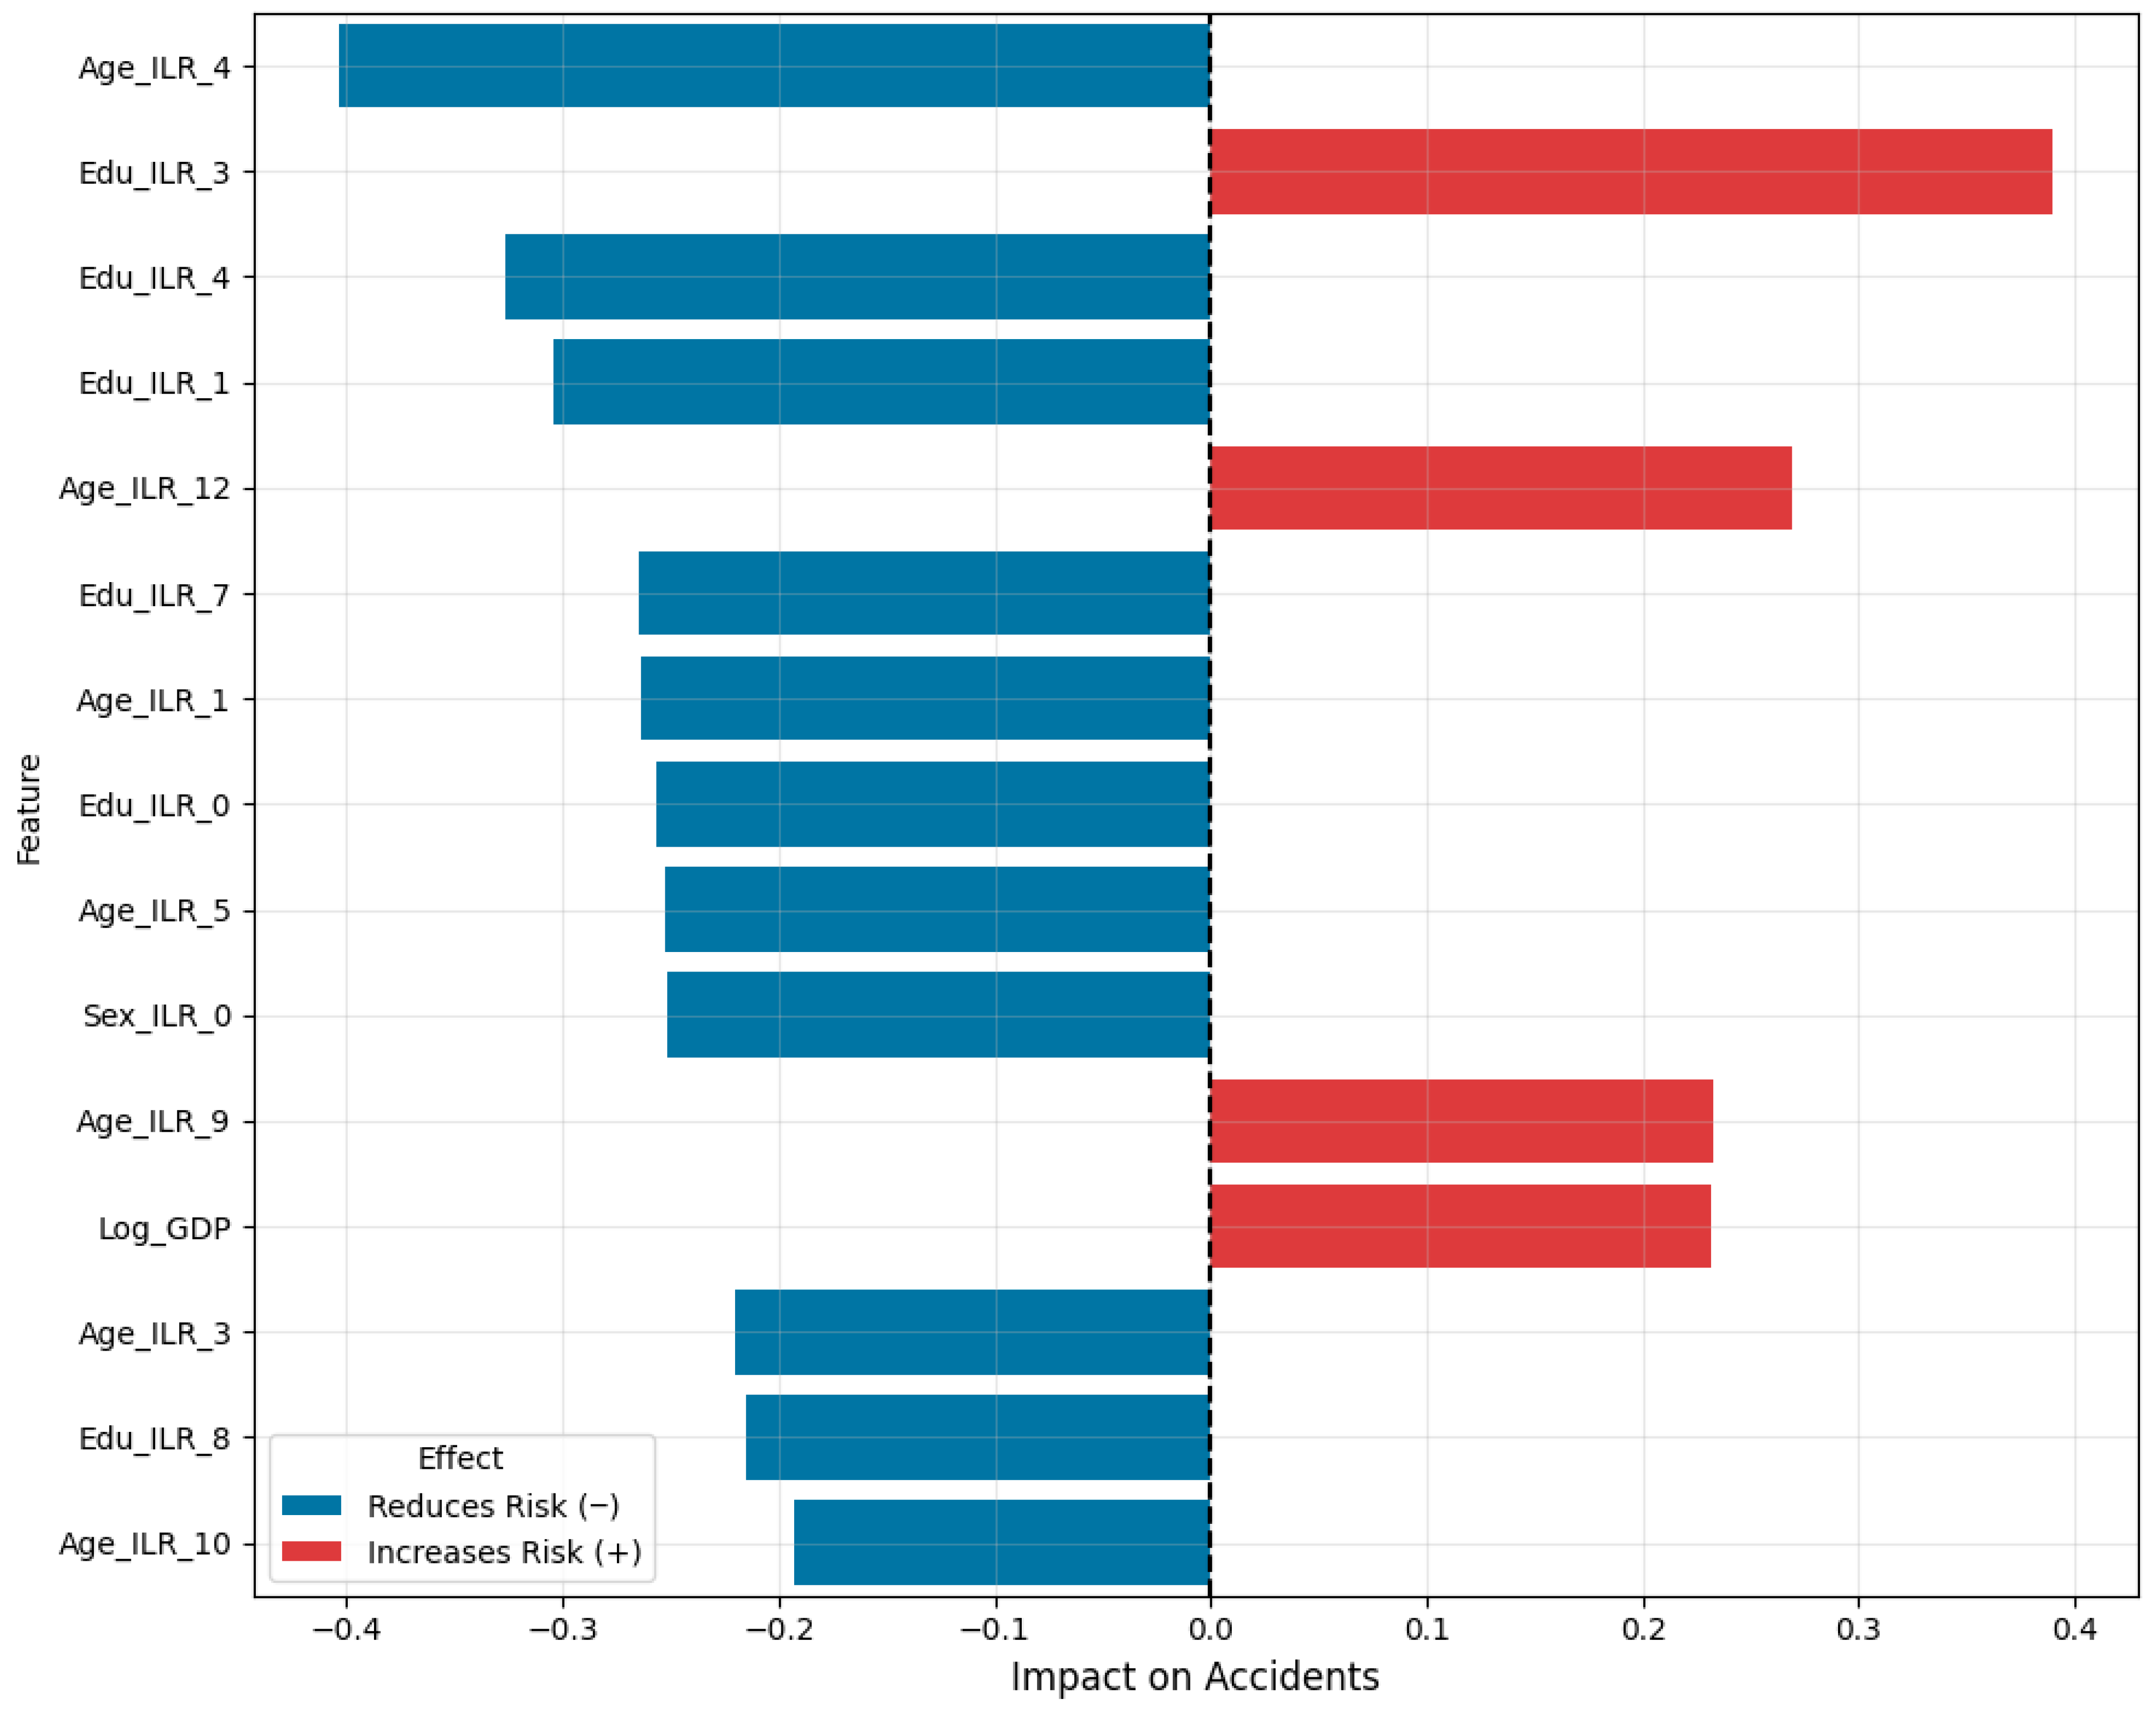
To identify which demographic components most strongly influence predicted traffic accident rates, we conducted a gradient-based sensitivity analysis on the trained Tabular ResNet ensemble. Figure 6 reports the 15 most influential inputs ranked by the absolute mean gradient, including ILR-transformed demographic features and log-GDP. Positive values (red) indicate directions that increase the predicted accident rate, whereas negative values (blue) indicate directions that reduce it. The ranking shows that age and education balance coordinates dominate the model’s sensitivity. The strongest risk-increasing component is Edu_ILR_3, followed by Age_ILR_12; Age_ILR_9 and Log_GDP also contribute positively. In contrast, the largest protective component is Age_ILR_4, and several education contrasts (Edu_ILR_4, Edu_ILR_1, and others) are also protective. This mixed-direction behavior is expected because ILR features encode balances (log-contrasts) rather than single-category shares; different redistributions within the same demographic domain can move predicted accident rates in opposite directions. Sex_ILR_0 appears among the top features but is secondary relative to age and education balances.
Figure 6.
Gradient-based sensitivity (mean partial derivative) of the Tabular ResNet ensemble with respect to standardized ILR balances and log-GDP.
The results indicate that age composition components play a prominent role in model sensitivity. In particular, Age_ILR_12 and Age_ILR_9 appear among the strongest risk-increasing features, whereas Age_ILR_4, Age_ILR_1, Age_ILR_5, Age_ILR_3, and Age_ILR_10 contribute in the opposite direction.
Education-related components also exhibit substantial influence, with both positive and negative gradients depending on the specific ILR coordinate. This indicates that relative changes within education levels, rather than absolute proportions, play a meaningful role in shaping predicted accident outcomes.
The GDP component (log-scaled and median-normalized) shows a comparatively moderate gradient magnitude, implying that economic variation contributes to predictions but does not dominate demographic composition effects. Overall, the gradient signs are stable and interpretable, with no evidence of unstable or oscillatory sensitivity, supporting the robustness of the learned representations.
From a modeling perspective, these attributions indicate that the ensemble’s predictions are primarily driven by nonlinear interactions among age and education compositions, with GDP providing an additional (but smaller) contribution. This pattern helps explain why the proposed approach differentiates provincial demographic risk profiles more effectively than the pooled statistical reference models and the added benchmark specifications, which exhibit larger positive bias on the 2022–2024 window.
Overall, the sensitivity analysis provides an interpretable layer linking the demography-first estimator to key demographic contrasts. The prominence of age-related balances suggests that shifts in population structure are strongly associated with predicted accident variation, while the protective directions among education balances are consistent with the interpretation that human-capital composition can be associated with lower predicted accident rates. It should be noted that this approach captures local first-order sensitivities and does not fully characterize higher-order nonlinear feature interactions.
It should be noted that the ILR coordinates are constructed using a sequential Helmert basis, and therefore the interpretation of individual balances depends on the ordering of components within each composition. While this introduces a degree of arbitrariness in the interpretation of specific ILR coordinates, it does not affect the overall model predictions, as different orthonormal bases represent equivalent transformations of the same compositional space.
Consequently, the identified dominant features should be interpreted as indicative of important directions in the compositional space rather than unique or invariant demographic contrasts. Alternative ILR bases, such as pivot or domain-informed balances aligned with specific policy hypotheses, could provide more directly interpretable contrasts.
3.4. Temporal Stability and Year-Wise Error Patterns
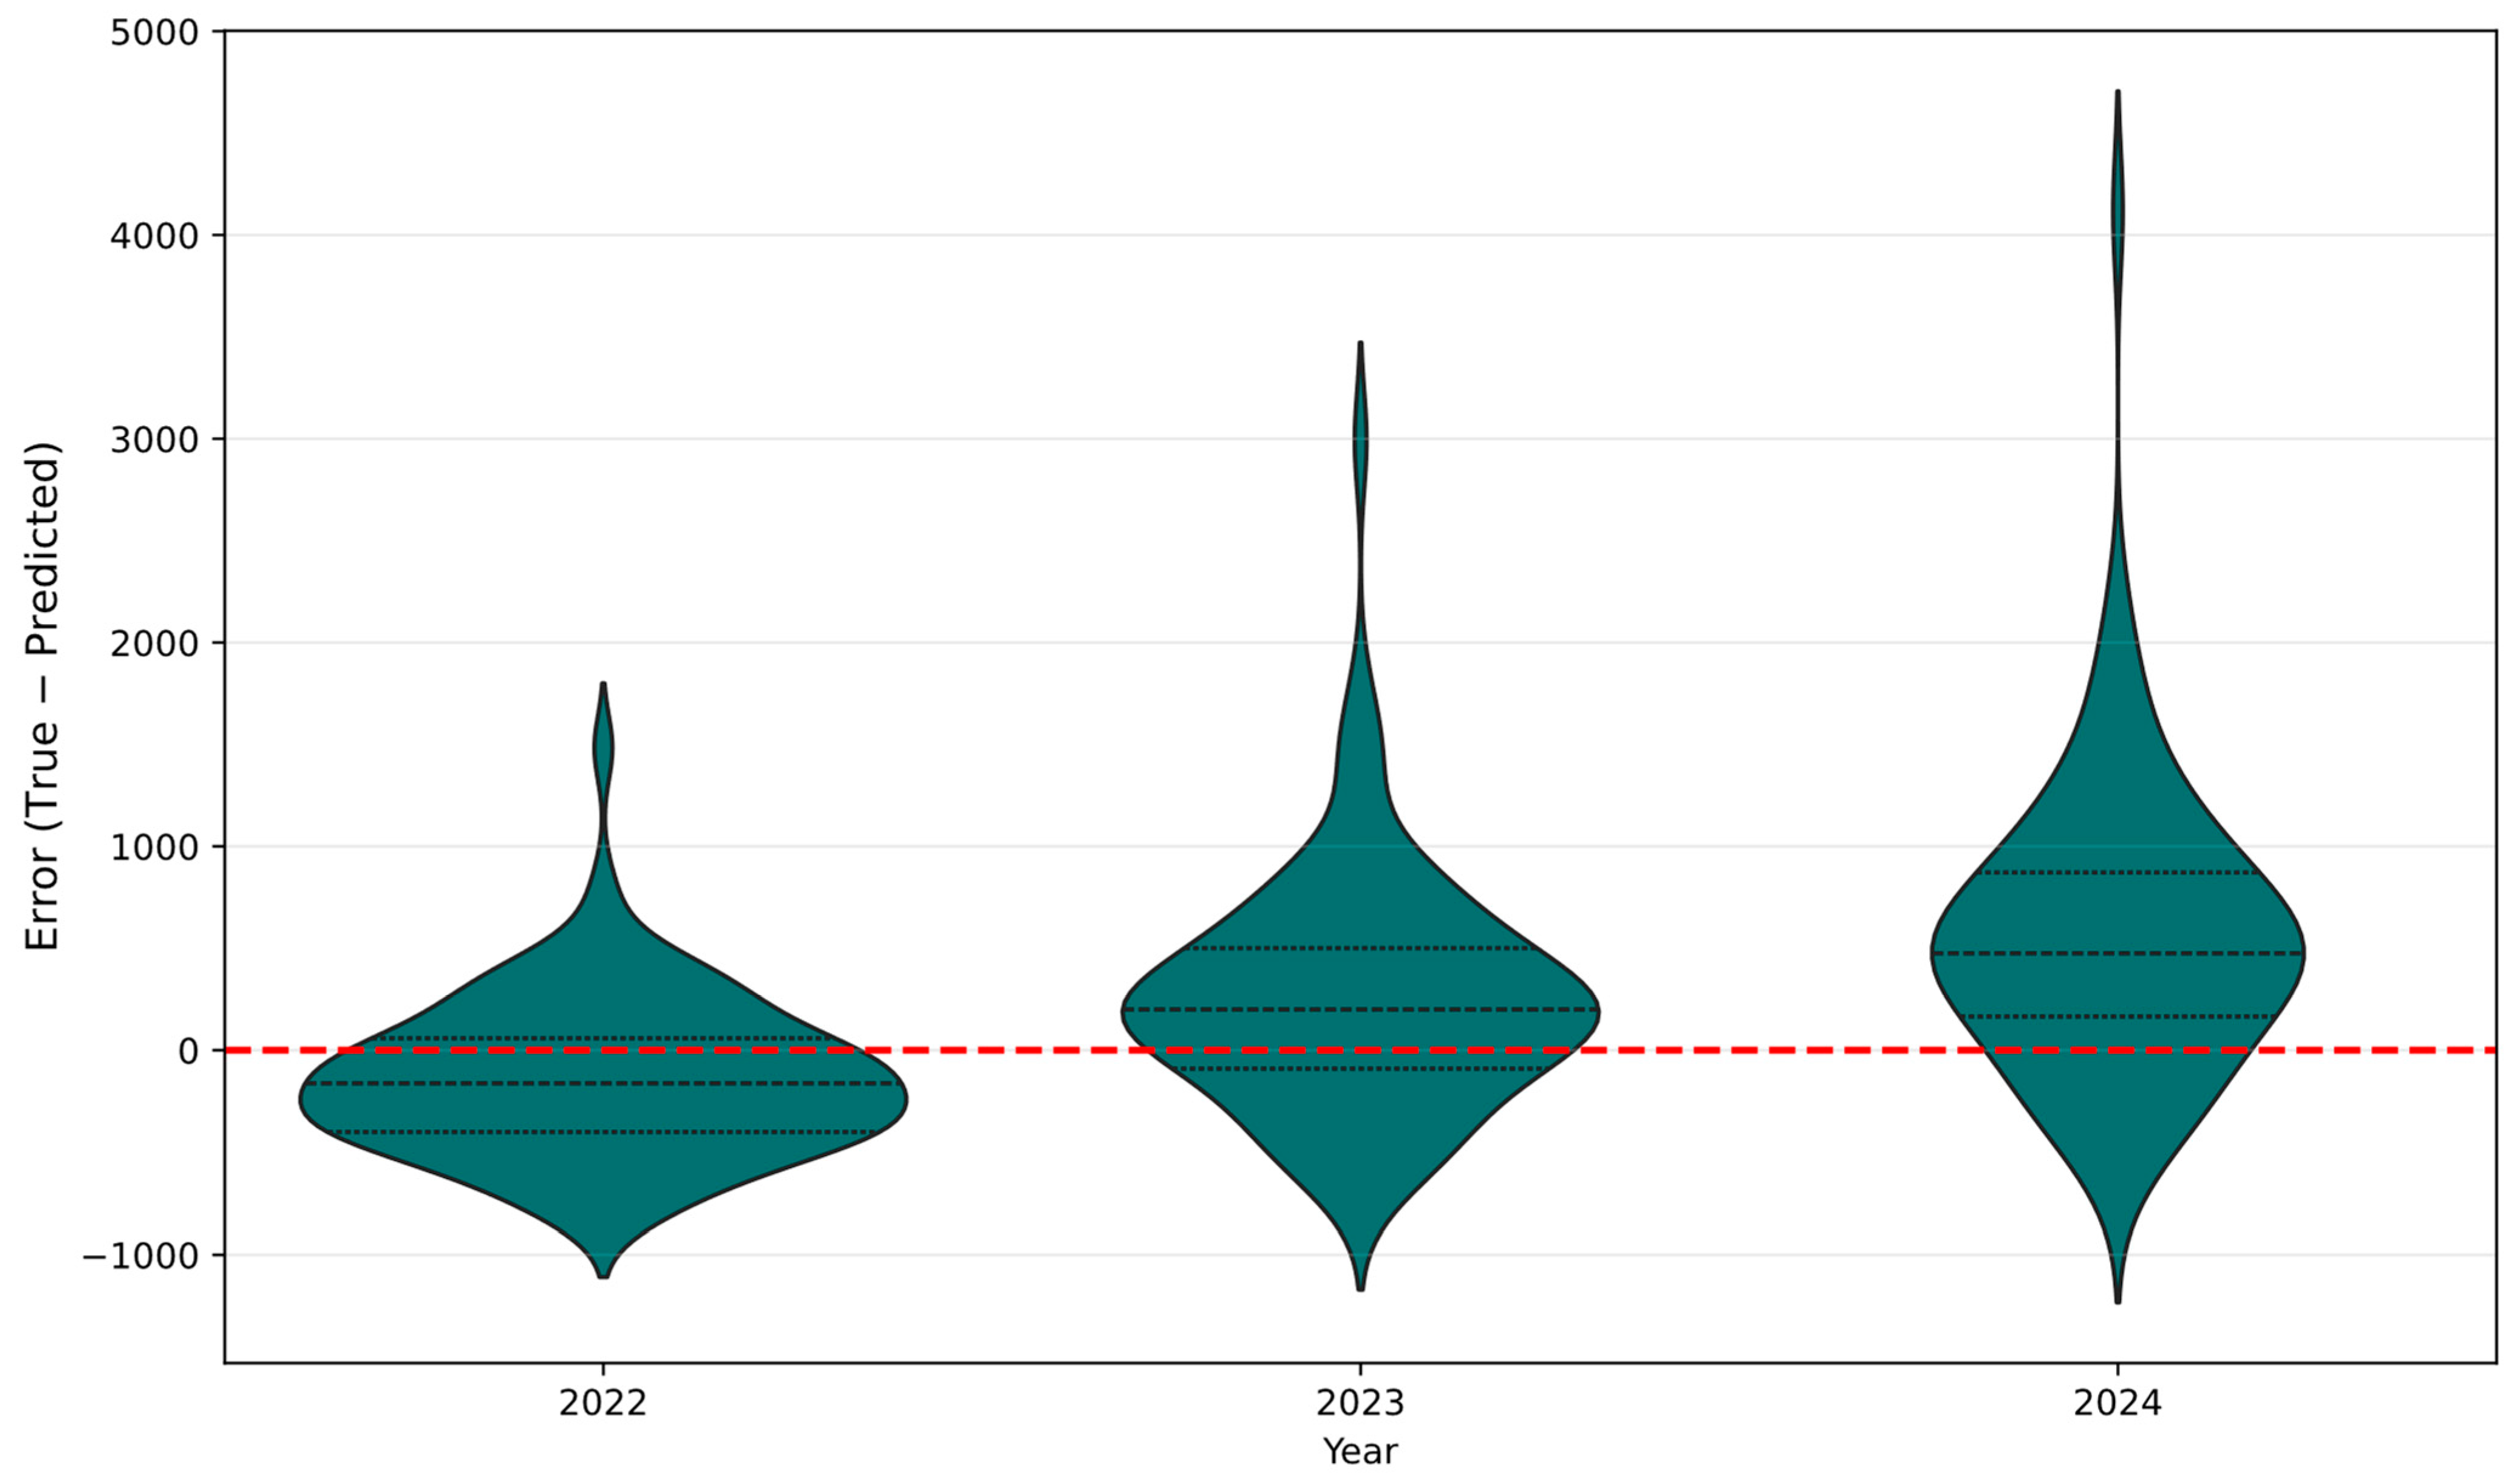
Year-wise boxplots of signed prediction errors reveal a clear temporal pattern. While predictions for 2022 are approximately centered around zero, the model exhibits increasing underprediction for 2023 and 2024. This indicates the presence of temporal drift between the training period (2008–2019) and the calibration/evaluation period, likely reflecting structural changes in traffic conditions, reporting practices, or policy effects that are not explicitly encoded in the input variables.
Importantly, this drift is gradual rather than erratic, suggesting that the model generalizes consistently but lacks explicit time-dependent adjustment mechanisms. This behavior is more stable than that of the pooled statistical reference models, which exhibit strong and persistent underprediction across all calibration/evaluation years.
Given the time-forward evaluation design, it is essential to assess whether error behavior is stable across evaluation years or shifts over time. Figure 7 shows signed errors (True − Predicted) for the Tabular ResNet ensemble by year. The distributions are not stationary: 2022 errors are centered below zero (net overprediction), whereas 2023 and 2024 shift upward with a clearly positive central tendency (net underprediction), and dispersion increases in 2024.
Figure 7.
Signed error distributions by calibration/evaluation year (Tabular ResNet).
As seen in Figure 7, this temporal shift matters for policy use. If enforcement intensity, reporting practices, mobility demand, or safety interventions change across years, a demography-first model trained on earlier regimes may require explicit temporal anchoring (e.g., time indicators, rolling refits, or recalibration). Importantly, the year-wise pattern appears gradual rather than erratic, indicating consistent generalization with incomplete adaptation to the most recent regime.
To further interpret the observed underprediction, the error distribution was examined across years and magnitude levels. The results suggest that discrepancies tend to increase in higher-accident province–years, indicating a potential tail-related calibration issue rather than uniform bias. However, this observation is indicative rather than conclusive and should be interpreted with caution given the scope of the current analysis.
In the context of Türkiye, the post-2020 period has been associated with changes in mobility patterns, economic activity, and enforcement practices following the COVID-19 disruption. Such factors may have contributed to shifts in the accident-generating process that are not fully captured by demographic composition alone, and may partly explain the observed temporal drift.
3.5. Residual Structure and Heteroskedasticity
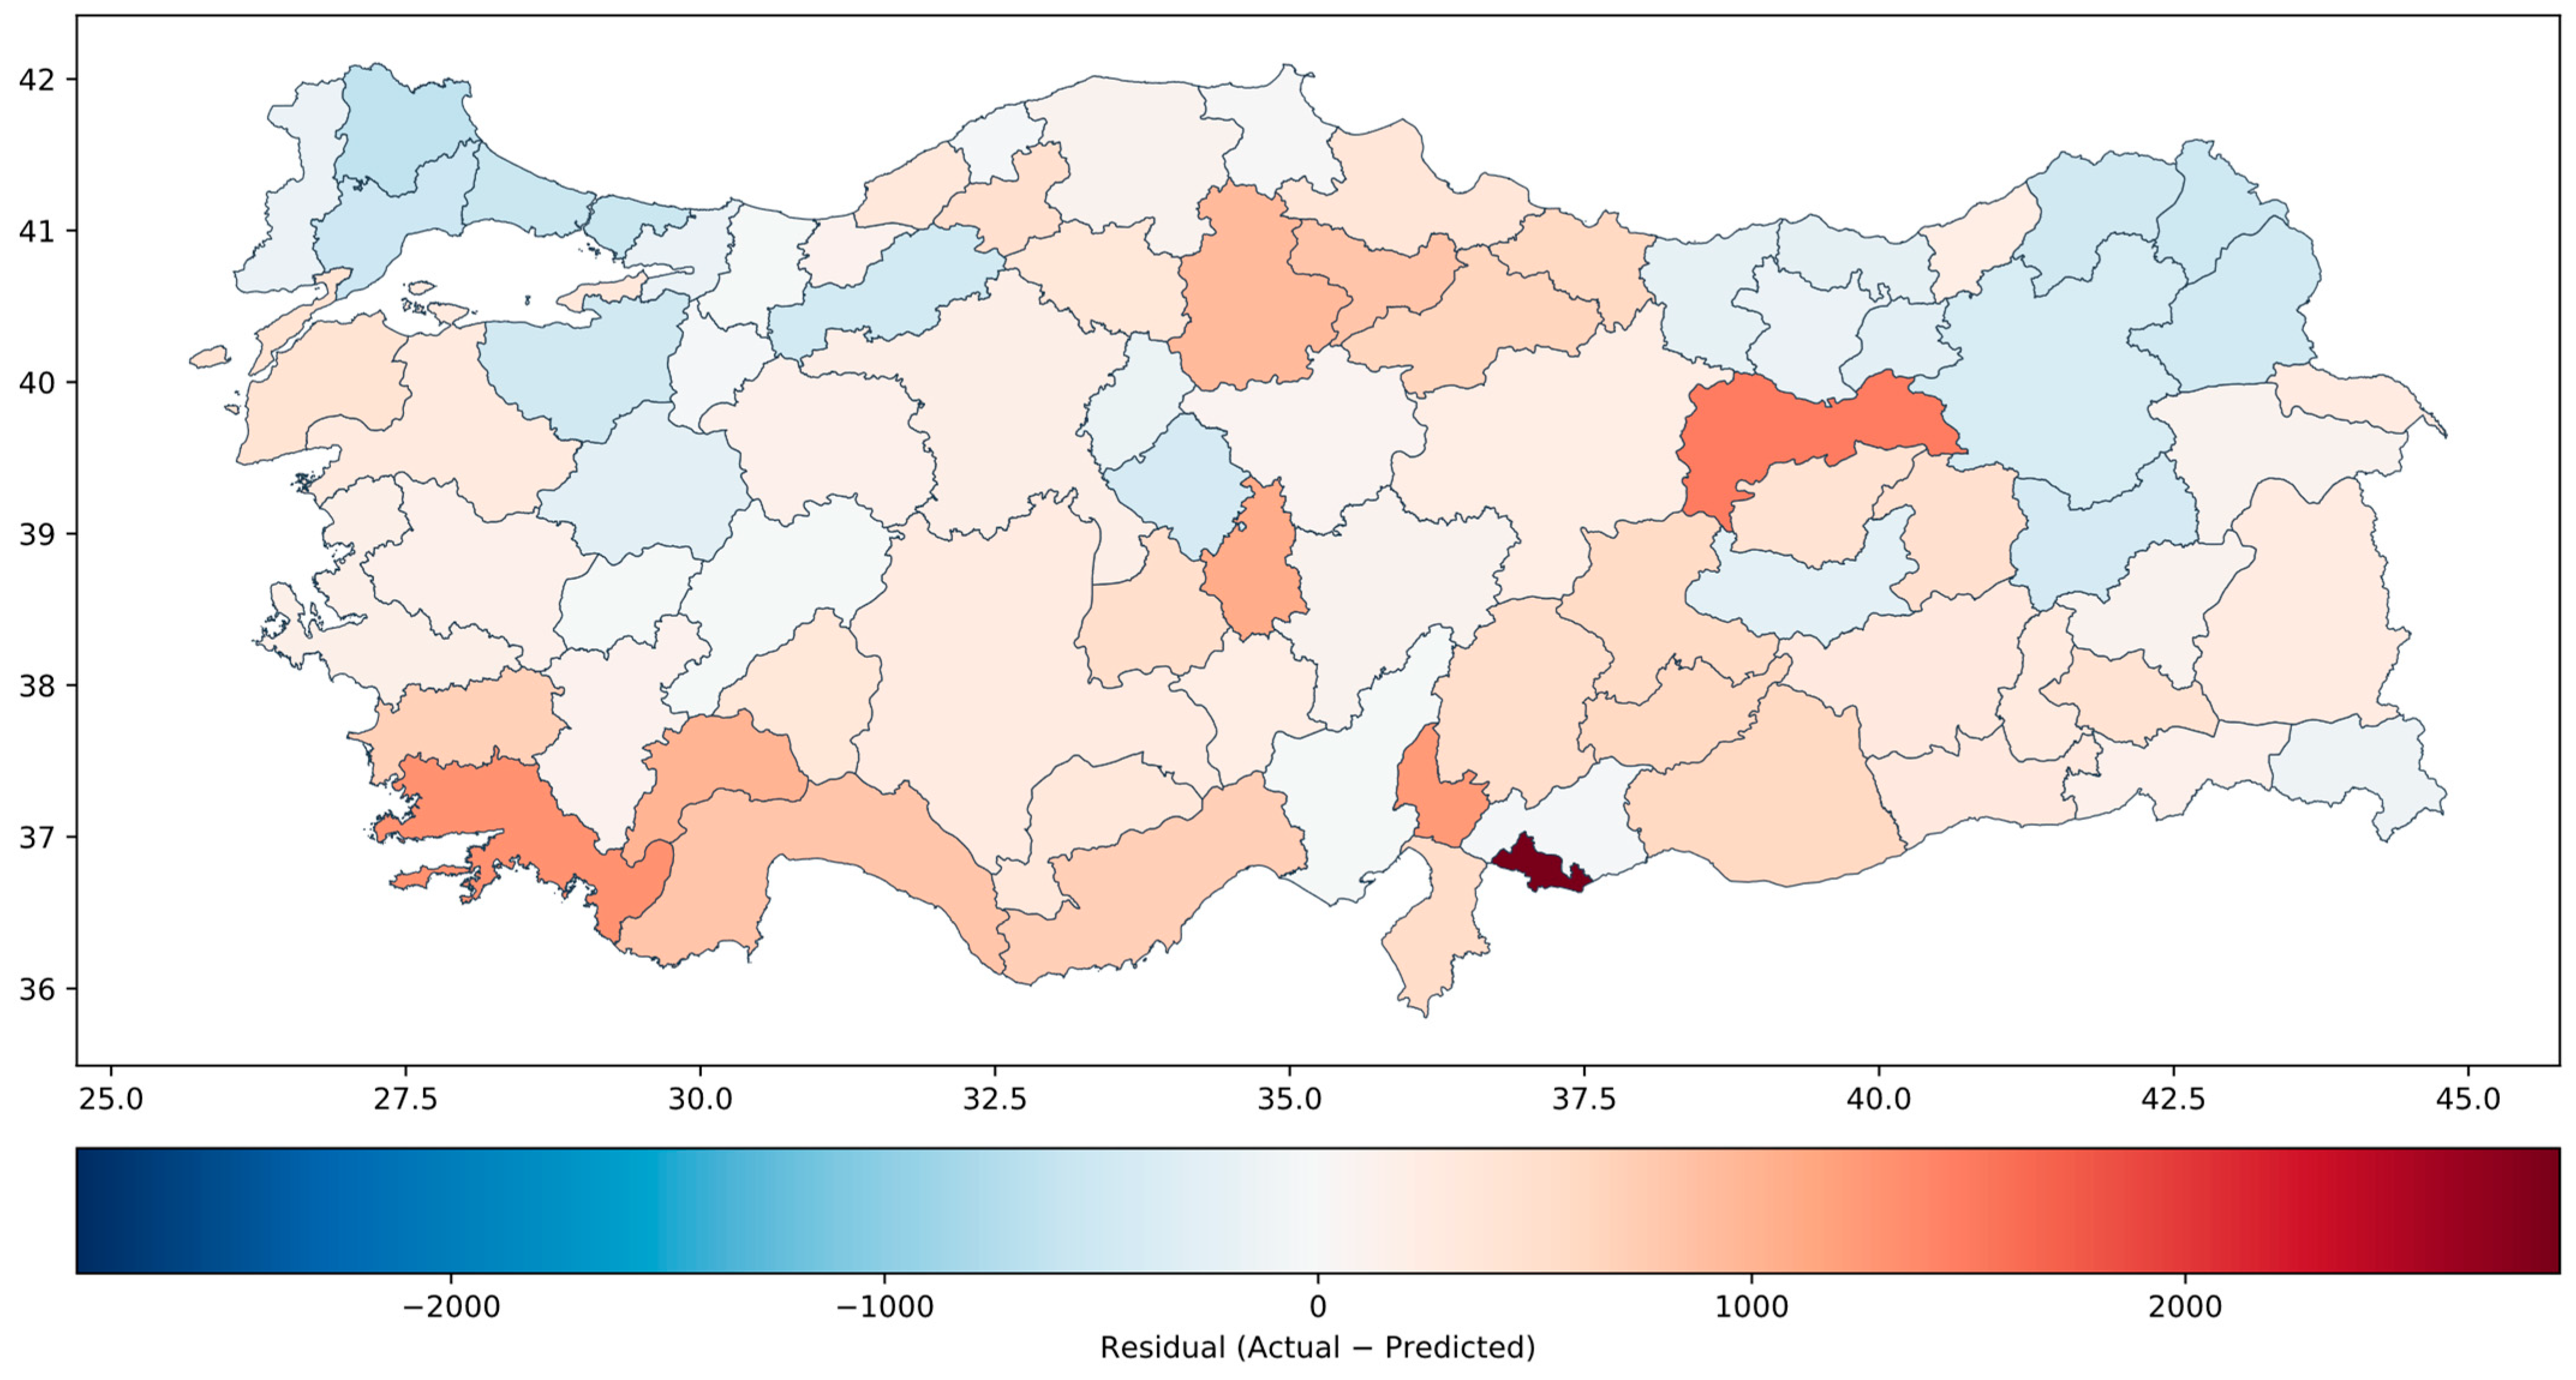
The Moran’s I analysis indicates strong spatial autocorrelation in the observed accident rates (I = 0.5380, p < 0.01), confirming the presence of geographic clustering. The residuals exhibit weaker but still statistically significant spatial autocorrelation (I = 0.1576, p < 0.05), suggesting that the model captures a substantial portion of the spatial structure while leaving some localized patterns unexplained.
The residual map (Figure 8) reveals clusters of over- and under-prediction, highlighting regions where additional spatial or exposure-related factors may influence accident rates beyond demographic composition.
Figure 8.
Spatial distribution of model residuals (True − Predicted) across provinces for the calibration/evaluation period.
3.6. Residuals Versus Predicted Values
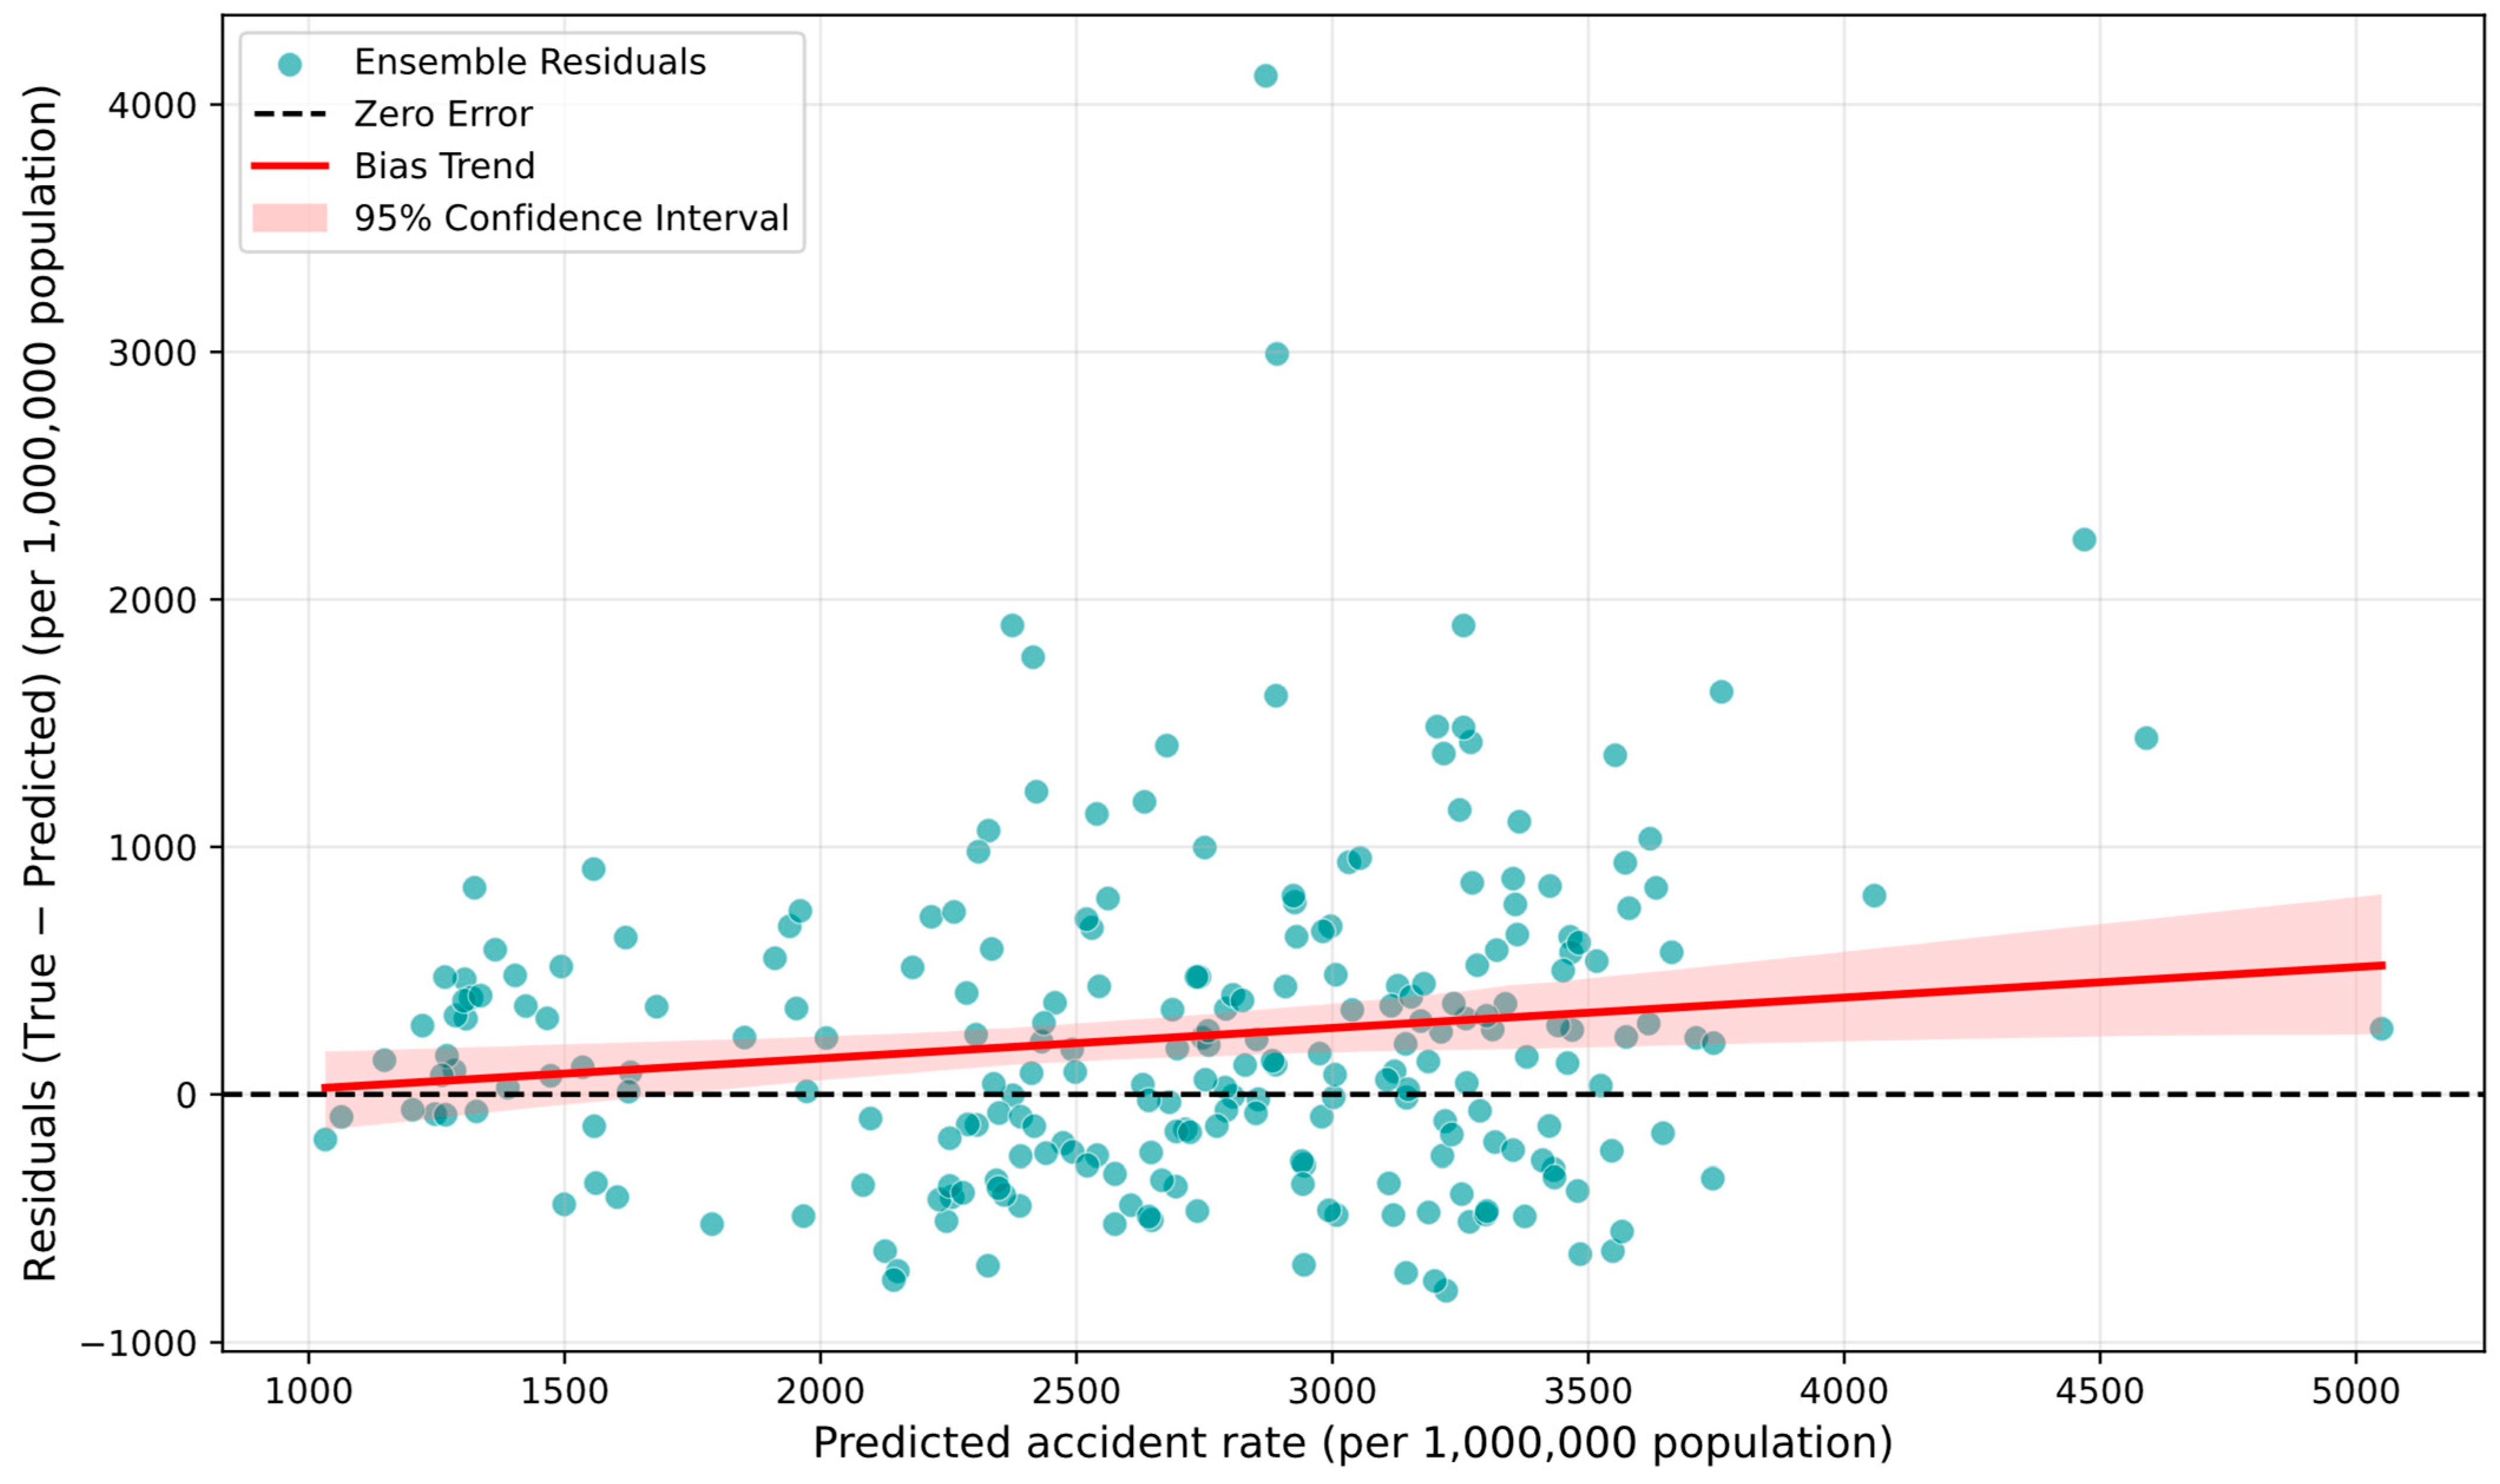
To evaluate whether remaining errors exhibit systematic structure, Figure 9 presents residuals versus predicted values for the final ensemble. Residual dispersion increases with higher predicted accident levels, indicating mild heteroskedasticity, which is expected for rate-like outcomes. In addition, the fitted bias line slopes upward, showing a systematic positive trend: the model tends to produce larger positive residuals (True − Predicted) as predicted accidents increase, implying increasing underprediction in higher-risk province–year observations. As seen in Figure 9, this pattern suggests that uncertainty is higher for high-accident observations and that calibration is weaker in the upper tail.
Figure 9.
Residuals (True − Predicted) versus predicted accident rate (per 1,000,000 population) for the Final Ensemble (2022–2024).
3.7. Implications for Modeling Accident Outcomes
The comparative results indicate that the pooled Poisson and pooled negative binomial reference models considered here provide a less favorable fit for this rate outcome on the 2022–2024 calibration/evaluation window than the proposed ResNet ensemble. Both pooled count-based reference specifications exhibit clear positive error bias (True − Predicted > 0), indicating systematic underestimation of accident rates together with relatively large error dispersion. Within the present benchmarking design, these results suggest that their distributional restrictions and predominantly linear additive structure are less effective in capturing the empirical mapping from compositional demographics and GDP to accident outcomes than the evaluated ResNet specification. In the present study, the Poisson and negative binomial models are used as simplified pooled reference specifications applied to the accident-rate outcome, rather than as canonical exposure-adjusted count formulations.
The pooled linear model performs comparably to the count-based reference models but still shows substantial dispersion and bias, indicating that linear structure alone is insufficient to represent the relevant demographic–risk relationships in this setting. In contrast, the Tabular ResNet ensemble achieves the strongest performance among the evaluated specifications, with the highest R2 and the lowest RMSE and MAE, while also outperforming the added Random Forest, XGBoost, and LVDF benchmarks on the same calibration/evaluation window. This pattern is consistent with the benefit of learning nonlinear interactions while respecting the compositional geometry of demographic inputs via ILR features.
At the same time, the year-wise error distributions and the residual–prediction trend indicate temporal drift and increasing underprediction in higher-risk cases, highlighting that regime change remains a key challenge. Future work should therefore consider explicit temporal adaptation mechanisms (e.g., rolling recalibration windows, time-aware encodings, or domain-shift correction) to stabilize performance as traffic dynamics evolve.
4. Conclusions
This study demonstrates that a compositional, demography-based modeling framework can provide a scalable baseline for traffic safety monitoring, with improved calibration and error characteristics compared to the pooled statistical reference models considered in this study.
Beyond average accuracy, the ensemble’s ECDF of signed errors showed a greater concentration of probability mass near zero, indicating more consistent calibration across provinces rather than gains driven by a small subset of cases. Model interpretability via gradient sensitivity further indicated that predictions are dominated by age- and education-balance coordinates, with GDP providing an additional (smaller) contribution and sex balances playing a secondary role—supporting the premise that population structure contains meaningful signal for baseline accident risk.
At the same time, year-wise diagnostics revealed a gradual temporal drift: the ensemble’s error distribution shifts from net overprediction in 2022 to increasing underprediction in 2023–2024, consistent with regime change not fully captured by demographics and GDP alone. Residual patterns also suggested larger uncertainty in high-accident observations, motivating uncertainty-aware reporting and tail-focused refinement when policy use prioritizes high-risk provinces. Overall, the results support the Tabular ResNet + ILR demographic pipeline as the most suitable demography-expected baseline among the evaluated specifications, while highlighting temporal adaptation and upper-tail calibration as key next challenges.
4.1. Limitations
The model uses a deliberately minimal covariate set based on demographic composition and GDP, which supports portability but leaves out key exposure and operational drivers such as mobility intensity, enforcement, infrastructure conditions, vehicle fleet composition, and weather, contributing to residual structure and regime sensitivity. Performance also shows temporal drift under a strict time-forward evaluation, indicating that relationships learned from 2008 to 2019 do not fully transfer to the 2022–2024 regime, likely due to evolving accident-generating processes and contextual changes. Residual diagnostics suggest weaker calibration and higher uncertainty in the upper tail, meaning prediction quality degrades for high-accident province–years where policy prioritization is often most critical. The annual province-level accident rate per million population further limits granularity by masking within-province heterogeneity, road-class differences, seasonality, and severity/type distinctions. Finally, results are demonstrated for Türkiye using official TUIK series, so external validity to other countries and reporting systems remains untested. Temporal drift may partly reflect changes in accident reporting practices over time. Changes in reporting procedures, data systems, or enforcement may affect the consistency of recorded accident statistics, potentially contributing to apparent increases or systematic underprediction independent of demographic or behavioral dynamics. Accordingly, reporting-related effects cannot be fully excluded when interpreting temporal patterns.
In addition, the compositional representation is based on a sequential Helmert ILR basis, meaning that the interpretation of individual coordinates depends on the ordering of components, although model predictions remain invariant to the choice of orthonormal basis. The benchmarking framework is also limited to classical statistical models, Random Forest, XGBoost, and an LVDF temporal heuristic; however, it still does not represent an exhaustive or fully symmetric hyperparameter search across tabular learning methods. Furthermore, the evaluation design relies on a calibration/evaluation period (2022–2024) that is also used for model selection and ensemble construction, and therefore does not constitute a fully independent test setting. These aspects should be considered when interpreting the results and assessing the generalizability of the proposed approach.
4.2. Future Work
Future work should incorporate time-aware mechanisms (e.g., explicit temporal features, rolling recalibration, or domain-shift correction) to reduce drift and stabilize performance across years. Uncertainty quantification through prediction intervals or quantile objectives is also needed to support decision-making, particularly for high-accident contexts where uncertainty is larger. Tail-focused learning strategies, such as weighted losses or upper-quantile targeting, may further improve calibration in high-risk provinces.
The baseline can be extended in a controlled manner by incorporating exposure-related variables (e.g., vehicle ownership, road supply, mobility indicators, enforcement intensity, and meteorological conditions) while preserving the compositional treatment of demographic structure, enabling clearer attribution of residual errors. Spatial generalization should be evaluated through transfer learning, hierarchical or spatial modeling, and out-of-region validation to separate demographic effects from country-specific regimes.
Interpretability can be enhanced by combining gradient-based sensitivity with complementary attribution methods and ILR-space counterfactual analyses that translate compositional shifts into policy-relevant insights. Future work may expand the benchmarking framework to include additional tabular learners such as LightGBM, CatBoost, or GAM-style models under more fully matched tuning settings.
Beyond predictive performance, the framework can be extended to support scenario-based policy analysis by examining how changes in demographic composition or targeted interventions (e.g., education, enforcement, or mobility policies) relate to expected accident rates and by informing strategies tailored to specific demographic risk profiles.
Funding
This research received no external funding.
Data Availability Statement
The raw data used in this study are publicly available from the Turkish Statistical Institute (TUIK) at https://biruni.tuik.gov.tr/medas/?locale=en (accessed on 10 April 2026). The processed province–year dataset, analysis code, and replication materials used to generate the reported results are publicly available in the associated GitHub/Zenodo repository (DOI: https://doi.org/10.5281/zenodo.19482870). The archived release used for this study corresponds to version v1.0.0, and the computational environment and software package versions are documented in the repository.
Conflicts of Interest
The author declares no conflicts of interest.
References
- World Health Organization. Global Status Report on Road Safety 2023; World Health Organization: Geneva, Switzerland, 2023. [Google Scholar]
- National Highway Traffic Safety Administration (NHTSA). Traffic Safety Facts 2021: A Compilation of Motor Vehicle Traffic Crash Data; Report No. DOT HS 813 527; National Highway Traffic Safety Administration: Washington, DC, USA, 2023.
- Centers for Disease Control and Prevention (CDC). Transportation Safety. Available online: https://www.cdc.gov/transportation-safety/about/index.html (accessed on 9 April 2026).
- Zeng, Q.; Wang, F.; Wang, Q.; Pei, X.; Yuan, Q. Bayesian multivariate spatial modeling for crash frequencies by injury severity at daytime and nighttime in traffic analysis zones. Transp. Lett. 2023, 15, 553–560. [Google Scholar] [CrossRef] [Scilit]
- Madushani, J.S.; Sandamal, R.K.; Meddage, D.P.; Pasindu, H.R.; Gomes, P.A. Evaluating expressway traffic crash severity by using logistic regression and explainable & supervised machine learning classifiers. Transp. Eng. 2023, 13, 100190. [Google Scholar] [CrossRef] [Scilit]
- Katanalp, B.Y.; Eren, E. The novel approaches to classify cyclist accident injury-severity: Hybrid fuzzy decision mechanisms. Accid. Anal. Prev. 2020, 144, 105590. [Google Scholar] [CrossRef] [Scilit] [PubMed]
- Ma, Z.; Mei, G.; Cuomo, S. An analytic framework using deep learning for prediction of traffic accident injury severity based on contributing factors. Accid. Anal. Prev. 2021, 160, 106322. [Google Scholar] [CrossRef] [Scilit] [PubMed]
- Manzoor, M.; Umer, M.; Sadiq, S.; Ishaq, A.; Ullah, S.; Madni, H.A.; Bisogni, C. RFCNN: Traffic accident severity prediction based on decision level fusion of machine and deep learning model. IEEE Access 2021, 9, 128359–128371. [Google Scholar] [CrossRef] [Scilit]
- Azhar, A.; Rubab, S.; Khan, M.M.; Bangash, Y.A.; Alshehri, M.D.; Illahi, F.; Bashir, A.K. Detection and prediction of traffic accidents using deep learning techniques. Clust. Comput. 2023, 26, 477–493. [Google Scholar] [CrossRef] [Scilit]
- Bokaba, T.; Doorsamy, W.; Paul, B.S. A comparative study of ensemble models for predicting road traffic congestion. Appl. Sci. 2022, 12, 1337. [Google Scholar] [CrossRef] [Scilit]
- Gupta, S.; Kumar, A. Machine learning strategies for analyzing road traffic accident. In International Conference on Intelligent Human Computer Interaction; Springer Nature: Cham, Switzerland, 2023; pp. 394–405. [Google Scholar] [CrossRef] [Scilit]
- Li, J.; Guo, F.; Zhou, Y.; Yang, W.; Ni, D. Predicting the severity of traffic accidents on mountain freeways with dynamic traffic and weather data. Transp. Saf. Environ. 2023, 5, tdad001. [Google Scholar] [CrossRef] [Scilit]
- Harantová, V.; Kubíková, S.; Rumanovský, L. Traffic accident occurrence, its prediction and causes. In International Conference on Transport Systems Telematics; Springer International Publishing: Cham, Switzerland, 2019; pp. 123–136. [Google Scholar] [CrossRef] [Scilit]
- Liang, C.W.; Chang, C.C.; Liang, J.J. The impacts of air quality and secondary organic aerosols formation on traffic accidents in heavy fog–haze weather. Heliyon 2023, 9, e14631. [Google Scholar] [CrossRef] [Scilit] [PubMed]
- Gao, J.; Tian, H.; Li, A.; Song, J.; Zhu, X. Analysis of agglomerate fog meteorological characteristics in Anhui Province based on traffic accident data. Pure Appl. Geophys. 2023, 180, 313–333. [Google Scholar] [CrossRef] [Scilit]
- Gorzelanczyk, P. Using neural networks to forecast the number of road accidents in Poland taking into account weather conditions. Results Eng. 2023, 17, 100981. [Google Scholar] [CrossRef] [Scilit]
- Tanishita, M.; Sekiguchi, Y.; Sunaga, D. Impact analysis of road infrastructure and traffic control on severity of pedestrian–vehicle crashes at intersections and non-intersections using bias-reduced logistic regression. IATSS Res. 2023, 47, 233–239. [Google Scholar] [CrossRef] [Scilit]
- Hamim, O.F.; Ukkusuri, S.V. Towards safer streets: A framework for unveiling pedestrians’ perceived road safety using street view imagery. Accid. Anal. Prev. 2024, 195, 107400. [Google Scholar] [CrossRef] [Scilit] [PubMed]
- Rahman, M.S.; Abdel-Aty, M.; Hasan, S.; Cai, Q. Applying machine learning approaches to analyze the vulnerable road-users’ crashes at statewide traffic analysis zones. J. Saf. Res. 2019, 70, 275–288. [Google Scholar] [CrossRef] [Scilit] [PubMed]
- Egozcue, J.J.; Pawlowsky-Glahn, V.; Mateu-Figueras, G.; Barcelo-Vidal, C. Isometric logratio transformations for compositional data analysis. Math. Geol. 2003, 35, 279–300. [Google Scholar] [CrossRef] [Scilit]
- Wang, J.; Guo, J.; Dong, S.; Bian, B.; Wang, H. Correlation analysis of traffic accidents based on multiple model fusion. In Machine Learning, Multi Agent and Cyber Physical Systems: Proceedings of the 15th International FLINS Conference (FLINS 2022); World Scientific Publishing: Singapore, 2023; pp. 373–381. [Google Scholar] [CrossRef] [Scilit]
- Nassiri, H.; Mohammadpour, S.I.; Dahaghin, M. Forecasting time trends of fatal motor vehicle crashes in Iran using an ensemble learning algorithm. Traffic Inj. Prev. 2023, 24, 44–49. [Google Scholar] [CrossRef] [Scilit] [PubMed]
- de Zarzà, I.; de Curtò, J.; Roig, G.; Calafate, C.T. LLM multimodal traffic accident forecasting. Sensors 2023, 23, 9225. [Google Scholar] [CrossRef] [Scilit] [PubMed]
- Turkish Statistical Institute (TUIK). Data Portal for Statistics. Available online: https://biruni.tuik.gov.tr/ (accessed on 6 January 2026).
- World Bank. World Bank Country and Lending Groups. Available online: https://datahelpdesk.worldbank.org/knowledgebase/articles/906519-world-bank-country-and-lending-groups (accessed on 19 January 2024).
- Yeo, I.K.; Johnson, R.A. A new family of power transformations to improve normality or symmetry. Biometrika 2000, 87, 954–959. [Google Scholar] [CrossRef] [Scilit]

Disclaimer/Publisher’s Note: The statements, opinions and data contained in all publications are solely those of the individual author(s) and contributor(s) and not of MDPI and/or the editor(s). MDPI and/or the editor(s) disclaim responsibility for any injury to people or property resulting from any ideas, methods, instructions or products referred to in the content. |
© 2026 by the author. Published by MDPI on behalf of the International Society for Photogrammetry and Remote Sensing. Licensee MDPI, Basel, Switzerland. This article is an open access article distributed under the terms and conditions of the Creative Commons Attribution (CC BY) license.