


Abstract
Water pipe smoking, or hookah smoking, is a growing public health concern ingrained in urban leisure cultures. Even though hookah smoking is common, the localized spatial drivers of this activity are still poorly understood. In order to close this gap, this study examined the locations of 273 hookah cafés in the Tabriz metropolis in Iran, modeling the distribution of these cafés against eight urban predictors: population density, road networks, and six distinct land use categories, such as commercial, administrative, educational, industrial, religious, and recreational land use. We combined Kernel Density Estimation (KDE) with Local Bivariate Relationships (LBR) using a high-resolution spatial approach. The findings indicate a non-random and spatially clustered pattern, using entropy-based measures of local relationship complexity. With the highest mean entropy value (0.84) and percentage of significant relationships (87.7%), educational land use density was found to be the best predictor. Additionally, there was a robust and consistent correlation with commercial land use density. Relationships with administrative and recreational land uses, on the other hand, showed lower entropy and were weaker and more dispersed. According to this study’s findings, the distribution of hookah cafés is spatially correlated to youth concentration and commercial activity patterns. Entropy analysis reveals substantial neighborhood-level variation in predictor influence, highlighting the value of local spatial analysis for identifying place-specific exposure.
1. Introduction
Smoking increases morbidity and mortality, making it a serious threat to public health [1]. In the past decade, water pipe smoking, also called hookah smoking, has become a popular social activity for young people [2]. Worldwide, more than 100 million people are addicted, most of whom are adolescents and young adults [3], and hookah consumption is increasingly embedded within contemporary urban leisure cultures [4]. Cities are not only the scene of social and economic interactions but also the arena for the emergence and intensification of health-related and harmful behaviors. In this context, we use the concept “third place” for those informal public spaces, separate from the home (first place) and the workplace (second place), that can serve as a platform for social gathering and interaction and thus play a central role in shaping urban lifestyles.
Oldenburg’s concept of third places describes informal social environments that structure everyday interaction [5]. When interpreted through risk environment theory and urban health geography, such spaces can be understood as spatial exposure environments where accessibility, social normalization, and urban form interact to shape behavioral opportunity structures [6,7]. Contemporary spatial epidemiology emphasizes that health-related behaviors are not randomly distributed but emerge from localized interactions between the built environment, mobility systems, and social gathering infrastructures [8,9]. Framing hookah cafés within this perspective shifts analysis from individual behavior to place-based exposure contexts that may facilitate or constrain health-relevant practices. Hookah smoking in urban coffeehouses and cafés is a prime example of this phenomenon, which has widespread health, social, and environmental consequences [5]. The World Health Organization (WHO) reports that each puff delivers 0.15–1.0 liters of smoke [10]. Acute physiological effects, such as elevated heart rate and blood pressure, along with long-term risks, including chronic bronchitis, cardiovascular diseases, and various cancers, are well documented [11].
There are various reasons for water pipe use. One is that it is more enticing, sweet, and fragrant than smoking cigarettes because users use tobacco flavored with either apple, plum, coconut, mango, mint, strawberry, or cola [12]; another is the mistaken belief that it is less harmful than cigarettes. Cultural characteristics of regions, the proximity of hookah sales centers to major universities, densely populated urban recreational areas, accessibility, and geographical proximity to specific urban uses are among other reasons [13]. In Iran, hookah is a major public health concern. A study in Iran showed that its prevalence in men ranged from 1.7% to 10.9% and from 0% to 16.8% in women [14]. Further evidence from Iran suggests that hookah use is influenced by the built environment, neighborhood social norms, and café accessibility [15,16]. Also, the results of a two-month study showed that the percentage of contemporary hookah use among students and youth in Tabriz was 8.5% [17].
Previous studies on hookah use can be divided into two categories. The first focuses mainly on individual and socio-economic risk factors. These studies show that attitudes towards hookah and health among water pipe users often rely on subjective norms (e.g., holding that it is healthier than cigarettes) and that peer group influence plays an important role [18,19,20,21]. Findings from this research strongly suggest that cultural normalization of hookah and its easy access via social media are major predictors of its use, especially among young people [20]. The second category emphasizes the relationship between the urban built environment and tobacco use. For example, the density of commercial outlets, offices, and recreational areas, as well as high-traffic urban contexts, has been found to be associated with increased access to tobacco products and the like [22,23]. Since high population density in an area can serve as an indicator of potential higher demand for social spaces such as coffee houses [24], proximity to educational uses is also a factor related to higher hookah use among students [2,25]. Most of these studies used descriptive methods [18,19,20,21], while others relied on cluster testing and regression analysis [23,24]. Previous studies have also examined the relationship between hookah lounges and one or more limited variables (such as distance from universities or economic status), while a few have comprehensively measured the spatial distribution of these toxic locations across a full range of uses.
Beyond individual-level behavioral studies, the growing international literature has examined how tobacco-related environments are spatially structured within cities, demonstrating that retail clustering, accessibility corridors, and youth-oriented activity zones are associated with uneven exposure opportunities [7,9]. Urban built environment research increasingly shows that density gradients, mixed land use, and transport connectivity contribute to geographically patterned health risks [7]. However, much of this work relies on global statistical approaches or descriptive mapping, which may obscure neighborhood-scale heterogeneity [8]. High-resolution local modeling has therefore been recommended to better capture spatial variability in exposure environments, yet its application to hookah-serving venues remains limited, particularly in rapidly urbanizing metropolitan contexts.
The present study specifically aimed to fill current research gaps by employing advanced statistical spatial methods, such as Local Bivariate Relationships (LBR), which determines the effect of each variable quantitatively and comparatively on the emergence and distribution of hookah hotspots. Unlike global models that assume stationarity, LBR reveals localized associations, capturing how, for example, educational or commercial land use may predict café clustering in some neighborhoods [26]. Likewise, Geographic Information System (GIS) technology has been used in a wide range of health applications, such as modeling and mapping disease locations, monitoring disease outbreaks, and assessing the use of health care services [27]. In the context of smoking, GIS has various applications, such as analyzing demographic predictors of tobacco store density or assessing neighborhoods that are more likely to sell tobacco [28]. In this study, we used GIS to spatially correlate hookah-serving cafes to specific urban land use and infrastructure characteristics. Recent geospatial health research has highlighted the value of high-resolution spatial modeling for identifying localized risk environments and neighborhood-level health inequalities, particularly in urban settings. These studies highlight how spatial heterogeneity in population distribution, accessibility, and land use structure can shape health outcomes in ways that global models often fail to capture.
From a health policy perspective, spatially explicit evidence on exposure environments can inform place-based regulation, zoning strategies, and youth-focused prevention planning [9]. Urban tobacco control increasingly recognizes that environmental availability influences behavioral uptake, meaning that identifying localized clustering patterns is relevant for targeted intervention rather than uniform citywide policy responses [7,9]. By linking the built environment to potential exposure contexts, spatial modeling provides actionable intelligence for municipal planners and public health authorities seeking to reduce environmental risk concentrations [8,9].
Despite substantial progress in tobacco and urban health research, few studies have applied high-resolution local spatial modeling to comprehensively examine how multiple urban land use, demographic, and infrastructural factors jointly shape the distribution of hookah cafés in an Iranian metropolis. Tabriz is particularly relevant for a case study because it combines rapid metropolitan growth, strong youth social activity, and diverse land use structures that mirror broader urban transitions occurring in many developing cities. It is clear that socio-spatial gradients, institutional clustering, and mixed commercial corridors create a suitable analytical setting for examining how environmental exposure patterns emerge. Insights derived from this context therefore extend beyond local description by illustrating mechanisms likely to operate in comparable metropolitan environments undergoing similar urban change. Existing studies typically rely on descriptive mapping or global statistical models, which overlook the localized, non-stationary dynamics that produce neighborhood-specific risk environments. To address this gap, the present study integrated Kernel Density Estimation (KDE), a non-parametric, distance-based method, with LBR to model the spatial distribution of 273 hookah cafés in Tabriz and quantify how key urban predictors, including population density, educational and commercial land uses, and road network accessibility, and their spatial association with clustering.
Importantly, this study moves beyond descriptive geographic mapping by quantifying neighborhood-scale relationships between urban structure and exposure environments. This analytical perspective contributes to a broader understanding of how the built environment shapes behavioral opportunity structures, offering a transferable framework for examining spatial risk environments in other public health domains. The following research questions were of specific interest: (1) How are hookah cafes spatially distributed across the urban landscape of Tabriz when examined using high-resolution density modeling? (2) To what extent do local variations in population density, land use patterns, and accessibility exhibit statistically significant spatial relationships with hookah café clustering? (3) How do these localized associations reveal neighborhood-specific risk environments that would remain obscured under global analytical approaches? These questions were designed to bridge spatial analysis with public health interpretation by identifying where environmental exposure conditions concentrate and how they vary across neighborhood contexts. Such framing supports evidence-based urban decision-making by linking geospatial patterns to potential intervention points.
Understanding the spatial organization of hookah-serving environments is important, not only for advancing methodological approaches in urban health research but also for informing place-sensitive public health planning. Identifying neighborhood-level exposure patterns can support targeted prevention strategies, zoning considerations, and youth-focused interventions in rapidly changing cities. Situating hookah café clustering within a broader spatial risk framework contributes to emerging efforts to integrate geospatial analytics into urban health governance, particularly in developing metropolitan settings where behavioral risk environments may intensify alongside urban growth. The aim of this study was therefore primarily to identify and evaluate the localized spatial relationships between hookah café density and urban predictors to reveal the place-specific drivers underlying the emergence of these kinds of toxic third places in Tabriz.
This study adopted a spatial exposure framework to examine how built environment characteristics shape the neighborhood distribution of hookah-serving cafés. The analytical workflow proceeds in three integrated stages. First, hookah café locations are treated as an environmental exposure proxy and spatially quantified using KDE to represent localized intensity patterns. Second, eight theory-driven urban indicators—population density, road accessibility, and six land use categories (commercial, educational, administrative, industrial, religious, and recreational)—are operationalized as predictors capturing demand structure, accessibility, and functional urban context. Third, LBR analysis evaluates neighborhood-scale statistical associations between café density and each predictor, while entropy diagnostics quantify spatial variability in relationship complexity. Together, these methods link urban structure to localized exposure environments, enabling the interpretation of how different spatial drivers interact to produce heterogeneous patterns of hookah café clustering across the city.
2. Materials and Methods
2.1. Study Area
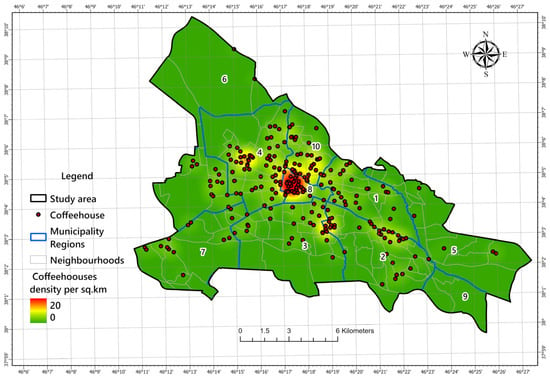
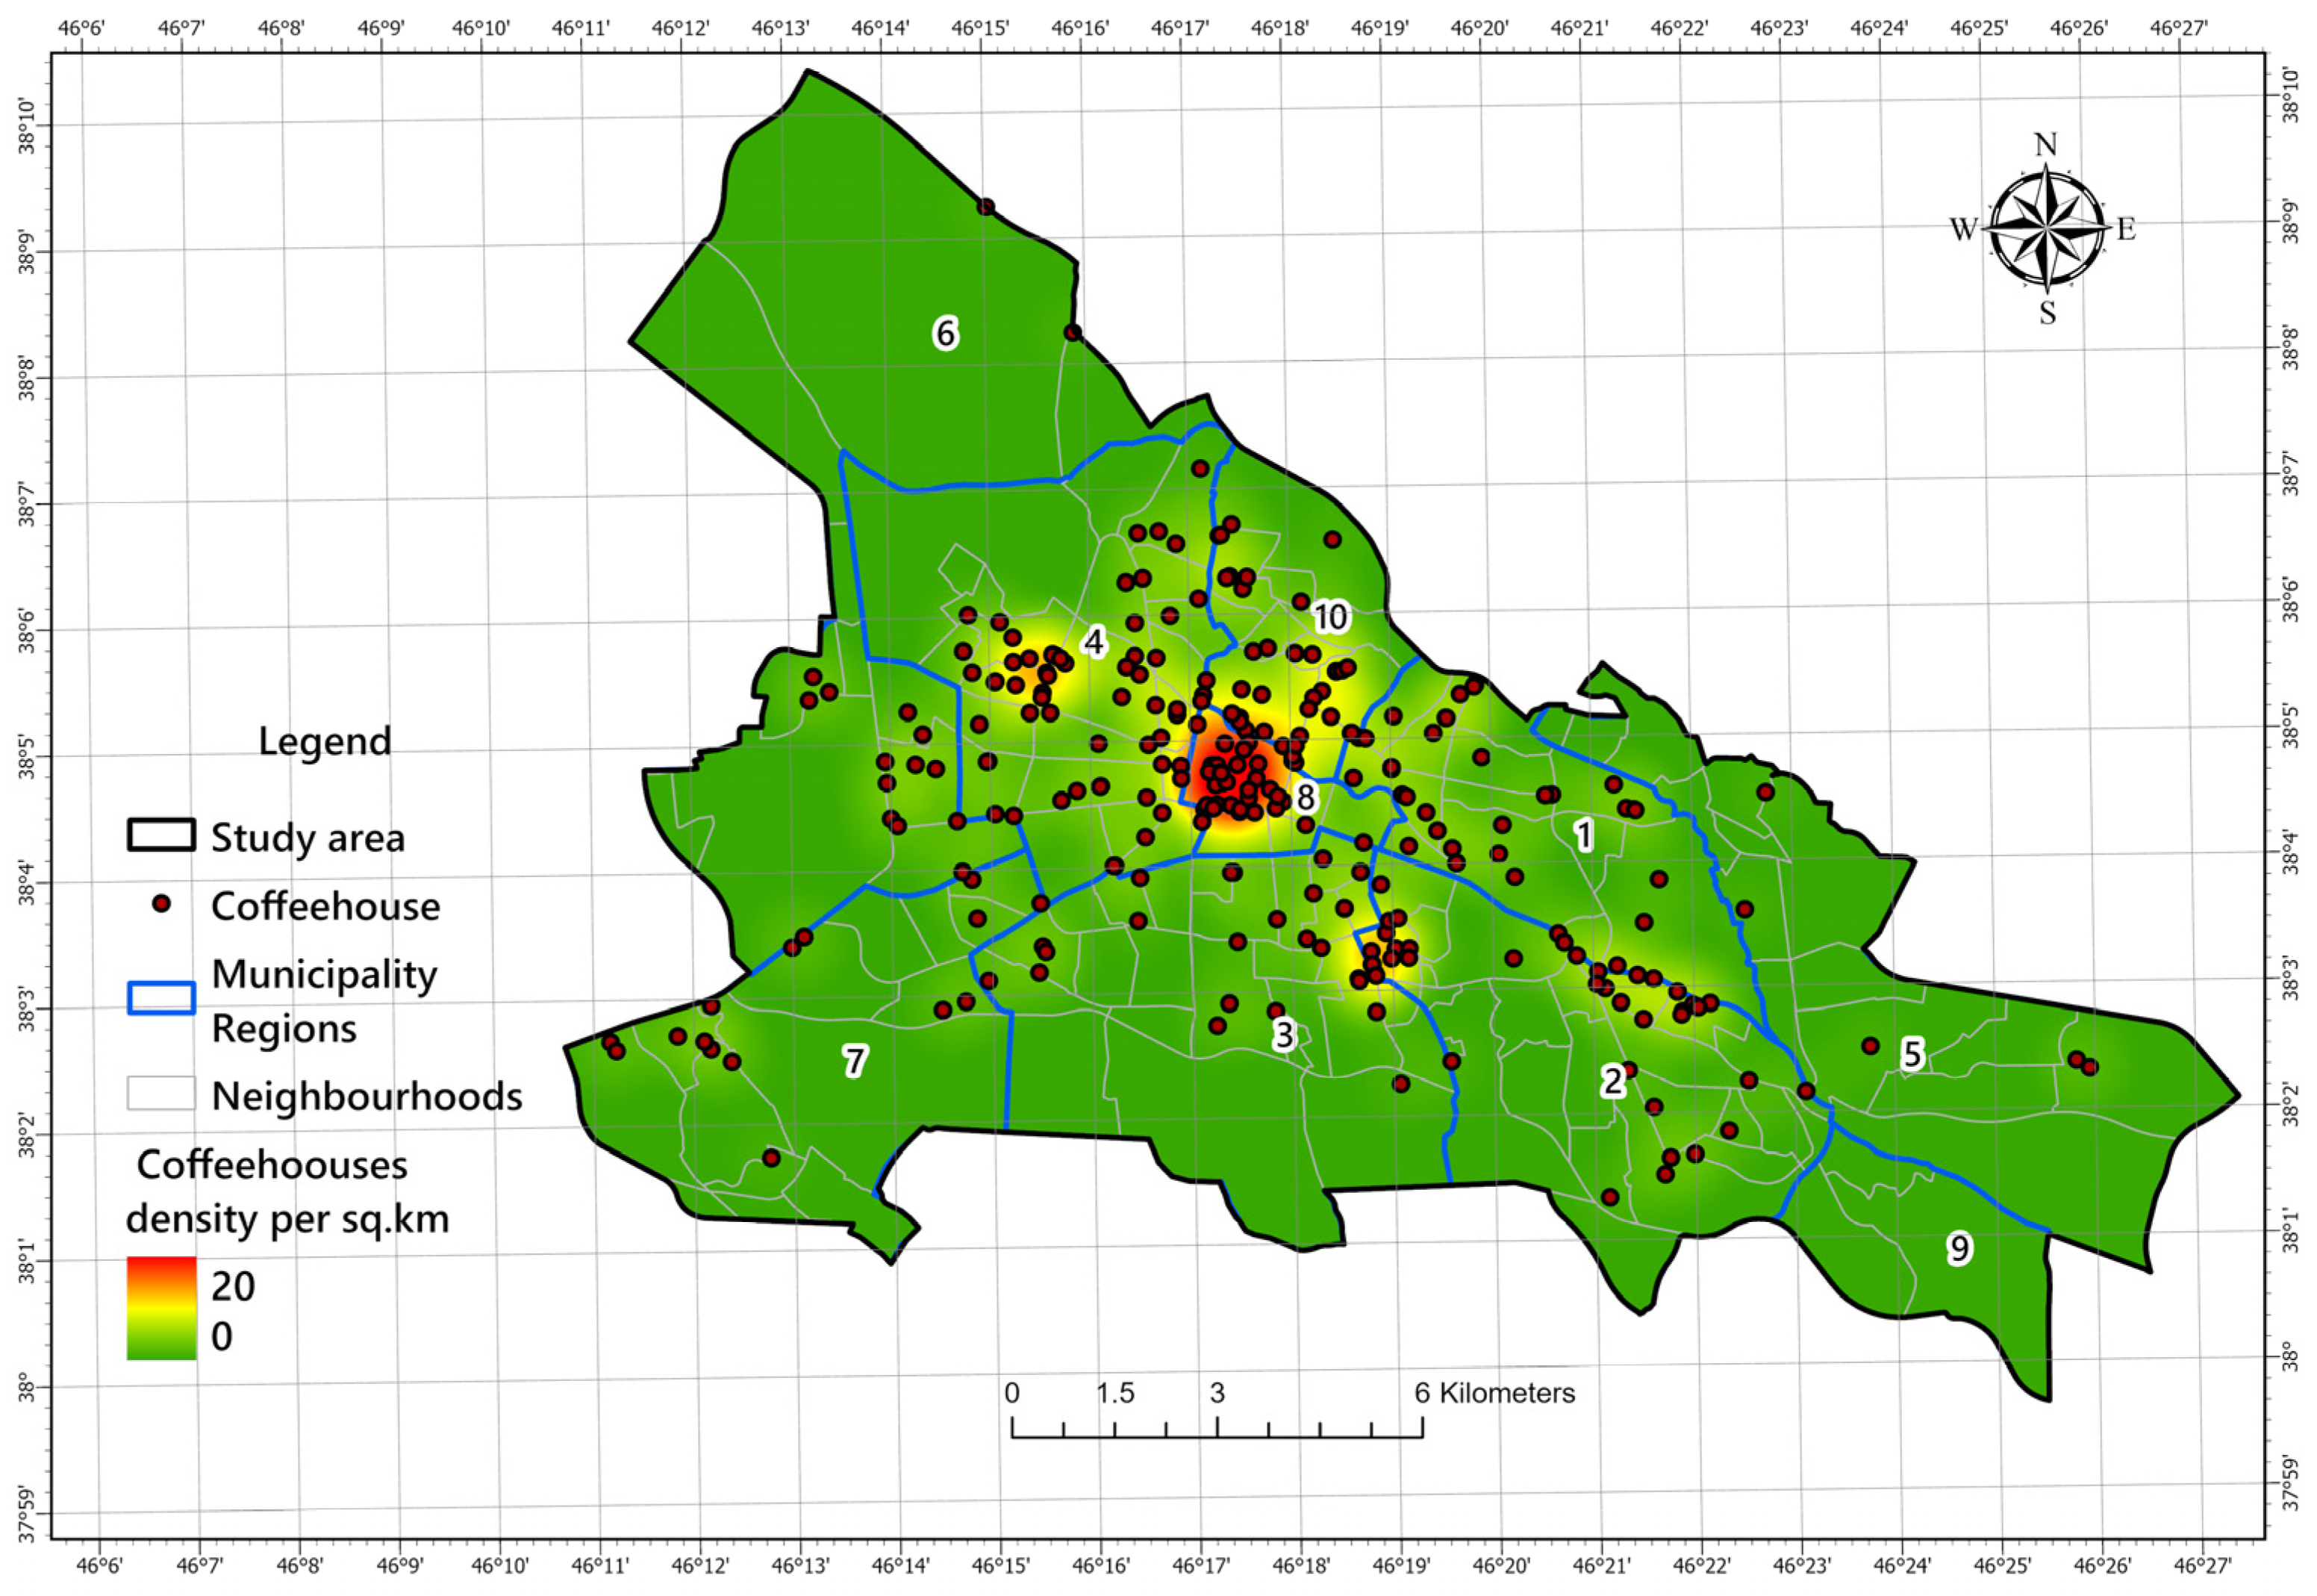
This study was conducted in Tabriz, a major metropolitan area and capital of East Azerbaijan Province in northwestern Iran (coordinates: 38.08° N, 46.29° E). According to the latest official census, the city has a population of approximately 1.56 million, distributed across 10 municipal districts and 135 neighborhoods [29]. Encompassing an area of 205 km2 (measured using QGIS version 3.28), Tabriz has evolved from a historic core, known for the UNESCO-listed Tabriz Historic Bazaar Complex, into a sprawling metropolis exhibiting both formal planning and informal urban expansion [30]. An initial survey identified 273 public hookah lounges for this research. Their spatial distribution is notably concentrated in the city’s central districts, with a density reaching up to 20 units per km2 (Figure 1). This distinct urban landscape, marked by clear socio-spatial gradients, establishes Tabriz as a highly relevant case study for investigating public health challenges within a developing metropolis.
Figure 1.
Spatial distribution of coffeehouses in the Tabriz metropolis, Iran.
2.2. Data Sources
2.2.1. The Dependent Variable
Within the municipal boundaries of Tabriz, 273 public coffeehouses providing hookah services were included in the study dataset. Comprehensive field surveys were used to confirm establishment locations, which were then cross-referenced with official municipal business registries. Using QGIS version 3.28, each location was accurately geocoded, assigning geographic coordinates (latitude and longitude) and verifying spatial accuracy. The urban landscape was methodically divided into 252 uniform hexagonal cells, each representing 1 km2, to enable reliable spatial correlation analysis. The quantitative analysis of coffeehouse distribution patterns in relation to different demographic and urban land use parameters was made possible by this standardized spatial framework.
2.2.2. The Independent Variables
This analysis employed eight significant urban spatial metrics as predictor variables, including road density, population density, and six distinct land use categories: commercial, administrative, educational, industrial, religious, and recreational land use densities (all measured per km2). These covariates were derived from the extensive urban land use geodatabase of the Tabriz municipality. Each variable’s spatial density was determined using GIS tools and ArcGIS Pro, version 3.1 (ESRI, Redlands, CA, USA). Continuous density surfaces were produced using the KDE technique. This approach enabled robust spatial analysis of the distribution of predictors (the independent variables), which facilitated the quantification of spatial patterns and intensity distributions across the study region. The methodology employed for these spatial analyses is described in detail in the Materials and Methods section.
The selection of predictor variables was theory-driven rather than solely determined by data availability. Each variable represents a distinct dimension of the urban exposure environment hypothesized to influence the spatial availability of hookah-serving cafés. Population density captures potential consumer concentration and social demand, road density reflects accessibility and mobility structures facilitating venue reach, and the six land use categories represent functional urban zones associated with youth activity, commercial exchange, institutional presence, or transitional neighborhood dynamics. Together, these variables operationalize an environmental framework that links built form characteristics to localized exposure opportunity structures, enabling interpretation of spatial associations beyond descriptive mapping. Table 1 summarizes the dependent and independent variables, including their spatial units, descriptive statistics, and analytical rationale, clarifying how each contributes to modeling neighborhood-level exposure conditions.
Table 1.
Variables used in the spatial analysis.
2.3. Analytical Methods
2.3.1. Kernel Density Estimation (KDE)
We utilized KDE for calculating the geographical intensity of people and land uses in the research area to illustrate the spatial distribution of the covariates [31]. In this case, the number of values (predictor density) was represented by the value of each cell at the raster surface (picture file format). We displayed a smoothed spatial density map using a 30 m cell size within a 2500 m bandwidth. The 2500 m bandwidth was selected to match the operational urban scale of Tabriz, balancing spatial smoothing with neighborhood-level resolution. Exploratory testing with smaller bandwidths (e.g., 1000 m) produced fragmented surfaces that obscured broader spatial structure, whereas 2500 m yielded stable and interpretable clustering patterns consistent with known urban activity zones. ArcGIS Pro’s spatial analyst mode [32] was used to calculate the KDE of the variables’ spatial density (Figure 5A). The KDE calculations are expressed in Equation (1) [31,33].
where is the density estimate at locations ; is the number of observations (covariates in this case); is the bandwidth or the kernel size; is the kernel function; and is the distance between locations and the location of the observation [31,33].
2.3.2. Local Bivariate Relationships (LBR)
We used the LBR to examine the spatially varying relationships between important variables [34,35]. By calculating the mutual information, a measure of shared information that can capture non-linear dependencies between a dependent and an explanatory variable within a defined neighborhood surrounding each feature, LBR quantifies localized associations in contrast to global statistics that assume stationarity. Based on a permutation-based significance test and a model selection process using the Corrected Akaike’s Information Criterion (AICc), the method divides each location into one of six different relationship categories: not significant, positive linear, negative linear, concave, convex, and undefined complex [36]. This method efficiently charts the locations and changes in the relationship between two variables throughout the research region.
The local relationships between number of coffeehouse locations and density of spatial values of study covariates, such as population density and various public land uses, were investigated using the LBR method. In order to define local contexts, the analysis was set up with 30 neighbors. Statistical significance was evaluated using 199 permutations at the 90% level of confidence and a False Discovery Rate (FDR) correction. The Scaling Factor (α), the sensitivity parameter, was set at 0.5. Parameter settings were selected to balance statistical stability with local sensitivity. The 30-neighbor window preserves neighborhood structure while minimizing edge effects at the urban scale. An α value of 0.5 provides moderate smoothing appropriate for heterogeneous spatial patterns, consistent with exploratory local modeling practice. A 90% confidence threshold was used to enhance detection of localized spatial signals, with FDR correction applied to control for multiple testing. This slightly relaxed threshold is consistent with exploratory local spatial modeling, where preserving sensitivity to neighborhood-scale variation is prioritized, while FDR correction mitigates the risk of inflated Type I error. This threshold is not intended for confirmatory inference but to enhance sensitivity to neighborhood-scale variation in an exploratory spatial framework, with False Discovery Rate correction applied to mitigate inflated Type I error. With diagnostic scatterplots enabled to facilitate interpretation, this configuration made it possible to create a comprehensive map that categorized the form and importance of each local relationship. These analyses were also conducted using ArcGIS Pro.
3. Results
3.1. Spatial Patterns of Urban Predictor Variables
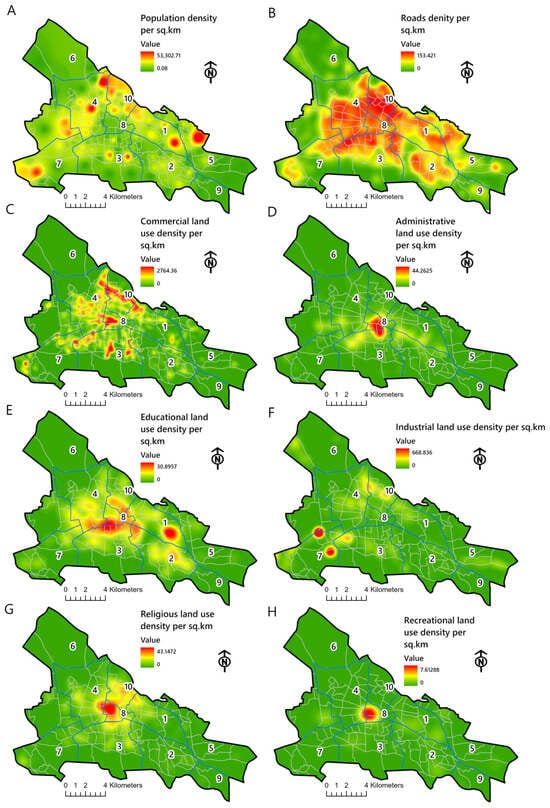
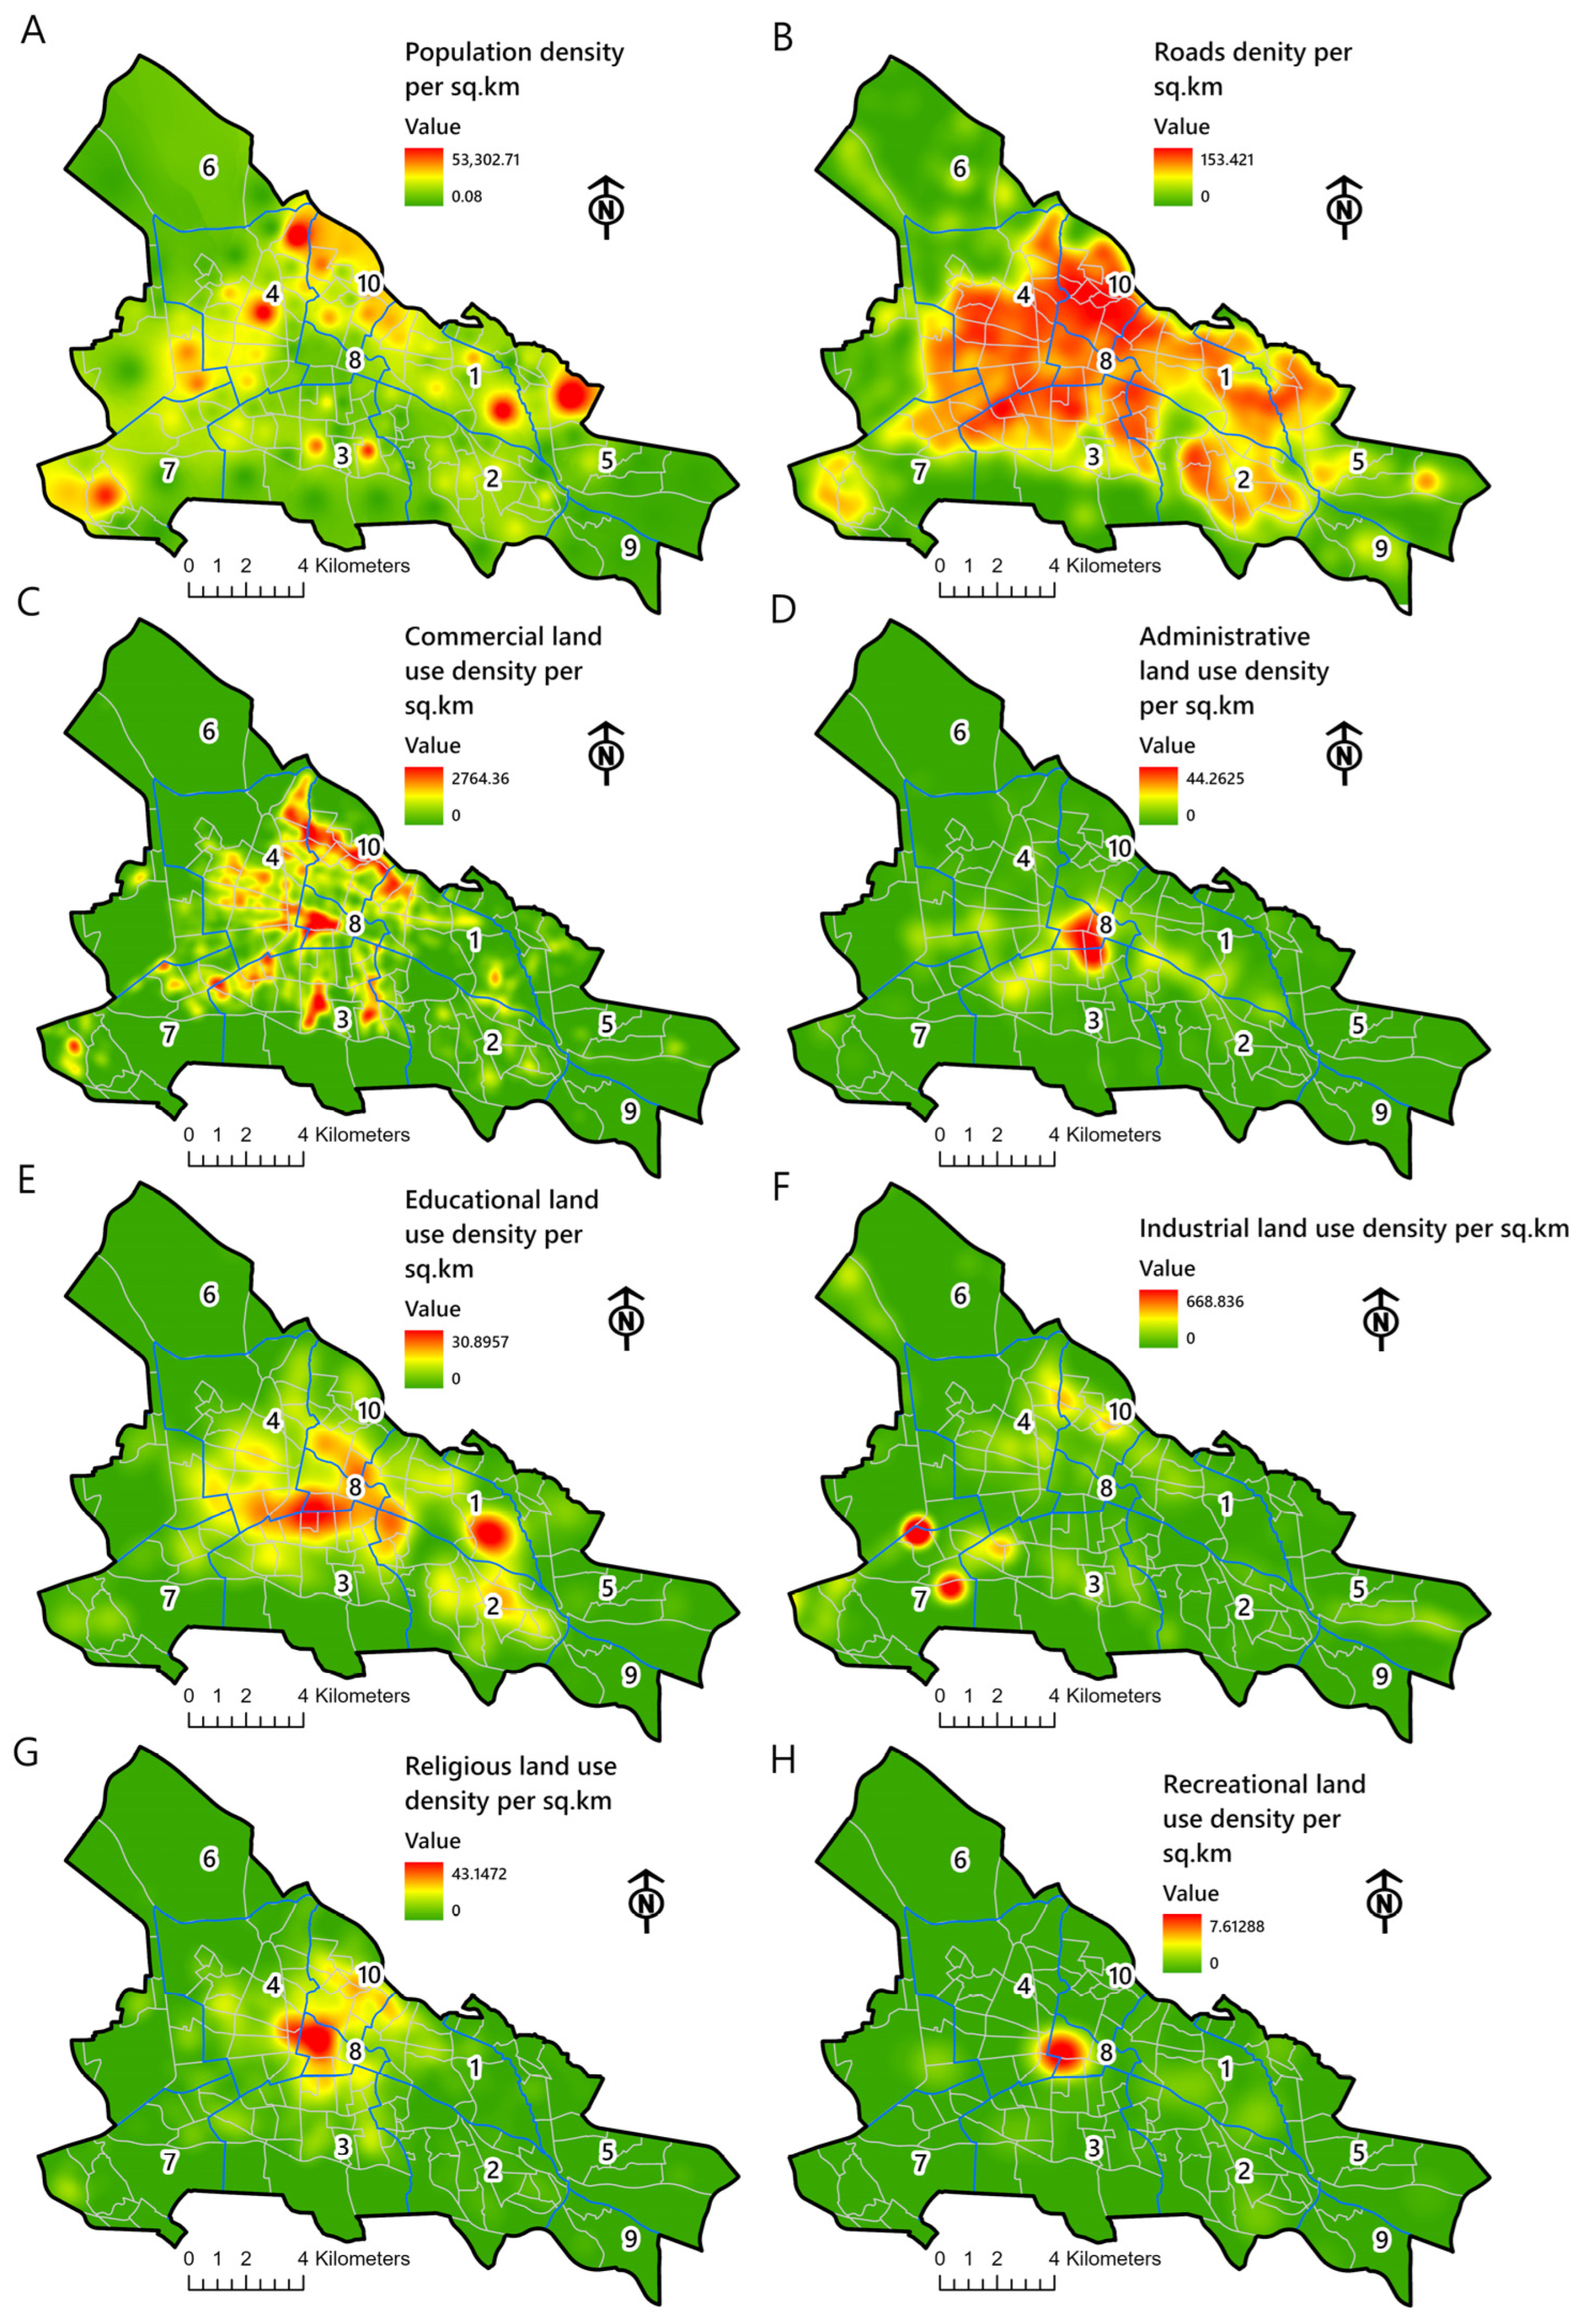
The KDE results revealed substantial spatial heterogeneity across all eight predictors, highlighting clear differences in how population, land use, and infrastructure are distributed across the municipality regions (Figure 2A–H). These density surfaces highlight the underlying urban structure of the study area. Population density (Figure 2A) showed a strong central concentration with clusters extending into the north-central neighborhoods representing the demographic core of the municipality. Road network density (Figure 2B) formed a continuous high-intensity corridor across regions 3, 4, 8, and 10, reflecting the main mobility spine and the city’s most accessible areas. Commercial land use density (Figure 2C) showed the most intense clustering, with pronounced hotspots in region 8 and extending into regions 3 and 10, corresponding to long-standing market and business districts.
Figure 2.
Spatial patterns of urban socio-environmental predictor variables derived from KDE. (A) population density per sq. km; (B) road density per sq. km; (C) commercial land-use density per sq. km; (D) administrative land-use density per sq. km; (E) educational land-use density per sq. km; (F) industrial land-use density per sq. km; (G) religious land-use density per sq. km; (H) recreational land-use density per sq. km.
Administrative land use (Figure 2D) was highly localized within region 8, the city’s civic center. Educational land use (Figure 2E) presented two dominant zones: one located in regions 8 and another across the eastern parts of regions 1 and 2, reflecting established institutional zones. Industrial land use (Figure 2F) exhibited a peripheral pattern, particularly concentrated in region 7, that is consistent with municipal zoning practices. Religious land use (Figure 2G) showed moderate clustering in regions 8 and 10, which include older, densely built neighborhoods with long-standing religious institutions. Recreational land uses (Figure 2H) were the least spatially concentrated, appearing only as scattered hotspots, indicating limited recreational infrastructure, which was mainly seen in region 8. Overall, the KDE surfaces showed uneven but clearly structured spatial distributions of urban predictors across the municipality. Rather than representing behavioral addiction outcomes, these patterns describe neighborhood-level environmental exposure in areas within which hookah-serving cafés operate. This framing emphasizes that the analysis captures spatial opportunity structures associated with café availability, providing the contextual foundation for interpreting localized relationships in subsequent sections.
3.2. Analytical Framework for Local Relationship Assessment
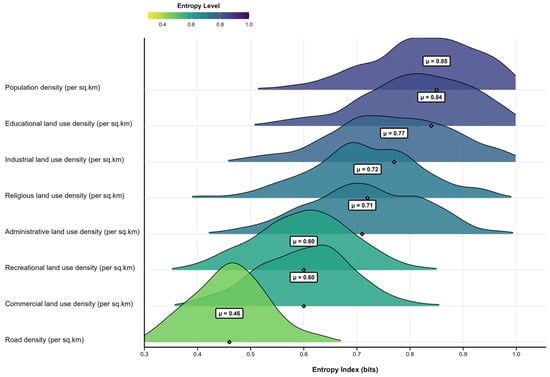
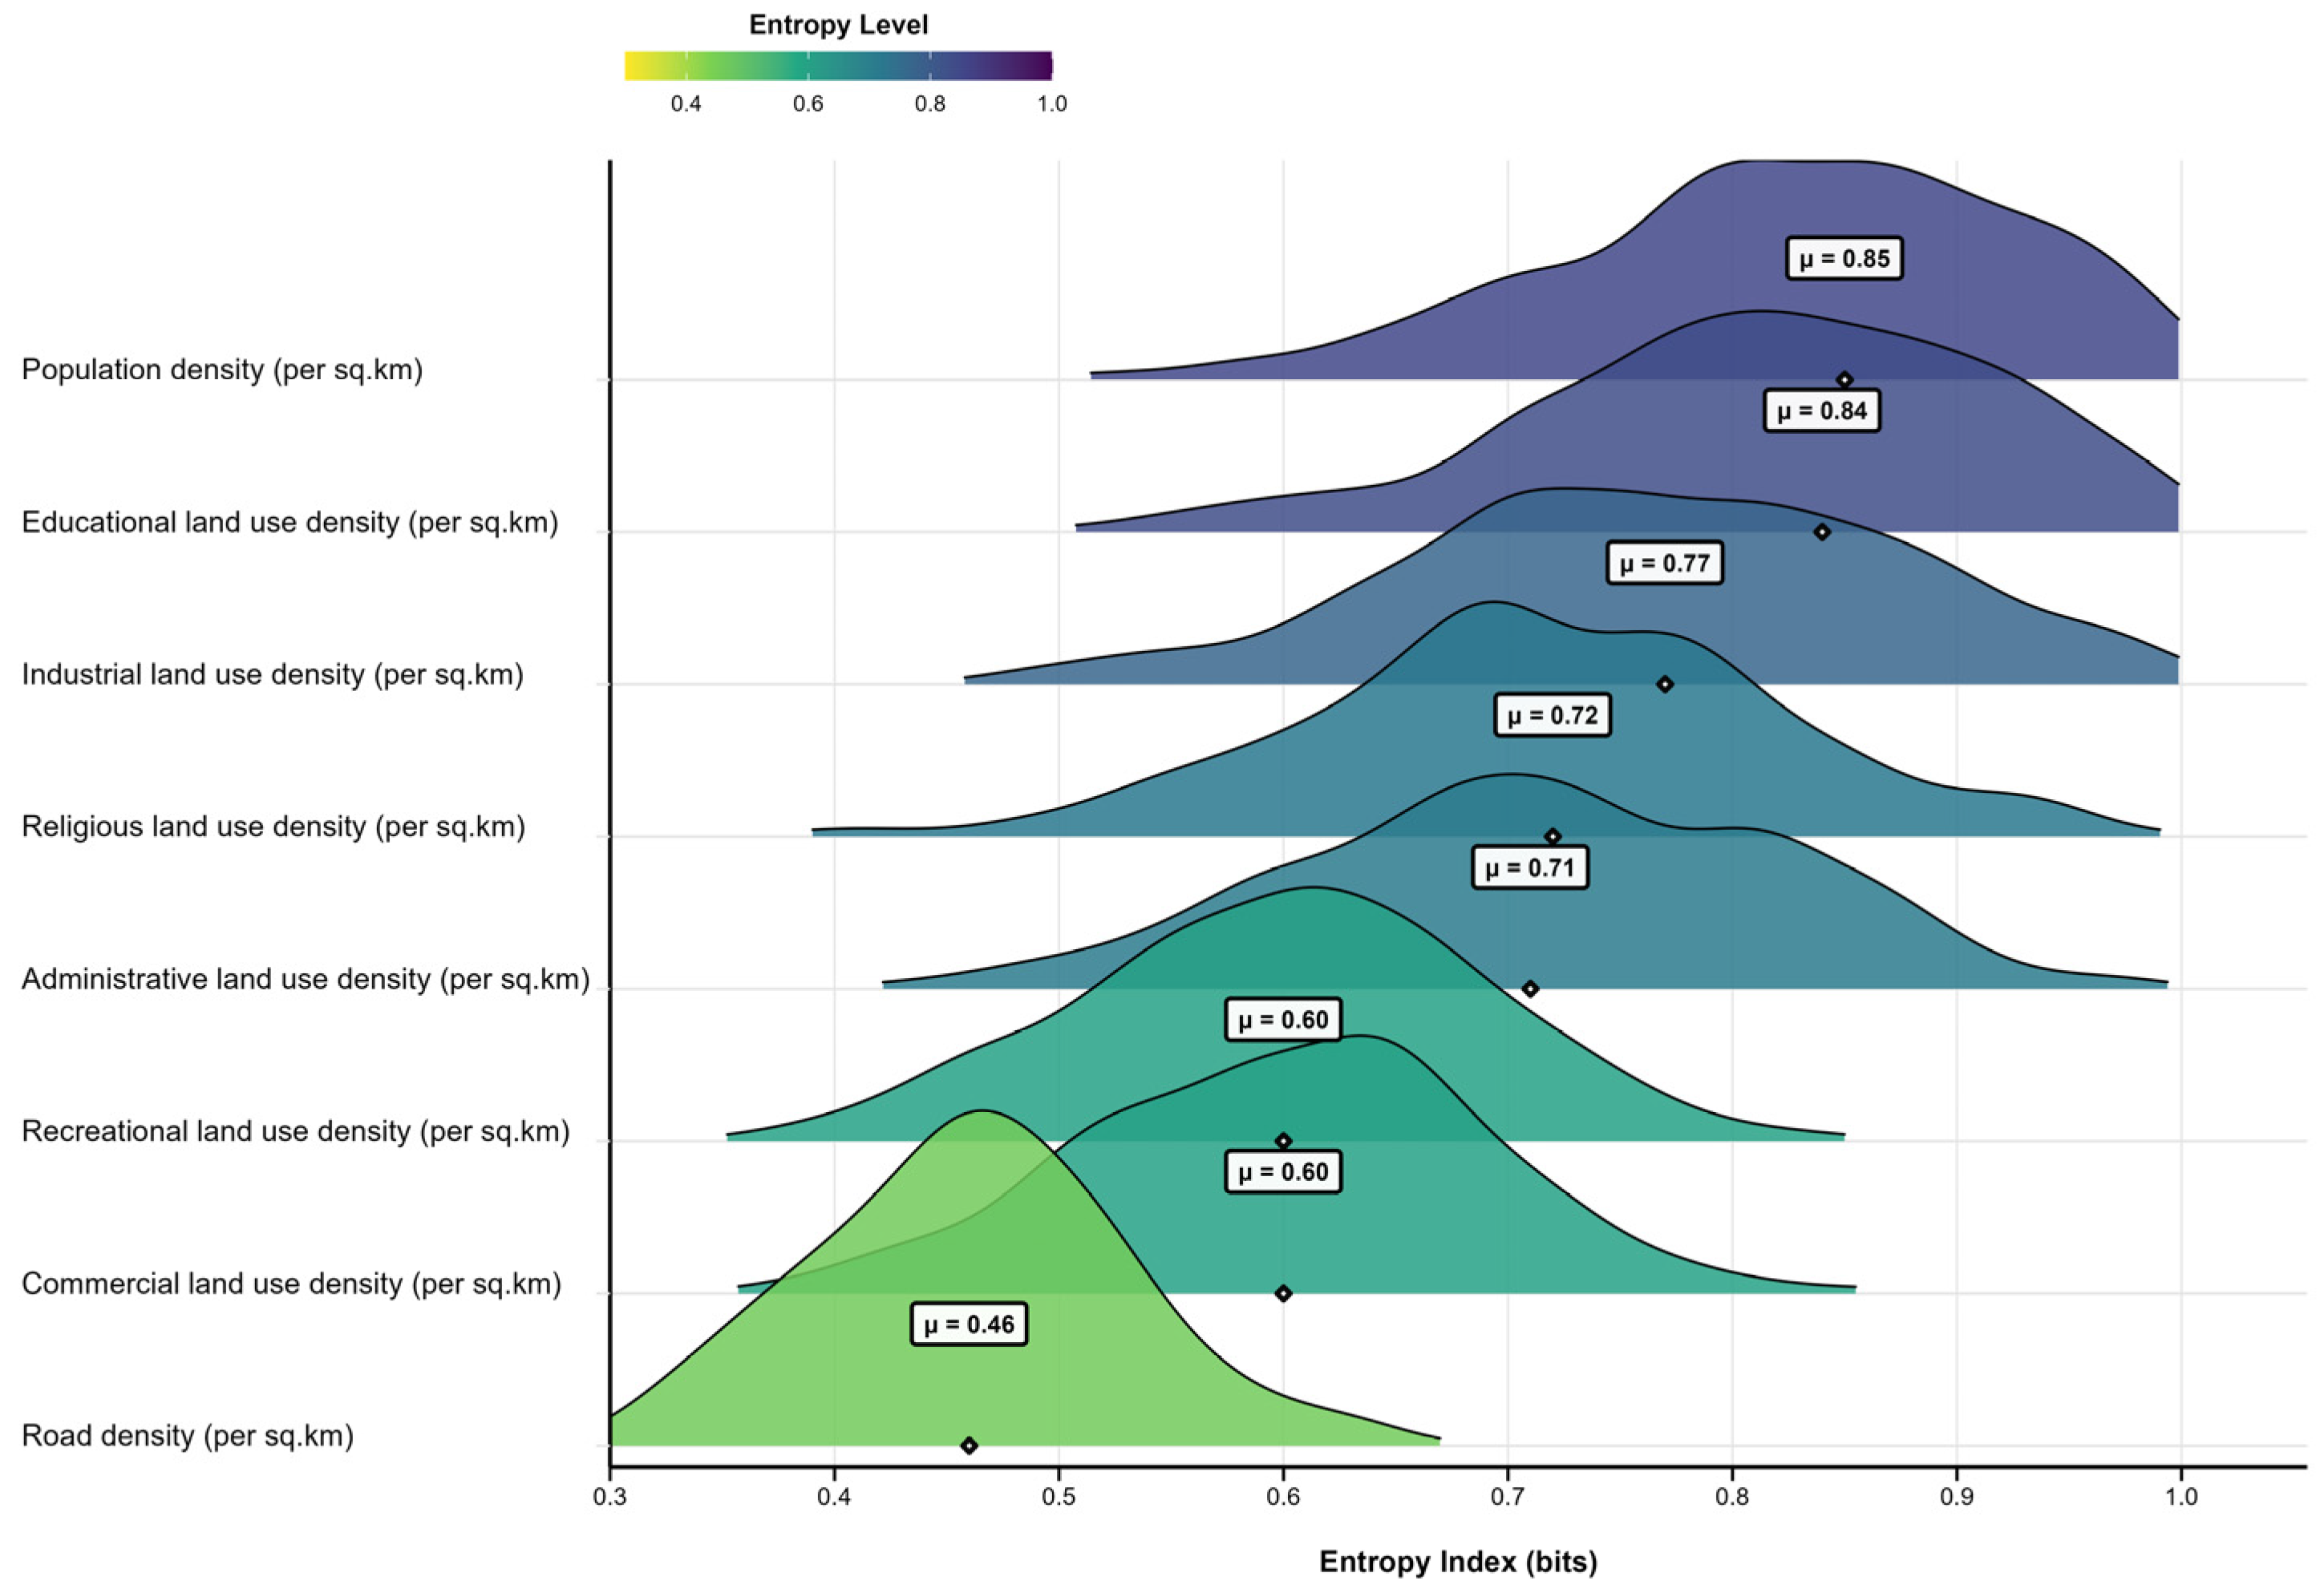
To ensure clarity in interpreting the subsequent results, it is important to briefly restate the analytical logic connecting the spatial modeling outputs. KDE was used to generate continuous density surfaces representing the spatial intensity of hookah cafés and each urban predictor. These surfaces served as inputs to the LBR analysis, which evaluates localized statistical associations within defined neighborhood contexts. Entropy metrics were then derived to quantify the spatial variability and complexity of these local relationships, forming the basis of the patterns visualized in Figure 3.
Figure 3.
Distribution of local bivariate relationship complexity between hookah-serving coffeehouses and urban socio-environmental predictors. Note: Higher entropy values indicate more complex, variable, and spatially unpredictable relationships. Analysis generated using R (spatial analysis packages) and visualized with kernel density curves.
Importantly, this study did not directly measure individual addiction prevalence. Instead, the spatial density of hookah-serving cafés should be interpreted as an environmental exposure proxy that reflects potential availability and neighborhood-level risk environments associated with hookah use. This distinction ensures that the analysis remained focused on spatial opportunity structures rather than behavioral outcomes, consistent with urban health geography frameworks.
3.3. Local Bivariate Relationship Diagnostics
Table 2 shows the diagnostic outputs from the LBR analysis, integrating entropy values, significance levels, and relationship types across all 252 spatial units. These results collectively illustrate how different socio-environmental factors shape the spatial organization of hookah-serving coffeehouses. The strongest and most spatially consistent associations were observed for educational and commercial land uses. Educational land use shows the highest significance (87.7% of units) and high mean entropy scores (0.84), while commercial land use showed similarly widespread significance (76.2%) with moderate spatial complexity (mean entropy = 0.60). These predictors therefore represent dominant components of the urban exposure environment, particularly in areas characterized by concentrated youth presence and intensive social activity.
Table 2.
Local Bivariate Relationship diagnostic entropy in relation to the False Discovery Rate.
Population density also emerged as a major driver, with 70.6% significant units and a high mean entropy score (0.85). The wide entropy range (0.06–1.64) reflects pronounced neighborhood-level heterogeneity: dense central regions 1, 4, and 10 show strong linear associations, whereas peripheral regions display more complex patterns. In contrast, recreational and administrative land uses showed the weakest associations, with lower significance levels (40.1% and 58.3%) and more dispersed relationship types. These predictors appear to exert indirect or diffuse influences rather than concentrated spatial pull. Industrial and religious land uses demonstrated moderate significance (63.1% and 65.1%) and relatively high entropy scores (0.77 and 0.72), reflecting context-dependent effects across specific neighborhood clusters. Overall, the diagnostic indicated that hookah café clustering reflects overlapping neighborhood exposure environments rather than direct measures of addiction behavior. The strongest associations occur where population density, commercial activity, educational hubs, and accessibility intersect, highlighting spatial contexts that may facilitate café availability and social visibility.
3.4. Entropy of Local Bivariate Relationships
The entropy analysis highlights substantial variation in the local complexity of relationships between hookah-serving coffeehouses and the eight urban predictors (Figure 3). The wide range of entropy values demonstrates that no predictor has a uniform influence across the city, consistent with the spatial heterogeneity typically observed in high-resolution urban and epidemiological models. Population density (μ = 0.85) and educational land use (μ = 0.84) exhibited the highest mean entropy, indicating highly variable and neighborhood-specific relationships. These variables strongly influence café density in several regions but show attenuation or non-linear shifts elsewhere, aligning with spatial epidemiology evidence that population clustering and youth-focused activity centers produce diverse local risk environments [37].
In urban behavioral terms, entropy can be interpreted as an indicator of how consistently a given urban feature shapes exposure opportunity across neighborhoods. Low entropy reflects stable, predictable relationships where a predictor exerts a similar influence citywide, whereas high entropy indicates context-dependent effects, suggesting that the same urban feature may facilitate exposure in some neighborhoods while exerting weaker or non-linear influence in others. This interpretation aligns with urban health geography perspectives that emphasize place-specific opportunity structures rather than uniform environmental effects.
Industrial (μ = 0.77) and religious land use (μ = 0.72) showed moderately high entropy, reflecting context-dependent effects that vary by municipal region—strong in older industrial or traditional neighborhoods but weaker in recently developed or low-activity areas. Administrative land use (μ = 0.71) showed intermediate complexity, with clear influence in the administrative core (Region 8) and inconsistent relationships at increasing distances. In contrast, commercial (μ = 0.60) and recreational land use (μ = 0.60) were characterized by lower entropy, indicating relatively stable and predictable relationships across the city. Their consistency reflects structural regularities in commercial geography and pedestrian activity. Road density (μ = 0.46) had the lowest entropy, representing the most uniform relationship, consistent with the well-established stability of transport networks as predictors of human activity patterns. Taken together, the entropy patterns demonstrate substantial neighborhood-level heterogeneity in spatial associations, reinforcing that café clustering varies with local environmental structure.
3.5. Statistical Significance of Local Relationships
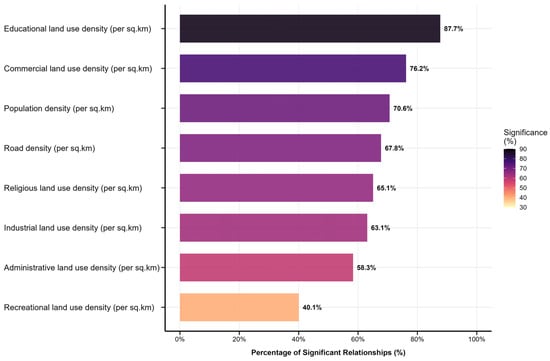
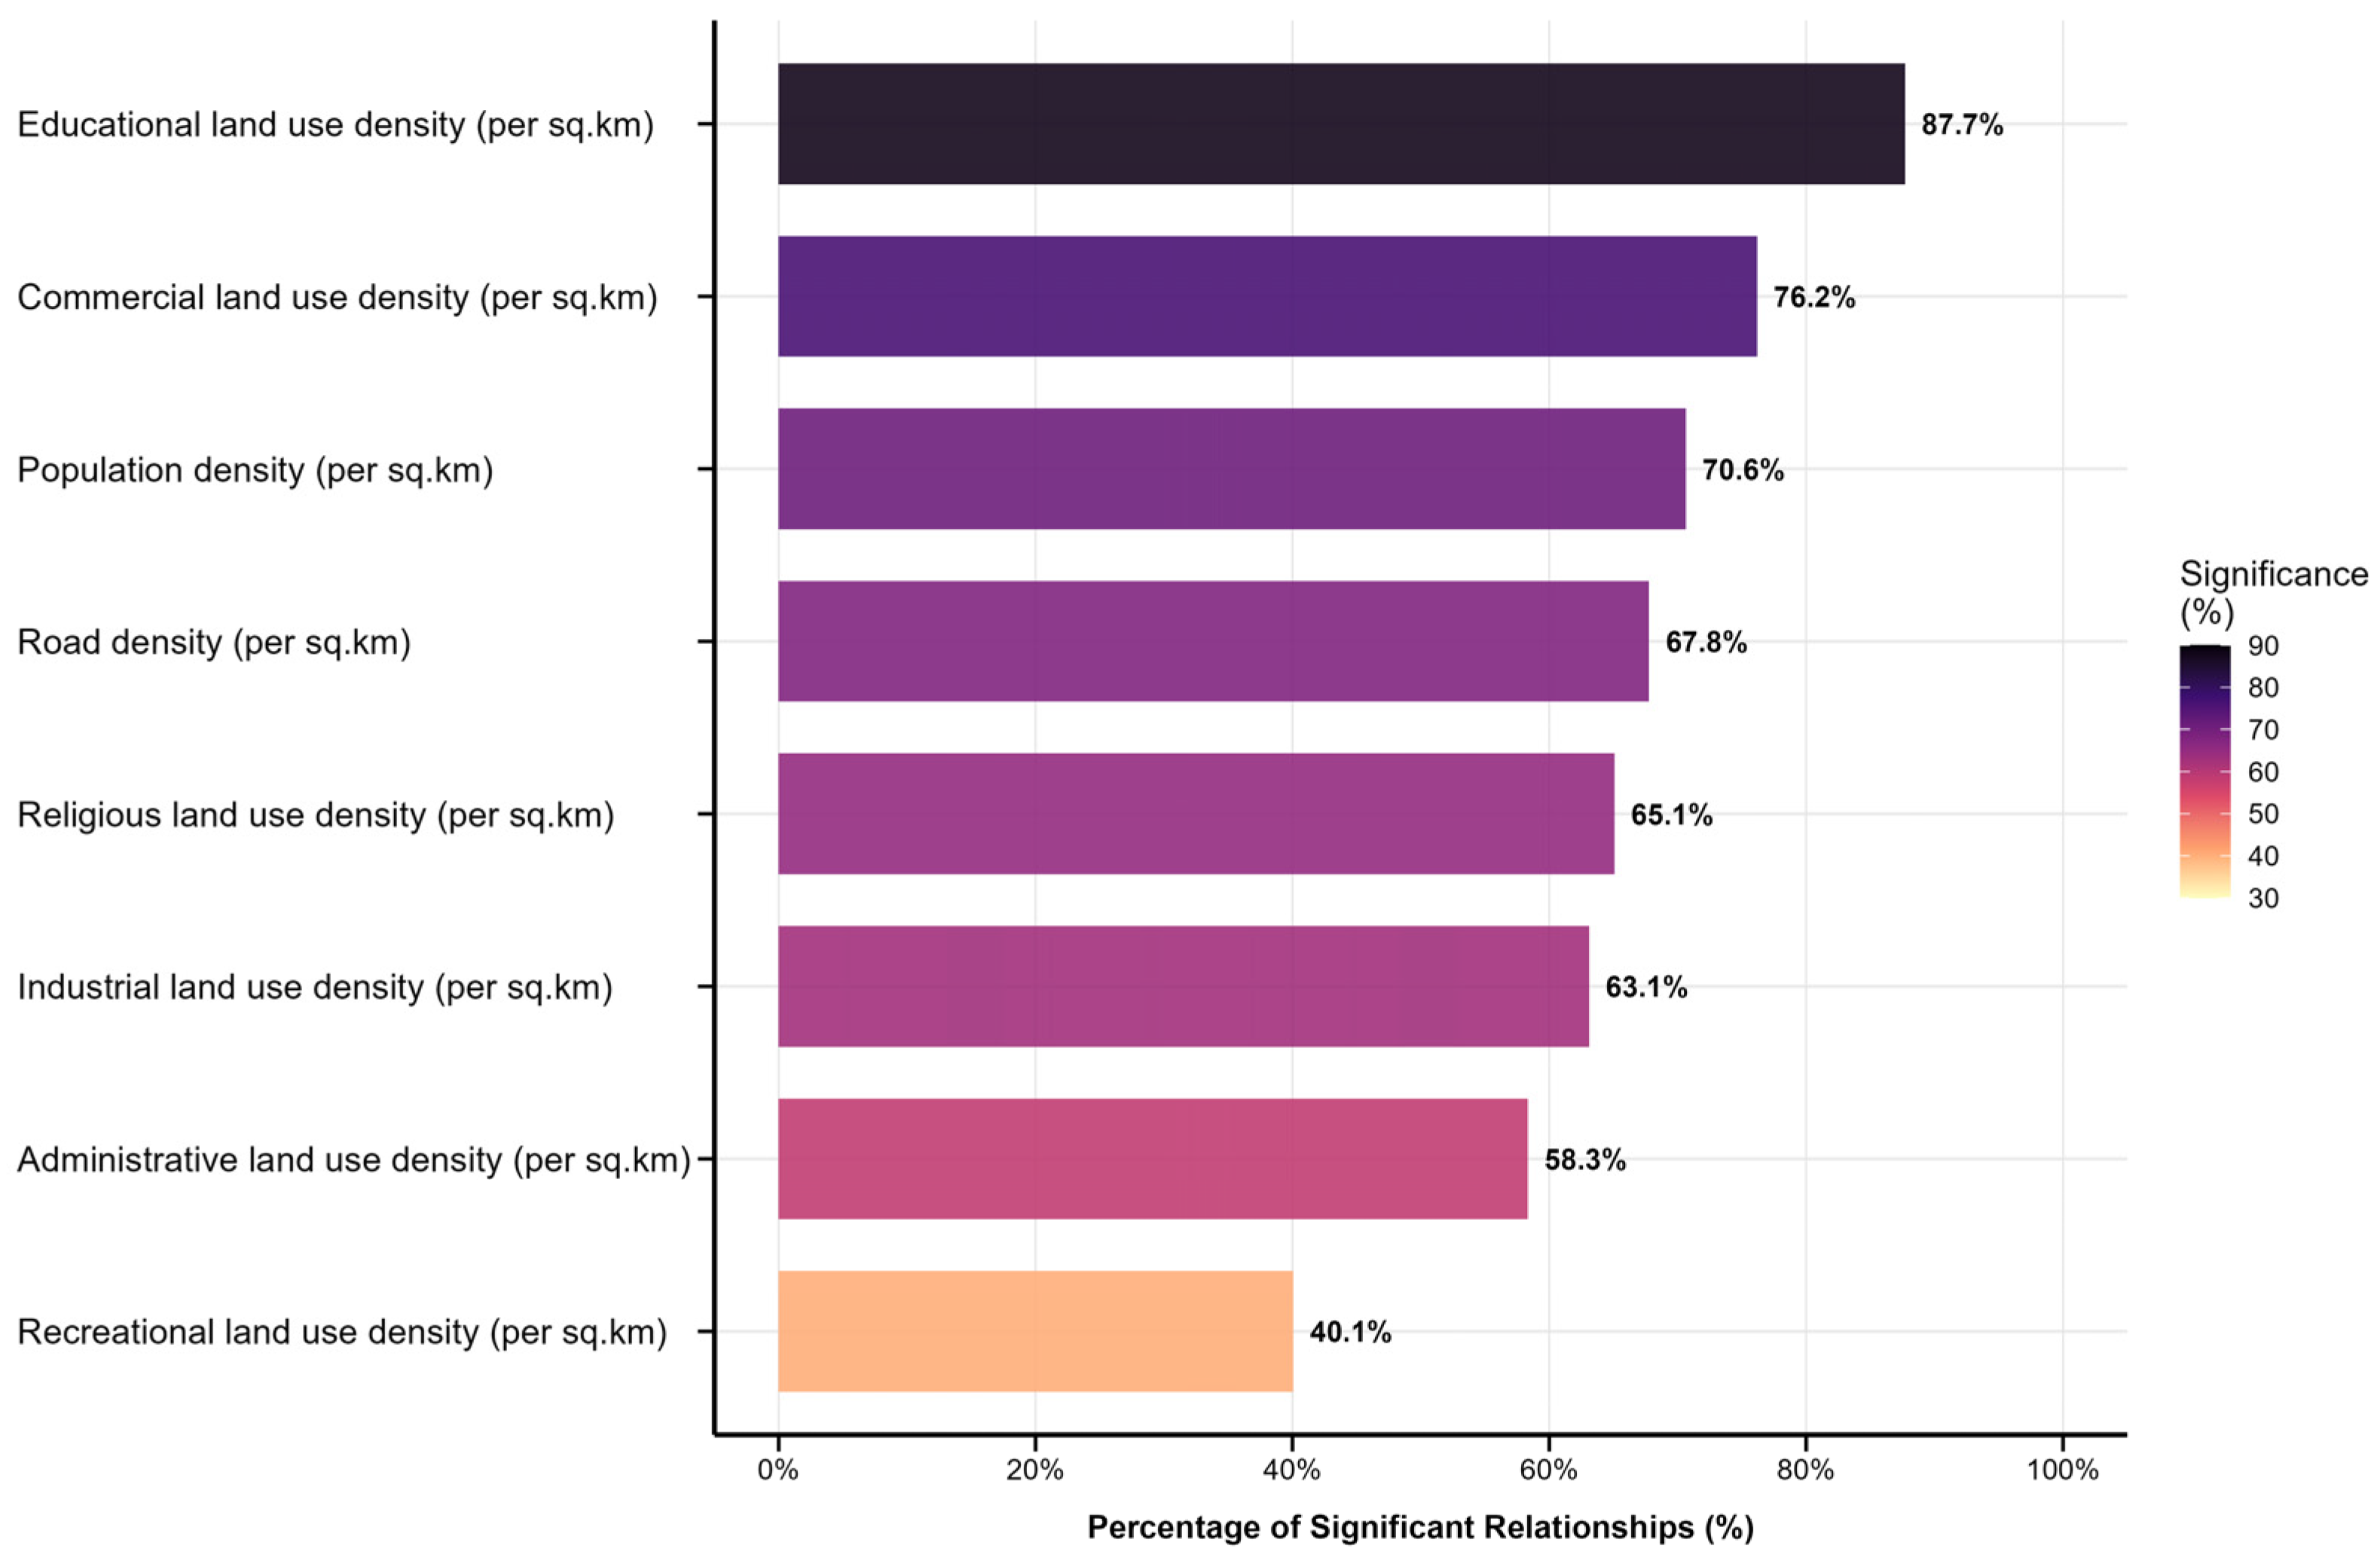
The proportion of spatial units, showing statistically significant local relationships (α = 0.05), varied across the eight predictors (Figure 4), indicating the uneven influence of urban socio-environmental factors on the distribution of hookah-serving coffeehouses. Educational land use density emerged as the strongest and most spatially consistent correlate, with 87.7% of units showing significant relationships. This suggests that neighborhoods with dense educational activity represent particularly favorable environments for coffeehouse emergence, which is consistent with evidence that youth-oriented spaces act as behavioral risk attractors.
Figure 4.
Percentage of significant Local Bivariate Relationships (α = 0.05) between hookah-serving coffeehouses and urban socio-environmental variables. Note. Analysis generated using R (spatial analysis packages) and visualized with kernel density curves.
Commercial land use density demonstrated the second-highest proportion of significant (76.2%), indicating that commercial corridors and mixed-use business districts in shaping café clustering. Population density (70.6%) and road density (67.8%) also showed strong significance, underscoring the importance of crowding and accessibility as structural drivers of hookah cafe presence.
Moderate significance was observed for religious (65.1%) and industrial land use (63.1%), suggesting context-dependent effects that vary across neighborhoods. In contrast, administrative (58.3%) and, particularly, recreational land use (40.1%) exhibited the weakest significance signals, implying more indirect influences. Overall, five predictors, educational land use, commercial activity, population density, road density, and religious land use, exhibit the most robust and spatially consistent associations with hookah-serving coffeehouses. Collectively, these results indicate that hookah café clustering is spatially associated with neighborhoods characterized by high social activity, commercial intensity, population concentration, and accessibility.
3.6. Local Bivariate Relationship (LBR) Classification
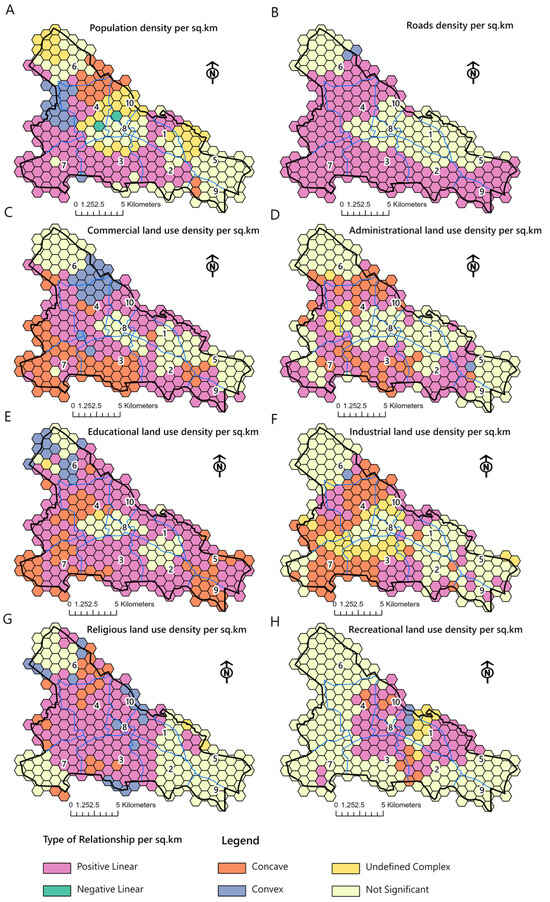
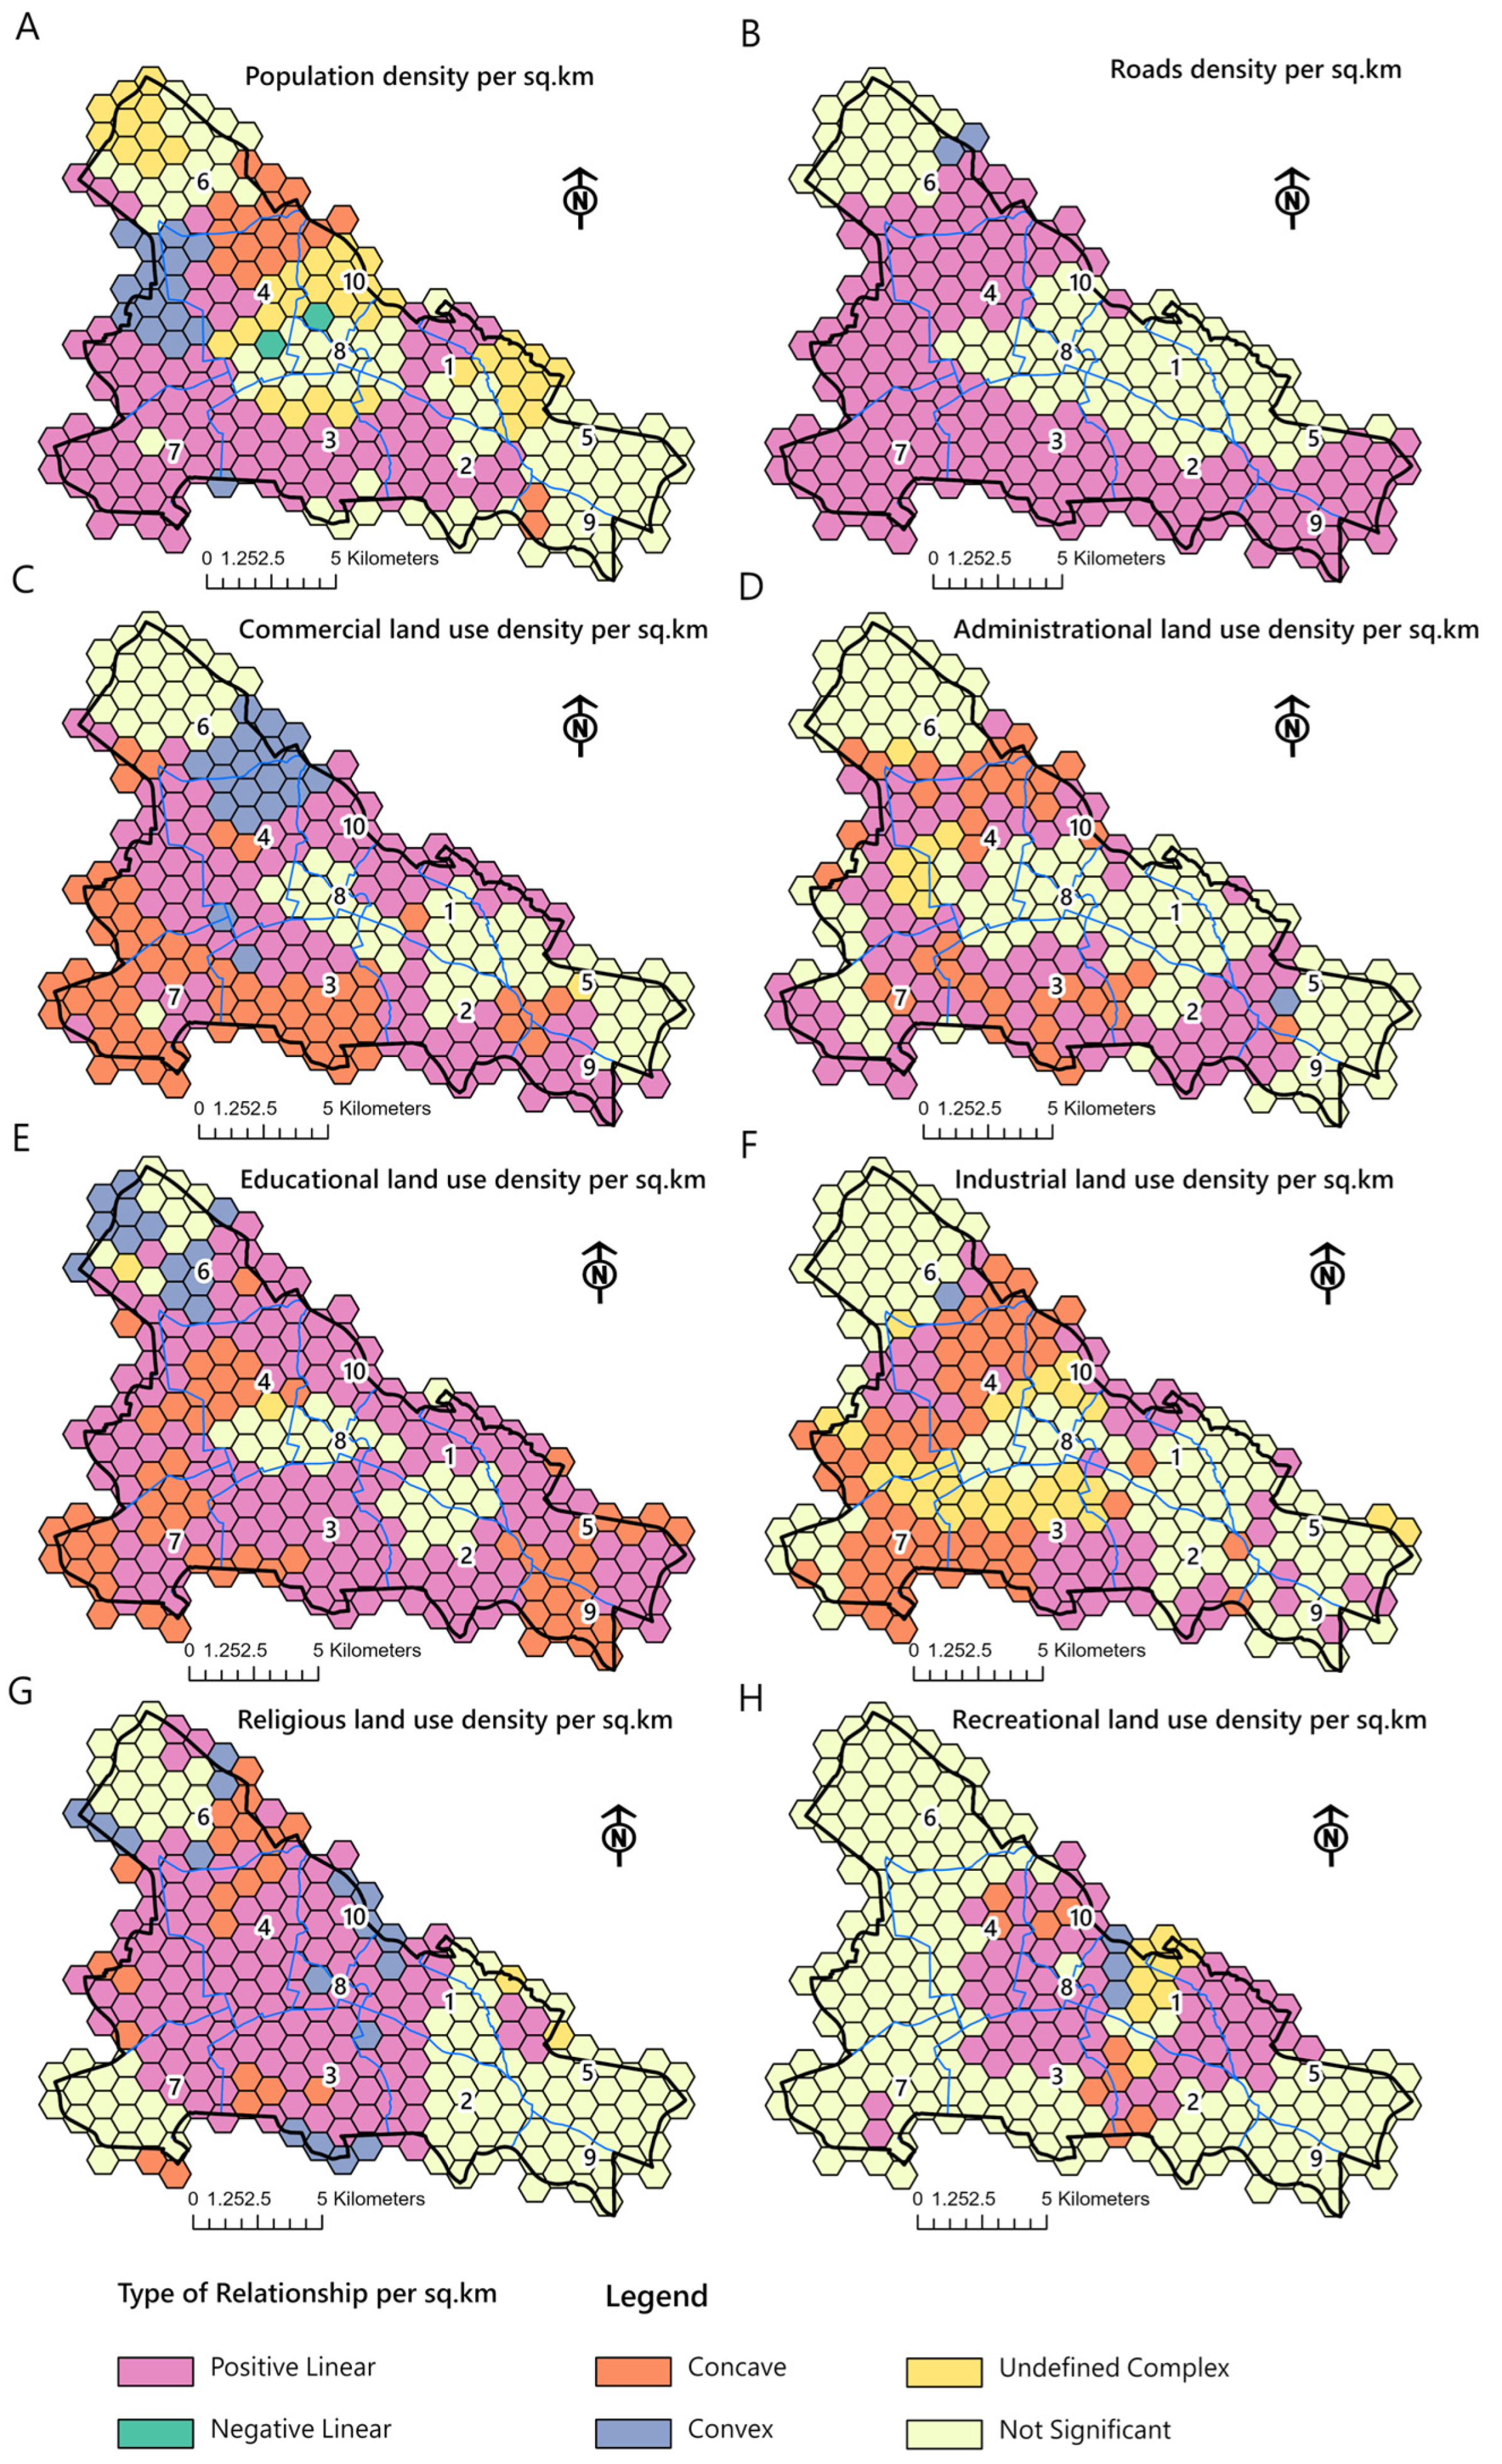
Figure 5 illustrates the spatial configuration of LBR types across the 252 hexagonal units, revealing substantial geographic variation in how each urban predictor relates to the distribution of coffee houses. Across all variables, positive linear relationships dominated, aligning with the central and high-activity parts of the city.
Figure 5.
Spatial patterns of Local Bivariate Relationship types between hookah cafes and urban predictors expressed by using hexagonal spatial units. (A) population density per sq. km; (B) road density per sq. km; (C) commercial land-use density per sq. km; (D) administrative land-use density per sq. km; (E) educational land-use density per sq. km; (F) industrial land-use density per sq. km; (G) religious land-use density per sq. km; (H) recreational land-use density per sq. km.
Population density (Figure 5A) shows strong positive associations across central, north-central, and western units, corresponding to the municipality’s demographic core. Road density (Figure 5B) forms a continuous west-to-central band of positive relationships, indicating stable associations with highly connected transport corridors. Commercial land use (Figure 5C) demonstrates the widest spatial extent of positive linear relationships, spanning the central commercial district and extending into south-central and northwestern units. Administrative land use (Figure 5D) shows fewer positive associations, concentrated mainly around the central administrative core. Educational land use (Figure 5E) exhibits a broad pattern of positive relationships across central, northeastern, and eastern sectors. Industrial land use (Figure 5F) shows positive linear associations primarily in central and south-central units, while religious land use (Figure 5G) shows positive patterns in historic central and adjacent north-central areas. Recreational land use (Figure 5H) has the smallest spatial footprint of positive relationships, concentrated mainly in central and east-central units.
Non-linear patterns, including concave and convex relationships, appear in several localized pockets. Concave relationships are most common in industrial zones (Figure 5F), especially in southern and southeastern sectors, while mixed concave and convex relationships are observed for commercial (Figure 5C) and administrative (Figure 5D) predictors in transitional neighborhoods. Negative linear relationships are limited but present, occurring mainly at the urban periphery, particularly in northwest, southwest, and eastern fringe units. These low-density, newly developing areas display inverse or weak associations between predictors and café presence. Large sections of the southern, far-western, and far-eastern fringe display undefined complex or non-significant relationships (Figure 5A–H). These units typically represent low-activity zones with limited built environment intensity, weaker accessibility, or recent development, conditions under which predictor variables exert minimal or unstable influence. Overall, the LBR classification demonstrates that café clustering emerges through localized interactions between urban structure and accessibility, forming heterogeneous neighborhood exposure environments. This spatial variability reflects differences in opportunity structure and accessibility, forming heterogeneous neighborhood exposure environments. It also reflects differences in opportunity structures for hookah availability, consistent with an environmental risk framework rather than direct behavioral measurement.
4. Discussion
A clear spatial picture of the important variables influencing the supply of hookah in Tabriz is provided by the combination of KDE and LBR methodology. Our findings confirm that these locations are not randomly distributed but rather shaped by overlapping land use patterns, accessibility, and social dynamics. Importantly, the use of local rather than global spatial diagnostics reveals substantial intra-urban heterogeneity that would be masked by city-wide averages, a key principle emphasized in contemporary spatial epidemiology.
Educational land use emerged as the most spatially consistent correlate of hookah café clustering, showing that student-oriented institutional zones function as localized exposure environments rather than uniformly elevated risk areas across the city. LBR maps (Figure 5E) show that hookah cafes cluster around major educational centers. This pattern indicates that educational environments are spatially associated with clustering of youth-oriented leisure economies, corresponding to localized risk environments rather than uniformly elevated risk across the city. This result directly supports previous findings that proximity to colleges and universities increases both availability and consumption of hookah among youth [2,25]. In Tabriz, educational hubs in the central and eastern sectors formed major attractor zones, reflecting a spatial alignment between student populations and third-place environments that cater to youth socialization. This matches earlier Iranian evidence that hookah use among youth in Tabriz is notably high [17] and that perceptions of “reduced harm” relative to cigarettes continue to influence decisions to smoke hookah [13,18]. Together, these findings suggest that educational corridors represent priority zones for place-based public health interventions.
Commercial land use emerged as another powerful predictor of hookah café clustering (Figure 1 and Figure 2C). This aligns with international findings showing commercial districts, characterized by high pedestrian flows and retail activity, with mixed-use development, normalize tobacco use and facilitate easy access to hookah venues [22,23]. In Tabriz, the KDE surfaces identified dense commercial hotspots that correspond almost exactly to the most intense clusters of hookah cafés. The spatial consistency of this relationship indicates that commercial intensity operates as a structurally stable driver of toxic third places rather than a context-dependent or transient influence. These findings suggest that hookah cafés capitalize on economic vibrancy and pedestrian flows typical of commercial corridors, reinforcing the role of market-driven urban form in shaping exposure environments.
The dense road network in these areas (Figure 2B) ensures easy access not only for pedestrians but also for customers arriving by vehicle, increasing their regional attractiveness. This combination creates an environment with a high accessibility advantage for hookah lounge use. The lower entropy for these predictor variables suggests that their effects are more uniformly positive and predictable than the educational variable. The influence of mobility infrastructures also emerged strongly through the road density variable. Road network density showed one of the most stable and spatially uniform relationships with hookah café distribution, emphasizing the role of accessibility. This supports research highlighting that tobacco use and retail availability increase in contexts where access to products is easy, rapid, and convenient [28]. The central mobility spine of Tabriz, characterized by high road connectivity, appears to facilitate not only customer access but also the operational logistics that sustain hookah businesses.
Population density remains a major driver, with a high mean entropy score (0.85) and 70.6% significant relationships. However, the wide entropy range (0.06–1.64) shows that the strength and form of this relationship vary widely across neighborhoods. While densely populated areas provide a potential customer base, density alone does not guarantee the expansion of hookah cafes. Its effect is likely moderated by population type (e.g., age structure, socio-economic status) and the character of the density. Central neighborhoods with mixed-use life show a strong positive relationship, while densely populated peripheral areas may not. This highlights the limitations of using macro-demographic variables without considering local urban function and morphology. In line with studies indicating that high population density can increase demand for informal social spaces such as coffeehouses [24], our results show that population density demonstrates one of the most substantial and complex associations with hookah cafés.
Recreational and administrative land uses show the weakest associations, with lower significance rates (40.1% and 58.3%, respectively) and more dispersed relationship types. These variables appear less central to the spatial organization of hookah cafes and may play more indirect roles tied to broader urban design characteristics rather than direct spatial pull. The findings challenge previous studies that placed hookah lounges under the general concept of “leisure activities.” [22,23]. Hookah lounges in Tabriz city seem to function not as complements to formal public recreational spaces but as substitutes or competitors for them. These toxic third places themselves appear as the main destinations for privatized and consumer-oriented leisure and are preferably located in commercial corridors and close to educational centers rather than in the vicinity of parks. This could indicate a lack of attractiveness of formal and free public leisure spaces for the young, or it could indicate that the leisure culture in this context has shifted more towards indoor and commercialized spaces. Therefore, while rejecting a direct and positive relationship, our finding suggests that the weakness of public recreational use may indirectly provide space for the expansion of toxic leisure places by creating a vacuum.
The findings of this study show that religious land use has a moderate and highly contextual relationship with hookah bar density (65.1% of significant spatial units; entropy: 0.72). This pattern is mainly concentrated in the historic and old core of the city. This finding is partly in line with previous studies that consider the presence of religious uses as a deterrent, as these uses are usually associated with stronger social norms and more conservative values that can conflict with leisure activities such as hookah consumption. However, our local analysis shows that this deterrent effect is not uniform and consistent across the city. In historic areas, probably due to the dense and old context, there is a possibility of mixing uses and the conversion of some traditional residential or commercial units into hookah bars, while the young population living in these neighborhoods may also be influenced by modern leisure attractions. Therefore, while the present study confirms the indirect and context-specific effect of religious use, it shows that the strength of this variable is strongly influenced by the morphology of the neighborhood, the mix of surrounding uses, and the social characteristics of its residents.
Industrial land use showed a moderate, nonlinear relationship with hookah cafes (63.1% significant relationship; entropy: 0.77), particularly in southern and southeastern zones where industrial areas interface with residential or light commercial use. This finding is consistent with studies linking industrial or socio-economically disadvantaged neighborhoods to easier access to harmful goods [22,23]. Industrial areas may offer lower rents, weaker enforcement of regulations, and a concentrated young workforce, creating favorable conditions for such venues. However, the nonlinear nature of the relationship suggests that purely industrial cores lacking nightlife or resident populations are less conducive to hookah cafes, while transitional edge zones are more attractive. This suggests that industrial use functions as a contextual amplifier rather than a direct driver, with its influence intensified in mixed-use and transitional urban environments.
4.1. Limitations and Future Research
Despite the contribution of this research to high-resolution spatial analysis, some factors in methodology and data could be important considerations. These should be interpreted as boundaries inherent to cross-sectional spatial modeling rather than weaknesses of the analytical framework itself. This study is cross-sectional in nature, with data represented by a true but static geospatial map of cafés that serve hookahs, with no capability for determining causation or understanding dynamic processes like seasonal fluctuations of utilization, business turnover, or the adjustment of operational hours that could affect the role of such establishments as “third places.” Accordingly, the findings should be understood as describing spatial exposure structure at a defined time point, not behavioral trajectories or causal mechanisms.
A more significant issue is related to the limited availability of finer-grained socio-economic information. Though strong spatial predictors of land use/infrastructure, for example, were accounted for, block- or hexagonal-level indicators of income, household type, or detailed information on educational attainment were not. Lack of access to such information hinders the ability to separate influences that could be ascribed to the built environment versus more pervasive socio-economic risk or composition, both of which play important model covariates in health behaviors. This limitation reflects data availability constraints that are common in urban spatial research and does not affect the internal validity of the spatial associations identified.
Furthermore, the predictor variables themselves originate from the official land use designations of municipalities. Such official designations do not necessarily capture the effective reality of land use patterns that are often observed in practice through various informal amalgamations of classifications. This is such that a given “commercial” area, for example, could support a large amount of residential traffic, effectively changing its social dynamic. While this introduces classification simplification, the standardized municipal framework ensures analytical consistency across spatial units.
It is inherent in the analysis that the relevant factors that contribute to its dynamics are spatial in their physical manifestation; factors such as social norms, the enforcement of smoking regulations, hookah acceptability, or marketing would fall outside the relevant considerations of the “toxicity” of such venues. These non-spatial influences represent complementary behavioral and policy domains rather than omissions of the spatial framework applied here. These limitations, therefore, provide distinct and fertile areas for potential research. At the forefront of these areas is the need for the incorporation of detailed socio-economic data into the established geographic framework. Correlation with block data from the census or with data from health surveys could enable a more complex analysis that could distinguish between the pull of accessibility as distinct from the push of social disadvantage.
Future research should employ longitudinal and dynamic approaches. Longitudinal observation of hookah café openings, closures, and relocations in response to urban development processes, such as transit expansion, university growth, or zoning interventions, would provide a stronger empirical basis for identifying causal mechanisms underlying the evolution of “toxic third places”. Such approaches would extend—rather than replace—the present spatial framework by introducing temporal depth.
Furthermore, it is crucial to expand the methodology of this study. The geographic patterns identified here should be validated through a mixed-methods approach. This would involve using ethnographies, surveys of patrons, and interviews with entrepreneurs and public health officials to gain deeper insights into the desires, customs, and economic systems influencing hookah use in these areas. Conversely, agent-based models could be created to simulate how people navigate urban spaces to access these venues, considering both geographic factors identified in this study and personal preferences.
Additionally, the combination of KDE with LBR proves to be useful for health geography research in urban environments. Applying this framework to other risk environments, such as locations selling alcohol, fast food, or materials used for vaping, could help determine its applicability in different cities like Tabriz. Such research might clarify whether the principles governing risk environment expansion are universal or depend on specific contexts, thereby enriching the theoretical understanding of how urban form influences health behaviors. These future directions emphasize methodological scalability while reinforcing the present study’s contribution as a foundational spatial assessment.
4.2. Policy Implications
The spatially explicit results of this study require a transition from uniform, city-wide tobacco control policies to geographically targeted, place-sensitive interventions. The strong and localized link between the number of hookah cafes and how land is used for education shows that university districts and student corridors are very important areas to focus on. In these areas, public health and municipal authorities should collaborate to implement focused awareness campaigns that directly counter the misconception of hookah as a “less harmful” alternative, utilizing peer educators and digital platforms relevant to youth. Concurrently, urban planning and licensing departments can leverage spatial analytics to enforce stricter zoning regulations, establishing buffer zones that restrict the opening of new hookah cafés within a specified radius of educational campuses and tightening the enforcement of age verification protocols in existing establishments. However, the feasibility of such zoning and licensing interventions depends on the local regulatory authority, institutional coordination, and enforcement capacity. Municipal governments must balance public health priorities with commercial interests and legal frameworks governing business operations. Pilot implementation in high-risk districts may offer a pragmatic pathway to evaluate operational costs, stakeholder acceptance, and enforcement logistics before broader rollout.
Furthermore, the significant role of commercial land use and road network accessibility suggests that interventions must also engage with the economic and infrastructural logic of these businesses. Policy should aim to reshape the commercial landscape by incentivizing the conversion of venues away from hookah service and supporting alternative, healthier forms of social leisure in high-density commercial hubs. This could include municipal support for cafes, cultural spaces, or recreational facilities that do not offer tobacco products. Simultaneously, transportation and urban design policies can be harnessed to subtly alter the accessibility dynamics that favor these venues, ensuring that urban vibrancy is supported by infrastructure that promotes active mobility and access to green, smoke-free public spaces, thereby offering competitive, attractive alternatives to commercialized “toxic third places.”
Importantly, these economic and infrastructure-oriented strategies require careful cost–benefit assessment, interdepartmental planning, and phased investment. Financial incentives, redevelopment schemes, or urban design modifications must be evaluated in relation to municipal budget constraints and long-term sustainability goals. Legal feasibility, business compliance, and community acceptance are critical determinants of success, underscoring the need for adaptive policy frameworks rather than uniform mandates.
This geospatial analysis clearly shows that the pattern of hookah cafés in our study city (Tabriz) is the result of deliberate, non-random interactions with the urban environment. With the utilization of high-resolution local approaches, it can go beyond global averages to expose intra-urban variability. It reveals that the pattern is associated with two major factors: educational land use density as well as commercial land use density. An important factor that provides support is the density of the road network, as it aids accessibility. In addition to these key predictors, complex relationships emerge that depend on context. Population density is characterized by strong, geographically variant influences that are moderated by local context. Religious, industrial, and administrative land use is related to the dependent variable with moderate, nonlinear strength that varies with local context and land mosaics. It is also interesting to note that the non-significant direct relationship with formal recreational land use indicates that these commercial cafes often act as substitutes for leisure activities rather than complements to public space. Taken together, the research provides a spatial framework that demonstrates the importance of the intersection of youth concentration, commercial dynamism, and accessibility for the emergence of ‘toxic third places’ in a developing city.
5. Conclusions
The major significance of educational land use density clearly places it as a significant social and economic hub for youth recreational activities, while the other major significance of commercial land use density points it out as a hub for economic activities and pedestrian streams. While these findings provide important insights into the spatial structuring of hookah café environments within Tabriz, they should be interpreted as context-specific rather than universally generalizable. The observed relationships reflect the socio-spatial configuration, regulatory environment, and urban morphology of the study area. Consequently, direct transferability to other cities cannot be assumed without consideration of comparable demographic patterns, land use structures, and governance contexts. This contextual framing strengthens the interpretation of the results as a model for spatial assessment rather than a universal behavioral template.
Author Contributions
Conceptualization: Alireza Mohammadi; Methodology: Alireza Mohammadi; Software: Alireza Mohammadi; Validation: Alireza Mohammadi and Arshad Ahmed; Formal Analysis: Arshad Ahmed; Investigation: Alireza Mohammadi and Arshad Ahmed; Resources: Elahe Pishgar; Data Curation: Alireza Mohammadi and Elahe Pishgar; Writing—Original Draft: Arshad Ahmed, Elahe Pishgar, and Munazza Fatima; Writing—Review and Editing: Alireza Mohammadi, Arshad Ahmed, and Robert Bergquist; Visualization: Alireza Mohammadi; Supervision: Alireza Mohammadi; Project Administration: Alireza Mohammadi; Funding Acquisition. All authors have read and agreed to the published version of the manuscript.
Funding
This research was funded by the University of Mohaghegh Ardabili, grant number 21634.
Data Availability Statement
The datasets generated and analyzed during this study are available from the corresponding author upon reasonable request. The foundational geospatial data—including urban land use and road networks—were sourced from the official geodatabase of the Tabriz municipality. Point location data for hookah-serving coffeehouses were collected via intensive field surveys and cross-verified against official municipal records.
Acknowledgments
We would like to thank the municipalities of Tabriz for allowing us to access the basic urban geodatabase used in this analysis. We would also like to appreciate R.B. for professional English language editing and proofreading.
Conflicts of Interest
Author Robert Bergquist was employed by the Geospatial Health. The remaining author declare that the research was conducted in the absence of any commercial or financial relationships that could be construed as a potential conflict of interest.
Abbreviations
The following abbreviations are used in this manuscript:
| KDE | Kernel Density Estimation |
| LBR | Local Bivariate Relationships |
| GIS | Geographic Information System |
| AICc | Corrected Akaike’s Information Criterion |
| FDR | False Discovery Rate |
References
- Alkouri, O.; Khader, Y.; Al-Bashaireh, A.M. Prevalence of Cigarettes and Waterpipe Smoking among Jordanians, Refugees, and Migrants in Jordan and Its Associated Factors: A Secondary Data Analysis. Int. J. Environ. Res. Public Health 2023, 20, 82. [Google Scholar] [CrossRef] [Scilit]
- Kates, F.R.; Salloum, R.G.; Thrasher, J.F.; Islam, F.; Fleischer, N.L.; Maziak, W. Geographic Proximity of Waterpipe Smoking Establishments to Colleges in the US. Am. J. Prev. Med. 2016, 50, e9–e14. [Google Scholar] [CrossRef] [Scilit] [PubMed]
- Aktas Sukuroglu, A.; Ozmen, S.I. Risk Assessment of Exposure to Heavy Metals from Hookah Consumption in Turkiye. Food Chem. Toxicol. 2026, 207, 115848. [Google Scholar] [CrossRef] [Scilit]
- Akl, E.A.; Ward, K.D.; Bteddini, D.; Khaliel, R.; Alexander, A.C.; Lotfi, T.; Alaouie, H.; Afifi, R.A. The Allure of the Waterpipe: A Narrative Review of Factors Affecting the Epidemic Rise in Waterpipe Smoking among Young Persons Globally. Tob. Control 2015, 24, i13–i21. [Google Scholar] [CrossRef] [Scilit]
- Oldenburg, R. The Great Good Place: Cafes, Coffee Shops, Bookstores, Bars, Hair Salons, and Other Hangouts at the Heart of a Community; Da Capo Press: New York, NY, USA; Berkeley, CA, USA, 1999. [Google Scholar]
- Rhodes, T. The ‘Risk Environment’: A Framework for Understanding and Reducing Drug-Related Harm. Int. J. Drug Policy 2002, 13, 85–94. [Google Scholar] [CrossRef] [Scilit]
- Diez Roux, A.V. Investigating Neighborhood and Area Effects on Health. Am. J. Public Health 2001, 91, 1783–1789. [Google Scholar] [CrossRef] [Scilit] [PubMed]
- Elliott, P.; Wartenberg, D. Spatial Epidemiology: Current Approaches and Future Challenges. Environ. Health Perspect. 2004, 112, 998–1006. [Google Scholar] [CrossRef] [Scilit]
- Galea, S.; Vlahov, D. Urban Health: Evidence, Challenges, and Directions. Annu. Rev. Public Health 2005, 26, 341–365. [Google Scholar] [CrossRef] [Scilit]
- WHO. Waterpipe Tobacco Smoking: Health Effects, Research Needs and Recommended Actions for Regulators; World Health Organization: Geneva, Switzerland, 2017. [Google Scholar]
- Karimi, Z.; Zarasvand Ardali, M.; Ghanbar Harati, E.; Entesari, H.; Charkazi, A.; Pahlavanzadeh, B. Perceived Risk of Cardiovascular Diseases and Its Determinants in Hookah Users in Southwest of Iran. Sci. Rep. 2025, 15, 32307. [Google Scholar] [CrossRef] [Scilit] [PubMed]
- Meo, S.A.; AlShehri, K.A.; AlHarbi, B.B.; Barayyan, O.R.; Bawazir, A.S.; Alanazi, O.A.; Al-Zuhair, A.R. Effect of Shisha (Waterpipe) Smoking on Lung Functions and Fractional Exhaled Nitric Oxide (FeNO) among Saudi Young Adult Shisha Smokers. Int. J. Environ. Res. Public Health 2014, 11, 9638–9648. [Google Scholar] [CrossRef] [Scilit]
- Seyyedsalehi, M.S.; Shah, A.; Rashidian, H.; Hadji, M.; Marzban, M.; Ansari-Moghaddam, A.; Nejatizadeh, A.; Boffetta, P.; Zendehdel, K. Determinants of Waterpipe Smoking in Iranian Adults: Results from the IROPICAN Study. Front. Psychiatry 2023, 14, 1292503. [Google Scholar] [CrossRef] [Scilit] [PubMed]
- Nemati, S.; Rafei, A.; Freedman, N.D.; Fotouhi, A.; Asgary, F.; Zendehdel, K. Cigarette and Water-Pipe Use in Iran: Geographical Distribution and Time Trends among the Adult Population; A Pooled Analysis of National STEPS Surveys, 2006–2009. Arch. Iran. Med. 2017, 20, 295–301. [Google Scholar]
- Dadipoor, S.; Heyrani, A.; Aghamolaei, T.; Ghanbarnezhad, A.; Ghaffari, M. Predictors of Hookah Smoking among Women in Bandar Abbas, Southern Iran: A Cross-Sectional Study Based on the Intervention Mapping Protocol. Subst. Use Misuse 2020, 55, 1800–1807. [Google Scholar] [CrossRef] [Scilit] [PubMed]
- Alnasrallah, M.; Rhman, M. Examining the Spatial Distribution of Smoking Lounges Near Colleges in Kuwait Using GIS. Arab World Geogr. 2025, 28, 197–210. [Google Scholar] [CrossRef] [Scilit]
- Mohammadpoorasl, A.; Abbasi Ghahramanloo, A.; Allahverdipour, H.; Modaresi Esfeh, J. Prevalence of Hookah Smoking in Relation to Religiosity and Familial Support in College Students of Tabriz, Northwest of Iran. J. Res. Health Sci. 2014, 14, 268–271. [Google Scholar]
- Bhatnagar, A.; Maziak, W.; Eissenberg, T.; Ward, K.D.; Thurston, G.; King, B.A.; Sutfin, E.L.; Cobb, C.O.; Griffiths, M.; Goldstein, L.B.; et al. Water Pipe (Hookah) Smoking and Cardiovascular Disease Risk: A Scientific Statement from the American Heart Association. Circulation 2019, 139, e917–e936. [Google Scholar] [CrossRef] [Scilit] [PubMed]
- Nakkash, R.T.; Khalil, J.; Afifi, R.A. The Rise in Narghile (Shisha, Hookah) Waterpipe Tobacco Smoking: A Qualitative Study of Perceptions of Smokers and Non-Smokers. BMC Public Health 2018, 11, 315. [Google Scholar] [CrossRef] [Scilit]
- Siahpush, M.; Shaikh, R.A.; Smith, D.; Hyland, A.; Cummings, K.M.; Kessler, A.S.; Dodd, M.D.; Carlson, L.; Meza, J.; Wakefield, M. The Association of Exposure to Point-of-Sale Tobacco Marketing with Quit Attempt and Quit Success: Results from a Prospective Study of Smokers in the United States. Int. J. Environ. Res. Public Health 2016, 13, 203. [Google Scholar] [CrossRef] [Scilit]
- Paulraj, D.; Narayanan, P.P.S.; Kumar, R.S.; Ulaganeethi, R.; Gola, A.; Kar, S.S. Descriptive Analysis of Spatial Distribution and Service Provision of Hookah in Establishments in Puducherry, a Union Territory of South India. Int. J. Community Med. Public Health 2025, 12, 5548–5553. [Google Scholar] [CrossRef] [Scilit]
- Sun, D.L.; Schleicher, N.C.; Recinos, A.; Henriksen, L. Spatial Clustering of Hookah Lounges, Vape Shops, and All Tobacco Retailers near Colleges. Nicotine Tob. Res. 2022, 24, 834–839. [Google Scholar] [CrossRef] [Scilit]
- Pearce, J.; Rind, E.; Shortt, N.; Tisch, C.; Mitchell, R. Tobacco Retail Environments and Social Inequalities in Individual-Level Smoking and Cessation among Scottish Adults. Nicotine Tob. Res. 2016, 18, 138–146. [Google Scholar] [CrossRef] [Scilit]
- Kassem, N.O.; Jackson, S.R.; Boman-Davis, M.; Kassem, N.O.; Liles, S.; Daffa, R.M.; Yasmin, R.; Madanat, H.; Hovell, M.F. Hookah Smoking and Facilitators/Barriers to Lounge Use among Students at a US University. Am. J. Health Behav. 2015, 39, 832. [Google Scholar] [CrossRef] [Scilit]
- O’sullivan, D. Geographically Weighted Regression: The Analysis of Spatially Varying Relationships, by A. S. Fotheringham, C. Brunsdon, and M. Charlton. Geogr. Anal. 2003, 35, 272–275. [Google Scholar] [CrossRef] [Scilit]
- Mohammadi, A.; Pishgar, E.; Aguilera, J. Spatial Prediction of High-Risk Areas for Asthma in Metropolitan Areas: A Machine Learning Approach Applied to Tehran, Iran. ISPRS Int. J. Geo-Inf. 2025, 14, 105. [Google Scholar] [CrossRef] [Scilit]
- Tseng, T.S.; Celestin, M.D., Jr.; Yu, Q.; Li, M.; Luo, T.; Moody-Thomas, S. Use of Geographic Information System Technology to Evaluate Health Disparities in Smoking Cessation Class Accessibility for Patients in Louisiana Public Hospitals. Front. Public Health 2021, 9, 712635. [Google Scholar] [CrossRef] [Scilit]
- Statistical Centre of Iran. Population and Housing Censuses; Statistical Centre of Iran: Tehran, Iran, 2016.
- Asghari Zamani, A.; Zandieh, M. Analysis of Spatial Structure of Tabriz Metropolitan Area Using Spatial Metrics. Spat. Inf. Res. 2018, 26, 195–205. [Google Scholar] [CrossRef]
- Chen, Y.-C. A Tutorial on Kernel Density Estimation and Recent Advances. Biostat. Epidemiol. 2017, 1, 161–187. [Google Scholar] [CrossRef] [Scilit]
- Pucha-Cofrep, F.; Fries, A. ArcGIS Pro Manual; ArcGeek: Loja, Ecuador, 2025. [Google Scholar]
- Mohammadi, A.; Bergquist, R.; Fathi, G.; Pishgar, E.; de Melo, S.N.; Sharifi, A.; Kiani, B. Homicide Rates Are Spatially Associated with Built Environment and Socio-Economic Factors: A Study in the Neighbourhoods of Toronto, Canada. BMC Public Health 2022, 22, 1482. [Google Scholar] [CrossRef] [Scilit] [PubMed]
- Guo, D. Regionalization with Dynamically Constrained Agglomerative Clustering and Partitioning (REDCAP). Int. J. Geogr. Inf. Sci. 2010, 24, 1587–1609. [Google Scholar] [CrossRef] [Scilit]
- ESRI. Local Bivariate Relationships (Spatial Statistics). Available online: https://pro.arcgis.com/en/pro-app/latest/tool-reference/spatial-statistics/localbivariaterelationships.htm (accessed on 22 May 2024).
- ESRI. How Local Bivariate Relationships Works. Available online: https://pro.arcgis.com/en/pro-app/latest/tool-reference/spatial-statistics/learnmore-localbivariaterelationships.htm (accessed on 22 May 2024).
- Tatem, A.J. Mapping Population and Pathogen Movements. Int. Health 2014, 6, 5–11. [Google Scholar] [CrossRef] [Scilit] [PubMed]
- Messina, J.P.; Brady, O.J.; Golding, N.; Kraemer, M.U.G.; Wint, G.R.W.; Ray, S.E.; Pigott, D.M.; Shearer, F.M.; Johnson, K.; Earl, L.; et al. The Current and Future Global Distribution and Population at Risk of Dengue. Nat. Microbiol. 2019, 4, 1508–1515. [Google Scholar] [CrossRef] [Scilit] [PubMed]

Disclaimer/Publisher’s Note: The statements, opinions and data contained in all publications are solely those of the individual author(s) and contributor(s) and not of MDPI and/or the editor(s). MDPI and/or the editor(s) disclaim responsibility for any injury to people or property resulting from any ideas, methods, instructions or products referred to in the content. |
© 2026 by the authors. Published by MDPI on behalf of the International Society for Photogrammetry and Remote Sensing. Licensee MDPI, Basel, Switzerland. This article is an open access article distributed under the terms and conditions of the Creative Commons Attribution (CC BY) license.