Article

The Validation of InSAR Time Series for Landfill Characterization and Monitoring: A Geospatial Approach to Ecological Security and Land System Sustainability

by
Cristina Allende-Prieto
1,2,3,*,
Pablo Rodríguez-Gonzálvez
4,5,
David Álvarez-Fuertes
6 and
Raquel Perdiguer-Lopez
3
1
Civil, Environmental and Geomatics Engineering Research Group (CEGE), Polytechnic School of Mieres, University of Oviedo, 33600 Mieres, Spain
2
Asturias Raw Materials Institute (AsRAM), University of Oviedo, 33600 Mieres, Spain
3
Department of Mining Exploitation and Prospecting, Polytechnic School of Mieres, University of Oviedo, 33600 Mieres, Spain
4
Department of Mining Technology, Surveying, and Structural Engineering, Universidad de León, Avda. Astorga s/n, 24401 León, Spain
5
DRACONES Research Group, Universidad de León, Avda. Astorga s/n, 24401 León, Spain
6
EXCADE S.L., C. Manuel Meana Canal, 5, Periurbano—Rural, 33393 Gijón, Spain
*
Author to whom correspondence should be addressed.
ISPRS Int. J. Geo-Inf. 2026, 15(4), 168; https://doi.org/10.3390/ijgi15040168
Submission received: 9 January 2026 / Revised: 4 April 2026 / Accepted: 7 April 2026 / Published: 12 April 2026

Abstract

This study applies InSAR time series analysis derived from Sentinel-1 satellite data (ascending and descending orbits) processed with ISCE2 and StaMPS (v.4.1) software to evaluate deformation dynamics in three landfill types near Gijón, Spain. Initially, the data were validated against the European Ground Motion Service (EGMS) dataset using a set of Persistent Scatterers (PS) in an urban control area through two analytical approaches (EGMS protocol and PSDefoPAT(2023)). The results showed high consistency, with 82–85% of points classified as highly reliable. Subsequently, this control group was compared with PS from each landfill type (active sanitary, operational inert, and closed inert). Significant deformation differences were found in each landfill type: the active sanitary landfill exhibited distinct anomalies depending on orbit, with strong residual variance instability detected (p < 0.003) in both. Operational inert landfills showed significant anomalies (p < 0.001) in both orbits with variable stability, while closed inert landfills displayed strong stability (p > 0.7) and variable anomalies. These results confirm the efficacy of InSAR approaches for detecting active landfill zones to aid in locating illegal or unauthorized dumping sites and to direct in situ inspection planning.

1. Introduction

The effective management of solid waste is a key component of environmental policy at the global scale, especially considering the rapid increase in urban population and the corresponding rise in waste volumes [1,2]. Moreover, this pressure on waste-management systems intensifies risks to soil, surface and groundwater, air quality, and human health when waste is not properly managed [2]. Based on the waste type and applied engineering techniques, landfills are categorized into two primary types: sanitary landfills, designated for municipal solid waste, and inert waste landfills, which accommodate waste from industrial sources or soil excavation processes [3,4]. Sanitary landfills are typically designed to limit biodegradation-driven emissions and leachate generation through engineered liners and leachate collection systems [5], whereas inert waste landfills often rely primarily on geotechnical containment and compaction measures because biodegradation is minimal [6]. Controlled landfills operate under strict engineering guidelines to ensure geotechnical stability. In contrast, the proliferation of unauthorized or illegal landfills poses a significant threat due to uncontrolled contamination and structural instability risks. In Spain, the persistence of at least 195 illegal landfills not closed, sealed, or restored since 2008 is causing “significant damage to the environment and endangering human health,” leading the European Commission to refer Spain to the Court of Justice of the European Union (CJEU) for failure to comply with the Waste Framework Directive [7]. Controlled landfills include features such as access control, drainage systems to manage leachate, waste compaction, and daily covering to minimize environmental impact. Unauthorized sites typically lack these controls, resulting in pollution hazards and unstable waste accumulation that can lead to environmental degradation and public health risks [8,9]. Unauthorized dumping also tends to occur in locations lacking subsurface monitoring and regulatory oversight, increasing the probability that hazardous materials will go undetected [10].
Movements in sanitary landfills are dominated by differential settlements induced by organic decomposition and the presence of leachate, which cause variations in moisture content and internal pressure within the waste mass [11]. Differential settlement refers to spatially variable vertical displacement resulting from heterogeneities in waste composition, decomposition rates and moisture distribution; these processes produce slow, long-term and spatially non-uniform ground motions [12]. These processes cause gradual and non-uniform settlements throughout the landfill’s lifespan. In contrast, in inert waste landfills, deformations are primarily linked to dynamic loads from heavy machinery during deposition and compaction operations; once mechanical activity stops, consolidation occurs rapidly, and subsequent ground variations are minimal [13,14]. This mechanical-dominant behavior typically yields short-duration, localized deformations that are temporally correlated with operational activity (e.g., vehicle passages, compaction cycles) rather than with long-term biodegradation.
The detection of this type of anomalous activity in areas not designated for controlled landfills can serve as an indicator of the presence of illegal dumping sites. Traditionally, this form of monitoring has relied on in situ inspections, which are costly, time-consuming, and spatially limited. Consequently, these operational constraints have driven the development of remote and proactive surveillance methodologies capable of identifying activity anomalies to prioritize and direct field inspections more efficiently. Remote methods enable broader spatial coverage and repeated observations that can reveal temporal patterns inconsistent with background terrain dynamics [15].
In this context, remote sensing has emerged as a revolutionary technology for detecting volumetric changes and surface deformations in landfills. Recent studies have implemented a data fusion approach that integrates optical (visible/near-infrared), thermal, and Synthetic Aperture Radar (SAR) backscatter sensors to derive multispectral indices, land surface temperature, and SAR backscatter coefficients, significantly enhancing sensitivity to variations in site geometry [16]. Parallel to these developments, remote sensing techniques for the automated detection of illegal dumping sites have achieved significant progress [10,17]. Multisensor fusion can increase detection robustness because different sensors respond to complementary physical properties (e.g., thermal anomalies associated with de-composition, spectral signatures of waste cover, and radar backscatter changes related to surface roughness and moisture) [18].
However, these Copernicus fusion and deep learning approaches largely overlook the temporal dynamics of ground deformation—essential for distinguishing legal operational activity, biogenic settlement processes, and machinery-induced movements—and remain constrained by meteorological dependencies, since optical sensors suffer from cloud cover, haze, and variable illumination that degrade data continuity and accuracy. Furthermore, deep learning models trained on spatial features alone may misclassify transient operational activities as persistent deformation without time-resolved inputs [19].
For their part, Synthetic Aperture Radar (InSAR) interferometry has emerged as a revolutionary technology for monitoring ground deformations with millimeter accuracy over large geographic areas [20]. Applications of InSAR for landfill monitoring have demonstrated effectiveness in forecasting the occurrence of landslides in abandoned soil dumps [21]. InSAR time series analysis incorporates several established algorithms to recover ground surface deformation over time [22]. For example, Persistent Scatterer Interferometry (PSI) identifies ground points with temporally stable radar backscatter [23], and the Small Baseline Subset (SBAS) technique generates interferograms using minimal temporal and spatial baselines [24]. PSI excels where stable, point-like reflectors exist (e.g., man-made structures), while SBAS is more suitable for distributed scatterers and areas with moderate temporal decorrelation; combining both methods can expand spatial coverage and improve temporal resolution [25]. By combining PSI and SBAS outputs, a continuous displacement time series is produced, enabling the retrieval of surface deformation velocities along the satellite line of sight (LOS). However, InSAR-derived displacements are affected by atmospheric delay, temporal decorrelation, and the projection geometry (LOS sensitivity), which must be accounted for during processing and interpretation [26].
The European Space Agency’s Sentinel-1 mission, part of the Copernicus program [27], has revolutionized InSAR applications by providing free data with a 12-day revisit cycle in Interferometric Wide Swath (IW) mode, covering 250 km swaths at approximately 5 × 20 m spatial resolution [28]. This systematic acquisition capability, combined with the availability of processing frameworks such as ISCE2 (InSAR Scientific Computing Environment) [29] and StaMPS (Stanford Method for Persistent Scatterers, v.4.1.) [30], has democratized access to high-quality InSAR time-series analysis. Sentinel-1’s regular revisit cadence and open data policy enable dense temporal stacks that are essential for recovering slow or intermittent landfill-related deformations [31].
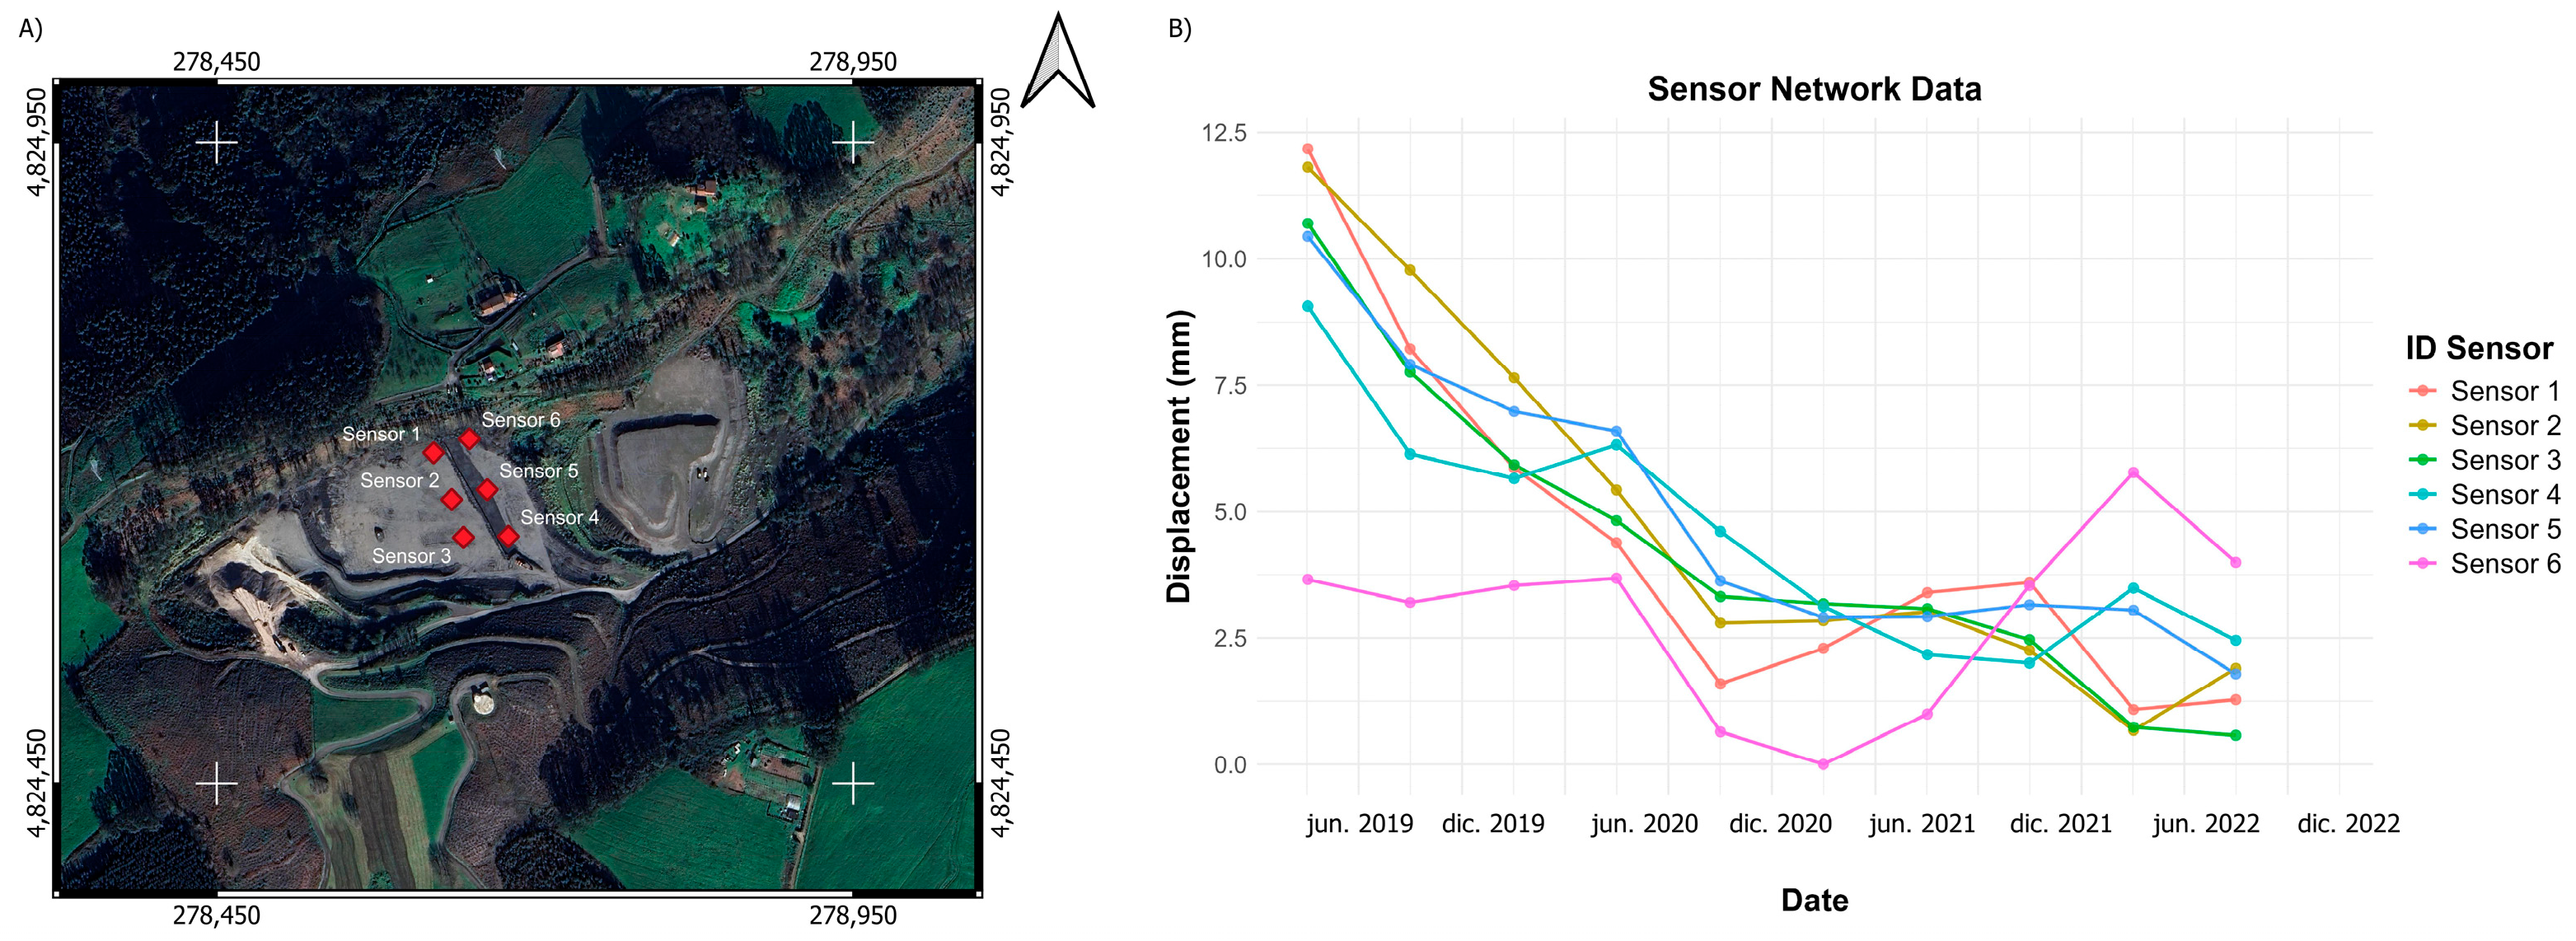
This study aims to apply InSAR time series analysis for the detection and characterization of deformation patterns in diverse landfill environments. The investigation focuses on three representative landfill types: an active sanitary landfill dominated by gradual differential settlement driven by organic decomposition and leachate generation (sample 1), an operational inert landfill characterized by mechanical compaction due to heavy equipment loads (sample 2) and a closed inert landfill undergoing residual consolidation with minimal external forces (sample 3). These three cases were chosen to cover the main deformation mechanisms relevant for landfill monitoring thus testing the capacity of InSAR time series to discriminate among them. In the case of the inactive landfill (sample 3), data collected from terrestrial sensors deployed at multiple locations across the site were analyzed to verify the absence of dynamic activity, thereby complementing the InSAR analysis with direct in situ measurements.
The InSAR time series data were validated against measurements from the European Ground Motion Service (EGMS, 2019-2022 update) [32], an operational component of the Copernicus Land Monitoring Service (CLMS), which provides the first continental-scale ground deformation dataset for Europe, based on the massive analysis of Sentinel-1 imagery [33].
This study focuses on detecting the presence or absence of movements or anomalies, not on quantifying the metric values of these displacements. By combining these results with spatial proximity analysis of the detected points, areas of illegal or unauthorized landfills could be identified, thus optimizing and reducing the time and resources needed for subsequent in situ verification. Ultimately, the approach is intended to prioritize field inspections by flagging locations with deformation signatures consistent with illicit dumping or atypical operational practices.

2. Materials

2.1. Study Area

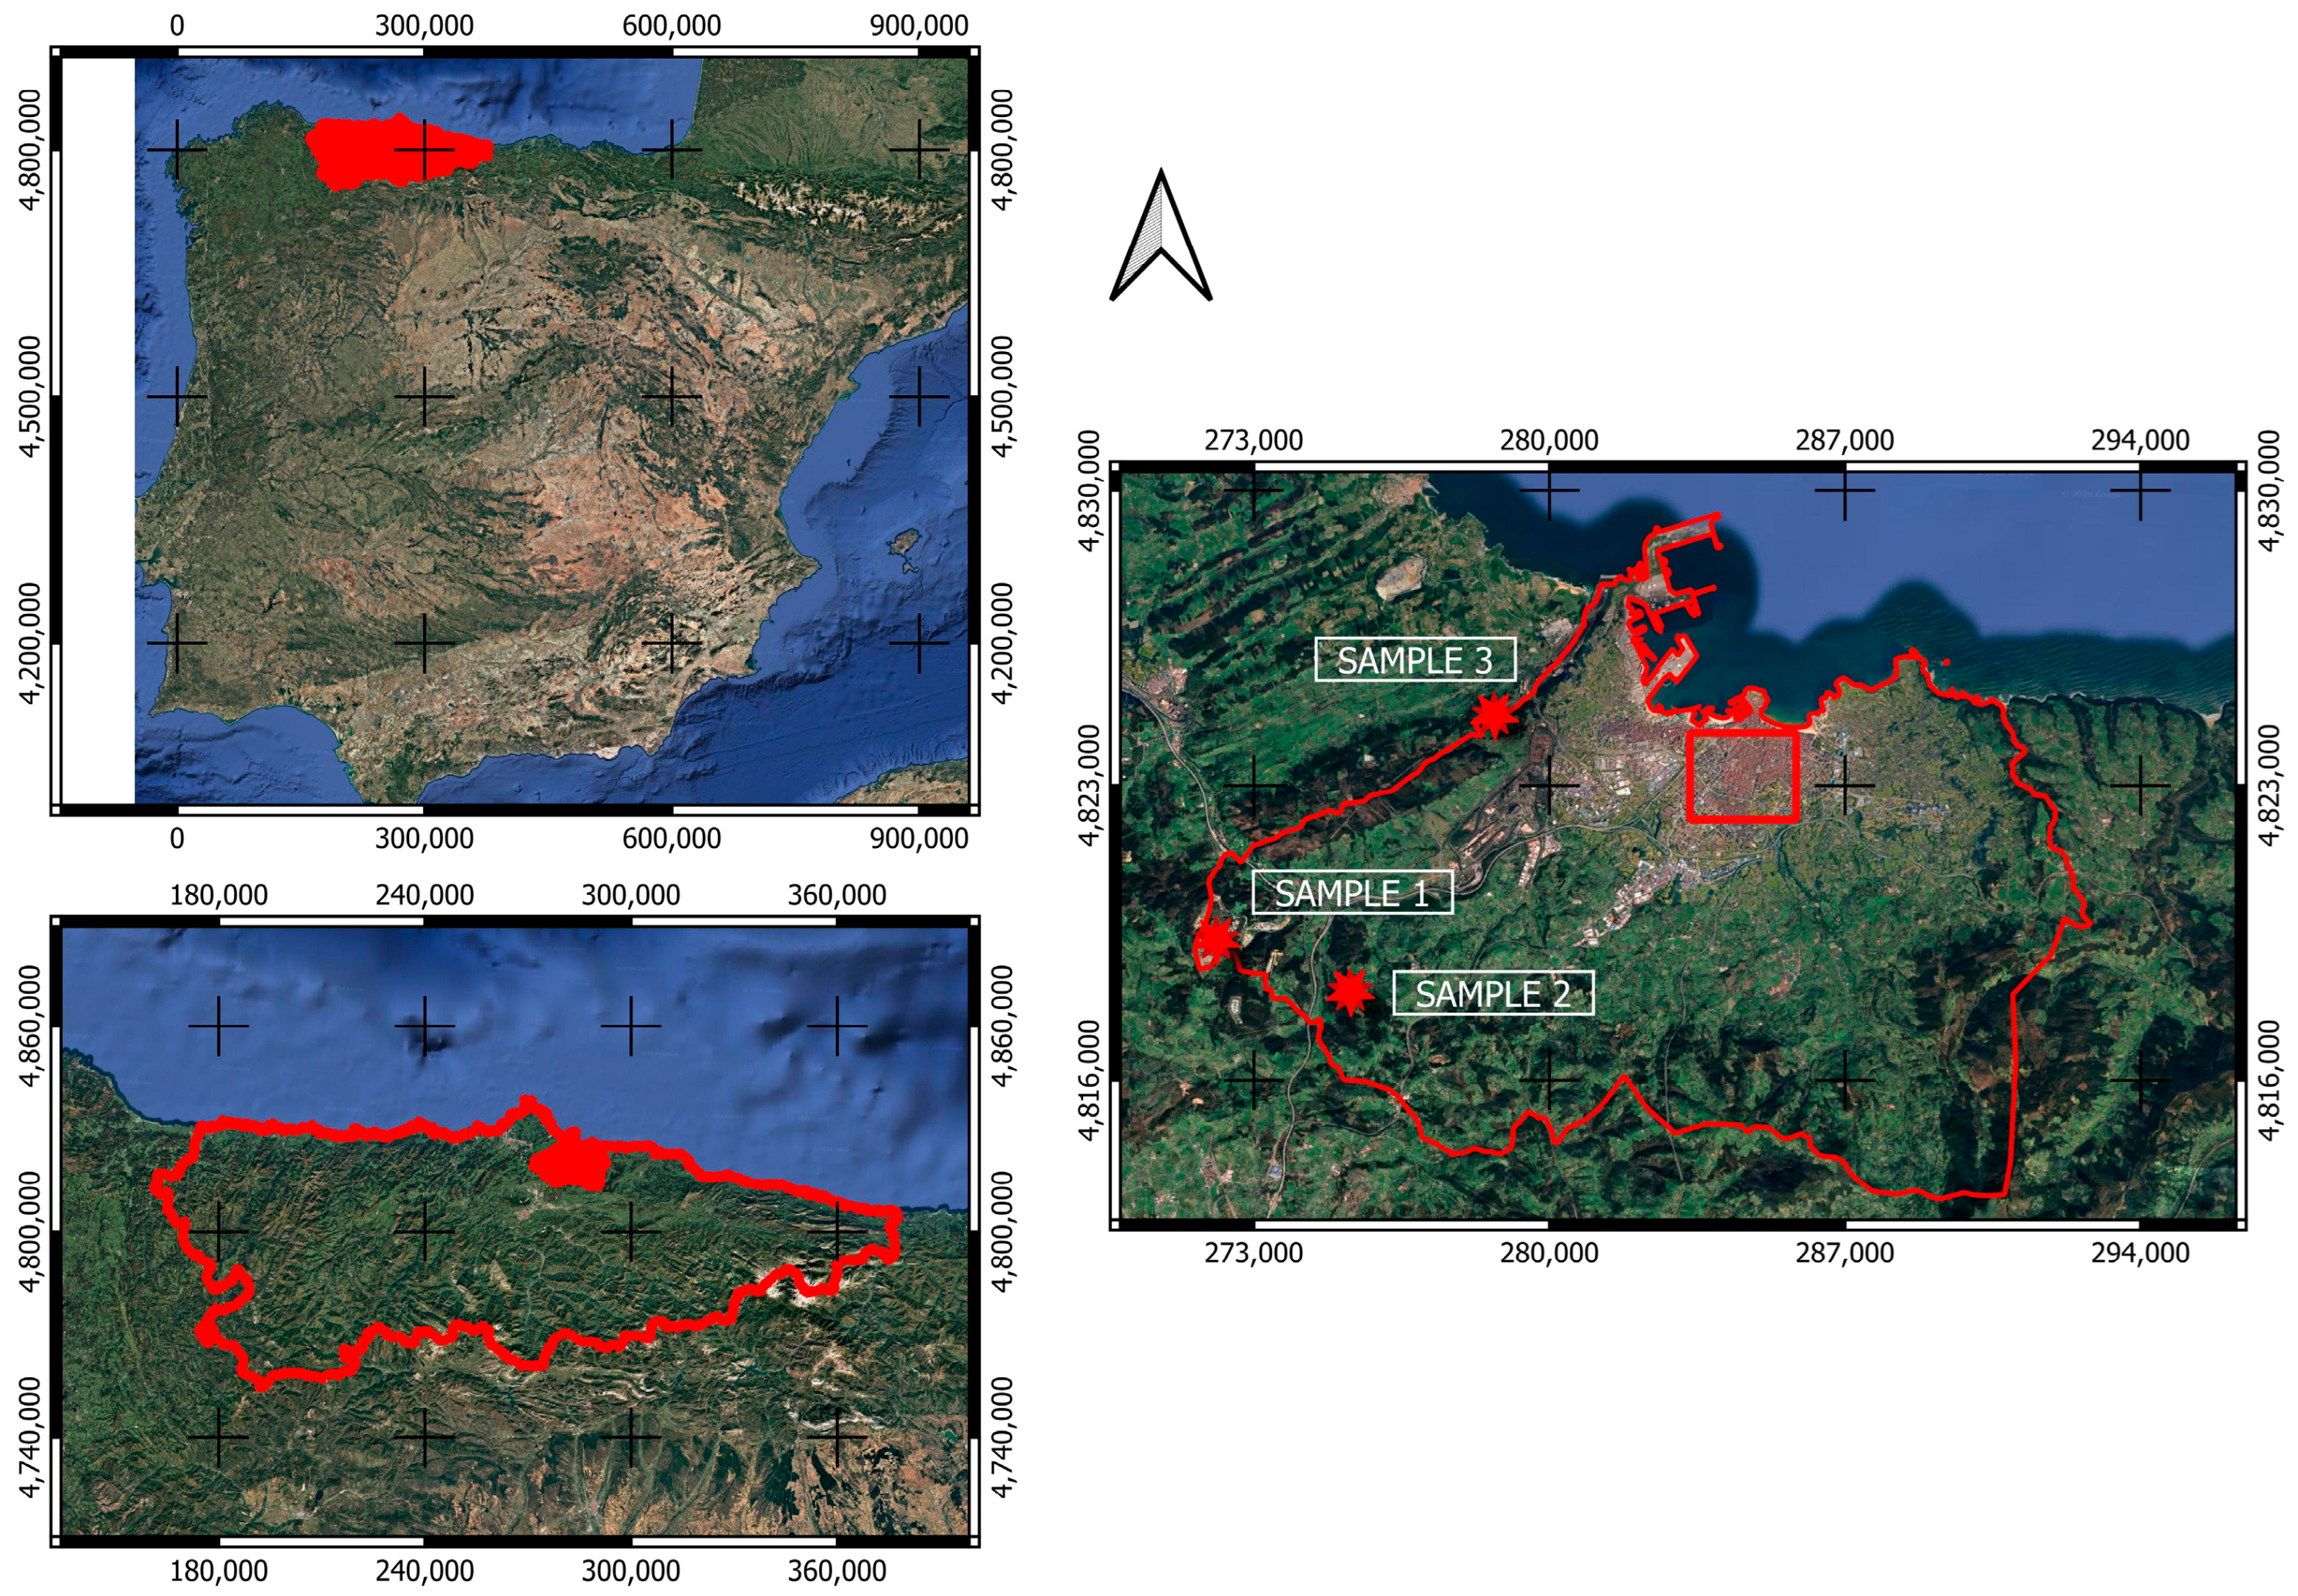
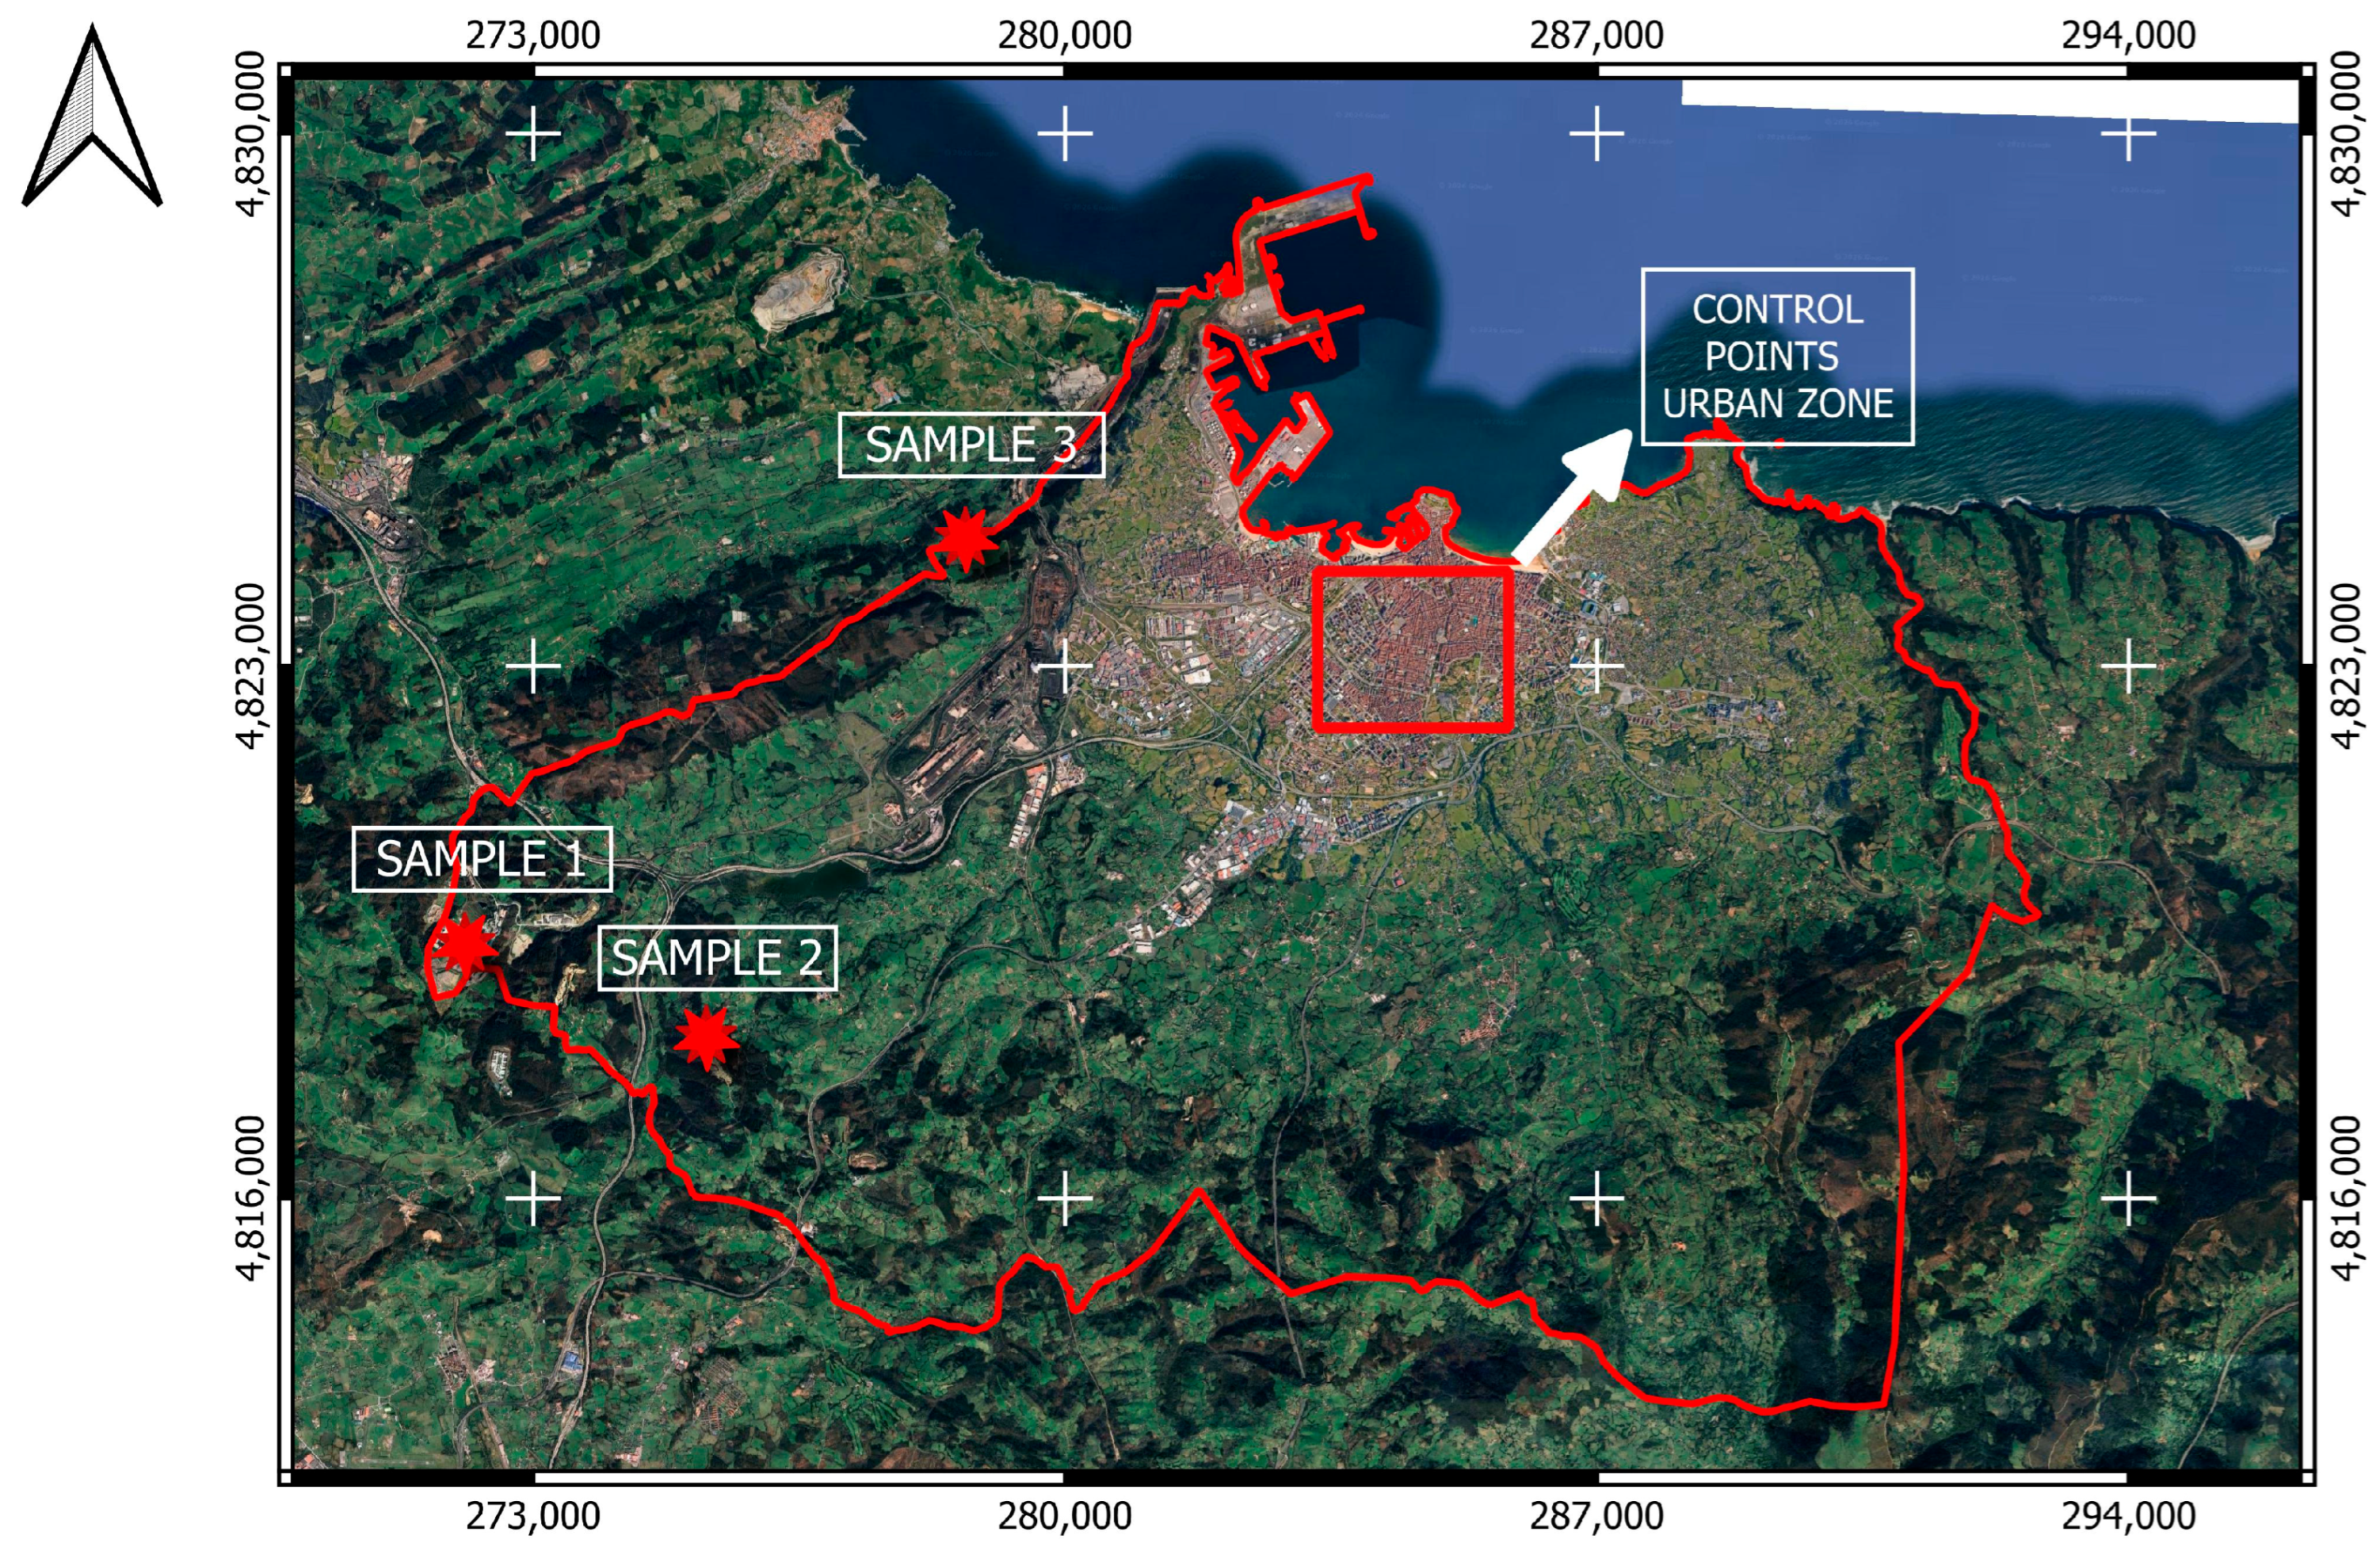
Gijón is a municipality located in the province of Asturias, in northwest Spain, distinguished by its historic industrial and mining development. The concentration of industrial facilities and mining operations over the decades has created the need for effective management of the waste generated by these activities, including the designated landfill areas. Figure 1 shows the geographic location of the municipality and the sites of the landfills under study (samples 1 to 3), which are situated in close proximity to the urban center. The red box delineates the control point area used for subsequent StaMPS-EGMS validation analyses. This configuration highlights the direct relationship between Gijón’s characteristic productive activity and the environmental challenges posed by proper waste management in both urban and industrial settings.
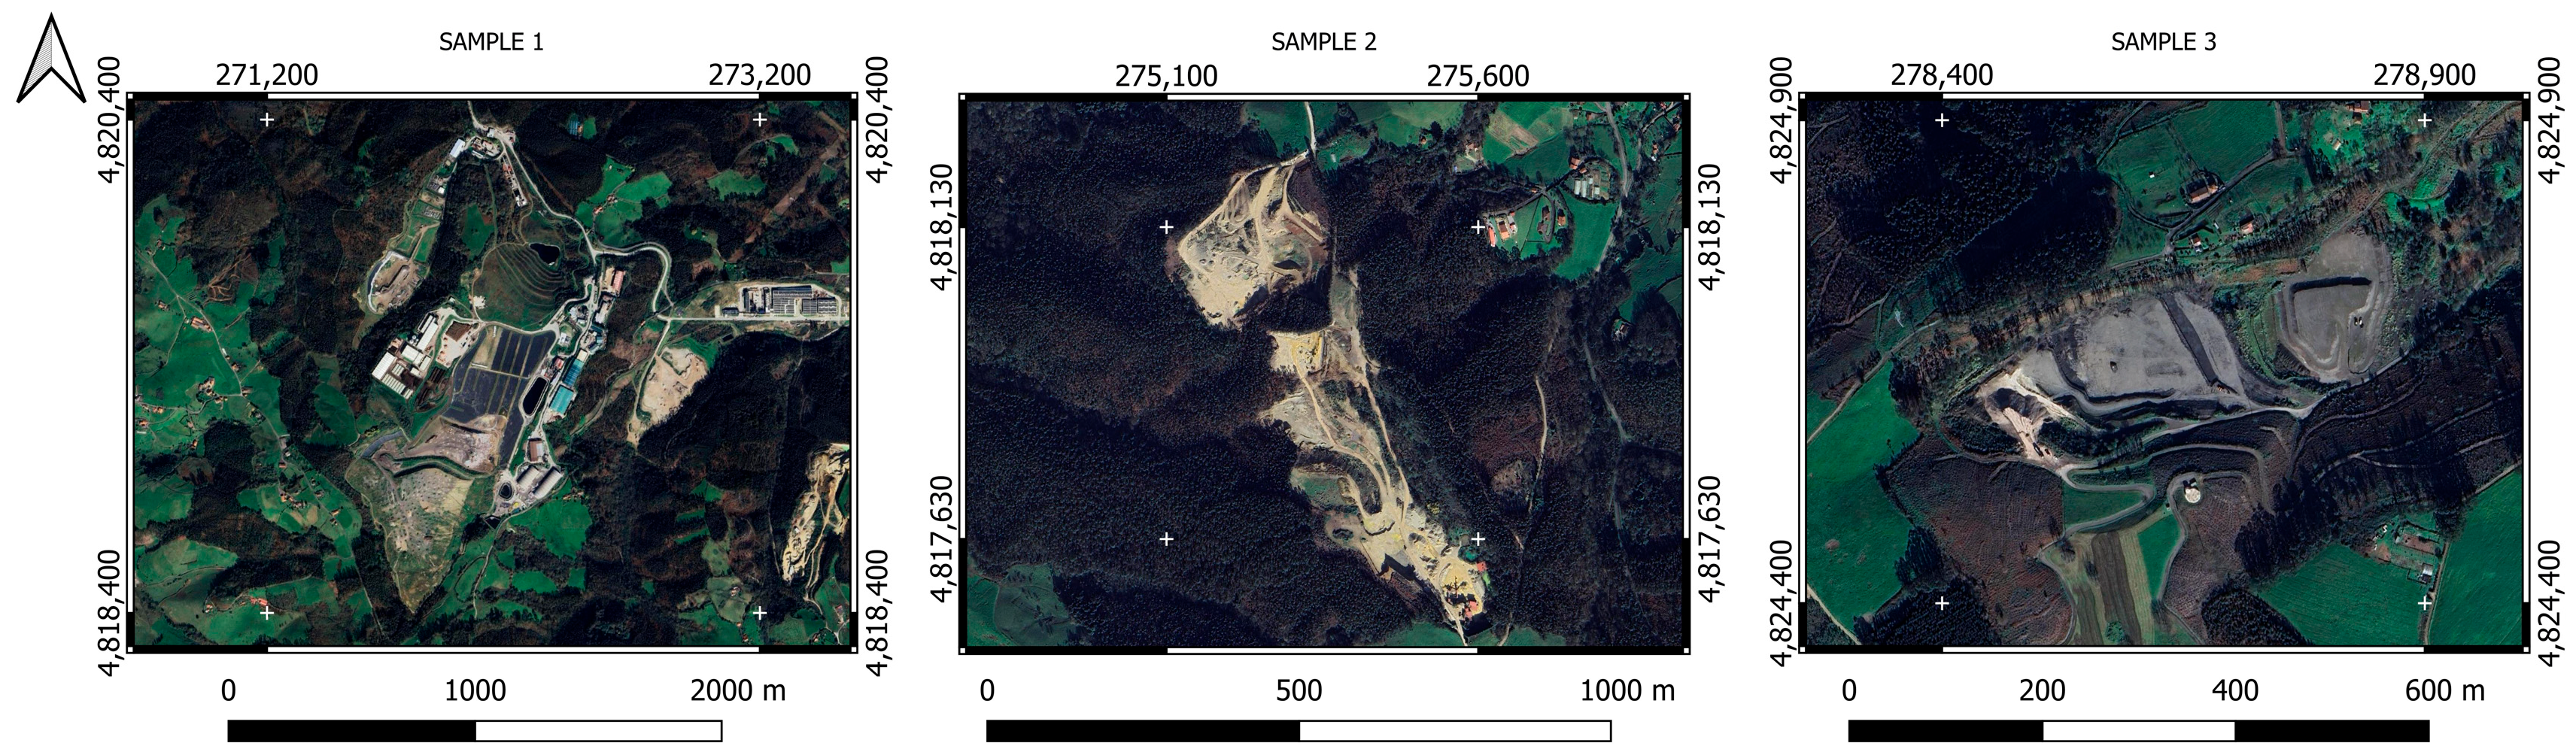
Figure 2 provides a detailed representation of the landfills associated with samples 1, 2, and 3 at an enlarged scale, enabling the precise visualization of the morphology, extent, and site-specific characteristics.
Sample 1 (active sanitary landfill) covers an area of 0.125 km2 with an average slope of 2.09%; Sample 2 (operational inert landfill) spans 0.09 km2 with a steeper average slope of 13.15%; and Sample 3 (closed inert landfill) occupies 0.05 km2 with an average slope of 9.51%.

2.2. Imagery

For the InSAR time series analysis, a set of 58 Sentinel-1A radar images were employed. The data corresponds to the Single-Look Complex (SLC) product in Interferometric Wide Swath (IW) mode with VV (Vertical–Vertical) polarization. This dataset was stratified into two observation geometries, each maintaining the characteristic 12-day revisit frequency of the individual satellite: 29 images in the ascending orbit (spanning from 20 January to 22 December 2022) and 29 images in the descending orbit (from 7 January to 21 December 2022), thereby providing the dense temporal coverage necessary for mitigating decorrelation and executing the displacement analysis.

2.3. InSAR Data Processing Software

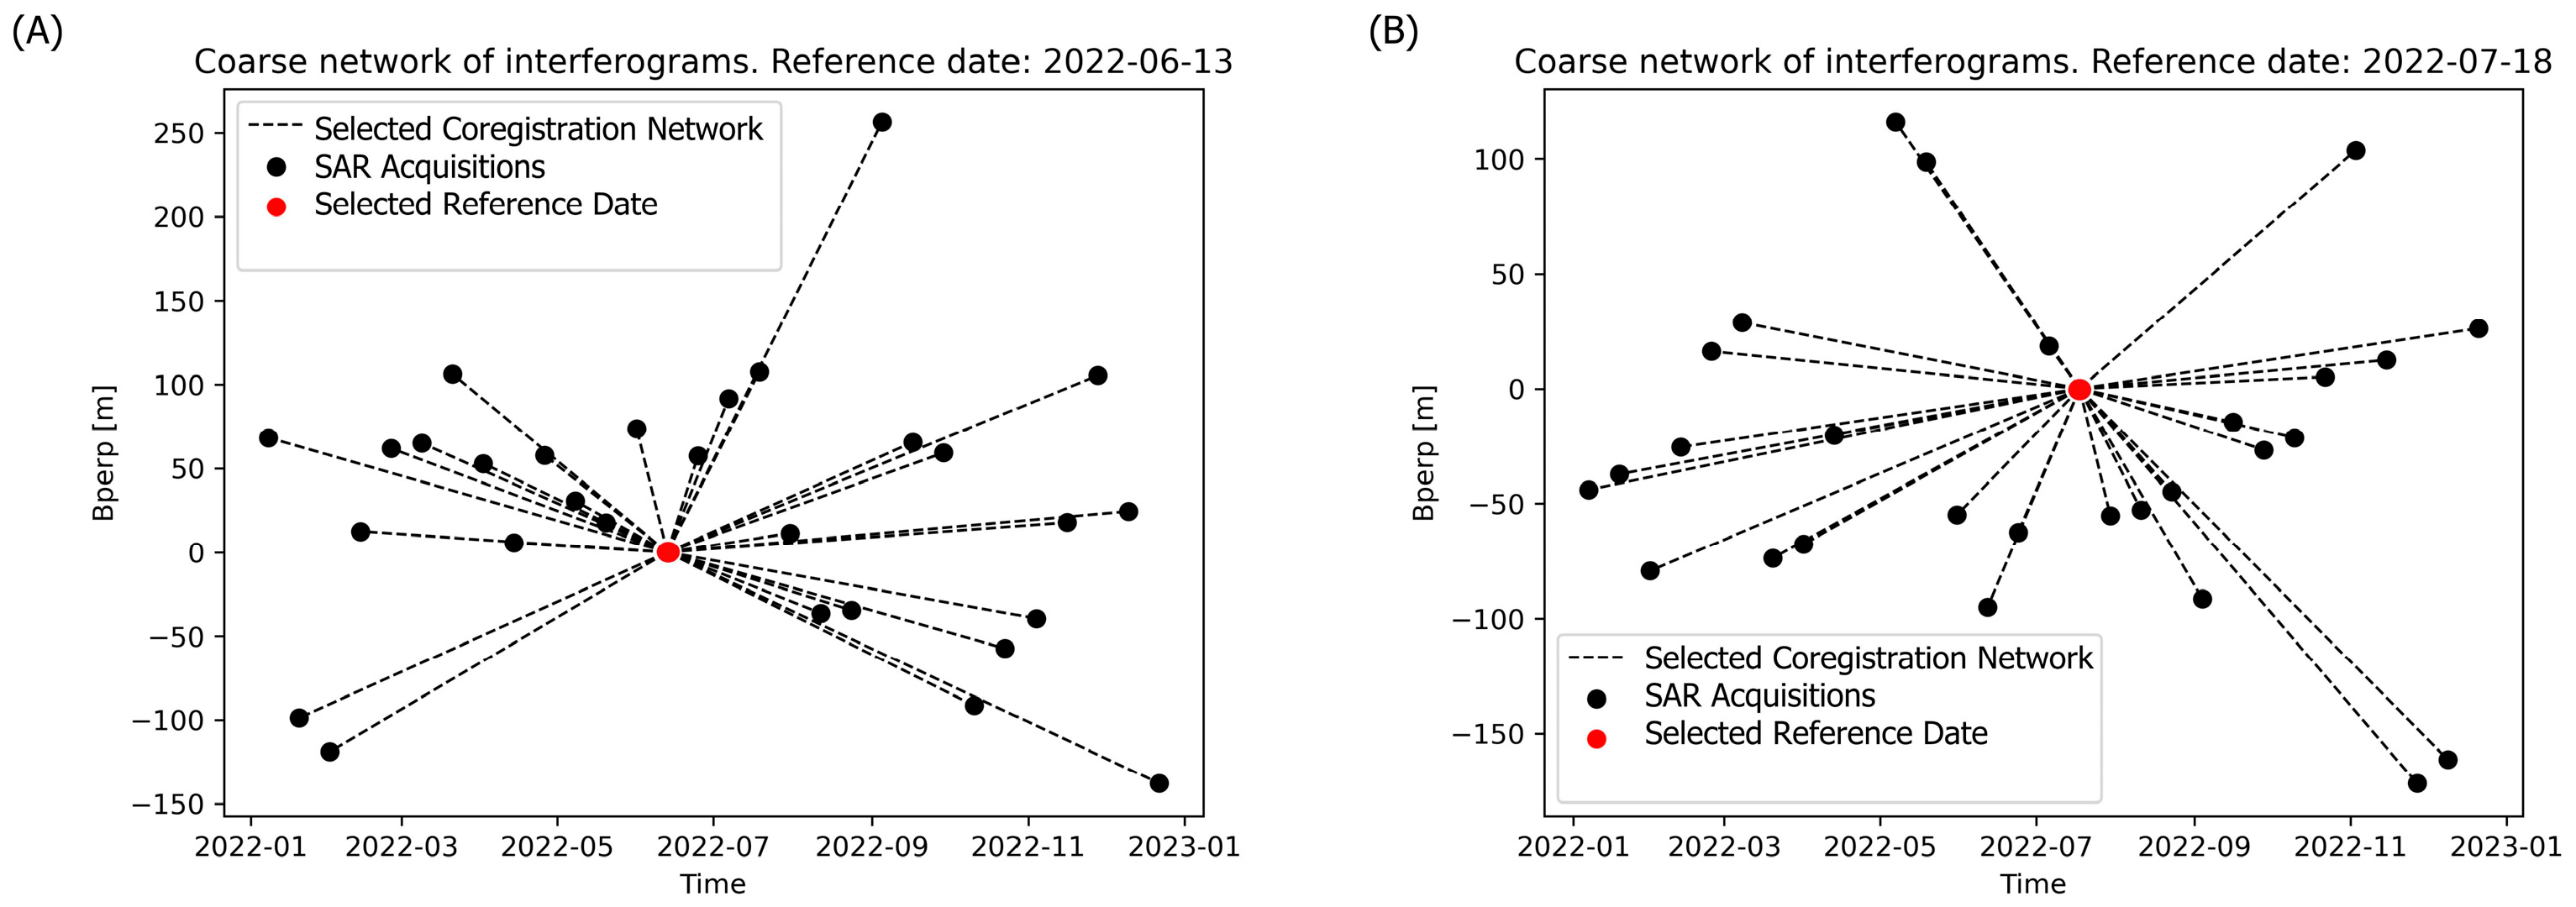
The raw Sentinel-1 SLC stack was initially processed with the InSAR Scientific Computing Environment (ISCE), an open-source, modular framework developed by NASA JPL for interferometric SAR processing [34,35]. First, Instrument Processing Facility (IPF) versions were verified to ensure consistent radiometric and geometric calibration across acquisitions. A WGS84 Shuttle Radar Topography Mission (SRTM) Digital Elevation Model (DEM) at 1 arcsecond resolution (~30 m) was employed for precise topographic phase removal, followed by co-registration of each slave SLC to an optimized master date (13 June 2022 and 18 July 2022 for ascending and descending orbits, respectively) chosen to minimize perpendicular and temporal baselines [34,35] (Figure 3 shows a coarse network of interferograms and the reference date selected for ascending and descending orbits). Subsequent processing included interferogram generation, phase unwrapping, and the removal of atmospheric and orbital artifacts, enabling the extraction of reliable surface deformation signals for time series analysis [36].
The interferometric processing was executed using the Stanford Method for Persistent Scatterers (StaMPS) software package, a widely recognized tool for InSAR time series analysis [30]. StaMPS employs the Persistent Scatterer Interferometry (PSI) technique to identify points on the ground (termed Persistent Scatterers or PS) that maintain stable radar reflectivity over time, such as stable rocky outcrops or engineered structures. The method allows for the estimation of surface deformation velocity and displacement time series with millimeter precision from the Sentinel-1 image collection, minimizing the effects of atmospheric and temporal decorrelation. This approach is critical for monitoring slow-moving phenomena, such as subsidence and landslides, by providing accumulated displacement measurements along the satellite’s Line-of-Sight (LOS).
To manage the previous processing steps in a unified framework, we employed the EZ-InSAR toolbox, an open-source MATLAB-based software designed to streamline and automate the InSAR time series analysis workflow [37]. EZ-InSAR offers an intuitive graphical user interface that facilitates its use for those less familiar with the underlying theory and computational tools. Rather than functioning as an independent processor, it integrates three widely used open-source InSAR tools: ISCE for interferogram generation and StaMPS for Persistent Scatterer Interferometry (PSI), and MintPy for Small Baseline Subset (SBAS) analysis [38].

2.4. In Situ Sensor Network

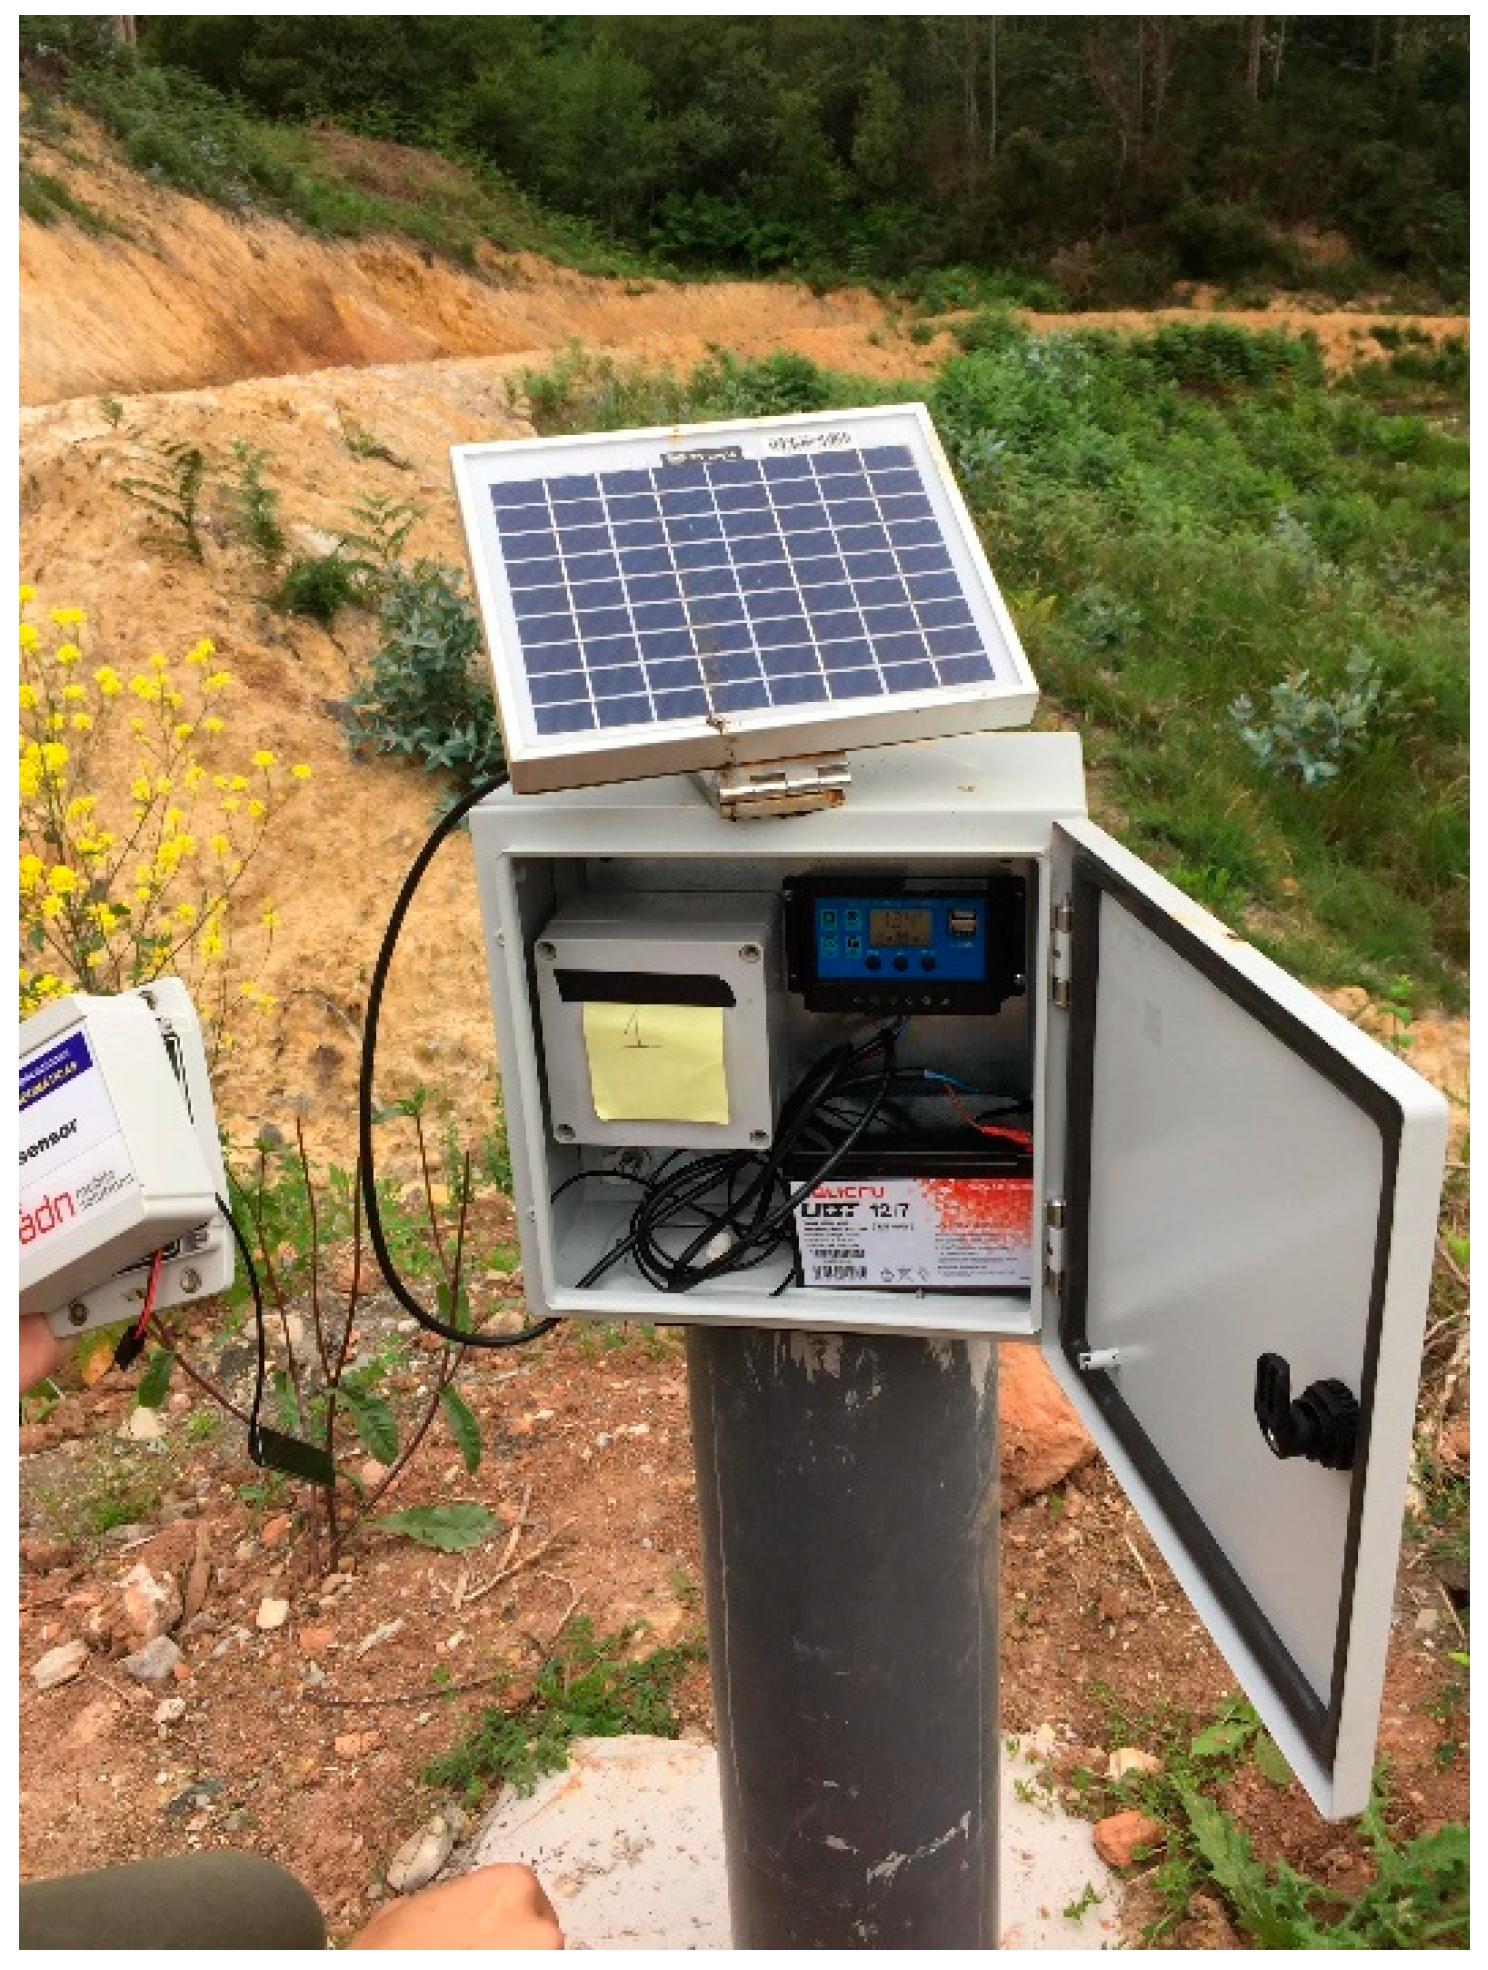
In situ monitoring of the closed inert landfill (sample 3) was conducted using a dedicated sensor network system. This system comprises encapsulated high-precision accelerometers and gyroscopes, strategically installed across the landfill surfaces to provide continuous, autonomous, and real-time measurements of ground vibrations and positional changes [39]. A total of six sensors were distributed across the landfill surface, recording data between the years 2019 and 2022. The devices are interconnected via an IoT-based communications module, enabling automated data transmission to a central collection and analysis hub. Figure 4 shows the sensor installation.
The sensor network system was designed and implemented by EXCADE S.L. (Gijón, Spain) as an ad hoc IoT network comprising high-precision accelerometer-gyroscope nodes equipped with TDK ICM-20689 3-axis sensors and 13GD20H high-precision units. These sensors measure position variations in any direction with 0.2° precision (equivalent to 0.03 mm at 1 m distance) across an acceleration range of ±2 G to ±16 G. The system enables continuous monitoring of both occasional phenomena and long-term ground displacement, featuring an automated alert module that generates urgent email/SMS notifications when pre-established safety thresholds are exceeded.
The calibration of these alert levels follows the Serviceability Limit State (SLS) framework and associated tolerances as defined in Eurocode 7 (UNE-EN 1997-1, clause 2.4.8 and Annex H). Specifically, the thresholds represent the maximum allowable angular distortion and displacement that ensure the structural integrity and functional stability of the deposit. By aligning our InSAR-derived deformation values with these established geotechnical standards, we ensure that the detected ‘anomalies’ correspond to physical movements that would trigger technical inspections under European regulations.
Data acquisition was configured to the required frequency for effective movement detection, and any values exceeding the pre-established thresholds triggered automated alerts. This sensor network was critical for discriminating between anthropogenic and natural sources of ground movement, confirming ongoing machinery activity in the operational landfill and ratifying the absence of active processes in the closed landfill. The robust and real-time monitoring architecture ensured that all observed surface motion could be objectively validated and reliably attributed to the corresponding operational status of the observed landfill zones. Figure 5 shows the sensor network data and its geographical position.

3. Methods

3.1. Validation InSAR Time Series Data

For the validation and comparison of the InSAR processing results, this study utilized the European Ground Motion Service (EGMS) calibrated dataset (Level 2b). The calibrated product was employed for direct comparison with the Line-of-Sight (LOS) velocity and displacement time series derived from StaMPS processing. Its calibrated nature allows overcoming the typical relative measurement limitations of InSAR time series, enabling a robust and statistically sound validation of the independently processed StaMPS results [40,41].
A systematic procedure was implemented to identify the common control points between the EGMS datasets and the results obtained from StaMPS. The objective was to ensure that the comparison between both datasets was conducted at the same geographical locations, thereby eliminating positional variability as a source of error in the validation. This process relied on rigorous spatial sampling, where each point in the StaMPS dataset was compared with all points in the EGMS datasets (L2b level, for both ascending and descending orbits). Common points were identified by performing a nearest-neighbor search using a Euclidean distance with a threshold of 10 m, in congruence with the nominal resolution characteristics of Sentinel-1 IW mode data [42]. The points used in this process belong to the urban area of Gijón, and their geographical location is shown in Figure 6, which is the nearest urban zone to the landfills utilized in the study, thereby ensuring both spatial representativeness and relevance of the validation results for the specific context of this investigation. This urban setting was deliberately chosen based on evidence from previous studies showing that InSAR measurements present higher stability and reliability in urban areas due to the presence of stable man-made structures, in contrast with vegetated or natural areas, where temporal decorrelation commonly reduces data quality and coherence [43].
As a result of this spatial sampling and rigorous matching procedure, a total of 18,670 points were extracted for subsequent analysis.
The validation of the StaMPS deformation time series against the calibrated EGMS dataset was carried out using two complementary approaches. First, the EGMS standardized three-phase statistical protocol [44] was applied, which relies on a point-to-point comparison strategy between individual Persistent Scatterers (PS). Second, the Persistent Scatterer Deformation Pattern Analysis Tool (PSDefoPAT, 2023) [45] framework for PS InSAR analysis was used, implementing a comparison strategy based on groups of PS. By integrating both methodologies, the validation process provides robust and comprehensive results.
Both process approaches decompose deformation time series into three key components: trend, seasonality, and residuals. However, the essential distinction lies in how these components are modeled and in the level of adaptability for each point or scatterer. Process 1 (EGMS standardized protocol) applies a uniform harmonic model to all data, combining a linear trend with periodic (sine and cosine) terms to represent seasonal effects, thereby ensuring methodological homogeneity in accordance with standard InSAR protocols. In contrast, process 2 (PSDefoPAT) uses a data-adaptive strategy, selecting for each point the most appropriate model—linear, quadratic, or piecewise—based on the Bayesian Information Criterion (BIC), which allows for a more precise representation of deformation where temporal evolution deviates from simple or strictly periodic behavior. As a result, process 1 facilitates direct comparison across points, while process 2 prioritizes optimal fitting to each signal, enhancing the accuracy of the decomposition in complex or rapidly changing deformation conditions.
Statistical validation procedures were designed to complement the respective decomposition approaches. For process 1, a two-sample independent t-test was applied to the estimated deformation velocities to evaluate the statistical significance of differences between datasets. For the residual components, both Pearson’s correlation coefficient and cosine similarity metrics were utilized: Pearson’s correlation quantified linear concordance or independence in transient movements, while cosine similarity measured the global shape similarity of the non-modeled variations, regardless of magnitude. This integrated approach ensures a rigorous and transparent assessment of both long-term and transient ground motion, fully aligned with international InSAR validation standards.
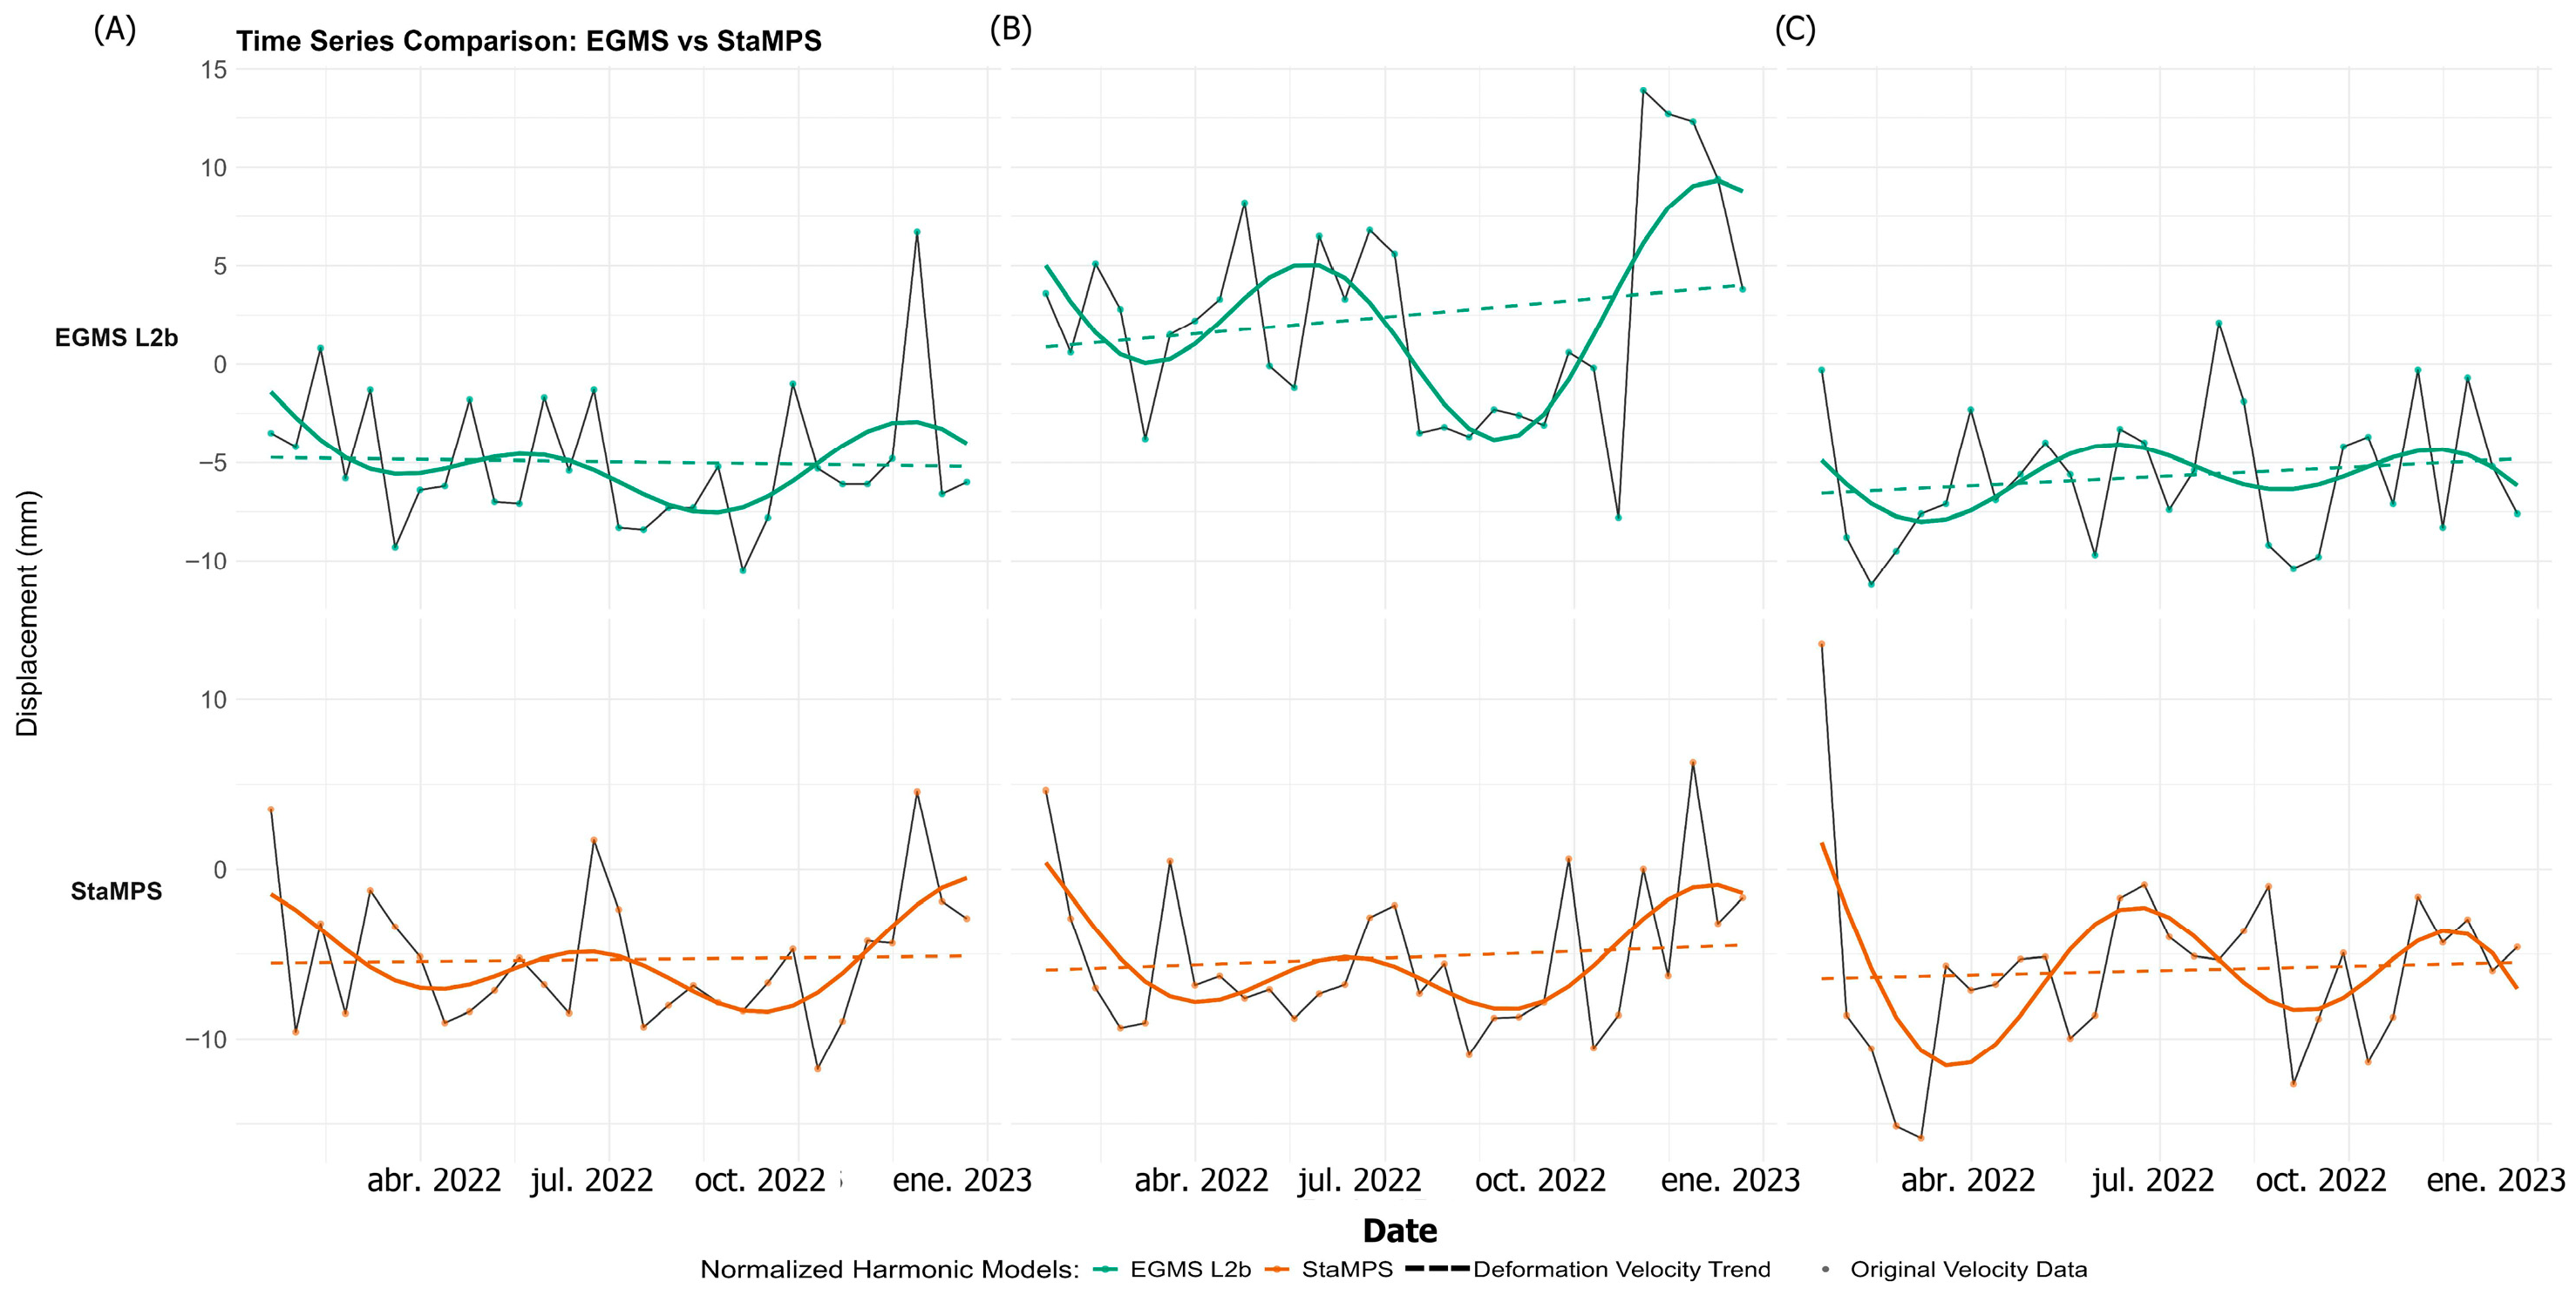
Figure 7 shows a time series comparison of ground displacement measurements obtained with StaMPS and EGMS for ascending orbit data at three randomly selected validation points (A, B, and C). Each panel decomposes the displacement signals into original velocity data, normalized harmonic models (EGMS L2b in teal; StaMPS in orange), and strain velocity trends. This visualization enables a detailed assessment of temporal agreement in both the seasonal and linear components, thus providing clear evidence of the relative performance of each InSAR processing approach in capturing ground motion dynamics under the established validation protocol.
For process 2, non-parametric hypothesis tests for non-normal distributions and outlier-resilient analysis were applied—specifically, the Wilcoxon–Mann–Whitney test using the linear trend velocity metric for all PSs, and Levene’s test to assess residual variance after fitting the simplest model.
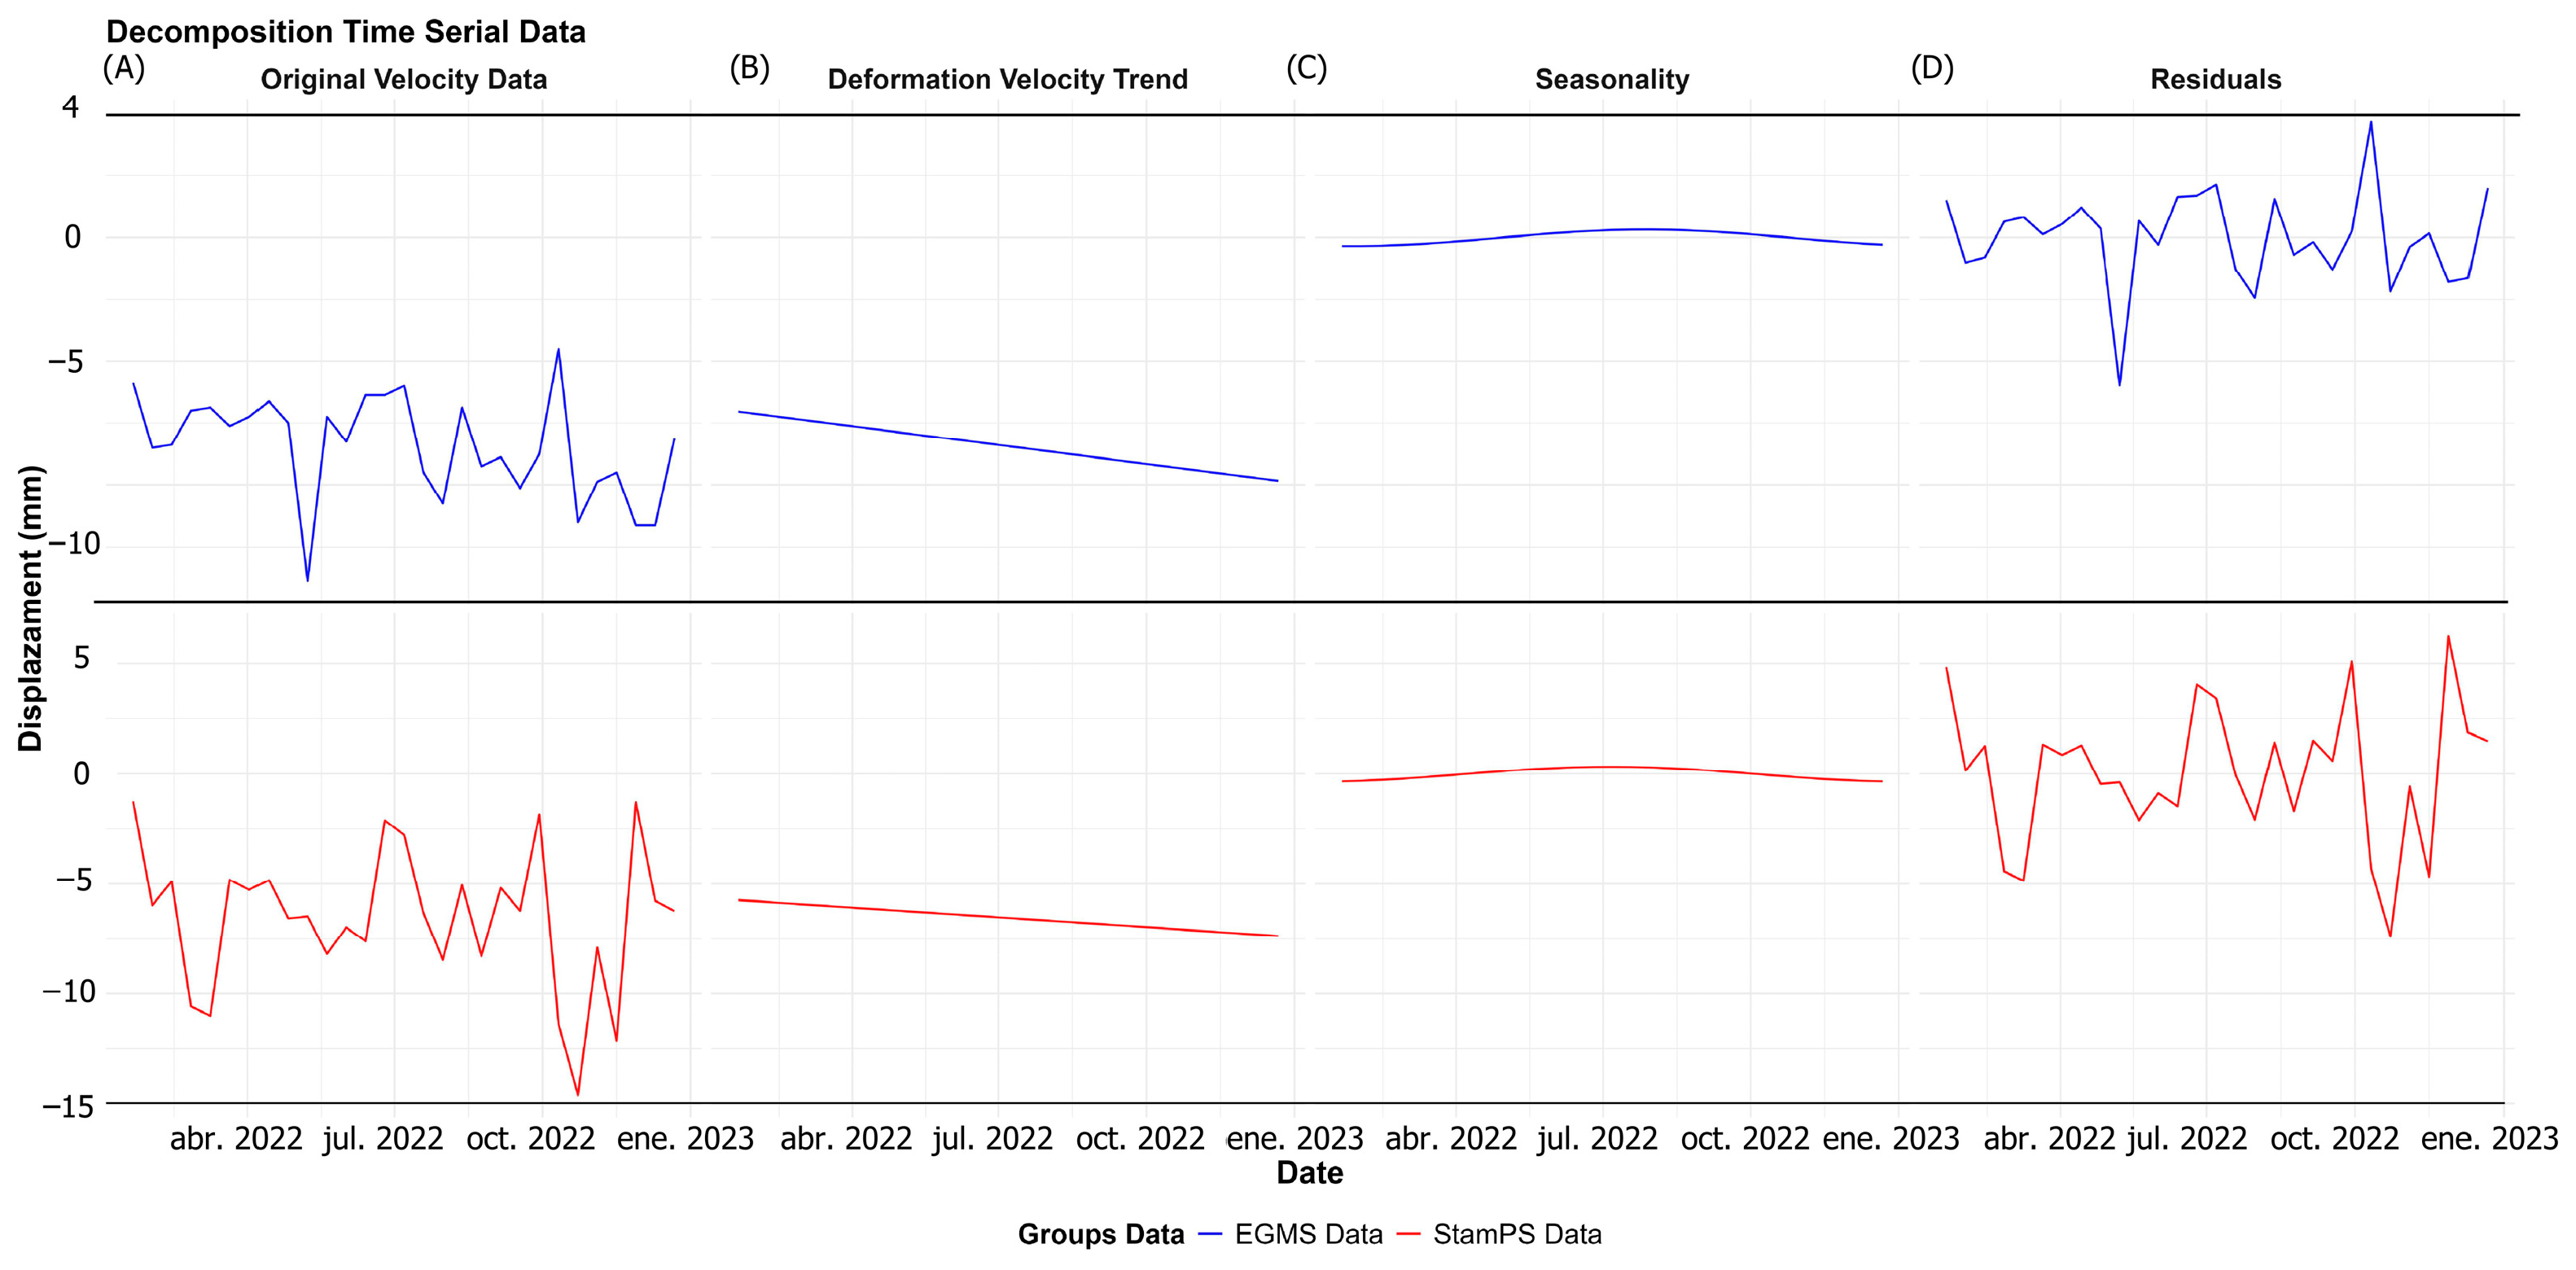
Figure 8 presents the displacement time series analyzed for a random single example Persistent Scatterer (PS) point using the PSDefoPAT approach. The raw displacement time series recorded by both EGMS and StaMPS (Figure 8, panel A) is decomposed into trend, seasonal, and residual components. The trend shown in Panel B represents the long-term evolution of the deformation velocity, while the periodic component, shown in panel C, is labeled as seasonality. Finally, the part of the time series that cannot be explained by the model, the residuals, is shown in panel D.

3.2. Deformation Patterns in Landfills

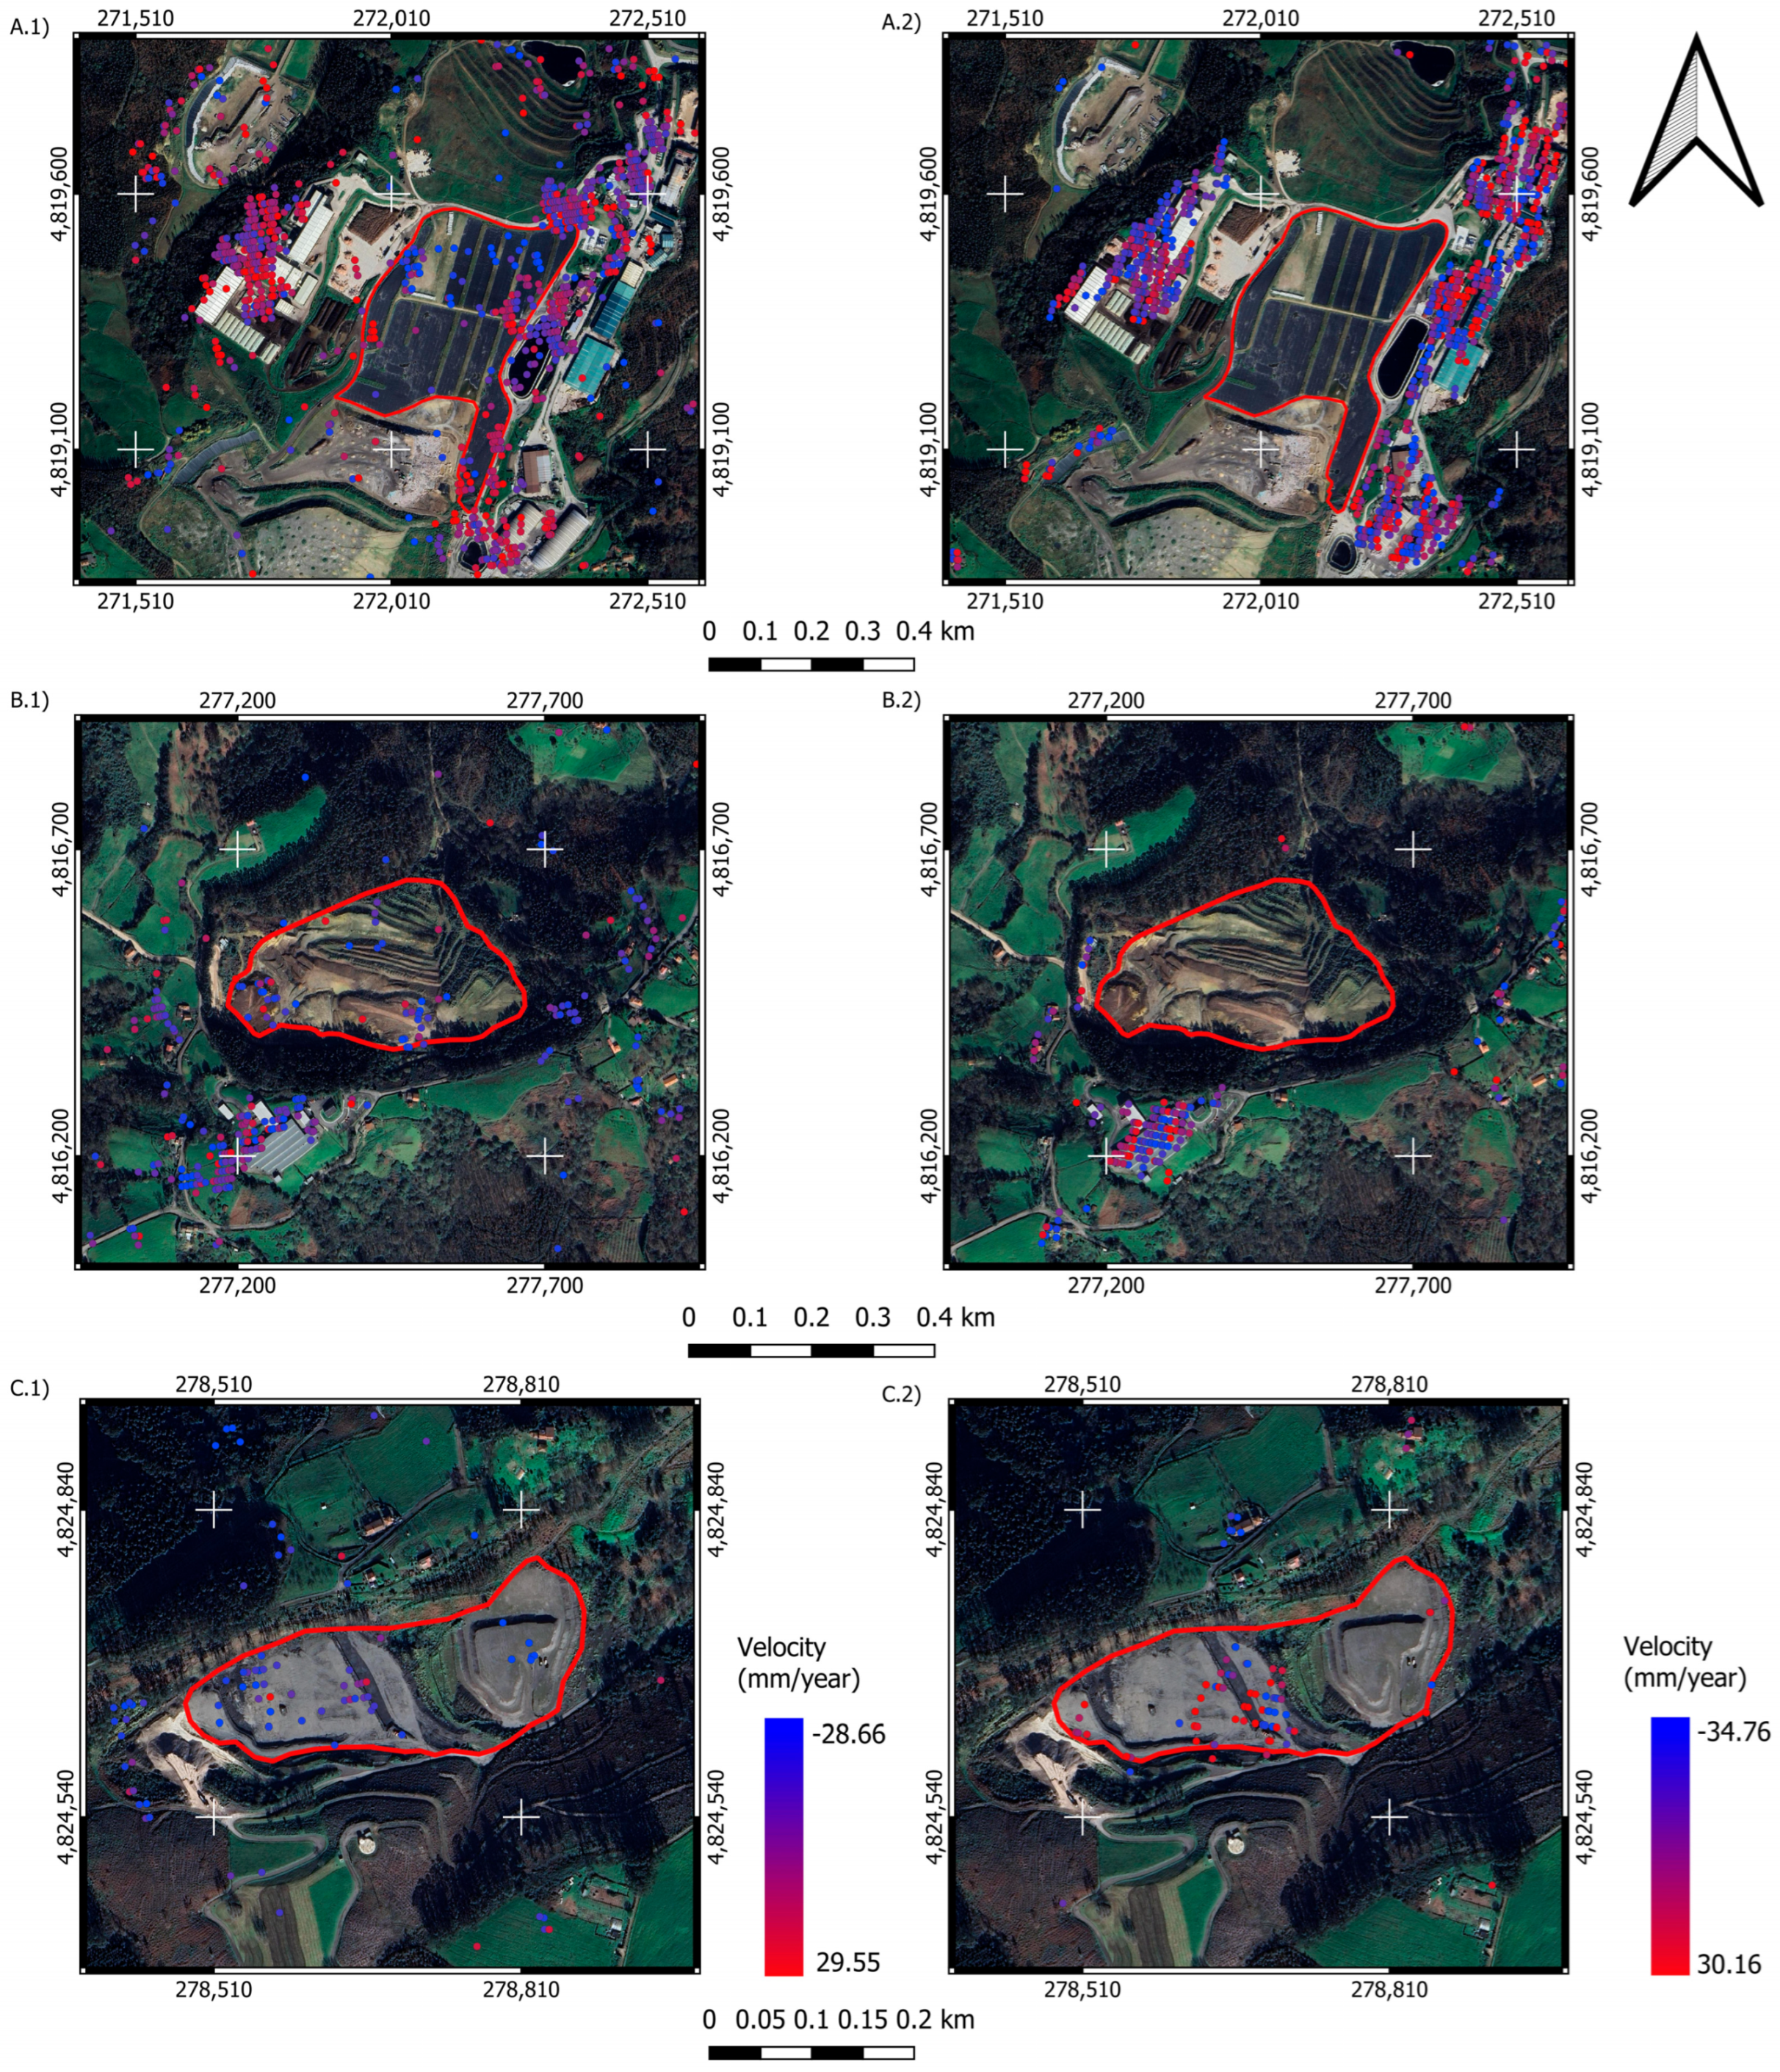
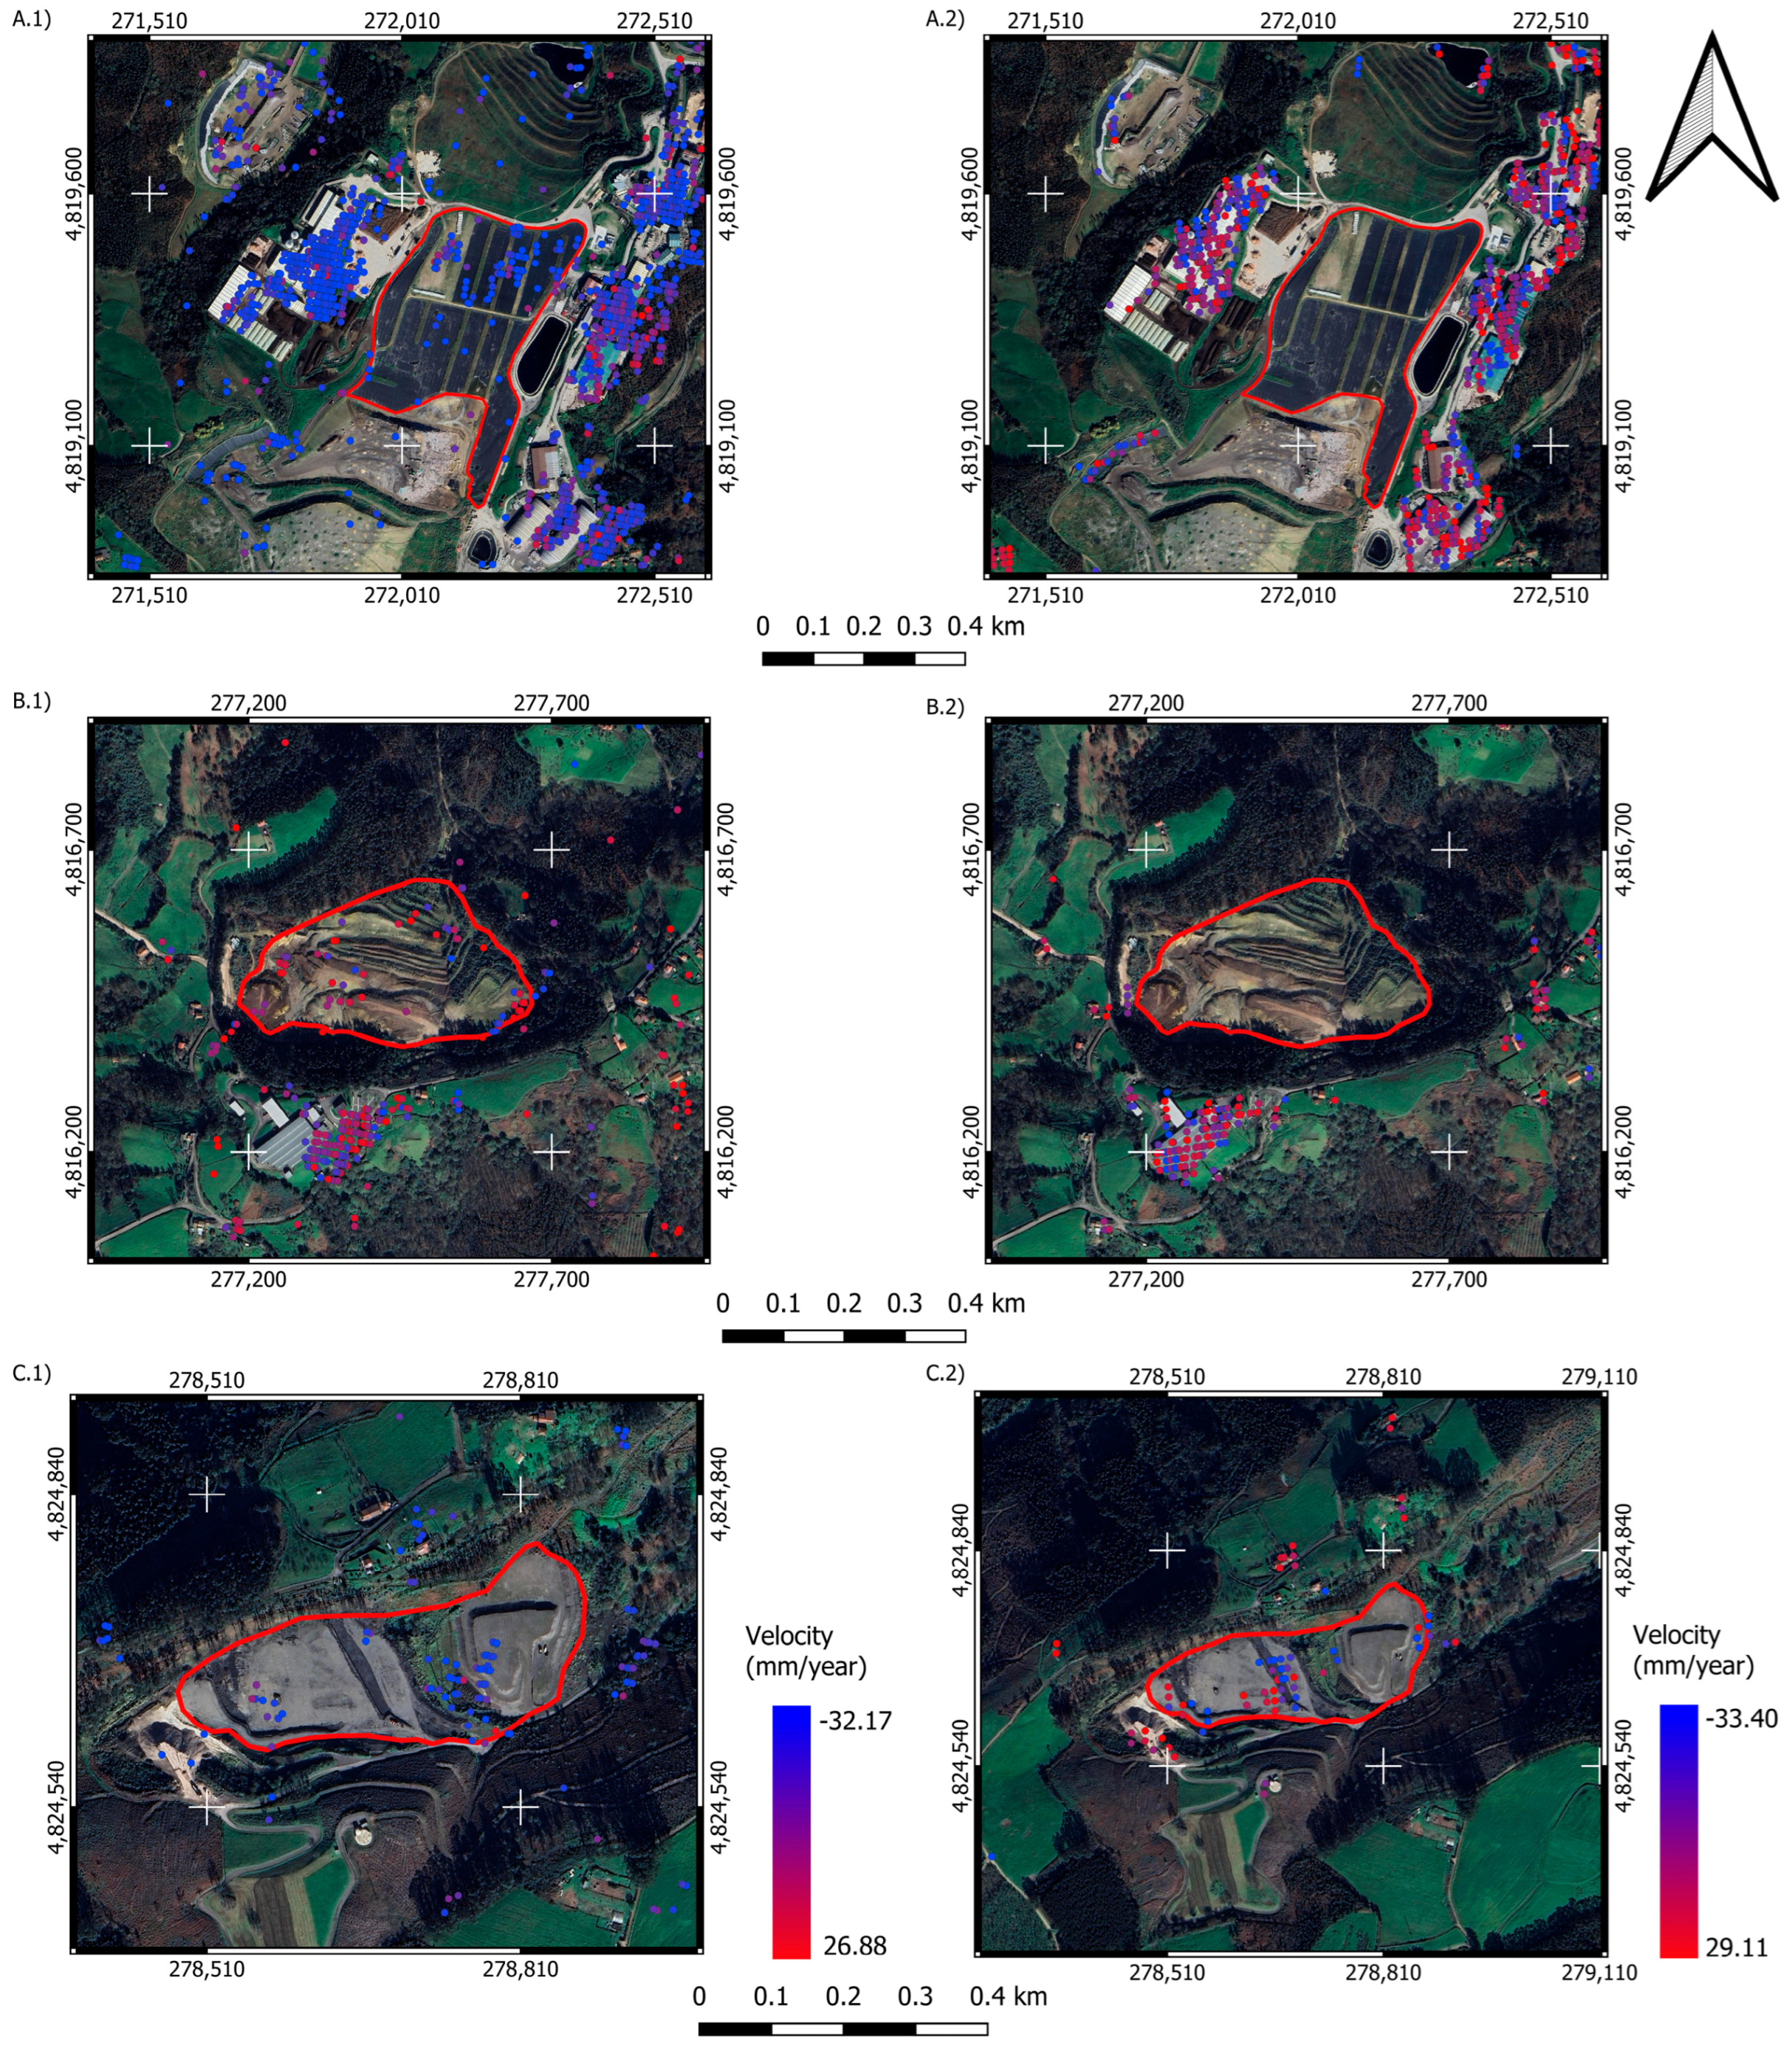
For this analysis aimed at detecting differences between the landfill and control PS groups, only the PSDefoPAT methodology was implemented. While EGMS provides validations at regional scale, PSDefoPAT operates directly on individual persistent scatterers, enabling focal analysis of specific zones. For the comparison between landfill and urban stable areas, PSDefoPAT is more appropriate as it allows point-to-point harmonic decomposition (trend, seasonality, residuals), avoiding the regional biases introduced by EGMS filters that can mask relevant local differences. Figure 9 and Figure 10 illustrate the spatial distribution of PS over the landfill areas for both ascending and descending orbits, comparing StaMPS results (left panels) with EGMS L2 products (right panels) using recent orthophotography as a reference (year 2023). The comparison shows a consistently higher PS density obtained with StaMPS, reflecting differences in processing chains and PS selection criteria. Despite the low coherence typical of landfill environments, the StaMPS-derived PS provide a representative spatial coverage within the landfill interiors, capturing zones affected by differential settlement. The analyses were performed within delineated areas inside the landfill bodies, ensuring that the comparison reflects internal conditions rather than edge effects. The prior validation of EGMS-StaMPS consistency (Figure 7) supports the robustness of this focal approach based on StaMPS data. The control group corresponds to the same set of PS points detected with StaMPS in the urban area of Gijón (Figure 6), which were also used for the validation against the EGMS dataset. For the landfill samples, a total of 138 PS points were utilized for sample 1, 38 for sample 2, and 40 for sample 3 in the ascending orbit (Figure 9). For the descending orbit, the respective numbers were 99 for sample 1, 36 for sample 2, and 48 for sample 3 (Figure 10). The reduced number of PS points in landfill areas relative to the urban control zone reflects the challenging coherence conditions inherent to waste environments. Landfill soils, composed of loose and temporally variable waste materials, produce rapid radar signal decorrelation, limiting the identification of PS candidates meeting coherence thresholds for reliable deformation analysis. This constraint is intrinsic to InSAR monitoring over non-consolidated terrain. Nevertheless, the retained sample sizes can be considered adequate for detecting significant deformation patterns through PSDefoPAT analysis.
In Figure 9 and Figure 10, panels display LOS velocity (mm/year) over the 2022 study period. Color bars include quantitative velocity intervals (min., 0, max.) with specific numerical values in the legend for enhanced interpretability. Color ramps are intended solely for qualitative spatial pattern comparison; direct metric equivalence between EGMS and StaMPS is not assumed due to differences in processing chains, PS selection, and different temporal origins (EGMS data (temporal origin January 2019; 2019–2022 collection, 2022 subset extracted) and StaMPS (2022-specific master date: 13 June 2022).

3.3. Monitoring of the Inactive Inert Landfill

For this analysis, statistical analyses were performed that included the Shapiro–Wilk normality test to detect stable distributions, variance calculation to identify possible fluctuations or instabilities, and temporal slope analysis to determine the magnitude and direction of movement, differentiating between residual settlement and active or accelerated movements.
All statistical analyses and model fitting were carried out using the open-source software R v. 4.5.2 (R Core Team), a widely used environment for statistical computing and graphics [46].

4. Results

4.1. Validation InSAR Time Series Data

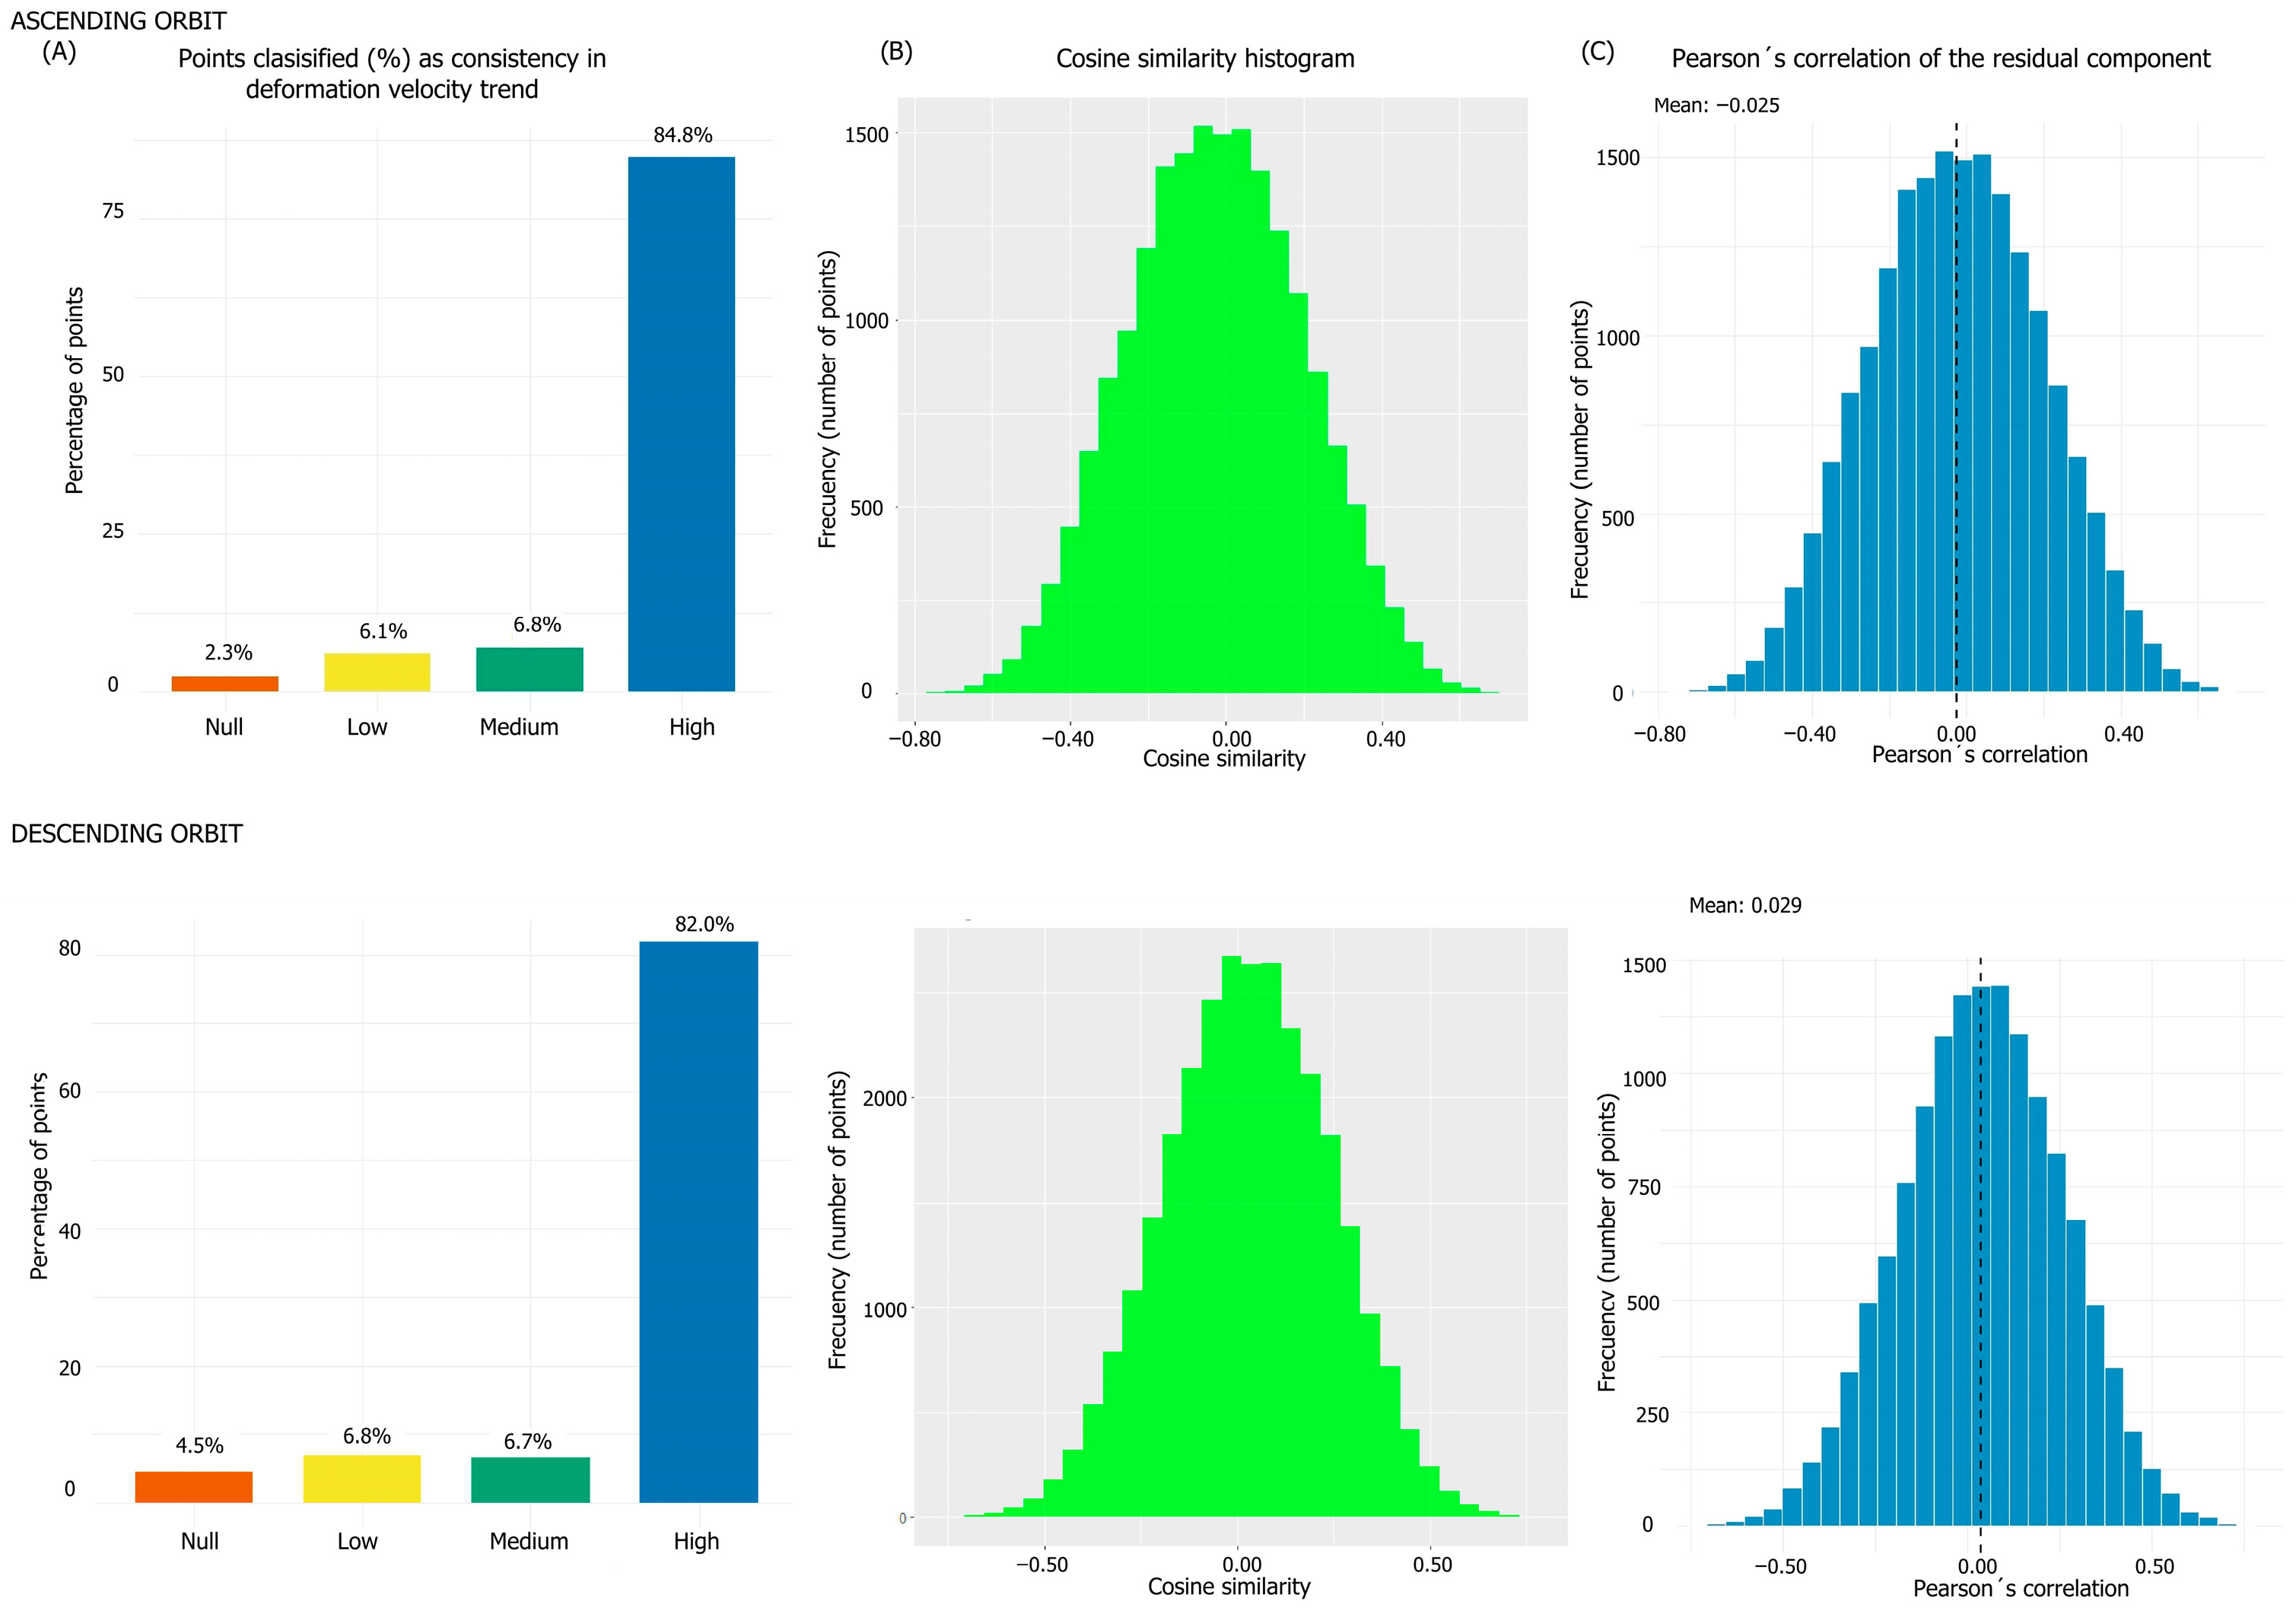
Statistical validation of point-to-point analysis (process 1) for ascending and descending orbits is shown in Figure 11, panel A, which displays the percentage of points classified by consistency in deformation velocity trend, showing a high degree of agreement with 84.8% of points at high validation level (p ≥ 0.10, two-sample t-test per EGMS protocol) for the ascending orbit and 82.0% for the descending orbit. Panel B presents the distribution of cosine similarity values for residuals, centered around zero with mean values of −0.025 for the ascending orbit and 0.029 for the descending orbit, indicating a lack of similarity between compared time series (values closer to zero). Panel C shows Pearson’s correlation histograms of the residual component, with mean values close to zero (Mean ASC: −0.025; Mean DESC: −0.015), confirming the structural independence of random noise between StaMPS and EGMS datasets, indicating that the two processing approaches do not introduce correlated noise artifacts.
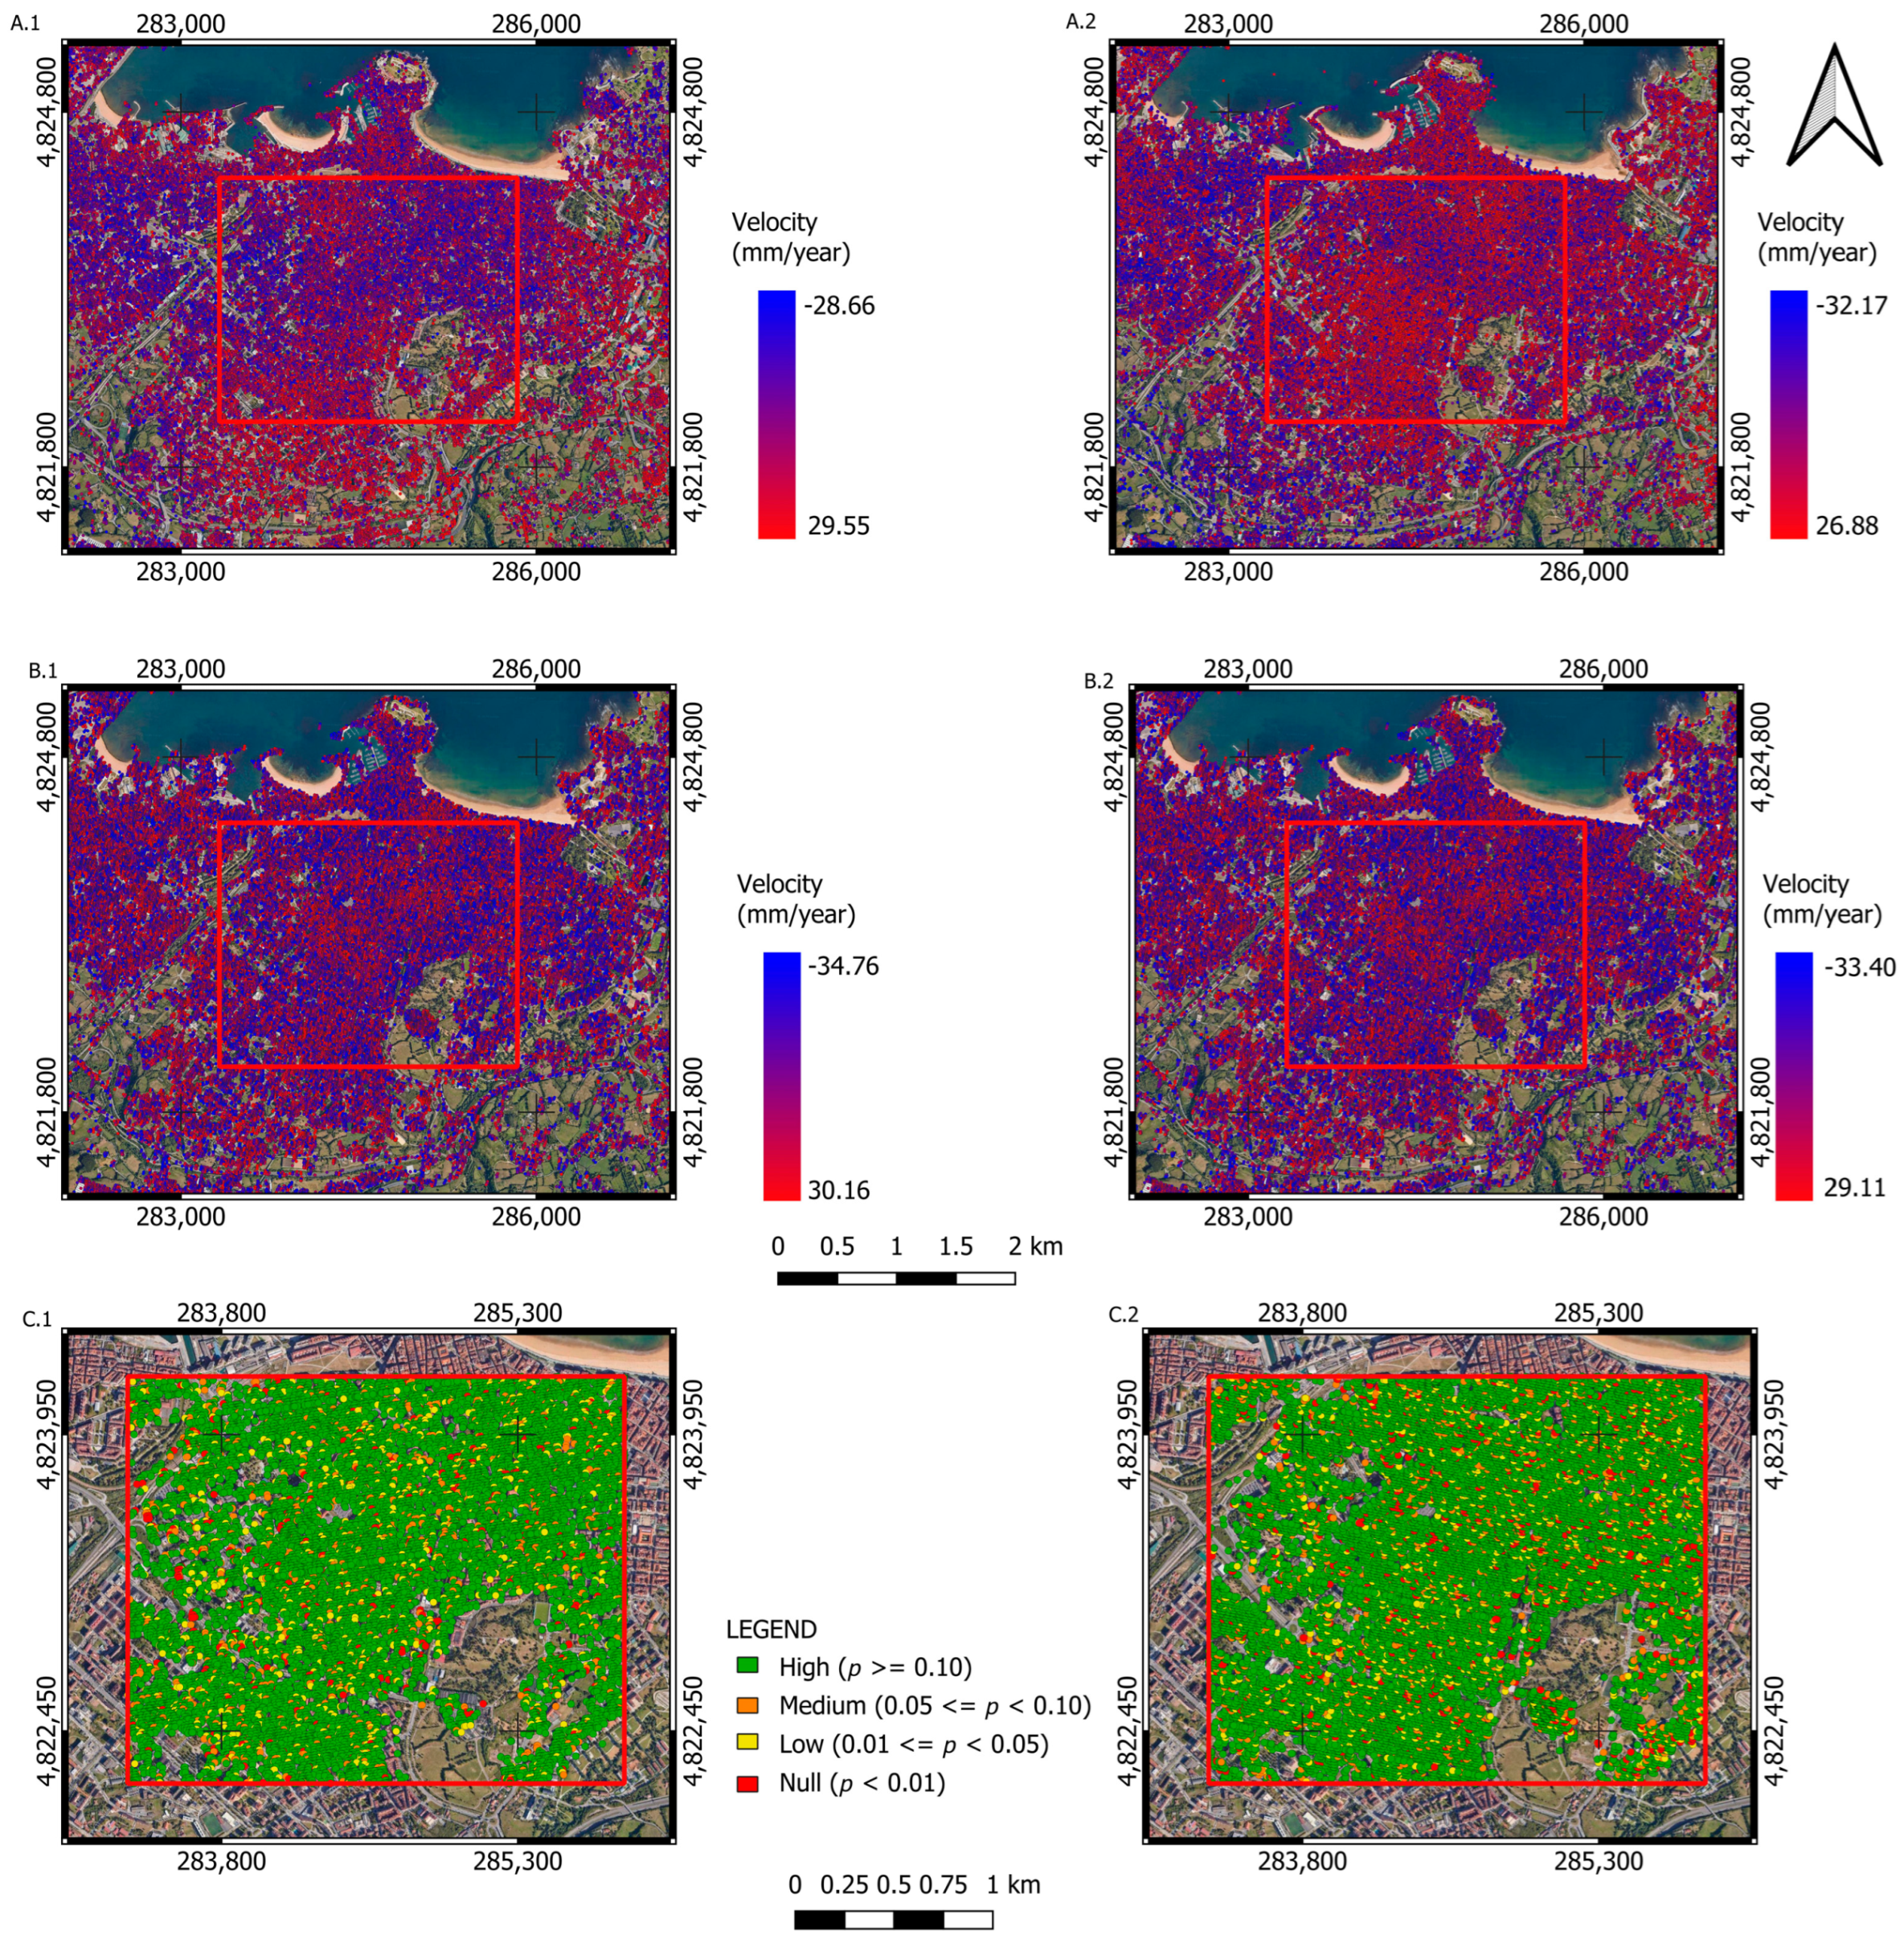
Figure 12 shows statistical validation of point-to-point analysis between EGMS product and StaMPS-processed Sentinel-1 InSAR datasets for ascending (left column: A.1, B.1, C.1) and descending (right column: A.2, B.2, C.2) orbits. Panels A.1 and A.2 display LOS deformation velocities (mm/year) derived from STAMPS, while B.1 and B.2 show corresponding EGMS reference velocities; color ramps span minimum (blue) to maximum (red) displacement values. Panels C.1 and C.2 illustrate consistency in deformation velocity trends across common points, revealing 84.8% high-validation agreement (p ≥ 0.10,) for ascending orbits and 82.0% for descending orbits. The secondary color scheme denotes p-value classifications: high (green, p > 0.10), medium (orange, 0.05 ≤ p < 0.10), low (yellow, 0.01 ≤ p < 0.05), and null (p < 0.01).
The PSDefoPAT quality analysis reinforced the reliability of the trend, as the Wilcoxon test did not identify significant differences in the absolute mean velocity between EGMS and StaMPS in either orbit (p = 1.0 in both cases), indicating that both datasets provide equivalent estimates of long-term deformation rates. However, Levene’s test was highly significant (p < 0.001 for both orbits), confirming that the residual variance of StaMPS is statistically different and lower than that of EGMS, probably indicating superior short-term signal cleanliness.

4.2. Deformation Patterns in Landfills

The results of the comparative analysis between the PS samples from each landfill and the control group, for the ascending and descending orbits, show statistically significant differences in the magnitude and stability of deformation according to the landfill type. These results highlight distinct deformation behaviors linked to operational status and landfill type. The active sanitary landfill (sample 1) exhibited significant deformation in the descending orbit, with a median absolute velocity nearly three times higher than the control (Wilcoxon, p < 2.2 × 10⁻¹⁶), whereas the ascending orbit did not detect anomalies (p = 0.6428), suggesting directional sensitivity in the observed deformation signal. The residual variance (Levene’s test) was significantly higher in both orbits (ASC: p = 0.0027; DESC: p = 2.5 × 10⁻⁵, indicating high instability consistent with heterogeneous and time-variable settlement driven by organic waste decomposition processes. The operational inert landfill (sample 2) showed consistent magnitude anomalies in both orbits (Wilcoxon, p < 0.001), indicating ongoing deformation characteristic of an actively operated facility. The increased instability detected in the descending orbit (p = 3.26 × 10⁻⁶) suggests anisotropic deformation behavior, potentially influenced by landfill geometry with respect to the acquisition orbit or compaction practices. Lastly, the closed inert landfill (sample 3) demonstrated stability in both orbits (Levene’s test, p≈0.74), with no significant differences in the deformation velocity. However, a small but significant residual deformation is observed in the descending orbit (Wilcoxon, p = 1.04 × 10⁻⁵), likely reflecting residual consolidation typical of post-closure settlement in inert landfills.
Interpretive criteria for landfill activity classification are based on standard statistical thresholds (α = 0.05). The Wilcoxon rank-sum test assesses deformation velocity differences between landfill PS and urban control groups, where p ≤ 0.05 indicates ‘anomaly detected’ (significant velocity deviation) and p > 0.05 indicates ‘no anomaly detected’. Levene’s test evaluates residual variance homogeneity, where p ≤ 0.05 indicates ‘instability detected’ (heterogeneous deformation patterns) and p > 0.05 indicates ‘stability detected’. These criteria enable robust classification of landfill operational status and geotechnical behavior, as detailed in Table 1.
The results of the comparative analysis between the PS samples from each landfill and the control group, for the ascending and descending orbits, show statistically significant differences in the magnitude and stability of deformation according to the landfill type. These results, summarized in Table 1, enable the clear identification of differences in the activity and geotechnical stability of the evaluated landfills. The Wilcoxon test assesses the centrality of deformation velocity (p ≤ 0.05 indicates anomaly detected, reflecting deviations in mean velocity), while the Levene test evaluates homogeneity of variances (p ≤ 0.05 indicates instability detected, signaling irregularity in deformation patterns); both metrics, as shown by the p-values in Table 1, classify landfills by activity and risk based on robust statistical tests (Wilcoxon and Levene). Together, these robust statistical indicators allow for the classification of landfills according to their deformation behavior and potential risk, underscoring the value of InSAR as a monitoring tool for landfill stability assessment.
Table 1. Results of the statistical comparison between Persistent Scatterer (PSs) deformation velocities within landfill areas and the control group for ascending (ASC) and descending (DESC) orbits.
SampleOrbitWilcoxon
p-Value
ImplicationLevene
p-Value
Implication
Sample 1
(sanitary)
Ascending0.628No anomaly detected0.0027Instability detected
Descending2.2 × 10−16Anomaly
detected
2.5 × 10⁻⁵Instability detected
Sample 2
(operational inert)
Ascending2.97 × 10−11Anomaly detected0.7404Stability
detected
Descending1.35 × 10−8Anomaly
detected
3.26 × 10⁻⁶Instability detected
Sample 3
(closed inert)
Ascending0.6229No anomaly detected0.7461Stability detected
Descending1.04 × 10−5Anomaly detected0.7293Stability detected
Notes:
  • Wilcoxon p-value: Indicates whether there are significant differences in the magnitude of deformation velocity compared to the control group.
  • Levene p-value: Reflects whether there is a difference in residual variability, associated with greater or lesser stability.

4.3. Monitoring of the Inactivity Inert Landfill

The statistical analyses conducted indicate that the six studied points (from the sensor network, Figure 5) exhibited normal distributions with p-values exceeding 0.05 (0.167–0.950), indicating stability and absence of anomalous disturbances. Variances across all points were consistently low (6 × 10⁻⁶ to 15 × 10−5), reflecting minimal dispersion and a lack of significant dynamic fluctuations. Based on the relative displacement data presented in the sensor network, negative slopes dominated the measurement period from June 2019 to December 2020, characteristic of slow, cumulative movements due to residual settlement in closed landfills. This systematic decrease in incremental displacements reflects the progressive stabilization of the monitored system, where post-closure deformations gradually diminished over time. The subsequent period (December 2020 onwards) exhibited near-zero slopes with minimal displacement values, indicating that the settlement process had reached equilibrium. The isolated positive slope observed in Sensor 6 during December 2021 represents a localized anomaly rather than a system-wide behavior, confirming that the overall trend is consistent with expected post-closure consolidation dynamics in waste containment structures.

5. Discussion

The validation of the InSAR-derived deformation time series against the European Ground Movement Service (EGMS) dataset has demonstrated strong consistency. The analysis shows that deformation trends coincide in the majority of points (>82%), validating that both methods effectively capture ground movement. The statistical independence of the residuals (close to zero for both cosine similarity and Pearson’s correlation) confirms that noise or errors are method-specific and not shared. This combination of high agreement in deformation velocity trends and uncorrelated residual behavior indicates that the observed deformation signals are robust and physically meaningful, rather than artifacts of a particular processing strategy. These findings support the use of EGMS as a reliable external reference for validating InSAR-derived time series and confirm that the applied processing methodology accurately retrieves ground deformation. The PSDefoPAT quality analysis confirmed the reliability of these trends by detecting no significant differences in the absolute mean velocity between EGMS and StaMPS (Wilcoxon, p = 1.0). However, Levene’s test revealed a significantly lower residual variance in StaMPS (p < 0.001), suggesting better short-term signal stability and reduced residual noise in StaMPS compared to EGMS. This implies that while both methods effectively capture the main deformation behavior, StaMPS may offer a cleaner and more stable signal for detailed movement analysis, particularly in applications requiring high temporal fidelity or localized deformation assessment.
In the deformation analysis of landfill samples, the assessment of residual variance homogeneity using Levene’s test provided a clear distinction between zones of stability and instability among the landfill types (Table 1). In the active landfill (sample 1), the significantly low p-values indicate elevated residual variability, revealing pronounced instability and ongoing internal dynamic processes related to organic waste degradation and heterogeneous settlement. These characteristics are typical of active sanitary landfills and confirm the sensitivity of InSAR-derived residual metrics. In contrast, the inert operational landfill presented moderate anomalies characteristic of the influence of heavy machinery activity in stockpiling, spreading and compaction of materials. Although inert waste does not undergo significant biochemical degradation, operational practices introduce short-term and spatially variable deformation signals that can be captured by the residual variance analysis. The closed inert landfill showed overall stability with residual anomalies characteristic of the settlement and consolidation process and the results of the sensor network for monitoring this landfill, can be confidently concluded that is effectively inactive from a geotechnical perspective. These findings validate the effectiveness of combined InSAR methodologies for the accurate characterization of landfill deformation dynamics, offering a reliable tool for environmental monitoring and risk assessment.
The variability observed between ascending and descending orbits in the landfill analysis reflects how satellite observation geometry and the predominant direction of settlements and internal movements condition the detectability of anomalies and residual stability. In contrast to urban areas, where both orbits provide coherent and stable results due to the greater homogeneity and orientation of PSs as well as the uniformity of the deformation patterns, landfills display much higher spatial and dynamic heterogeneity. Processes such as differential subsidence, compaction, and waste degradation may manifest preferentially in directions that are better captured by one orbit than the other. Additionally, local factors like landfill orientation, slope geometry, surface roughness and humidity conditions can affect the sensitivity of certain orbital geometries to specific movements [16]. Therefore, the combined analysis of both orbits is fundamental for a precise and robust characterization of risks and deformation dynamics at these sites. The integration of multi-orbit InSAR observations enables a more complete interpretation of both magnitude and stability of ground movements, reinforcing the effectiveness of combined InSAR methodologies as reliable tools for landfill monitoring, environmental management, and risk assessment.

6. Conclusions

The application of InSAR time series analysis enabled the robust detection and characterization of deformation dynamics in distinct landfill typologies, clearly differentiating between active sanitary, operational inert, and closed inert landfills. Validation and quality assessment of StaMPS and EGMS datasets demonstrated a high degree of statistical consistency in deformation velocity trends, with the majority of sampling points achieving a high validation level, and confirmed the statistical independence of transient signals through near-zero mean residual correlations and cosine similarity metrics. Comparative statistical tests (Wilcoxon and Levene) revealed significant differences in deformation magnitudes and stability among landfill types: active sanitary landfills displayed pronounced settlement rates and elevated instability linked to ongoing organic decomposition and leachate generation; operational inert landfills exhibited moderate deformation anomalies primarily attributable to machinery-induced activity; and closed inert landfills evidenced overall geotechnical stability, supported by both remote sensing results and in situ sensor network data.
To effectively implement InSAR-based technology for identifying potential locations of unauthorized or illegal landfills, it is crucial to consider the spatial proximity of detected Persistent Scatterers (PS) that present deformation characteristics compatible with landfill activity. The presence of isolated PS points showing anomalous deformation does not, by itself, permit reliable geolocation of illegal dumping sites; however, the existence of a cluster of multiple anomalous PS points within a limited spatial area significantly increases the likelihood of correctly identifying and confirming these sites. Therefore, clustering analysis of spatially related PS detections should be systematically integrated into the monitoring workflow to improve the operational reliability, reduce false positives and support the prioritization of field inspections.
In conclusion, InSAR-based monitoring methodologies can be considered complementary tools to traditional in situ inspection strategies, both for the control and monitoring of authorized landfills and for the detection of unauthorized or illegal ones, providing greater efficiency and coverage capacity. The integration of detected deformation patterns with cadastral datasets, land-use information, and protected-area inventories can further strengthen decision-making processes, enabling authorities to optimize surveillance efforts, prioritize inspections, and improve environmental risk management.

Author Contributions

Conceptualization, Cristina Allende-Prieto and David Álvarez-Fuertes; methodology, Cristina Allende-Prieto; software, Cristina Allende-Prieto; validation, Cristina Allende-Prieto and David Álvarez-Fuertes; formal analysis, Cristina Allende-Prieto and Pablo Rodríguez-Gonzálvez; investigation, Cristina Allende-Prieto and Pablo Rodríguez-Gonzálvez; resources, Cristina Allende-Prieto and David Álvarez-Fuertes; data curation, Cristina Allende-Prieto and Pablo Rodríguez-Gonzálvez; writing—original draft preparation, Cristina Allende-Prieto; writing—review and editing, Cristina Allende-Prieto, Pablo Rodríguez-Gonzálvez and Raquel Perdiguer-Lopez; visualization, Cristina Allende-Prieto and Raquel Perdiguer-Lopez; supervision, Cristina Allende-Prieto; project administration, Cristina Allende-Prieto; funding acquisition, David Álvarez-Fuertes. All authors have read and agreed to the published version of the manuscript.

Funding

This work was supported by the Economic Development Institute of the Principality of Asturias under Grant IDE/2018/000400 and IDE/2022/000472, by the Ministry of Industry, Commerce and Tourism of the Government of Spain under grant AEI-010500-2023-72, and by the City Council of Gijón and the University Institute of Industrial Technology of Asturias, Spain (IUTA) under grant SV-22-GIJON-09.

Data Availability Statement

The results presented in this study are openly available in Zenodo at DOI: https://doi.org/10.5281/zenodo.18187548 (accessed on 9 January 2026).

Acknowledgments

The authors would like to express their gratitude to the company EXCADE S.L. and EXCADE Chair of University of Oviedo, for their valuable support and contribution.

Conflicts of Interest

The authors declare the following financial interests/personal relationships which may be considered as potential competing interests: David Alvarez-Fuertes reports financial support was provided by Government of Principality of Asturias. The other authors declare that they have no known competing financial interests or personal relationships that could have appeared to influence the work reported in this paper. The funders had no role in the design of the study; in the collection, analyses, or interpretation of data; in the writing of the manuscript; or in the decision to publish the results.

References

  1. Voukkali, I.; Papamichael, I.; Loizia, P.; Zorpas, A.A. Urbanization and Solid Waste Production: Prospects and Challenges. Environ. Sci. Pollut. Res. 2024, 31, 17678–17689. [Google Scholar] [CrossRef]
  2. Steffan, J.J.; Brevik, E.C.; Burgess, L.C.; Cerdà, A. The Effect of Soil on Human Health: An Overview. Eur. J. Soil Sci. 2018, 69, 159–171. [Google Scholar] [CrossRef]
  3. Siddiqua, A.; Hahladakis, J.N.; Al-Attiya, W.A.K.A. An Overview of the Environmental Pollution and Health Effects Associated with Waste Landfilling and Open Dumping. Environ. Sci. Pollut. Res. 2022, 29, 58514–58536. [Google Scholar] [CrossRef]
  4. Allende Prieto, C. Evaluation of Environmental Pollution Due to Dust from Areas Designated for Landfills and Spoil Banks, Using Real Three-Dimensional Models Obtained by Cartographic Techniques and Computational Models. Ph.D. Thesis, Universidad de Oviedo, Oviedo, Spain, 2010. [Google Scholar]
  5. Hu, W.; Yu, Y. Modelling of Leachate Leakage and Contaminant Migration Through Municipal Solid Waste Landfill Liner Systems. In International Association for Engineering Geology and the Environment; Springer Nature: Singapore, 2023; pp. 321–329. [Google Scholar] [CrossRef]
  6. Sarmah, P.; Katsumi, T.; Yamawaki, A.; Takai, A.; Omine, K.; Ishiguro, T.; Doi, Y.; Nakase, Y.; Ideguchi, S. Physical and mechanical properties of waste ground at inert waste landfills. Waste Manag. 2021, 132, 1–11. [Google Scholar] [CrossRef]
  7. European Commission. Waste: Commission Decides to Refer Spain to the Court of Justice of the European Union for Failure to Apply the Waste Management Requirements, 2024. Available online: https://ec.europa.eu/commission/presscorner/detail/en/ip_24_266 (accessed on 22 March 2026).
  8. Ozbay, G.; Jones, M.; Gadde, M.; Isah, S.; Attarwala, T. Design and Operation of Effective Landfills with Minimal Effects on the Environment and Human Health. J. Environ. Public Health 2021, 2021, 6921607. [Google Scholar] [CrossRef] [PubMed]
  9. Kjeldsen, P.; Barlaz, M.A.; Rooker, A.P.; Baun, A.; Ledin, A.; Christensen, T.H. Present and Long-Term Composition of MSW Landfill Leachate: A Review. Crit. Rev. Environ. Sci. Technol. 2002, 32, 297–336. [Google Scholar] [CrossRef]
  10. Cicala, L.; Gargiulo, F.; Parrilli, S.; Amitrano, D.; Pigliasco, G. Progressive Monitoring of Micro-Dumps Using Remote Sensing: An Applicative Framework for Illegal Waste Management. Sustainability 2024, 16, 5695. [Google Scholar] [CrossRef]
  11. Yaashikaa, P.R.; Kumar, P.S.; Nhung, T.C.; Hemavathy, R.V.; Jawahar, M.J.; Neshaanthini, J.P.; Rangasamy, G. A Review on Landfill System for Municipal Solid Wastes: Insight into Leachate, Gas Emissions, Environmental and Economic Analysis. Chemosphere 2022, 309, 136627. [Google Scholar] [CrossRef] [PubMed]
  12. El-Fadel, M.; Khoury, R. Modeling settlement in MSW landfills: A critical review. Crit. Rev. Environ. Sci. Technol. 2000, 30, 327–361. [Google Scholar] [CrossRef]
  13. Somasundaram, S.; Khilnani, K.; Shenthan, T.; Irvine, J. Characterization and Settlement Modeling of Deep Inert Debris Fills. In Proceedings of the 18th International Conference on Soil Mechanics and Geotechnical Engineering, Paris, France, 2–6 September 2013; pp. 619–622. [Google Scholar]
  14. Environment Agency. Landfills for Inert Waste; Environment Agency: Bristol, UK, 2020. [Google Scholar]
  15. Kuenzer, C.; Dech, S.; Wagner, W. Remote sensing time series revealing land surface dynamics: Status quo and the pathway ahead. In Remote Sensing Time Series: Revealing Land Surface Dynamics; Springer International Publishing: Cham, Switzerland, 2015; pp. 1–24. [Google Scholar] [CrossRef]
  16. Papale, L.G.; Guerrisi, G.; De Santis, D.; Schiavon, G.; Del Frate, F. Satellite Data Potentialities in Solid Waste Landfill Monitoring: Review and Case Studies. Sensors 2023, 23, 3917. [Google Scholar] [CrossRef]
  17. Mvula, R.L.S.; Banda, Y.M.; Njunju, M.A.; Tholo, H.M.; Chisenga, C.; Nyengere, J.; Njalam’mano, J.; Eregno, F.E.; Kadewa, W. Mapping Illegal Dumping Sites in a Low-Resource Region Using GIS and Remote Sensing: The Case of Blantyre City, Malawi. Urban Sci. 2025, 9, 254. [Google Scholar] [CrossRef]
  18. Samadzadegan, F.; Toosi, A.; Dadrass Javan, F. A critical review on multi-sensor and multi-platform remote sensing data fusion approaches: Current status and prospects. Int. J. Remote Sens. 2025, 46, 1327–1402. [Google Scholar] [CrossRef]
  19. Dong, Y.; Nava, L.; Palamà, R.; Monserrat, O.; Festa, D.; Floris, M.; Catani, F. Improving Ground Deformation Classification by Integrating InSAR Time Series with Geospatial Information. IEEE Trans. Geosci. Remote Sens. 2025, 63, 4709412. [Google Scholar] [CrossRef]
  20. Pepe, A.; Calò, F. A Review of Interferometric Synthetic Aperture RADAR (InSAR) Multi-Track Approaches for the Retrieval of Earth’s Surface Displacements. Appl. Sci. 2017, 7, 1264. [Google Scholar] [CrossRef]
  21. Qin, X.; Huang, Y.; Wang, C.; Jiang, K.; Xie, L.; Liu, R.; Shi, X.; Chen, X.; Zhang, B. A Temporary Soil Dump Settlement and Landslide Risk Analysis Using the Improved Small Baseline Subset-InSAR and Continuous Medium Model. Int. J. Appl. Earth Obs. Geoinf. 2024, 128, 103760. [Google Scholar] [CrossRef]
  22. Osmanoğlu, B.; Sunar, F.; Wdowinski, S.; Cabral-Cano, E. Time Series Analysis of InSAR Data: Methods and Trends. ISPRS J. Photogramm. Remote Sens. 2016, 115, 90–102. [Google Scholar] [CrossRef]
  23. Crosetto, M.; Monserrat, O.; Cuevas-González, M.; Devanthéry, N.; Crippa, B. Persistent Scatterer Interferometry: A Review. ISPRS J. Photogramm. Remote Sens. 2016, 115, 78–89. [Google Scholar] [CrossRef]
  24. Ansar, A.M.H.; Din, A.H.M.; Latip, A.S.A.; Reba, M.N.M. A Short Review on Persistent Scatterer Interferometry Techniques for Surface Deformation Monitoring. Int. Arch. Photogramm. Remote Sens. Spat. Inf. Sci. 2022, 46, 23–31. [Google Scholar] [CrossRef]
  25. Giorgini, E.; Orellana, F.; Arratia, C.; Tavasci, L.; Montalva, G.; Moreno, M.; Gandolfi, S. InSAR Monitoring Using Persistent Scatterer Interferometry (PSI) and Small Baseline Subset (SBAS) Techniques for Ground Deformation Measurement in Metropolitan Area of Concepción, Chile. Remote Sens. 2023, 15, 5700. [Google Scholar] [CrossRef]
  26. Hanssen, R.F. Radar Interferometry; Remote Sensing and Digital Image Processing; Springer: Dordrecht, The Netherlands, 2001; Volume 2, ISBN 978-0-7923-6945-5. [Google Scholar]
  27. NASA Earthdata. Sentinel-1. Available online: https://www.earthdata.nasa.gov/data/platforms/space-based-platforms/sentinel-1 (accessed on 26 December 2025).
  28. ICEYE. Single Look Complex Image—Product Documentation. Available online: https://sar.iceye.com/5.0/productFormats/slc/ (accessed on 26 December 2025).
  29. ISCE Framework Developers. ISCE2: InSAR Scientific Computing Environment, Version 2.7.0; California Institute of Technology: Pasadena, CA, USA, 2023. Available online: https://github.com/isce-framework/isce2 (accessed on 6 April 2026).
  30. Terradue. StaMPS Permanent Scatterer Processing—Geohazards Thematic Exploitation Platform 2.1 Documentation. Available online: https://terradue.github.io/doc-tep-geohazards-v2/tutorials/stamps-ps.html (accessed on 26 December 2025).
  31. Farías, C.A.; Lenardón Sánchez, M.; Bonì, R.; Cigna, F. Statistical and Independent Component Analysis of Sentinel-1 InSAR Time Series to Assess Land Subsidence Trends. Remote Sens. 2024, 16, 4066. [Google Scholar] [CrossRef]
  32. Costantini, M.; Minati, F.; Trillo, F.; Ferretti, A.; Novali, F.; Passera, E.; Dehls, J.; Larsen, Y.; Marinkovic, P.; Eineder, M.; et al. European Ground Motion Service (EGMS). In Proceedings of the 2021 IEEE International Geoscience and Remote Sensing Symposium (IGARSS), Brussels, Belgium, 11–16 July 2021; pp. 3293–3296. [Google Scholar] [CrossRef]
  33. Crosetto, M.; Solari, L.; Mróz, M.; Balasis-Levinsen, J.; Casagli, N.; Frei, M.; Oyen, A.; Moldestad, D.A.; Bateson, L.; Guerrieri, L.; et al. The Evolution of Wide-Area DInSAR: From Regional and National Services to the European Ground Motion Service. Remote Sens. 2020, 12, 2043. [Google Scholar] [CrossRef]
  34. Rosen, P.A.; Gurrola, E.M.; Agram, P.; Cohen, J.; Lavalle, M.; Riel, B.V.; Fattahi, H.; Aivazis, M.A.G.; Simons, M.; Buckley, S.M. The InSAR Scientific Computing Environment 3.0: A Flexible Framework for NISAR Operational and User-Led Science Processing. In Proceedings of the IGARSS 2018—2018 IEEE International Geoscience and Remote Sensing Symposium, Valencia, Spain, 22–27 July 2018; pp. 4897–4900. [Google Scholar] [CrossRef]
  35. Gurrola, E.; Rosen, P.A.; Sacco, G.F.; Szeliga, W.; Zebker, H.; Simons, M.; Sandwell, D.; Shanker, P.; Wortham, C.; Chen, A. InSAR Scientific Computing Environment. In Proceedings of the 2010 American Geophysical Union Meeting, San Francisco, CA, USA, 13–17 December 2010. [Google Scholar]
  36. Hooper, A.; Bekaert, D.; Hussain, E.; Spaans, K. StaMPS/MTI Manual Version 4.1b. 2018. Available online: https://github.com/dbekaert/StaMPS (accessed on 26 December 2025).
  37. Hrysiewicz, A.; Wang, X.; Holohan, E.P. EZ-InSAR: An Easy-to-Use Open-Source Toolbox for Mapping Ground Surface Deformation Using Satellite Interferometric Synthetic Aperture Radar. Earth Sci. Inform. 2023, 16, 1929–1945. [Google Scholar] [CrossRef]
  38. AlexisInSAR. EZ-InSAR: Easy InSAR. Available online: https://github.com/alexisInSAR/EZ-InSAR (accessed on 26 December 2025).
  39. Álvarez Fuertes, D.; Martínez Álvarez, D. Development of a System for the Monitoring and Predictive Analysis of the Stability of Slopes, Landfills, and Structures. In Proceedings of the 3rd Research, Development and Innovation Conference in Civil Engineering (JIDIIC2020); Escuela Politécnica de Mieres, University of Oviedo: Mieres, Spain, 2020. [Google Scholar]
  40. Crosetto, M.; Solari, L.; Moldestad, D.A.; Oyen, A.; Ministerie van Infrastructuur en Waterstaat. COPERNICUS Land Monitoring Service: Validation of the EGMS Product Portfolio. Copernicus Land Monitoring Service 2023. Available online: https://land.copernicus.eu/user-corner/technical-library/validation-approach-of-the-egms-product-portfolio (accessed on 8 January 2026).
  41. Vradi, A.; Sala, J.; Solari, L.; Balasis-Levinsen, J. Validating the European Ground Motion Service: An Assessment of Measurement Point Density. Int. Arch. Photogramm. Remote Sens. Spat. Inf. Sci. 2023, 48, 247–252. [Google Scholar] [CrossRef]
  42. Copernicus: Sentinel-1—EoPortal. Available online: https://www.eoportal.org/satellite-missions/opernicus-sentinel-1 (accessed on 26 December 2025).
  43. ElGharbawi, T.; Tamura, M. Increasing Spatial Coverage in Rough Terrain and Vegetated Areas Using InSAR Optimized Pixel Selection: Application to Tohoku, Japan. Geo-Spat. Inf. Sci. 2022, 25, 295–311. [Google Scholar] [CrossRef]
  44. Calero, J.S.; Vöge, M.; Martins, J.E.; Raucoules, D.; De Michelle, M.; Vradi, A.; Vecchiotti, F.; Solari, L. EGMS Validation Methodologies and Procedures. European Commission Report, 2023. Available online: https://land.copernicus.eu/en/technical-library/validation-methodologies-and-procedures/ (accessed on 26 December 2025).
  45. Evers, M.; Thiele, A.; Hammer, H.; Hinz, S. PSDefoPAT—Persistent Scatterer Deformation Pattern Analysis Tool. Remote Sens. 2023, 15, 4646. [Google Scholar] [CrossRef]
  46. R Project. The R Project for Statistical Computing. Available online: https://www.r-project.org/ (accessed on 26 December 2025).
Figure 1. Location of the study area and location of landfill samples in the municipality of Gijón (Principality of Asturias), NW Spain. EPSG 25830 (SIGNA, accessed 2026).
Ijgi 15 00168 g001
Figure 2. Detailed geographical representation of landfill sites (samples 1, 2, and 3) at enlarged scale. EPSG 25830 (SIGNA, accessed 2026).
Ijgi 15 00168 g002
Figure 3. Coarse network of interferograms and the reference dates selected (A) for the ascending orbit; (B) for the descending orbit. The Y-axis represents the perpendicular baseline (Bperp) in meters, which indicates the perpendicular separation between satellite orbits for each SAR acquisition pair relative to the selected reference date.
Ijgi 15 00168 g003
Figure 4. Sensor installation in ‘sample 3′ area.
Ijgi 15 00168 g004
Figure 5. Sensor network geographical location (A) and temporal displacement data (B) from June 2019 to December 2022, showing six ground-based sensors monitoring ground deformation across the study area (sample 3) (SIGNA, accessed 2026).
Ijgi 15 00168 g005
Figure 6. Geographical representation of control points in the urban zone for validating InSAR time series data. EPSG 25830 (SIGNA, accessed 2026).
Ijgi 15 00168 g006
Figure 7. InSAR time series validation: StaMPS versus EGMS displacement comparison across three random points (AC) with decomposed harmonic models and velocity trends for ascending orbit data.
Ijgi 15 00168 g007
Figure 8. Decomposition of displacement time series using PSDefoPAT framework. Panel (A) shows original velocity data from EGMS and StaMPS. Panel (B) displays the linear deformation velocity trend. Panel (C) presents the seasonal component. Panel (D) shows the residual variations.
Ijgi 15 00168 g008
Figure 9. Ascending orbit. Spatial distribution of persistent scatterers (PS) across the three landfills comparing StaMPS processing (left panels: (A.1C.1)) with EGMS L2 (right panels: (A.2C.2)). Red polygons delineate main landfill bodies (A-Sample 1; B-Sample 2; C-Sample 3). Colors show minimum (blue) and maximum (red) LOS velocities (mm/yr). EPSG 25830 (SIGNA, accessed 2026).
Ijgi 15 00168 g009
Figure 10. Descending orbit. Spatial distribution of persistent scatterers (PS) across the three landfills comparing StaMPS processing (left panels: (A.1C.1)) with EGMS L2 (right panels: (A.2C.2)). Red polygons delineate main landfill bodies (A-Sample 1; B-Sample 2; C-Sample 3). Colors show minimum (blue) and maximum (red) LOS velocities (mm/yr). EPSG 25830 (SIGNA, accessed 2026).
Ijgi 15 00168 g010
Figure 11. Statistical validation of deformation velocity trend consistency and residual analysis for ascending and descending orbits.
Ijgi 15 00168 g011
Figure 12. Point-to-Point Validation of STAMPS (left panels: (A.1C.1))vs. EGMS (right panels: (A.2C.2)) LOS Velocities: ascending and descending Orbits. EPSG 25830. (SIGNA, accessed 2026).
Ijgi 15 00168 g012
Disclaimer/Publisher’s Note: The statements, opinions and data contained in all publications are solely those of the individual author(s) and contributor(s) and not of MDPI and/or the editor(s). MDPI and/or the editor(s) disclaim responsibility for any injury to people or property resulting from any ideas, methods, instructions or products referred to in the content.