


Abstract
The identification of senior residential concentrations requires geospatial methods that combine fine-scale population modeling with robust uncertainty assessment. This study introduces NORC-SIMCLUST, a framework that integrates dasymetric disaggregation of senior households with density-based clustering and stability confidence measures derived from simulation runs and parameter sweeps. The method creates synthetic microdata by allocating census block senior household counts to residential parcels using housing-unit information, then estimates cluster stability through repeated simulations. By addressing data sparsity and spatial analysis pitfalls inherent in aggregated areal approaches, our work improves reliability and enables the detection of both horizontal and vertical NORCs—an underexplored geospatial challenge. A case study in Colorado Springs, USA, demonstrates enhanced detection reliability and confidence assessment compared to conventional heuristics. This work advances geospatial analytics for aging-in-place research and planning by providing a scalable, reproducible pipeline for demographic simulation, spatial clustering, and uncertainty analysis.
1. Introduction
The global demographic landscape is undergoing a significant transformation, with aging populations becoming a hallmark of the century. According to the United Nations, by 2050, one in six people worldwide will be over the age of 65, compared to one in eleven in 2029 [1]. This demographic shift will reshape neighborhoods, housing markets, and the way communities function.
Understanding where older adults live at fine spatial scales and how those concentrations form and persist is central to aging-in-place geospatial analytics. Yet, most operational workflows still rely on coarse administrative aggregates or residential proxies, obscuring the micro-geographies that planners, service providers, and researchers need to see. Within this methodological gap, Naturally Occurring Retirement Communities (NORCs), areas or buildings not purpose-built for older adults but that evolve to house a high share of them, offer a powerful lens for studying aging-in-place [2,3,4]. NORCs matter because they are empirical phenomena as much as policy constructs; they emerge in response to local housing markets, senior residency preferences, neighborhood amenities, and social networks, and thus demand spatially explicit detection and validation [5,6].
Despite decades of conceptual work on NORCs and promising demonstrations with supportive service programs, identification remains inconsistent and under-standardized [3]. Qualitative approaches (e.g., case studies, occupancy reviews, key-informant interviews) yield rich context but are resource-intensive, subjective, and hard to scale [7,8,9,10,11]. Quantitative methods such as census-based GIS overlays and spatial clustering offer greater objectivity and broad coverage. However, their effectiveness is limited by coarse data granularity, since block-group or tract summaries rarely capture parcel-level detail. In addition, these approaches depend heavily on predefined areal units and neighborhood concepts, making cluster results unreliable and suffering from residential misalignment [12,13,14]. Recent advances in dasymetric mapping have largely focused on allocating the general population rather than age-specific groups, and they still tend to produce only coarse approximations of the residential fabric [15,16,17,18,19,20,21]. A rigorous, systematic geospatial approach for effectively identifying these communities at the parcel or housing-unit level is still lacking.
This paper addresses those limitations by introducing NORC-SIMCLUST, a geospatial framework operated by dasymetric modeling simulation and cluster analysis with stability confidence measures for identifying NORCs. The framework advances three methodological fronts:
- Fine-scale senior population disaggregation via dasymetric modeling. We downscale senior household counts from census blocks to residential housing units. Dasymetric modeling replaces uniform areal assumptions with actual residential housing allocation, producing synthetic senior household microdata suitable for parcel and housing-unit-level analytics.
- Robust spatial clustering with stability confidence measures. We detect concentration patterns using noise-resistant clustering with parameter optimization and evaluate their stability across simulation runs. This process yields both cluster-level footprint stability measures and parcel-level participation confidence measures of membership stability across simulations, transforming detected concentrations into inference-ready parcel groups rather than heuristic visuals.
- NORC characterization across forms and scales. We profile detected clusters with structural indicators (e.g., share of residential parcels, proportion of senior households, prevalence of multi-unit buildings) to distinguish horizontal NORCs (neighborhood-scale, low-rise fabric) from vertical NORCs (building-scale, multi-unit structures). This typology links detected geospatial patterns to actionable planning contexts.
We demonstrate NORC-SIMCLUST in Colorado Springs, USA, a metropolitan setting where senior populations are growing rapidly and spatial heterogeneity is the norm. The case study shows that integrating dasymetric disaggregation, synthetic microdata, and confidence-based clustering improves detection reliability, reproducibility, and comparability beyond administrative boundaries. More broadly, the framework is scalable and transferable as it can be deployed in other cities, integrated with mixed-methods designs (e.g., Public Participation GIS), and used to support evidence-based aging-in-place strategies.
In sum, this study reframes NORC identification as a geospatial inference challenge that demands rigorous population downscaling, robust cluster detection with parameter optimization, and explicit cluster uncertainty assessment. By integrating dasymetric mapping with simulation-based confidence measures to evaluate cluster stability, NORC-SIMCLUST delivers a standardized, transparent, and reproducible workflow for uncovering fine-scale residential patterns of older adults. This approach equips planners, researchers, and community stakeholders with confidence to act on these insights for aging-in-place strategies.
2. Background and Methodological Context
2.1. Definition and Characteristics of NORCs
NORCs were first defined by Hunt and Gunter-Hunt in [4] as residential developments not initially designed for older adults but which, over time, come to house a large proportion of them. While this foundational definition remains widely cited, the literature reveals significant variability in operational criteria. Some studies define NORCs as communities where 40% or greater of residents are aged 60 or older. In contrast, others use similar thresholds based on households with older adults or different age cutoffs (e.g., 65+). These inconsistencies in age thresholds, population proportions, and spatial boundaries create ambiguity, complicating the comparability of research and the implementation of policies. In this study, we focus on senior households defined as those that include at least one individual aged 65 or older.
Beyond definitional variability, NORCs exhibit complex characteristics that make identification challenging. They occur in diverse forms, ranging from vertical NORCs in single apartment buildings to horizontal NORCs spanning entire neighborhoods [22]. Their size, shape, socio-economic composition, and functional boundaries vary widely and may change quickly, influenced by factors such as housing markets, urban development, migration patterns, and gentrification [3]. This makes longitudinal tracking difficult and undermines identification methods that are static or costly to repeat.
Identifying NORCs becomes increasingly complex when methods are applied across different geographic scales and regions. At larger scales, such as entire cities or regions, analyses often rely on aggregated census data over broad administrative units. This approach can obscure small but meaningful clusters, like a single high-rise building. On the other hand, studying smaller areas, such as neighborhoods, demands high-resolution data, which is frequently unavailable or expensive to obtain. Differences in settlement patterns and housing types within the study area add another layer of difficulty, making it challenging to standardize methods and set consistent thresholds for identification.
2.2. Prior Geospatial Foundations
2.2.1. Fine-Scale Population Modeling of the Residential Fabric
Detecting NORCs at fine scale starts with breaking down senior population data from broad administrative units to the actual residential landscape. Recent advances in geospatial analysis have improved small-area estimation through dasymetric mapping. However, these approaches still fall short of delivering parcel-level, housing-unit-specific allocations of senior populations, an essential step for reliably identifying NORCs. For instance, Peng et al. propose using a Grid Voronoi partition to address uneven base-station coverage and apply regression of mobile-phone counts against building-use covariates. This approach produces fine-scale dasymetric maps that capture urban heterogeneity for the general population [15]. However, the spatial framework remains telecom-centric rather than aligned with parcels or building footprints. As a result, allocations may not correspond to actual residences. Bonnevie et al. compare six dasymetric algorithms using CORINE land cover and Eurostat census data to improve population estimates at finer scales, contributing to better data harmonization for socioeconomic analysis [16]. Similarly, Cartagena-Colón et al. applied multi-class land-cover dasymetric modeling over several decades [19]. However, these approaches rely on land cover as a proxy for residential areas, which tends to underrepresent multi-story buildings and mixed-use environments. Rebelo et al. and Aquilino et al. incorporated building heights and UAV-derived 3D parameters, showing that structural information can improve dasymetric population mapping by reducing misallocation compared to simple land-cover approaches [20,21]. However, their methods remain limited for NORC identification because building height or footprint area is typically used as a proxy for capacity rather than actual occupancy.
A significant step toward parcel-level support for NORC analysis is the study by Dao et al., which disaggregates senior households to parcels and examines segregation and access vulnerability [23]. However, it does not incorporate simulation permutations or formal measures of cluster confidence—key elements addressed in this study. Our proposed approach builds on this trajectory by disaggregating census counts directly to parcels considering their housing-unit count, generating point-level inputs for cluster detection without relying on global settlement products.
2.2.2. Existing Areal-Based Cluster Inference and Its Pitfalls
Detecting concentrations of older adults has traditionally relied on local spatial statistics applied to census units such as tracts, block groups, or blocks, using aggregated counts of seniors or senior households. Common methods include Local Indicators of Spatial Autocorrelation (LISA), particularly local Moran’s I and local Getis-Ord Gi, which test localized concentrations against a null model of spatial randomness to identify clusters of older adults within the broader study area [24,25]. These outputs are often filtered using demographic thresholds (e.g., ≥40% of residents aged 60 or older), consistent with NORC definitions outlined in [4]. Such approaches are valued for their scalability, cost-effectiveness, and replicability, enabling longitudinal monitoring and comparative analysis across regions and time periods.
Several studies have applied these techniques to NORC identification or related elderly clustering. For example, Rivera-Hernandez et al. used global and local Moran’s I on census tract data in Ohio, USA, to identify NORCs, defined as tracts where ≥40% of residents are aged ≥65, and examined their persistence and evolution between 2000 and 2010 [11]. Similarly, Morrison and Bryan employed local Moran’s I to detect spatial clusters of elderly consumers at the block level, interpreting these clusters as proxies for NORCs in service planning contexts [26]. More recently, Li et al. analyzed the spatial distribution and evolution of the elderly population in Wuhan, China, using kernel density estimation, spatial autocorrelation, and standard deviation ellipses across administrative levels [27]. Lu et al. combined global and local LISA with geographically weighted correlation to map aging population hotspots and examine socio-economic linkages over time [28]. While these studies demonstrate the utility of spatial clustering for demographic analysis, they share a common reliance on aggregated census units, which constrains their ability to capture fine-grained residential patterns or irregular NORCs.
Relying on aggregated administrative units introduces several limitations. First, these zones often include large non-residential parcels, such as open spaces, institutional lands, or commercial areas, sometimes mixed with vertical housing. As a result, derived hot spots may indicate senior concentrations where older adults do not actually live, reducing interpretability for qualitative teams and practitioners planning aging-in-place services. Because clusters inherit the geometry of input zones, cluster outputs mirror tract or block-group boundaries rather than the irregular, fragmented footprints that NORCs typically exhibit (e.g., a single high-rise or dispersed neighborhood fabric). This challenge underscores the need for dasymetric mapping and housing-unit-constrained disaggregation before applying concentration analyses [29,30].
Second, these analyses are vulnerable to the Modifiable Areal Unit Problem (MAUP) and results vary by scale (tract vs. block group), zoning (alternative boundary systems), and spatial weights (queen/rook contiguity, distance bands, k-NN) [31]. These choices can significantly alter which areas appear as hot or cold spots, making identification unreliable when parameter sensitivity is not systematically assessed [32,33]. Finally, NORCs are irregular and dynamic. Traditional local spatial statistics based on fixed administrative boundaries provide limited ability to track changes in NORCs over time because they lack the fine spatial detail needed to identify NORCs as contexts evolve.
2.3. Our Contribution: NORC-SIMCLUST
NORC-SIMCLUST addresses a key methodological gap in NORC detection by anchoring inference to the actual residential fabric. Rather than operating on aggregated areal units, our approach disaggregates census-based senior household counts directly to residential parcels, accounting for housing-unit counts at each parcel. This alignment reduces the interpretability issues common in choropleth-based workflows and avoids conflating non-residential parcels with places where older adults actually live—an issue repeatedly noted in dasymetric mapping and small-area estimation research [28,30].
On each simulated point-level dataset, NORC-SIMCLUST applies HDBSCAN [34,35,36], a hierarchical, density-based clustering algorithm that handles variable densities, irregular shapes, and noise. By clustering housing-unit locations rather than zones, the method can delineate both vertical NORCs (e.g., a single high-rise where senior households concentrate across floors) and horizontal NORCs (e.g., fragmented neighborhood fabrics spanning multiple blocks). HDBSCAN’s hierarchical structure and stability-based cluster selection allow dense cores to be separated from surrounding noise while preserving the irregular geometries typical of naturally occurring communities. In our workflow, we employ the HDBSCAN algorithm with parameter sensitivity assessment conducted for each SimSHH permutation of senior households, ensuring robust parameter optimization and consistent results.
A central contribution of NORC-SIMCLUST is its confidence-as-stability framework. Instead of relying on traditional permutation-based p-values tied to null-hypothesis significance tests, we estimate cluster footprint stability and parcel-level confidence in cluster membership through repeated simulation runs of the full detection pipeline. Each run regenerates synthetic household allocations from census totals, applies clustering with optimized parameters, and records cluster membership. Confidence is then expressed as the proportion of runs in which a parcel is assigned to a detected cluster. This is an interpretable measure of membership stability across simulated scenarios, rather than a test against complete spatial randomness. In addition, cluster footprint stability across simulation runs is estimated using an area-weighted Jaccard index, enabling assessment of cluster persistence and convergence as the number of simulation runs increases. This design yields both cluster-level and parcel-level confidence-aware delineations that can be readily communicated to mixed-methods teams and policy stakeholders, supporting decisions about site selection, service targeting, and phased rollouts where robustness and uncertainty matter as much as detection.
Compared to existing dasymetric and clustering approaches, NORC-SIMCLUST differs by simulating parcel-level senior household locations and applying density-based clustering directly to residential points, enabling detection of both horizontal and vertical NORCs without areal constraints. Its stability confidence measure framework departs from conventional cluster stability metrics by estimating area-weighted spatial footprint stability and parcel participation confidence across repeated simulations, rather than comparing alternative partitions of a fixed dataset or relying on null-hypothesis testing. Relative to our prior work, this study advances NORC detection by integrating uncertainty-aware simulation, parameter-sensitive clustering, and multi-scale stability assessment into a unified, confidence-aware framework suitable for planning and policy applications.
Because clustering operates on point locations, cluster geometry is no longer constrained by tract or block-group boundaries, and the typical MAUP concerns associated with areal analyses are unnecessary. Additionally, we treat HDBSCAN parameter sensitivity and cluster boundary quantification as integral components of the workflow. Systematic parameter sweeps are used to evaluate robustness and optimize key HDBSCAN settings, including the minimum cluster size and the minimum samples [35]. Together, residential alignment, shape-agnostic clustering, and stability-based confidence transform NORC detection from heuristic hotspotting into a rigorous geospatial inference framework that produces actionable, confidence-aware boundaries for aging-in-place planning.
3. Methodology
NORC-SIMCLUST is designed to identify Naturally Occurring Retirement Communities (NORCs) as groups of parcels with quantified stability-estimated boundaries and parcel stability confidence measures. The framework integrates three geospatial algorithms:
- SimSHH simulates senior household (SHH) data at the parcel level and incorporates permutations to generate multiple synthetic datasets.
- C-NORC-ID applies noise resistant, density based spatial clustering with parameter sensitivity assessment to detect SHH concentrations for each simulated dataset. Overlapping clusters are merged to form NORC candidates (C-NORCs), with quantified boundaries, cluster footprint stability, and parcel participation confidence.
- NORC-ID evaluates NORC candidates based on housing composition and supports final NORC selection using specified characteristics and confidence thresholds.
The following section provides a detailed description of these algorithms and outlines the complete NORC-SIMCLUST workflow. In this study, a permutation refers to one stochastic within-block allocation of senior households generated by the SimSHH algorithm, while a simulation run, or run, refers to one complete execution of the SimSHH and clustering pipeline in the C-NORC-ID algorithm.
3.1. The SimSHH Algorithm
This algorithm was developed to simulate the SHH count for each residential land parcel, considering its related housing-unit count. Essentially, our algorithm adopts a dasymetric process to disaggregate the census-block-aggregated SHH counts to all relevant residential land parcels, accounting for different types of residential housing, such as single-family, duplex, triplex, and complex units. Residential parcels associated with registered nursing homes or senior assisted living are not considered for this assignment because census-reported counts do not include these units.
In the first step of the process, we collect all relevant parcels within each block using spatial queries. The collected parcels for each block are then further processed to retain only those designated as residential parcels. During the second step, the collected residential parcels are weighed by housing type to ensure fair disaggregation, since single homes and condos typically house one household, while duplexes, triplexes, and apartments can accommodate more households. To ensure that the total number of residential parcels available within a block equals the census household count, we estimate the number of households a multiple-unit parcel can accommodate based on the difference between the block’s total household count and the number of households accommodated by other parcels of single residential houses, condos, duplexes, and triplexes. After modeling the possible number of households each parcel can accommodate, we clone each parcel that number of times to produce the final residential household units, which will serve as the target zone for our disaggregation process.
The senior household count for each block is then randomly distributed to its related set of residential parcels. Given a block aggregated SHH count N and a set of PA residential parcels with the block, the process of distributing N to PA so that is the vector of SHH count for each residential parcel follows a multinomial distribution, so:
For any individual parcel, the count is distributed as , with expected value and variance . This formulation represents the discrete analogue of complete spatial randomness [37], ensuring uniformity and independence in the allocation process.
Figure 1 depicts the input and output of the SimSHH algorithm for three exemplified blocks, where the aggregated SHH block counts are shown in black numbers, the simulated SHH count for each parcel is in colored numbers, and the simulated individual SHH for each parcel is in colored dots.
Figure 1.
The input and output of the SimSHH algorithm for three exemplified blocks.
The SimSHH algorithm is executed multiple times to generate various permutations of simulated senior household (SHH) data. Each permutation’s data is then analyzed to detect concentrations of senior households. By merging the detected concentrations from all simulation runs, we can identify groups of parcels where significant block-aggregated SHH counts align with high-density residential units.
Because census block-level senior household counts do not provide information on within-block residential location, allocating senior households to individual parcels is inherently uncertain. However, it is important to note that the random allocation of senior household to parcels in this study is implemented within each census block and is explicitly constrained by the housing-unit counts of the involved residential parcels, including single-family housing, duplexes, triplexes, and multi-unit parcels. As a result, the random allocation applied here represents within-block locational uncertainty under housing-unit constraints, rather than an assumption of behavioral randomness.
Beyond housing-unit counts, alternative constrained allocation strategies could be incorporated within the same framework, such as weighting parcels by building characteristics (e.g., floor area, building height, or year built), neighborhood context (e.g., proximity to services, transit access, or land-use mix), or hypothesized senior residential preferences (e.g., preference for multi-unit buildings, elevator-served structures, or amenity-rich environments). These extensions may improve plausibility in settings where such auxiliary data are available and where senior residential behavior is strongly structured by environmental or socio-spatial factors.
However, these alternative constraints also introduce additional assumptions and potential limitations. Building- or amenity-based attributes often function as proxies for residential suitability rather than direct indicators of senior occupancy, while preference-based weighting relies on behavioral assumptions that may vary across cultural, economic, and geographic contexts. Inconsistent data availability and uncertain transferability across cities further limit the generalizability of heavily parameterized allocation models. As a result, deterministic or strongly weighted allocations risk obscuring uncertainty rather than representing it, particularly in heterogeneous urban environments.
3.2. The C-NORC-ID Algorithm
The objective of this second algorithm is to identify candidates for NORCs. A candidate NORC (C-NORC) is defined as a group of spatially connected parcels that have a high likelihood of being associated with a high concentration of senior households (SHHs). For a group of parcels to qualify as a C-NORC, they must meet two criteria: (1) they must be spatially connected or close, and (2) they must belong to a rigorously identified SHH concentration.
Our approach to detecting C-NORCs involves two main steps: (1) using the HDBSCAN algorithm—with parameter sensitivity testing—to identify spatial clusters of SHHs for each permutation, and (2) merging overlapping clusters across simulation runs to create C-NORCs, along with estimating their stability confidence.
3.2.1. Parameter-Optimized Clustering with HDBSCAN
To rigorously identify high concentrations of simulated SHH, we employed the Hierarchical Density-Based Spatial Clustering of Applications with Noise (HDBSCAN) algorithm to the simulated SHH point data for each permutation. This algorithm is well-documented in the spatial clustering literature [35] as an advanced level of the Density-Based Spatial Clustering of Applications with Noise (DBSCAN) algorithm [34].
The DBSCAN algorithm aims to identify groups of closely packed SHH points. It requires two parameters: eps (the neighborhood radius) and min_samples (minimum points needed to form a dense region). SHH points within dense regions are classified as core points, which then expand to form clusters. Conversely, SHH points that do not belong to any dense region are labeled as noise. While DBSCAN can detect clusters of arbitrary shape, it encounters challenges when clusters have different densities because a single eps value must be applied for the entire dataset. This limitation is particularly relevant for identifying NORCs, as these communities within urban or mixed urban-rural areas can vary significantly in household density.
HDBSCAN (Hierarchical DBSCAN) extends the capabilities of DBSCAN to address this limitation. Rather than relying on a fixed density threshold, HDBSCAN constructs a hierarchy of clusters across multiple density levels by computing mutual reachability distances and creating a minimum spanning tree. As edges are removed from this tree, clusters emerge at different density scales. This hierarchical structure is then condensed to identify the most stable clusters, eliminating the need to specify eps and allowing for the detection of clusters with variable densities.
Although the HDBSCAN algorithm no longer requires specifying the neighborhood search radius, it still requires setting two parameters: the minimum cluster size and the minimum samples. The minimum cluster size defines the smallest allowable grouping that can be identified as a cluster. Smaller values encourage the formation of fine-grained clusters but may result in over-fragmentation. In contrast, larger values produce fewer smoother clusters, with a higher likelihood of treating more points as noise or merging small groups into larger cluster structures. The minimum samples parameter controls the local density requirement and determines how many neighbors a point must have to be considered a core point of a cluster. A higher threshold enforces stricter density requirements and often results in more conservative clustering, while a lower threshold relaxes the requirements for cluster membership, reducing the number of points categorized as noise. By jointly tuning these parameters, the algorithm balances sensitivity to local structure with robustness against spurious groupings.
HDBSCAN was integrated into the C-NORC-ID workflow and applied independently to each SimSHH permutation, allowing clustering parameters to be evaluated across multiple within-block stochastic simulated SHH datasets. For each SimSHH output, we conducted a systematic parameter sweep over two key HDBSCAN hyperparameters: the minimum cluster size, tested across values [5, 10, 15, 20, 25, 30, 35, 40, 45, 50], and the minimum samples parameter, evaluated using values [None, 5, 10, 20]. All parameter combinations were assessed, and clustering outcomes and associated validity metrics were stored in a run-specific sensitivity table for reproducibility.
Cluster validity was evaluated using a combination of internal and density-based indices for each parameter pair. Specifically, we computed the silhouette coefficient, which measures relative cluster separation and internal cohesion [38], and the Density-Based Clustering Validation (DBCV) index, which is designed to assess compactness and separation in density-defined clusters [39]. Because the silhouette coefficient can underestimate clustering quality in density-based contexts, DBCV was used as the primary criterion for parameter selection. More specifically, DBCV assesses the balance between within-cluster density cohesion and between-cluster density separation by comparing the weakest internal density connection of each cluster to its nearest neighboring cluster in density space.
In our workflow, DBCV is estimated for each parameter combination and SimSHH permutation using a 5000 random sample of clustered points to ensure computational feasibility for large datasets. While alternative DBCV sample sizes could be explored, preliminary testing indicated that relative parameter rankings were stable at the chosen sample size; given the emphasis on cross-run parameter consistency and cluster stability, we therefore retained a fixed sample size of 5000 clustered points.
For each SimSHH permutation, the parameter set yielding the highest DBCV value was selected to produce the final clustering outcome. Importantly, because this parameter selection procedure is repeated independently across multiple simulation runs and all validity metrics are retained, parameter robustness is evaluated across simulated SHH datasets output by the SimSHH algorithm rather than relying on a single dataset instance. DBCV is interpreted here as an internal, comparative validity measure to guide parameter selection, rather than as an absolute measure of clustering quality, with higher values indicating more compact and better-separated density-defined clusters.
This clustering technique, based on parameter-optimized HDBSCAN, is particularly well-suited for the NORC identification problem because it does not require prior specification of the number of clusters or the spatial contiguity relationships, unlike other approaches such as LISA [24] and K-Mean [40]. It is also effective at detecting clusters of irregular shapes and varying densities, even in the presence of noise. In contrast to the LISA approach, such as Moran’s I or Getis-Ord’s G, which focus on detecting high-high or low-low similarity in aggregated SHH count among neighboring blocks or tracts, HDBSCAN in our workflow identifies individual simulated SHH concentrations with varying local density, allowing for the detection of both dominant potential vertical NORCs and sparse horizontal NORCs, with varying sizes and shapes.
When integrated into our C-NORC-ID algorithm, HDBSCAN is utilized to identify a set of SHH clusters that are spatially separated for each SimSHH permutation output. Parameter sensitivity testing is used to ensure its application in our workflow is rigorous and reliable, enabling the identification of spatial clusters of SHHs as an emergent property of the data. Figure 2a,b illustrate this process with two permutations. In the first permutation output, HDBSCAN detected two distinct clusters, labeled 1,p1 and 2,p1. For the second permutation output, the detected clusters are labeled 1,p2 and 2,p2. Each of these clusters comprises a set of spatially connected parcels with a high concentration of SHH. Because the simulated SHH data generated across different runs differ due to within-block randomness, the cluster sets discovered will vary but exhibit significant spatial overlap (i.e., spatially overlapped), as illustrated in Figure 2c. Figure 2 illustrates the concept using only two permutations.
Figure 2.
(a,b) HDBSCAN clustering of SHH points for two different permutation outputs, and (c) Spatial overlays of identified clusters.
To represent the structure of clusters generated across multiple permutations, let denote the set of permutations, and let PA be the set of all parcels. Each permutation produces a collection of clusters, denoted by
where is the number of clusters in permutation , and each cluster . The overall structure of all clusters across permutations is then
This notation captures the hierarchical organization where each permutation consists of multiple clusters, and each cluster is a subset of the parcel set.
3.2.2. C-NORCs: Boundary and Confidence Measure
The next step in the C-NORC-ID algorithm is to process all detected cluster sets across all SimSHH permutations to present the C-NORCs logically. The HDBSCAN algorithm yields spatially separated clusters for each permutation, where each cluster is a group of spatially connected parcels. Thus, if there were only one permutation, each detected cluster could be a candidate. However, our framework enables multiple permutations, offering permuted overlapping clusters for consideration for each candidate, as shown in Figure 3a. Merging these spatially overlapped clusters to represent a C-NORC while maintaining their distant separation from other overlapped cluster groups (i.e., other C-NORCs) is consequently logical.
Figure 3.
(a) Overlapped clusters across 10 permutations, (b) Merged overlap clusters to form C-NORCs, (c) Cluster participation confidence for parcel members of the C-NORCs, and (d,e) Quantified C-NORC boundary using concave hull with different parameter values.
To merge clusters generated across multiple permutations while preserving spatial connectivity, we employ a partial overlap-based approach that does not assume a fixed cluster index across permutations. Each permutation produces a set of clusters, where each cluster is represented as a set of parcels. With all clusters from different permutations, we identify those that are directly or indirectly linked through parcel overlap by requiring at least one parcel in common between them. We construct an overlap graph in which nodes correspond to clusters from all permutations, and edges connect clusters that share at least one parcel. Connected components of this graph represent groups of clusters that exhibit spatial connection across permutations. For each connected component, we form a merged cluster by taking the union of all parcels from its member clusters, ensuring that any parcel appearing in at least one cluster within the component is included. Each merged cluster is then used to present a C-NORC.
This process is illustrated in Figure 3b and can be mathematically formalized as follows. To consolidate clusters generated across multiple permutations to derive the C-NORCs, we first define the set of all clusters as:
where each represents a cluster of parcels from permutation . Spatial connectivity between clusters is determined by the overlap relation:
which indicates that two clusters are connected if they share at least one parcel. Using this relation, we construct connected components , each representing a group of clusters that are directly or indirectly linked through overlaps:
Finally, each connected component is merged into a single cluster by taking the union of all parcels from its member clusters:
The resulting set of merged clusters is:
where is the number of connected components.
At the end of this cluster merging process, C-NORCs are formed, each of which is defined by as a group of spatially connected parcels by merging all the overlapping clusters detected using all permutations. By this definition, a parcel does not have to participate in a merged cluster all P permutation times to become a member of the candidate. However, it must participate at least one time. Moreover, if a parcel repeatedly participates in a merged cluster across various permutations, its confidence of belonging to the core of a NORC is high, as measured by the number of participation times. We refer to this condition as the parcel’s permutation-based cluster participation confidence, or cluster internal stability confidence, as illustrated in Figure 3c.
In general, a residential parcel can be assigned a number of simulated SHH, ranging from 0 to the maximum block count, by 0 to P times across all P permutations. Through spatial clustering, the parcel can participate in a cluster anywhere from 0 to P times, depending on the actual aggregated SHH count and the composition of residential parcels within the block. To quantify the participation confidence of each parcel in a merged cluster (i.e., a C-NORC), we calculate the number of permutations in which the parcel participates in clustering, then multiplying that by 100. Specifically, for a merged cluster , let denote the total number of permutations. For each parcel , define its participation count as:
This counts how many permutations include parcel in any cluster within the connected component . The participation percentage for parcel is:
Any parcel participating in a C-NORC can have confidence value ranging from (1/P)*100%, equivalent to 1 out of P permutations, to (P/P)*100%, equivalent to P out of P permutations. The fundamental idea is that parcels with a higher participation confidence level are more likely to form the core of a NORC, especially when they are identified with a high permutation time. While some may argue that a C-NORC should only include parcels with a 100% confidence level to ensure most reliable identification, our approach emphasizes providing this measure for all parcels. This enables users to set their own cutoff thresholds when assessing candidates to finalize the NORCs.
The permutation-based participation measure represents parcel-level stability rather than correctness and should not be interpreted as a ground-truth accuracy metric. It quantifies how reproducibly a parcel is identified as part of a SHH concentration under within-block parcel allocation uncertainty. Parcels with high participation represent stable cluster cores, while lower participation values indicate transitional or boundary areas that are more sensitive to within-block allocation uncertainty.
Once all participating parcels and their respective participation confidence levels are identified for each candidate, our algorithm quantifies the candidates’ boundaries using the minimal boundary based on the concave hull of all member parcels. A concave hull is defined as a boundary that closely conforms to a set of points, allowing for a more accurate representation of their shape compared to a convex hull [41,42]. This method adapts to the contours of the point data input, with the alpha parameter ranging from 0 to 1 to control the level of detail; smaller alpha values produce tighter, more intricate boundaries. Figure 3d,e illustrate the concept of a concave hull using different alpha values of 0.1 and 0.3. In our workflow, all boundary vertices of member land parcels associated with a detected SHH cluster are identified and used to detect the concave hull, with the alpha value set to 0.3 to allow for some flexibility in contouring around the outer boundaries of the parcels.
3.2.3. Cluster Stability Assessment Across Simulation Runs
Cluster stability was quantified using an area-weighted Jaccard similarity metric applied to cluster footprints to evaluate the spatial reproducibility of clusters (i.e., C-NORCs) across multiple independent simulation runs of SimSHH and HDBSCAN. For each run, detected clusters were represented by concave hull polygons that delineate the spatial footprint of clustered parcels.
Let denote the polygonal spatial extent, i.e., concave hull, of cluster obtained from clustering run , where . Spatial similarity between corresponding clusters derived from two runs and was measured using the Jaccard similarity coefficient,
where denotes planar area. This metric captures spatial agreement in both location and extent and takes values in the interval .
Because spatial clustering results are often sensitive to minor boundary shifts and small fragmented overlaps, it is possible that a cluster footprint in one run intersected multiple footprints in another run. In this case, Jaccard values were aggregated using an area-weighted approach [43]. The area-weighted Jaccard similarity between cluster i in run and run was computed as
where denotes the overlap area between the concave hull and each intersecting hull . When no spatial overlap exists (i.e., ), the similarity is defined as . The area-based weighting scheme ensures that spatial agreements involving larger shared areas contribute more strongly to the stability measure, while incidental or sliver overlaps are down weighted. The resulting statistic reflects the reproducibility of the core spatial structure of each cluster.
To evaluate stability of a cluster across k runs, a full-ensemble area-weighted Jaccard index is estimated. Let be a set of simulation runs excluding reference run . The full-ensemble area-weighted Jaccard stability index for cluster in run is:
where is the total overlap area between the concave hull and all intersecting hulls in run .
To examine how stability of a cluster depends on the number of simulation runs, the full-ensemble area-weighted Jaccard estimation was repeatedly estimated for all possible combinations of k runs, with k equals 2 to P. This means for each value of k, a value was computed for every k-run subset, and the resulting estimates were averaged to produce a representative stability value for that ensemble size. This approach avoids dependence on run ordering and enables evaluation of stability convergence as the number of simulations increases, supporting identification of clusters that exhibit robust spatial persistence under stochastic simulation.
3.2.4. Cluster Stability Convergence as Evidence of Robust Spatial Structure to Identify C-NORCs
Evaluating cluster stability across increasing numbers of simulation runs provides insight into robustness that cannot be obtained from a single stability value. By computing full-ensemble area-weighted Jaccard stability for all combinations of k out of P simulation runs, we assess how stability estimates behave as the simulation ensemble grows, considering the within-block uncertainty-aware design of the SimSHH algorithm.
As k increases, clusters may converge to consistently high, moderate, or low Jaccard values. Convergence indicates that the estimated level of stability is reproducible under additional simulations, while the magnitude of the converged value reflects the strength of the underlying spatial structure, that is, the concentration of simulated senior households. Clusters that converge to high values exhibit robust and persistent spatial footprints despite stochastic parcel-level SHH allocation, whereas convergence to low values indicates consistently weak or fragmented spatial structure. In contrast, clusters whose Jaccard values fluctuate substantially as k increases lack convergence, reflecting sensitivity to simulation composition and internal spatial uncertainty. Under this framework, robust concentrations of senior households are evidenced by convergence to high Jaccard values, while non-convergent behavior or convergence to low Jaccard values indicates instability.
To operationalize this interpretation, clusters were classified into stability categories based on their converged Jaccard similarity values: clusters with J ≥ 0.7 (i.e., having ≥70% area overlaps across runs) were classified as stable C-NORCs, those with 0.5 ≤ J < 0.7 as moderately stable (potential) C-NORCs, and those with J < 0.5 as unstable, consistent with established Jaccard-based cluster stability assessments [44].
3.2.5. Distinguish Between Cluster Footprint Stability and Internal Parcel-Level Stability Under Within-Block Uncertainty
An important consideration in evaluating the stability of spatial clusters produced by the SimSHH and HDBSCAN framework is the scale at which stability is assessed. Because the SimSHH algorithm explicitly models within-block uncertainty by randomly allocating senior households to parcels, parcel-level persistence across simulation runs is neither expected nor theoretically meaningful. Variation in parcel-level cluster membership reflects intentional stochastic within-block SHH allocation uncertainty rather than instability in the underlying spatial pattern. Direct parcel-to-parcel comparisons across runs would therefore conflate modeled uncertainty with algorithmic inconsistency and are not an appropriate basis for stability assessment.
NORC-SIMCLUST is instead designed to evaluate robustness at the level of emergent cluster footprints rather than deterministic parcel assignments. By repeatedly simulating plausible within-block allocations under housing-unit constraints and assessing cluster stability across simulations, the framework absorbs reasonable variation in allocation assumptions. Clusters that persist across runs therefore represent spatial structures that are robust to allocation uncertainty, whereas clusters that fail to converge or exhibit low stability are explicitly identified as sensitive to within-block variability and treated as unstable. This design allows potential failure cases—such as areas with fragmented residential fabric, mixed housing forms, or weak spatial concentration—to be diagnosed through low stability and non-convergence rather than masked by stronger allocation assumptions.
Rather than imposing stability criteria at the parcel scale, this study uses parcel participation to characterize C-NORC internal structure and cluster footprint stability to characterize overall C-NORC robustness. Parcel participation captures how frequently parcels are included within a cluster across simulation runs, allowing spatial cores, gradients, and boundary zones to be identified without requiring deterministic parcel membership. This approach preserves a clear distinction between cluster-level footprint stability, which reflects reproducible spatial structure across the study area, and parcel-level variability, which is an intended feature of the uncertainty-aware simulation model. In this sense, parcel participation serves as a descriptive diagnostic rather than a stability metric, complementing cluster footprint Jaccard stability measures by revealing how consistently different parts of a cluster are represented across simulation runs.
3.3. NORC-ID Algorithm
Once the final set of SHH clusters is identified as the C-NORCs, they are input into our third algorithm, NORC-ID, for interactive examination and characterization. This third component of NORC-SIMCLUST serves as a decision-support system, enabling users to finalize their selection of NORCs. Users can query the set of parcels based on specific stability and confidence measures to define potential NORCs. Following this, spatial analysis is conducted to characterize these parcels, estimating their residential land composition and simulated SHH count. The statistics provided assist users in interactively refining their NORC selections according to their own defined thresholds.
3.4. The NORC-SIMCLUST Workflow
The overall workflow of NORC-SIMCLUST is depicted in Figure 4. This workflow takes as inputs the boundaries of census blocks, counts of senior households (SHH) aggregated by each block, and land parcel data that includes descriptions and boundaries of the parcels. The workflow sequentially executes three algorithms, resulting in the identification of C-NORCS as groups of concentrated senior residential parcels. Additionally, it provides estimated characteristics of these C-NORCs, such as SHH counts, residential housing compositions, and permutation-based stability confidence levels for the participating parcels for final NORC selections.
Figure 4.
The NORC-SIMCLUST workflow chart.
4. Application: Identify NORCs in Colorado Springs, Colorado, USA
This section showcases the application of NORC-SIMCLUST to identify NORCs within Colorado Springs, Colorado, as a case study. We will begin by introducing the study area and the data, followed by a presentation and discussion of the results from NORC-SIMCLUST.
4.1. Colorado Springs: Landscapes and Seniors
The City of Colorado Springs, Colorado, represents the demographic of aging in mid-sized urban environments in the Western United States. According to the 2020 census, the city has a population of approximately 478,961 residents and is situated at an elevation of 6035 feet in the eastern foothills of the Rocky Mountains. It is notably close to Pikes Peak, a prominent landmark in Pike National Forest and the inspiration for the song “America the Beautiful”. Colorado Springs consistently ranks among the top 10 cities in the country according to U.S. News & World Report and is a popular retirement destination, particularly for retired military personnel [45].
The urban structure of Colorado Springs includes a compact downtown business center and widespread suburban neighborhoods tucked among parallel North–South and East–West transportation corridors, including Interstate-25, which runs North–South through its downtown (Figure 5). On the West side of Interstate-25 at the foothill lie various well-known natural landmarks that once served as popular resorts of the West for gold miners, including the 5-star Broadmore Hotel Complex, the Garden of the Gods, the Starsmore Nature Center, Bear Creek Regional Park, and the Cheyenne Mountain open space. Palmer Park, located near the center of the area, is a 730.7-acre regional park that offers stunning views of Pikes Peak on the west and provides over 25 miles of trails for horseback riding, mountain biking, and hiking.
Figure 5.
Colorado Springs location and imagery of the landscape.
The city allocates approximately 41% of its total land area to residential use, dominated by single-family zones with some multi-family and mixed-use districts. Commercial land accounts for about 6–7%, concentrated along major corridors and downtown, while industrial zones occupy roughly 4–5%, primarily in the eastern and southern regions. The city is notable for its commitment to green spaces, maintaining over 9000 acres of parkland, 500 acres of trails, and nearly 7200 acres of preserved open space, representing about 15% of the total area. Public and institutional uses, including schools and government facilities, comprise an additional 8–10% of land [46,47]. This spatial arrangement well supports active aging in place, a preference expressed by most older adults, while fostering community cohesion and access to amenities [48].
Colorado Springs offers an ideal context for identifying and supporting NORCs, given its distinctive residential landscape and rapidly aging population. The city’s residential patterns, as shown in Figure 6, are primarily composed of low-density single-family homes, which account for about 83% of residential land, complemented by emerging mixed-use developments and multi-family housing clusters [46].
Figure 6.
Distribution of residential parcels in Colorado Springs.
Demographically, Colorado Springs has a growing senior population, with approximately 14.7% of residents aged 65 and older, and projections indicate this number will more than quadruple by 2050 [48]. There were 201,150 households within the city limits in 2020, out of which 53,677 (26%) were households with seniors [49]. These factors create natural clusters of older adults, aligning with the core concept of NORCs.
Identifying NORCs in Colorado Springs also illustrates the methodological challenges posed by their complex formations, as previously discussed. NORCs do not conform to uniform geographic boundaries; they may emerge horizontally across sprawling suburban neighborhoods or vertically within multi-story apartment complexes [22,50]. In Colorado Springs, aging populations are dispersed across diverse housing typologies and irregular spatial patterns, from low-density suburban tracts to higher-density urban corridors. Colorado Springs offers a rich case study for testing our NORC-SIMCLUST framework, given its mix of horizontal and vertical aging patterns and strong neighborhood identity.
Our analysis reveals strong evidence of spatial segregation among senior households, based on both census-aggregated data at the block level (Figure 7a) and the tract level (Figure 7b,c). Figure 7a presents a bivariate map showing concentrations of senior households, depicted in dark brownish color, along the foothills in the west and in the central northern part of the city. Additionally, there are blocks with a high percentage of senior households but a low count, indicated in blue, within the downtown area.
Figure 7.
(a) Distribution of census block aggregated SHH in Colorado Springs, and (b) Spatial distribution of identified sub-regions characterized by census-tract senior-household (SHH) counts and per capita income, and (c) Attribute-based profiles of sub-regions, where dots represent standardized attribute values, box plots summarize the overall distribution of each attribute, and lines connect attributes within sub-regions to illustrate multivariate clustering patterns.
Figure 7b,c further highlights the spatial segregation of senior households in relation to income levels, with green representing high-income areas, blue indicating middle-income regions, and red denoting low-income zones. The darker the shade of these colors, the higher the concentration of senior households. Notably, high-income senior households cluster along the western side of I-25, while middle-income households surround the Palmer Park area, and low-income households are primarily found in the downtown area or southeast of it.
While these maps provide valuable insights into residency patterns and segregation, the analysis scale is too broad to identify localized Naturally Occurring Retirement Communities (NORCs) at the local community level. Implementing a Local Indicators of Spatial Association (LISA) approach on the census-block aggregated senior household count is a popular method to identify concentrations, confirming the patterns observed earlier, as illustrated in Figure 8a. However, it is important to note that LISA operates on attribute data with a definition of spatial contiguity that can lead to variations in results if the definition changes (as shown in Figure 8b). Additionally, there are limitations due to low spatial granularity and the Modifiable Areal Unit Problem (MAUP), as discussed in the previous section of this work.
Figure 8.
LISA clusters of blocks with high SHH using two different neighborhood definitions: (a) inverse distance, and (b) inverse distance squared.
In the following sections, we will present and discuss the results of using NORC-SIMCLUST to identify Naturally Occurring Retirement Communities (NORCs) as a composition of parcels within Colorado Springs, as proposed. All the data used for this case study were obtained from widely recognized administrative sources that are often publicly available for cities across the United States. We collected two primary datasets for this study. The first dataset consists of US 2020 Census block data for Colorado Springs, available at http://data.census.gov/advanced (accessed on 11 October 2023). This dataset includes attributes such as the total household count and the count of senior households. The second dataset contains land parcel information for Colorado Springs, including descriptive attributes, available at https://assessor.elpasoco.com/assessordata/ (accessed on 11 October 2023).
All maps presented in this paper use the NAD 1983 State Plane Colorado Central FIPS 0502 (US Feet) projected coordinate system.
4.2. SimSHH Algorithm and Simulated Senior Household Result
The SimSHH algorithm uses two publicly available datasets as inputs: census block-level aggregated senior household counts and residential land parcel data. These datasets enable the generation of simulated SHH counts and corresponding point locations linked to individual parcels. The algorithm can be executed any number of times, but for demonstration purposes, we generated ten permutations of simulated household distributions.
Figure 9 offers a closer look at exemplified census blocks within the study area, showcasing maps of the simulated SHH count values and their associated individual SHH locations in two different permutations (Figure 9a,b) and across all ten permutations (Figure 9c). As discussed in the Methodology section, the simulated individual SHH locations are generated by randomly distributing the aggregated SHH count across all residential parcels within the block for each permutation. As a result, the simulated individual SHH locations across permutations do not necessarily overlap. However, their high densities are preserved in spatially compact residential areas with high aggregated counts. Consequently, the reliability of the HDBSCAN algorithm’s detected concentrations will be established through stability as the number of permutations increases.
Figure 9.
(a) Simulated senior household (SHH) count assigned to residential parcels using SimSHH for two permutations, where colored numeric labels indicate parcel-level SHH counts simulated under different permutations 1 and 2, (b) Simulated individual senior household locations for the same two permutations, where colored dots represents individual SHH locations generated by different permutations, and (c) Simulated individual SHH locations using ten permutations, with dot colors indicating permutation membership.
Figure 10 presents a map of all simulated SHH locations within the study area across all 10 permutations, illustrating the outputs of the SimSHH algorithm which will later be used as inputs to the C-NORC-ID algorithm.
Figure 10.
Overlayed simulated individual SHH location data obtained after running the SimSHH algorithm 10 times, with a close look at the Southwest neighborhood.
4.3. C-NORC-ID Process and Result
The individual simulated SHH point locations generated by each SimSHH permutation serve as inputs for HDBSCAN, a robust spatial clustering algorithm used to detect concentrations with noise resistance. Figure 11a illustrates the input and output maps of the HDBSCAN clustering process for one SimSHH permutation, while Figure 11b shows overlapping clusters detected across all ten permutations.
Figure 11.
(a) Simulated individual SHH location data and its detected clusters for one SimSHH permutation, and (b) Overlay of the detected simulated SHH clusters for ten permutations.
4.3.1. Clustering Parameter Sensitivity Analysis Result
Clustering parameter sensitivity is evaluated using the DBCV index for each SimSHH permutation and each parameter combination, as previously discussed. Table 1 lists the best parameter sets by simulation run and Figure 12 presents the cross-run mean DBCV surface corresponding to different parameter sets. Across SimSHH permutation, optimal HDBSCAN parameters consistently fall within a limited region of the tested parameter space, most commonly involving moderate minimum cluster sizes (25–35) and min_samples values of None or 20. Although the exact best parameter pair varies by run, this variability is constrained to nearby alternatives, indicating that parameter selection is not driven by a single fragile optimum. The mean DBCV surface corroborates this pattern by showing that higher mean DBCV values are concentrated within this same region, supporting the robustness and reproducibility of the chosen parameter ranges. Across the SimSHH permutations, the best DBCV values obtained for each run fall in the range of approximately 0.3–0.4, reflecting moderate density-based cluster separation. Such values are expected for this study given the stochastic nature of the simulated household distributions and the large number of detected spatial clusters.
Table 1.
List of the best parameter sets and the resulting DBCV value, noise point fraction and detected cluster count by simulations runs.
Figure 12.
Analysis of cross-run mean DBCV associated with different parameter sets.
Parameter sensitivity analysis in this study serves both to identify appropriate HDBSCAN configurations and to assess the robustness of clustering outcomes under reasonable parameter variation. By systematically evaluating clustering results across a broad parameter sweep and across multiple simulation runs, the analysis characterizes how cluster validity, noise fraction, and cluster counts vary within the explored parameter space. Importantly, this variability is used diagnostically to delineate stable regions of the parameter space and to avoid fragile or poorly supported clustering solutions. Once an optimized and stable parameter configuration is identified, variability in clustering outcomes outside this region is not interpreted as uncertainty in the final results. Instead, subsequent inference focuses on cluster footprint stability under stochastic within-block simulation, as reported in Section 4.3.2, where uncertainty is quantified through ensemble-based stability and convergence analysis rather than through non-optimal parameter choices.
4.3.2. Cluster Stability Assessment Result
Figure 13a depicts all cluster footprints detected across our ten runs of the SimSHH and HDBSCAN workflow. It is visually confirmed that the clusters generally retain their spatial locations and spatial extents across the study area.
Figure 13.
(a) Overlaid clusters as they detected across simulation runs, (b) Jaccard index convergence for each cluster detected from run 1 as simulation count increases, and (c) Classified clusters based on their 10-run-ensemble area-weighted Jaccard indices.
Figure 13b summarizes the convergence behavior of the area-weighted Jaccard stability metric of clusters detected in run 1 compared to clusters detected in other runs as the number of simulation runs increases from two to ten. Each line represents one detected cluster (240 total), and the y-axis reports the area-weighted Jaccard index computed over all run-subset combinations at each run count. Overall, the stability trajectories exhibit rapid convergence: for most clusters, the Jaccard values increase modestly from the two-run estimate to the three- or four-run estimates and then plateau, with only minor incremental changes thereafter. This pattern indicates that additional simulation permutations primarily refine estimates rather than fundamentally altering inferred cluster reproducibility, suggesting that the cluster footprints are largely determined by persistent spatial structure rather than by individual permutation of the within-block stochastic SHH allocation.
Figure 13b also reveals substantial heterogeneity in stability across clusters. A subset of clusters consistently attains high stability values (upper band of curves) and stabilizes early, whereas other clusters converge to moderate or low values even as the permutation count increases. Notably, the ordering of clusters is largely preserved across permutation counts, i.e., clusters that are relatively stable under low permutation count k remain stable as k grows, and clusters that are less stable do not systematically improve with additional permutations. This monotonic and rank-preserving behavior supports interpreting the stability metric as an intrinsic property of each cluster’s spatial structure reproducibility under uncertainty, rather than a sampling artifact of any specific run subset.
Across the 240 clusters detected in run 1 with their convergence analysis shown in Figure 13b and their map presented in Figure 13c, the cluster stability assessment reveals a clear stratification in cluster reproducibility under within-block SHH uncertainty. Only 32 clusters (13%) consistently achieve high average area-weighted Jaccard values (≥0.7) and form the upper envelope of the convergence trajectories. These stable clusters exhibit rapid stabilization, with Jaccard values reaching a plateau after only a few permutations and remaining effectively unchanged as additional runs are incorporated, indicating a robust and persistent spatial core that is resilient to within-block stochastic SHH allocation.
A larger group of 85 clusters (35%) converges to medium stability levels (<0.7 and ≥0.5), forming a distinct middle band of trajectories. Although these potential clusters do not attain the same degree of spatial agreement as the stable group, their Jaccard values nonetheless display clear convergence behavior as the number of simulation permutations increases. Their convergence indicates that these clusters are not artifacts of insufficient simulation runs, rather they represent spatial patterns that are repeatedly detected but exhibit greater sensitivity to within-block SHH allocation. These clusters likely correspond to transitional or edge-defined concentration patterns, where a recognizable core exists but its spatial extent is less sharply defined across simulations.
The remaining 112 clusters (47%) are classified as unstable, with their area-weighted Jaccard values below 0.5 across all 10 runs. These clusters occupy the lower band of trajectories in Figure 13b and exhibit little evidence of upward convergence as the number of simulations increases. Unlike stable and moderately stable clusters, whose Jaccard values plateau at high or moderate J values, these unstable clusters have J values consistently remain low and often show minor fluctuations around their converged values. From an uncertainty modeling perspective, the persistence of low Jaccard values across increasing permutations suggests that additional simulation runs do not resolve their instability and that these clusters lack a coherent spatial core that can be repeatedly recovered under within-block stochastic SHH allocation. Their detected extents are highly sensitive to within-block randomness and boundary effects, leading to substantial variation in cluster geometry across runs.
The observed convergence provides additional evidence that the stability assessment is operating as intended in an uncertainty-explicit simulation framework. Because SimSHH deliberately introduces within-block randomness when allocating senior households to parcels, individual permutation outputs are expected to differ. Therefore, stability should be evaluated at the level of emergent spatial patterns rather than at the level of exact parcel assignments. Under this design, convergence of average area-weighted Jaccard values as permutation count increases indicates that the SimSHH and HDBSCAN clustering pipeline repeatedly recovers similar cluster geometries despite stochastic variation in underlying senior household parcel allocations.
The convergence behavior shown in Figure 13b has direct implications for determining an appropriate minimum number of simulation runs required for reliable cluster stability assessment within the NORC-SIMCLUST framework. Across the majority of detected clusters, area-weighted Jaccard values increase modestly between the 2-run and 3-run combinations, stabilize further by approximately 4–5 runs, and exhibit only marginal changes thereafter. Beyond this point, additional permutations primarily reduce residual variability in the stability estimates rather than altering the relative ordering or classification of clusters.
From a practical standpoint, these results indicate that a minimum of approximately 5 simulation runs is sufficient to obtain a stable and interpretable estimate of cluster footprint reproducibility in this case study, while additional runs (e.g., up to 10) provide increased confidence and robustness rather than fundamentally different conclusions. Importantly, clusters that ultimately converge to high stability values under the full 10-run assessment already exhibit strong stability signals at lower run counts, whereas clusters that converge to moderate or low stability do not systematically transition into the high-stability category as more permutations are added. This reinforces the interpretation that cluster footprint stability is an intrinsic property of the underlying SHH spatial pattern rather than an artifact of limited sampling during SHH simulation.
4.3.3. Merging Clusters to Form C-NORCs
After the clusters for each SimSHH permutation were discovered with the parameter-optimized HDBSCAN, they are together processed for overlapping and generating C-NORCs. Each group of spatially overlapping clusters generated using all ten permutations is merged to form a C-NORC (Figure 14a). The algorithm then quantifies the boundary of each candidate by computing the concave hull of all participating parcels (Figure 14a). Parcel participation across simulation runs is used to calculate a parcel-level confidence measure, reflecting how consistently each parcel participates in clustering. Figure 14b presents the C-NORCs, including their quantified boundaries and parcel-level confidence scores for each parcel, taking all ten SimSHH permutations into account.
Figure 14.
(a) Quantified C-NORCs with ten simulation runs as concave hulls of permutation-combined clusters, and (b) quantified cluster participation confidence for C-NORC parcels.
Figure 15 depicts the map of the detected C-NORCs characterized jointly by cluster-level stability and parcel-level participation confidence, providing a multi-scale depiction of robust SHH patterns under within-block allocation uncertainty. Cluster outlines distinguish stable, moderately stable, and unstable C-NORCs based on area-weighted Jaccard stability, while parcel shading indicates their confidence measure in clustering participation across simulations.
Figure 15.
C-NORCs characterized by both cluster footprint stability and parcel participation.
The significance of this map lies in its ability to convey both the reproducibility of cluster extents and the internal spatial structure of clusters without imposing deterministic parcel membership, thereby preserving the uncertainty-aware design of the SimSHH framework. As such, the map provides an interpretable and policy-relevant representation of where robust concentrations of senior households exist and how confidently different parts of each C-NORC can be delineated for planning and service prioritization.
4.4. NORC-ID Process and Result
The identified C-NORCs highlight specific areas in Colorado Springs with high concentrations of simulated senior households. A key strength of NORC-SIMCLUST lies in its ability to delineate C-NORCs as clusters of parcels rather than relying on rigid census block boundaries. This approach produces more practical boundary definitions, accommodating variations in size and shape (Figure 16a). Future enhancements could include interactive GIS-based tools, enabling users to explore NORCs with high spatial precision for in-depth analysis.
Figure 16.
(a) C-NORCs with census block aggregated SHH count and percentage, (b) C-NORCs with cluster stability and parcel participation confidence measures, (c) C-NORCs with residential parcel types, and (d) Identified vertical NORCs.
Figure 16a provides a plausibility check for the identified C-NORCs by overlaying their boundaries with block-level aggregated senior household counts and percentages from the original census data. The majority of C-NORC boundaries intersect census blocks with elevated counts, elevated percentages, or both, indicating consistency between the parcel-level simulation results and independently observed block-level patterns. At the same time, the figure highlights variation in senior concentration profiles across C-NORCs, with some clusters associated primarily with high absolute numbers of senior households and others with high proportional concentrations. This heterogeneity reflects the uneven residential distribution of older adults across Colorado Springs and suggests that the detected C-NORCs capture multiple expressions of senior concentration. The spatial correspondence between C-NORCs and block-level SHH indicators supports the interpretation of these clusters as meaningful representations of senior residential concentrations derived through fine-scale simulation.
A distinctive feature of our framework is its ability to assess cluster-level stability and parcel-level confidence in cluster participation. This capability allows users to filter and select parcel groups based on stability and confidence thresholds. For example, Figure 16b illustrates parcels within candidate boundaries that have a participation confidence of ≥50%, together with the stable and moderately stable cluster locations, highlighting areas of concentrated SHH with high reliability. These represent proposed NORC locations that warrant further investigation for NORC-SSP development. Researchers can focus on parcels with confidence measures ranging from 60% to 100%, or query for high-confidence parcels (90% or above) combined with land parcel type data (Figure 16c) to identify vertical NORCs within multi-unit housing parcels (Figure 16d). By layering additional information, such as socioeconomic, active aging, health, and environmental profiles, users can explore multidimensional interactions and connections related to these NORCs.
Quantifying the boundaries of each C-NORC creates opportunities for in-depth analysis through spatial queries and summary statistics. This approach enables a closer examination of parcel and housing type compositions within candidate areas. For example, Figure 17 shows previously identified 10-run NORCs with a participation confidence of 10% or greater. This analysis allows classification and ranking of candidates based on key factors, including the overall percentage of SHH (Figure 17a), the extent of residential areas (Figure 17b), the presence of duplex and triplex units (Figure 17c), and multi-unit housing (Figure 17d).
Figure 17.
NORC characterization by their (a) composition of different residential housing types, (b) percentage of residential parcels, (c) percentage of duplex and triplex housing parcels, and (d) percentage of multiple unit residential parcels.
Future enhancements could incorporate functionality for exploring each C-NORC within a localized settlement and socio-environmental context (Figure 18). Such advancements would support an interactive information discovery system, significantly aiding research and policy integration. This capability would allow researchers to systematically address questions about resource accessibility, community associations, co-location patterns, and social networks. By providing this level of detail, the framework can enable analyses that go beyond the limitations of existing quantitative studies.
Figure 18.
Identified NORCs WITH 50% or more confidence level and their neighborhood context with three zoom-in areas.
5. Conclusions
This study introduces NORC-SIMCLUST, a geospatial framework for identifying Naturally Occurring Retirement Communities (NORCs) at the housing-unit-constrained parcel level. By disaggregating census block-level senior household counts to parcel-based residential housing units, the framework overcomes key limitations of traditional areal-based approaches that rely on aggregated zones and are affected by the Modifiable Areal Unit Problem (MAUP) and residential misalignment. NORC-SIMCLUST integrates dasymetric population simulation with shape-agnostic, parameter-optimized density-based clustering, enabling the detection of both vertical NORCs (single buildings) and fragmented horizontal NORCs that are often missed by conventional workflows.
A central contribution of this work lies in its uncertainty-aware design. Through repeated simulations and parameter sensitivity assessment, NORC-SIMCLUST quantifies cluster-level footprint stability and parcel-level participation confidence, transforming NORC identification from a heuristic mapping exercise into a reproducible geospatial inference framework. These confidence-aware delineations support interpretable, actionable insights for aging-in-place planning, service targeting, and mixed-methods research, while explicitly distinguishing robust spatial structures from patterns that are sensitive to within-block allocation uncertainty.
Beyond its immediate application, NORC-SIMCLUST provides a scalable and transferable foundation for demographic spatial analysis that bridges geographic information science and social policy. Future research can extend this framework in several directions. Periodic reidentification using updated census and parcel data would enable longitudinal monitoring of NORC formation, persistence, and decline. Integration with ancillary datasets, such as mobility patterns, healthcare accessibility, active aging facilities, and social vulnerability indicators, could further enrich cluster interpretation and support multidimensional aging strategies. Scaling and automating the workflow for multi-city or national deployments, combined with mixed-methods validation that integrates quantitative outputs with qualitative fieldwork, would strengthen confidence in delineations and improve alignment with the lived experiences of older adults.
In addition, while the current implementation constrains within-block allocation using housing-unit counts, the SimSHH algorithm can be readily extended to incorporate alternative constraints, such as building attributes, accessibility measures, or preference-informed weighting, by integrating these factors into the parcel-level allocation probability structure. Systematic evaluation of alternative constrained allocation schemes and their effects on cluster stability represents a natural extension of NORC-SIMCLUST rather than a limitation of the present design.
By reframing NORC detection as a confidence-aware geospatial inference problem grounded in residential alignment and stability assessment, NORC-SIMCLUST advances demographic analytics and provides a robust methodological foundation for supporting equitable, evidence-based aging-in-place initiatives.
Supplementary Materials
The following supporting information can be downloaded at: https://www.mdpi.com/article/10.3390/ijgi15040149/s1, Colorado Springs census tract data, census block data, and parcel data in shapefile format.
Author Contributions
Conceptualization, Khac An Dao and Thi Hong Diep Dao; methodology, Thi Hong Diep Dao and Khac An Dao; software, Khac An Dao and Thi Hong Diep Dao; validation, Khac An Dao and Thi Hong Diep Dao; formal analysis, Thi Hong Diep Dao and Khac An Dao; investigation, Khac An Dao and Thi Hong Diep Dao; resources, Khac An Dao and Thi Hong Diep Dao; data curation, Khac An Dao and Thi Hong Diep Dao; writing—original draft preparation, Khac An Dao and Thi Hong Diep Dao; writing—review and editing, Thi Hong Diep Dao and Khac An Dao; visualization, Khac An Dao and Thi Hong Diep Dao. All authors have read and agreed to the published version of the manuscript.
Funding
This research received no external funding.
Institutional Review Board Statement
Not applicable.
Informed Consent Statement
Not applicable.
Data Availability Statement
All data used in this research are included in the article/Supplementary Materials. Inquiries on the code can be directed to the corresponding author.
Conflicts of Interest
The authors declare no conflicts of interest.
Abbreviations
The following abbreviations are used in this manuscript:
| C-NORC | Candidate Natural Occurring Retirement Community |
| DBSCAN | Density-Based Spatial Clustering of Applications with Noise |
| HDBSCAN | Hierarchical Density-Based Spatial Clustering of Applications with Noise |
| GIS | Geographical Information Science |
| NORC | Natural Occurring Retirement Community |
| NORC-SSP | Natural Occurring Retirement Community—Support Service Program |
| SHH | Senior Household |
References
- United Nations Department of Economic and Social Affairs (UNDESA). Our World Is Growing Older: UN DESA Releases New Report on Ageing; UN DESA: New York, NY, USA, 2019; Available online: https://www.un.org/development/desa/en/news/population/our-world-is-growing-older.html (accessed on 18 December 2025).
- E, J.; Xia, B.; Susilawati, C.; Chen, Q.; Wang, X. An Overview of Naturally Occurring Retirement Communities (NORCs) for Ageing in Place. Buildings 2022, 12, 519. [Google Scholar] [CrossRef] [Scilit]
- Parniak, S.; DePaul, V.G.; Frymire, C.; DePaul, S.; Donnelly, C. Naturally Occurring Retirement Communities: Scoping Review. JMIR Aging 2022, 5, e34577. [Google Scholar] [CrossRef] [Scilit]
- Hunt, M.E.; Gunter-Hunt, G. Naturally Occurring Retirement Communities. J. Hous. Elder. 1986, 3, 3–22. [Google Scholar] [CrossRef] [Scilit]
- Kloseck, M.; Crilly, R.G.; Gutman, G. Naturally Occurring Retirement Communities: Untapped Resources to Enable Optimal Aging at Home. J. Hous. Elder. 2010, 24, 392–412. [Google Scholar] [CrossRef] [Scilit]
- Bedney, B.J.; Goldberg, R.B.; Josephson, K. Aging in Place in Naturally Occurring Retirement Communities: Transforming Aging Through Supportive Service Programs. J. Hous. Elder. 2010, 24, 304–321. [Google Scholar] [CrossRef] [Scilit]
- Marshall, L.J.; Hunt, M. Rural Naturally Occurring Retirement Communities. J. Hous. Elder. 2008, 13, 19–34. [Google Scholar] [CrossRef] [Scilit]
- Vladeck, F.; Segel, R. Identifying Risks to Healthy Aging in New York City’s Varied NORCs. J. Hous. Elder. 2010, 24, 356–372. [Google Scholar] [CrossRef] [Scilit]
- Aurand, A.; Miles, R.; Usher, K. Local Environment of Neighborhood Naturally Occurring Retirement Communities (NORCs) in a Mid-Sized U.S. City. J. Hous. Elder. 2014, 28, 133–164. [Google Scholar] [CrossRef] [Scilit]
- Hunt, M.E.; Marshall, L.J.; Merrill, J.L. Rural Areas That Affect Older Migrants. J. Archit. Plan. Res. 2002, 19, 44–56. [Google Scholar]
- Anetzberger, G.J. Community Options of Greater Cleveland, Ohio: Preliminary Evaluation of a Naturally Occurring Retirement Community Program. Clin. Gerontol. 2009, 33, 1–15. [Google Scholar] [CrossRef] [Scilit]
- Rivera-Hernandez, M.; Yamashita, T.; Kinney, J.M. Identifying Naturally Occurring Retirement Communities: A Spatial Analysis. J. Gerontol. B Psychol. Sci. Soc. Sci. 2015, 70, 619–627. [Google Scholar] [CrossRef] [Scilit]
- E, J.; Xia, B.; Buys, L.; Yigitcanlar, T. Sustainable Urban Development for Older Australians: Understanding the Formation of Naturally Occurring Retirement Communities in the Greater Brisbane Region. Sustainability 2021, 13, 9853. [Google Scholar] [CrossRef] [Scilit]
- DePaul, V.G.; Parniak, S.; Frymire, C.; DePaul, S.A.; Donnelly, C.A. Identification and Engagement of Naturally Occurring Retirement Communities to Support Healthy Aging in Canada: A Set of Methods for Replication. JMIR Aging 2022, 5, e37617. [Google Scholar] [CrossRef] [Scilit] [PubMed]
- Peng, Z.; Wang, R.; Liu, L.; Wu, H. Fine-Scale Dasymetric Population Mapping with Mobile Phone and Building Use Data Based on Grid Voronoi Method. ISPRS Int. J. Geo-Inf. 2020, 9, 344. [Google Scholar] [CrossRef] [Scilit]
- Bonnevie, I.M.; Hansen, H.S.; Schrøder, L. Dasymetric Algorithms Using Land Cover to Estimate Human Population at Smaller Spatial Scales. ISPRS Int. J. Geo-Inf. 2024, 13, 427. [Google Scholar] [CrossRef] [Scilit]
- Zhao, Y.; Zhang, Y.; Wang, H.; Du, X.; Li, Q.; Zhu, J. Intraday Variation Mapping of Population Age Structure via Urban-Functional-Region-Based Scaling. Remote Sens. 2021, 13, 805. [Google Scholar] [CrossRef] [Scilit]
- Friedman, S.; Fang, C.; Yang, T.-C.; Li, R.; Mithu, I.H.; Manganello, J.A.; Romeiko, X.; Lin, S. Mapping the Vulnerability of Older-Adult Neighborhoods: An Ecological Study of New York State. Int. J. Environ. Res. Public Health 2025, 22, 332. [Google Scholar] [CrossRef] [Scilit]
- Cartagena-Colón, M.; Mattei, H.; Wang, C. Dasymetric Mapping of Population Using Land Cover Data in JBNERR, Puerto Rico during 1990–2010. Land 2022, 11, 2301. [Google Scholar] [CrossRef] [Scilit]
- Rebelo, C.; Rodrigues, A.M.; Tenedório, J.A. Dasymetric Mapping Using UAV High Resolution 3D Data within Urban Areas. Remote Sens. 2019, 11, 1716. [Google Scholar] [CrossRef] [Scilit]
- Aquilino, M.; Adamo, M.; Blonda, P.; Barbanente, A.; Tarantino, C. Improvement of a Dasymetric Method for Implementing Sustainable Development Goal 11 Indicators at an Intra-Urban Scale. Remote Sens. 2021, 13, 2835. [Google Scholar] [CrossRef] [Scilit]
- Bronstein, L.; Kenaley, B.L.D. Learning from Vertical NORCs: Challenges and Recommendations for Horizontal NORCs. J. Hous. Elder. 2010, 24, 237–248. [Google Scholar] [CrossRef] [Scilit]
- Dao, T.H.D.; Dao, K.A.; Barboza-Salerno, G. Uncovering Spatial Patterns of Residential Settlements, Segregation, and Vulnerability of Urban Seniors Using Geospatial Analytics and Modeling Techniques. Urban Sci. 2024, 8, 81. [Google Scholar] [CrossRef] [Scilit]
- Anselin, L. Local Indicators of Spatial Association—LISA. Geogr. Anal. 1995, 27, 93–115. [Google Scholar] [CrossRef] [Scilit]
- Getis, A.; Ord, J.K. The Analysis of Spatial Association by Use of Distance Statistics. Geogr. Anal. 1992, 24, 189–206. [Google Scholar] [CrossRef] [Scilit]
- Morrison, P.A.; Bryan, T.M. Targeting Spatial Clusters of Elderly Consumers in the U.S.A. Popul. Res. Policy Rev. 2010, 29, 33–46. [Google Scholar] [CrossRef] [Scilit]
- Li, F.; Zhou, J.; Wei, W.; Yin, L. Spatial Distribution Pattern and Evolution Characteristics of Elderly Population in Wuhan Based on Census Data. Land 2023, 12, 1350. [Google Scholar] [CrossRef] [Scilit]
- Lu, B.; Dong, Z.; Yue, P.; Qin, K. Spatial Analysis of the Aging Population and Socio-economic Factors of China: Global and Local Perspectives. J. Geod. Geoinf. Sci. 2024, 7, 37–51. [Google Scholar] [CrossRef]
- Eicher, C.L.; Brewer, C.A. Dasymetric Mapping and Areal Interpolation: Implementation and Evaluation. Cartogr. Geogr. Inf. Sci. 2001, 28, 125–138. [Google Scholar] [CrossRef] [Scilit]
- Sleeter, R.; Gould, M. Geographic Information System Software to Remodel Population Data Using Dasymetric Mapping Methods; U.S. Geological Survey—Techniques and Methods 11-C2; U.S. Geological Survey: Reston, VA, USA, 2007; 15p. [CrossRef] [Scilit]
- Openshaw, S. The Modifiable Area Unit Problem; Concepts and Techniques in Modern Geography; Geo Books: Norwich, UK, 1984; Volume 38. [Google Scholar]
- Wong, D.W.S. The Modifiable Areal Unit Problem (MAUP). In WorldMinds: Geographical Perspectives on 100 Problems; Janelle, D.G., Warf, B., Hansen, K., Eds.; Springer: Dordrecht, The Netherlands, 2004; pp. 571–575. [Google Scholar] [CrossRef] [Scilit]
- Manley, D. Scale, Aggregation, and the Modifiable Areal Unit Problem. In Handbook of Regional Science, Living Reference Entry; Fischer, M.M., Nijkamp, P., Eds.; Springer: Berlin/Heidelberg, Germany, 2019; pp. 1–15. [Google Scholar] [CrossRef] [Scilit]
- Campello, R.J.G.B.; Moulavi, D.; Sander, J. Density-Based Clustering Based on Hierarchical Density Estimates. In Advances in Knowledge Discovery and Data Mining: 17th Pacific-Asia Conference, PAKDD 2013; Springer: Berlin/Heidelberg, Germany, 2013; pp. 160–172. [Google Scholar] [CrossRef] [Scilit]
- Campello, R.J.G.B.; Moulavi, D.; Zimek, A.; Sander, J. Hierarchical Density Estimates for Data Clustering, Visualization, and Outlier Detection. ACM Trans. Knowl. Discov. Data 2015, 10, 1–51. [Google Scholar] [CrossRef] [Scilit]
- McInnes, L.; Healy, J.; Astels, S. HDBSCAN: Hierarchical Density Based Clustering. J. Open Source Softw. 2017, 2, 205. [Google Scholar] [CrossRef] [Scilit]
- O’Sullivan, D.; Unwin, D.J. Geographic Information Analysis, 2nd ed.; John Wiley & Sons: Hoboken, NJ, USA, 2010. [Google Scholar]
- Rousseeuw, P.J. Silhouettes: A Graphical Aid to the Interpretation and Validation of Cluster Analysis. J. Comput. Appl. Math. 1987, 20, 53–65. [Google Scholar] [CrossRef] [Scilit]
- Moulavi, D.; Jaskowiak, P.A.; Campello, R.J.G.B.; Zimek, A.; Sander, J. Density-Based Clustering Validation. In Proceedings of the 2014 SIAM International Conference on Data Mining (SDM); SIAM: Philadelphia, PA, USA, 2014; pp. 839–847. [Google Scholar] [CrossRef] [Scilit]
- Arthur, D.; Vassilvitskii, S. K-means++: The Advantages of Careful Seeding. In Proceedings of the Eighteenth Annual ACM-SIAM Symposium on Discrete Algorithms (SODA ’07); Society for Industrial and Applied Mathematics: Philadelphia, PA, USA, 2007; pp. 1027–1035. [Google Scholar]
- Edelsbrunner, H.; Kirkpatrick, D.; Seidel, R. On the shape of a set of points in the plane. IEEE Trans. Inf. Theory 1983, 29, 551–559. [Google Scholar] [CrossRef] [Scilit]
- Asaeedi, S.; Didehvar, F.; Mohades, A. α-Concave hull, a generalization of convex hull. Theor. Comput. Sci. 2017, 702, 48–59. [Google Scholar] [CrossRef] [Scilit]
- Levy, A.; Shalom, B.R.; Chalamish, M. A guide to similarity measures and their data science applications. J. Big Data 2025, 12, 188. [Google Scholar] [CrossRef] [Scilit]
- Tang, M.; Kaymaz, Y.; Logeman, B.L.; Eichhorn, S.W.; Liang, Z.S.; Dulac, C.; Sackton, T.B. Evaluating single-cell cluster stability using the Jaccard similarity index. Bioinformatics 2021, 37, 2212–2214. [Google Scholar] [CrossRef] [Scilit] [PubMed]
- U.S. News & World Report. Best Places to Live in the U.S. in 2023–2024. Available online: https://realestate.usnews.com/places/rankings/best-places-to-live (accessed on 22 April 2024).
- City of Colorado Springs. Comprehensive Plan and Land Use Data. Available online: https://coloradosprings.gov (accessed on 19 December 2025).
- Colorado Energy Office. Colorado Springs Land Use and Zoning Overview. Available online: https://energyoffice.colorado.gov (accessed on 19 December 2025).
- U.S. Department of Housing and Urban Development (HUD). Consolidated Plan for Colorado Springs. Available online: https://coloradosprings.gov/2025AnnualActionPlan (accessed on 19 December 2025).
- The United States Census Bureau. QuickFacts Colorado Springs City, Colorado. Available online: https://www.census.gov/quickfacts/fact/table/coloradospringscitycolorado/POP010220#POP010220 (accessed on 31 March 2024).
- Golant, S.M. The Quest for Residential Normalcy by Older Adults: Relocation But One Pathway. J. Aging Stud. 2011, 25, 193–205. [Google Scholar] [CrossRef] [Scilit]
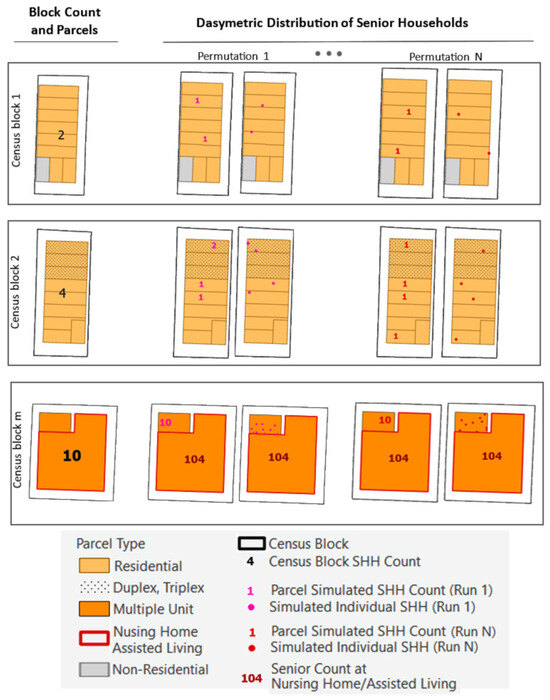
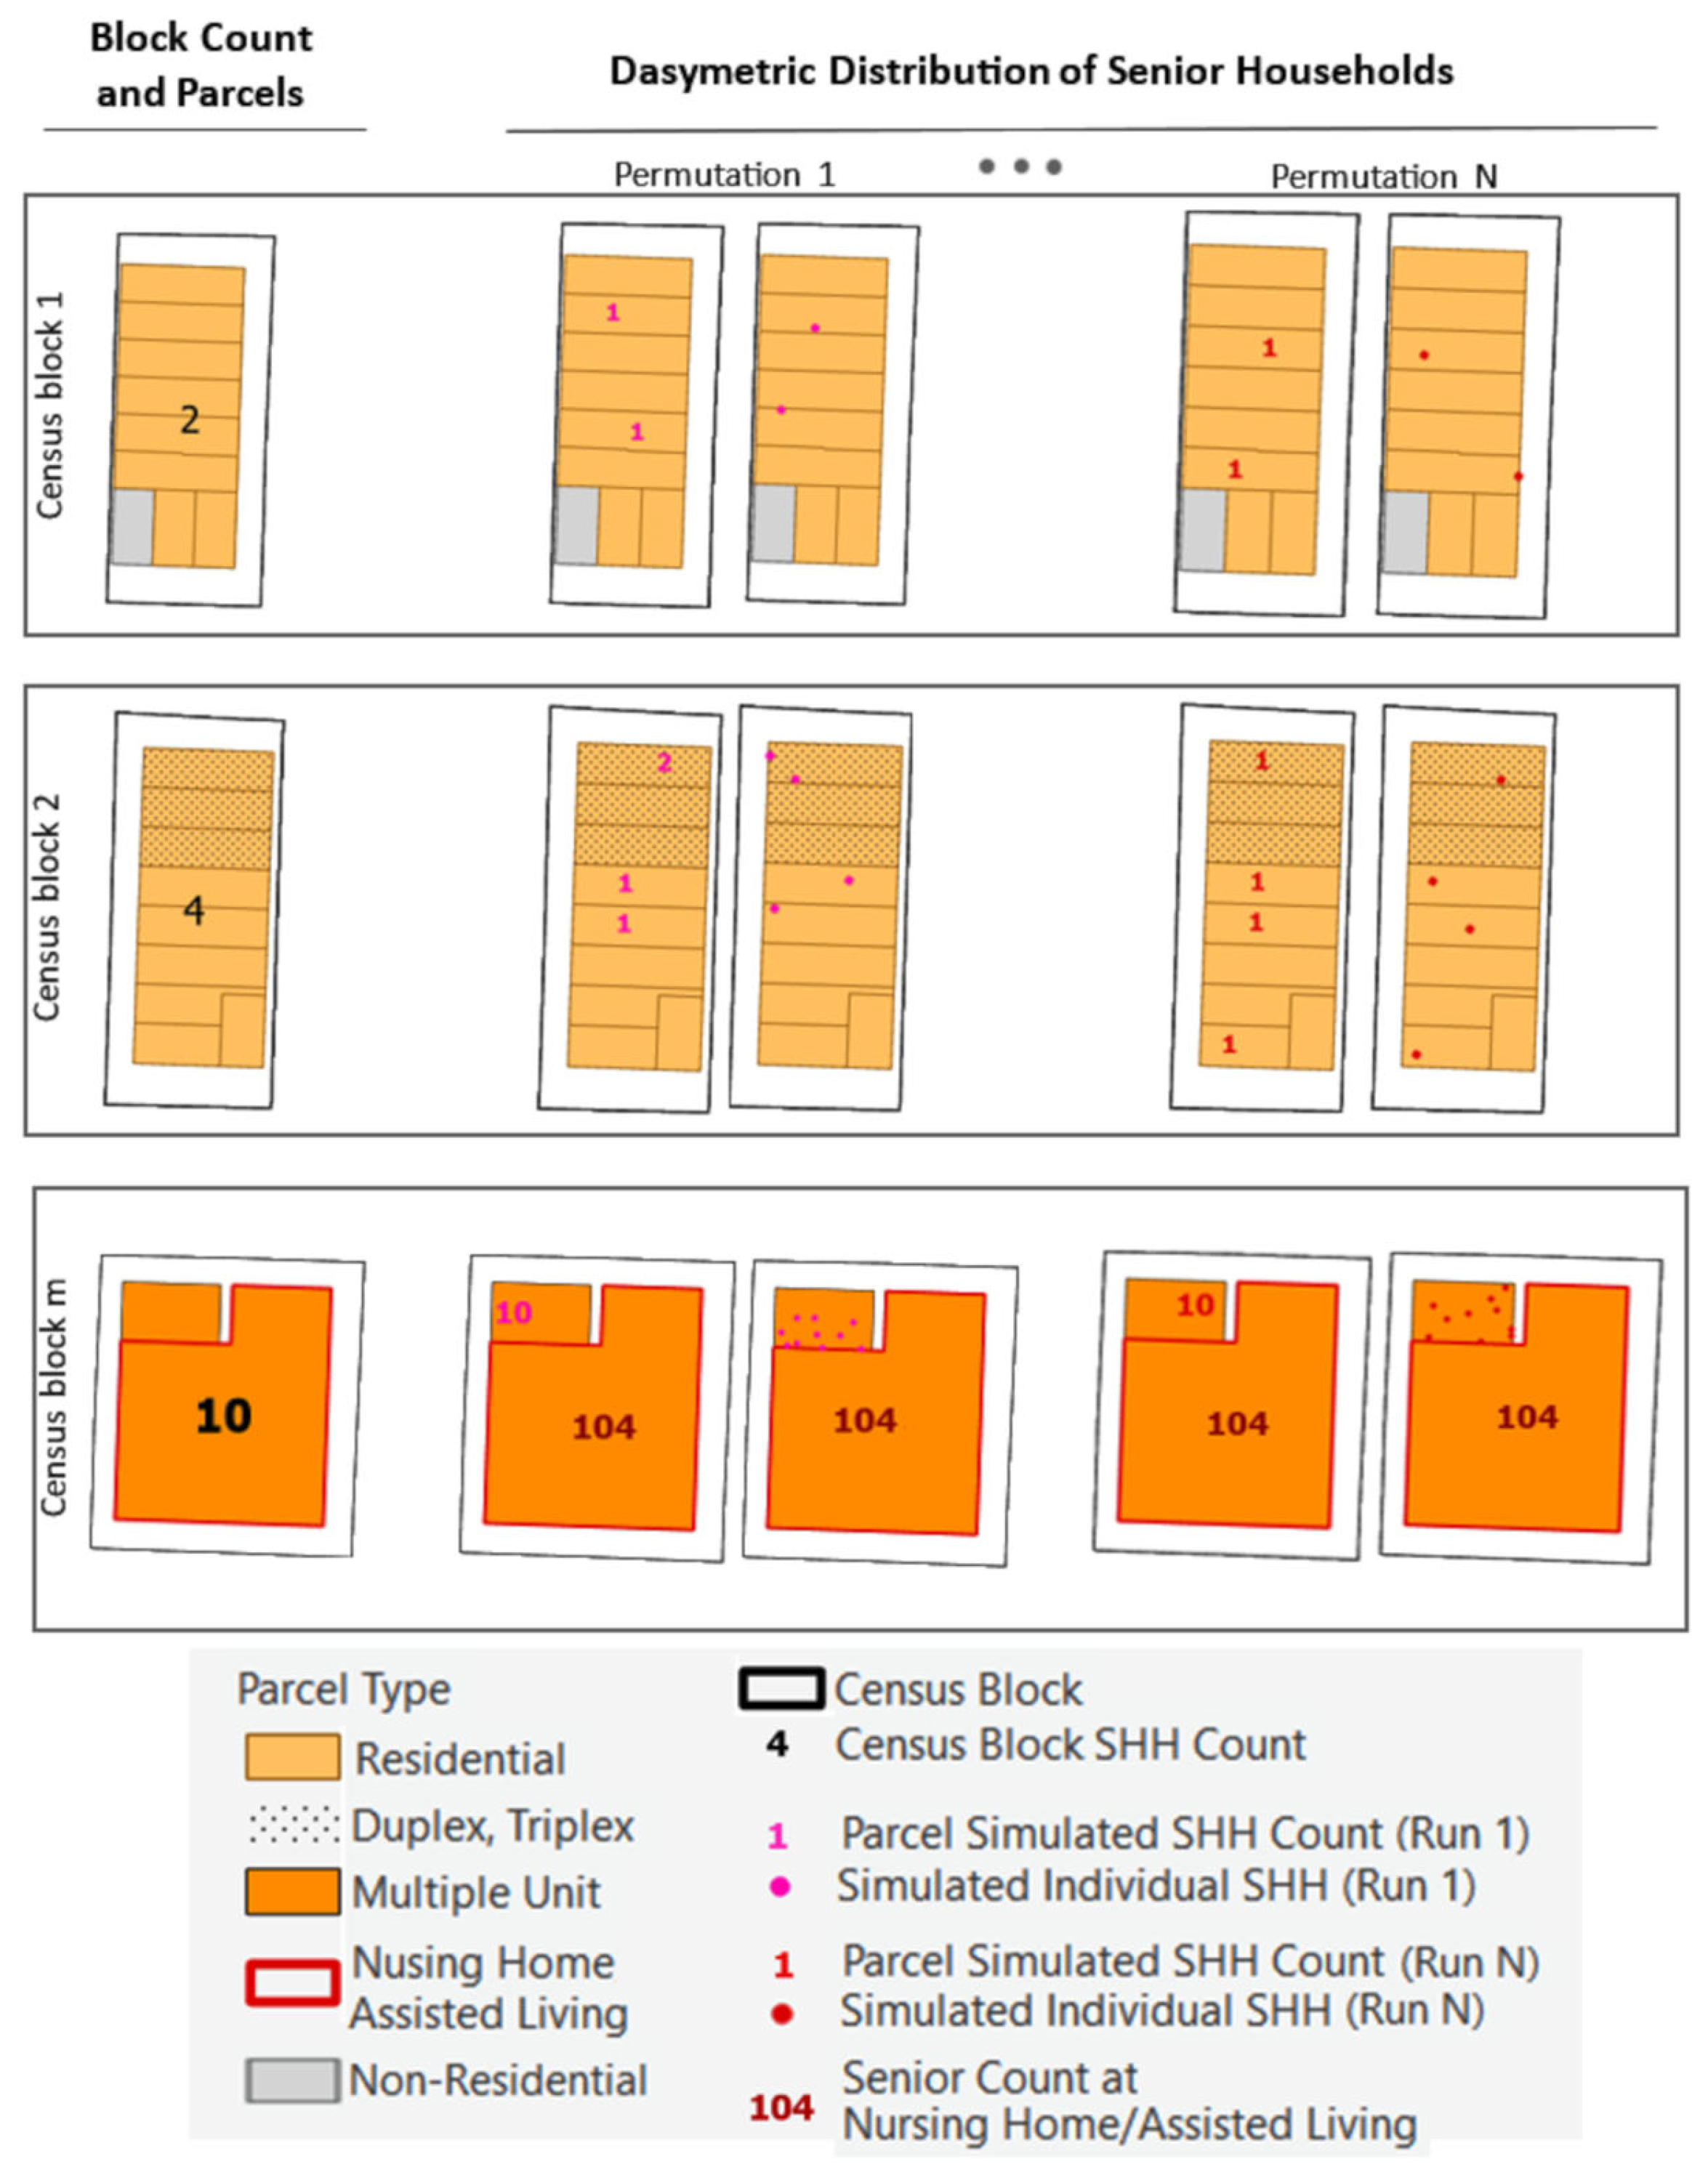
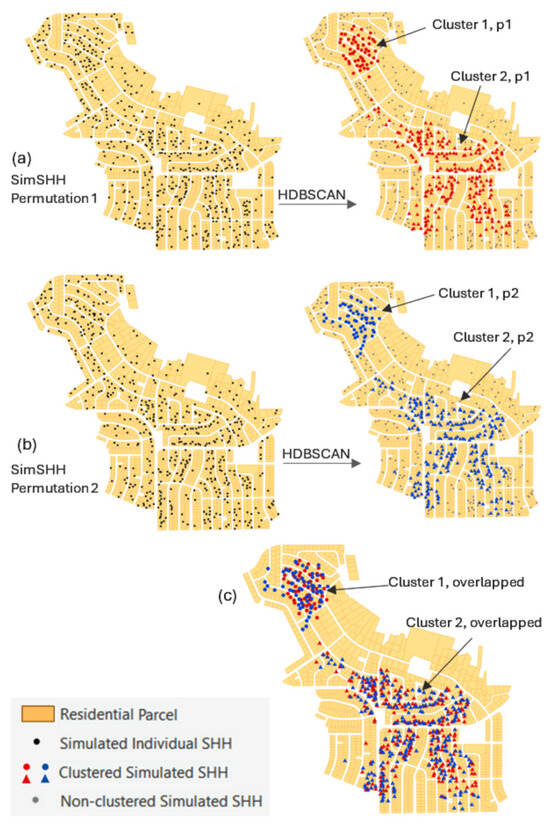
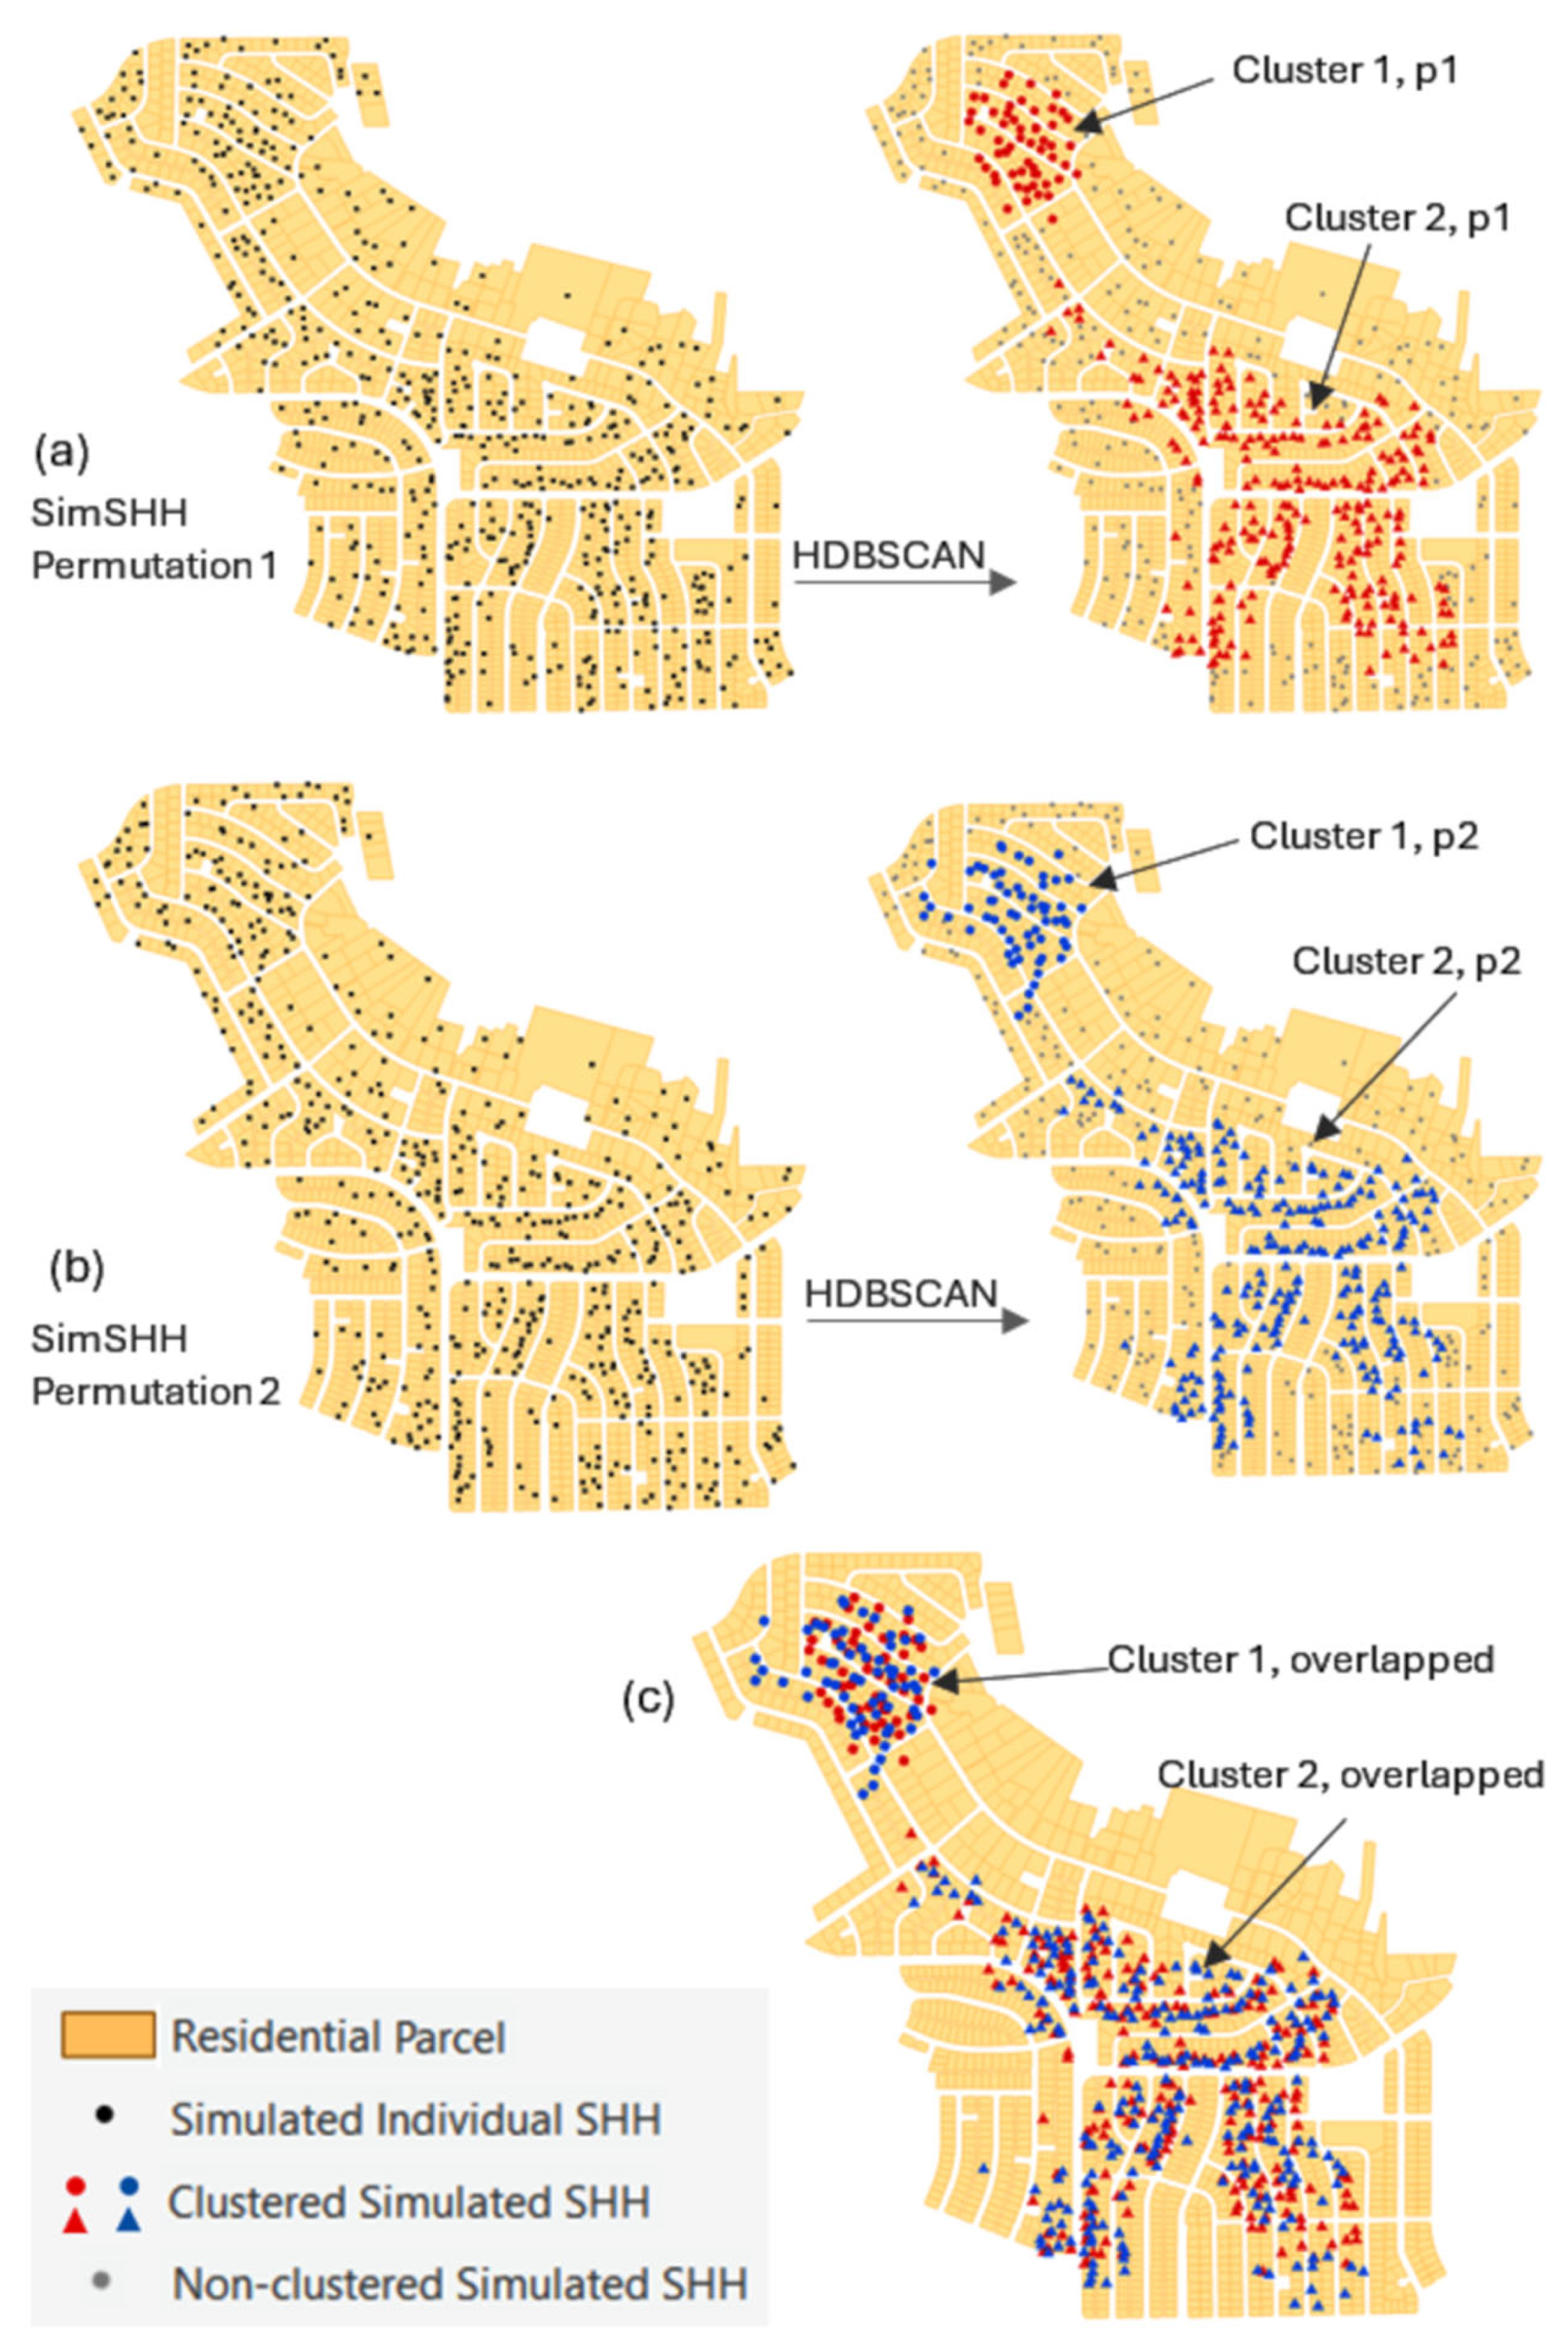
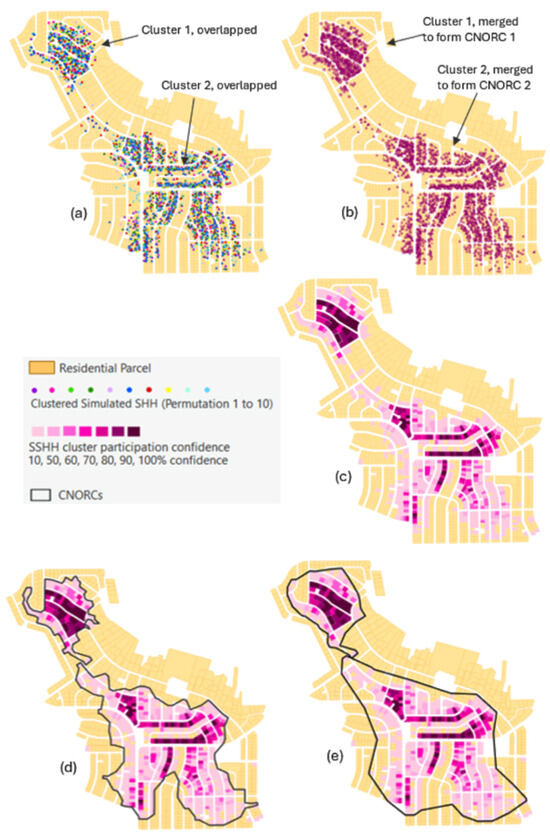
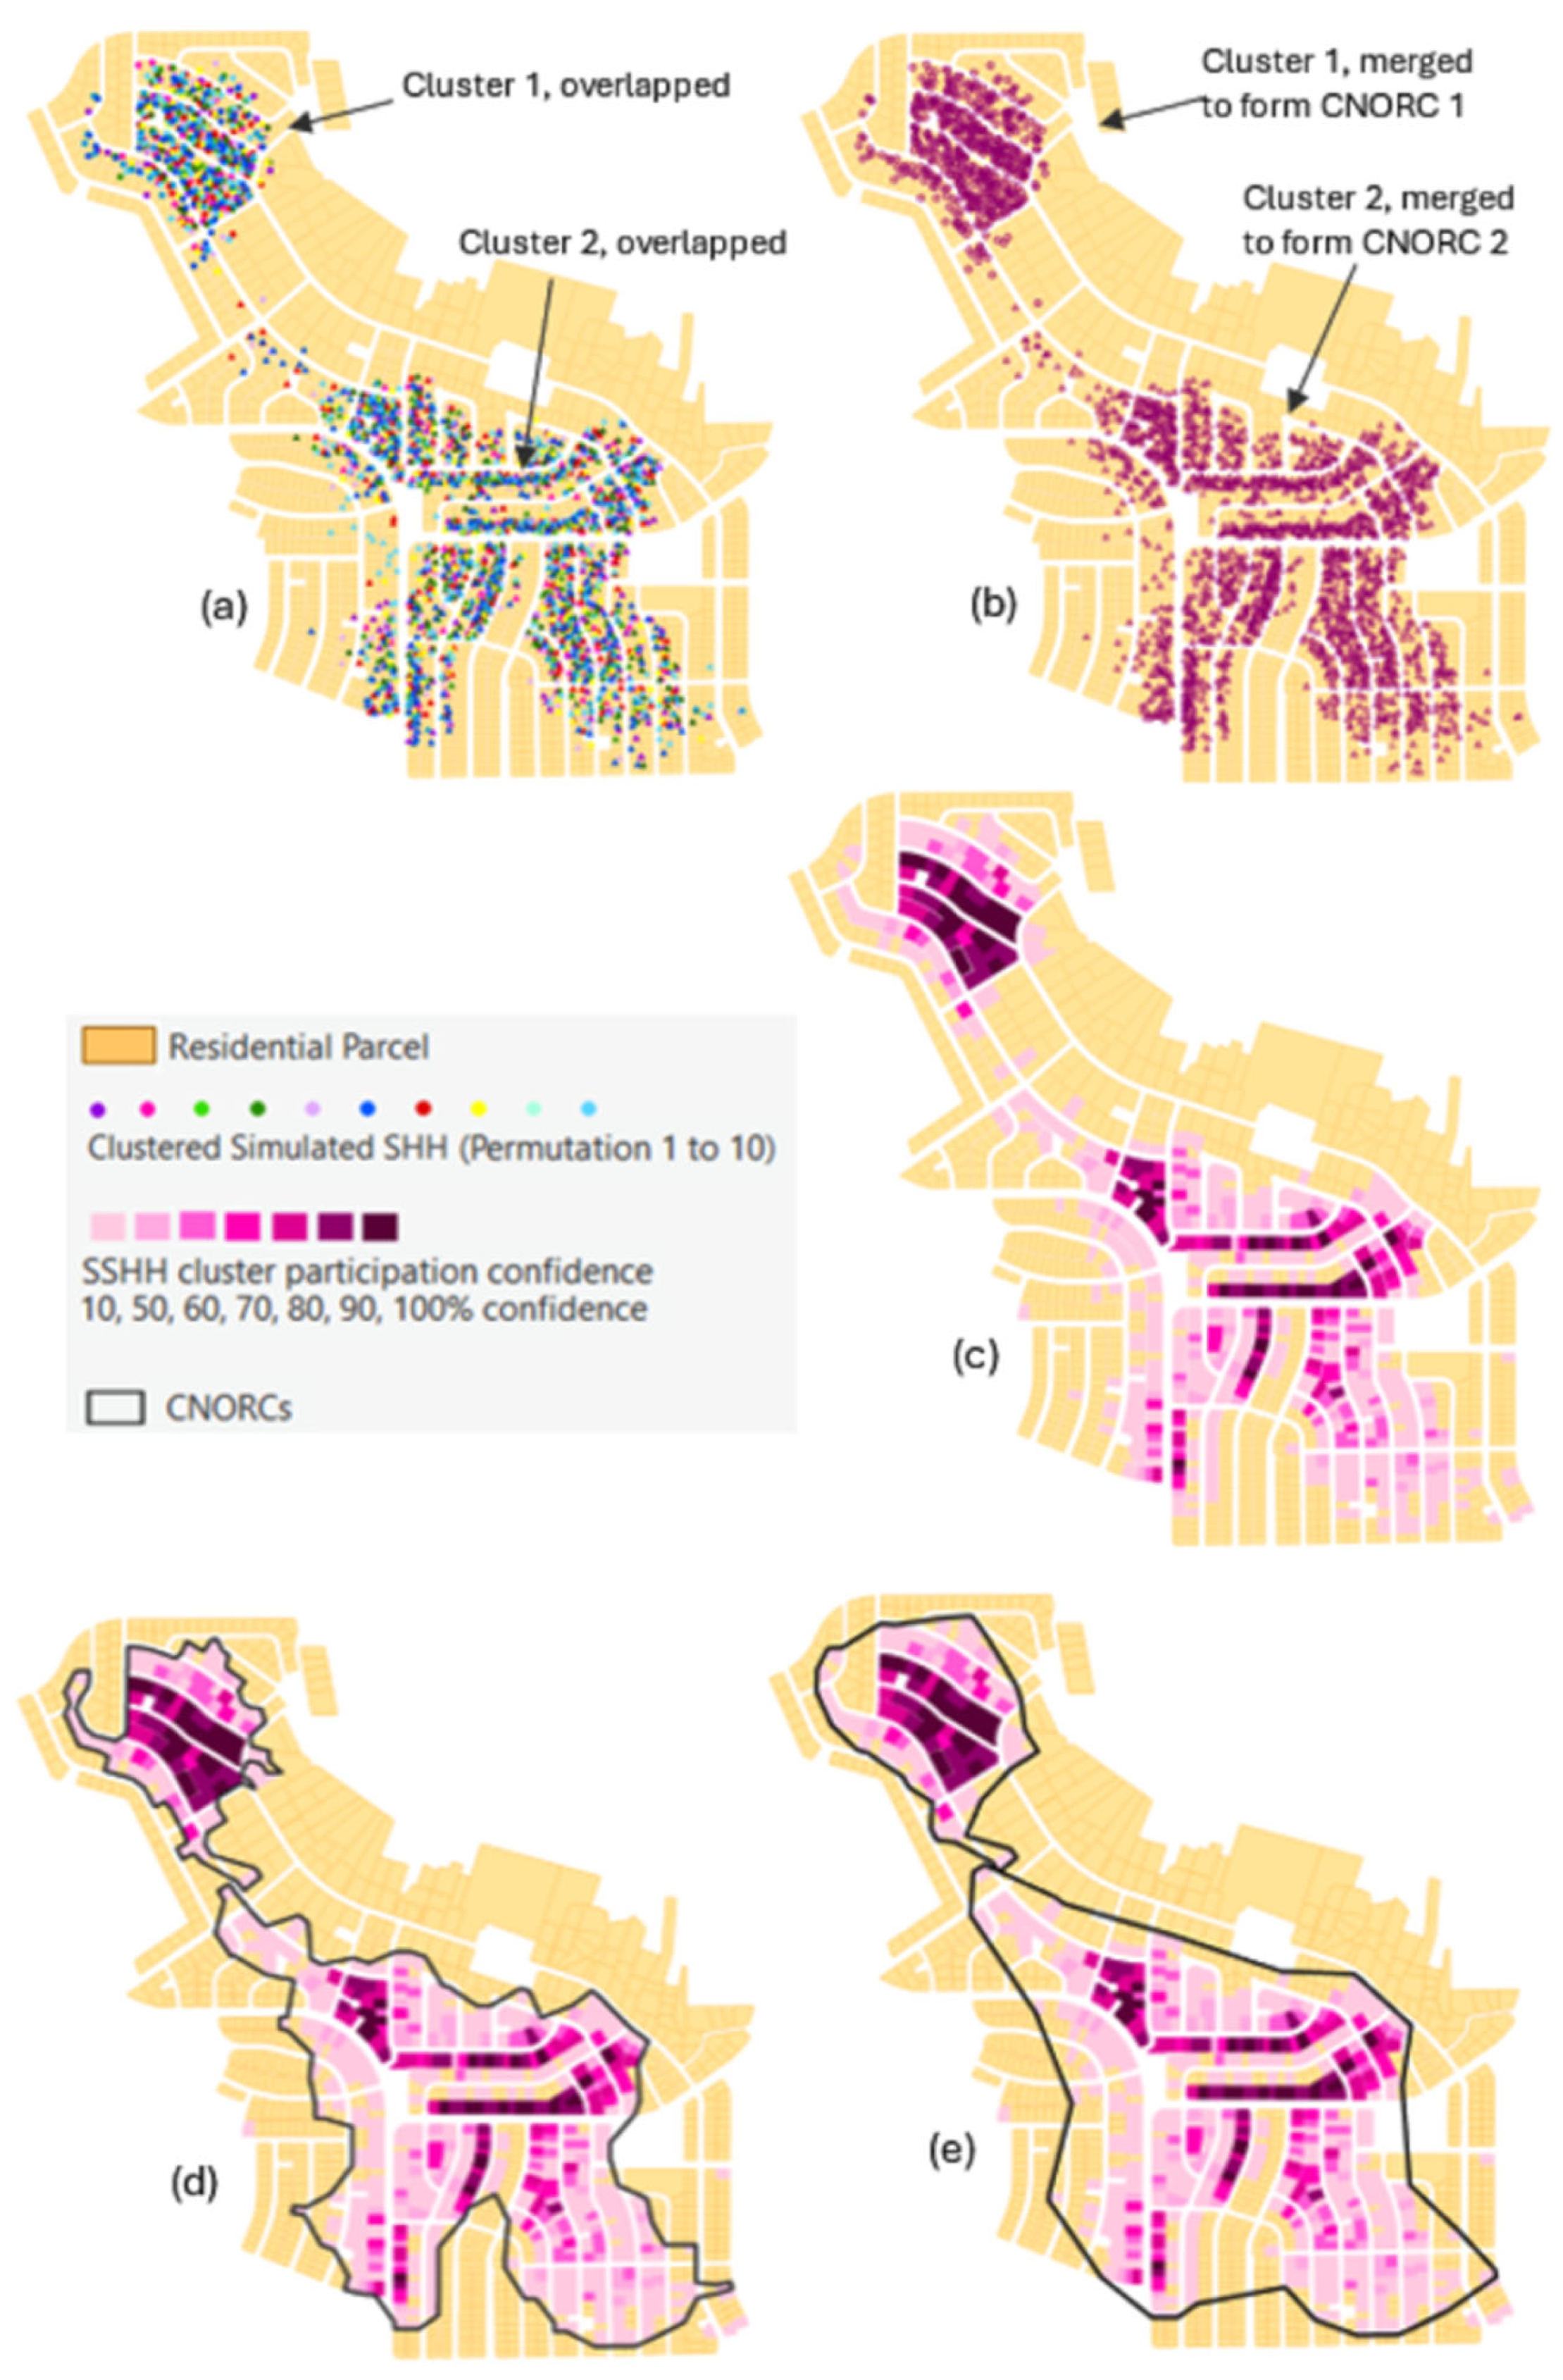
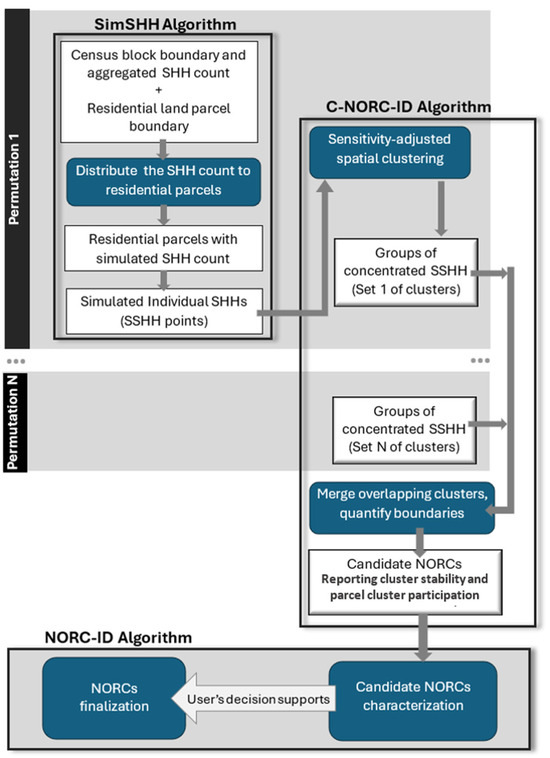
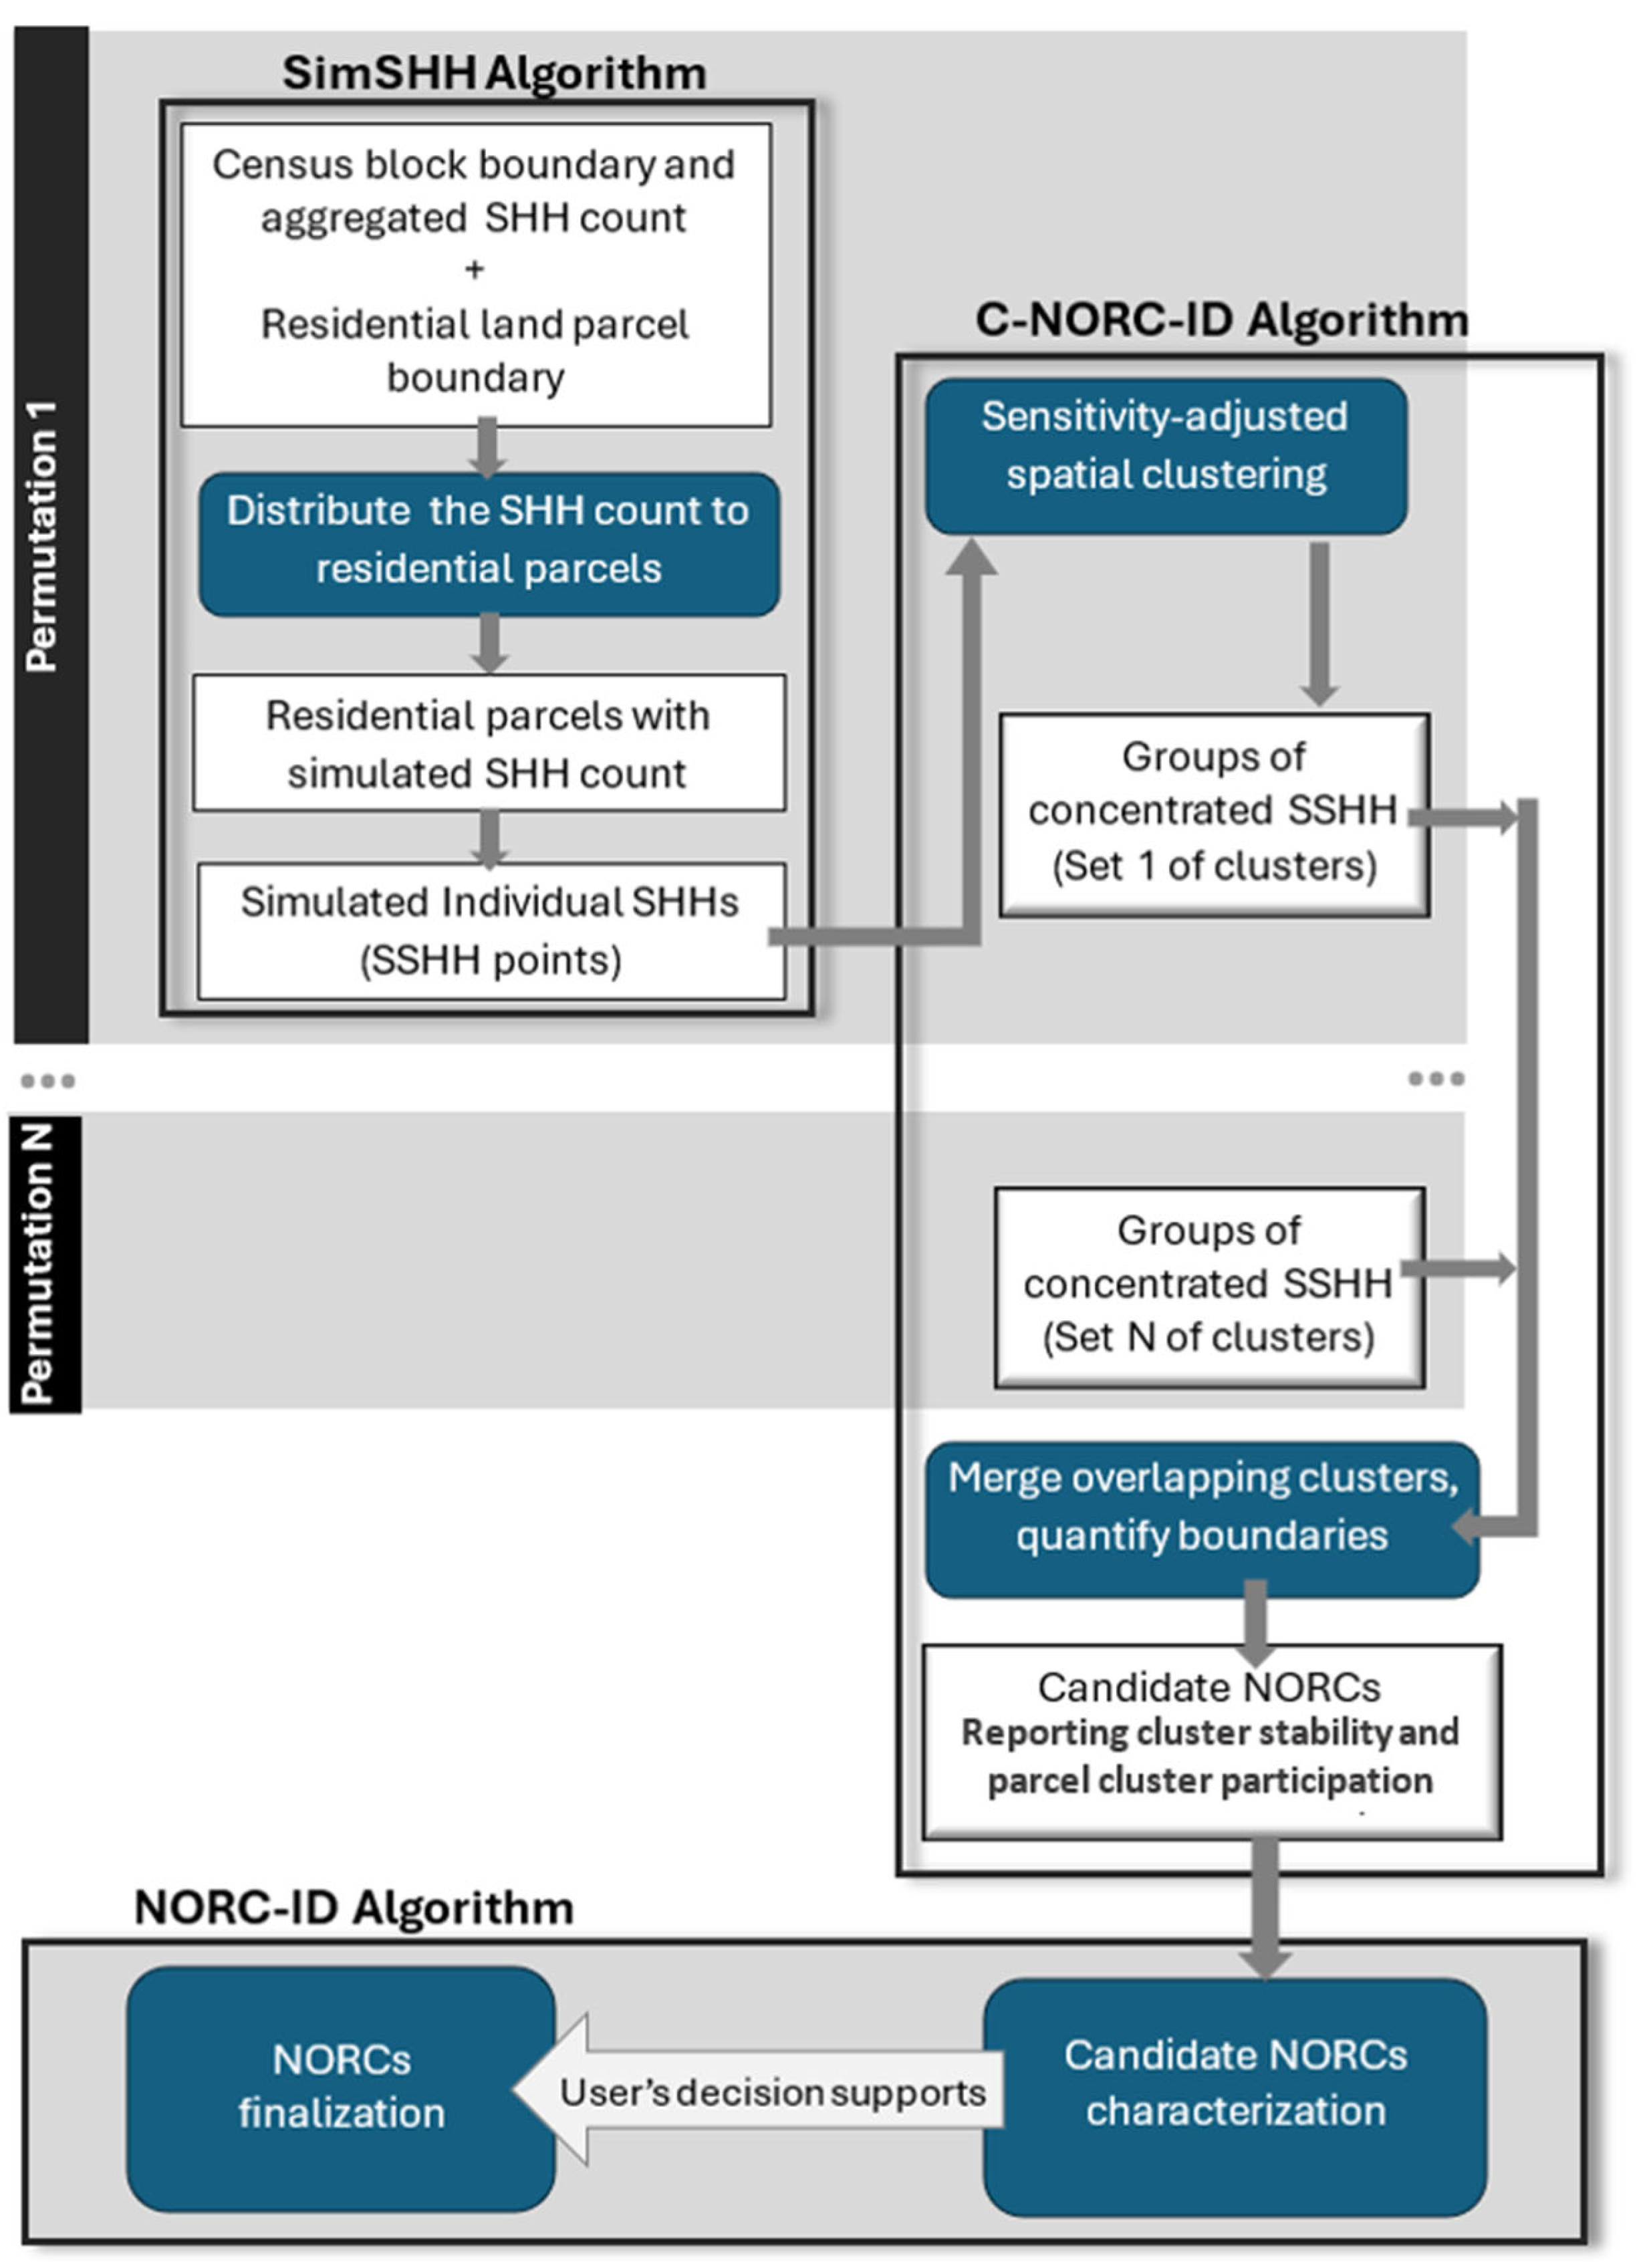
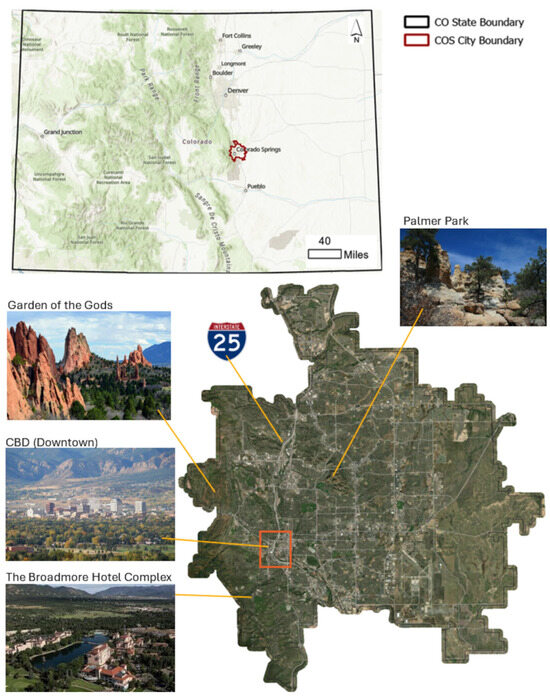
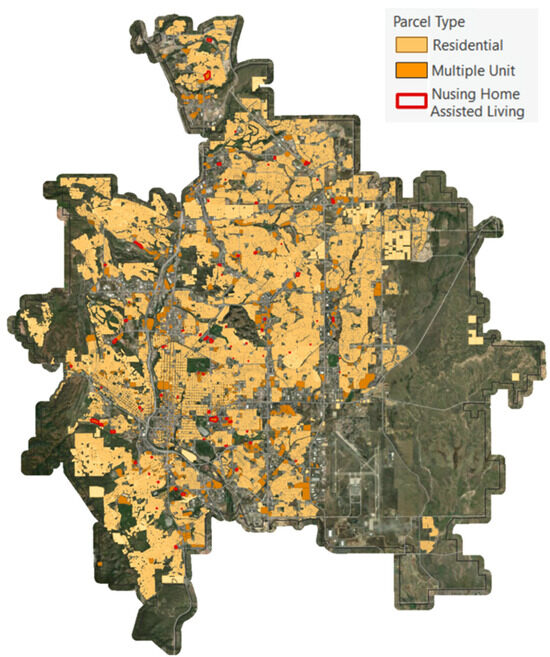
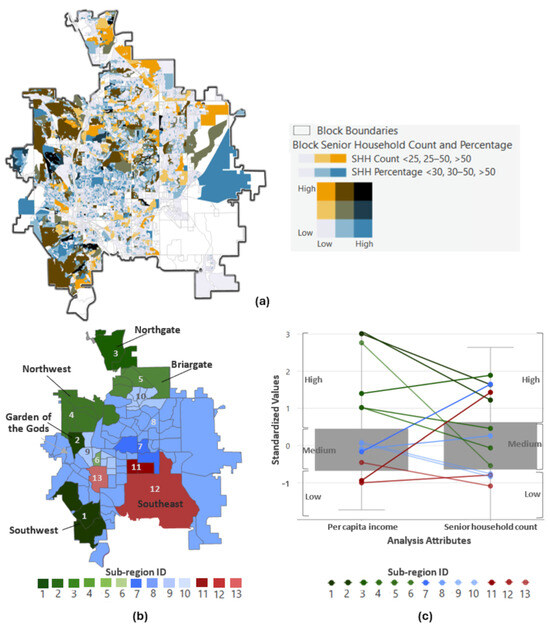
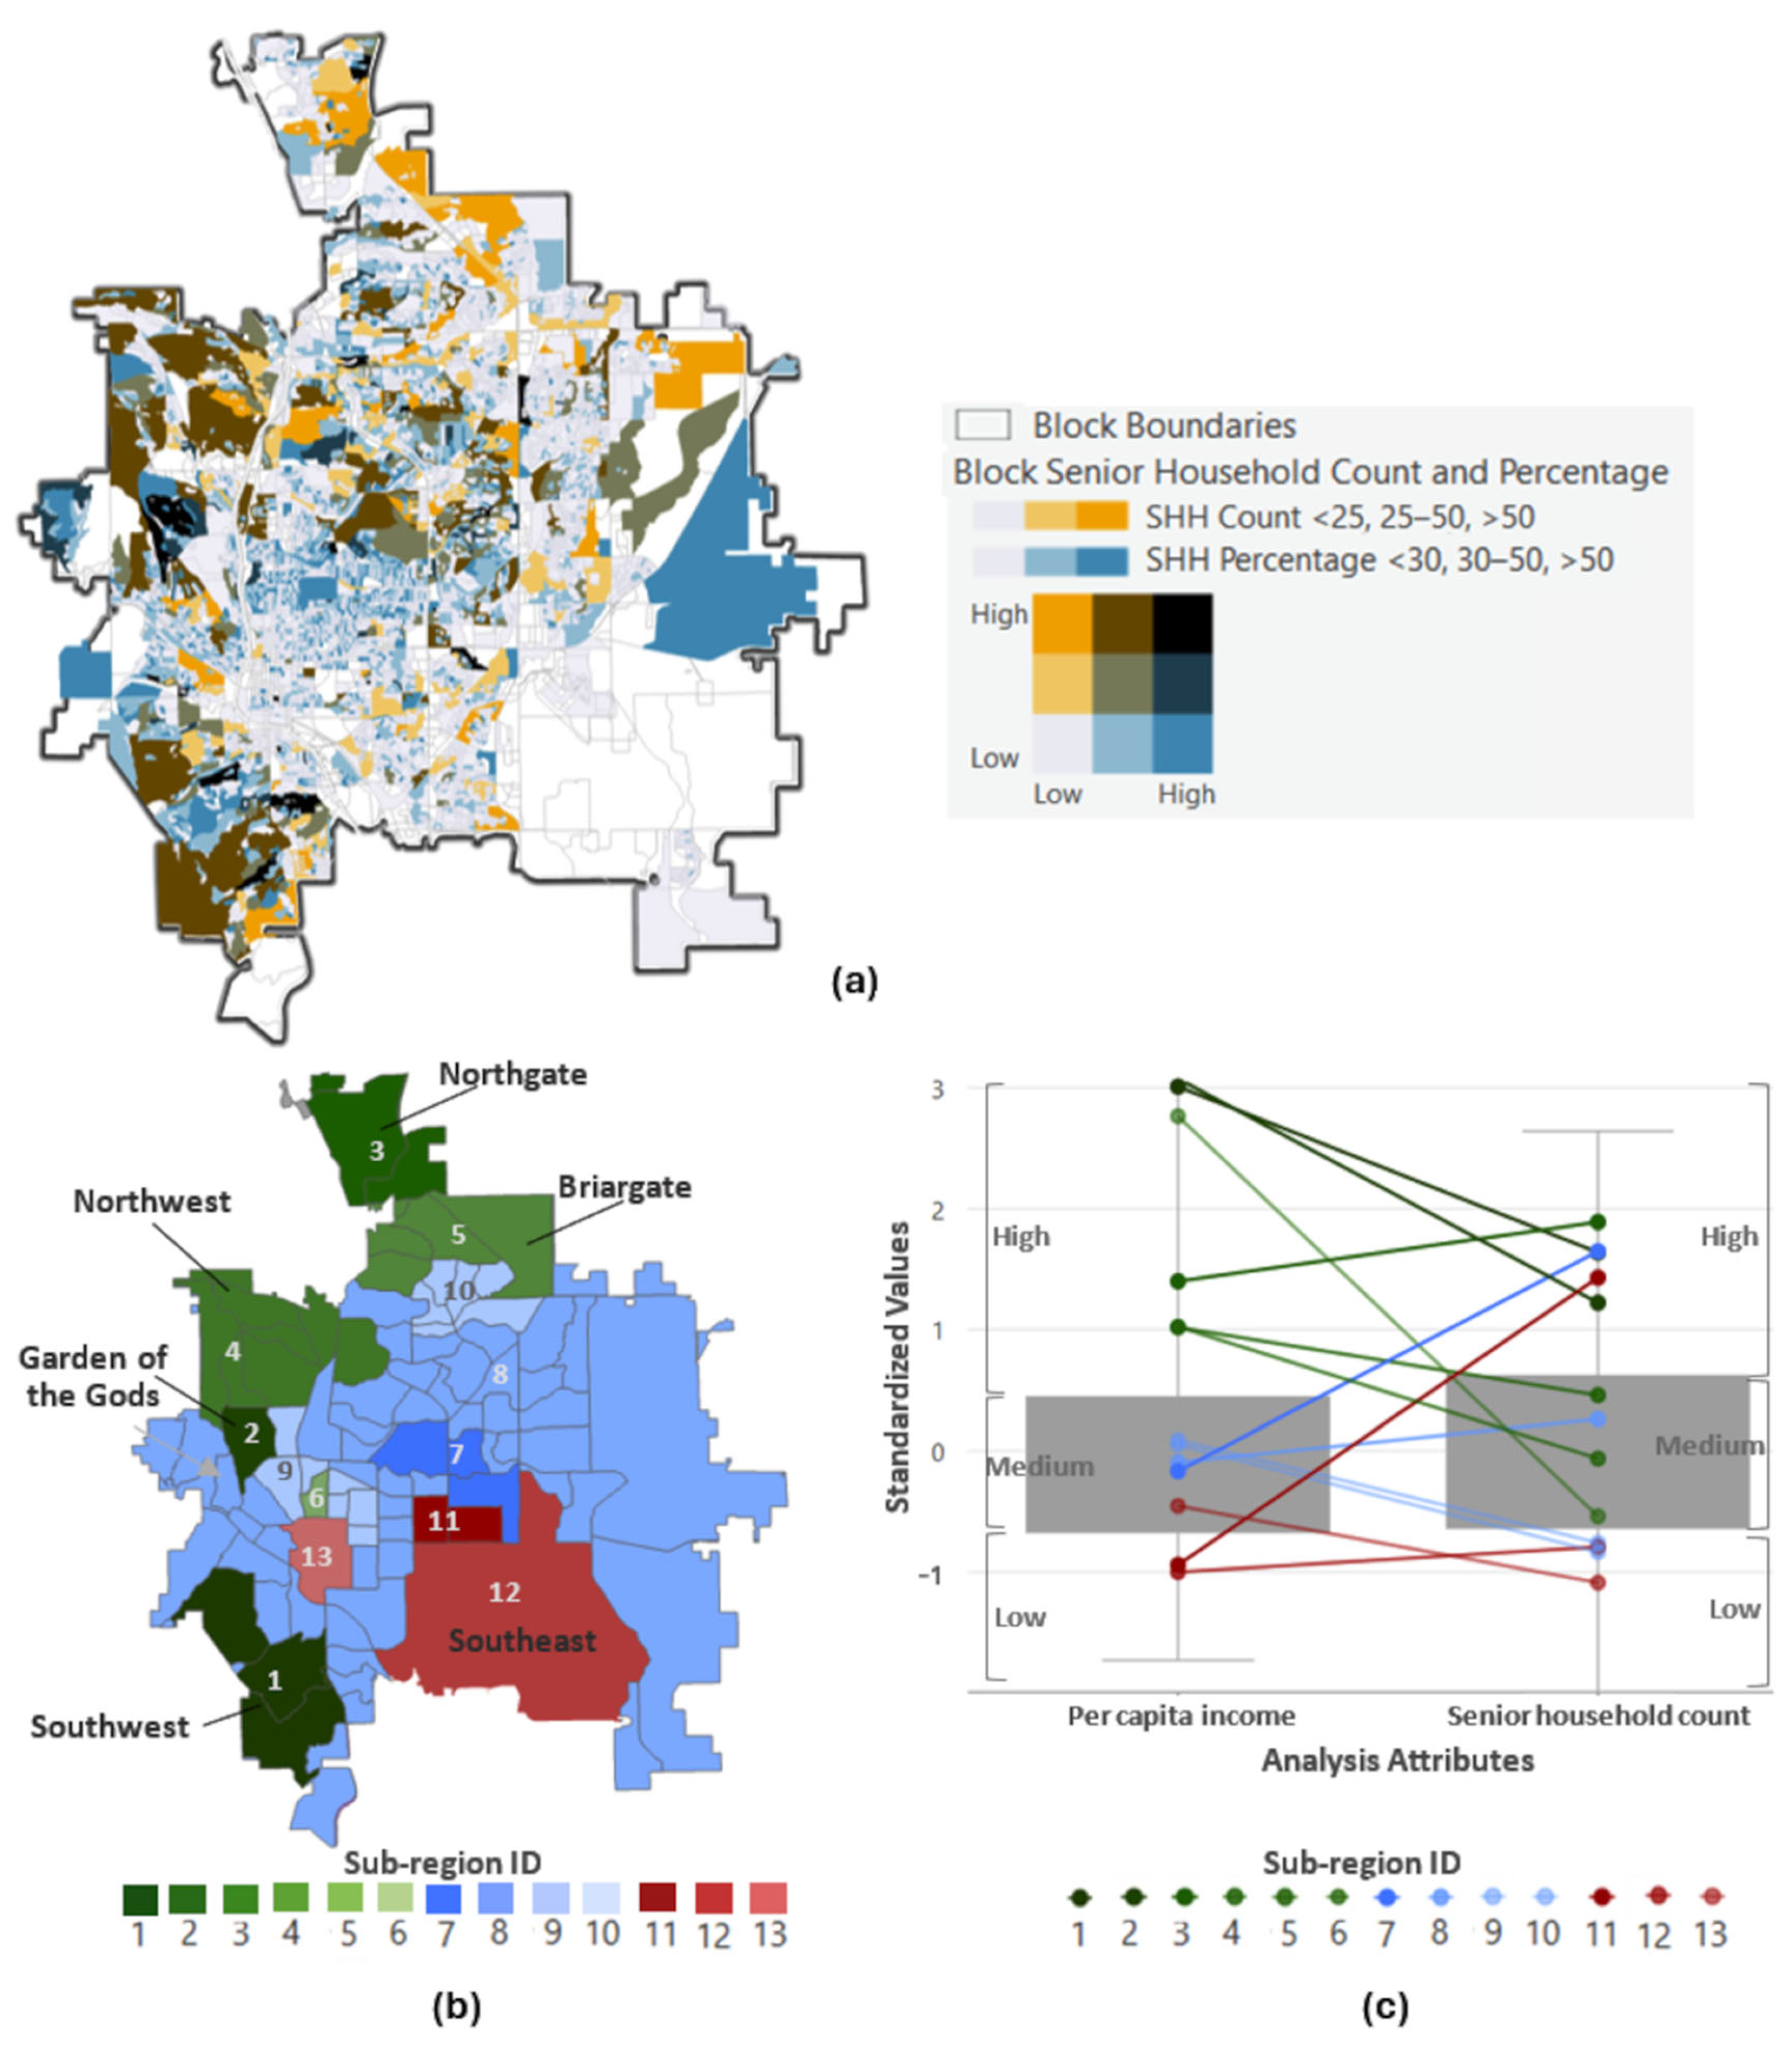
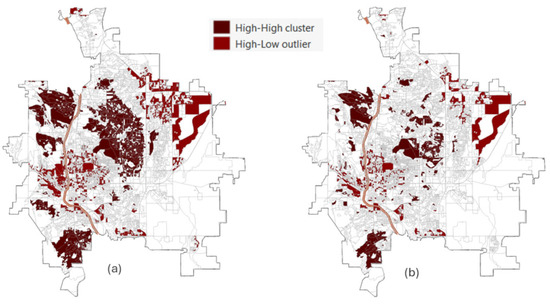
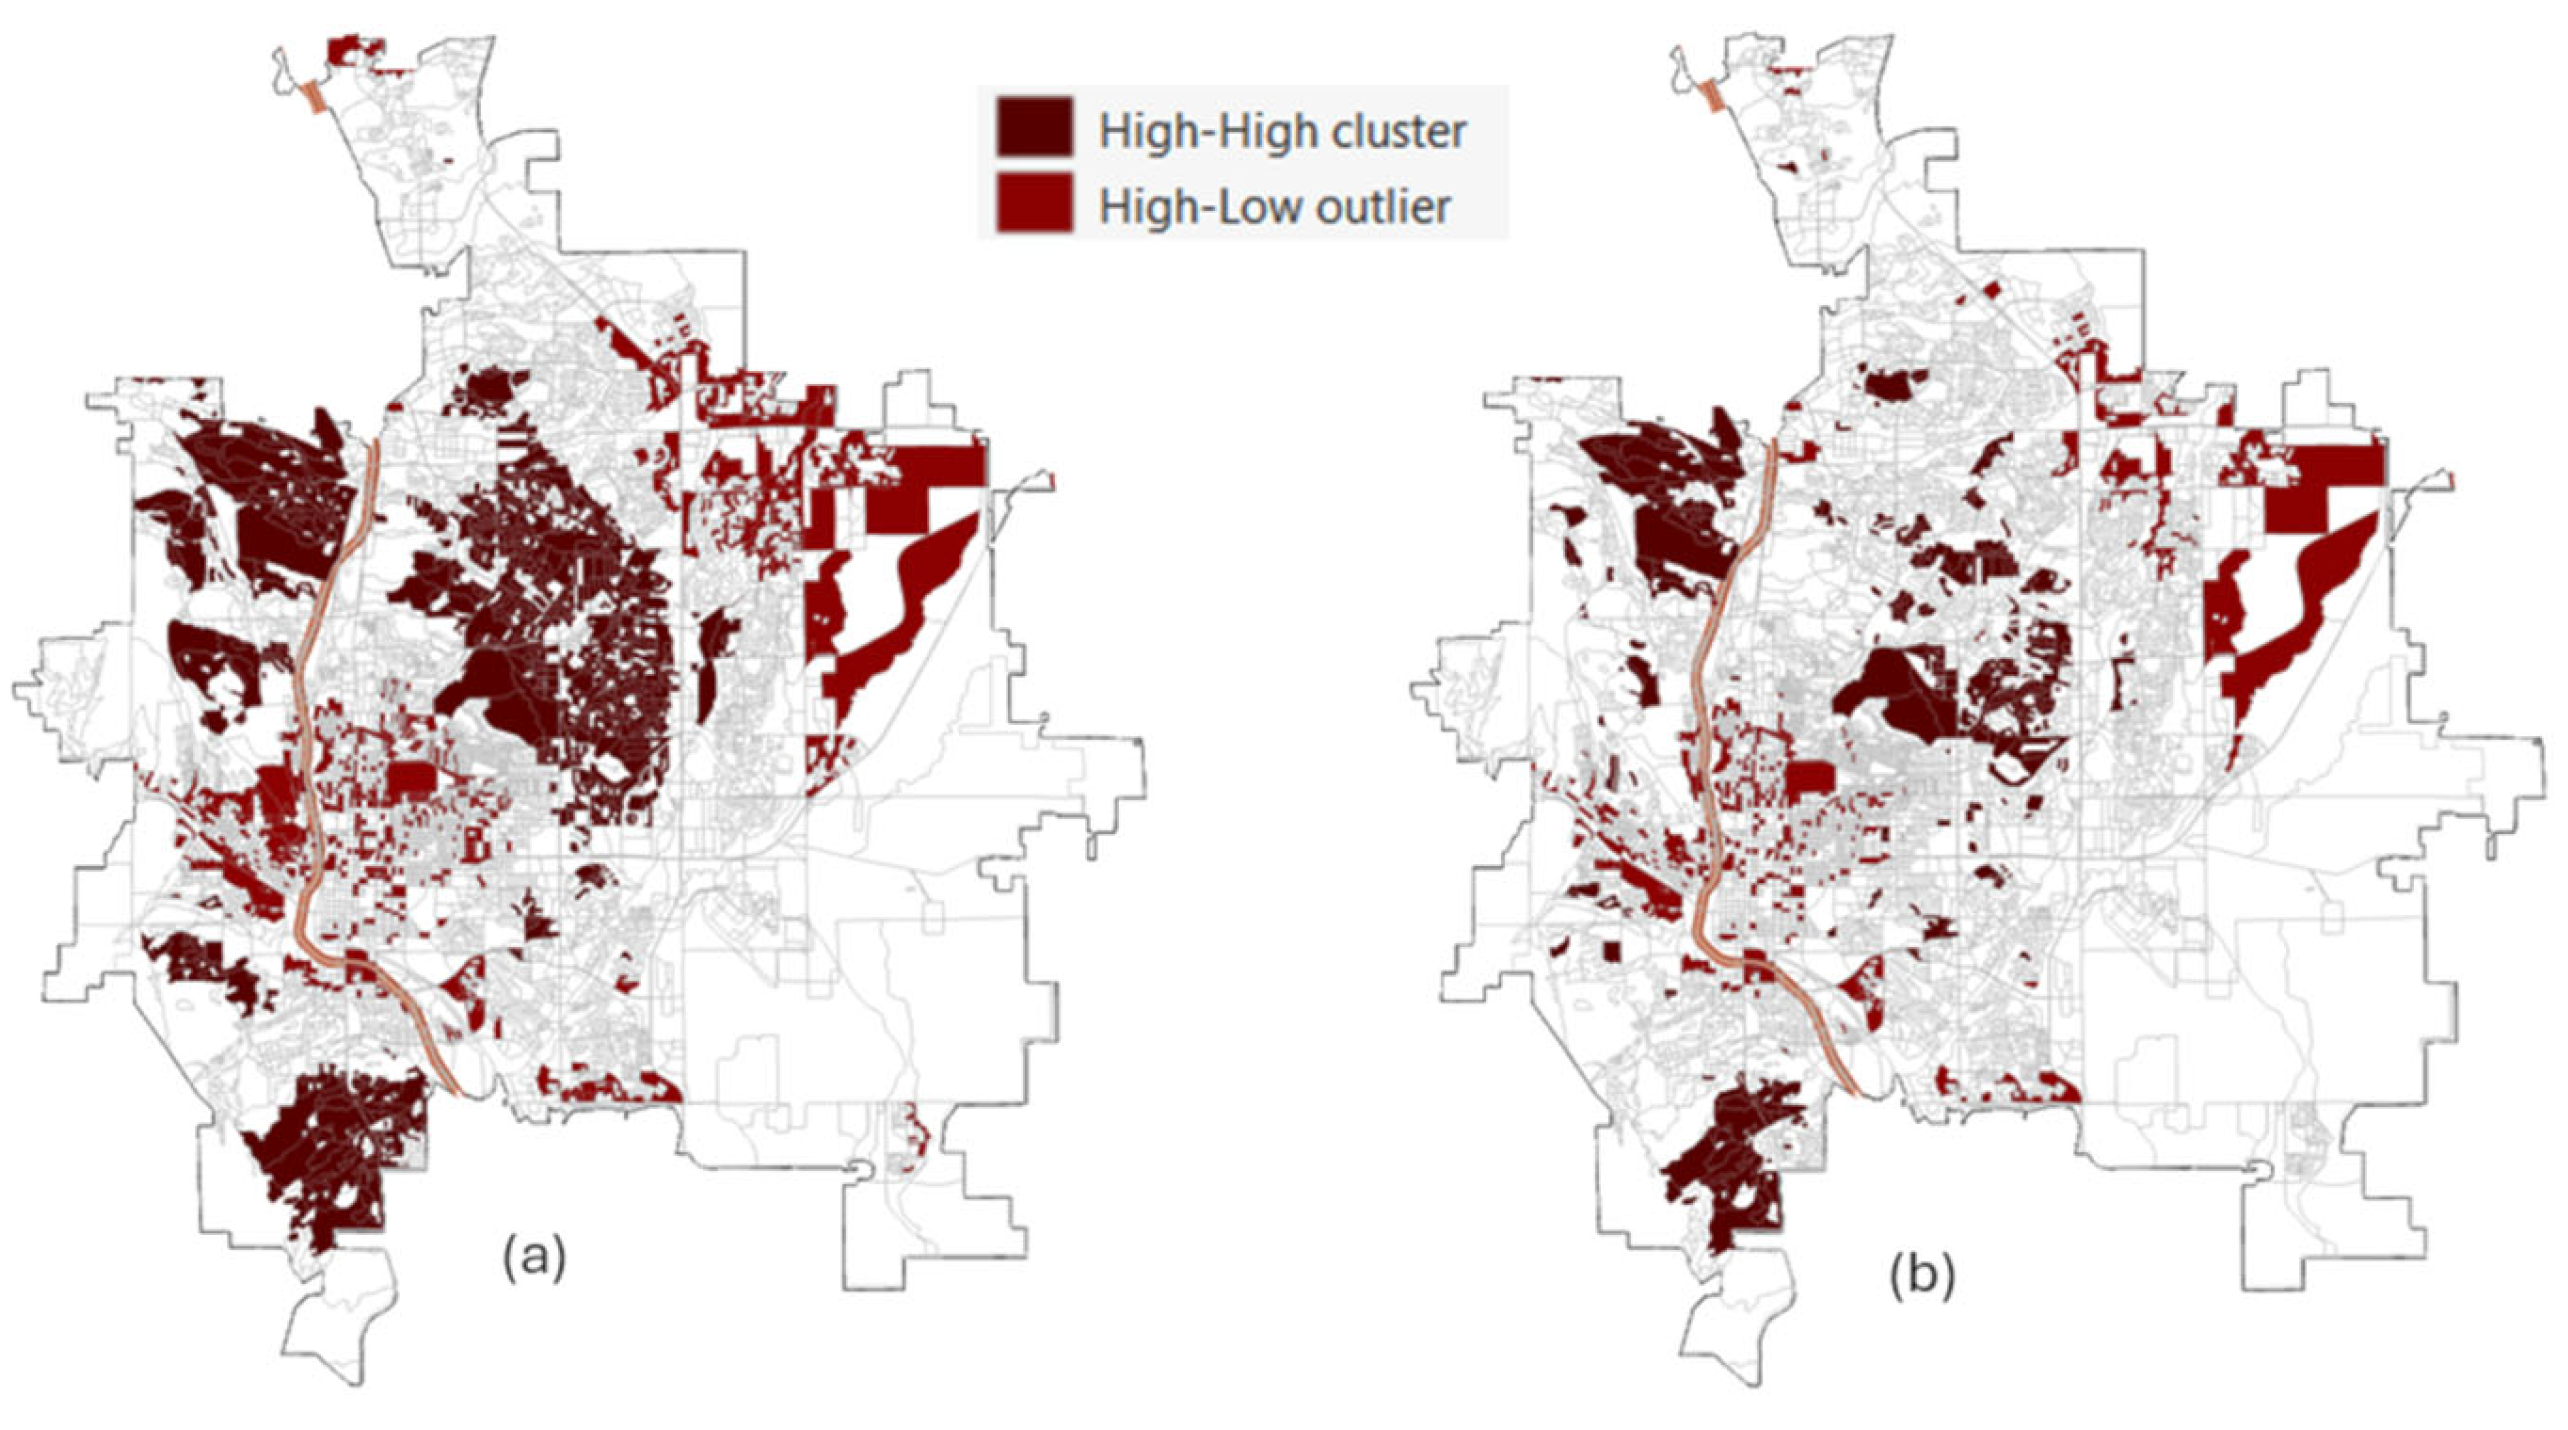
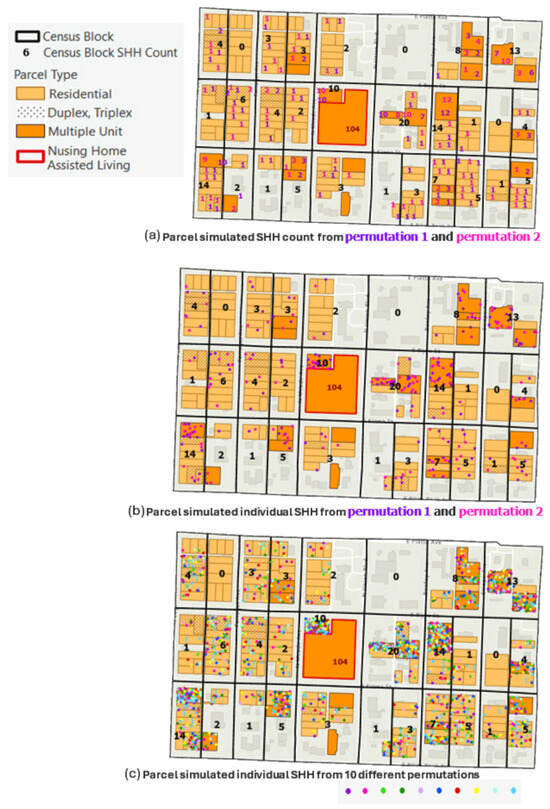
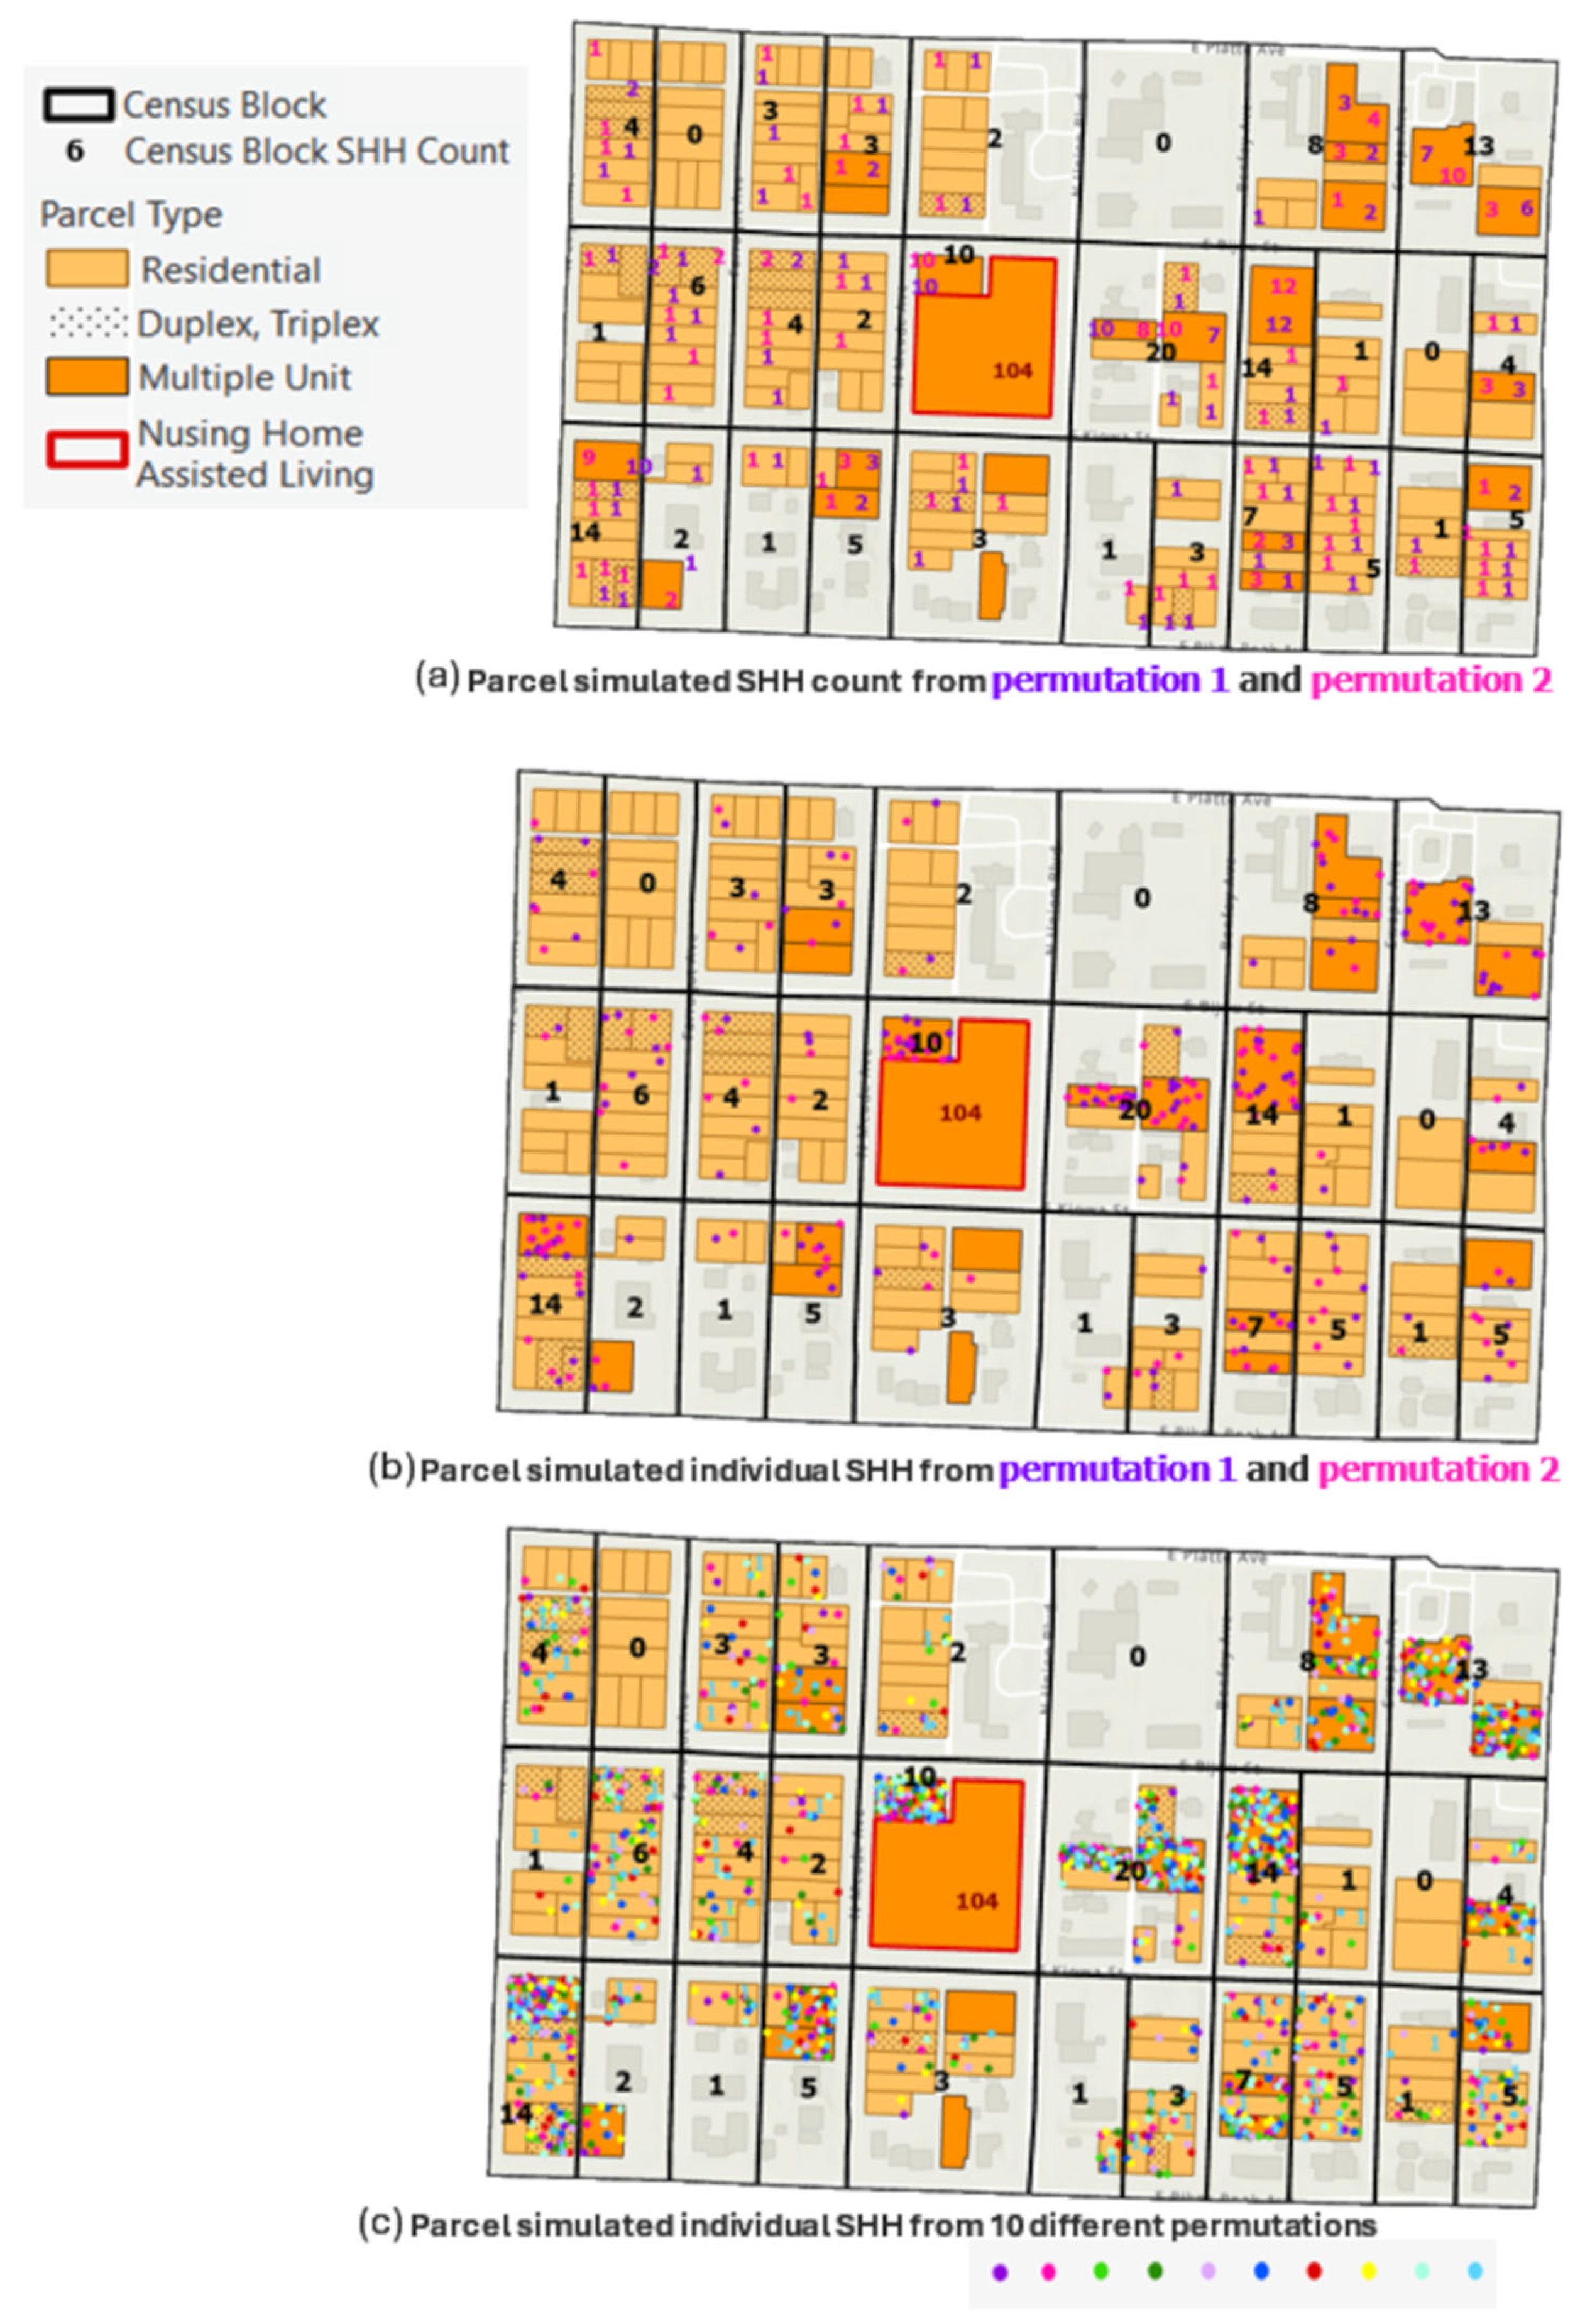
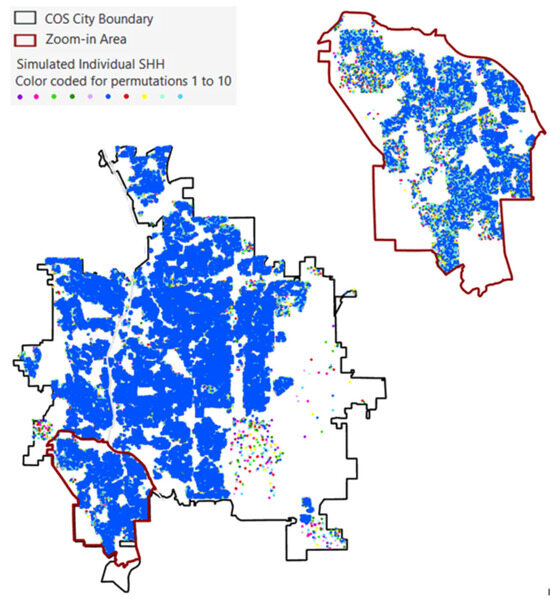
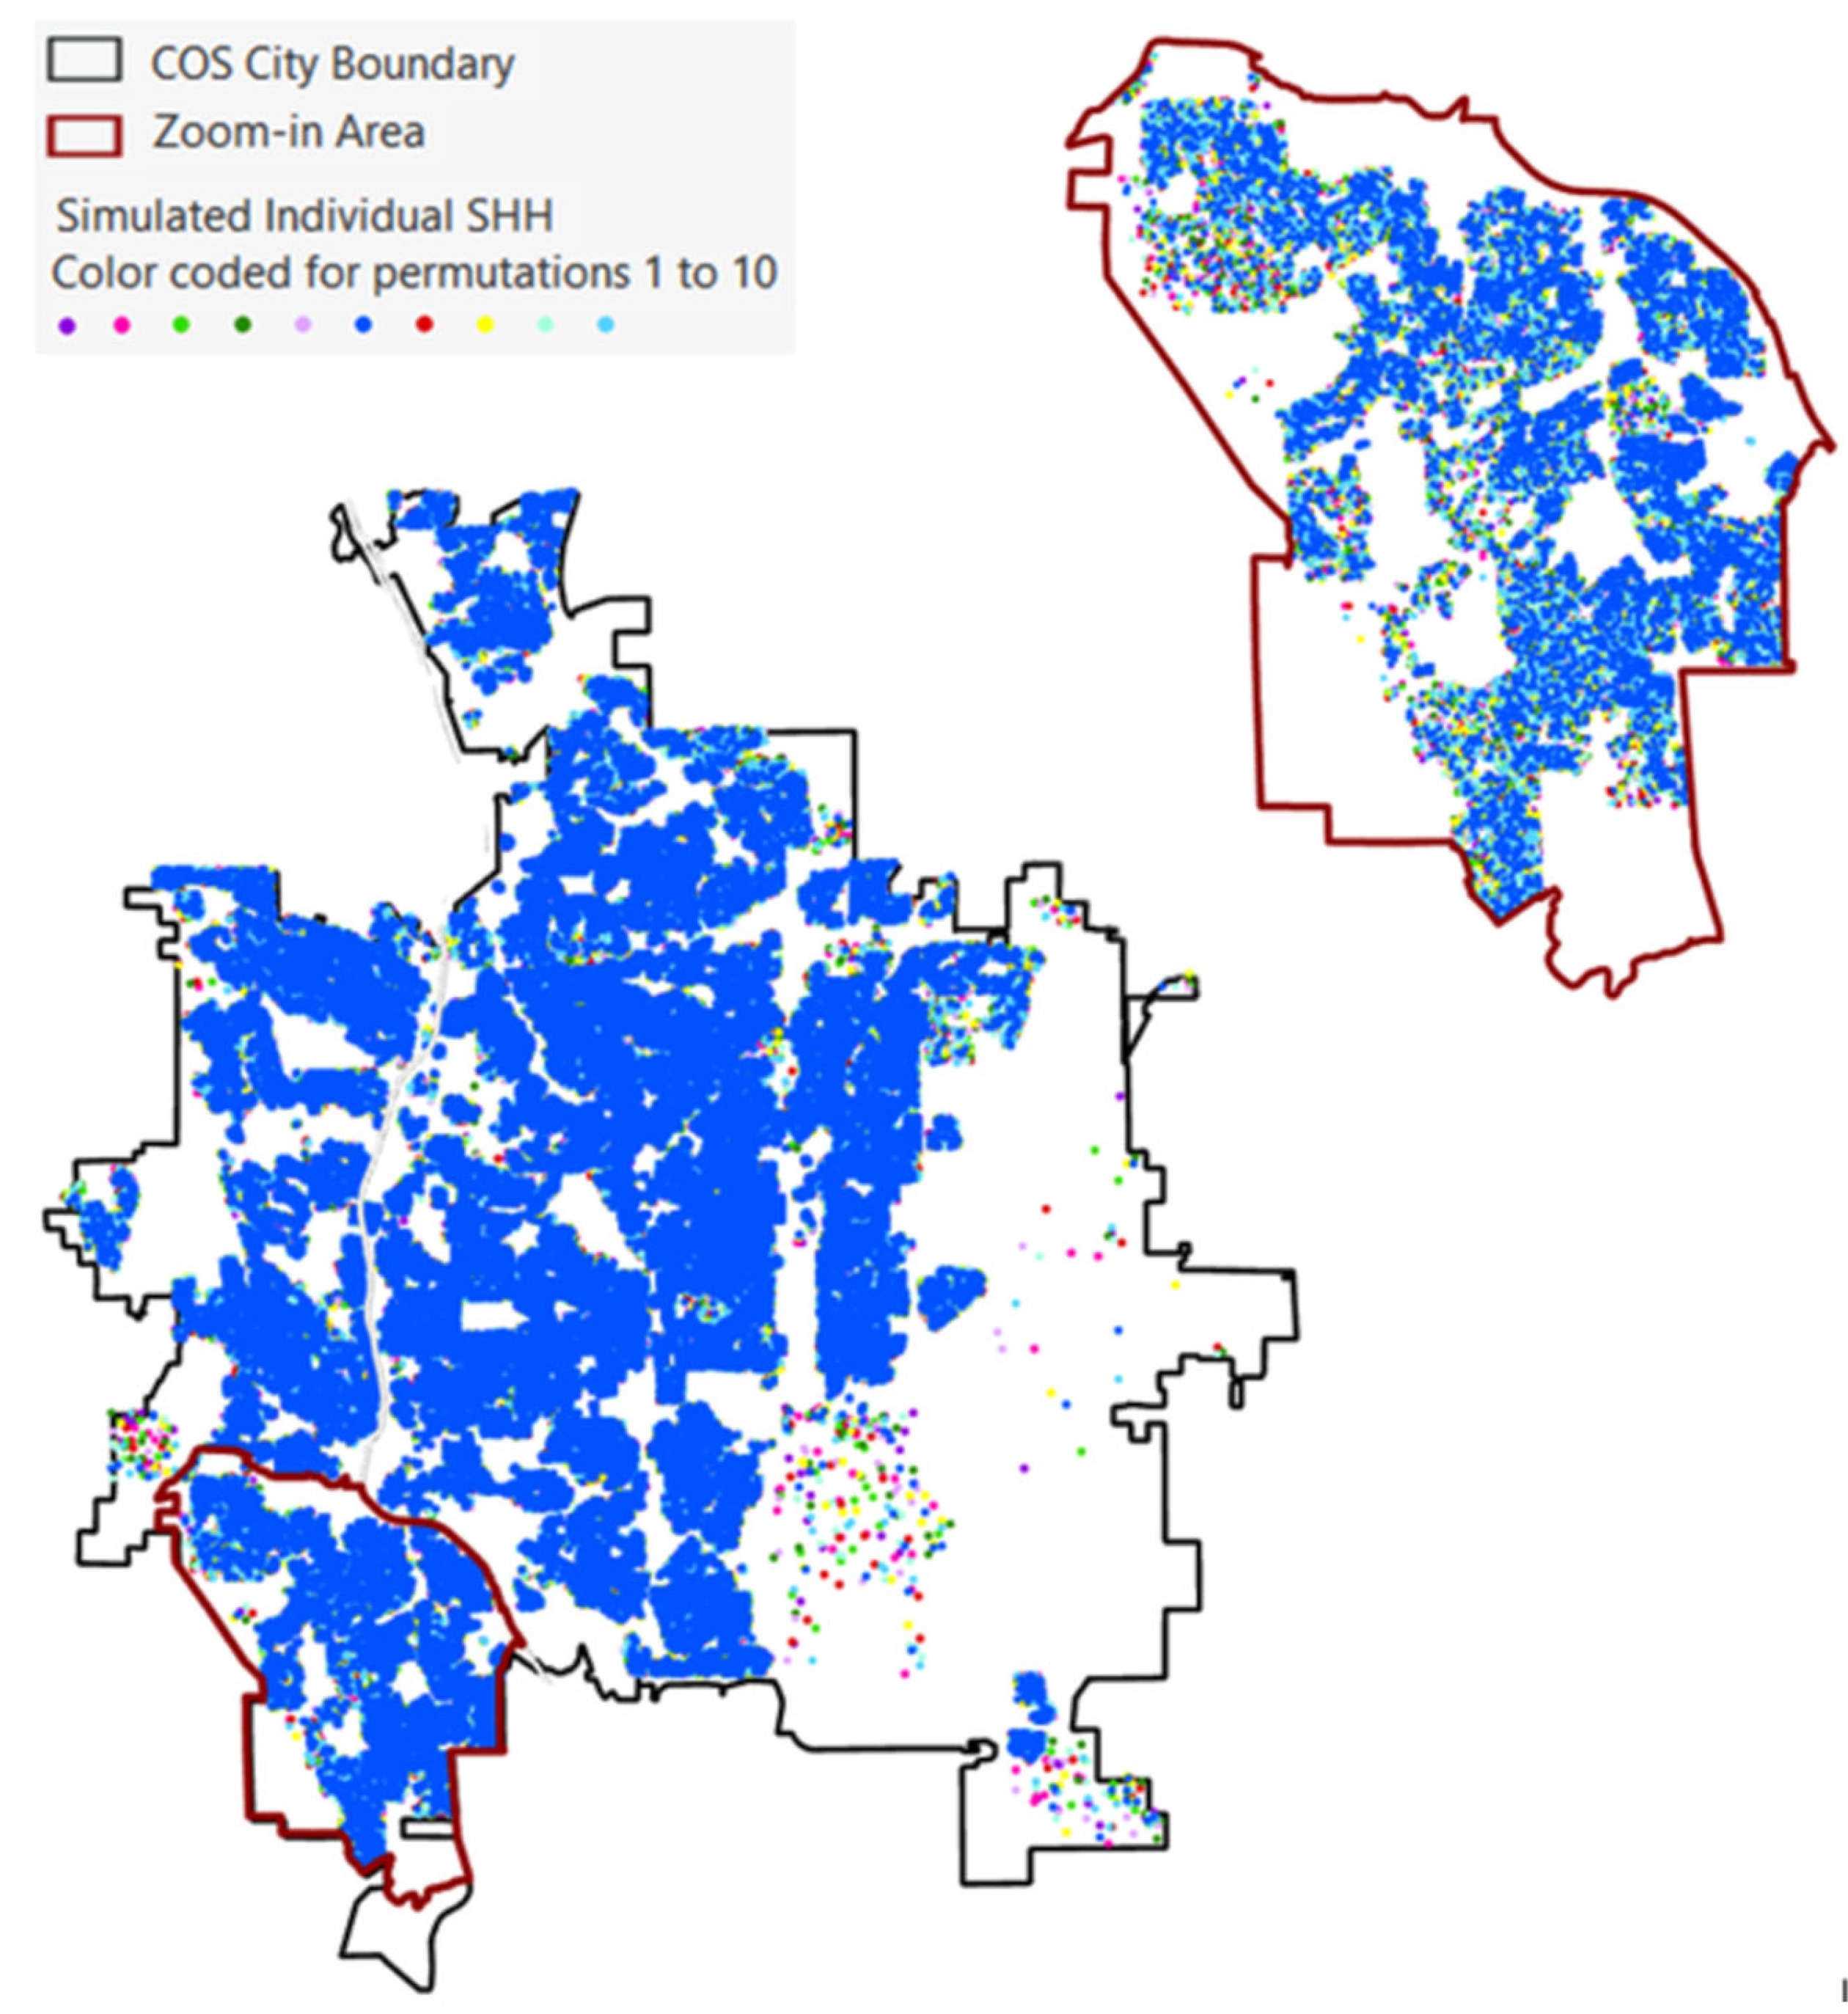
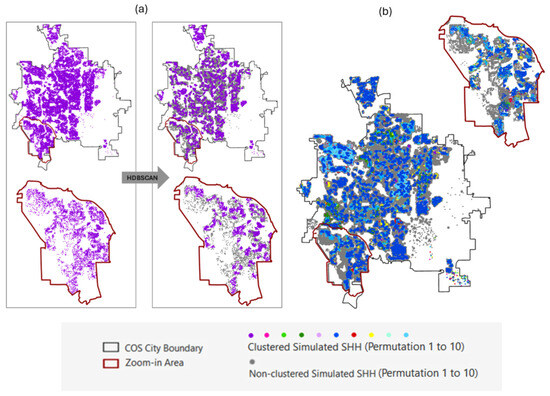
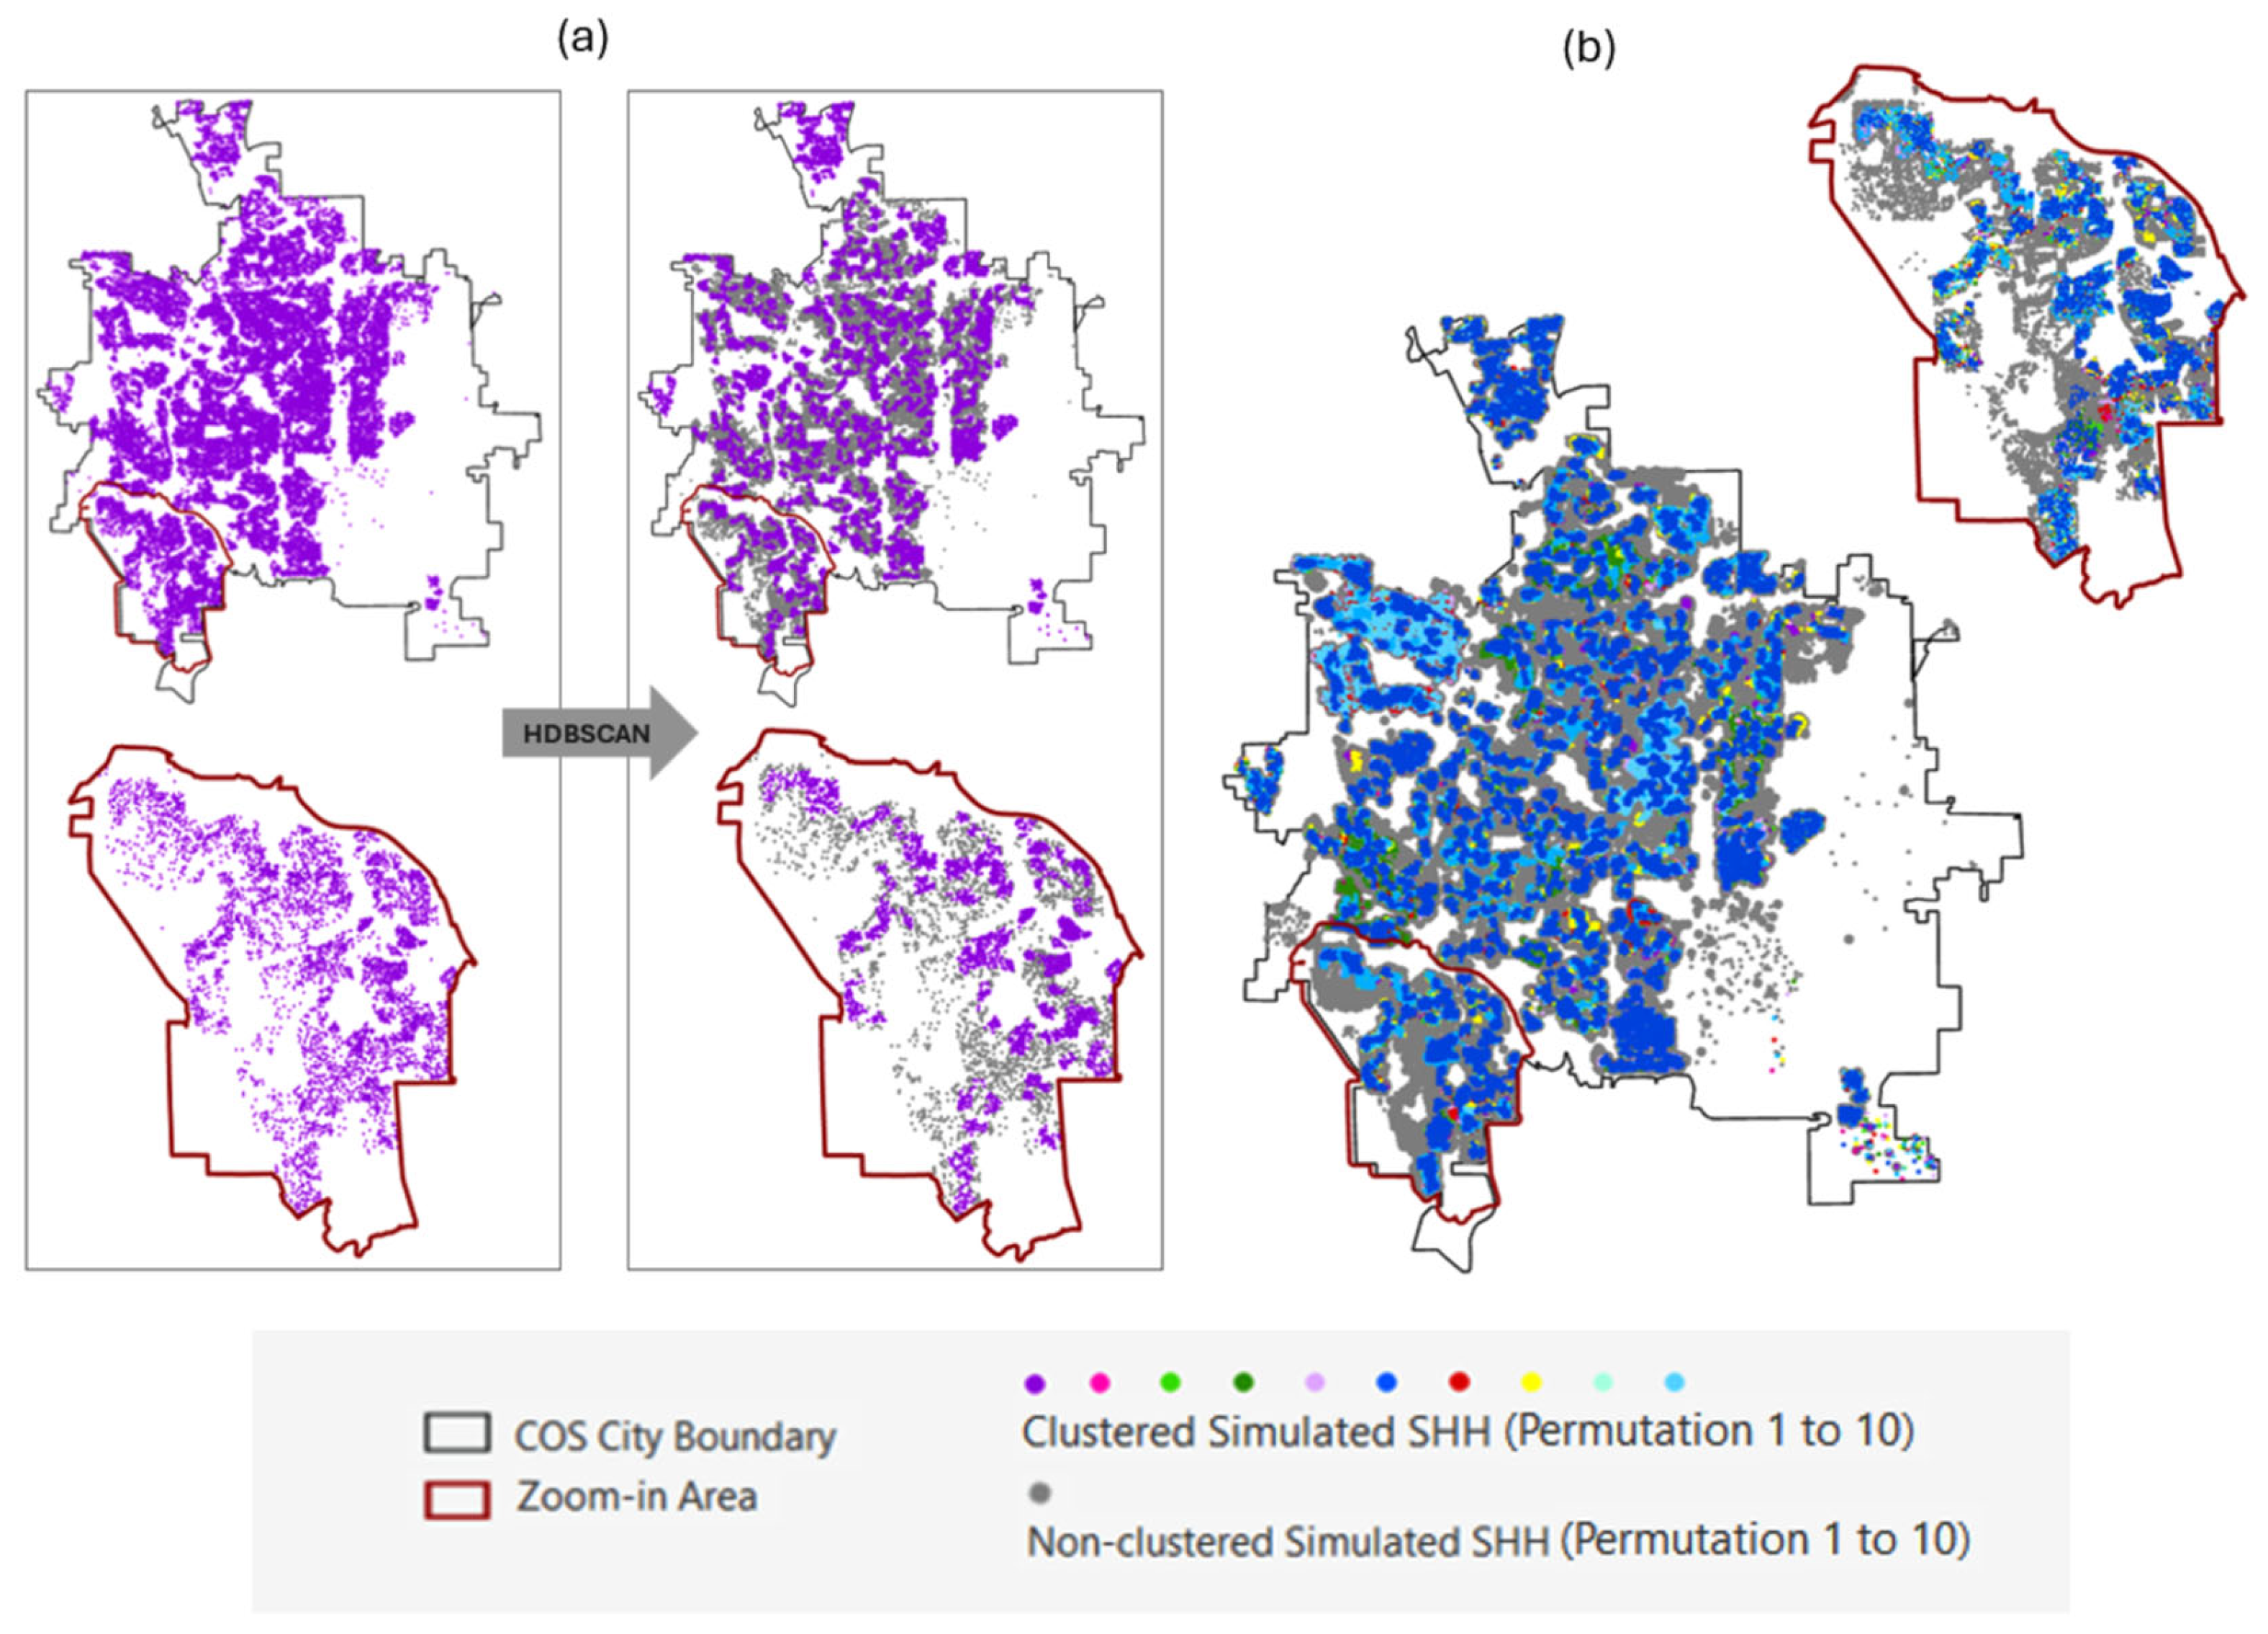
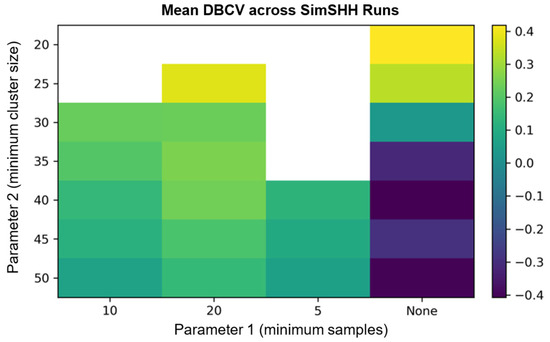
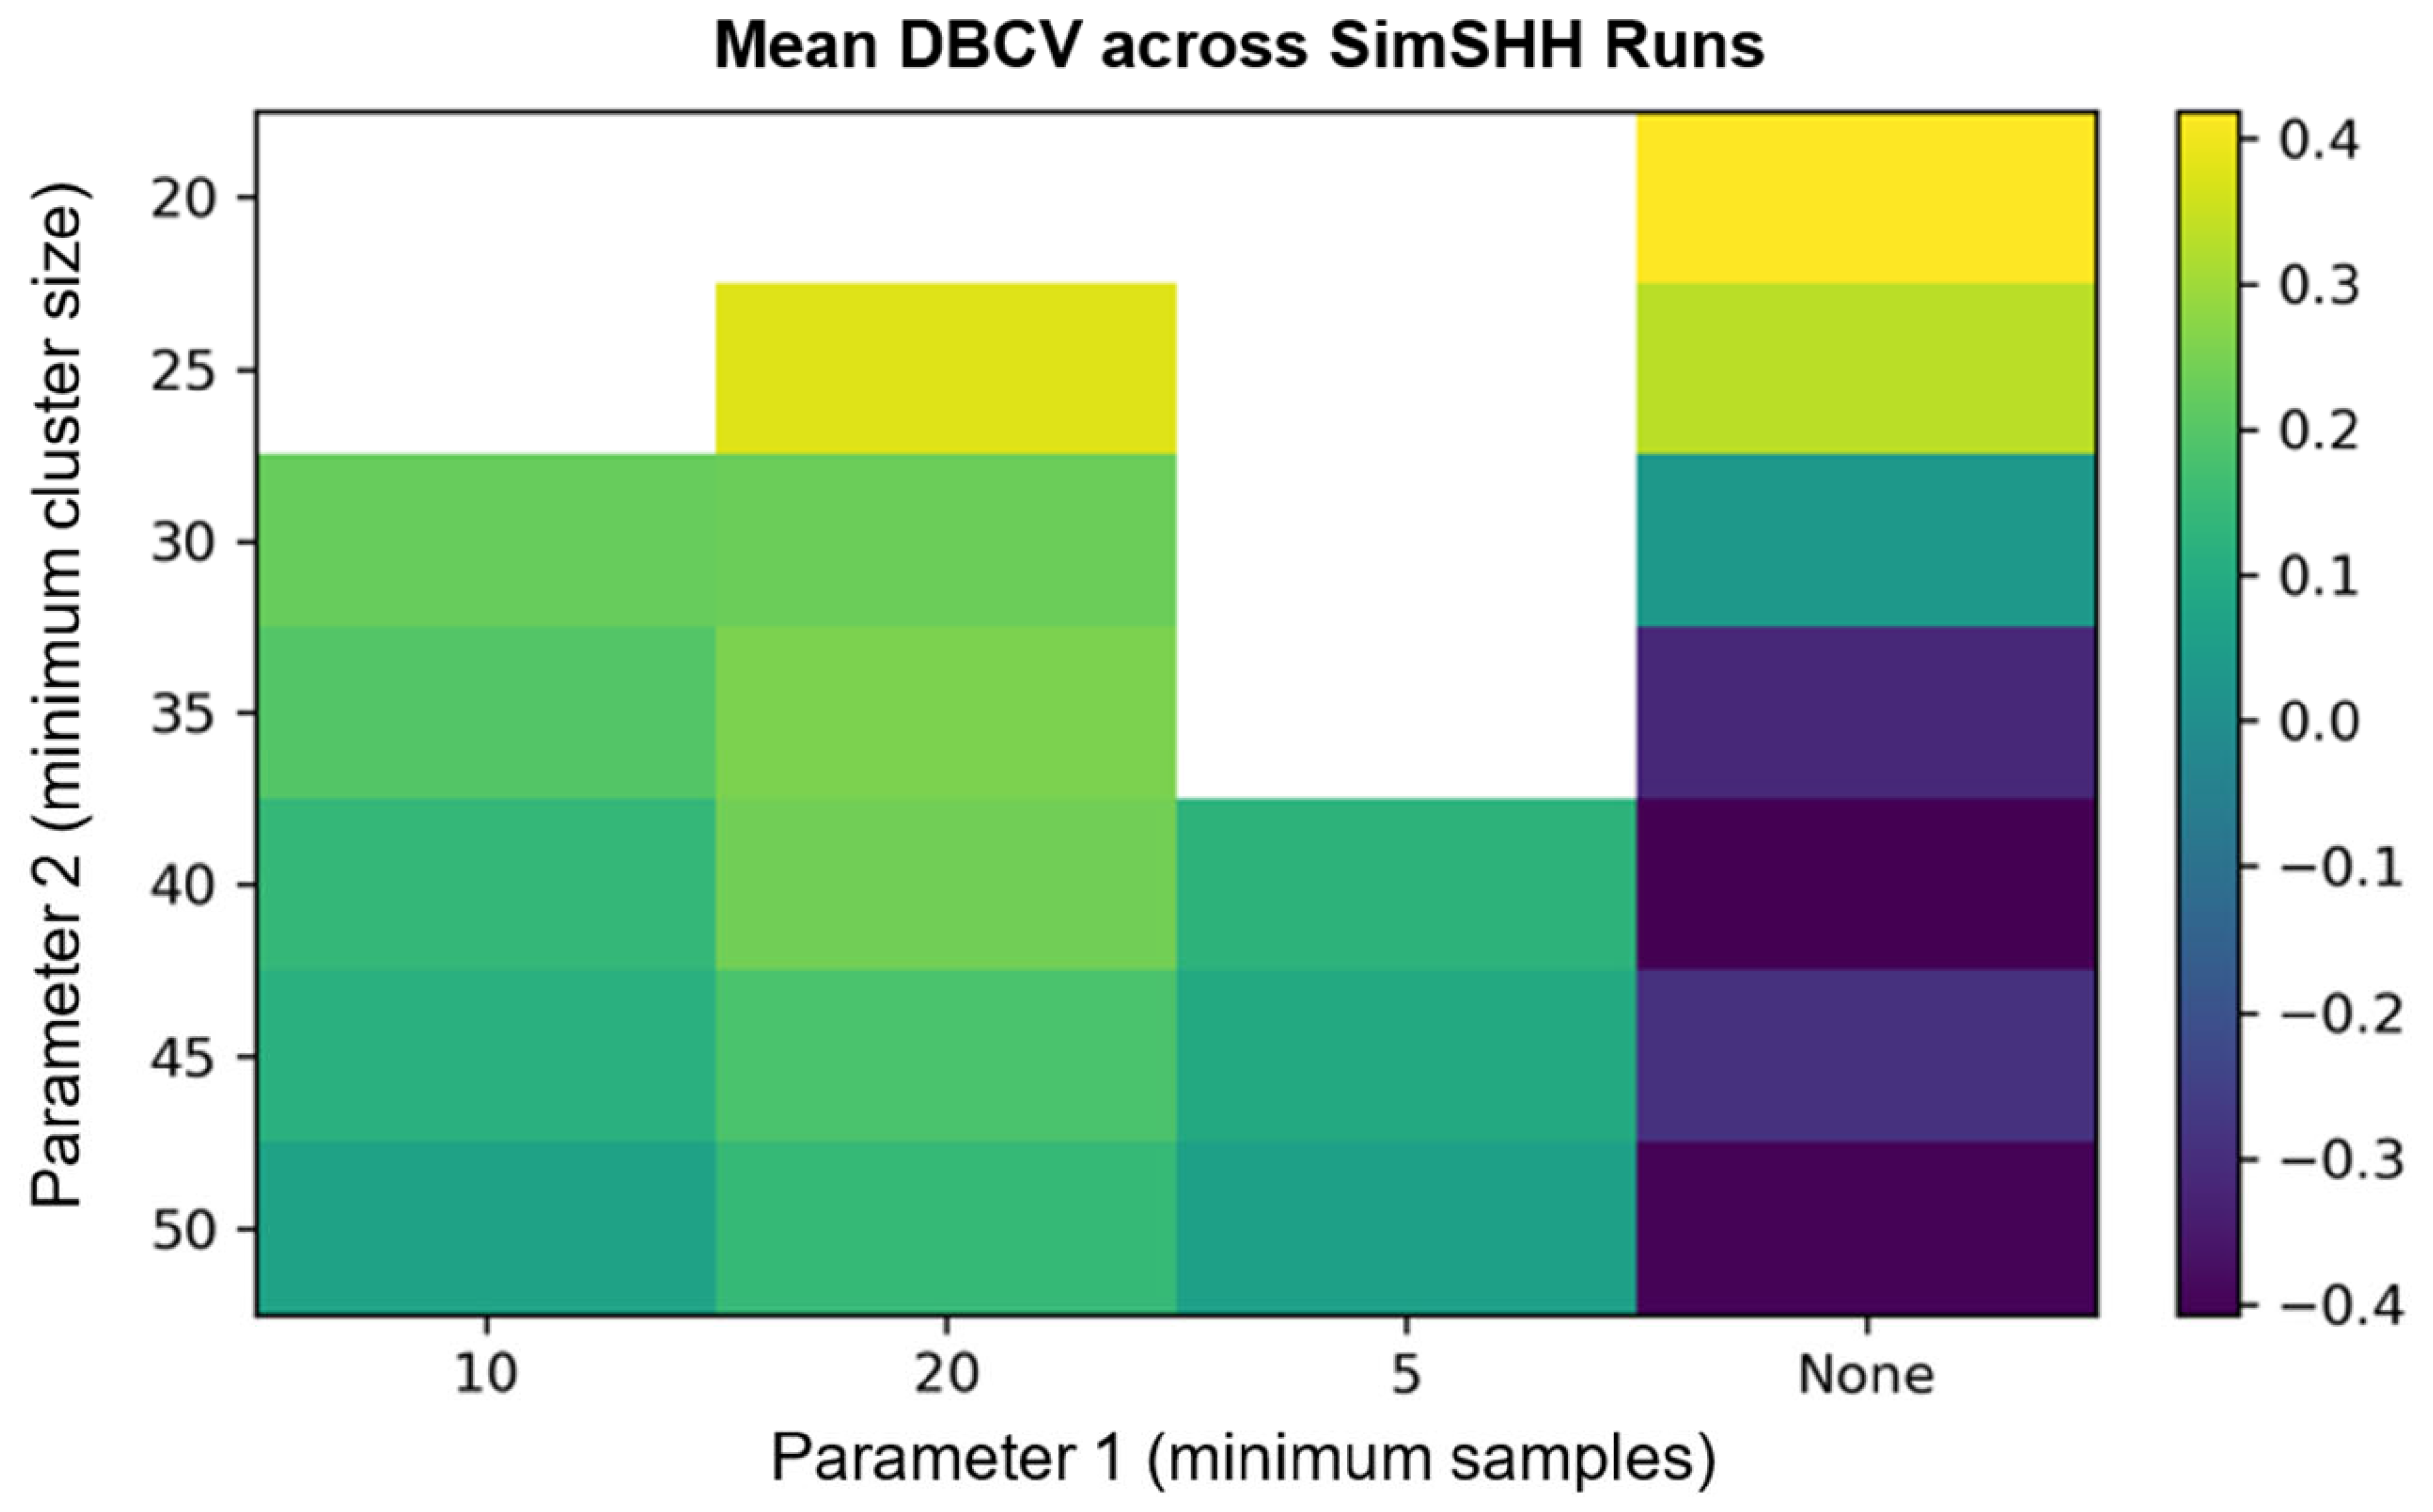
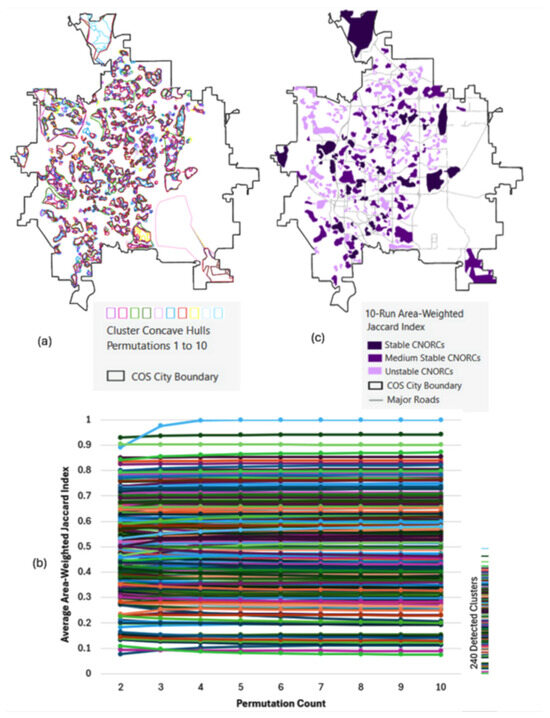
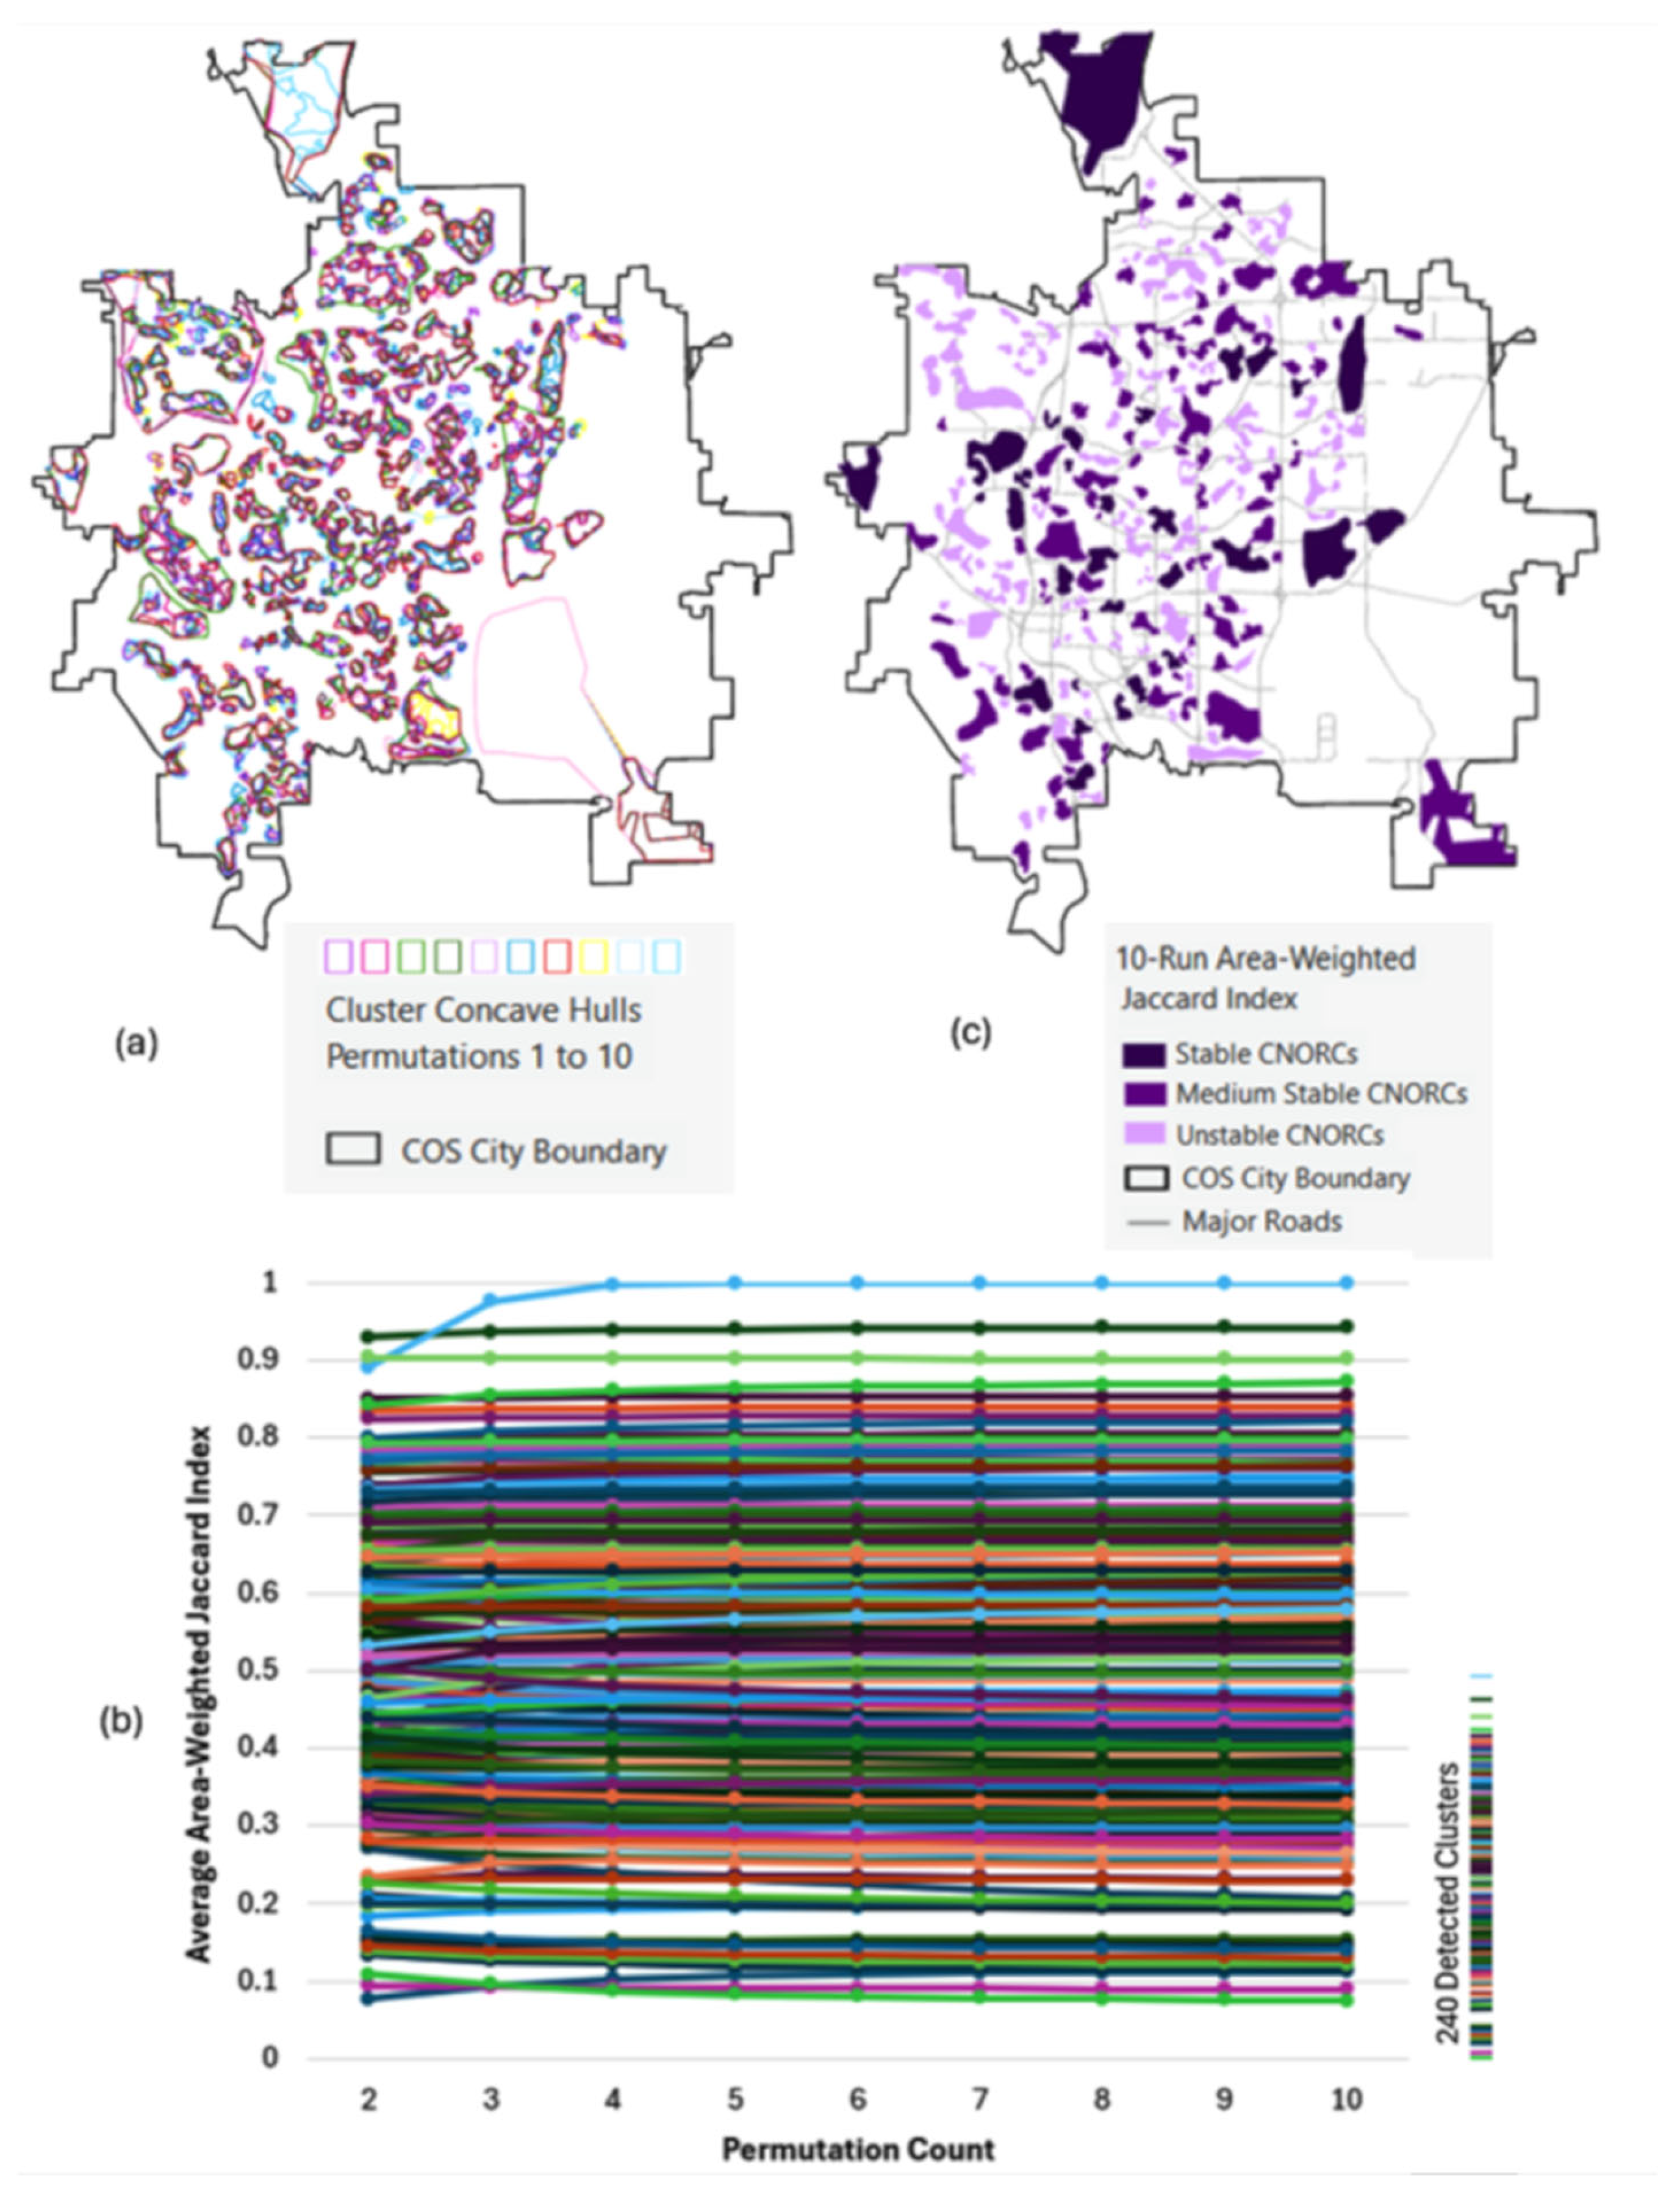
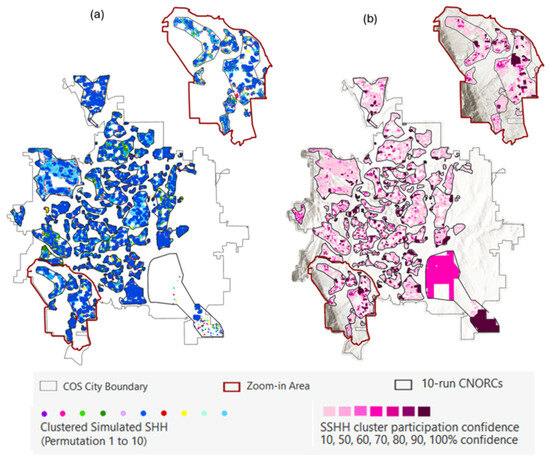
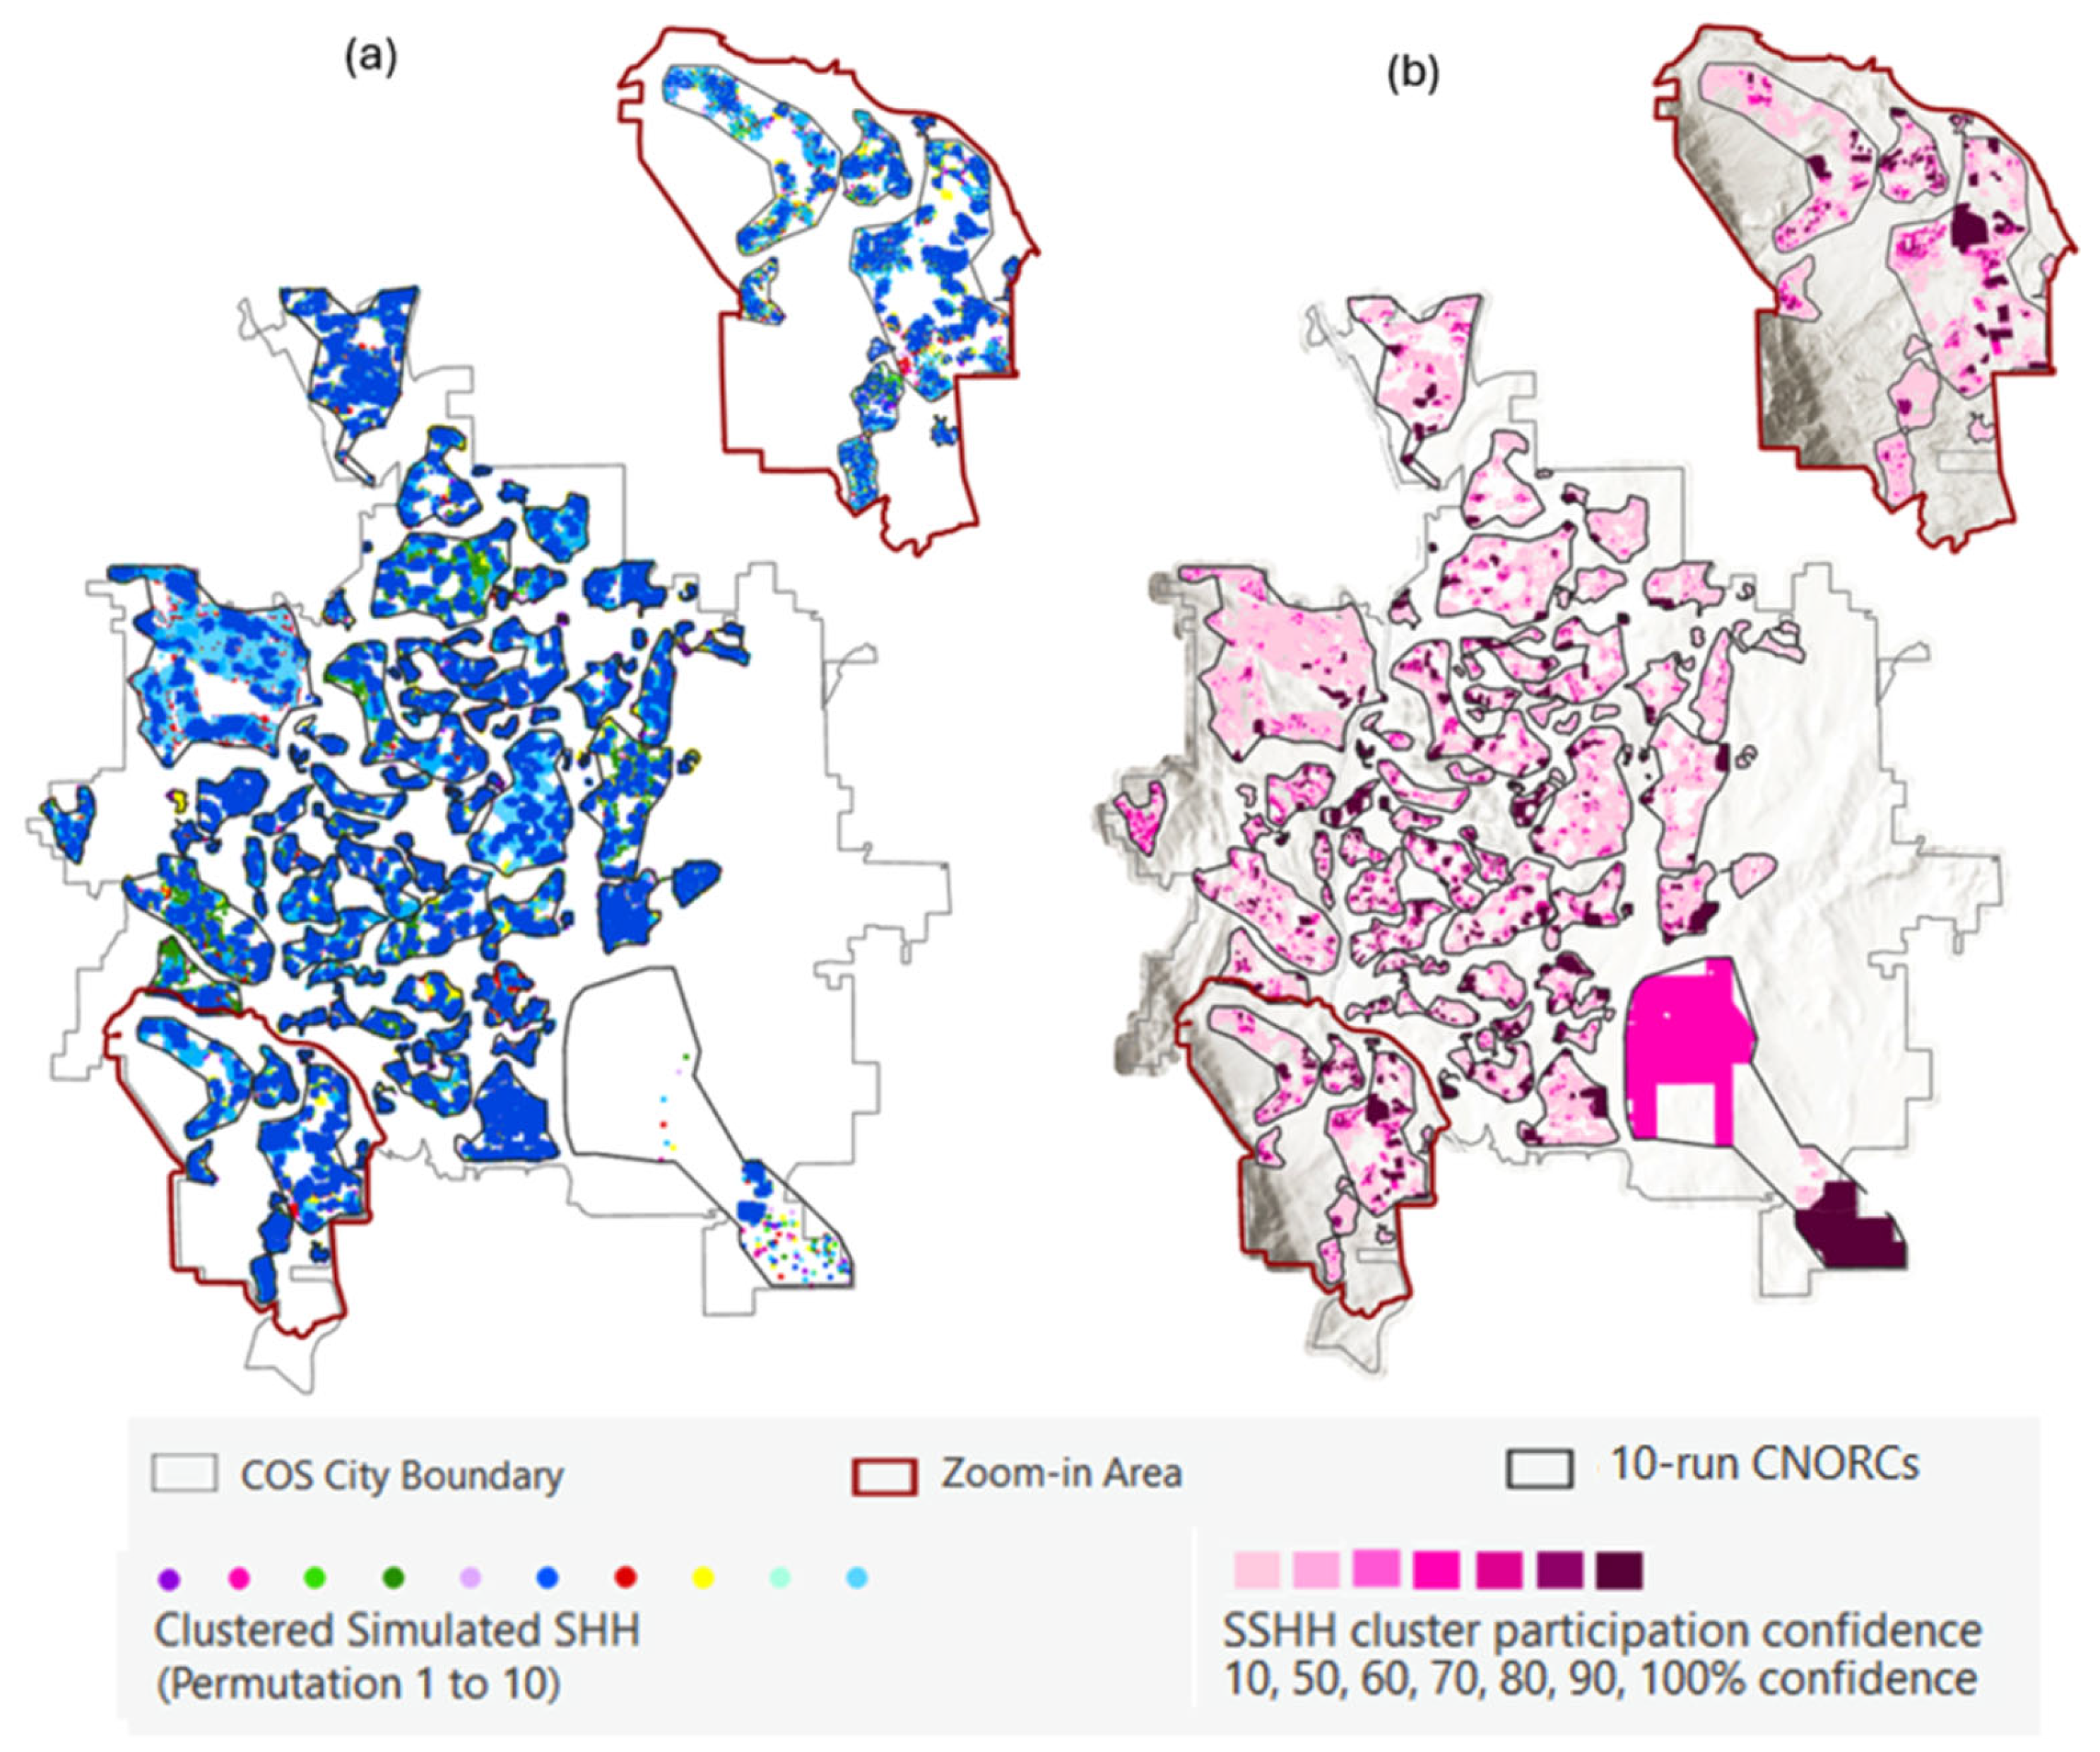
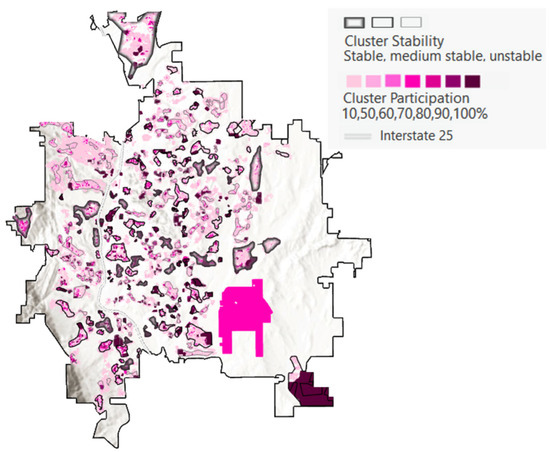
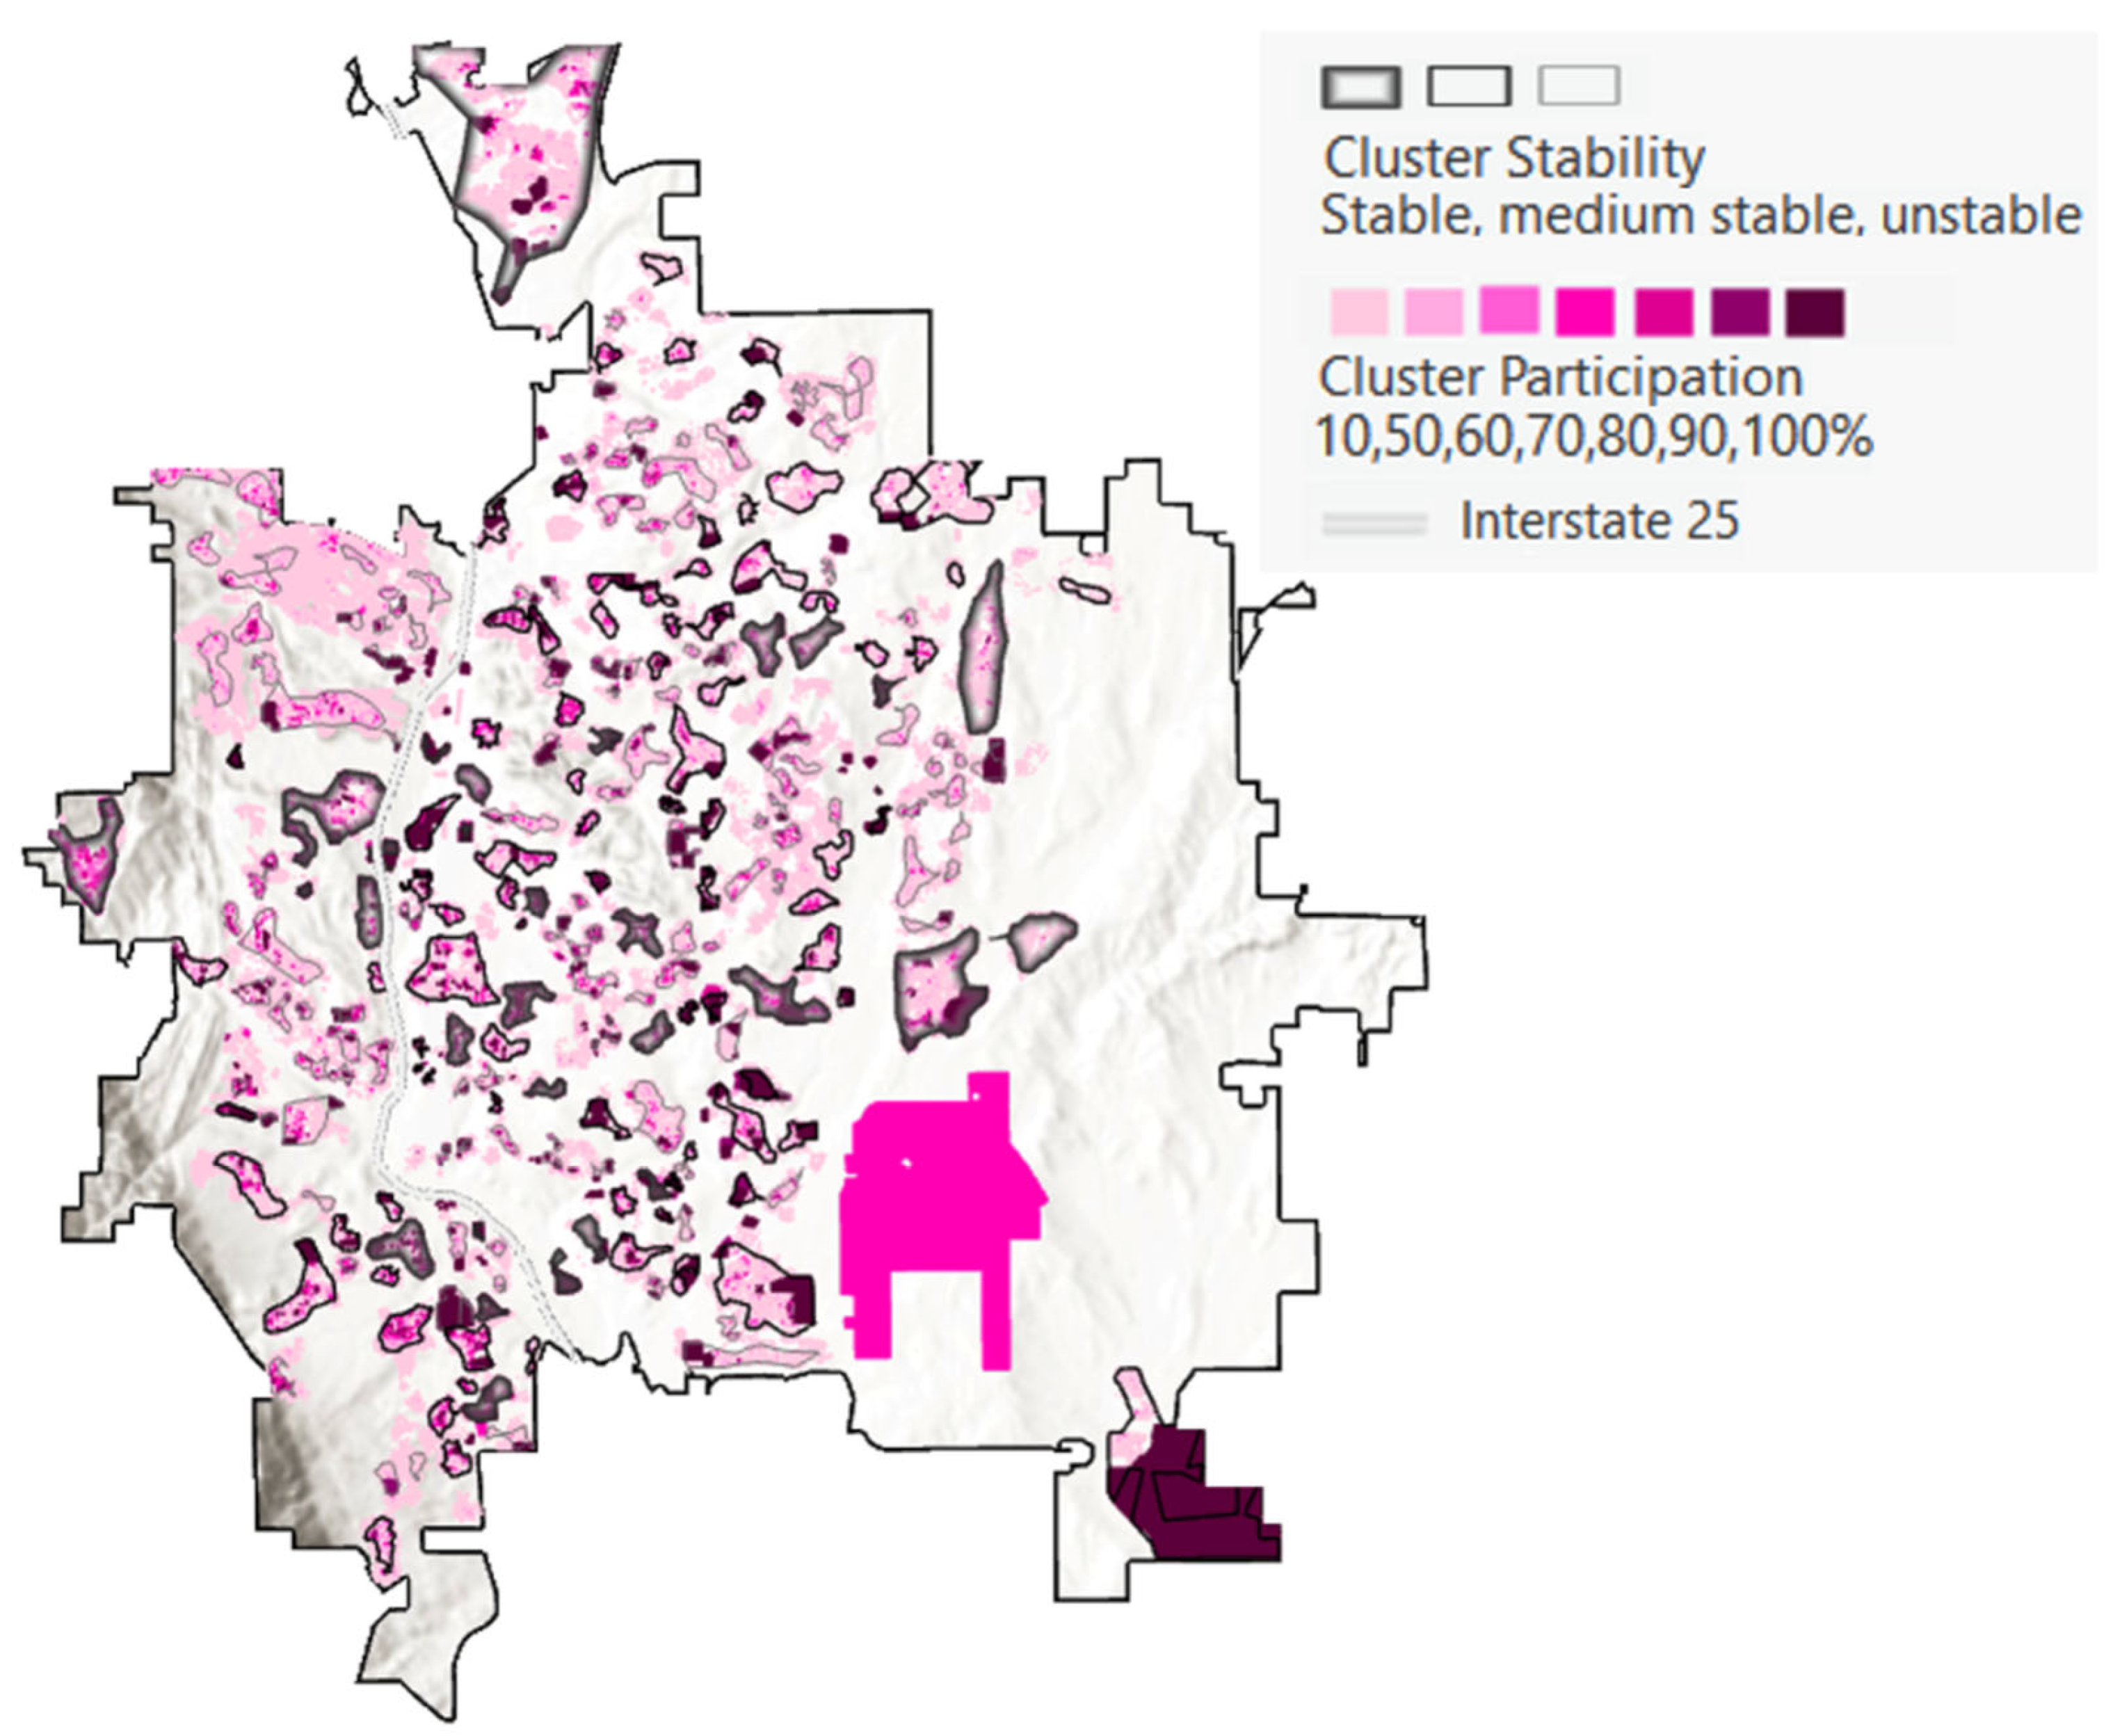
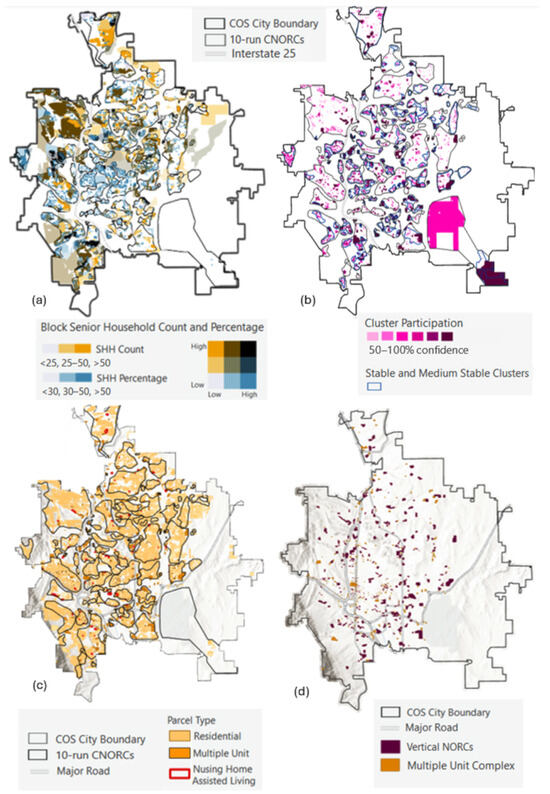
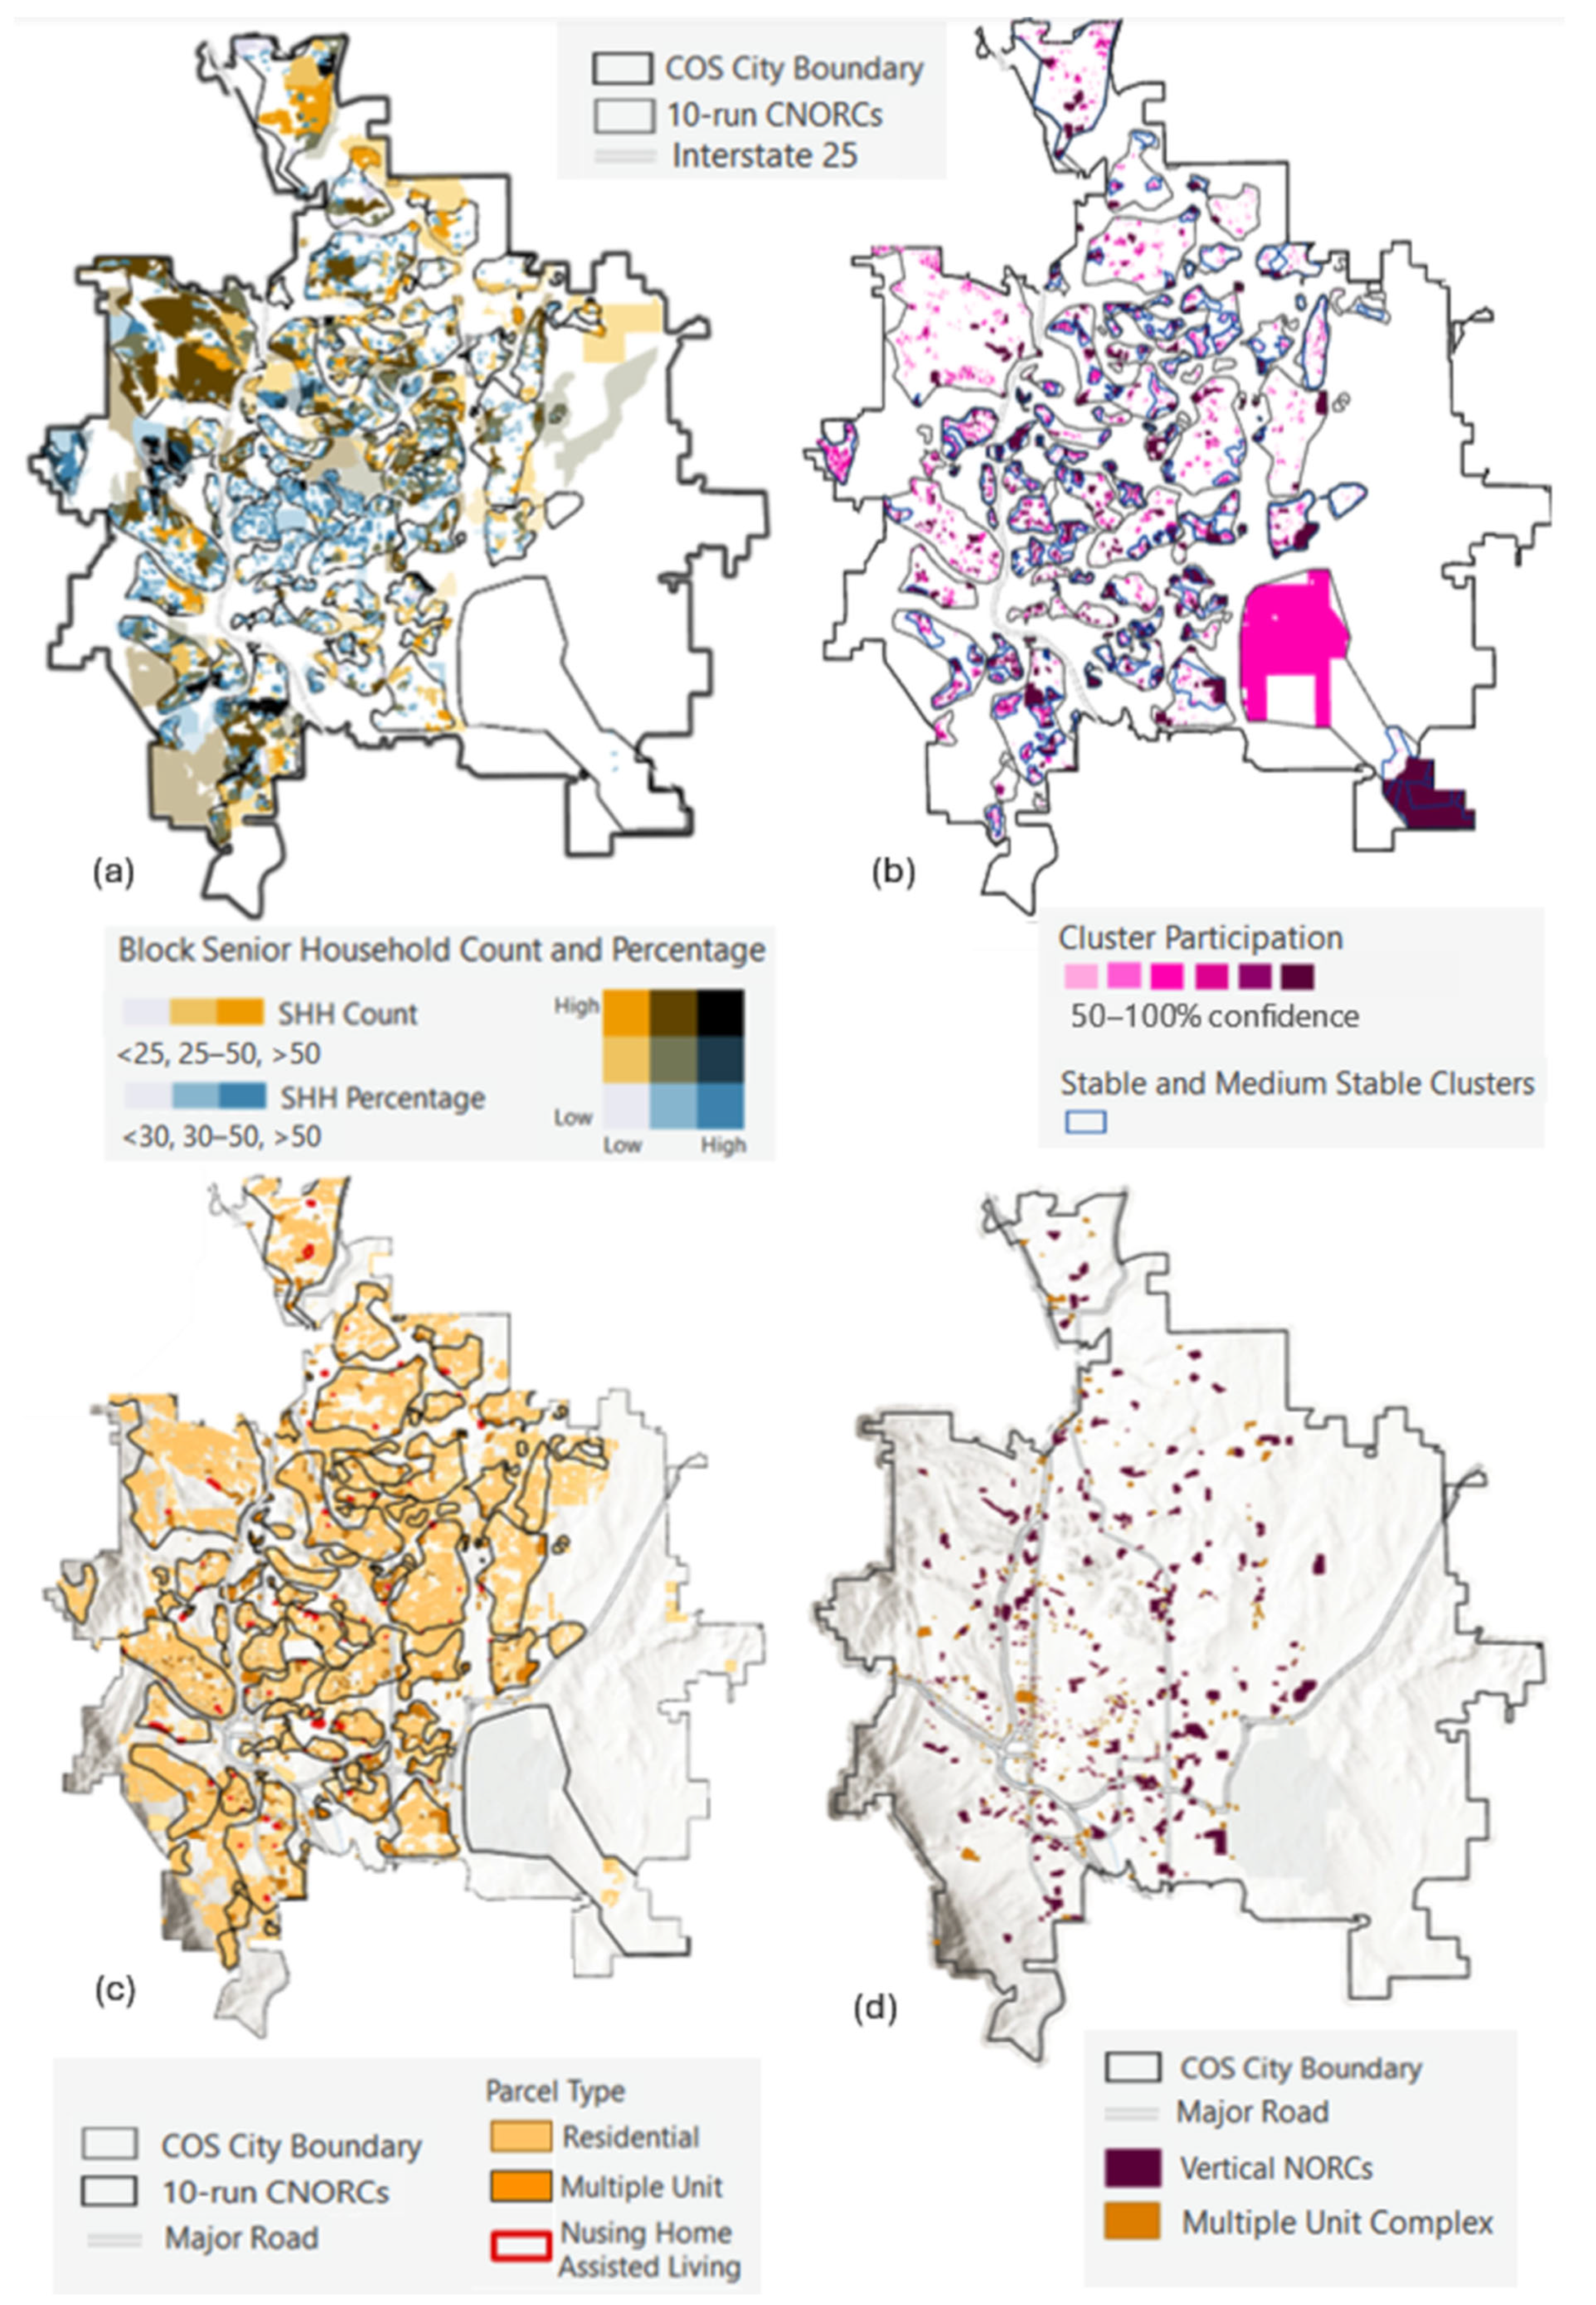
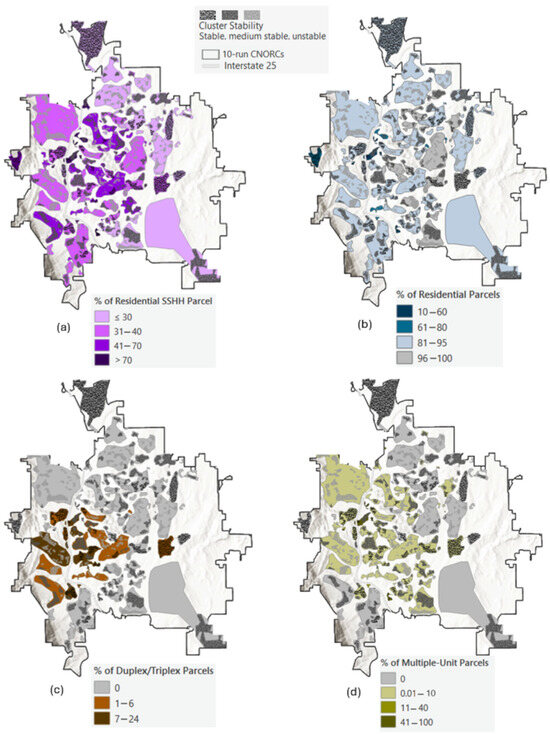
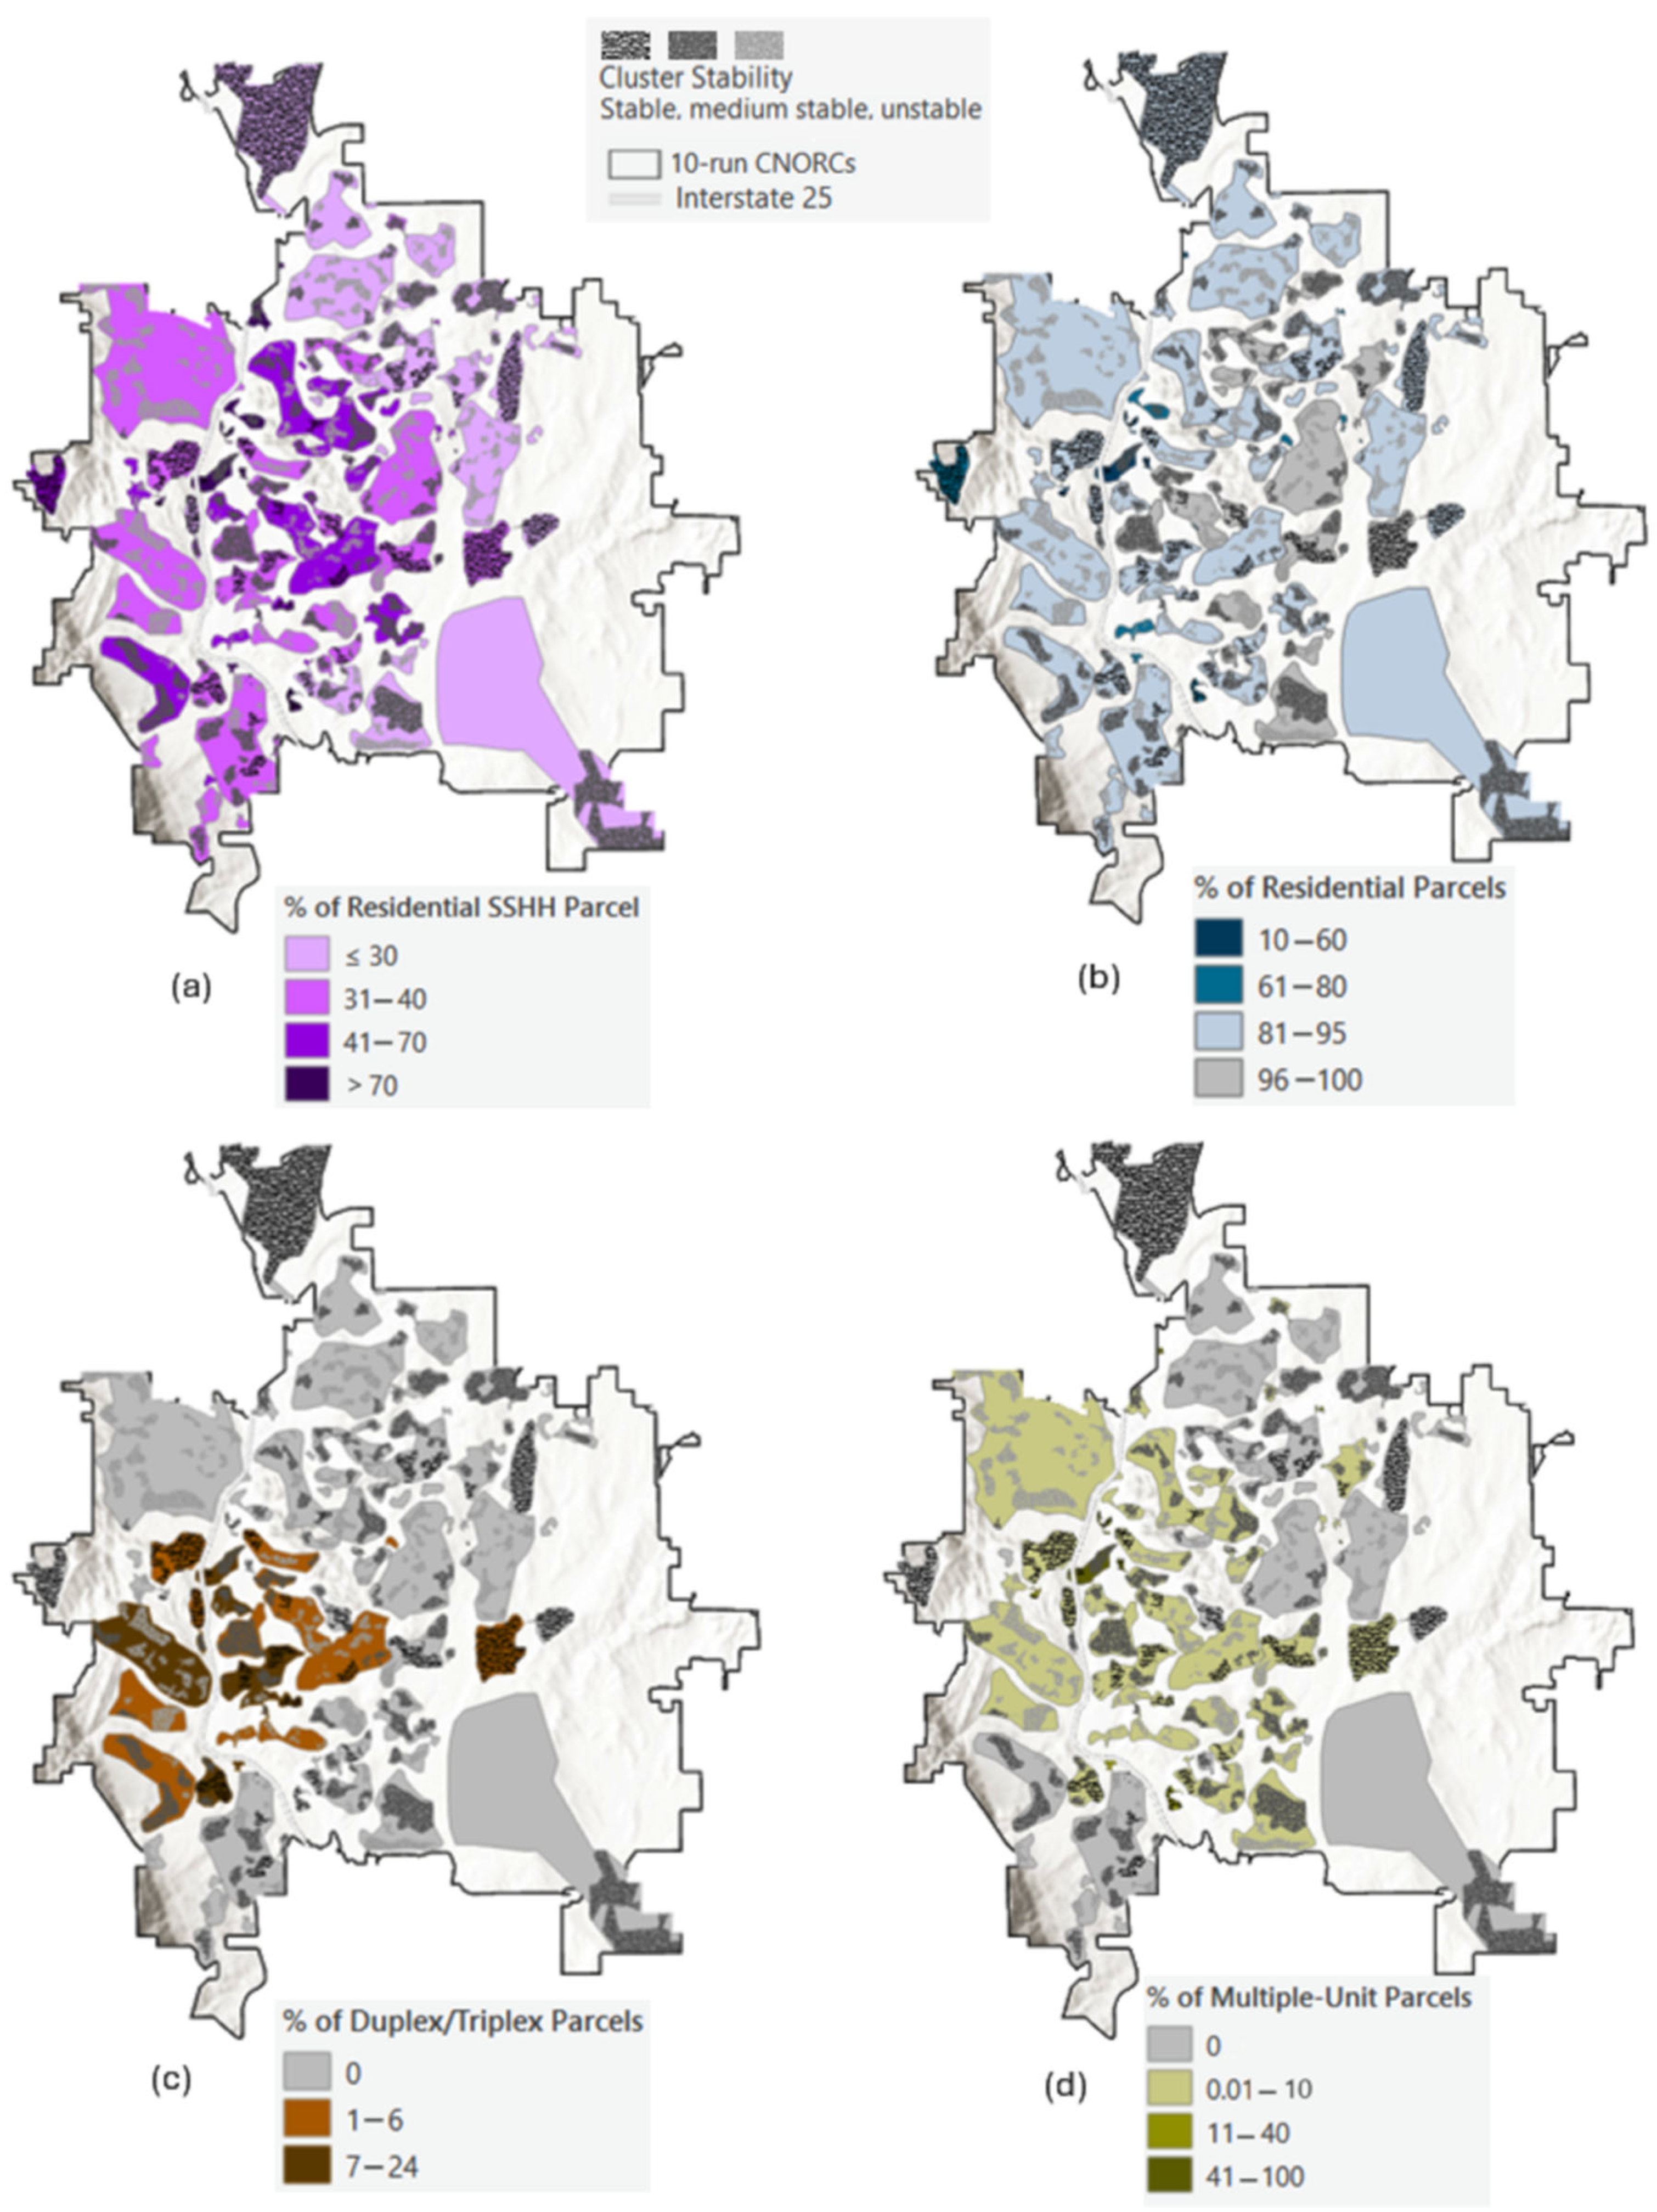
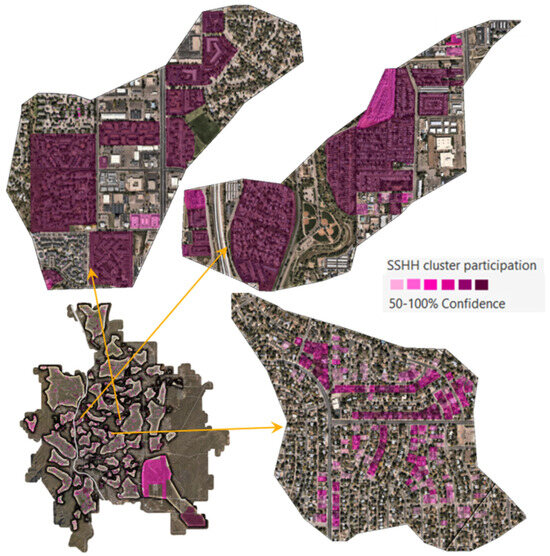
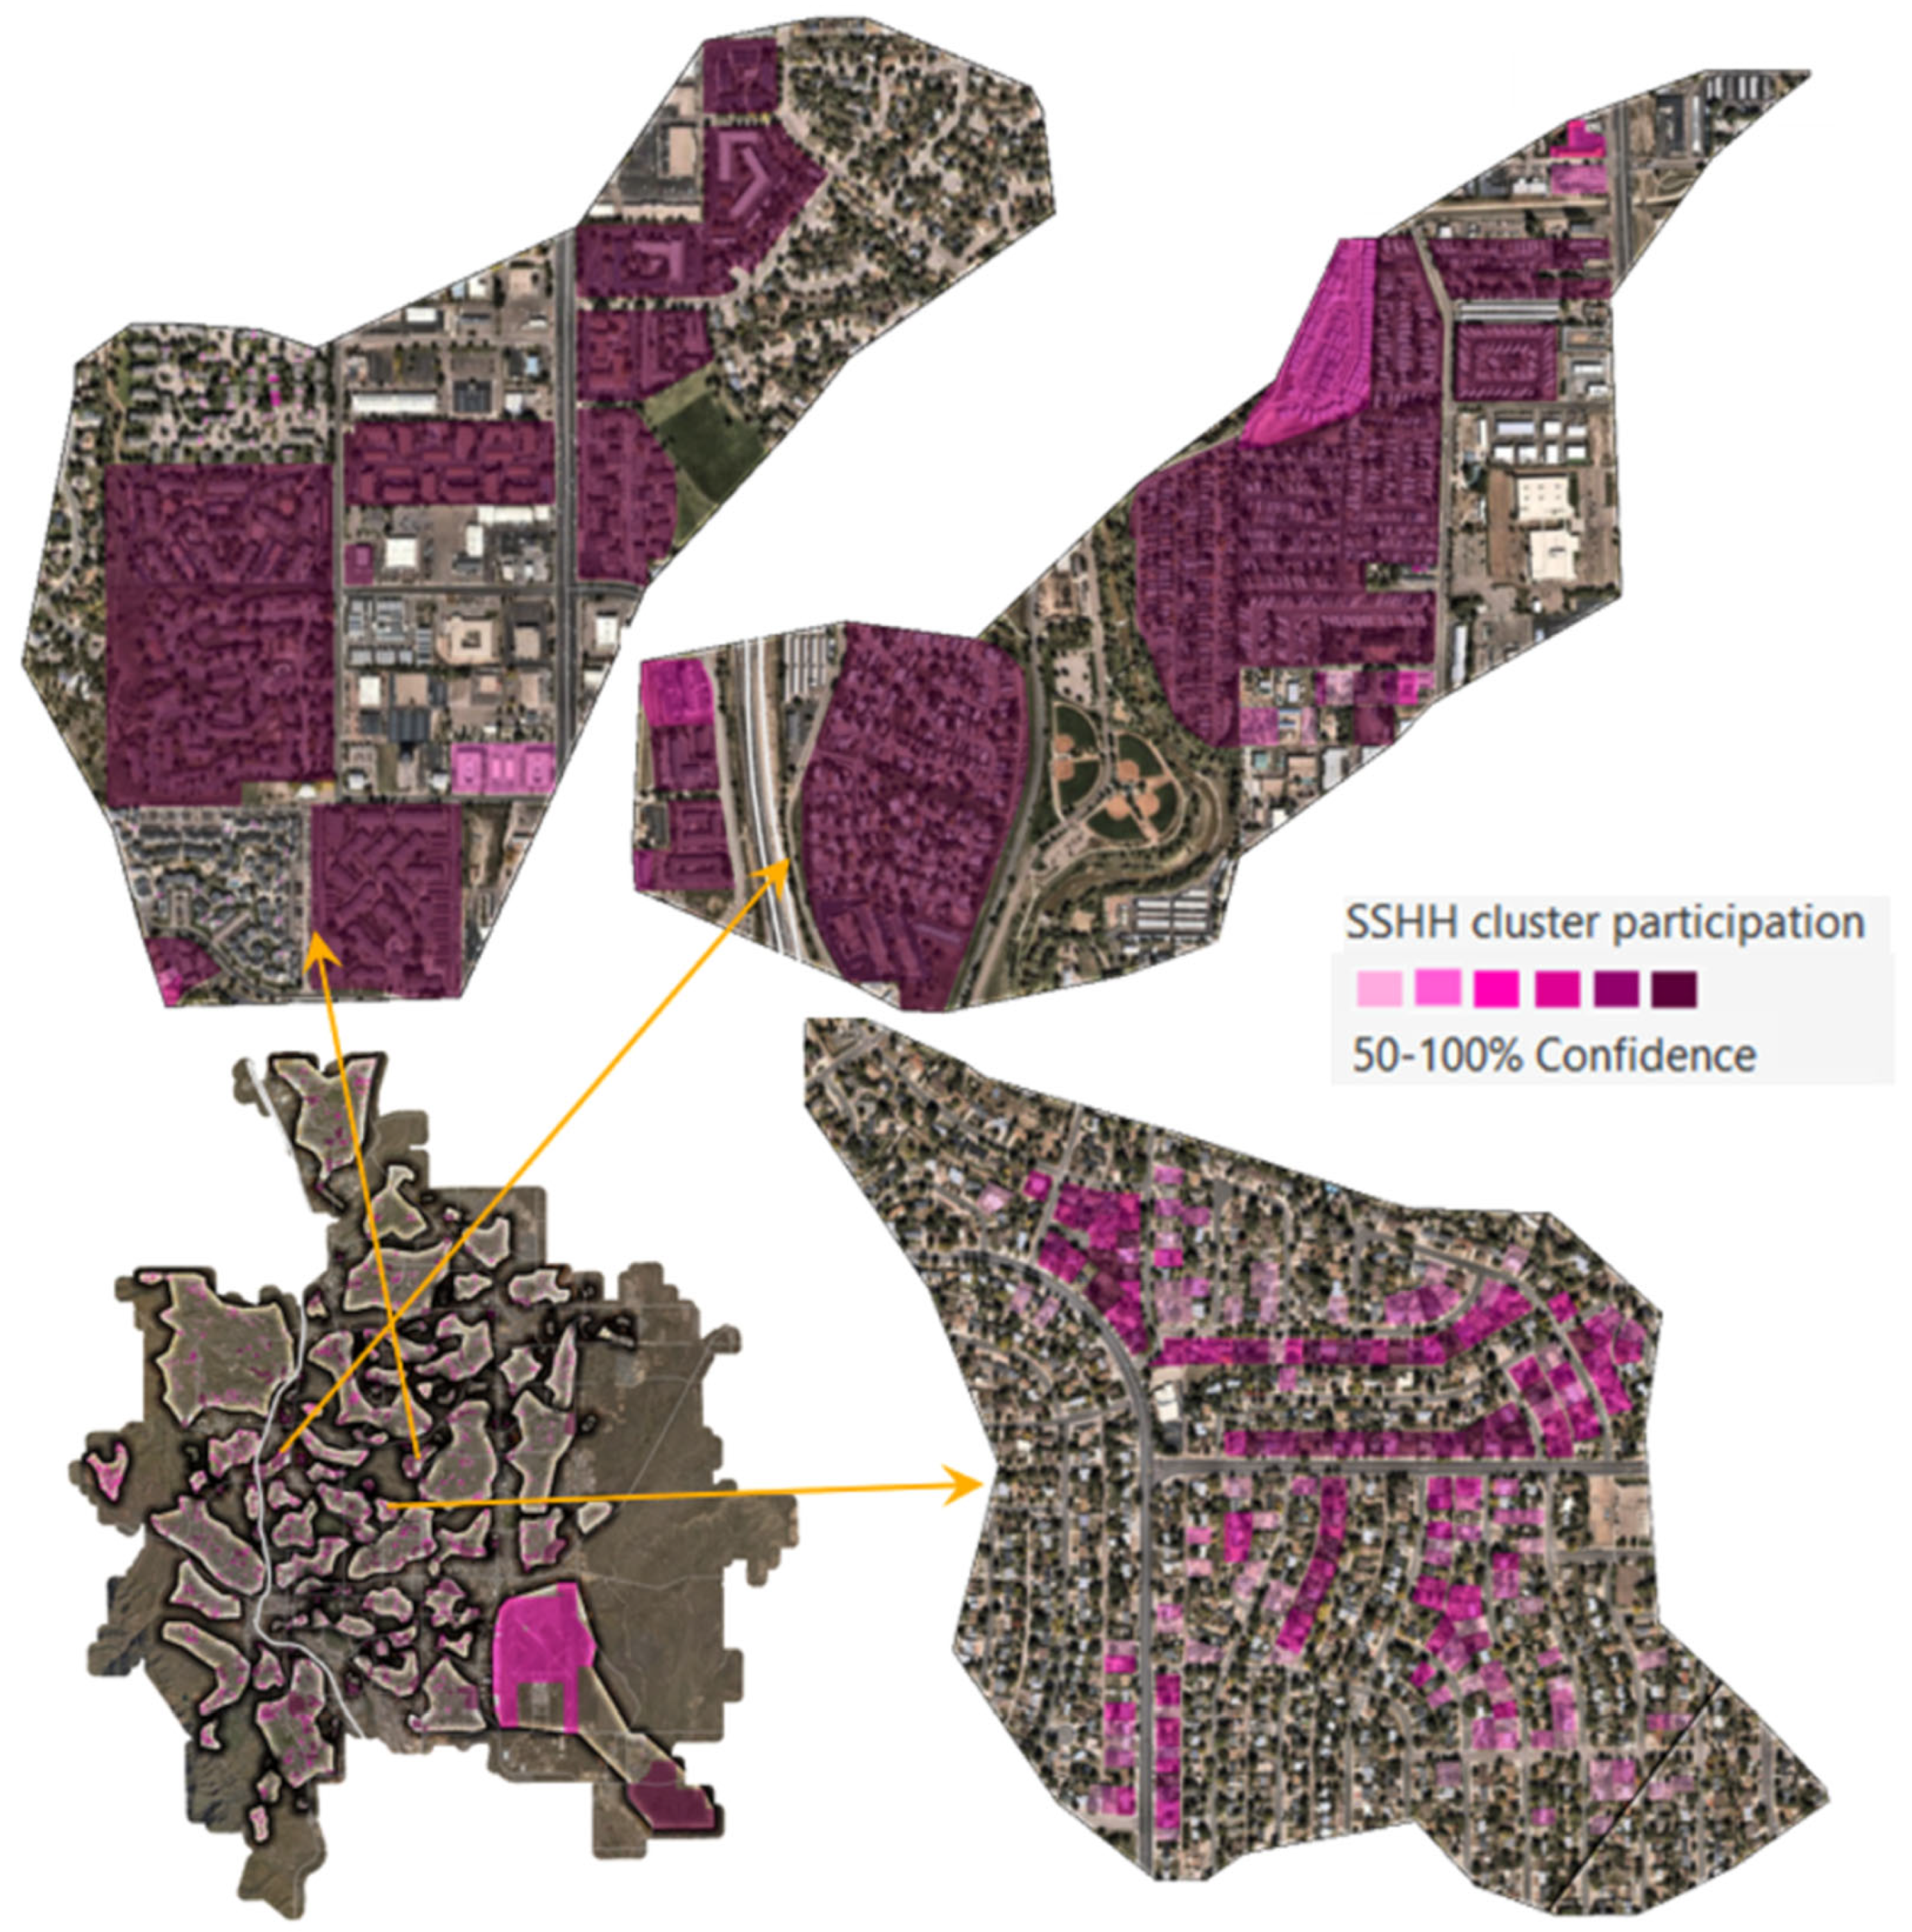

Disclaimer/Publisher’s Note: The statements, opinions and data contained in all publications are solely those of the individual author(s) and contributor(s) and not of MDPI and/or the editor(s). MDPI and/or the editor(s) disclaim responsibility for any injury to people or property resulting from any ideas, methods, instructions or products referred to in the content. |
© 2026 by the authors. Published by MDPI on behalf of the International Society for Photogrammetry and Remote Sensing. Licensee MDPI, Basel, Switzerland. This article is an open access article distributed under the terms and conditions of the Creative Commons Attribution (CC BY) license.