


Abstract
To characterize age-associated molecular differences in the longissimus dorsi muscle of female Ashdan yaks, this study combined Oxford Nanopore Technologies (ONT) full-length transcriptomic sequencing and untargeted LC-MS metabolomics in 27 independent animals aged 10 days (M0), 6 months (M6), and 54 months (M54), with nine animals per group. At BH q < 0.05 and |log2FC| > 1, the three pairwise comparisons identified 1999, 3480, and 2350 differentially expressed genes, respectively, with the largest set between M0 and M54. Networks reconstructed from these gene sets identified high-connectivity candidates, including ENSBGRG00000003669 in comparisons involving M0 and MRTO4 and BYSL in M6 vs. M54. Of 1842 retained annotated LC-MS peak features, 1487, 1474, and 1285 were differential at BH q < 0.05; 676, 589, and 452 also showed at least twofold differences. Separate gene-overrepresentation and quantitative metabolite member-profile tests supported oxidative phosphorylation in both comparisons involving M0 and purine metabolism in M0 vs. M6. Alanine, aspartate and glutamate metabolism showed recurring metabolite-profile differences without significant gene overrepresentation. Among 1860 matched gene-feature pairs, 977 pooled associations passed BH q < 0.05. The transcript resource included 4642 novel candidates and 14 unique differential splicing candidates. These findings characterize age-associated transcriptional and metabolic variation and prioritize pathways and computational candidates for subsequent study.
1. Introduction
Yaks are the most representative livestock of the Qinghai-Tibet Plateau. Adapted to low-oxygen, cold environments, yaks produce meat renowned for its high protein content and unique flavor, and play an important role in the economy of plateau pastoral areas [1]. Skeletal muscle accounts for approximately 40 percent of body weight; its development not only determines meat yield but also influences meat quality through muscle fiber type and intramuscular fat deposition [2,3].
A whole-transcriptome analysis of yak muscle and adipose tissue revealed a candidate ceRNA regulatory network associated with intramuscular fat deposition [4]; a transcriptomic and DNA methylation study of the longissimus dorsi muscle in polled yaks at different developmental stages also identified differentially expressed genes associated with muscle growth, such as TMEM8C, IGF2, and MUSTN1 [5]. These studies place transcriptional and epigenetic variation within the broader regulation of myogenesis [6]. However, the presence of an associated pathway or predicted regulatory network does not by itself establish its contribution to muscle growth.
Third-generation sequencing technologies such as ONT can read long transcript molecules and offer advantages in identifying candidate new transcripts, alternative splicing, and non-coding RNAs [7]. A full-length transcriptome study of porcine skeletal muscle identified candidate genes associated with muscle development [8]. Long-read sequencing also expands bovine transcript annotations, although transcript completeness and functional relevance require separate assessment [9,10]. Metabolomics provides complementary information on small-molecule abundance in muscle [11]. A combined transcriptomic and metabolomic analysis of cattle longissimus dorsi linked molecular variation with measured meat-quality differences [12]. Together, these approaches can connect transcript diversity with metabolic context, provided that annotation confidence, multiple testing, and the distinction between relative abundance and pathway activity are considered.
Muscle development is jointly influenced by genetics, nutrition, and age. A transcriptomic study spanning 11 prenatal and early postnatal periods in pigs demonstrated pronounced stage-dependent expression patterns [13]. Such dense sampling can resolve changes that three widely separated ages cannot. A combined proteomic and transcriptomic study of yak longissimus dorsi under different feeding systems also found incomplete correspondence between RNA and protein changes [14]. Untargeted NMR profiling of Jiulong yak meat identified differences in amino acid-related metabolites among muscles [15]. These findings support examining transcripts and metabolite profiles together, but also show why evidence from one molecular layer should not be treated as a direct measurement of another. Analyses of the same animals can distinguish shared pathway-level patterns from individual gene-metabolite co-variation; accounting for age group is necessary to assess whether pooled associations extend beyond differences between the sampled groups.
This study examined the longissimus dorsi muscle from 27 female Ashdan yaks at three postnatal ages: 10 days (M0), 6 months (M6), and 54 months (M54). These ages contrast early calf life, a later juvenile age, and adulthood in independent animals rather than tracing a continuous developmental trajectory. ONT full-length transcriptomic sequencing and untargeted LC-MS metabolomics were used to characterize transcript resources and age-associated expression and abundance differences. Differential gene sets provided the inputs for functional overrepresentation and protein association network analyses. Complementary pathway-member profiles and matched gene-metabolite associations were examined with multiple-testing control, including assessment after adjustment for age group. The objective was to identify molecular patterns and computational candidates relevant to yak muscle biology, while separating these associations from validated mechanisms or demonstrated improvements in meat quality.
2. Materials and Methods
2.1. Ethical Statement
The experiment on Ashdan yaks was approved by the Animal Care and Ethics Committee of the Lanzhou Institute of Animal Science and Veterinary Medicine, Chinese Academy of Agricultural Sciences (SYXK-2014-0002).
2.2. Laboratory Animals and Tissue Collection
All 27 female Ashdan yaks in this study were from Datong Yak Farm in Qinghai Province. Nine independent animals were sampled at each of three ages: 10 days (M0), 6 months (M6), and 54 months (M54). Sampling took place in April 2026 under free-grazing management. The groups consisted of different animals; identical numeric sample suffixes in different age groups did not indicate repeated sampling. For each animal, the same tissue sample was used for both omics assays, and sample identities were matched across ONT and LC-MS datasets. After slaughter, longissimus dorsi muscle tissue was collected, cut into 1 cm3 blocks, rapidly frozen in liquid nitrogen, and retained for ONT full-length transcriptomic sequencing and untargeted LC-MS metabolomics.
2.3. Analysis of ONT Full-Length Transcriptomic Sequencing Data
2.3.1. RNA Extraction
A 15–30 mg tissue sample was ground in liquid nitrogen and homogenized in TRK Lysis Buffer. The lysate was transferred to a homogenization column and centrifuged at 14,000× g for 2 min at room temperature to remove insoluble impurities. An equal volume of 70% ethanol was added to the filtrate, and the mixture was vortexed, transferred to an RNA-binding column, and centrifuged at 10,000× g for 1 min. The flow-through was discarded. The column was washed with 500 µL of RNA Wash Buffer I and centrifuged at 10,000× g for 30 s, followed by 500 µL of RNA Wash Buffer II and centrifugation at 10,000× g for 1 min. The column was centrifuged again at 10,000× g for 2 min to remove residual wash solution. RNA was eluted into a new 1.5 mL tube with 30–70 µL of nuclease-free water by centrifugation at 10,000× g for 2 min. RNA quality was assessed using a NanoDrop One spectrophotometer (NanoDrop Technologies, Wilmington, DE, USA) and a Qubit 3.0 Fluorometer (Life Technologies, Carlsbad, CA, USA).
2.3.2. Sequencing Read Processing and Transcript Assembly
The provider’s initial sequencing workflow used Dorado with—no-trim to convert raw Nanopore signals to FASTQ sequences. Reads with mean Q ≥ 10 and length ≥ 50 nt were retained. Pychopper 2.7.1 (-Q 7 -z 50) was used to identify, orient, and trim full-length cDNA reads, followed by NanoFilt 2.8.0 (-q 7 -l 50) [16]. Reads were aligned to the Bos grunniens LU_Bosgru_v3.0 reference genome with the Ensembl release 116 annotation using minimap2 2.24-r1122 (-ax splice -uf -k14) [17]. Alignment statistics were calculated using samtools 1.15.1 flagstat [18]. Pinfish 0.1.0 with default settings was used to construct consensus transcript sequences through spliced_bam2gff, cluster_gff, collapse_partials, and polish_clusters. StringTie 2.2.1 (-conservative -L -R) was used for transcript reconstruction, followed by—merge with default settings to generate the nonredundant transcript set. These settings were recovered from the provider’s analysis report. The statistical reanalysis used the delivered GTF, annotation, estimated-count, and TPM files; base calling, read alignment, and transcript reconstruction were not repeated.
2.3.3. Novel Transcript Annotation and Candidate Resource Assessment
We compared the nonredundant transcripts with the reference annotation using gffcompare 0.12.6 (-R -C -K -M). The supplied novel-transcript candidate catalog comprised class codes i, j, k, m, n, o, u, x, and y. Coding regions were predicted using TransDecoder 5.5.0 (-m 50–single_best_only). Functional annotations used the supplied Nr, KEGG, GO, and KOG results, together with the available UniProt and Pfam annotations. Candidate transcript IDs from the complete novel-transcript FASTA were matched to the exported estimated-count matrix and functional-annotation table. An estimated count of at least 10 in at least three animals defined a descriptive expression-support tier. Sequence-catalog membership, annotation availability, and expression support were summarized separately; these criteria did not independently verify complete transcript boundaries, splice junctions, or function.
2.3.4. Structural Optimization and Differential Splicing Analysis
We adjusted gene-model boundaries using AGAT (agat_convert_sp_gff2gtf.pl), including upstream or downstream UTR extensions supported by the reconstructed models. For reanalysis, a common structural-event catalog was generated from the supplied combined GTF using official SUPPA 2.3 [19], with strict boundaries and event options SE, SS, MX, RI, and FL. PSI was recalculated from the complete isoform TPM matrix using psiPerEvent. Pairwise empirical differential splicing was evaluated using diffSplice with nine independent animals per group, -area 1000, -lower-bound 0, -tpm-threshold 1, and -nan-threshold 0. Event identifiers were sorted and PYTHONHASHSEED was fixed at 20261020 for reproducibility. No paired-across-age option or ΔPSI-based preselection was used. Within each comparison, BH correction included all finite event p-values pooled across the seven event classes. Differential candidates required BH q < 0.05 and |ΔPSI| > 0.1. Empirical p-values of zero indicated that the observed ΔPSI exceeded the finite local empirical-distribution support; they were not interpreted as exact zero probabilities. Structural-catalog totals and differential-candidate counts were reported separately.
SSR predictions were obtained using MISA 1.0 with the provider’s default settings. Exported locus rows, SSR-containing sequences, and the provider’s compound-formation count were enumerated as separate units. Coding potential was predicted using CNCI 2.0, CPC2 (standalone_python3 v1.0.1), and PLEK; the intersection of the three noncoding prediction sets defined the consensus lncRNA candidates. The separate positional-classification table was treated as a partial annotation, rather than a classification of the complete consensus set. TF entries and families were summarized from the provider’s transcript annotation table. These catalogs were treated as computational resources without inferred TF-target or lncRNA regulatory relationships.
2.3.5. Analysis of Differentially Expressed Genes and Transcripts
Transcript abundance was originally quantified using Salmon 2.4.1 [20]. For the revised gene- and transcript-level expression analyses, the exported estimated-count matrices, rather than TPM, were used. Features with CPM ≥ 1 in at least nine of the 27 animals were retained before testing, and estimated counts were rounded to the nearest integer for PyDESeq2 0.5.4, a Python (3.10) implementation of the DESeq2 workflow [21]. Negative-binomial models included categorical age group (~age_group), with median-of-ratios normalization, parametric dispersion fitting, Cook’s-distance handling and refitting, and pairwise Wald contrasts. BH adjustment was performed within each gene- or transcript-level contrast using the software’s default independent filtering. Differential expression required adjusted p < 0.05 and |log2FC| > 1; Wald 95% confidence intervals were retained. Positive log2FC indicated higher expression in the older group. Fold changes were model estimates, not ratios of group baseMean values. Effective-length offsets were not reconstructed from the exported matrices; interpretation of this import depends on the original library and quantification workflow.
Gene-level PCA used the 2000 most variable retained genes after PyDESeq2 variance stabilization, centering, and unit-variance scaling. PCA was descriptive; no animal was removed to improve age-group separation. The covariance contours in the PCA display were descriptive 95% contours, calculated from each group’s PC1-PC2 covariance and the two-dimensional chi-square quantile, rather than tests of group separation.
2.3.6. Functional Overrepresentation Analysis
KEGG and GO overrepresentation was tested using upper-tail hypergeometric tests. For each contrast, the background comprised expression-filtered genes with a finite expression-test p-value and the corresponding supplied annotations. Terms with at least three background genes were eligible, including terms with no selected-gene hits. BH correction was applied to the complete eligible KEGG and GO families separately within each comparison. GO analysis used direct supplied annotations without propagation to ancestor terms. DETs and their tested transcript background were projected to unique mapped genes before a separately reported enrichment analysis, preventing multiple transcripts from counting the same gene repeatedly.
2.3.7. DEG-Derived Protein Association Networks
Each current DEG set was mapped by exact ENSBGRG gene identifiers to protein aliases in the complete Bos grunniens STRING v12.0 reference (taxon 30521) [22]. Proteins assigned to multiple gene identifiers were excluded. Functional associations with combined scores >700/1000 were retained only when both endpoints mapped to current DEGs. Self-links were removed, and reciprocal or isoform-level edges were collapsed to unique undirected gene pairs using the maximum score. No non-DEG neighbors were added. Unweighted degree was the number of distinct DEG-gene neighbors in the complete network; mapped isolated genes had degree zero, and unmapped genes were recorded separately. Candidates were ranked by descending degree, with equal degrees sharing a dense rank and stable gene identifiers determining display order within ties. Network processing used NetworkX 3.5.
2.4. Untargeted LC-MS Metabolomics Analysis
2.4.1. Sample Preparation
A 25 mg sample of longissimus dorsi muscle was mixed with 500 μL of internal-standard extraction solution (methanol:acetonitrile:water, 2:2:1, v/v/v) precooled to −40 °C. The sample was homogenized at 35 Hz for 4 min and sonicated in an ice-water bath for 5 min; this sequence was repeated three times. After incubation at −40 °C for 1 h, 300 μL was transferred to a 96-well filtration plate. The filtration plate and collection plate were placed in a positive-pressure device, and pressure was gradually increased to 6 psi and maintained for 3 min. The filtrate was collected for analysis. Equal aliquots of filtrate from the samples were pooled to prepare the QC sample.
2.4.2. LC-MS Acquisition and Provider Annotation
A Vanquish ultra-high-performance liquid chromatograph (Thermo Fisher Scientific, Waltham, MA, USA) with a Waters ACQUITY UPLC BEH Amide column (2.1 mm × 50 mm, 1.7 μm) was used for chromatographic separation [23]. Mobile phase A contained 25 mmol/L ammonium acetate and 25 mmol/L ammonium hydroxide in water, and mobile phase B was acetonitrile. The autosampler was maintained at 4 °C, and the injection volume was 2 μL. MS1 and MS2 data were acquired using an Orbitrap Exploris 120 mass spectrometer (Thermo Fisher Scientific, Waltham, MA, USA) under Xcalibur 4.4 control. The source settings were a sheath gas flow of 50 arbitrary units, auxiliary gas flow of 15 arbitrary units, capillary temperature of 320 °C, full-MS resolution of 60,000, MS/MS resolution of 15,000, stepped normalized collision energies of 20/30/40, and spray voltages of 3.8 kV in positive mode and −3.4 kV in negative mode. The provider converted raw data to mzXML using ProteoWizard 3.0.24054 and used an in-house R workflow [24] with inhouse_database V4.0 for metabolite annotation. Instrumental peak detection and spectral matching were not repeated in the statistical reanalysis.
2.4.3. Peak Feature Processing and Quality Control
The exported matrix contained 27 biological samples and four QC measurements. Rows were collapsed only when ion mode, m/z, retention time, and all 31 exported intensities agreed exactly. Conflicting profiles were kept separate, and all candidate annotations were retained. Six internal-standard signals were excluded using the supplied IS_Info table. Zero intensities were treated as missing signals. Retained features required detection in at least three of four QCs, a QC coefficient of variation ≤30% calculated from observed exported areas, and detection in at least five of nine animals in at least one age group. For each sample, observed areas were divided by the total observed area of retained unique features separately in positive and negative ion modes. Missing normalized values were filled with half the feature-specific minimum positive intensity across biological and QC samples, and each filled cell was flagged. The resulting values were log2-transformed. QC variability was summarized before and after normalization.
2.4.4. Differential Peak Abundance and Effect Sizes
For each pairwise comparison, a feature was quantitatively testable only if observed signal was present in at least five animals in each group and the standard error was nondegenerate. Two-sided Welch t-tests compared log2 normalized intensities. Log2FC was the older-group minus younger-group mean on this scale, and Welch 95% confidence intervals and geometric fold changes were retained. BH correction included all testable retained signals, annotated and unannotated, within each comparison. Differential peaks required q < 0.05 without a VIP cutoff. Primary significant peaks with no imputed values in the compared animals were marked as a sensitivity subset without recalculating BH on that subset. A companion analysis used the provider-processed matrix with the same signal identities and quantitative-testing eligibility.
2.4.5. PCA, Supervised Model Validation, and Descriptive Clustering
Metabolomic PCA used all retained log2-transformed features, including QC measurements, after centering and unit-variance scaling. As in gene PCA, 95% covariance contours were descriptive. For pairwise supervised discrimination, one orthogonal component was removed using pyopls 20.3. post1, followed by one-component PLS regression using scikit-learn 1.9.1. QC-qualified annotated signals were used without differential-feature preselection. QC filtering and sample-wise ion-mode total-area normalization were independent of age labels. Within each training fold, features required observed values in at least half the training samples; half-minimum imputation, log2 transformation, centering, and unit-variance scaling were fitted on the training samples and applied to the held-out samples. Stratified threefold cross-validation was repeated for ten deterministic seeds, starting at 20261020, 20261120, and 20261220 for the three comparisons, with increments of one across repeats. Q2 was calculated as 1 minus the out-of-fold prediction-error sum of squares divided by the total sum of squares of the binary age-group label. The first deterministic threefold Q2 was compared with 999 label-permutation Q2 values, refitting the complete training-fold pipeline for each permutation. The permutation p-value was (1 + the number of permuted Q2 values at least as large as observed)/1000. Repeated splits assessed split sensitivity and did not provide independent external validation.
K-means clustering used the mean log2 abundances of all retained annotated features in M0, M6, and M54, standardized within each feature across the three group means. Solutions with k = 2–9 were fitted using 30 initializations and random seed 20261020. Silhouette scores were calculated on a deterministic sample of up to 1200 features. Solutions with a minimum cluster size of at least ten were eligible; the solution with the highest silhouette score was selected, with smaller k breaking exact ties. The selected clusters were descriptive summaries of independent age groups, and the nearly tied k = 3 and k = 6 scores were reported.
2.4.6. Metabolite Pathway Overrepresentation and Member-Profile Tests
Metabolite overrepresentation used only quantitatively testable, single-candidate features with provider-assigned level 1 or 2 annotations and exactly one KEGG compound identifier. Each compound was counted once. The background comprised the eligible measured compounds, and selected compounds were those represented by at least one FDR-significant feature. Provider-exported pathway membership was used, with at least two background compounds required per pathway. Upper-tail hypergeometric p-values were BH-corrected over all 60 eligible pathways separately in each comparison.
A separate quantitative member-profile test included all eligible measured compound signals without selecting differential peaks. Each eligible log2 signal was median-centered across all 27 biological samples without age labels, and signals assigned to the same compound were combined by their per-sample median. For each pathway, the statistic was the mean squared Welch t across its measured compound profiles. All 48,620 allocations of the 18 compared animals into two groups of nine were enumerated; the same allocation was applied to every compound and pathway to preserve within-sample covariance. The exhaustive tail probability included the observed and complementary allocations, without a Monte Carlo plus-one adjustment. BH correction pooled all 180 pathway-comparison hypotheses. Sensitivity tests used standardized rank profiles with a mean squared rank-difference statistic, or excluded signals with any imputed value in the compared animals. The original pathway family was retained; sets with fewer than two eligible remaining compounds received p = 1 and were marked unassessable. These tests assumed sample-label exchangeability and described relative member-profile differences, not pathway activation or metabolic flux.
2.5. Pathway Comparison and Matched Gene-Metabolite Associations
Gene-overrepresentation results and metabolite member-profile results were matched by KEGG pathway code. Two-layer support required q < 0.05 for each layer’s distinct test in the same comparison, without treating metabolite profile association as metabolite overrepresentation. Oxidative phosphorylation, purine metabolism, and alanine, aspartate and glutamate metabolism were selected as exploratory focus pathways from the original group-level study, before the matched individual association results were examined. All retained genes annotated to these pathways and all eligible unambiguous metabolite features mapping to their measured compounds defined 1860 unique gene-feature pairs across the same 27 animals.
Pooled Spearman correlations were calculated from global ranks of variance-stabilized gene expression and log2 metabolite intensities. Two-sided significance was assessed using 19,999 unrestricted permutations of metabolite-animal correspondence, with a common permutation across all pairs, plus-one p-values, and BH correction across all 1860 pairs. The |rho| ≥ 0.7 threshold identified a display subset among pooled FDR-significant associations. For age-adjusted analysis, each global rank vector was residualized against categorical age-group indicators, and the residual vectors were correlated. Metabolite-animal correspondence was permuted independently within each age group 999,999 times, again using a common permutation across all pairs. Two-sided plus-one p-values were BH-corrected over the same complete family. The three illustrated pairs had the largest absolute pooled correlation within each focus pathway; pooled and age-adjusted estimates were displayed together.
3. Results
3.1. Full-Length Transcriptome Profiles and Transcript Resources
3.1.1. Sample Structure and Support for Novel Transcripts
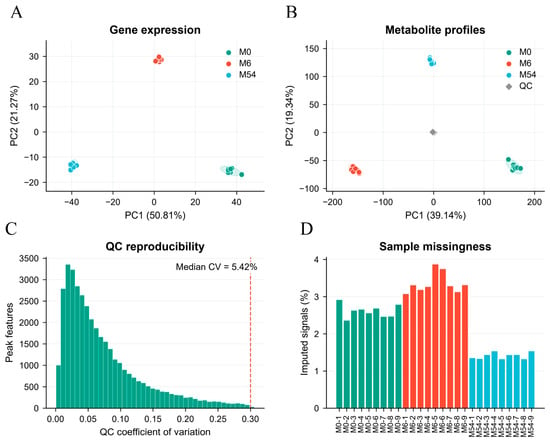
The full-length transcriptome dataset comprised 27 female Ashdan yaks, with nine independent animals at each age: 10 days (M0), 6 months (M6), and 54 months (M54). Provider-exported alignment rates ranged from 97.90% to 98.99%. All 27 animals were retained in the expression analysis. Principal component analysis of the 2000 most variable variance-stabilized genes showed distinct age-group profiles; PC1 and PC2 explained 50.81% and 21.27% of the variance, respectively (Figure 1A). The comparisons therefore describe molecular differences among independent age groups.
Figure 1.
Quality control and sample structure. (A) PCA of the 2000 most variable variance-stabilized genes. (B) PCA of all retained metabolite signals, including QC measurements. Ellipses in A and B are descriptive 95% covariance contours. (C) QC coefficient-of-variation distribution after normalization. (D) Percentage of filled metabolite signals in each animal. M0, 10 days; M6, 6 months; M54, 54 months; n = 9 independent female Ashdan yaks per group.
The supplied novel-transcript sequence set contained 4642 unique candidates, of which 3573 were represented in the supplied functional annotation table. A total of 3875 candidates had an estimated count of at least 10 in at least three animals (Figure S1B). This expression-support summary complements the sequence and annotation resources but does not independently validate transcript boundaries, complete exon-intron structures, or biological function.
3.1.2. Alternative Splicing Candidates and SSR Counting Units
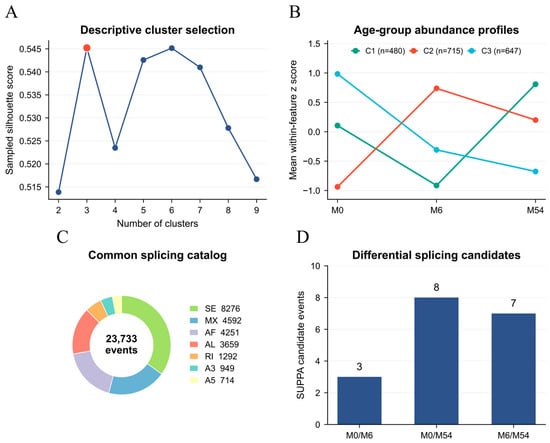
SUPPA analysis of the common transcript annotation generated 23,733 structural splicing events, of which 22,285 had finite PSI in at least one animal. The catalog comprised 8276 SE, 4592 MX, 4251 AF, 3659 AL, 1292 RI, 949 A3, and 714 A5 events (Figure 2C). Complete-family BH correction followed by q < 0.05 and |ΔPSI| > 0.1 identified 3, 8, and 7 differential candidates in M0 vs. M6, M0 vs. M54, and M6 vs. M54, respectively (Figure 2D), corresponding to 14 unique events across comparisons (Figure S1A).
Figure 2.
Descriptive abundance profiles and splicing candidates. (A) Sampled silhouette scores for k = 2–9; k = 3 and k = 6 are nearly tied. (B) Three descriptive clusters of all 1842 retained annotated metabolite peaks, summarized by their standardized age-group means. (C) Composition of the common 23,733-event splicing catalog. (D) SUPPA candidates meeting complete-family BH q < 0.05 and |ΔPSI| > 0.1. Selected empirical p-values of zero reflect finite local empirical-distribution support and do not establish exact zero probabilities or validated splice changes. The profiles describe independent age groups.
All selected empirical p-values were zero because the observed differences exceeded the finite local empirical-distribution support; these are candidate events rather than validated splice changes. The SSR export contained 15,003 locus rows in 11,321 SSR-containing sequences. The supplier total of 17,272 combined these loci with a compound-formation count of 2269. The reported 108,186,438 bp describes all sequences examined, not the total length of SSRs.
3.1.3. Transcription Factor Annotations and lncRNA Predictions
The provider also supplied a separate 559-entry positional classification comprising 375 intergenic, 33 antisense, 131 intronic, and 20 sense entries. This partial classification was not used to describe the positional distribution of all 631 consensus predictions. These resources represent computational annotations and candidates for subsequent study.
3.1.4. Differential Gene Expression and Downstream Analyses
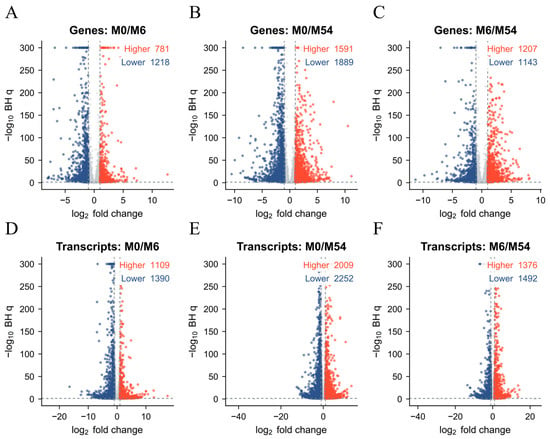
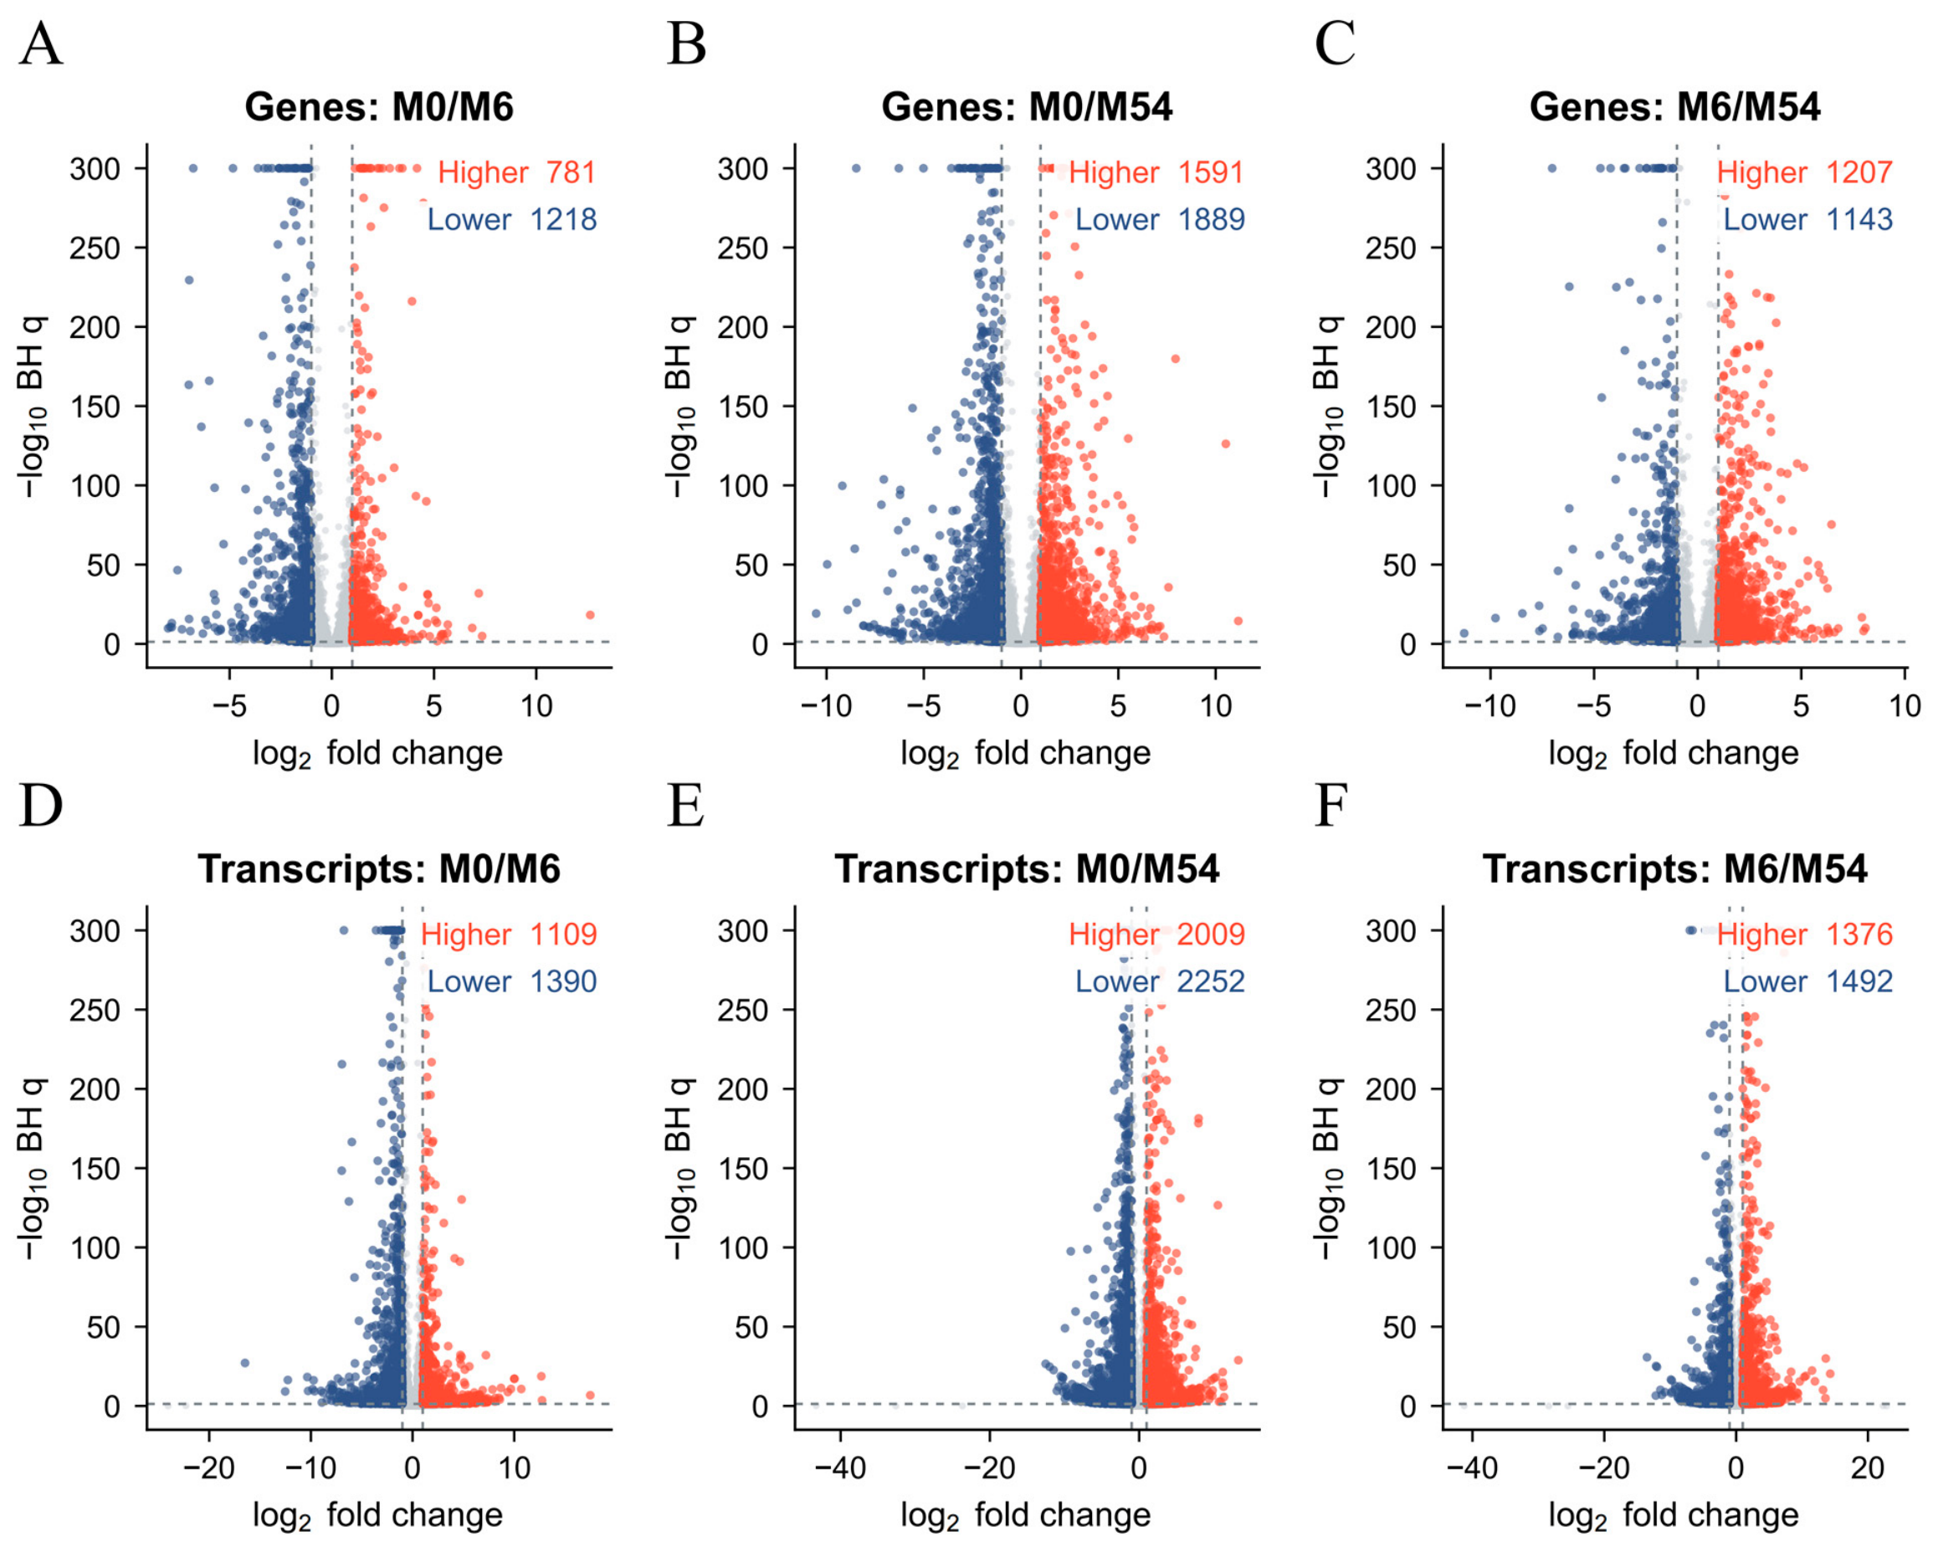
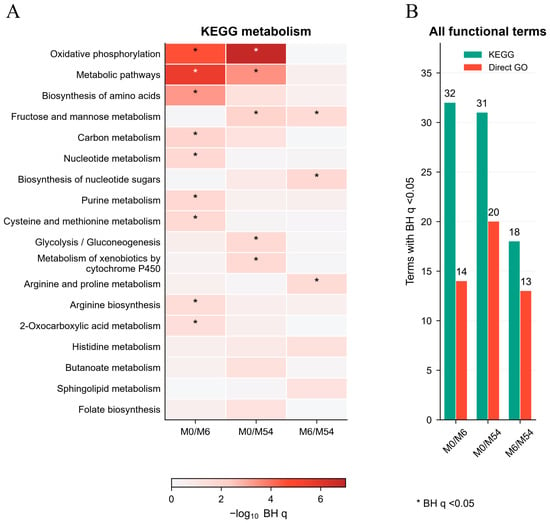
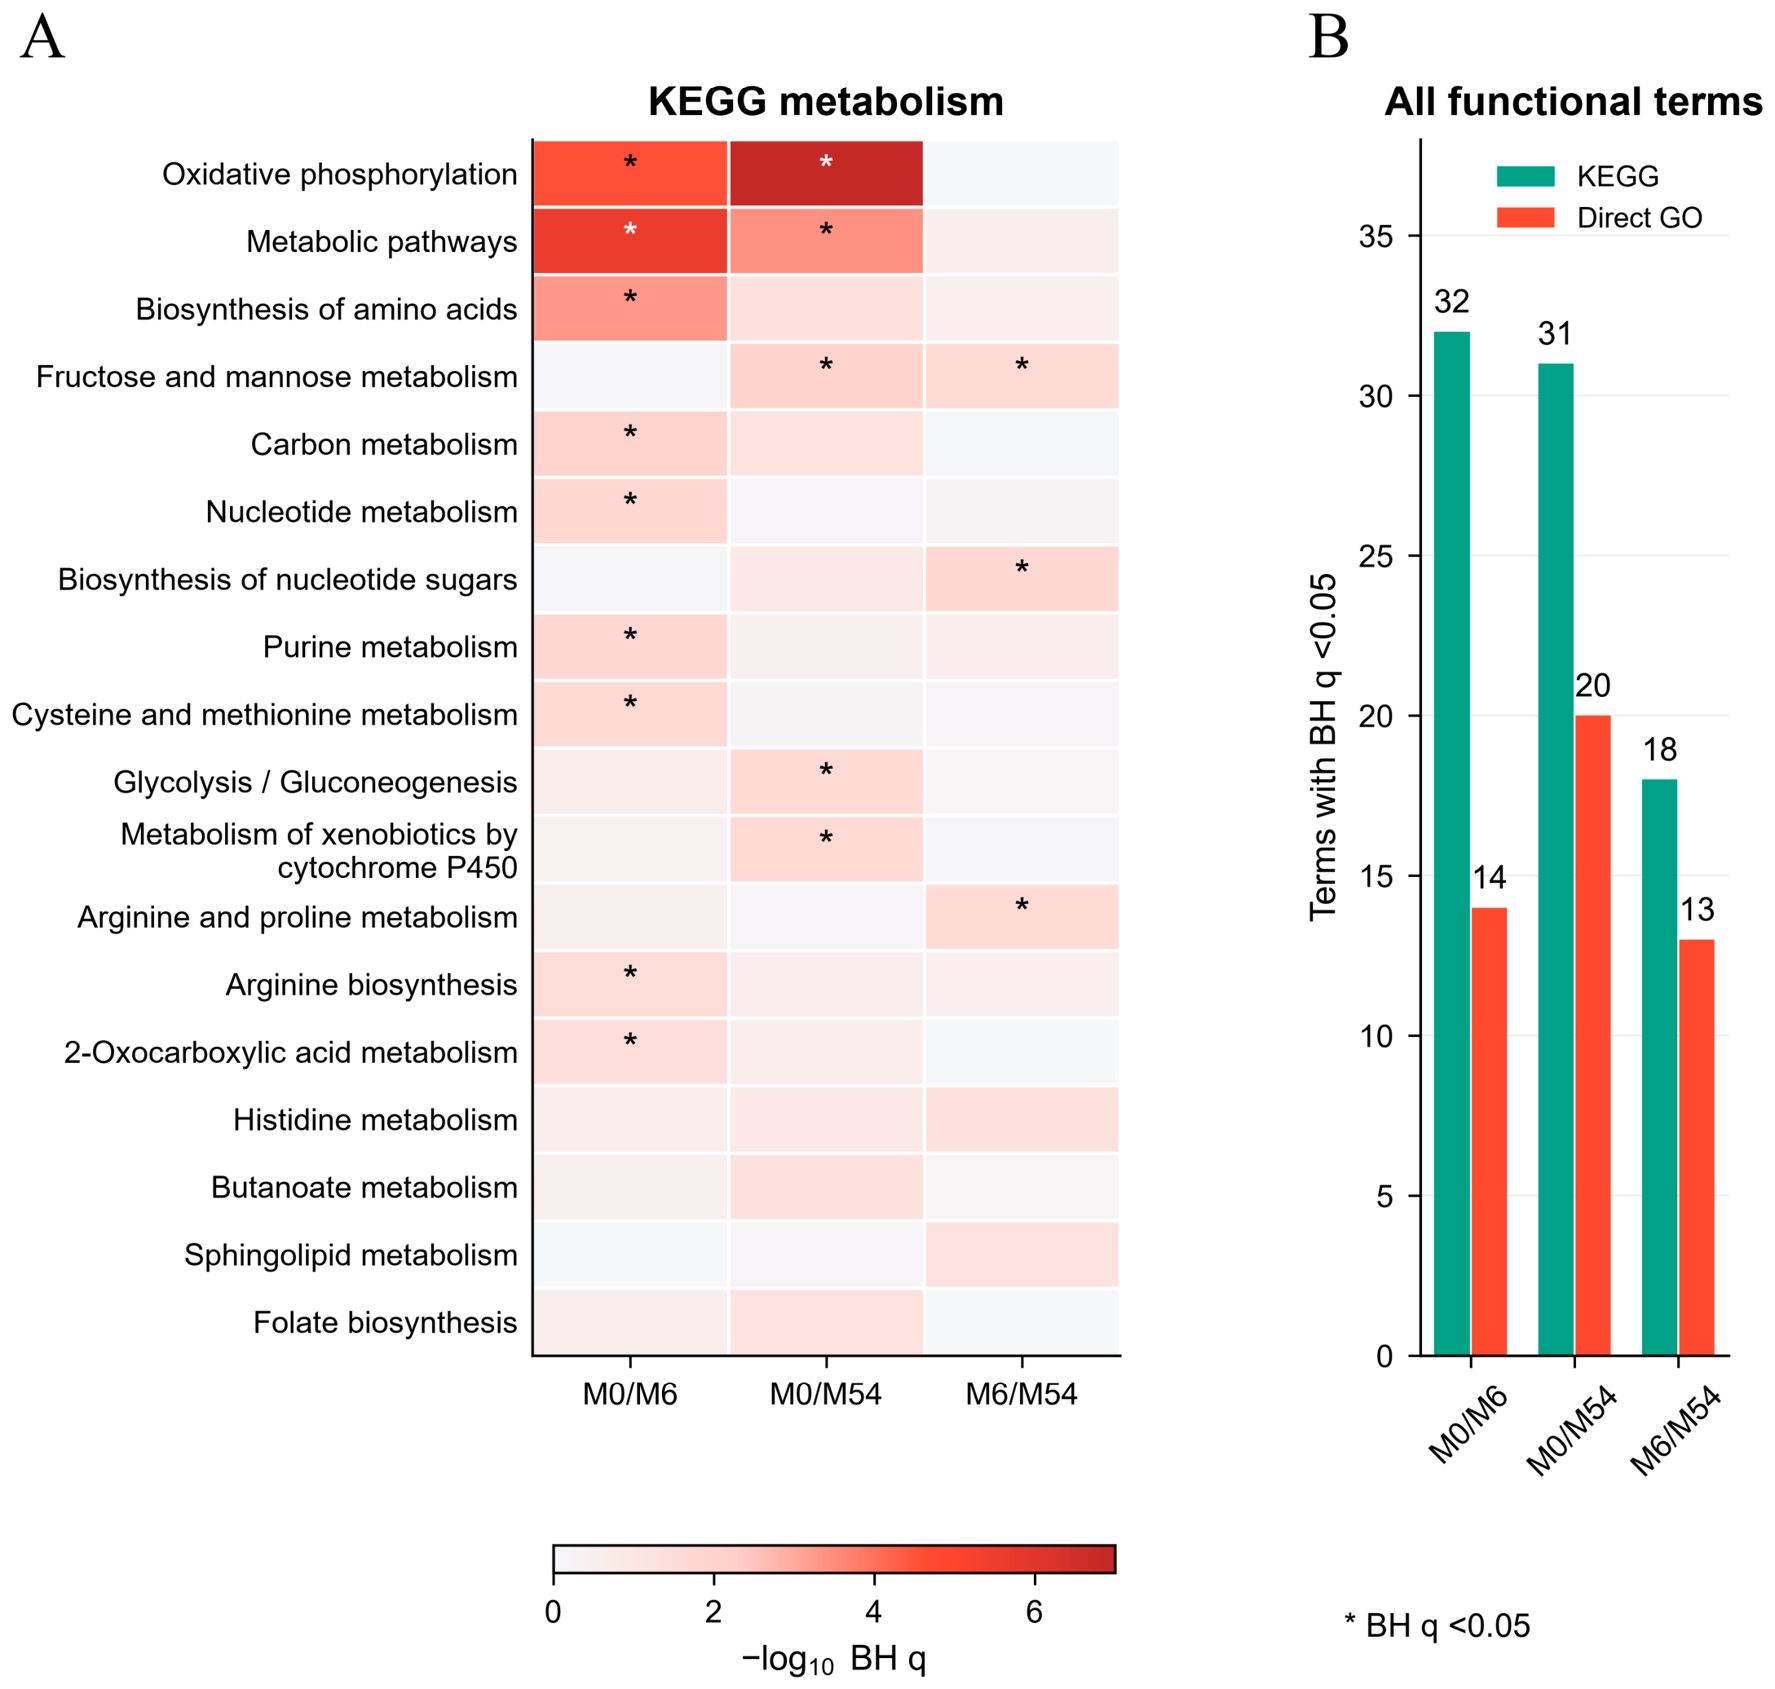
Of 28,018 input genes, 13,440 passed the expression filter. At BH q < 0.05 and |log2FC| > 1, M0 vs. M6, M0 vs. M54, and M6 vs. M54 contained 1999, 3480, and 2350 differentially expressed genes (DEGs), respectively (Figure 3A–C). Higher and lower expression in the older group accounted for 781 and 1218 DEGs in M0 vs. M6, 1591 and 1889 in M0 vs. M54, and 1207 and 1143 in M6 vs. M54. The largest DEG set occurred between M0 and M54. Functional overrepresentation using tested, correspondingly annotated genes as backgrounds identified 32, 31, and 18 KEGG pathways and 14, 20, and 13 directly annotated GO terms, respectively (Figure 4B). Figure 4A displays 18 KEGG Metabolism pathways, with q-values retained from correction across the complete eligible KEGG family. The relative numbers across these unequal age intervals do not define a longitudinal rate of transcriptional change.
Figure 3.
Differential gene and transcript expression. Gene volcano plots for (A) M0 vs. M6, (B) M0 vs. M54, and (C) M6 vs. M54; transcript volcano plots for the same comparisons in (D–F). Colored points meet BH q < 0.05 and |log2FC| > 1. Coral indicates higher expression and navy lower expression in the older group. Counts refer to the displayed significant sets. For display only, q-values below 10−300 are placed at −log10 q = 300.
Figure 4.
Functional overrepresentation among differentially expressed genes. (A) Eighteen KEGG Metabolism pathways ranked by their smallest q-value across comparisons. Colors show −log10 BH q, with correction retained across the complete eligible KEGG family; asterisks indicate q < 0.05. (B) Numbers of all KEGG pathways and directly annotated GO terms passing q < 0.05. Backgrounds contain the tested genes with the corresponding annotations.
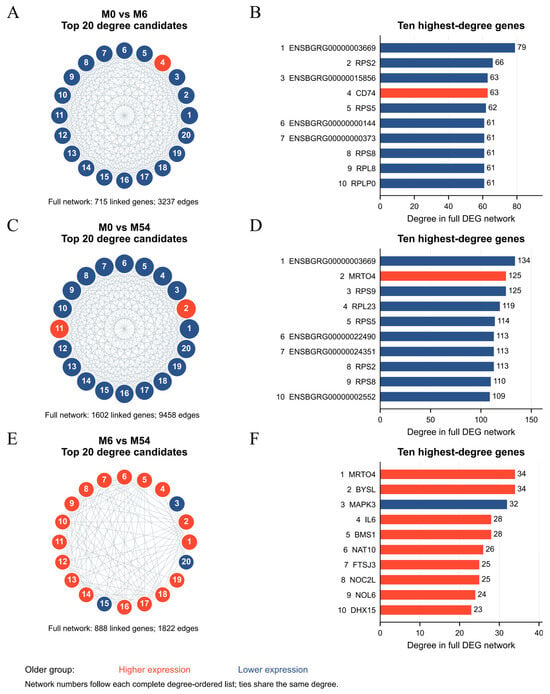
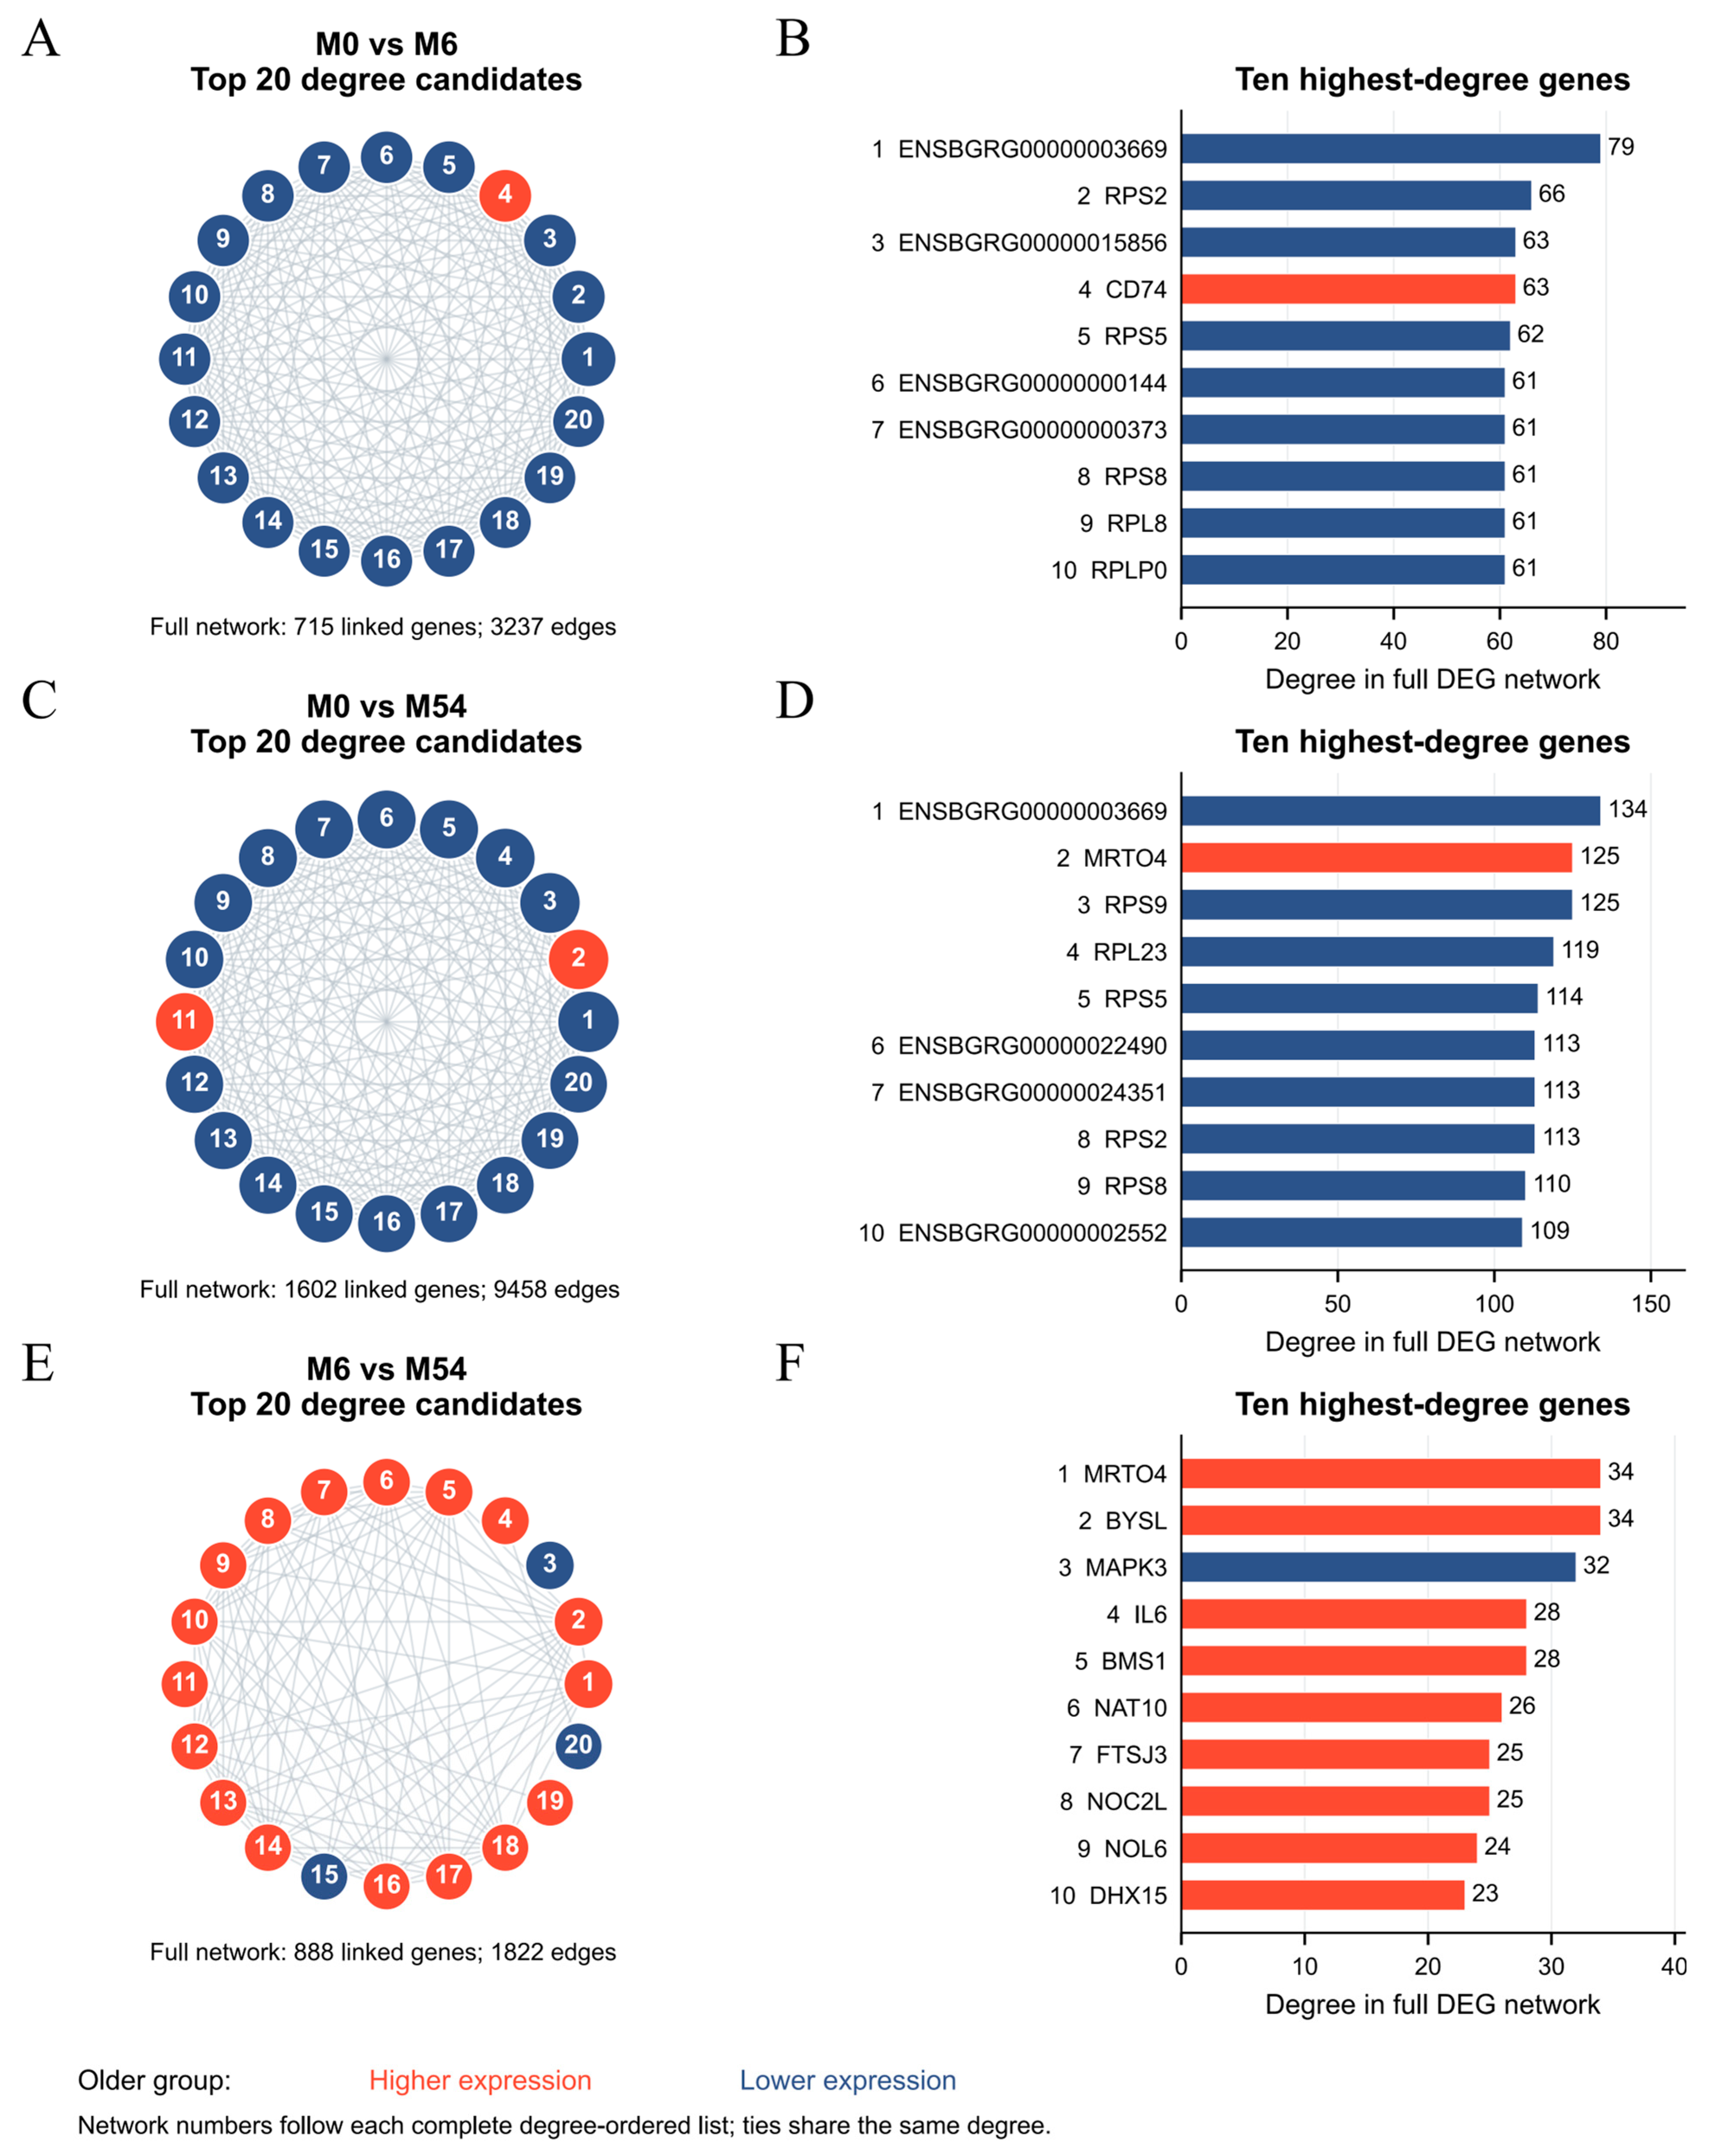
The DEG sets defined above were used as the inputs for separate protein-protein association networks. Exact gene-to-protein mapping to the Bos grunniens STRING v12.0 reference (taxon 30521) mapped 1558, 2881, and 1923 DEGs in M0 vs. M6, M0 vs. M54, and M6 vs. M54, respectively. After associations with combined scores >0.7 were retained between DEG-encoded proteins and repeated protein-level edges were collapsed to unique undirected gene pairs, the networks contained 715, 1602, and 888 connected gene nodes and 3237, 9458, and 1822 edges, respectively (Figure 5A,C,E). Degree was calculated as the number of distinct DEG neighbors in each complete network. Mapped isolated genes were retained with degree zero, and unmapped genes were recorded separately.
Figure 5.
Protein association networks reconstructed from the current DEG sets. (A,C,E) Subgraphs induced by the 20 highest-degree connected genes for M0 vs. M6, M0 vs. M54, and M6 vs. M54, respectively; (B,D,F) degree values for the ten leading genes in those comparisons. STRING v12.0 yak associations with combined scores >0.7 were retained only between current DEG sets; reciprocal and repeated protein edges were collapsed, and no non-DEG neighbors were added. Degrees and node sizes refer to each complete gene-level network, not only the displayed subgraph. In the network graphs (A,C,E), the node colors represent gene expression levels in the older group of each comparison. In the bar charts (B,D,F), the bar colors correspond to the same expression status. Specifically, coral indicates higher expression, and navy indicates lower expression in the older group.
Ranking all network genes by degree identified ENSBGRG00000003669 as the highest-connectivity candidate in M0 vs. M6 (degree 79), followed by RPS2 (ENSBGRG00000025950; degree 66); ENSBGRG00000015856 and CD74 (ENSBGRG00000022423) shared the next degree value of 63 (Figure 5B). ENSBGRG00000003669 also ranked highest in M0 vs. M54 (degree 134), followed by MRTO4 (ENSBGRG00000004243) and RPS9 (ENSBGRG00000019081), both with degree 125 (Figure 5D). In M6 vs. M54, MRTO4 and BYSL (ENSBGRG00000022371) shared the highest degree of 34, followed by MAPK3 (ENSBGRG00000007125; degree 32; Figure 5F).
3.1.5. Differential Transcript Expression and Gene-Projected Enrichment
The input matrix contained 54,577 transcripts, of which 17,243 passed the expression filter. Using BH q < 0.05 and |log2FC| > 1, 2499, 4261, and 2868 differentially expressed transcripts (DETs) were identified in M0 vs. M6, M0 vs. M54, and M6 vs. M54, respectively (Figure 3D–F). The corresponding higher/lower counts in the older group were 1109/1390, 2009/2252, and 1376/1492. After projection to unique mapped genes, DET enrichment yielded 36, 27, and 9 KEGG pathways and 18, 20, and 9 directly annotated GO terms at full-family BH q < 0.05. The largest DET set again occurred between M0 and M54. Complete transcript-level tests and gene-projected enrichment results were retained separately from the gene-level summaries in Figure 4.
3.2. LC-MS Metabolomic Profiles and Age-Associated Abundance Differences
3.2.1. Retained Peak Features and Overall Sample Profiles
Untargeted LC-MS profiling included the same 27 animals and four QC measurements. Exact exported-signal deduplication and exclusion of six internal standards retained 37,901 nonstandard peak features after QC filtering, including 1842 annotated features. Of these annotated features, 1705 had one candidate annotation and 137 had multiple candidates (Figure S2A). These counts represent measured signals rather than independently confirmed molecules; provider-assigned annotation levels and alternative candidate identities were retained. After normalization, the median QC coefficient of variation was 5.42% (Figure 1C), and the percentage of imputed signals for each animal is shown in Figure 1D.
Principal component analysis of all retained metabolite signals showed separation among M0, M6, and M54, with PC1 and PC2 explaining 39.14% and 19.34% of the variance, respectively (Figure 1B). Together, the first two components explained 58.48% of the variance. This unsupervised overview describes the relative profiles of the sampled age groups.
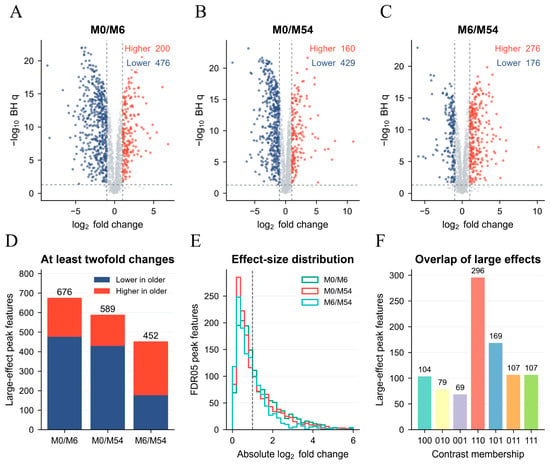
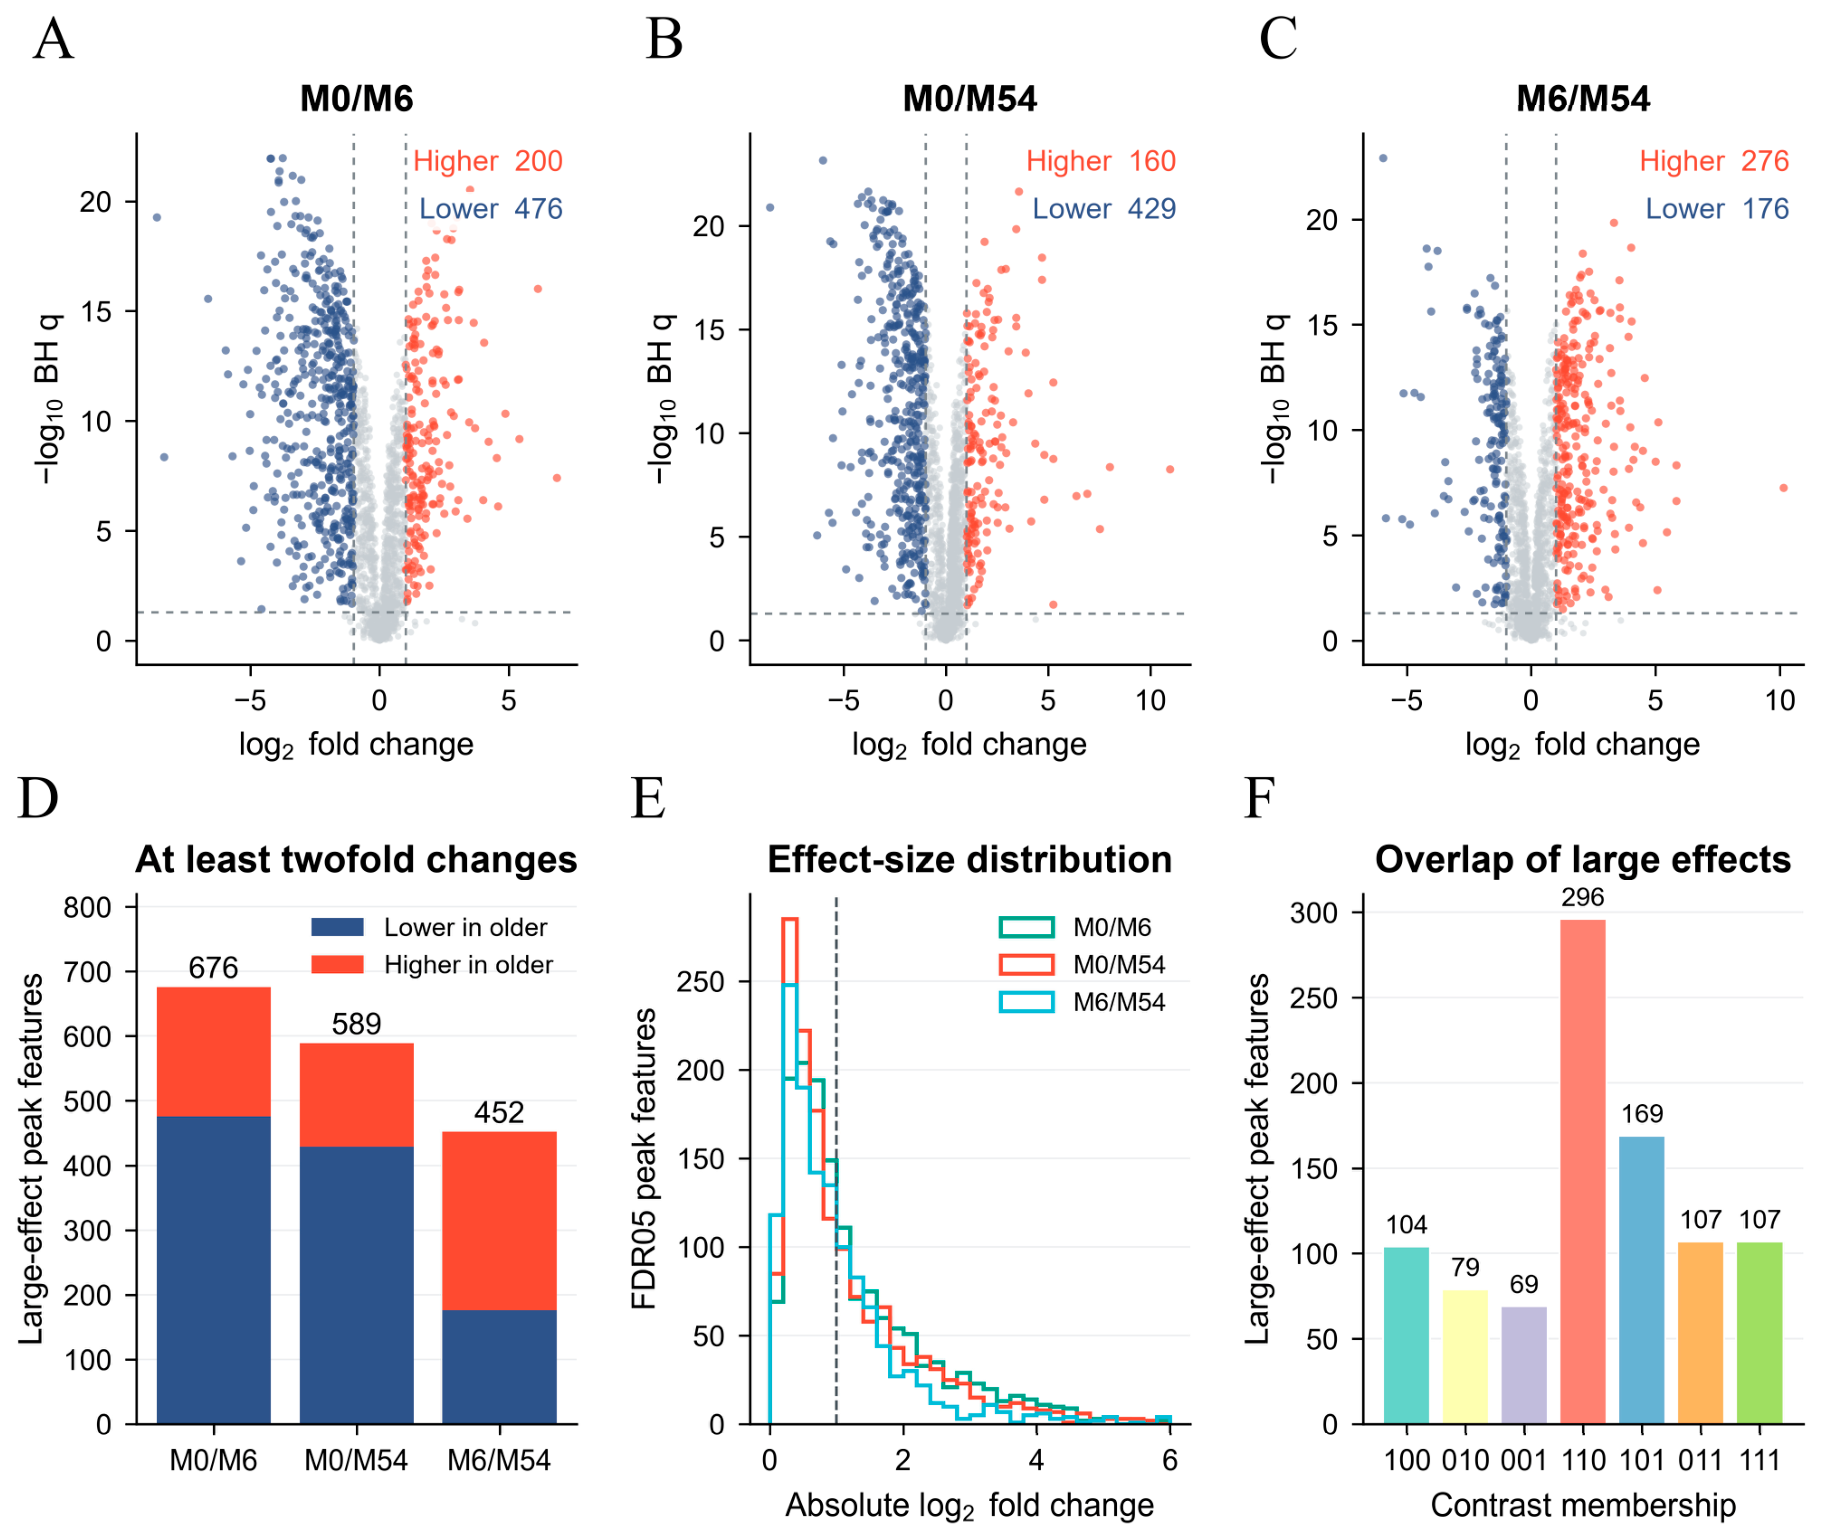
Among annotated peaks, 1830, 1831, and 1830 features were quantitatively testable in M0 vs. M6, M0 vs. M54, and M6 vs. M54, respectively. BH correction over all testable retained signals, including unannotated signals, identified 1487, 1474, and 1285 differential annotated peaks at q < 0.05. Of these, 676, 589, and 452 also had |log2FC| ≥ 1 and formed the large-effect subset (Figure 6A–D). The union of this subset comprised 931 peaks, including 107 shared by all comparisons; 104, 79, and 69 were unique to M0 vs. M6, M0 vs. M54, and M6 vs. M54, respectively (Figure 6F). Within the primary significant sets, 1472, 1462, and 1271 peaks required no filled values in the corresponding comparison (Figure S2B).
Figure 6.
Differential metabolite peak features and effect sizes. (A–C) Volcano plots for M0 vs. M6, M0 vs. M54, and M6 vs. M54. Coral and navy mark higher and lower abundance in the older group at BH q < 0.05 and |log2FC| ≥ 1. (D) Numbers and directions of these large-effect peaks. (E) Absolute log2FC distributions for all FDR-significant annotated peaks; the display spans 0–6, while larger values remain in the full tables and volcano plots. (F) Overlap of the large-effect subsets; binary membership codes follow M0/M6, M0/M54, and M6/M54. Counts denote annotated peak features rather than confirmed independent compounds.
3.2.2. Internal Cross-Validation and Label-Permutation Results
For each pairwise comparison, OPLS with one orthogonal and one predictive component was evaluated using ten deterministic stratified threefold splits. Mean cross-validated Q2 values were 0.9992, 0.9981, and 0.9975 for M0 vs. M6, M0 vs. M54, and M6 vs. M54, respectively. In 999 label permutations that refitted the training-fold processing and model, the first deterministic threefold Q2 exceeded all permuted Q2 values in each comparison (permutation p = 0.001; Figure S3A,C,E). Out-of-fold predictions for that split are shown in Figure S3B,D,F. These results describe internal discrimination within this cohort; the repeated splits do not constitute independent external validation.
3.2.3. Large-Effect Peaks and Descriptive Abundance Clusters
In the large-effect subset, 200 peaks were higher and 476 lower in M6 relative to M0; 160 were higher and 429 lower in M54 relative to M0; and 276 were higher and 176 lower in M54 relative to M6 (Figure 6A–D). The effect-size distributions of all FDR-significant annotated peaks are shown in Figure 6E, including significant changes below the twofold threshold.
K-means clustering used the standardized age-group mean profiles of all 1842 retained annotated peaks. The sampled silhouette score was highest for k = 3 (0.545216), but was nearly identical for k = 6 (0.545165; Figure 2A). The three-cluster summary contained 480, 715, and 647 peaks in C1, C2, and C3, respectively (Figure 2B).
C1 showed its lowest mean standardized abundance in M6 and its highest in M54; C2 was highest in M6; and C3 was highest in M0 and decreased across the three age-group means (Figure 2B). These profiles summarize between-group abundance patterns in independent animals.
Metabolite overrepresentation analysis counted each eligible KEGG compound once and used testable, unambiguously mapped measured compounds as the background. None of the 60 eligible pathways passed BH q < 0.05 in any comparison. Separately, quantitative pathway-member profile analysis tested all 60 pathways in each comparison, with BH correction over the complete 180-test family. Member-profile associations passed q < 0.05 for 60 pathways in M0 vs. M6, 58 in M0 vs. M54, and 60 in M6 vs. M54 (Figure S4). The same 178 hypotheses were supported by the rank-profile and no-imputation sensitivity analyses. The two non-significant M0 vs. M54 profiles were caffeine metabolism and retinol metabolism. These results describe differences in the measured relative abundance profiles within pathway sets.
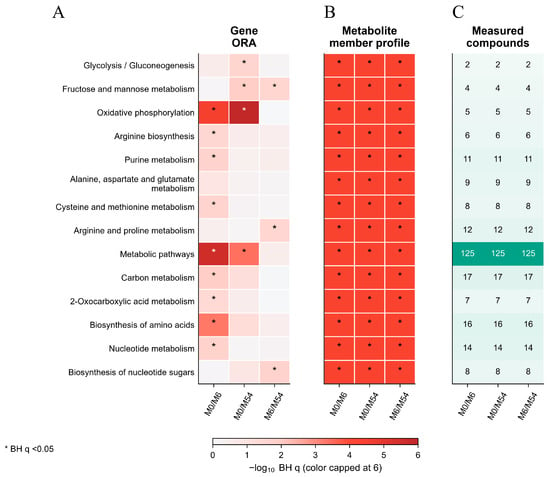
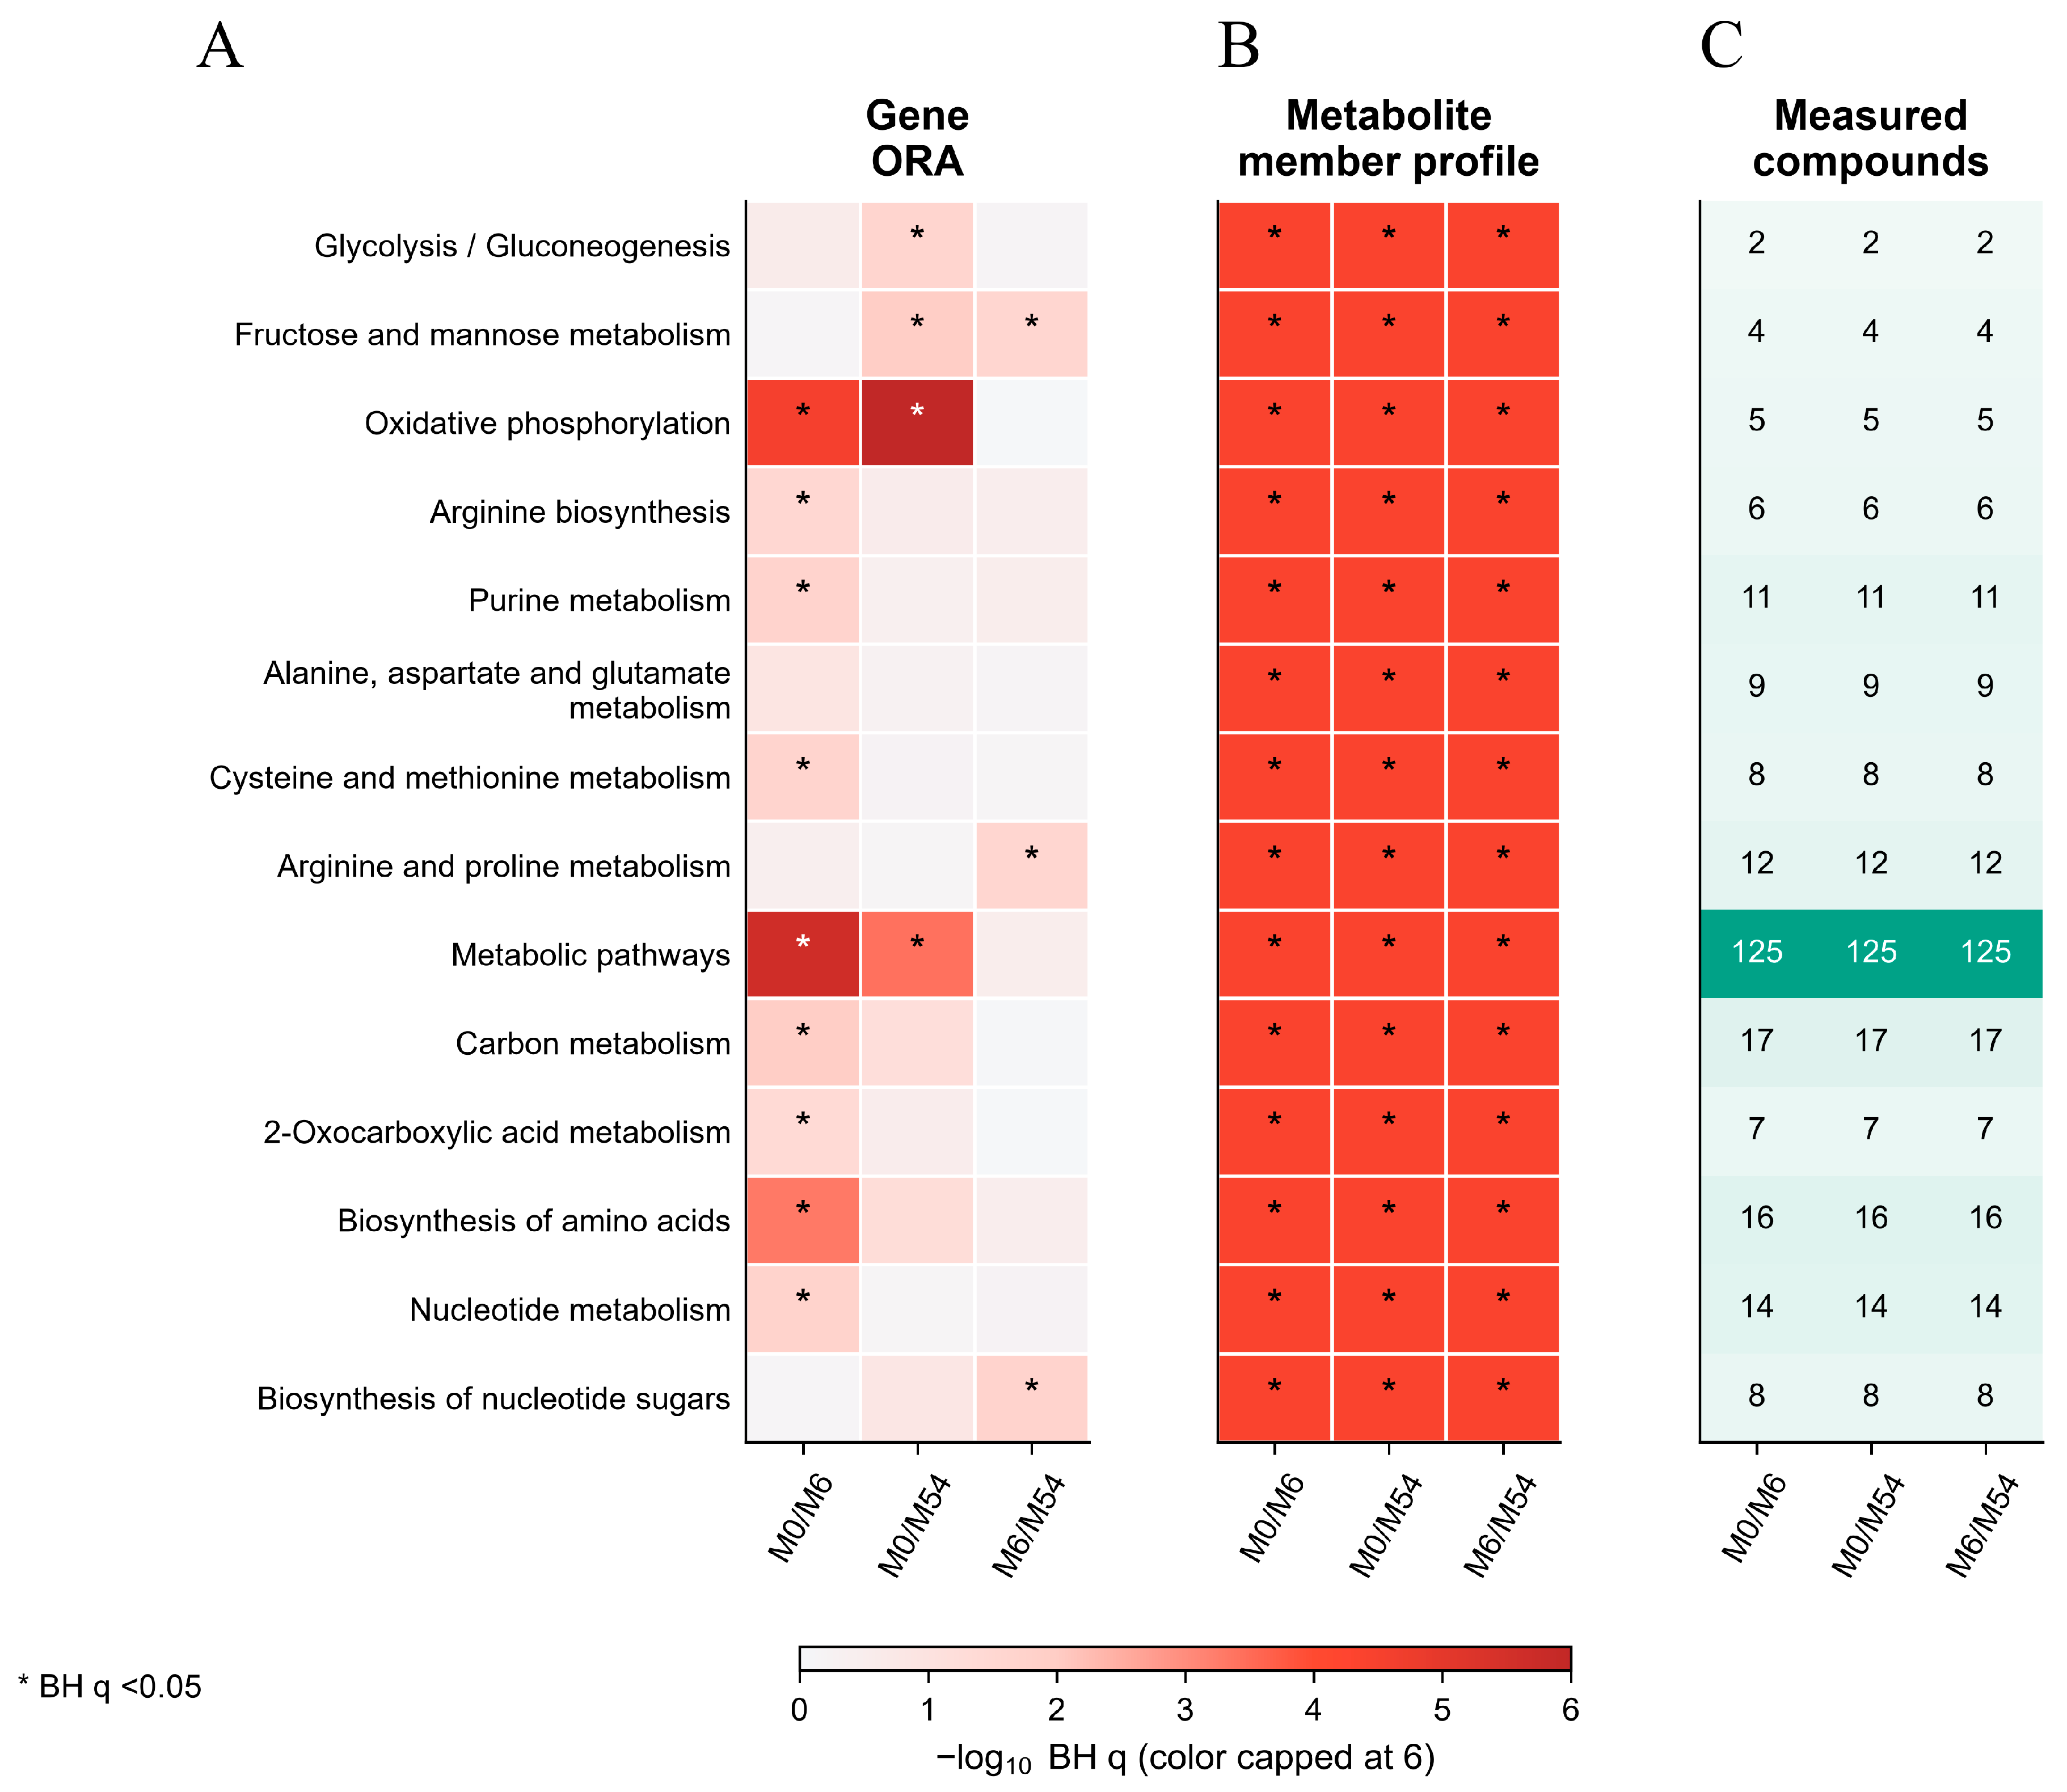
Oxidative phosphorylation, purine metabolism, and alanine, aspartate and glutamate metabolism were represented by 5, 11, and 9 measured compound profiles, respectively, and showed quantitative member-profile associations in all three comparisons (Figure 7B,C and Figure S4). These coverage counts describe the observed portion of each pathway. The profiles include amino acid, nucleotide, carbon, cofactor, and energy metabolism sets.
Figure 7.
Distinct pathway evidence across omics layers. (A) Gene overrepresentation q-values. (B) Quantitative metabolite member-profile association q-values, corrected over all 180 pathway-comparison tests. Asterisks in A and B denote BH q < 0.05 for the corresponding test; colors are capped at −log10 q = 6. (C) Numbers of measured unique compound profiles in each displayed pathway.
3.2.4. Pathway Evidence Across the Transcriptomic and Metabolomic Layers
Nine pathways in M0 vs. M6, four in M0 vs. M54, and three in M6 vs. M54 had separate support from gene overrepresentation and metabolite member-profile association at BH q < 0.05 (Figure 7A,B). Oxidative phosphorylation met both criteria in M0 vs. M6 and M0 vs. M54, whereas purine metabolism met both in M0 vs. M6. Figure 7C reports the corresponding measured compound coverage. The two layers were evaluated with distinct tests; the metabolite member-profile association was not substituted for metabolite overrepresentation.
Alanine, aspartate and glutamate metabolism showed metabolite member-profile association in every comparison, but its gene-overrepresentation q-values were 0.134, 0.560, and 0.722 for M0 vs. M6, M0 vs. M54, and M6 vs. M54, respectively (Figure 7A,B). It therefore remained a recurring metabolite-profile association without meeting the two-layer support criterion. Together, the pathway results describe age-associated molecular differences while retaining the distinct statistical evidence available for each omics layer.
3.3. Matched Gene-Metabolite Associations
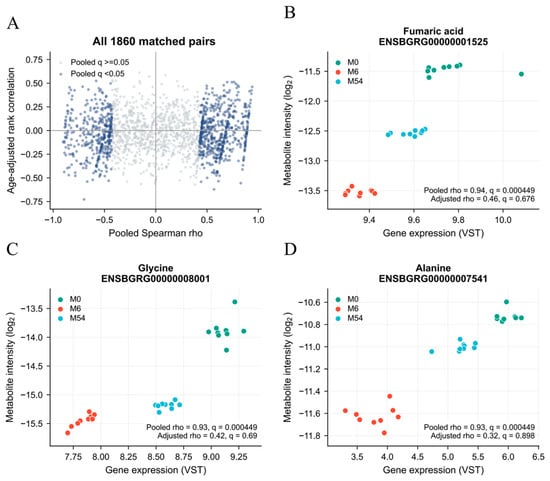
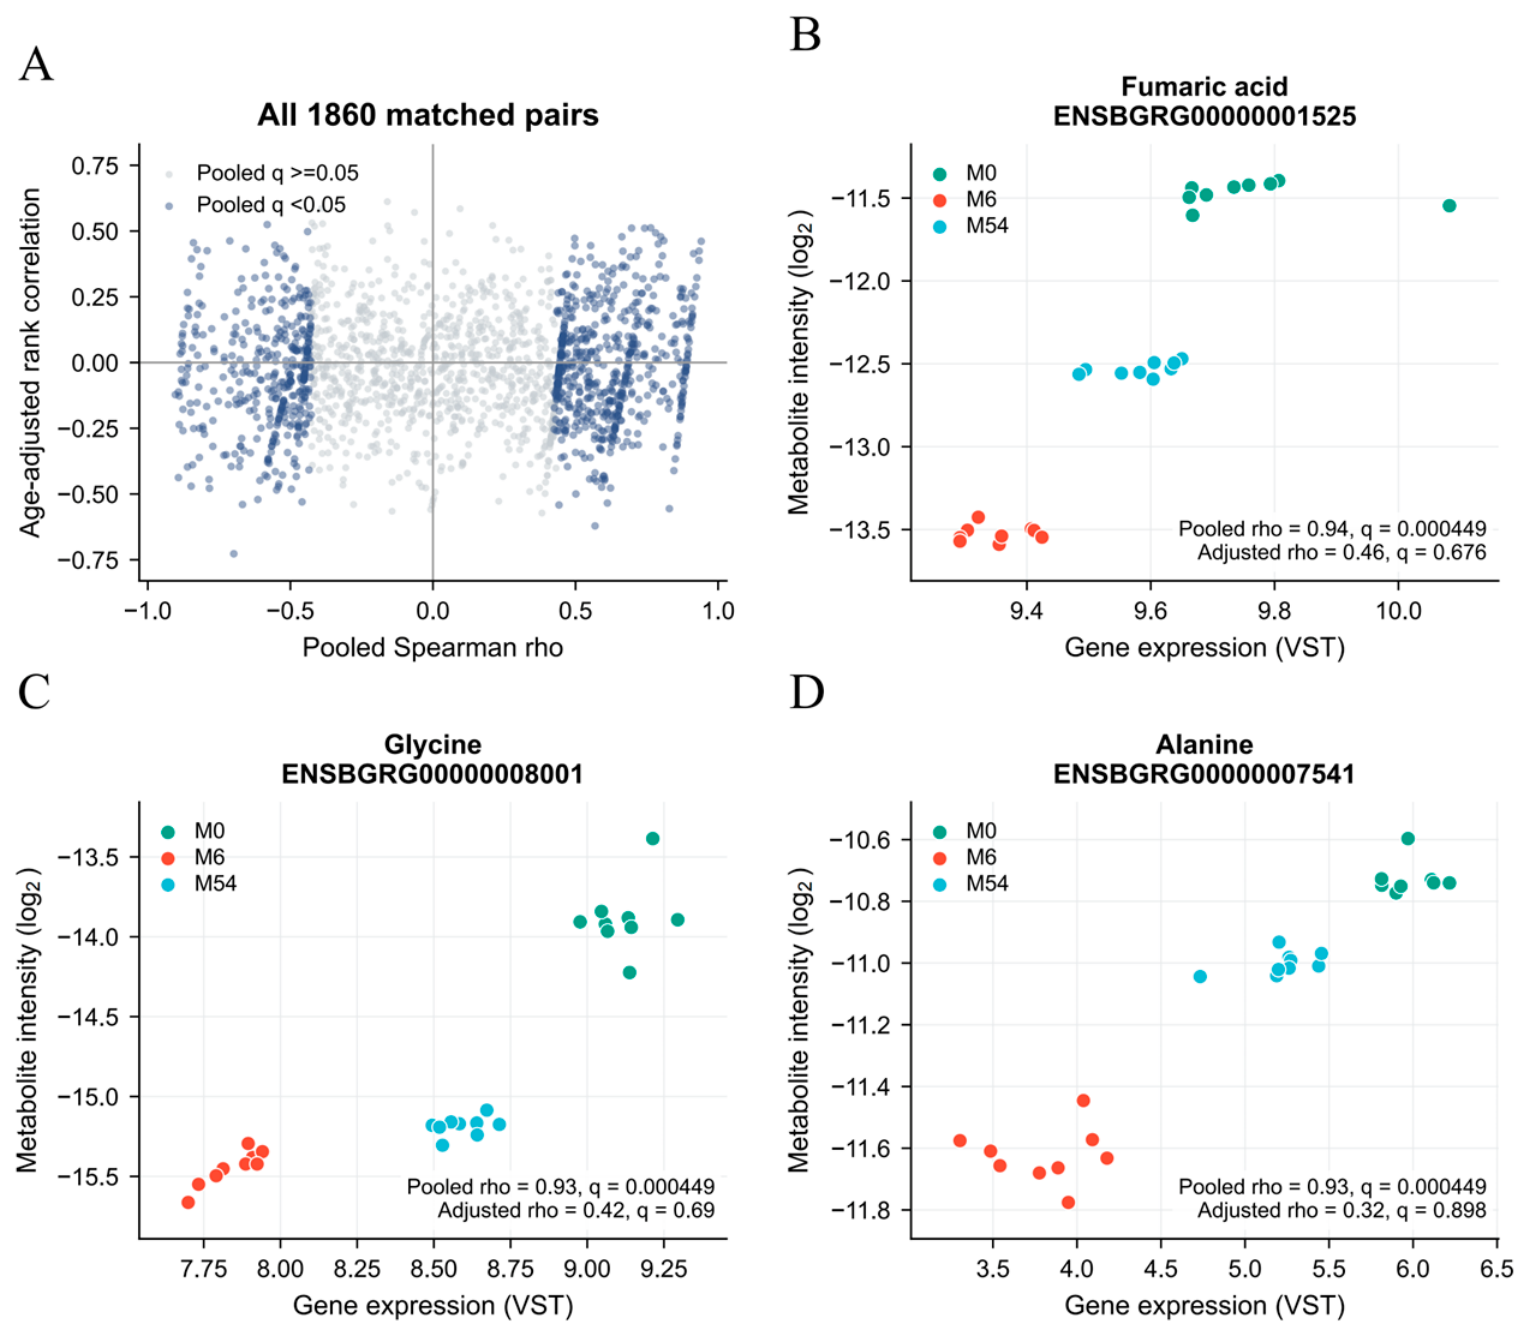
For complementary pathway-based integration, retained genes and unambiguously annotated metabolite features within oxidative phosphorylation, purine metabolism, and alanine, aspartate and glutamate metabolism defined 1860 unique gene-feature pairs, comprising 234 genes and 22 metabolite features. Across the same 27 animals, pooled Spearman analysis with unrestricted correspondence permutations and BH correction across all pairs identified 977 associations at q < 0.05, including 232 with |rho| ≥ 0.7 (Figure 8A). After adjustment of the ranks for categorical age group and within-age correspondence permutations, no pair passed BH q < 0.05; the smallest adjusted q was 0.11904.
Figure 8.
Pooled and age-adjusted associations in matched animals. (A) Pooled Spearman rho versus age-adjusted rank correlation for all 1860 gene-feature pairs. Navy points meet pooled permutation BH q < 0.05. (B–D) The fixed examples for fumaric acid and ENSBGRG00000001525, glycine and ENSBGRG00000008001, and alanine and ENSBGRG00000007541. Colors identify the three age groups. Pooled and age-adjusted estimates and q-values are shown together.
The illustrated examples were the largest absolute pooled correlations within the three focus pathways and paired fumaric acid with ENSBGRG00000001525, glycine with ENSBGRG00000008001, and alanine with ENSBGRG00000007541 (Figure 8B–D). Their pooled rho values were 0.941, 0.933, and 0.926, respectively, with q = 0.000449 for each pair. Corresponding age-adjusted correlations were 0.461, 0.424, and 0.322. These results identify pooled co-variation that includes between-age differences.
4. Discussion
This study characterized full-length transcriptomic and untargeted metabolomic profiles of the longissimus dorsi muscle in female Ashdan yaks at three postnatal ages. The largest DEG and DET sets occurred between M0 and M54, but the unequal intervals and independent animals mean that these counts do not demonstrate a progressive increase in transcriptional change with age. A study of Tianzhu white yaks at 6, 30, and 54 months likewise identified age-associated transcriptional differences [25], whereas comparisons of Gannan and Tianzhu white yaks linked breed-related expression patterns with measured myofiber characteristics [26]. These studies support the relevance of muscle molecular variation, while their different ages, breeds, and phenotypic measurements preclude direct equivalence with the present cohort. Here, oxidative phosphorylation and the muscle-cell cytoskeleton were overrepresented in both comparisons involving M0, while PPAR signaling was supported in M6 vs. M54. This pattern is consistent with differences in muscle structural and metabolic requirements across the sampled ages.
This study retained 631 consensus lncRNA predictions and 543 transcription-factor annotation entries. These resources provide potential regulatory context, rather than evidence that every entry participates in an age-dependent muscle network. In Tianzhu white yak, predicted lncRNA targets have been associated with pathways including PI3K-Akt and PPAR signaling [27], and age-associated miRNA profiles provide another layer of candidate regulation [28]. Functional work on a muscle lncRNA demonstrated that a ceRNA mechanism can influence differentiation in a defined experimental system [29]. That mechanistic example illustrates a possible mode of action, but does not establish the targets or functions of the present yak predictions. Likewise, enrichment among coding genes cannot automatically be assigned to the predicted lncRNAs or TF families. Their principal value here is as an annotation resource that can be interpreted alongside the expression results, rather than as an independently validated explanation of the observed metabolic differences.
ONT sequencing yielded 4642 candidate novel transcripts, including 3573 represented in the functional annotation export and 3875 with estimated counts of at least 10 in at least three animals. Long-read analysis can improve transcript annotation, but read support, complete boundaries, and biological function are distinct questions [9]. The common splicing annotation contained 23,733 structural events; complete-family BH correction and |ΔPSI| > 0.1 retained 3, 8, and 7 differential candidates across the comparisons, corresponding to 14 unique events. Thus, transcript diversity is much broader than the subset with statistical support for differential splicing. A bovine developmental transcriptome study also documented extensive transcript variation [30], but event totals depend on annotation, sampling, and the unit counted. The finite empirical p-value support in the present SUPPA output further argues for treating the retained events as candidates.
The novel transcripts and alternative splicing candidates provide a resource for subsequent gene and isoform annotation. Full-length profiling across 32 bovine tissues substantially expanded the known transcript repertoire [10], while long-read analysis of porcine muscles with different intramuscular fat contents linked differential splicing candidates with lipid-related pathways [31]. These comparisons support the utility of transcript-resolved data, but their tissue and phenotype contrasts differ from the present age comparison. Integration of ATAC-seq and RNA-seq in Tianzhu white yak supplied evidence connecting chromatin accessibility with expression, and a cattle-yak study combined transcriptomic screening with cellular assays of ADAMTS6 [32]. Those additional evidence layers explain why their regulatory conclusions are stronger than annotation or network connectivity alone. The present study contributes expression-supported transcript candidates and statistically filtered comparisons.
PPI analysis followed the current DEG selection: each complete DEG set was mapped to the yak STRING v12.0 reference, associations were restricted to DEG-encoded proteins, and candidates were then ranked by degree in the complete gene-level network [22]. ENSBGRG00000003669 had the highest connectivity in both comparisons involving M0; its stable identifier is retained because a validated functional assignment is unavailable here. Named high-connectivity candidates included RPS2, RPS9, and MRTO4, while MRTO4 and BYSL shared the leading degree in M6 vs. M54. The RPS/RPL annotations and the known roles of MRTO4 in large-subunit maturation and BYSL in small-subunit biogenesis suggest a possible connection with the machinery supporting protein synthesis [33,34]. These functional roles were established in other experimental systems, not in yak muscle. This provides a hypothesis about translational capacity rather than evidence of increased protein synthesis or a causal muscle-growth regulator. STRING associations combine several evidence channels, and degree also depends on mapping coverage, input-set size, and annotation density [22].
Untargeted LC-MS retained 1842 annotated peak features after filtering and deduplication. At BH q < 0.05, 1487, 1474, and 1285 annotated peaks differed between groups, while 676, 589, and 452 also met the twofold effect-size criterion. These are signal-level results, and alternative annotations prevent treating every peak as an independent confirmed compound. Amino acid and nucleotide metabolism provide biological contexts for these differences, with statistical support specific to each analytical layer and test. No metabolite-overrepresentation pathway passed BH q < 0.05; instead, quantitative member-profile tests supported alanine, aspartate and glutamate metabolism in each comparison, based on nine measured compound profiles. Its gene-overrepresentation tests were not significant. Thus, the recurring abundance pattern suggests age-associated variation in the measured amino acid-related pool without establishing a dominant pathway across both omics layers. Transcriptomic and metabolomic studies of Ashdan yaks under different feeding regimes [35], dietary-energy experiments in Gannan yaks [36], and yak lipidomics under contrasting feeding systems [37] also show that muscle molecular profiles are sensitive to nutritional context. Beef postmortem-aging studies [38] and yak fattening studies with measured carcass and meat traits [39] provide biological context for amino acid variation and flavor precursors [40].
Muscle fiber composition and energy metabolism are closely related [41]. In the present study, oxidative phosphorylation received separate support from gene overrepresentation and metabolite member-profile tests in M0 vs. M6 and M0 vs. M54. Its five measured compound profiles sample only part of this pathway. Respiratory complex I participates in electron transfer and proton translocation [42], but pathway membership does not measure respiratory activity. Early postnatal pig studies have combined myofiber phenotyping with omics profiles [43], and muscle-specific PGC-1α overexpression in mice and pigs directly linked mitochondrial programs with fiber-type conversion [44]. These findings make energy metabolism a plausible context for the age-associated yak differences. Comparative yak-cattle expression studies and yak genomic analyses also implicate energy-related biology in high-altitude adaptation [45,46].
Intramuscular adipose development is relevant to meat composition [47], and cattle studies have associated PPAR-related expression with intramuscular fat development [48]. More recent comparisons of bovine adipose depots combined histology, transcriptomics, and cell assays to relate slower intramuscular fat accumulation to differences in fatty acid handling and adipogenic capacity [49]. The significant PPAR gene-overrepresentation result in M6 vs. M54 is therefore biologically compatible with age-associated lipid-related processes, but enrichment does not specify pathway activation, the responsible cell population, or the amount of deposited fat. Bulk muscle contains multiple cell types, so changes in their relative contributions offer an additional explanation for expression differences. Genetic-model evidence for IGF1-Akt control of muscle growth [50] provides mechanistic background, not validation of that pathway in these animals. Yak m6A profiles likewise identify another potentially relevant regulatory layer [51], which was not measured here. Given the genetic and nutritional determinants of intramuscular fat [52], the present PPAR association is best treated as a candidate explanation of age-associated molecular variation rather than demonstrated adipogenesis or improved meat quality.
The matched-animal analyses add a further distinction between shared pathway patterns and direct gene-metabolite relationships. Oxidative phosphorylation had two-layer support in both comparisons involving M0, whereas purine metabolism met that criterion only in M0 vs. M6. The latter is compatible with differences in nucleotide-related metabolic requirements, but does not identify a direction of purine synthesis or turnover. These pathway results provide a basis for focused integration without selecting only the highest-degree PPI candidates. Across all 1860 eligible gene-feature pairs, 977 pooled associations passed BH q < 0.05, including 232 with |rho| ≥ 0.7; none passed after age adjustment. The attenuation indicates that differences between age groups contribute substantially to the pooled co-variation. Incomplete RNA-protein correspondence in yak muscle and the feeding-dependent profiles reported in Ashdan yaks [36] offer relevant biological context for why cross-layer patterns need not imply a direct regulatory link. Moreover, the broad member-profile associations across 60 pathway sets can reflect shared compounds and widespread abundance differences, rather than 60 independent activated processes.
5. Conclusions
Full-length transcriptomic and untargeted metabolomic profiling identified age-associated molecular differences in the longissimus dorsi muscle of female Ashdan yaks at 10 days, 6 months, and 54 months. The largest DEG and DET sets occurred between M0 and M54. DEG-derived protein association networks prioritized high-connectivity candidates, including ENSBGRG00000003669 in comparisons involving M0 and MRTO4 and BYSL in M6 vs. M54. Separate gene and metabolite-profile analyses supported oxidative phosphorylation in both comparisons involving M0 and purine metabolism in M0 vs. M6. Together with 4642 candidate novel transcripts and 14 unique differential splicing candidates, these results provide a resource for comparative yak muscle biology. They identify pathways and computational candidates for subsequent investigation without establishing continuous developmental mechanisms, causal regulation, or effects on meat quality.
This cross-sectional study compared three widely separated ages in female Ashdan yaks and did not include intermediate time points or corresponding measurements of muscle growth, intramuscular fat, myofiber properties, or meat quality. Diet, intake, and reproductive or other physiological status could not be separated fully from age. Sequencing-batch and LC-MS injection-order records were unavailable, preventing assessment or adjustment of these technical factors. Transcript boundaries, prioritized genes, and inferred molecular relationships were not independently validated by qRT-PCR, proteomics, or functional experiments. The additional post-review pathway and association analyses were exploratory, and the findings should be interpreted as age-associated profiles under the sampled conditions.
Supplementary Materials
The following supporting information can be downloaded at: https://www.mdpi.com/article/10.3390/biom16111591/s1, Figure S1: Transcriptomic structure and quality metrics. Figure S2: Metabolite annotation statistics and robustness of differential abundance results. Figure S3: Model validation and predictive performance of the multivariate models. Figure S4: KEGG pathway enrichment analysis of differentially abundant metabolites.
Author Contributions
Conceptualization, J.D. and X.W.; methodology, J.D.; software, J.D., Q.Z. and X.W.; formal analysis, C.C. and N.L.; investigation, J.D. and C.C.; resources, P.B., N.L. and Q.Z.; data curation, J.D., X.W. and P.Y.; writing—original draft preparation, J.D.; writing—review and editing, J.D., P.B. and P.Y.; visualization, C.C. and N.L.; supervision, P.Y.; project administration, X.W. and P.Y.; funding acquisition, P.B. and P.Y. All authors have read and agreed to the published version of the manuscript.
Funding
This work was supported by the National Natural Science Foundation of China (U23A20227); Xinjiang Tianchi Talent Research Program (TCYC-TP2023); Improvement and innovative utilization of the Pamir yak breed (KS2024017), Gansu Provincial Science and Technology Plan Projects (25YFWA010).
Institutional Review Board Statement
The experiment on Ashdan yaks was approved by the Animal Care and Ethics Committee of the Lanzhou Institute of Animal Science and Veterinary Medicine, Chinese Academy of Agricultural Sciences (SYXK-2014-0002, 18 January 2024).
Data Availability Statement
The original data presented in the study are openly available in the Genome Sequence Archive; the submission number is subCRA082983.
Conflicts of Interest
The authors declare that they have no competing interests.
Abbreviations
The following abbreviations are used in this manuscript:
| ONT | Oxford Nanopore Technologies |
| PPI | Protein-protein interaction |
| Nr | Non-Redundant Protein Sequence |
| KOG | Eukaryotic Orthologous Groups |
| UTRs | Untranslated regions |
References
- Li, Y.; Zong, W.; Zhao, S.; Qie, M.; Yang, X.; Zhao, Y. Nutrition and edible characteristics, origin traceability and authenticity identification of yak meat and milk: A review. Trends Food Sci. Technol. 2023, 139, 104133. [Google Scholar] [CrossRef] [Scilit]
- Picard, B.; Gagaoua, M. Muscle Fiber Properties in Cattle and Their Relationships with Meat Qualities: An Overview. J. Agric. Food Chem. 2020, 68, 6021–6039. [Google Scholar] [CrossRef] [Scilit]
- Joo, S.T.; Kim, G.D.; Hwang, Y.H.; Ryu, Y.C. Control of fresh meat quality through manipulation of muscle fiber characteristics. Meat Sci. 2013, 95, 828–836. [Google Scholar] [CrossRef] [Scilit]
- Wang, H.; Zhong, J.; Zhang, C.; Chai, Z.; Cao, H.; Wang, J.; Zhu, J.; Wang, J.; Ji, Q. The whole-transcriptome landscape of muscle and adipose tissues reveals the ceRNA regulation network related to intramuscular fat deposition in yak. BMC Genom. 2020, 21, 347. [Google Scholar] [CrossRef] [Scilit]
- Ma, X.; Jia, C.; Chu, M.; Fu, D.; Lei, Q.; Ding, X.; Wu, X.; Guo, X.; Pei, J.; Bao, P.; et al. Transcriptome and DNA Methylation Analyses of the Molecular Mechanisms Underlying with Longissimus dorsi Muscles at Different Stages of Development in the Polled Yak. Genes 2019, 10, 970. [Google Scholar] [CrossRef] [Scilit]
- Bentzinger, C.F.; Wang, Y.X.; Rudnicki, M.A. Building Muscle: Molecular Regulation of Myogenesis. Cold Spring Harb. Perspect. Biol. 2012, 4, a008342. [Google Scholar] [CrossRef] [Scilit]
- Deamer, D.; Akeson, M.; Branton, D. Three decades of nanopore sequencing. Nat. Biotechnol. 2016, 34, 518–524. [Google Scholar] [CrossRef] [Scilit]
- Song, Q.; Li, J.; Li, S.; Cao, H.; Jin, X.; Zeng, Y.; Chen, W. Full-Length Transcriptome Analysis of Skeletal Muscle of Jiangquan Black Pig at Different Developmental Stages. Int. J. Mol. Sci. 2024, 25, 6095. [Google Scholar] [CrossRef] [Scilit]
- Amarasinghe, S.L.; Su, S.; Dong, X.; Zappia, L.; Ritchie, M.E.; Gouil, Q. Opportunities and challenges in long-read sequencing data analysis. Genome Biol. 2020, 21, 30. [Google Scholar] [CrossRef] [Scilit]
- Halstead, M.M.; Islas-Trejo, A.; Goszczynski, D.E.; Medrano, J.F.; Zhou, H.; Ross, P.J. Large-Scale Multiplexing Permits Full-Length Transcriptome Annotation of 32 Bovine Tissues From a Single Nanopore Flow Cell. Front. Genet. 2021, 12, 664260. [Google Scholar] [CrossRef] [Scilit]
- Patti, G.J.; Yanes, O.; Siuzdak, G. Metabolomics: The apogee of the omics trilogy. Nat. Rev. Mol. Cell Biol. 2012, 13, 263–269. [Google Scholar] [CrossRef] [Scilit]
- Wang, Z.; An, X.; Yang, Y.; Zhang, L.; Jiao, T.; Zhao, S. Comprehensive Analysis of the Longissimus Dorsi Transcriptome and Metabolome Reveals the Regulatory Mechanism of Different Varieties of Meat Quality. J. Agric. Food Chem. 2023, 71, 1234–1245. [Google Scholar] [CrossRef] [Scilit]
- Zhao, Y.; Li, J.; Liu, H.; Xi, Y.; Xue, M.; Liu, W.; Zhuang, Z.; Lei, M. Dynamic transcriptome profiles of skeletal muscle tissue across 11 developmental stages for both Tongcheng and Yorkshire pigs. BMC Genom. 2015, 16, 377. [Google Scholar] [CrossRef] [Scilit]
- Ma, X.; Guo, X.; La, Y.; Wu, X.; Chu, M.; Bao, P.; Yan, P.; Liang, C. Integrative Analysis of Proteomics and Transcriptomics of Longissimus dorsi with Different Feeding Systems in Yaks. Foods 2023, 12, 257. [Google Scholar] [CrossRef] [Scilit]
- Zhu, C.; Petracci, M.; Li, C.; Fiore, E.; Laghi, L. An Untargeted Metabolomics Investigation of Jiulong Yak (Bos grunniens) Meat by 1H-NMR. Foods 2020, 9, 481. [Google Scholar] [CrossRef] [Scilit]
- De Coster, W.; D’Hert, S.; Schultz, D.T.; Cruts, M.; Van Broeckhoven, C. NanoPack: Visualizing and processing long-read sequencing data. Bioinformatics 2018, 34, 2666–2669. [Google Scholar] [CrossRef] [Scilit]
- Li, H. Minimap2: Pairwise alignment for nucleotide sequences. Bioinformatics 2018, 34, 3094–3100. [Google Scholar] [CrossRef] [Scilit]
- Li, H.; Handsaker, B.; Wysoker, A.; Fennell, T.; Ruan, J.; Homer, N.; Marth, G.; Abecasis, G.; Durbin, R.; 1000 Genome Project Data Processing Subgroup. The Sequence Alignment/Map format and SAMtools. Bioinformatics 2009, 25, 2078–2079. [Google Scholar] [CrossRef] [Scilit]
- Trincado, J.L.; Entizne, J.C.; Hysenaj, G.; Singh, B.; Skalic, M.; Elliott, D.J.; Eyras, E. SUPPA2: Fast, accurate, and uncertainty-aware differential splicing analysis across multiple conditions. Genome Biol. 2018, 19, 40. [Google Scholar] [CrossRef] [Scilit]
- Patro, R.; Duggal, G.; Love, M.I.; Irizarry, R.A.; Kingsford, C. Salmon provides fast and bias-aware quantification of transcript expression. Nat. Methods 2017, 14, 417–419. [Google Scholar] [CrossRef] [Scilit]
- Love, M.I.; Huber, W.; Anders, S. Moderated estimation of fold change and dispersion for RNA-seq data with DESeq2. Genome Biol. 2014, 15, 550. [Google Scholar] [CrossRef] [Scilit]
- Szklarczyk, D.; Kirsch, R.; Koutrouli, M.; Nastou, K.; Mehryary, F.; Hachilif, R.; Gable, A.L.; Fang, T.; Doncheva, N.T.; Pyysalo, S.; et al. The STRING database in 2023: Protein–protein association networks and functional enrichment analyses for any sequenced genome of interest. Nucleic Acids Res. 2023, 51, D638–D646. [Google Scholar] [CrossRef] [Scilit]
- Wang, J.; Zhang, T.; Shen, X.; Liu, J.; Zhao, D.; Sun, Y.; Wang, L.; Liu, Y.; Gong, X.; Liu, Y.; et al. Serum metabolomics for early diagnosis of esophageal squamous cell carcinoma by UHPLC-QTOF/MS. Metabolomics 2016, 12, 116. [Google Scholar] [CrossRef] [Scilit]
- Zhou, Z.; Luo, M.; Zhang, H.; Yin, Y.; Cai, Y.; Zhu, Z.-J. Metabolite annotation from knowns to unknowns through knowledge-guided multi-layer metabolic network. Nat. Commun. 2022, 13, 6656. [Google Scholar] [CrossRef] [Scilit]
- Shi, B.; Shi, X.; Zuo, Z.; Zhao, S.; Zhao, Z.; Wang, J.; Zhou, H.; Luo, Y.; Hu, J.; Hickford, J.G.H. Identification of differentially expressed genes at different post-natal development stages of longissimus dorsi muscle in Tianzhu white yak. Gene 2022, 823, 146356. [Google Scholar] [CrossRef] [Scilit]
- Niu, Y.; Guo, D.; Wei, Y.; Li, J.; Bai, Y.; Liu, Z.; Jia, X.; Chen, Z.; Li, L.; Shi, B.; et al. Comparative Transcriptome Analysis of mRNA and miRNA during the Development of Longissimus Dorsi Muscle of Gannan Yak and Tianzhu White Yak. Animals 2024, 14, 2278. [Google Scholar] [CrossRef] [Scilit]
- He, Z.; Wang, X.; Qi, Y.; Zhu, C.; Zhao, Z.; Zhang, X.; Liu, X.; Li, S.; Zhao, F.; Wang, J.; et al. Long-stranded non-coding RNAs temporal-specific expression profiles reveal longissimus dorsi muscle development and intramuscular fat deposition in Tianzhu white yak. J. Anim. Sci. 2023, 101, skad394. [Google Scholar] [CrossRef] [Scilit]
- Shi, B.; Zhu, C.; Wang, X.; Qi, Y.; Hu, J.; Liu, X.; Wang, J.; Hao, Z.; Zhao, Z.; Zhang, X. MicroRNA Temporal-Specific Expression Profiles Reveal longissimus dorsi Muscle Development in Tianzhu White Yak. Int. J. Mol. Sci. 2024, 25, 10151. [Google Scholar] [CrossRef] [Scilit]
- Cesana, M.; Cacchiarelli, D.; Legnini, I.; Santini, T.; Sthandier, O.; Chinappi, M.; Tramontano, A.; Bozzoni, I. A Long Noncoding RNA Controls Muscle Differentiation by Functioning as a Competing Endogenous RNA. Cell 2011, 147, 358–369. [Google Scholar] [CrossRef] [Scilit]
- Sun, X.; Li, M.; Sun, Y.; Cai, H.; Li, R.; Wei, X.; Lan, X.; Huang, Y.; Lei, C.; Chen, H. The developmental transcriptome landscape of bovine skeletal muscle defined by Ribo-Zero ribonucleic acid sequencing. J. Anim. Sci. 2015, 93, 5648–5658. [Google Scholar] [CrossRef] [Scilit]
- Hao, W.; Yang, Z.; Sun, Y.; Li, J.; Zhang, D.; Liu, D.; Yang, X. Characterization of Alternative Splicing Events in Porcine Skeletal Muscles with Different Intramuscular Fat Contents. Biomolecules 2022, 12, 154. [Google Scholar] [CrossRef] [Scilit]
- Huang, C.; Feng, F.; Dai, R.; Ren, W.; Li, X.; Zhaxi, T.; Ma, X.; Wu, X.; Chu, M.; La, Y.; et al. Whole-transcriptome analysis of longissimus dorsi muscle in cattle-yaks reveals the regulatory functions of ADAMTS6 gene in myoblasts. Int. J. Biol. Macromol. 2024, 262, 129985. [Google Scholar] [CrossRef] [Scilit]
- Lo, K.-Y.; Li, Z.; Wang, F.; Marcotte, E.M.; Johnson, A.W. Ribosome stalk assembly requires the dual-specificity phosphatase Yvh1 for the exchange of Mrt4 with P0. J. Cell Biol. 2009, 186, 849–862. [Google Scholar] [CrossRef] [Scilit]
- Adachi, K.; Soeta-Saneyoshi, C.; Sagara, H.; Iwakura, Y. Crucial Role of Bysl in Mammalian Preimplantation Development as an Integral Factor for 40S Ribosome Biogenesis. Mol. Cell. Biol. 2007, 27, 2202–2214. [Google Scholar] [CrossRef] [Scilit]
- Wang, T.; Ma, X.; Zheng, Q.; Ma, C.; Zhang, Z.; Pan, H.; Guo, X.; Wu, X.; Chu, M.; Liang, C.; et al. A comprehensive study on the longissius dorsi muscle of Ashdan yaks under different feeding regimes based on transcriptomic and metabolomic analyses. Anim. Biotechnol. 2024, 35, 2294785. [Google Scholar] [CrossRef] [Scilit]
- Yang, C.; Liu, J.-B.; Wu, X.-Y.; Bao, P.-J.; Long, R.-J.; Guo, X.; Ding, X.-Z.; Yan, P. The response of gene expression associated with lipid metabolism, fat deposition and fatty acid profile in the longissimus dorsi muscle of Gannan yaks to different energy levels of diets. PLoS ONE 2017, 12, e0187604. [Google Scholar] [CrossRef] [Scilit]
- Xiong, L.; Pei, J.; Wang, X.; Guo, S.; Guo, X.; Yan, P. Effect of Lipids in Yak Muscle under Different Feeding Systems on Meat Quality Based on Untargeted Lipidomics. Animals 2022, 12, 2814. [Google Scholar] [CrossRef] [Scilit]
- King, D.; Shackelford, S.; Broeckling, C.; Prenni, J.; Belk, K.; Wheeler, T. Metabolomic Investigation of Tenderness and Aging Response in Beef Longissimus Steaks. Meat Muscle Biol. 2019, 3, 76. [Google Scholar] [CrossRef] [Scilit]
- Liu, Y.-X.; Ma, X.-M.; Xiong, L.; Wu, X.-Y.; Liang, C.-N.; Bao, P.-J.; Yu, Q.-L.; Yan, P. Effects of Intensive Fattening With Total Mixed Rations on Carcass Characteristics, Meat Quality, and Meat Chemical Composition of Yak and Mechanism Based on Serum and Transcriptomic Profiles. Front. Vet. Sci. 2021, 7, 599418. [Google Scholar] [CrossRef] [Scilit]
- Khan, M.I.; Jo, C.; Tariq, M.R. Meat flavor precursors and factors influencing flavor precursors—A systematic review. Meat Sci. 2015, 110, 278–284. [Google Scholar] [CrossRef] [Scilit]
- Schiaffino, S.; Reggiani, C. Fiber Types in Mammalian Skeletal Muscles. Physiol. Rev. 2011, 91, 1447–1531. [Google Scholar] [CrossRef] [Scilit]
- Sazanov, L.A. A giant molecular proton pump: Structure and mechanism of respiratory complex I. Nat. Rev. Mol. Cell Biol. 2015, 16, 375–388. [Google Scholar] [CrossRef] [Scilit]
- Wang, J.; Jia, M.; Zhang, H.; Guo, Y.; Zhang, Q.; Yan, X.; Lu, Q.; Zhang, S.; Xing, B. Multi-Omics Analysis and Comparison of the Developmental Characteristics of Muscle Fiber Types Between Huainan and Large White Pigs in Early Postnatal Period. Biology 2025, 14, 1409. [Google Scholar] [CrossRef] [Scilit]
- Zhang, L.; Zhou, Y.; Wu, W.; Hou, L.; Chen, H.; Zuo, B.; Xiong, Y.; Yang, J. Skeletal Muscle-Specific Overexpression of PGC-1α Induces Fiber-Type Conversion through Enhanced Mitochondrial Respiration and Fatty Acid Oxidation in Mice and Pigs. Int. J. Biol. Sci. 2017, 13, 1152–1162. [Google Scholar] [CrossRef] [Scilit]
- Wang, H.B.; Zan, L.S.; Zhang, Y.Y. Profiling of the yak skeletal muscle tissue gene expression and comparison with the domestic cattle by genome array. Animal 2014, 8, 28–35. [Google Scholar] [CrossRef] [Scilit][Green Version]
- Qiu, Q.; Zhang, G.; Ma, T.; Qian, W.; Wang, J.; Ye, Z.; Cao, C.; Hu, Q.; Kim, J.; Larkin, D.M.; et al. The yak genome and adaptation to life at high altitude. Nat. Genet. 2012, 44, 946–949. [Google Scholar] [CrossRef] [Scilit]
- Rosen, E.D.; MacDougald, O.A. Adipocyte differentiation from the inside out. Nat. Rev. Mol. Cell Biol. 2006, 7, 885–896. [Google Scholar] [CrossRef] [Scilit]
- Wang, Y.H.; Bower, N.I.; Reverter, A.; Tan, S.H.; De Jager, N.; Wang, R.; McWilliam, S.M.; Cafe, L.M.; Greenwood, P.L.; Lehnert, S.A. Gene expression patterns during intramuscular fat development in cattle. J. Anim. Sci. 2009, 87, 119–130. [Google Scholar] [CrossRef] [Scilit]
- Tan, Z.; Pokhrel, B.; Zhou, Z.; Jiang, H. Transcriptome analysis unveils multiple reasons behind delayed and slower deposition of intramuscular fat compared to subcutaneous fat in cattle. BMC Genom. 2025, 26, 706. [Google Scholar] [CrossRef] [Scilit]
- Schiaffino, S.; Mammucari, C. Regulation of skeletal muscle growth by the IGF1-Akt/PKB pathway: Insights from genetic models. Skelet. Muscle 2011, 1, 4. [Google Scholar] [CrossRef] [Scilit]
- Ma, X.; La, Y.; Bao, P.; Chu, M.; Guo, X.; Wu, X.; Pei, J.; Ding, X.; Liang, C.; Yan, P. Regulatory Role of N6-Methyladenosine in Longissimus Dorsi Development in Yak. Front. Vet. Sci. 2022, 9, 757115. [Google Scholar] [CrossRef] [Scilit]
- Hocquette, J.F.; Gondret, F.; Baéza, E.; Médale, F.; Jurie, C.; Pethick, D.W. Intramuscular fat content in meat-producing animals: Development, genetic and nutritional control, and identification of putative markers. Animal 2010, 4, 303–319. [Google Scholar] [CrossRef] [Scilit]
Disclaimer/Publisher’s Note: The statements, opinions and data contained in all publications are solely those of the individual author(s) and contributor(s) and not of MDPI and/or the editor(s). MDPI and/or the editor(s) disclaim responsibility for any injury to people or property resulting from any ideas, methods, instructions or products referred to in the content. |
© 2026 by the authors. Licensee MDPI, Basel, Switzerland. This article is an open access article distributed under the terms and conditions of the Creative Commons Attribution (CC BY) license.