


Abstract
In this paper, we discuss the atomic models developed for the non-local thermodynamic equilibrium (LTE) analysis of the spectra of two odd-Z chemical elements, the little-studied potassium and copper, whose nuclei are often thought to form in Cosmos through different astrophysical processes. The K I and Cu I atomic models have been developed and updated over the past decade and applied to determine non-LTE abundances of these elements in the hot and cool dwarfs, giants, and supergiants of different metallicities, from solar to extremely low metallicity. The abundances of potassium and copper in old metal-poor halo stars are of considerable interest because these objects bear the imprints of nucleosynthesis in Type II supernovae and hypernovae in the early Galaxy. The vast majority of the studies of the spectra of these atoms have been based on the assumption of LTE. In some cases, this approach has led to incorrect results, which have sometimes affected our understanding of evolutionary processes in stars and stellar systems. The main objective of this article is to highlight the importance of using the non-LTE stellar abundance data to improve or modify existing theoretical models of cosmic chemical evolution. In particular, significantly different results for the copper abundance in old Galactic stars were obtained compared to LTE data. This finding could inspire specialists working in the field of chemodynamic models to search for realistic pathways for the formation of this element in massive stars. Despite this, since the first non-LTE results on the copper abundance in the oldest Galactic stars, LTE data remained in use for several years. This situation seriously hinders progress in research into some certain aspects of cosmic nucleosynthesis.
1. Introduction
It is widely recognized that the elemental abundances in stars are of paramount importance for our correct understanding of the physics of the stars, planetary systems, stellar clusters, the physics of our Galaxy and extragalactic stellar systems. Around the middle of the last century, the assumption of the local thermodynamic equilibrium (LTE) in stellar atmospheres came into widespread use as a standard method for determining the elemental abundances in stars. Since then, a vast amount of abundance data has been obtained. In the LTE concept, temperature is one of the most important parameters. Considering the various microprocesses in the plasma of stellar atmospheres, several “types” of temperature can be distinguished. The kinetic temperature describes the motion of particles in the atmosphere gas (if electrons are considered, the temperature is the electron temperature ); Maxwellian velocity distribution is assumed for the gas particles. Excitation processes (bound–bound transitions between atomic energy levels; the Boltzmann distribution of atoms over excitation states) are described by the excitation temperature . Ionization processes (bound-free transitions) are controlled by the ionization temperature (the Saha formula for the distribution over ionization states is used). The state where = = defines the local thermodynamic equilibrium. Radiative temperature describes the radiation field in the stellar atmosphere. The state when = = = defines complete thermodynamic equilibrium. Because radiation in stellar atmospheres can propagate over large distances, the radiative temperature can vary at different points in the atmosphere, and the radiation field may not be in equilibrium with the matter. Since about the second part of the last century, it has become clear that the simplified approach in spectroscopic analysis, based on the assumption of LTE in the stellar atmospheres, often produces unreliable results that affect our understanding of various processes in the Cosmos.
With the advent of more powerful computational and observational tools (high-resolution spectral material in the far, near-ultraviolet, visible, near, and far-infrared spectral ranges), and especially with the advent and availability of useful atomic databases containing information on energy levels, reliable oscillator strengths, ionization cross sections of atomic transitions for various chemical elements and other necessary data, it became possible to abandon the simplified assumption of the validity of the LTE condition in stellar atmospheres and to conduct a detailed study of microprocesses in atmospheric plasma, which made it possible to more realistically determine the populations of energy levels in some atoms and ions (non-LTE approximation). It soon became clear that, although in some cases for some elements there was reasonable agreement between LTE and non-LTE abundance results, there were problematic elements (more precisely, the atoms and ions under consideration and their spectral lines) that exhibited significant differences in abundances determined from lines of different multiplets and ionization stages. An instructive example is the oxygen abundance in stars inferred from the analysis of near-infrared lines of the oxygen triplet (7772, 7774, 7775 Å). These lines are quite strong, have good shapes, practically are not blended and appear to offer an excellent opportunity to determine oxygen abundance in the cool stars. However, as shown in [1], cooler and hotter dwarfs in the Hyades cluster exhibit a clear difference in the LTE oxygen abundance. Moreover, ref. [2] also noted a discrepancy between the LTE oxygen abundance values obtained for dwarfs and giants in this cluster, as well as between the oxygen abundance values inferred from the infrared triplet and forbidden line of neutral oxygen at 6300.3 Å (formed under LTE condition). This discrepancy indicates that the infrared oxygen lines are influenced by non-LTE effects, and this influence depends on the stellar parameters. These lines are no longer used for LTE analysis. In contrast, some studies still use LTE abundances of problematic elements, such as copper, for example. However, as shown below, the neutral copper lines in the spectra of metal-poor stars are subject to very strong non-LTE effects (some aspects of this problem were discussed in [3]).
Since the predictions of the Galaxy chemical evolution theoretical models are based on the expected elemental yields of massive stars, such as progenitors of Type II supernovae and hypernovae (for the nature of this phenomenon see, [4]), as well as lower mass stars, namely progenitors of Type I supernovae and asymptotic giant branch stars, and these models are constrained by elemental abundances data for stars of different ages, it is crucial to ensure the reliability of the abundance data obtained from observations. New data on the non-LTE abundances of certain elements allow us to reexamine the results obtained from various sources and, based on these data, modify or improve existing models of the Galactic chemical evolution. Much remains to be done in this direction, following the availability of data from large-scale high-quality spectroscopic surveys of faint metal-poor halo stars.
2. Non-LTE Spectroscopic Analysis
The non-LTE approximation requires finding adequate populations of atomic energy levels under the radiative and collisional processes in which the considered atom participates. Traditionally, the level populations are expressed in terms of b-factors (the ratio of the actual energy level population to the equilibrium population, namely ). The source function for the transition between the upper level “u” and lower level “l” in this notation is , where is the Planck function. Non-LTE calculations in one-dimensional approximation can be performed, for example, using the MULTI program developed by [5] in combination with the Kurucz’s atmosphere models generated by ATLAS9 [6]. Some important modifications of the MULTI code were made by [7]. In particular, the following additional possibilities are available in the modified version:
- 1.
- Opacity sources from the ATLAS9 [6] are included in MULTI. This allows for a significantly more accurate calculation of the continuum opacity and intensity distribution in the ultraviolet (UV) region.
- 2.
- There is a possibility to calculate combined profiles of blended lines, taking into account the stellar rotation and instrumental profile.
- 3.
- The b-factors calculated in MULTI are transferred to the SynthV ([8]) program, developed for calculating synthetic spectrum. The synthetic spectrum is calculated using the non-LTE source function for the line of interest and LTE source functions for all lines (including blending lines) in its vicinity. Oscillator strengths are typically taken from the Vienna Atomic Line Database (VALD, [9]). This methodology was used in all of our non-LTE analyses and abundance determinations.
Thorough non-LTE analysis of the spectrum of a given atom of a certain chemical element must take into account processes of inelastic collisions between the atoms being studied and hydrogen atoms. As usual, these processes are described using the Drawin’s formula ([10]), adapted for astrophysical use by [11]. This approximation involves the use of an empirically chosen scaling factor. It should be noted that [12] considers this approach to not be physically justified (the importance of this problem for the atmospheres of FGK stars is discussed in [13]). According to these authors, “The influence of inelastic hydrogen atom collisions on the spectral line formation remains to be a significant source of uncertainty for stellar abundance analyses, due to the difficulty in obtaining accurate data for low-energy atomic collisions either experimentally or theoretically”. Among recent publications on this topic, one can mention paper [14], which describes a method for calculating the rate constants of inelastic collisions for the fine structure of alkali element atoms (in particular, potassium) with hydrogen atoms. This method was applied by [15] in their updated potassium atomic model. According to these authors, non-LTE effects become less pronounced when using new collisional data. While recognizing the shortcomings of the discussed approach based on the Drawin’s formula, we nevertheless used it in our non-LTE analysis of the spectra of neutral potassium and copper atoms.
The following generally adopted definitions are used below: abundance of element (El/H) = (El/H) + 12.00; relative-to-solar abundance of element: [El/H] = (El/H)*(El/H)Sun; relative-to-iron abundance of element (El/Fe) = (El/H) (Fe/H) and [El/Fe] = (El/Fe)*(El/Fe)Sun.
3. Atomic Models for Non-LTE Analysis of Potassium and Copper Spectra
3.1. Potassium
For, potassium (), the number of stable isotopes is two: and (the Solar System isotope ratio is ). The most abundant isotope can be formed during oxygen burning just before Type II supernovae explosions in reactions between -particles and nuclei, as well as between protons and nuclei. Possible chains of these reactions are
or
Due to its relatively high cosmic abundance and rather low first ionization potential (4.34 eV), potassium is of particular interest, because it may be the dominant contributor of electrons in the atmospheres of very cool stars. Spectroscopic analysis typically uses two resonance lines: 7664.899 and 7698.964 Å (often, only the second line is studied).
3.1.1. LTE and Early Non-LTE Analyses
We begin this brief review of potassium studies by mentioning the work of [16], which determined the potassium abundance in the Sun. An LTE analysis by [17] showed that the potassium abundance increases starting from [Fe/H] ≈ 0 dex toward lower metallcity, where [K/Fe] reaches dex at [Fe/H] dex. The authors of [18] conducted an extensive LTE study of 90 FG type main-sequence disk stars. Similar to other LTE studies, they found a clear increase in the [K/Fe] abundance as a function [Fe/H]. This increase is observed over the metallicity range from zero to dex, and [K/Fe] reaches about +0.4 dex. The authors of [19] used spectra (equivalent widths measurements) of 32 main-sequence stars with [Fe/H] values less than dex to determine the LTE abundances and to explore the potassium abundance dependence as a function of metallicity. According to the abundance results reported by these authors, the relative potassium abundance [K/Fe] increases with decreasing metallicity, but with a large scatter. The authors of [20] redetermined the abundances in the stars from APOGEE+Kepler stellar sample and also found that the potassium abundance gradually increases with the metallicity decreasing in the range of [Fe/H] values from to dex. In [21], the potassium abundance was determined in 20 halo stars covering the metallicity range from [Fe/H] = to dex. The average [K/Fe] is approximately +0.25 dex. Most recently, [22] determined potassium abundance in 58 bulge stars using infrared lines (15,163.067 and 15,168.376 Å). According to the authors, the differences between the LTE and non-LTE (corrected) abundances are negligible, below 0.1 dex. Figure 7 of that paper shows a fairly wide range of potassium abundance in the bulge stars, although these data are in satisfactory agreement with the potassium abundance in the disk stars (non-LTE, [23], see below) and halo stars ([21]), also shown in that figure. The potassium abundance in a sample of the extremely metal-poor stars was investigated in [24]. Interestingly, K I lines were detected in seven stars with very low [Fe/H] values, below dex. The potassium abundance values corrected for non-LTE effects are not significantly different from the LTE results with the average [K/Fe] value (non-LTE) being about +0.5 dex in the very low metallicity regime. This result provides insight into the formation of potassium by massive stars during their evolution in the early Galaxy.
Probably the first attempt to apply the non-LTE approximation to determine the potassium abundance in the Sun was undertaken by [25]. One of the two resonance lines was used, namely the 7698.964 Å line. For this, a very simple potassium atomic model was developed: the ground level of K I and three lower levels: 4s 2, 4p 2, 4p 2, and 5p 2. Even with this simple model, the authors obtained a solar potassium abundance (K/H) = 5.14 dex, which is very close to the currently adopted value for the Sun (K/H) = 5.07 dex ([26]). The authors also draw an important conclusion regarding the inapplicability of the LTE assumption when analyzing the resonance doublet lines. Later, ref. [27] reported the results of an analysis of the potassium lines in the solar spectrum. This work was continued in a series of subsequent papers ([28,29,30,31]). For six-levels models, the obtained non-LTE potassium abundance in the Sun was (K/H) = 5.08 dex. The authors of [32] used a more complex approach to studying the potassium spectrum. Their atomic model included 20 bound levels of K I and a continuum state. Takeda et al. [33] analyzed the 7698.964 Å line in the spectra of the Sun and Procyon. Based on equivalent widths, the authors obtained essentially identical abundance for the Sun and Procyon, (K/H) dex. The authors of [34] examined the non-LTE formation of K I lines (the potassium atomic model consisted of 36 energy levels, 35 of which were K I levels and the ground level of K II). According to the results, the potassium abundance in the Sun is (K/H) = 5.14 dex. The non-LTE corrections in the range of atmosphere parameters considered ( = 4000–10,000 K, = 0–4.5 dex, metallicity from to 0 dex) turned out to be quite significant: from to dex (weak subordinate lines 11,769.64, 12,432.27 and 12,522.13 Å). The corrections for one resonance line 7698.964 Å are larger, from about to dex. The authors of [35] studied the formation of neutral potassium lines in the solar photosphere to determine the solar potassium abundance. The computations were based on a 68-level potassium atomic model. The solar potassium abundance is (K/H) = dex.
Non-LTE abundance analysis of the metal-poor stars deserves special attention. The authors of [36] investigated the 7698.964 Å line in a sample of metal-poor FG disk and halo stars. To determine the non-LTE potassium abundance in program stars, the equivalent widths of this line were analyzed with the help of Kurucz’s program WIDTH9, adapted for use with the non-LTE line source function. The obtained relative-to-iron potassium abundance [K/Fe] for a homogeneous sample of 22 stars showed a close correlation and a slow increase with metallicity, reaching approximately 0.3–0.4 dex at [Fe/H] ≈ to dex. A reanalysis of the data by [17] (equivalent widths for 24 stars), which showed a large scatter, turned out to be less informative. Another important conclusion made by the authors concerns the absolute values of the non-LTE corrections to the potassium abundance in the line under study. These corrections turned out to be quite large, ≈from to dex. The authors of [23] determined the potassium abundance in a sample of 58 metal-poor stars. The authors used the atomic model consisting of 67 energy levels of K I and ground level of K II. The non-LTE corrections are quite significant, ranging from to , depending on temperature and gravity. Halo stars exhibit a plateau-like distribution of [K/Fe] as a function of [Fe/H] in the metallicity range from to dex. Thick disk stars show a local maximum of [K/Fe] dex at [Fe/H] dex. The authors of [37] analyzed potassium resonance lines in the spectra of 15 red giants belonging to the globular clusters M 4, M 13, and M 15 and two reference K giants. Within each cluster, the stars exhibited a more or less uniform potassium abundance, with two stars in M 4 and M 13 showing significant overabundance. For other stars from the studied clusters except these two, the relative-to-iron potassium abundance [K/Fe] gradually increases from 0.1–0.2 dex (at [Fe/H] ) to +0.3 at [Fe/H] , although statistical data are insufficient to make a final conclusion about a broad maximum of [K/Fe] around 0.3–0.4 dex at [Fe/H] dex.
3.1.2. Our Atomic Model for Non-LTE Analysis and First Results for Very Metal-Poor Stars
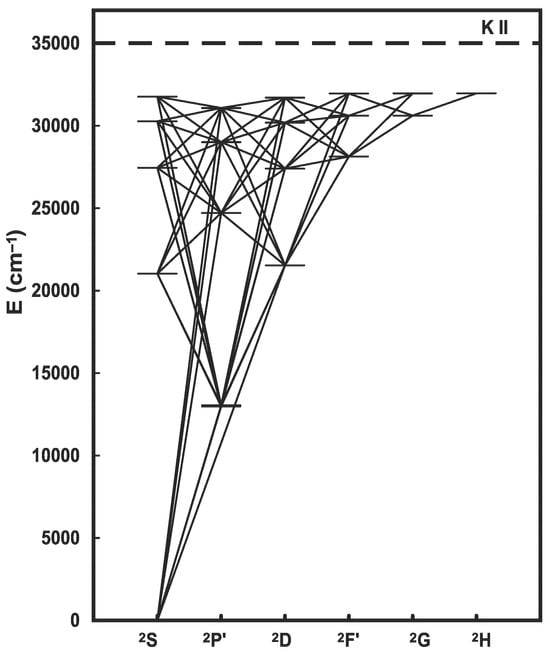
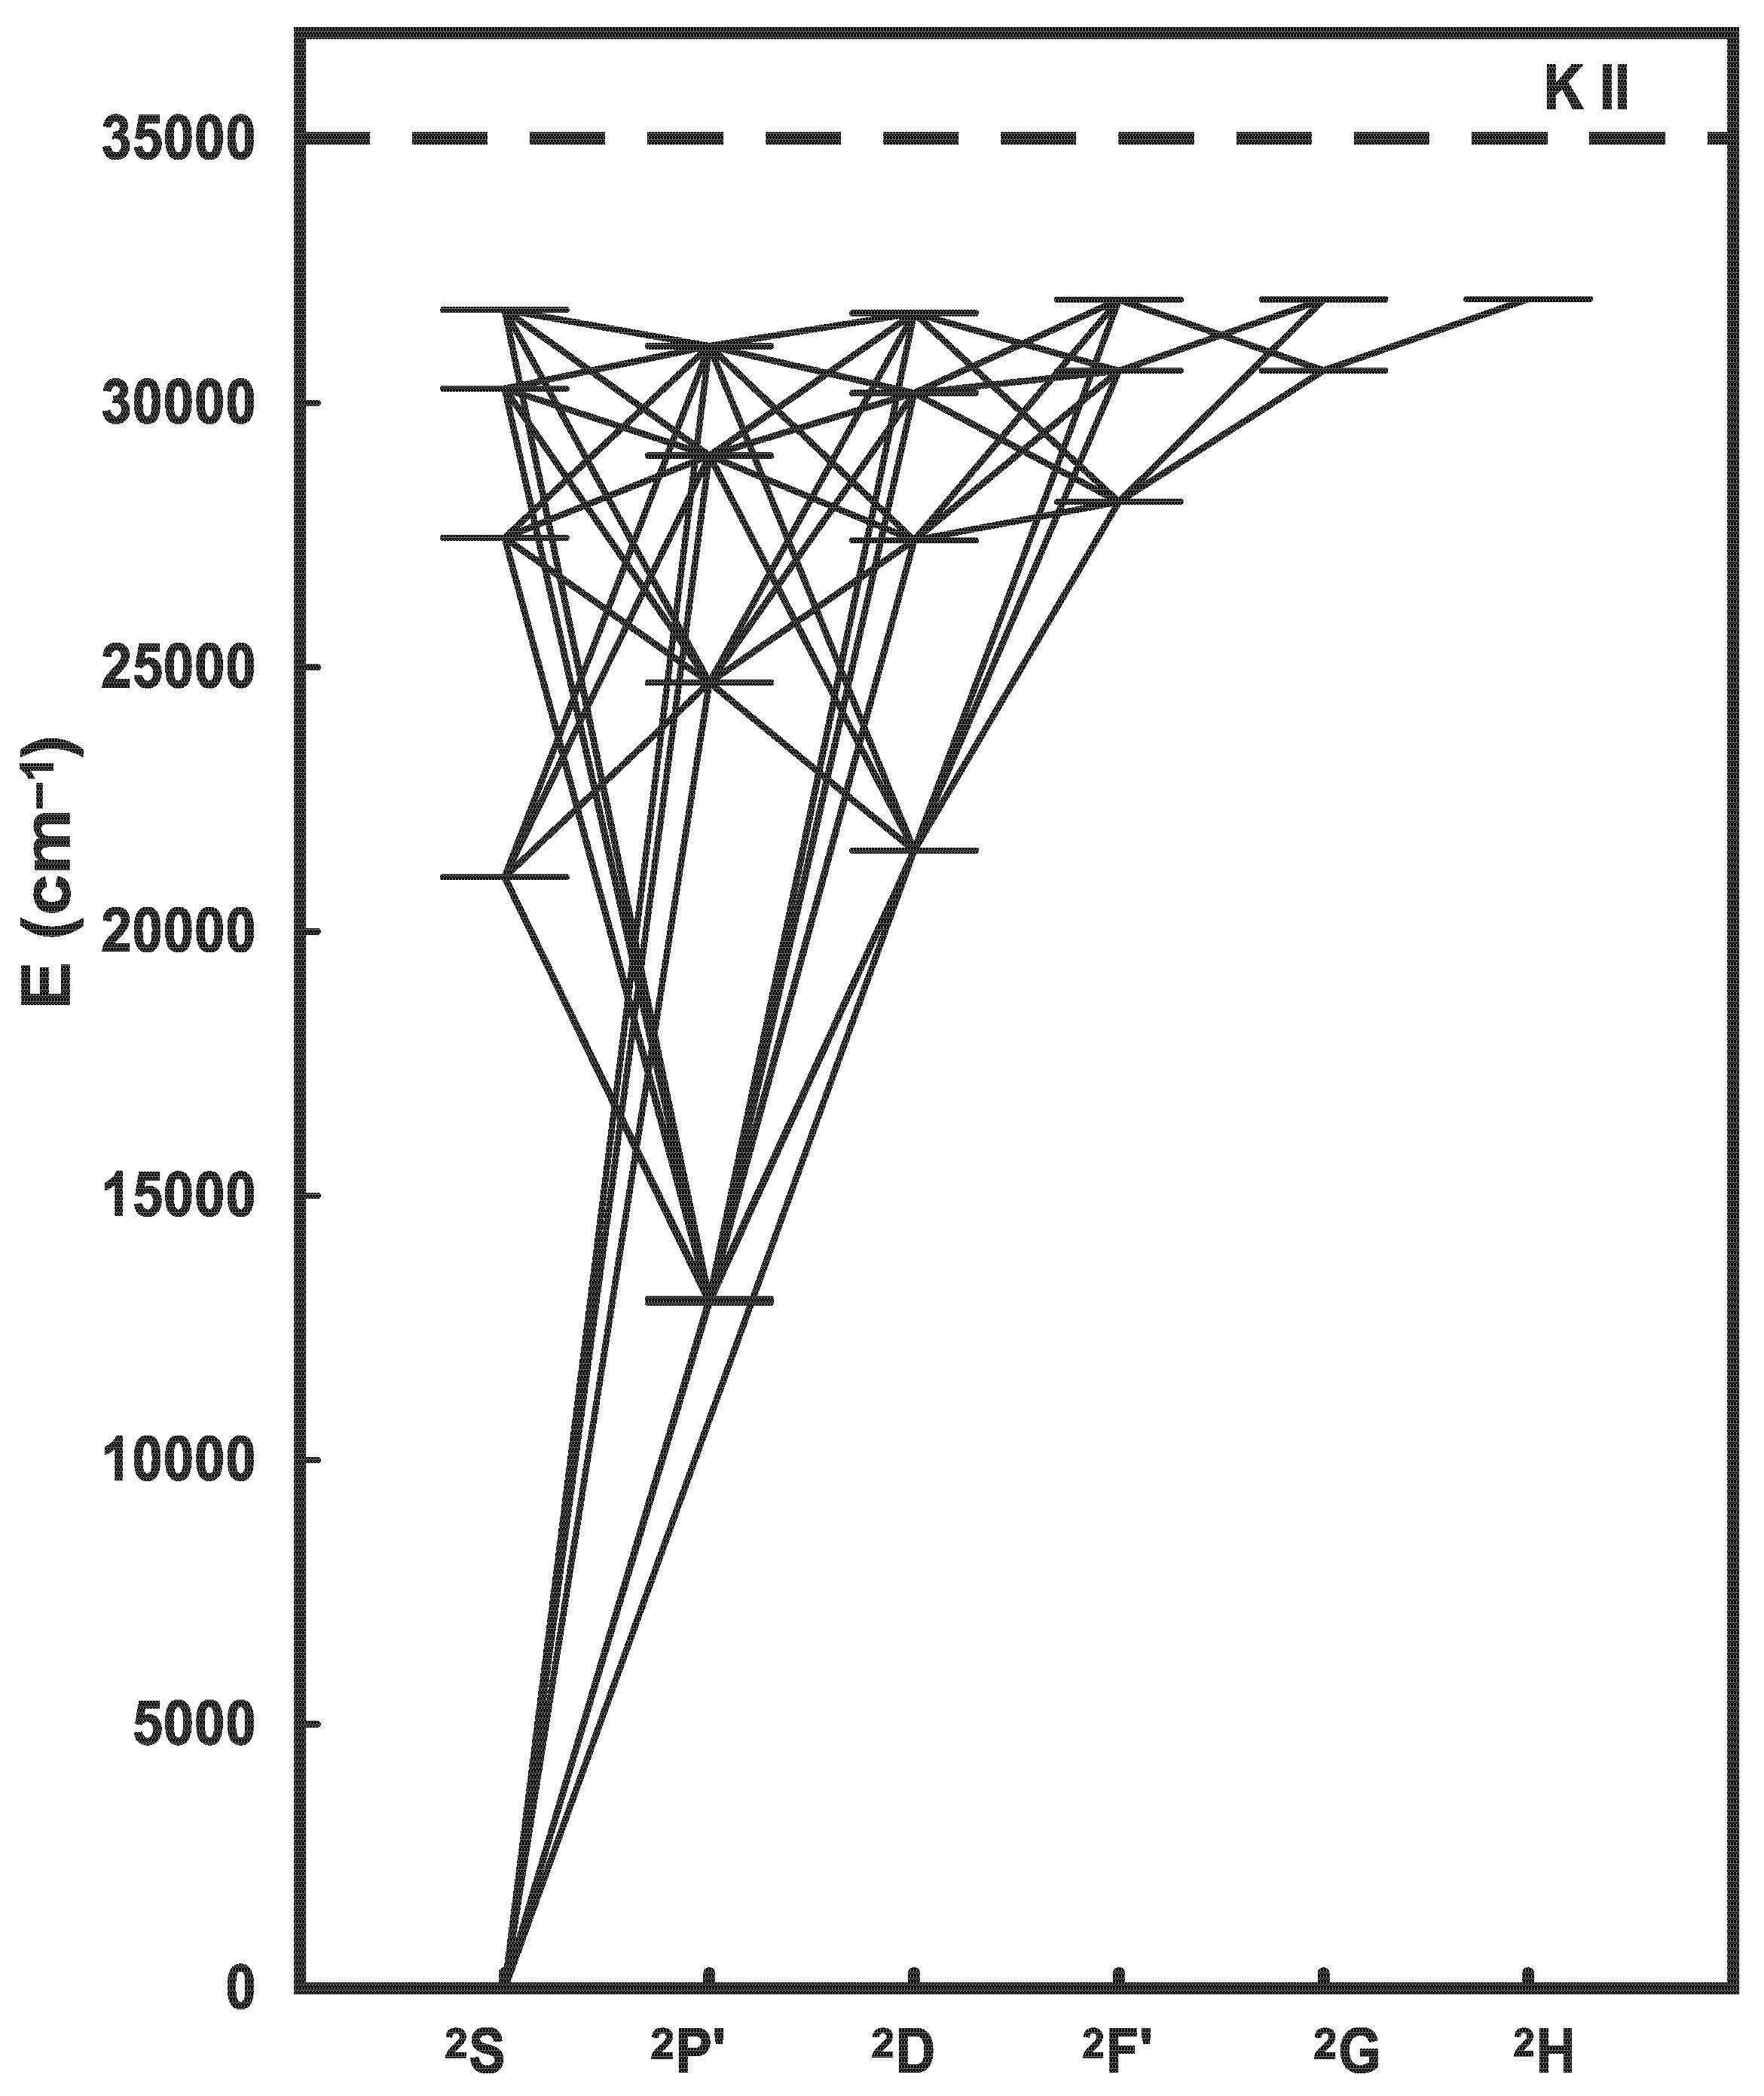
Continuing these works, Andrievsky et al. [38] developed a potassium atomic model for non-LTE analysis based on the model of [32]. In this implementation, the authors considered in detail all transitions between the first 20 energy levels of the neutral potassium atom and the ground level of the K II. Fine splitting was taken into account for the 4p2Po level. The remaining levels were treated as single levels. To conserve the number of particles, fifteen additional levels of K I atom and seven levels of K II were used. The level energies are taken from [39]. The oscillator strengths of the bound–bound transitions are taken from [40,41]. For the resonance transitions, the data from [42] were used. The total number of bound–bound transitions considered in detail was 62. Photoionization cross sections from the ground level of K I were presented by [43]. For the P-levels, the ionization cross sections published by [44] were used. For 2S, 2D, 2F levels, the cross sections calculated with the help of the quantum defect method ([45]) were applied. For the remaining levels, we used the hydrogen-like approximation. The electron collision rates were estimated using the formula from [46], while the formula from [47] was used for the forbidden transitions. Collision ionization from the ground level was described using the corresponding formula from [48]. For other levels, the formula from [49] was used. To take into account collisions of potassium atoms with hydrogen atoms, the formula of [11] with a correction factor of 0.05 was applied. The Grotrian diagram of K I atom is shown in Figure 1.
Figure 1.
The original Grotrian diagram for the neutral potassium atom K I. The ground state of ionized potassium K II is shown.
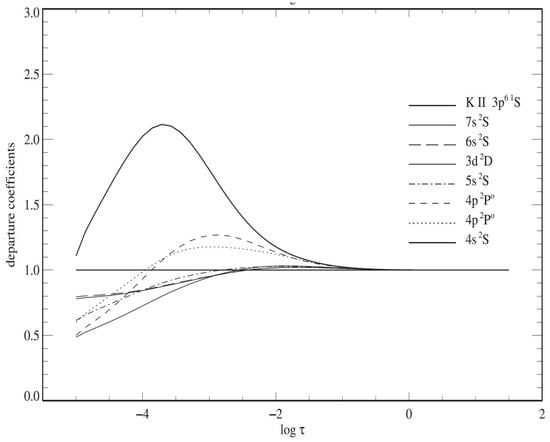
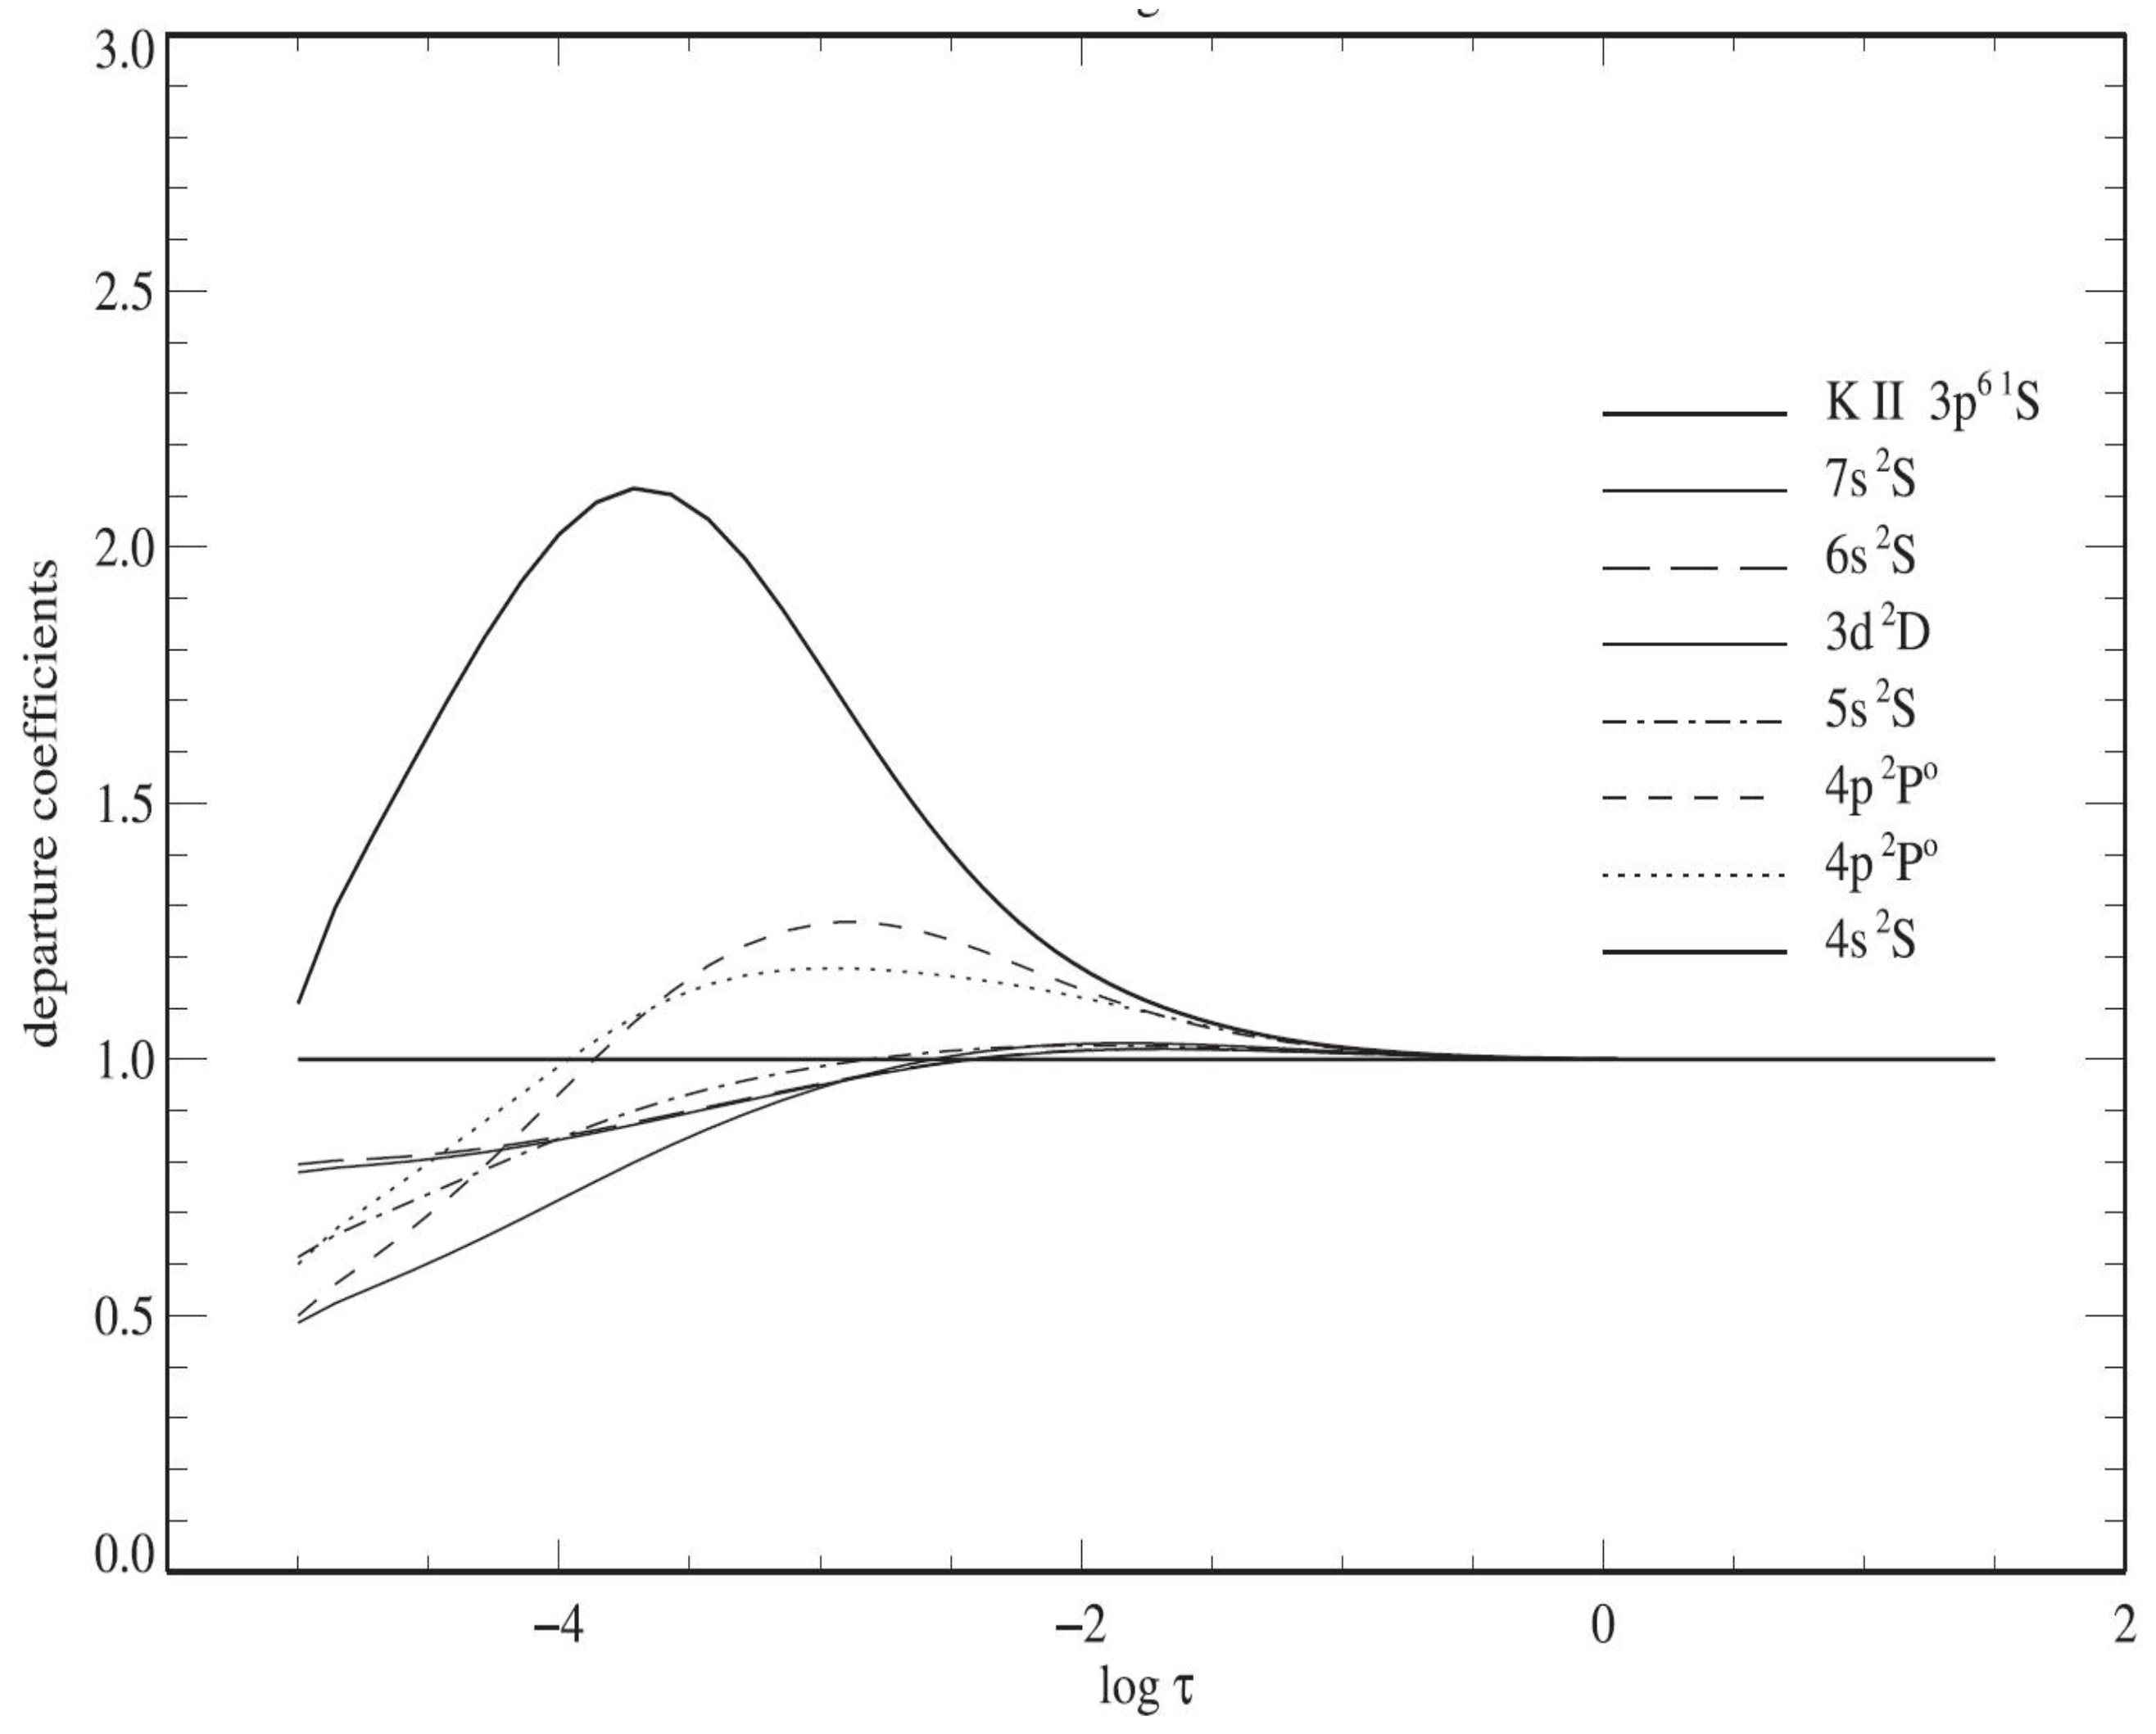
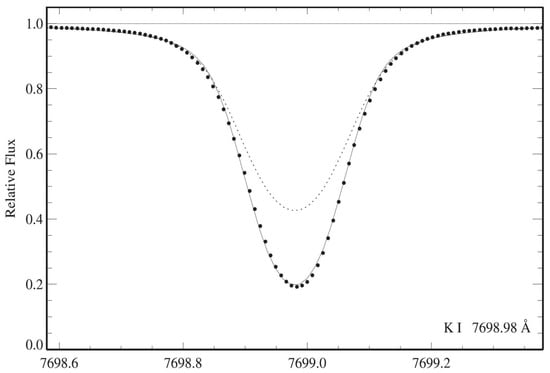
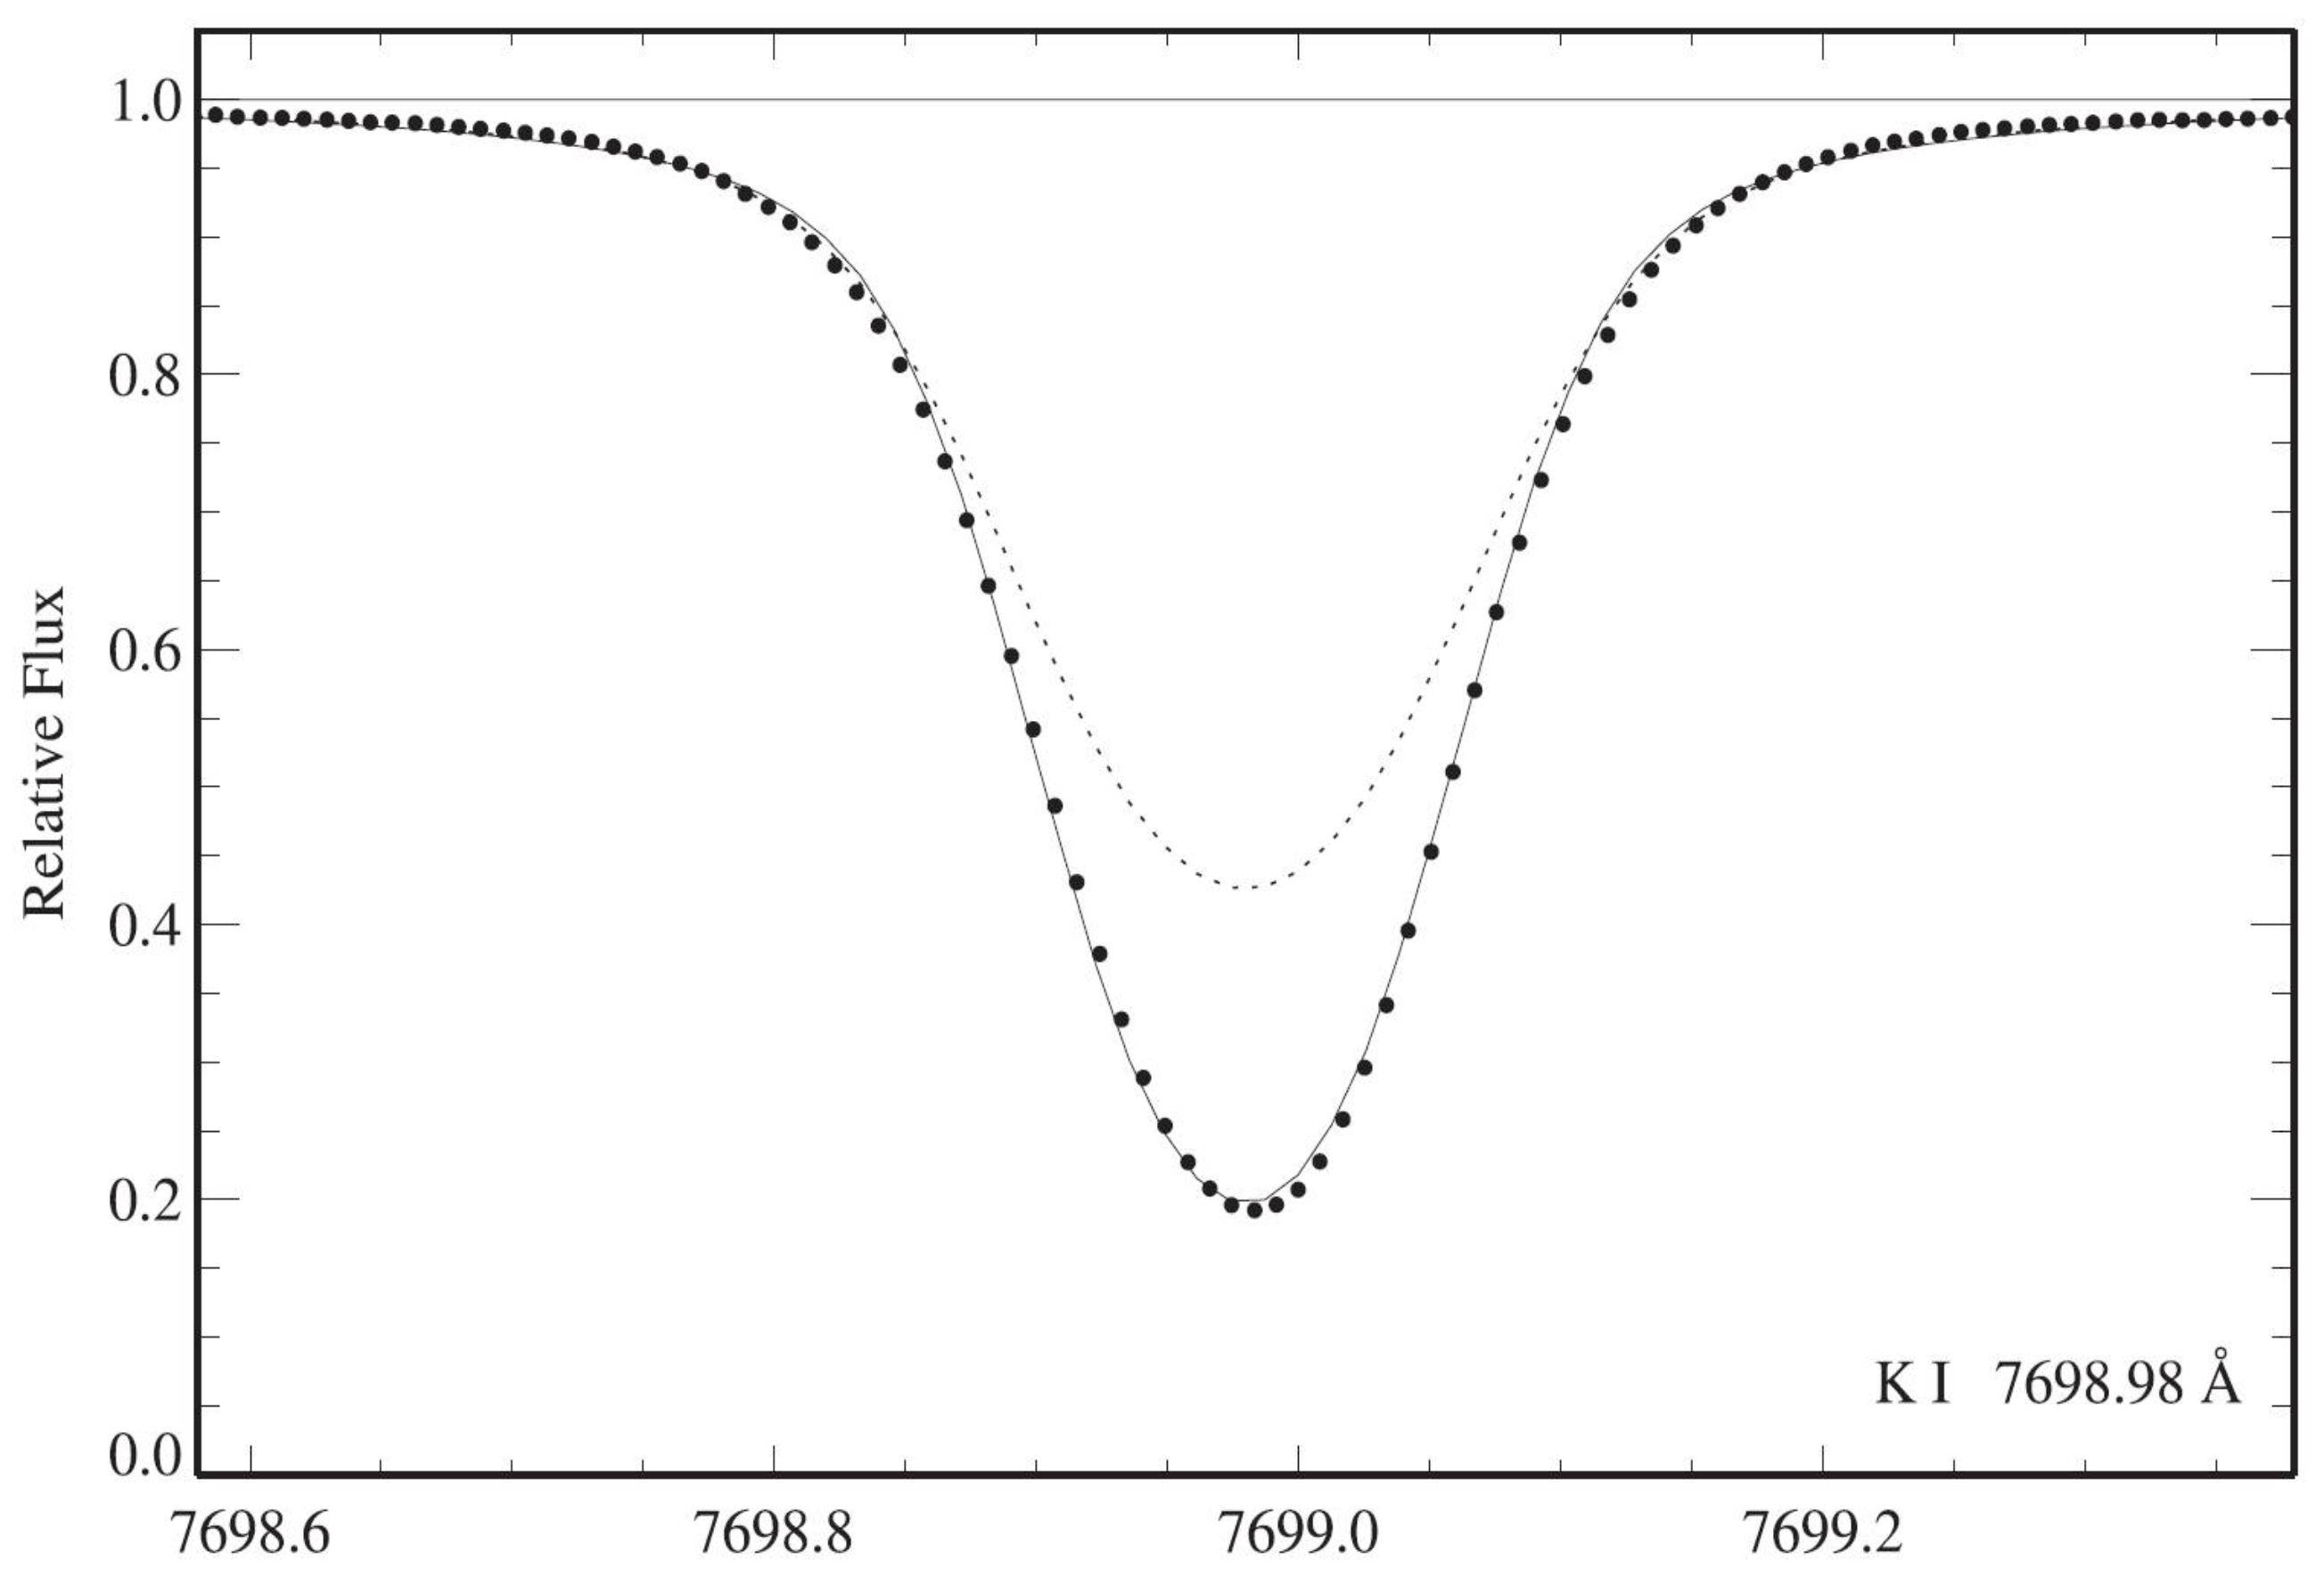
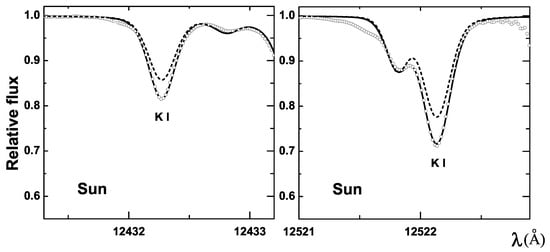
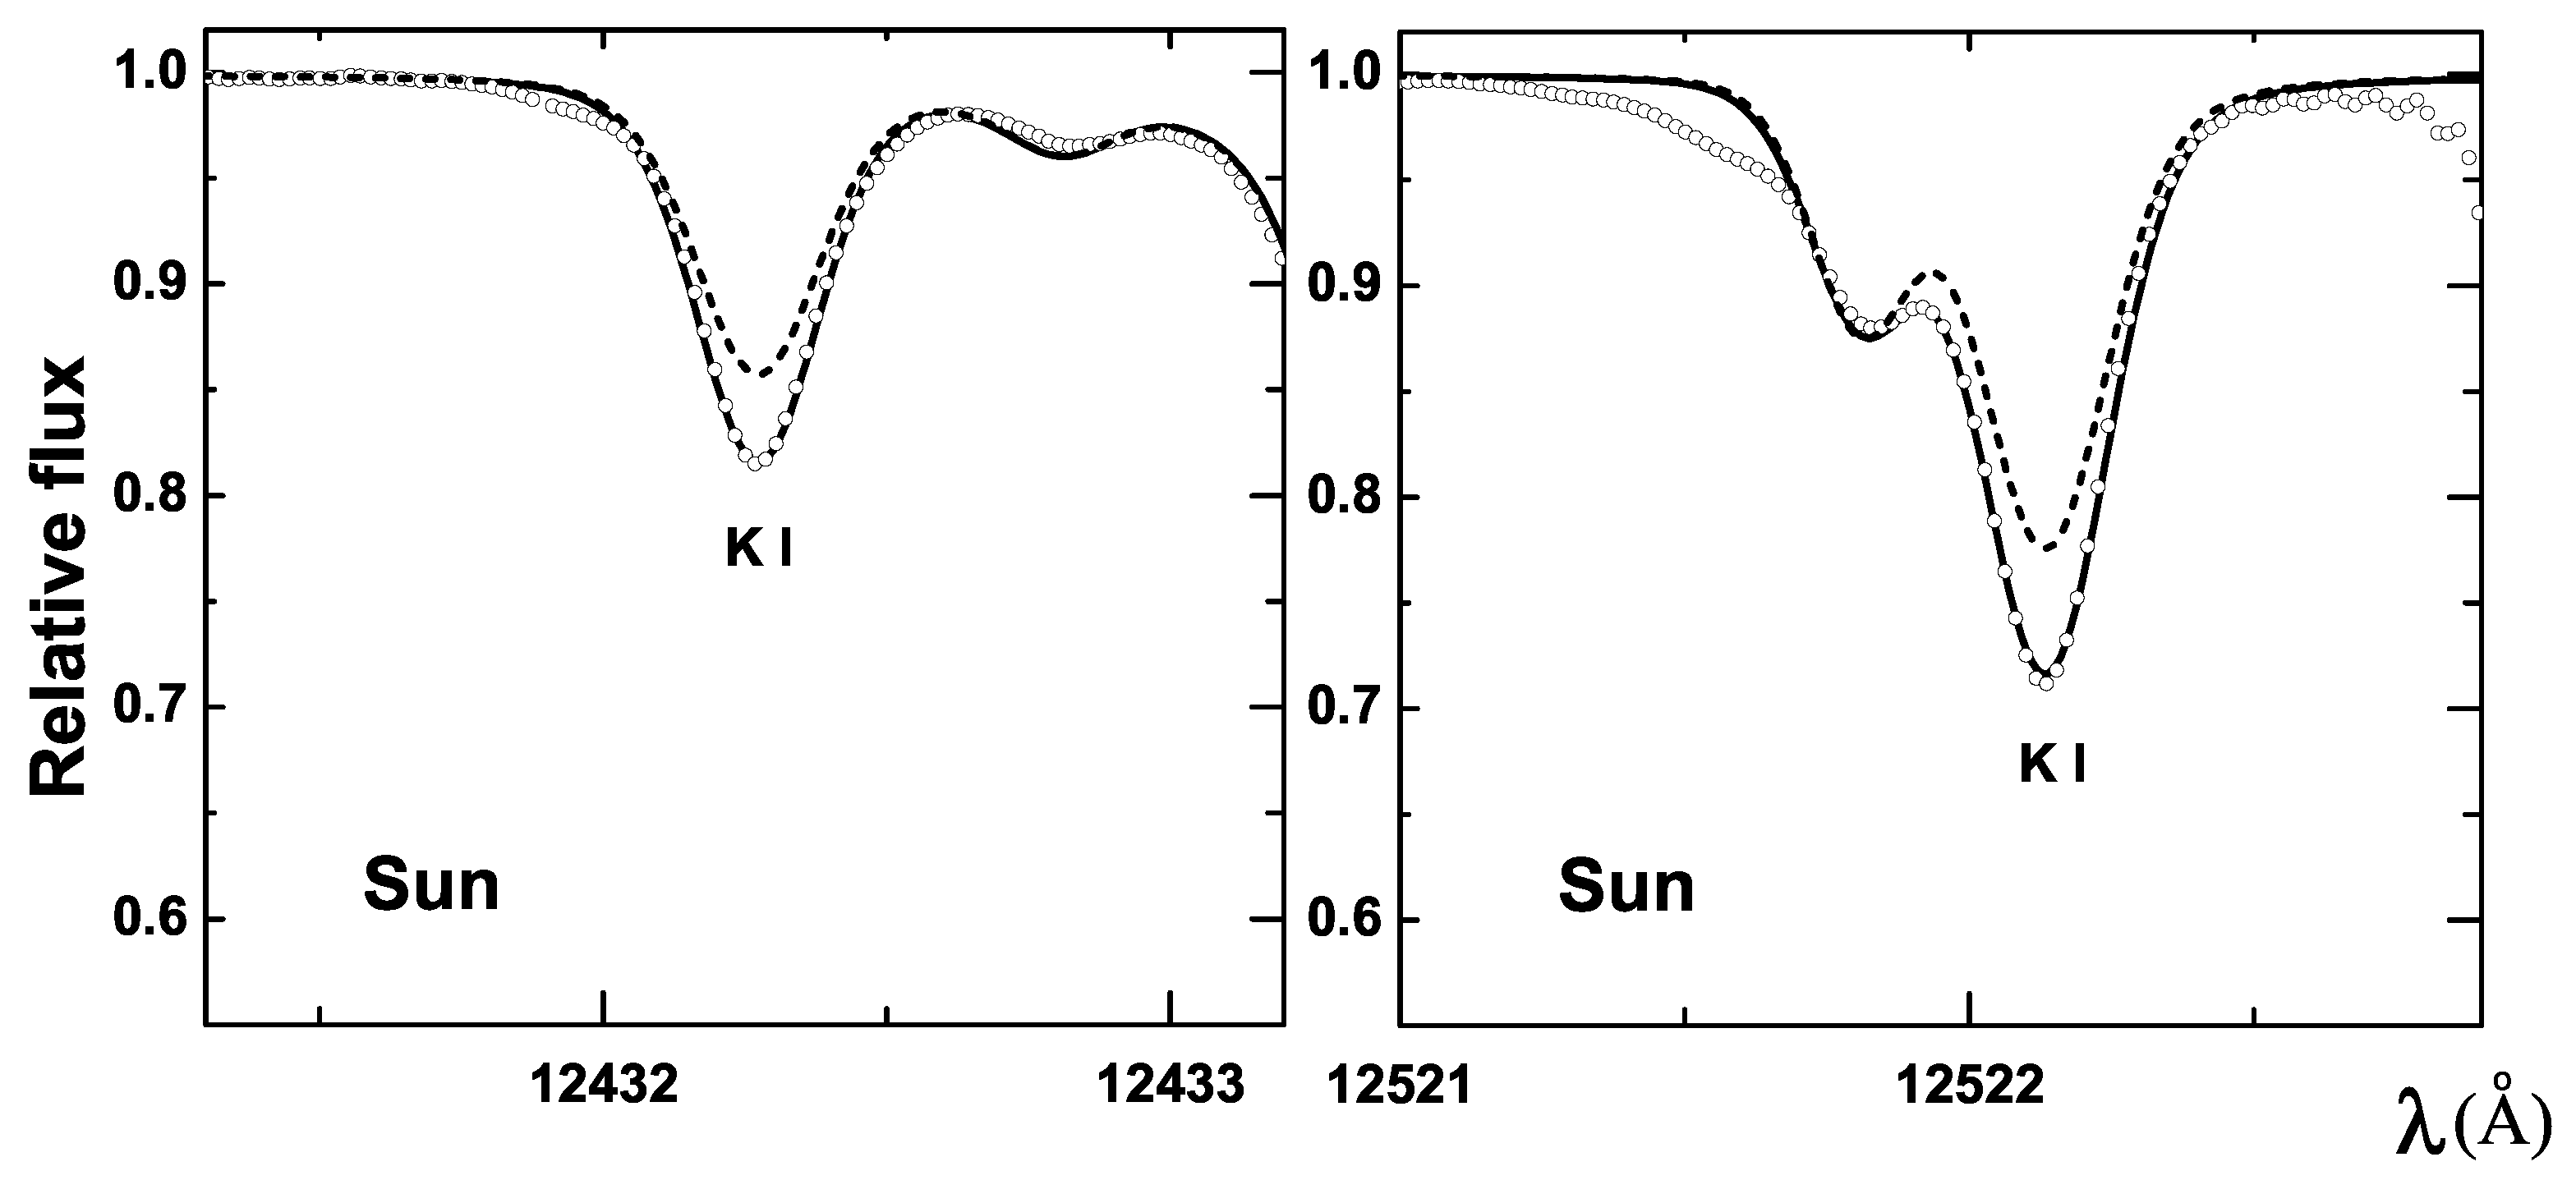
The fundamental difference between LTE- and non-LTE-based potassium abundances is due to an overrecombination to the first level of the K I atom in the atmospheres of late-type stars. This is demonstrated by the b-factors behavior, Figure 2. This leads to an increase in the equivalent widths of the potassium resonance lines, and, as a consequence, the LTE abundance is overestimated. The agreement between the observed and calculated non-LTE profiles of some potassium lines is shown in Figure 3 and Figure 4 (the adopted potassium abundance for the Sun is 5.11 dex).
Figure 2.
b-factors behavior in the atmosphere of the Sun, adapted from [35].
Figure 3.
Profile fit for the K I line 7698.964 Å in the solar spectrum. Observed spectrum—filled circles, non-LTE profile—continuous line, LTE profile—dotted line (non-LTE and LTE profiles are calculated with the same potassium abundance), based on [35].
Figure 4.
Profile fit for two infrared K I lines in the solar spectrum. Observed spectrum—open circles, non-LTE profile—continuous line, LTE profile—dashed line (non-LTE and LTE profiles are calculated with the same potassium abundance) [50].
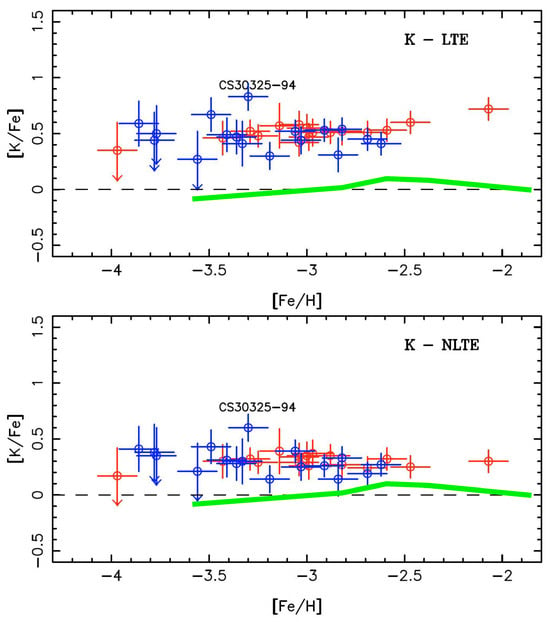
In the next step, the potassium abundance in a sample of metal-poor halo giants (35 stars with metallicities ranging from to dex and effective temperature in the range 4500–5300 K) was determined. The overall dependence of the relative-to-iron potassium abundance as a function of [Fe/H] is shown in Figure 5. [K/Fe] exhibits a very uniform distribution with a small scatter. It should be noted that the LTE result for these stars gives a slightly increased average potassium abundance, with a slight trend indicating an increase in the relative potassium abundance with increasing metallicity. The resulting dependence of the potassium non-LTE abundance as a function of metallicity supports the hypothesis that the nuclei of this element are formed in massive stars in the early Galaxy.
Figure 5.
Relative-to-iron abundance of potassium as a function of [Fe/H] in the Galactic halo giants. Red symbols represent mixed giants, blue symbols—unmixed giants (see, explanation in [51]), according to [38]. Theoretical potassium abundance distribution ([52]) is shown by the solid green line.
3.1.3. Recent Advances in the Non-LTE Study of Potassium Abundance in Cool Stars
More recently, using the 7698.964 Å line, the non-LTE abundance of potassium in the disk and halo stars was obtained by [53]. The metallicity range considered is from to +0.24 dex. Disk stars exhibit an increase in the derived abundance with decreasing metallicity, while thick disk and halo stars do not exhibit a clear dependence on the metallicity (the average abundance [K/Fe] is about +0.2 dex). A recent non-LTE analysis of potassium lines in six benchmark stars was conducted by [54]. It should be noted that these authors applied up-to-date atomic data on the collision cross sections of potassium atoms with electrons and hydrogen atoms. Similar to previous findings, the authors concluded that potassium line 7698.964 Å, widely used in analysis, is susceptible to non-LTE effects. They also calculated a grid of non-LTE corrections over a fairly wide range of the temperature, gravity, metallicity and microturbulent velocity values and corrected the LTE abundances published by [55] (differential analysis for the solar twins), [56,57]. With these non-LTE corrections, the distribution of the relative potassium abundance [K/Fe] as a function of [Fe/H] was completely changed in the low-metallicity regime (Figure 14 in that paper). The LTE results on the relative potassium abundance [K/Fe] show a slight decreasing trend in the metallicity range from [Fe/H] = to dex, with a maximum [K/Fe] value higher than +0.5 dex at [Fe/H] dex and a minimum [K/Fe] value lower than +0.5 dex at [Fe/H] dex. A non-LTE analysis reveals a different picture. Instead of a decreasing trend, the [K/Fe] distribution in the above metallicity range shows a slight increase in the relative potassium abundance followed by a plateau at [Fe/H] dex. The minimum value of [K/Fe] dex is observed at [Fe/H] dex, the plateau value of [K/Fe] is about +0.2 dex, which is in excellent agreement with the results of Andrievsky et al. [38] in this metallicity range; see Figure 5.
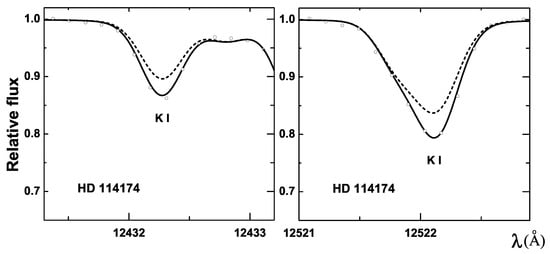
In this regard, it is also worth mentioning that we recently presented a study of the departures from LTE in the formation of infrared lines of K I in unevolved stars of FGK spectral types and near-solar metallicities ([50]). For this study, we significantly modified the model first described in [38]. Specifically, the photoionization cross sections for some levels were taken from [58]. For the six lower levels, we used the collision rates with hydrogen atoms according to [59]. The oscillator strengths for the two infrared lines 11,769.64 and 11,772.84 Å were taken from [60], and for the remaining studied lines, from [40]. For the 11,769.64, 11,772.84, 12,432.27 and 12,522.13 Å lines, the damping parameters were taken from [61]. The spectra of 40 stars observed with the GIANO spectrograph at the 3.5 m Telescopio Nazionale Galileo were analyzed using this modified potassium atomic model, and some practical recommendations were provided. It was shown that, of all the lines studied, the non-LTE effects are not negligible for the following lines: 11,769.64, 11,772.84, 12,432.27 and 12,522.13 Å. While the lines 15,163.07, 15,163.07 and 15,168.38 Å can be analyzed under an LTE condition in the specified temperature range. As an example, Figure 6 shows the agreement between the observed and non-LTE profiles of two infrared lines for HD 114174 ( K, [Fe/H] = dex).
Figure 6.
Profile fit for two infrared K I lines in the spectrum of HD 114174 ([Fe/H] = dex). Observed spectrum—open circles, non-LTE profile—continuous line, LTE profile—dashed line (non-LTE and LTE profiles are calculated with the same potassium abundance) [50].
3.2. Copper
Copper (), like potassium, has two stable isotopes: and (the Solar System isotope ratio is ≈2.24). Given the early Galactic chemical evolution, copper is a challenging element. Determination of the copper abundance in stars of various populations has revealed an unusual pattern in the distribution of copper abundance in the low-metallicity regime: as the metallicity of stars decreases, their relative-to-iron ratio [Cu/Fe] also decreases. Several explanations for this unexpected pattern have been proposed based on nucleosynthesis data obtained from various stars. These include explosive nucleosynthesis in massive stars (the progenitors of Type II supernovae and hypernovae), nucleosynthesis in lower-mass stars such as Type I supernovae, and nucleosynthesis in asymptotic giant branch stars of various masses.
As expected, the following processes leading to the formation of copper nuclei can occur: the s- and r-processes (respectively, slow and rapid capture of free neutrons by seed nuclei). Since copper nuclei can originate in sources of different masses, their efficiency varies at different stages of the Galactic evolution. Clearly, in the early stages of the Galaxy evolution, massive stars must have been the primary cosmic suppliers of copper. In these stars, copper nuclei can form through slow and rapid neutron capture during phases of helium, carbon and neon burning in hydrostatic equilibrium. The necessary component of these reactions, namely, free neutrons, is produced in reactions between nuclei of the neon isotope and -particles. Recently, much discussion has focused on whether copper nuclei can be effectively formed in the -rich freeze out process during the silicon explosive burning in the Type II supernovae and hypernovae. Since the main source of copper in the early Galaxy should be massive stars (exploding as supernovae and hypernovae), when the metallicity [Fe/H] was less than dex, the question arises: why is the copper abundance (in particular, [Cu/Fe]) so low in old low-metallicity stars that have survived to the present day due to their low masses? Such low abundance has been obtained in a number of studies published in recent decades. The results of LTE copper abundance determinations published before 2004 were collected and discussed in the paper [62]. The available relative-to-iron [Cu/Fe] data show a gradual decrease with decreasing metallicity from approximately zero dex at [Fe/H] dex to dex at [Fe/H] dex. Later, ref. [63] used the LTE approximation to determine the copper abundance in several extremely metal-poor giants ([Fe/H] in the range from to dex). Near-UV resonance lines of Cu I were used. For this metallicity range, the authors determined an average copper abundance [Cu/Fe] dex.
3.2.1. The Problem of LTE Copper Abundance in Metal-Poor Stars
Clear evidence that there may be inaccuracies in copper abundance inferred from Cu I lines can be found in a paper published by [64]. The authors analyzed neutral and ionized copper lines in a sample of six metal-poor stars (iron abundance ranges from approximately to dex). The copper lines in the visible, near-UV and far-UV parts of the spectrum were analyzed. The main result for the copper abundance was the following: for stars with metallicity less than dex, the difference in the copper abundance inferred from the Cu II lines was dex larger than the abundance derived from the Cu I lines. This provided clear evidence that the Cu I lines are strongly affected by non-LTE effects in the low-metallicity regime. Recently, [65] published LTE results on the copper abundance in 37 main-sequence (turn-off) very metal-poor stars ([Fe/H] less than dex). The authors showed that, in this metallicity domain, [Cu/Fe] values are scattered in the range from to dex.
3.2.2. Pioneereing Non-LTE Studies of Copper in Metal-Poor Halo Stars
A new approach to solving the copper abundance problem arose from the analysis of copper lines within the non-LTE approximation. The first attempt to apply the copper atomic model to analyze the copper lines in the solar atmosphere was made by [66]. Their model consisted of 96 terms of Cu I and the ground state of Cu II. The authors indicated that the main non-LTE effect that influences the neutral copper is the overionization by the ultraviolet radiation, although, for the Sun, the non-LTE abundance correction is very small.
The first attempts to determine the copper abundance in the metal-poor stars were undertaken by [53,67]. The former determined the copper abundance in stars with metallicities up to ≈ dex, while the latter presented the copper abundance results in four metal-poor stars in the [Fe/H] range from to dex. The authors of both papers note an increase in the difference between the non-LTE and LTE copper abundances with decreasing metallicity.
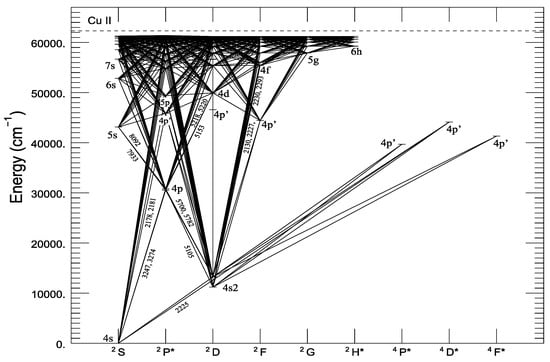
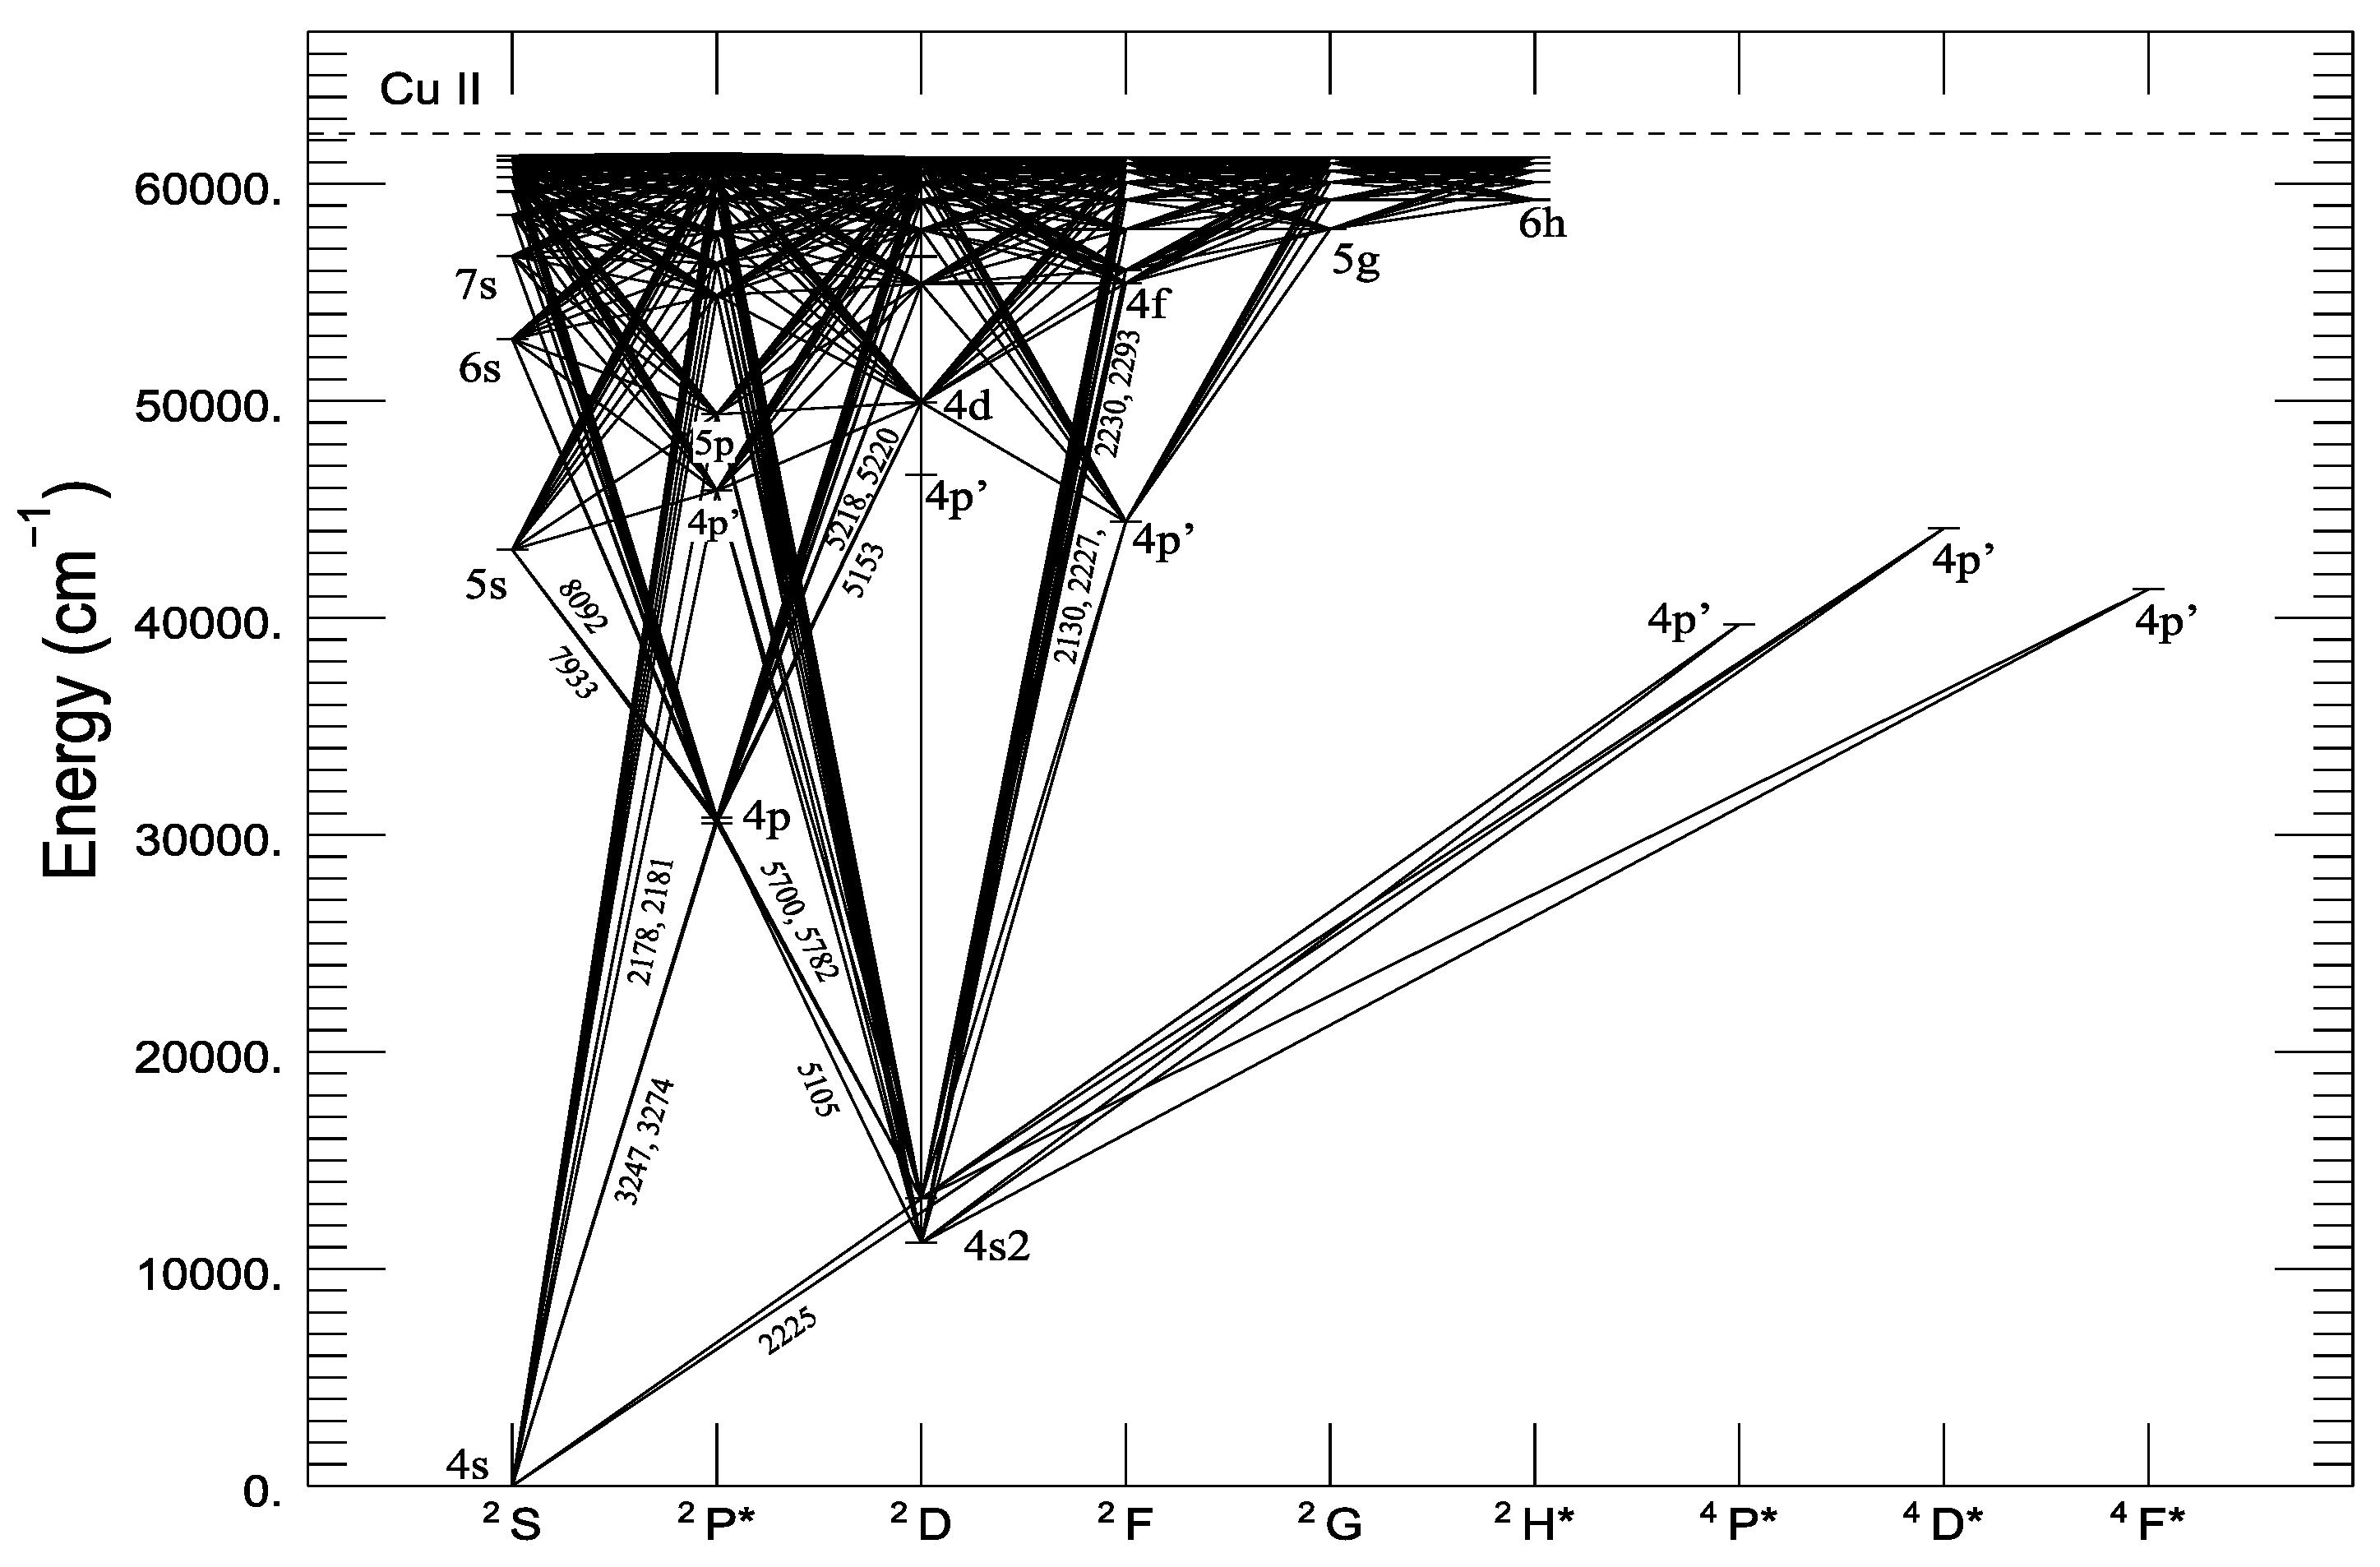
Later, Andrievsky et al. [68] developed the copper atomic model for the non-LTE analysis. In this model, the authors used 130 energy levels (116 levels of Cu I and 14 levels of Cu II). The atomic level parameters were taken from [69,70]. Data from the NIST database were also used. Each multiplet was considered as a single term. The fine structure was taken into account for the following levels: 4s2 2D, 4p 2Po and 4d 2D, which are tightly coupled with the most important transitions in the Cu I atom. In this case, the fine splitting is very important, since, for example, such splitting for the 2D term exceeds 0.25 eV. The highest energy level for which the radiative and collision transitions are taken into account has an ionization potential of 0.11 eV. This value corresponds to an electronic temperature of approximately 1300 K, meaning that the coupling between the excited levels and continuum is adequately described. Radiative transitions between the first 59 levels of Cu I and ground level of Cu II were considered. The populations of other levels were taken into account only for solving the particle number equation. All 486 bound–bound transitions were considered in detail. For each transition, the Stark and van der Waals effects, as well as the influence of microturbulent velocity were taken into account. To adequately reproduce the radiative rates of several significant ultraviolet transitions from 2S and 2D levels, 100 to 150 frequency points were calculated. For the remaining line profiles, only 30 frequency points were used. The photoionization cross sections were taken from [69]. For all bound–bound transitions, the oscillator strengths were compared to those from the NIST data base. In the absence of values, theoretically calculated values from [69] were used. The collision ionization rates were calculated using the Seaton’s formula ([49]) with threshold photoionization cross section from [69]. Collision excitations by electrons were calculated with the help of van Regemorter’s formula [46]. Collision rates for forbidden transitions were calculated using Allen’s formula ([47]) with an effective collision strength of 1. For 30 transitions between low-excited levels, the collision rates calculated by O’Mullane and made available through the Atomic Data and Analysis Structure (ADAS, [71]) were used. Inelastic collisions with hydrogen atoms were described with Drawin’s formula ([10], adapted for astrophysical use by [11]). The Grotrian diagram of the developed Cu I atomic model is presented in Figure 7.
Figure 7.
Grotrian diagram for Cu I atom [68].
It should be noted that since developing and applying the first version of our model to analyze copper lines in the spectra of metal-poor stars, we have made several attempts to improve it by incorporating newly available atomic data. This particularly concerns the collision rates of copper atoms with hydrogen atoms (quantum-mechanical rate coefficients from [72]). Our preliminary (unpublished) test calculations using these data showed that our previous results remain qualitatively unchanged.
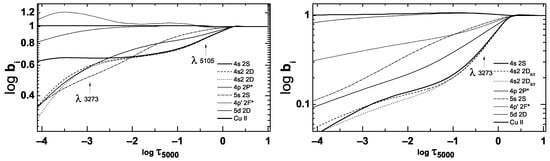
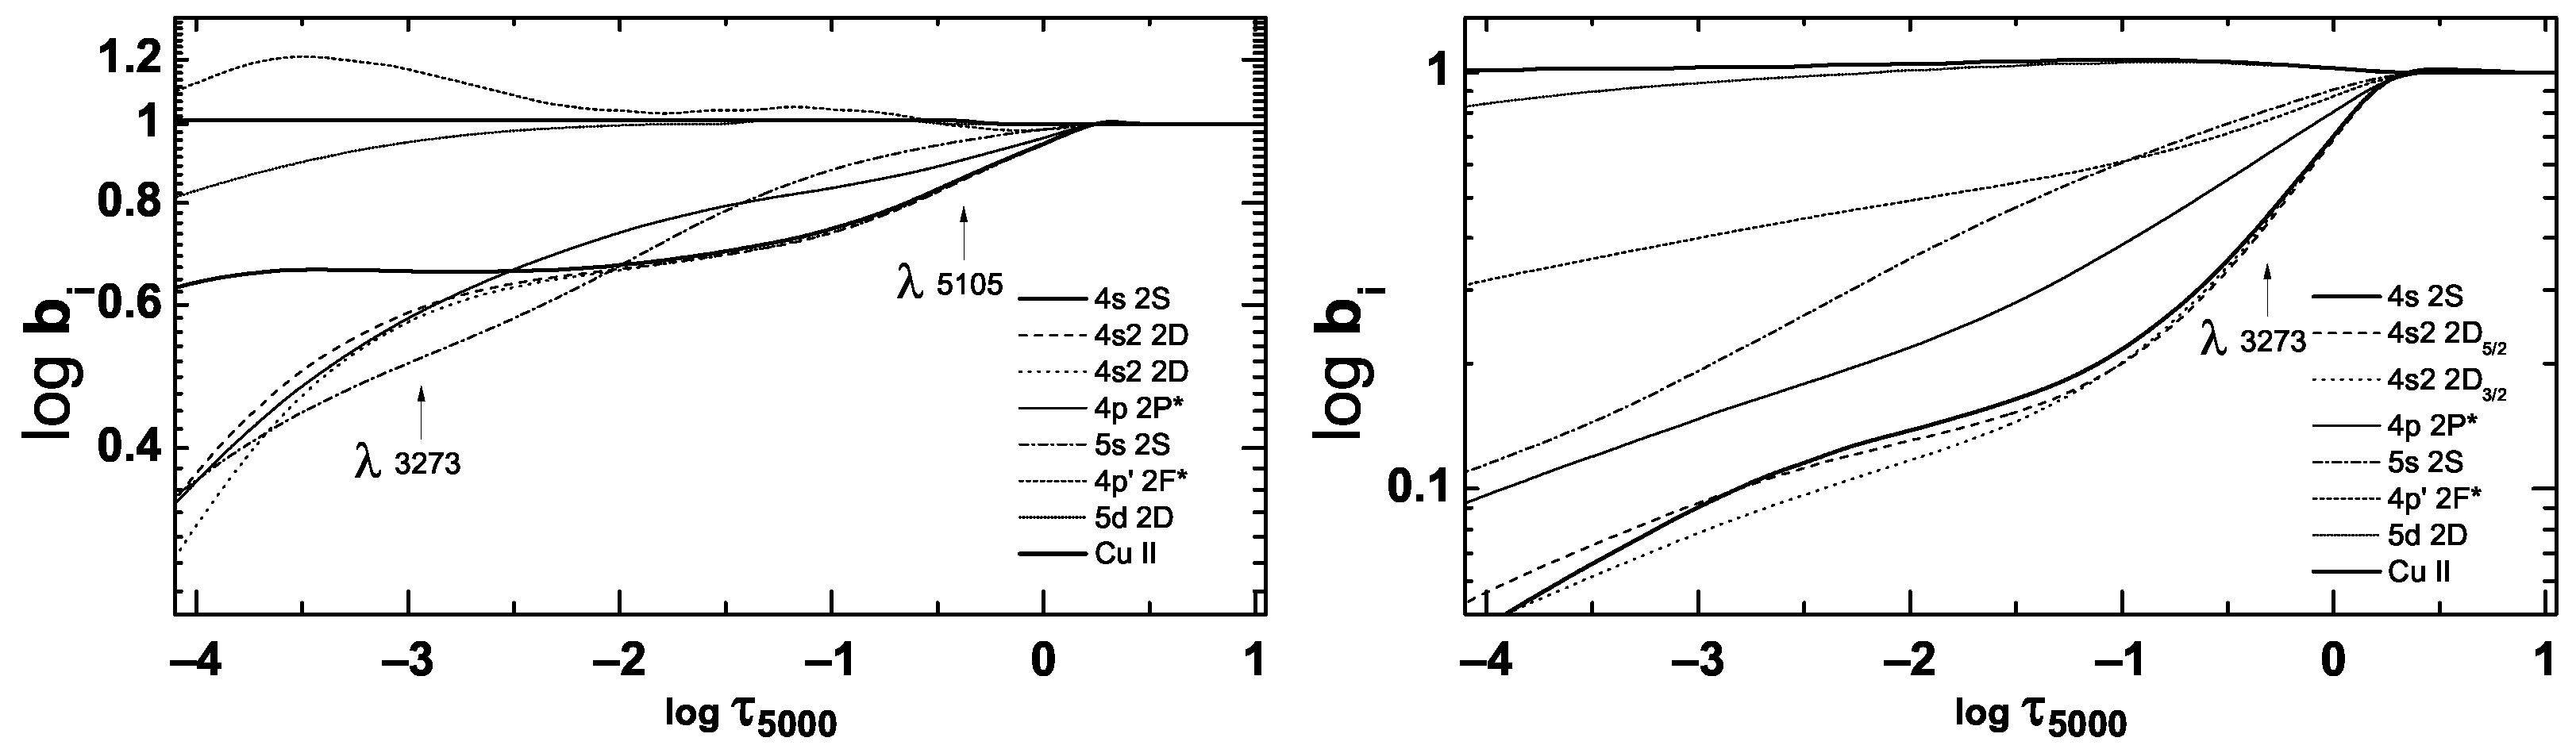
Since strong Cu I lines are formed in the upper atmosphere layers, it is appropriate to use a combination of the ATLAS solar model atmosphere of [6] with the chromosphere model from the VAL-C model ([73]) and the corresponding microturbulent velocity distribution. To further test our atomic model, we also used a simpler case: the spectra of two stars—Procyon and HD 140283 ([Fe/H] = dex)—analyzed using standard atmosphere models. The distributions of b-factors in the atmospheres of these stars are shown in Figure 8.
Figure 8.
Departure coefficients b distribution in the Procyon atmosphere (left panel) and in the atmosphere of the metal-poor star HD 140283 (right panel). The optical depths of the line core formation are indicated by arrows [68].
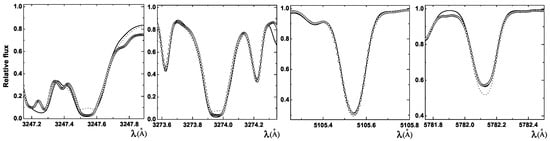
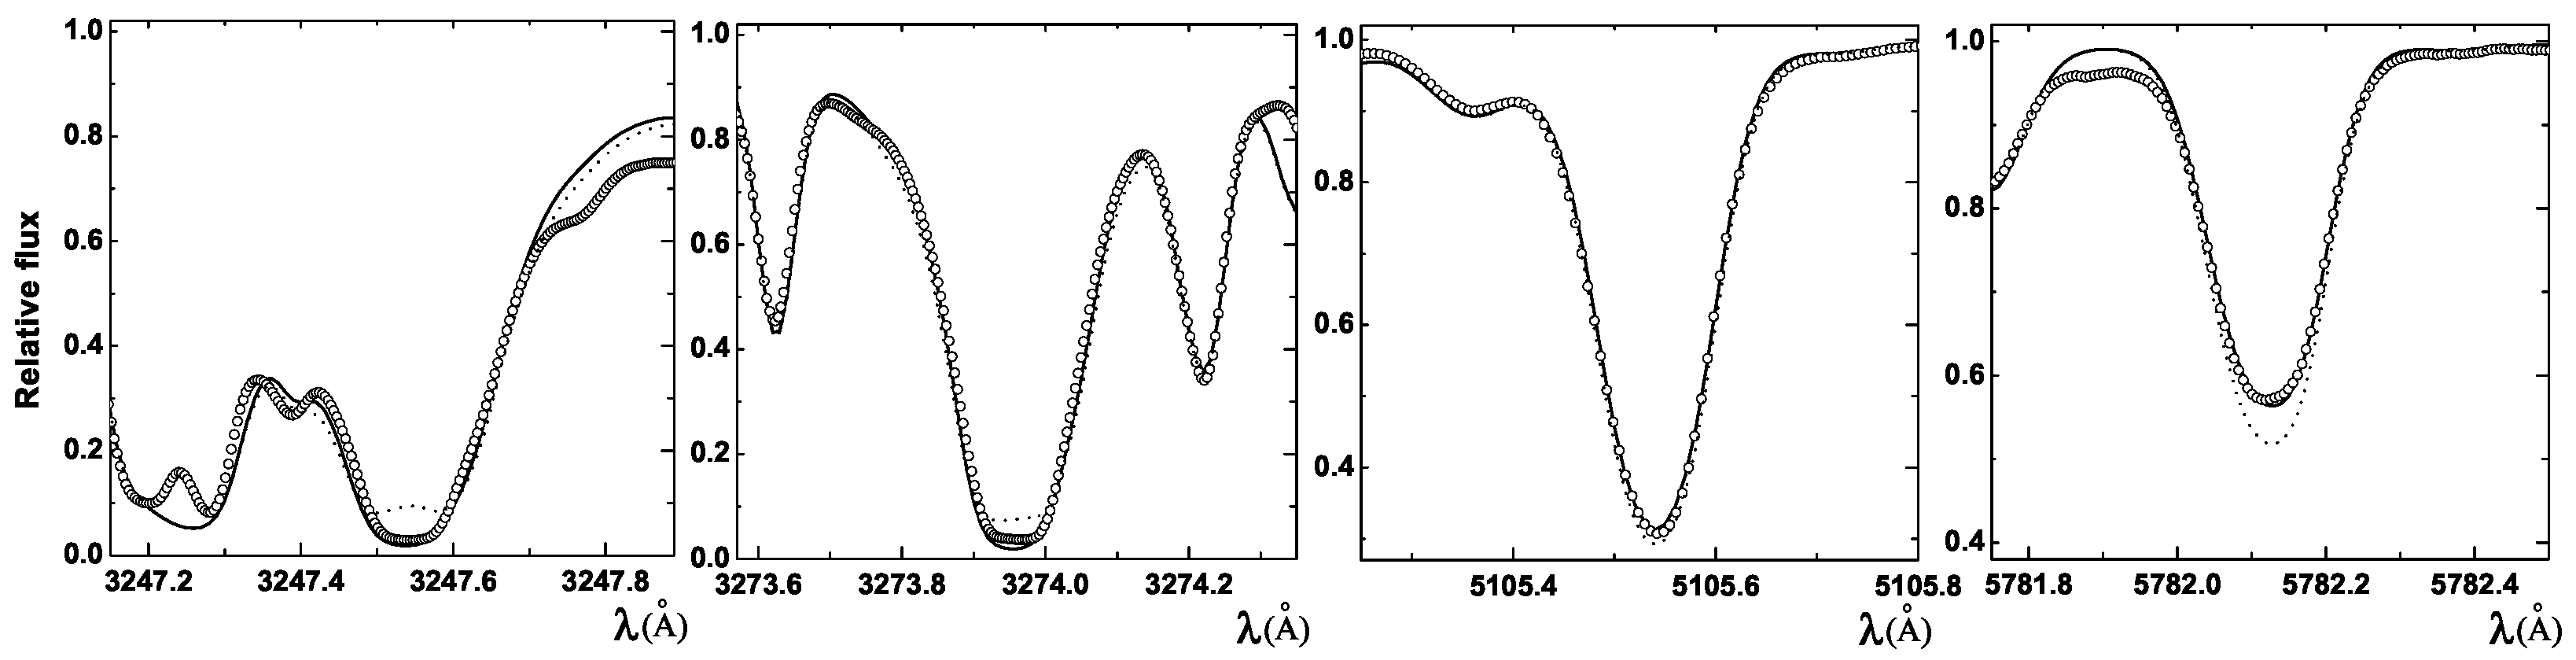
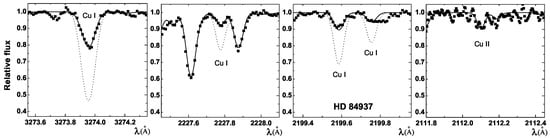
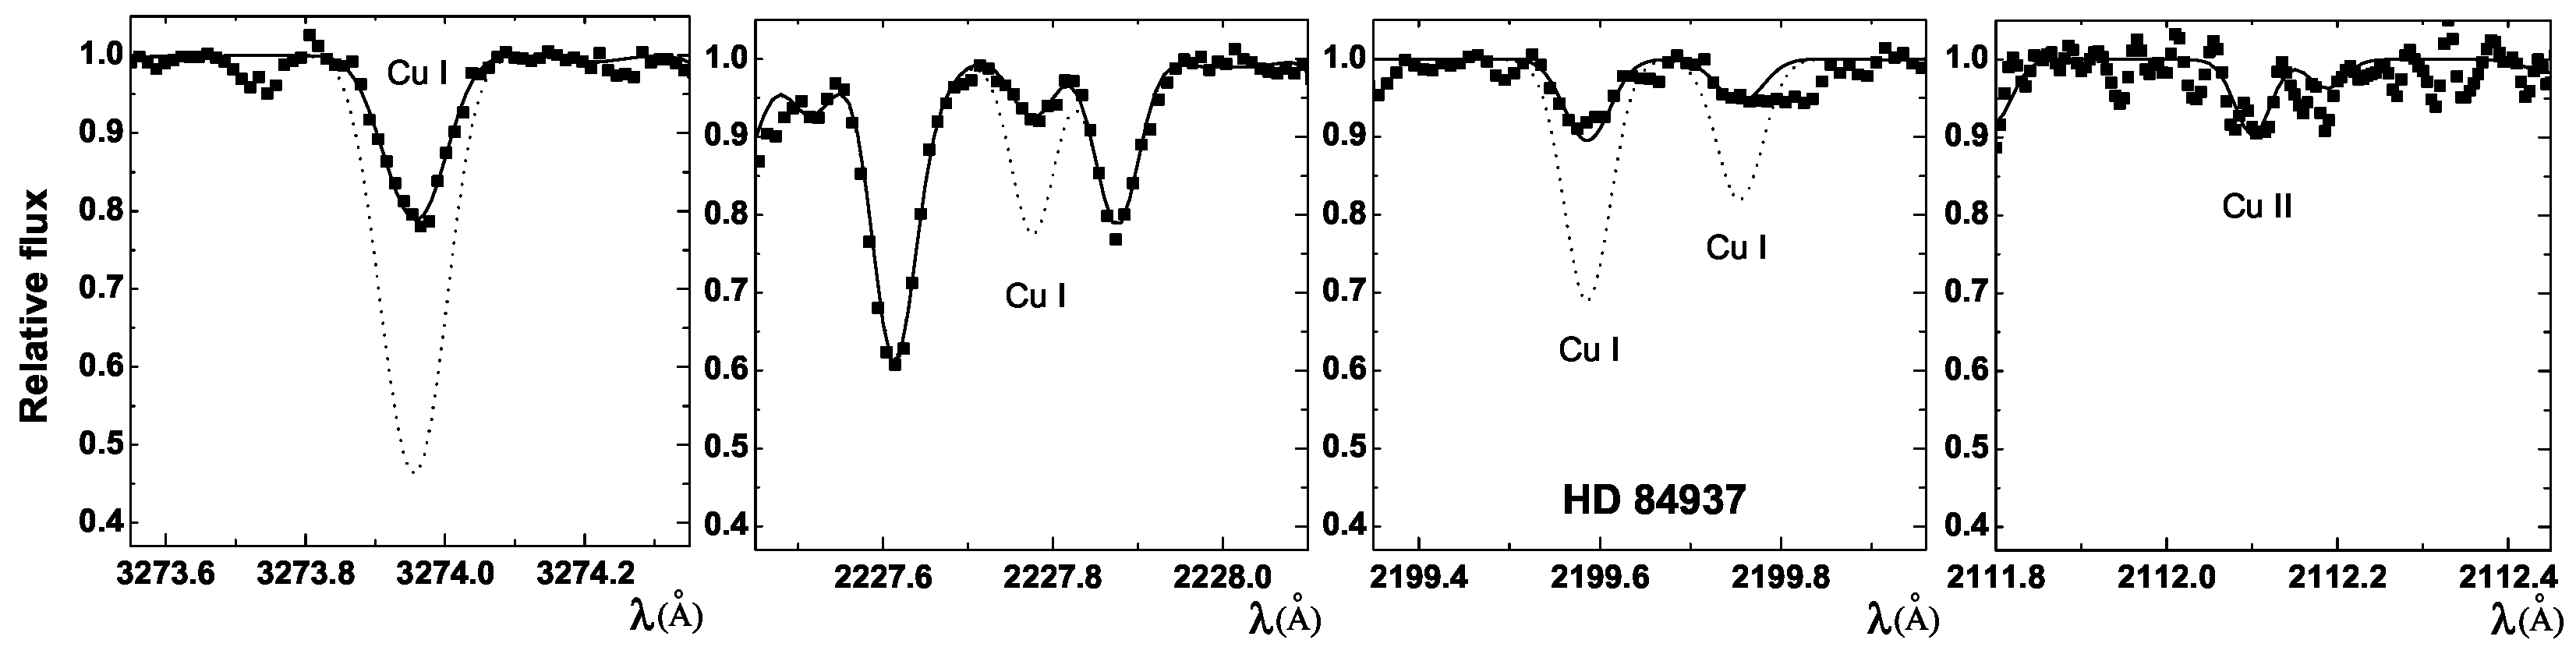
For the Sun, line profiles were calculated assuming a copper abundance in meteorites, (Cu/H) = 4.25 dex ([74]). To reproduce copper lines in the solar spectrum, the collision rates with hydrogen atoms without any correcting factor were used. This avoids a significant imbalance in the calculated line intensities, which would immediately lead to an artificial overestimation of the copper abundance in the Sun. The observed line profiles were taken from the solar flux spectrum ([75]). The agreement between some observed solar copper line profiles and calculated profiles is shown in Figure 9. Figure 10 shows the fit between some UV line profiles in observed spectrum of HD 84937 ([Fe/H] = ) and theoretical profiles.
Figure 9.
Copper line profiles in the spectrum of the Sun. The observed spectrum—open circles, non-LTE spectrum—continuous line, LTE spectrum calculated with the same abundance that was used for non-LTE spectrum generation—dotted line [68].
Figure 10.
Copper line profiles in the spectrum of HD 84937. The observed spectrum—filled squares, non-LTE spectrum—continuous line, LTE spectrum calculated with the same abundance that was used for non-LTE spectrum generation—dotted line [68].
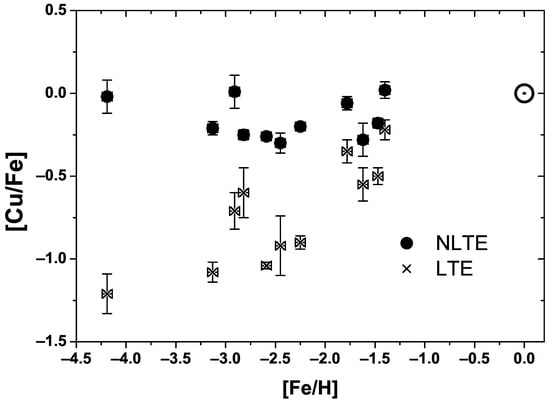
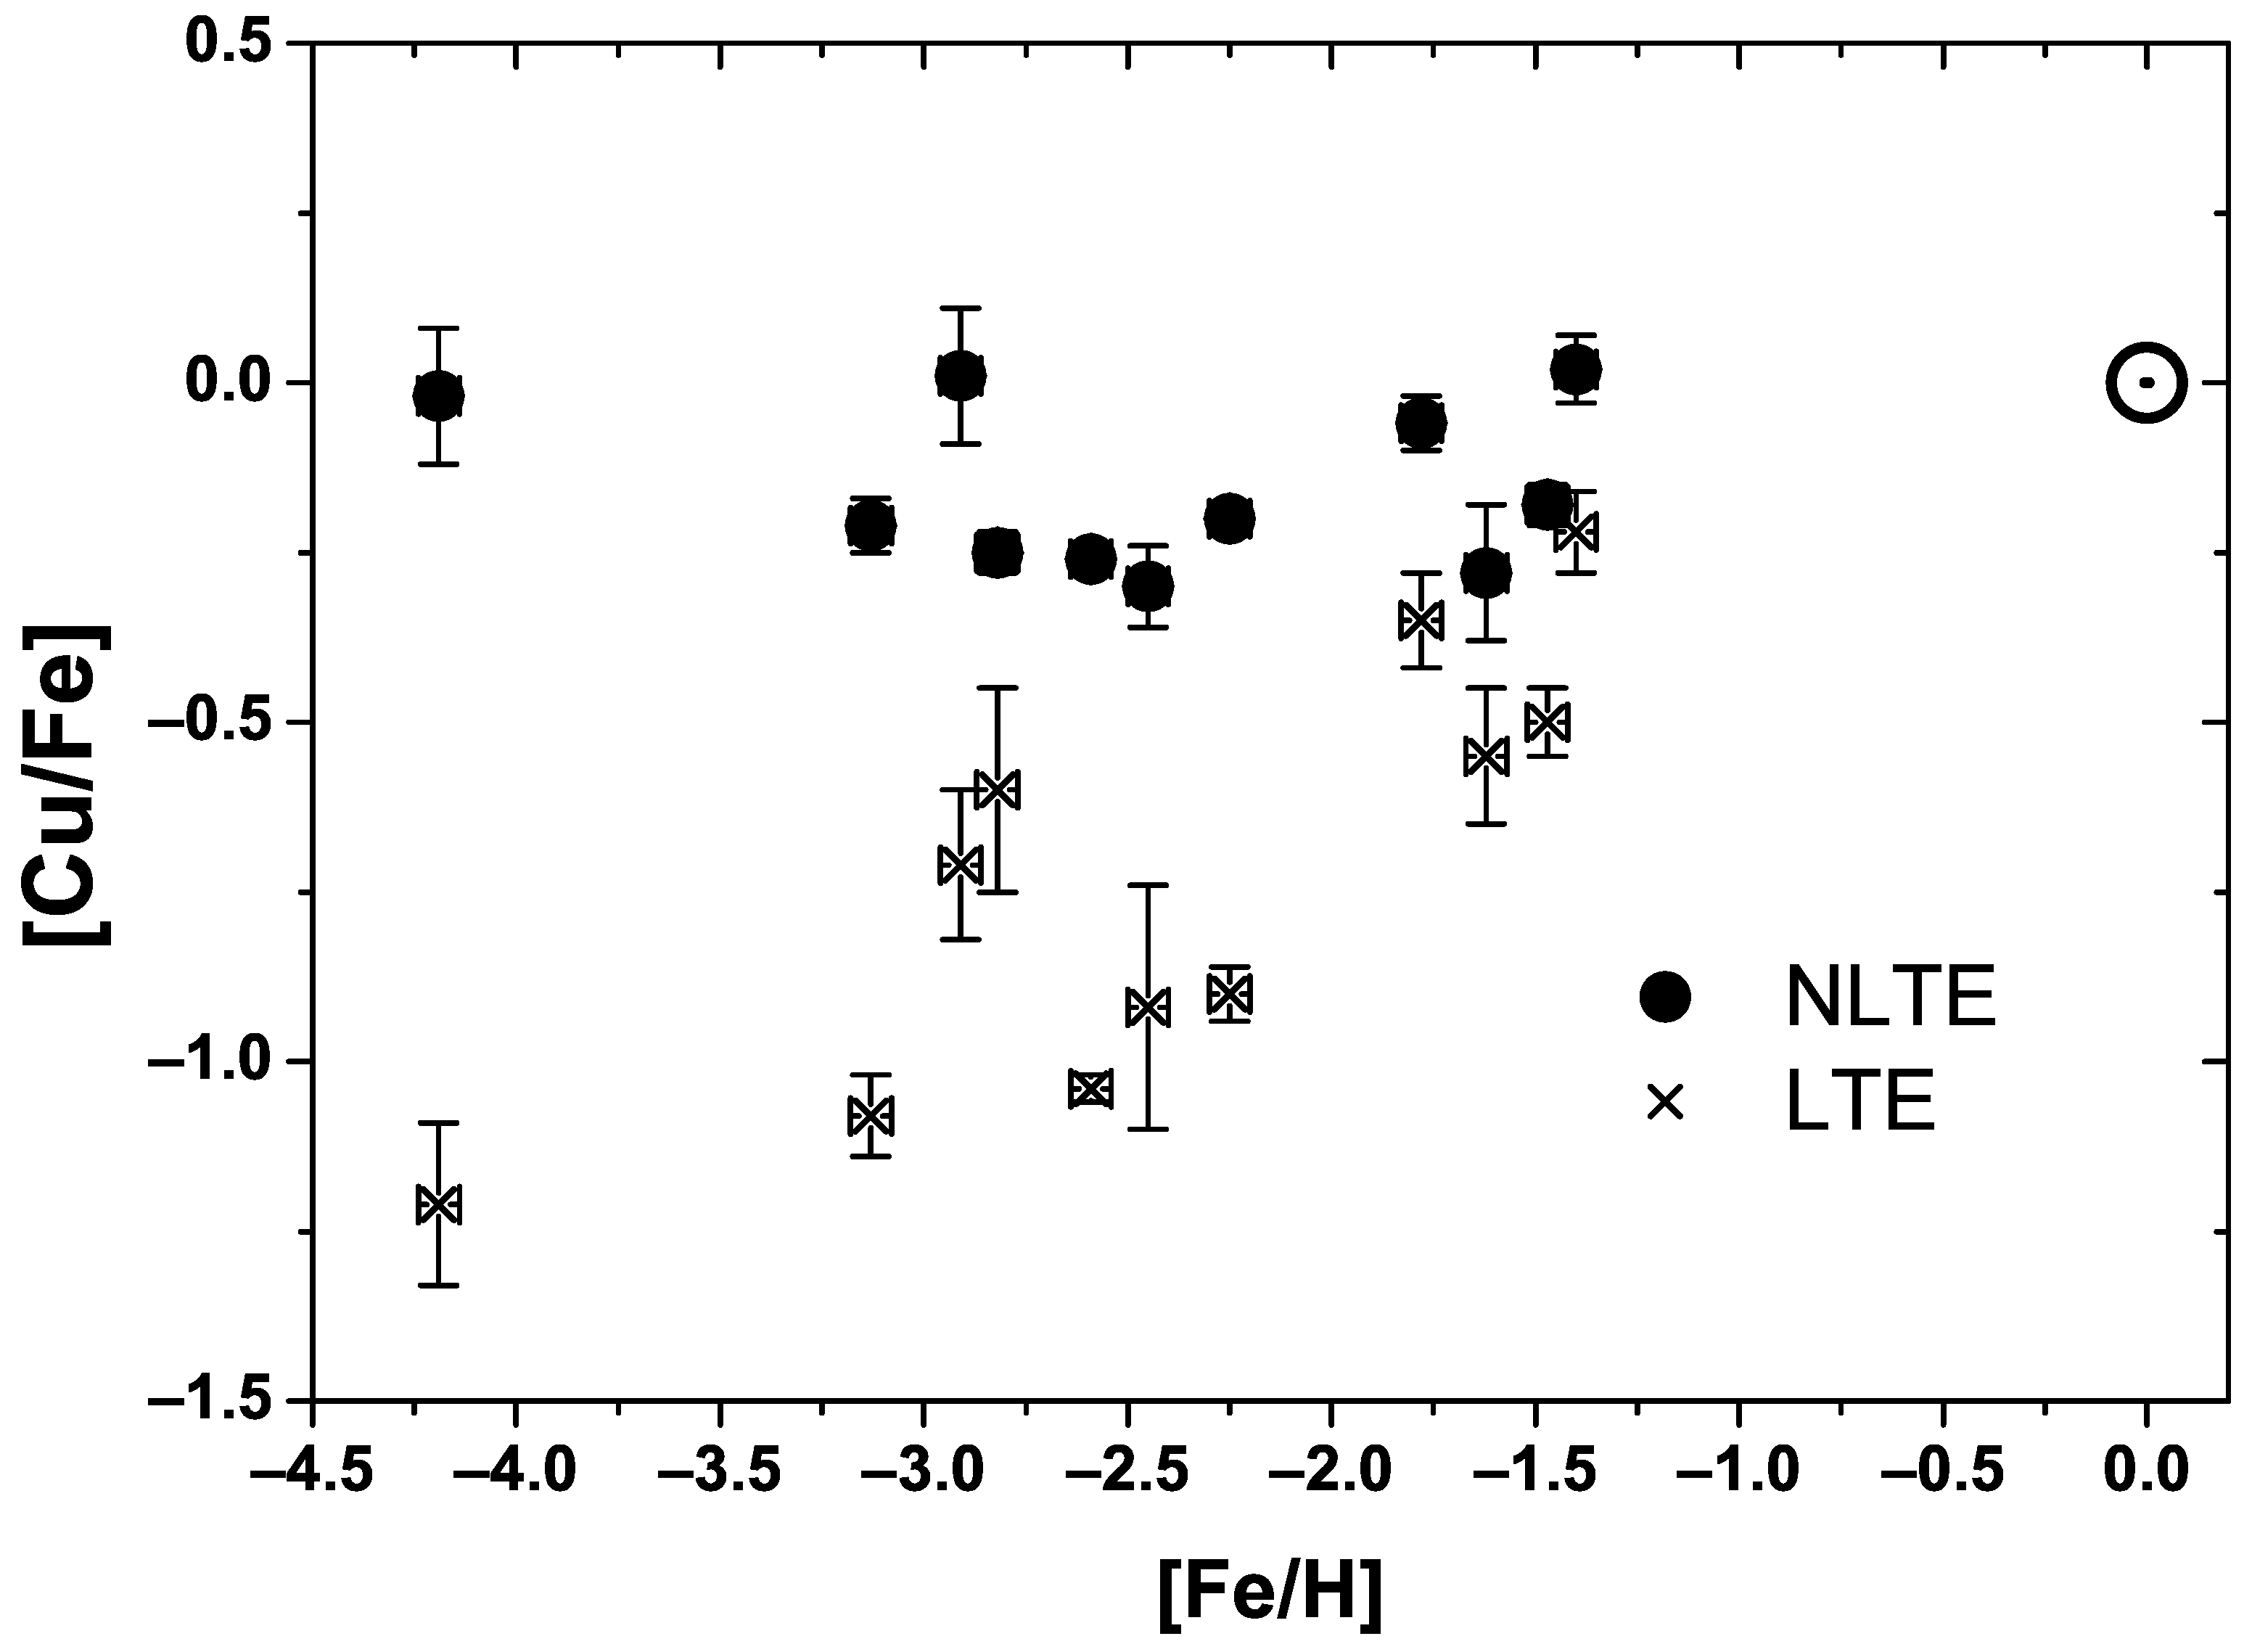
It is important to stress again that non-LTE effects cause the overionization of neutral copper atoms, reducing the line absorption and weakening the Cu I lines. This means that the LTE copper abundance is underestimated. The non-LTE correction, namely non-LTE (abundance)–LTE (abundance), is positive. The discrepancy between the non-LTE and LTE abundances progressively increases toward the low-metallicity regime. It is demonstrated in Figure 11. This conclusion, made by Andrievsky et al. [68], was based on an analysis of halo stars with [Fe/H] ranging from to dex (this range includes metal-poor, very metal-poor, extremely metal-poor and ultra metal-poor stars).
Figure 11.
Non-LTE and LTE copper abundances as a function of [Fe/H]. Copper abundance in the Sun is denoted as ⊙ [68].
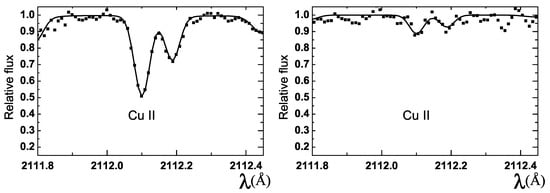
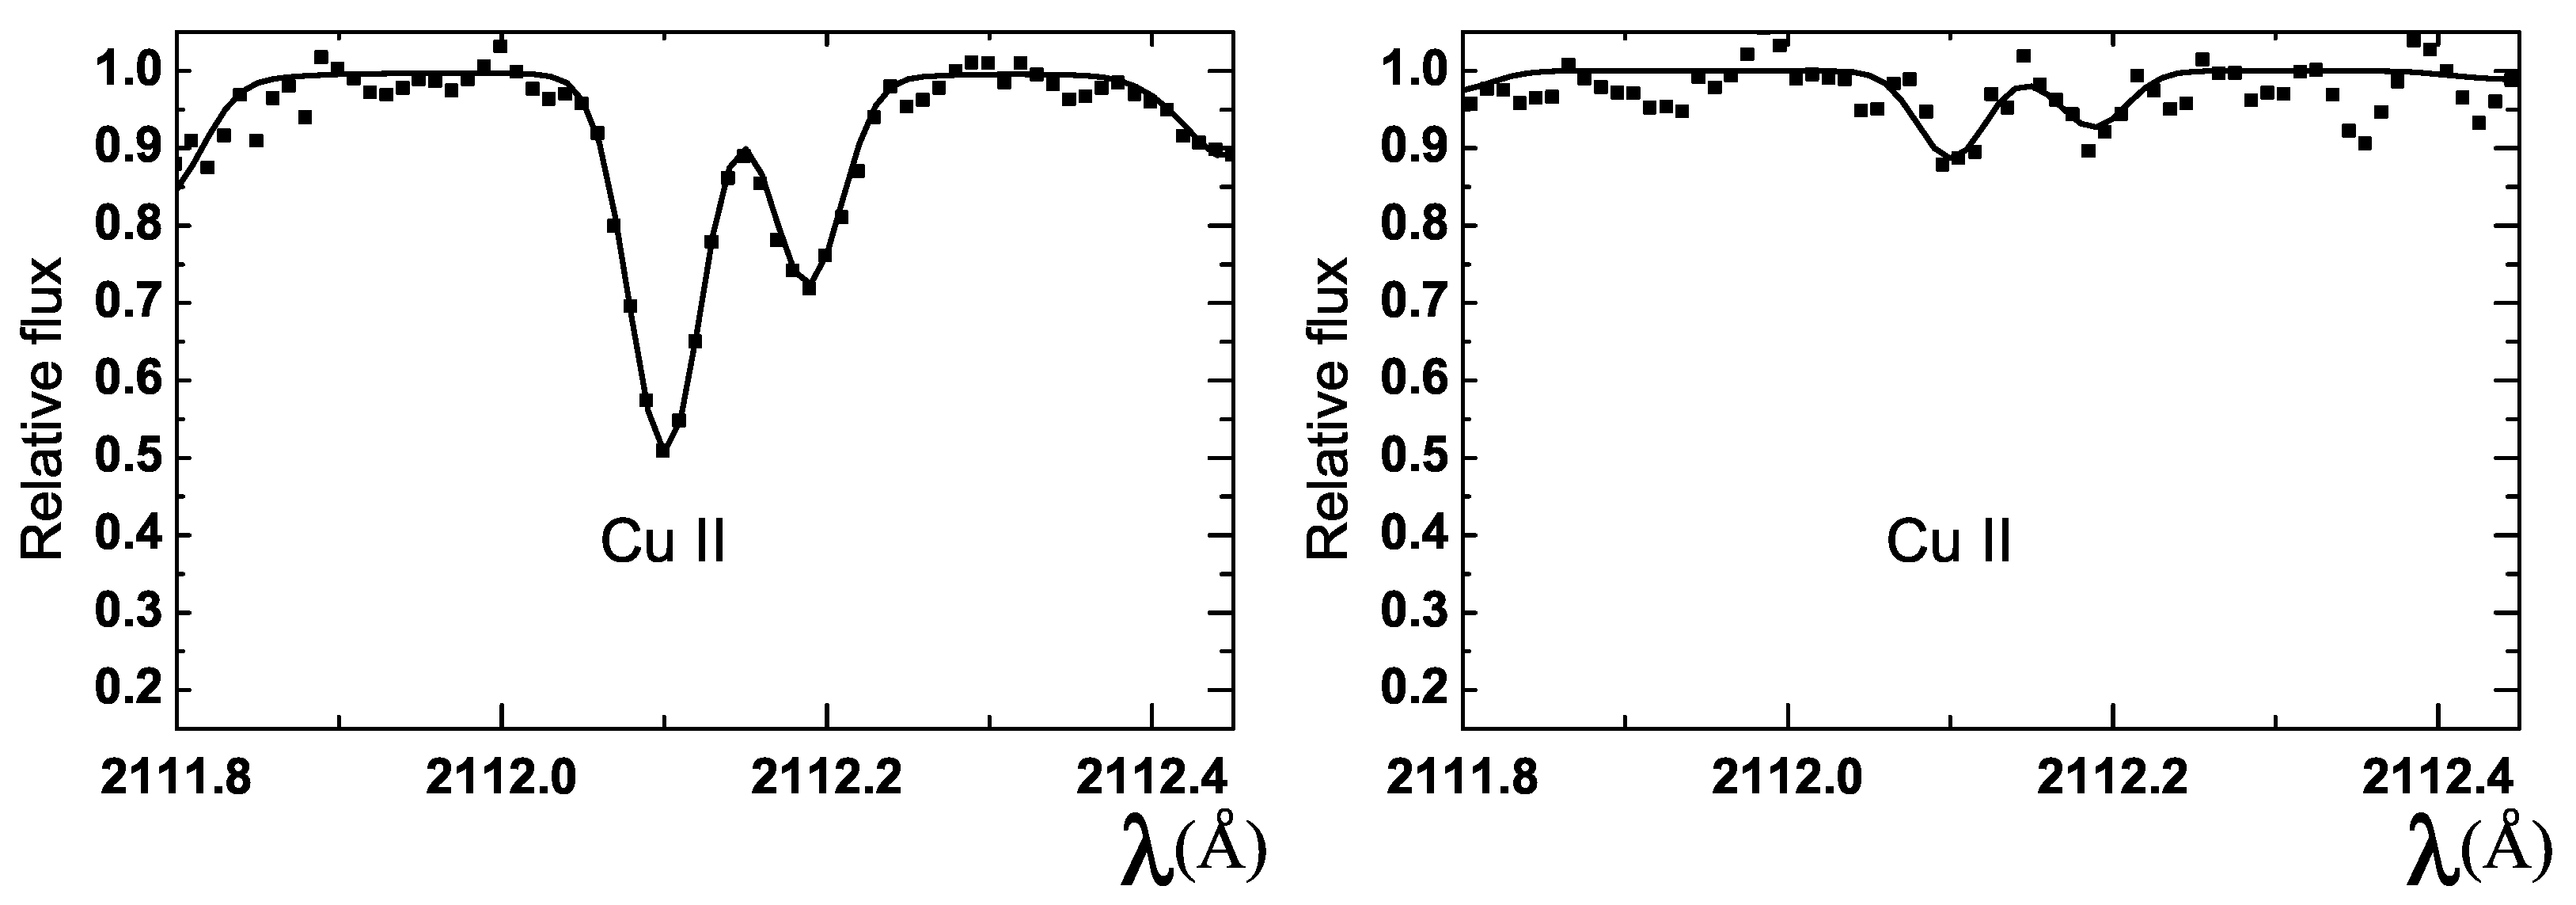
A similar conclusion was reached in Korotin et al. [76]. The authors analyzed copper lines in a sample of dwarfs with temperatures of 5800–6100 K. In addition to neutral copper lines, they examined eight ultraviolet lines of ionized copper. The first ionization potential of copper is approximately 7.73 eV. In the claimed range of effective temperatures, weak lines of ionized copper are formed in the deep atmosphere layers, where the Cu II energy level populations can be described by the Boltzmann distribution. Figure 12 shows examples of the Cu II lines in the spectra of program stars HD 94028 and HD 140283. The authors obtained excellent agreement between the abundances determined from the lines of two ionization stages.
Figure 12.
Cu II line profile in the spectrum of metal-poor stars HD 94028 (left panel) and HD 140283 (right panel). Observed spectrum—filled squares, non-LTE spectrum—continuous line.
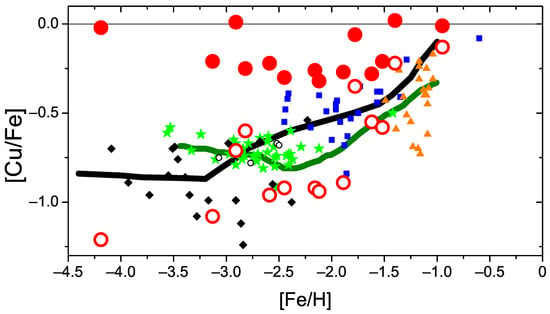
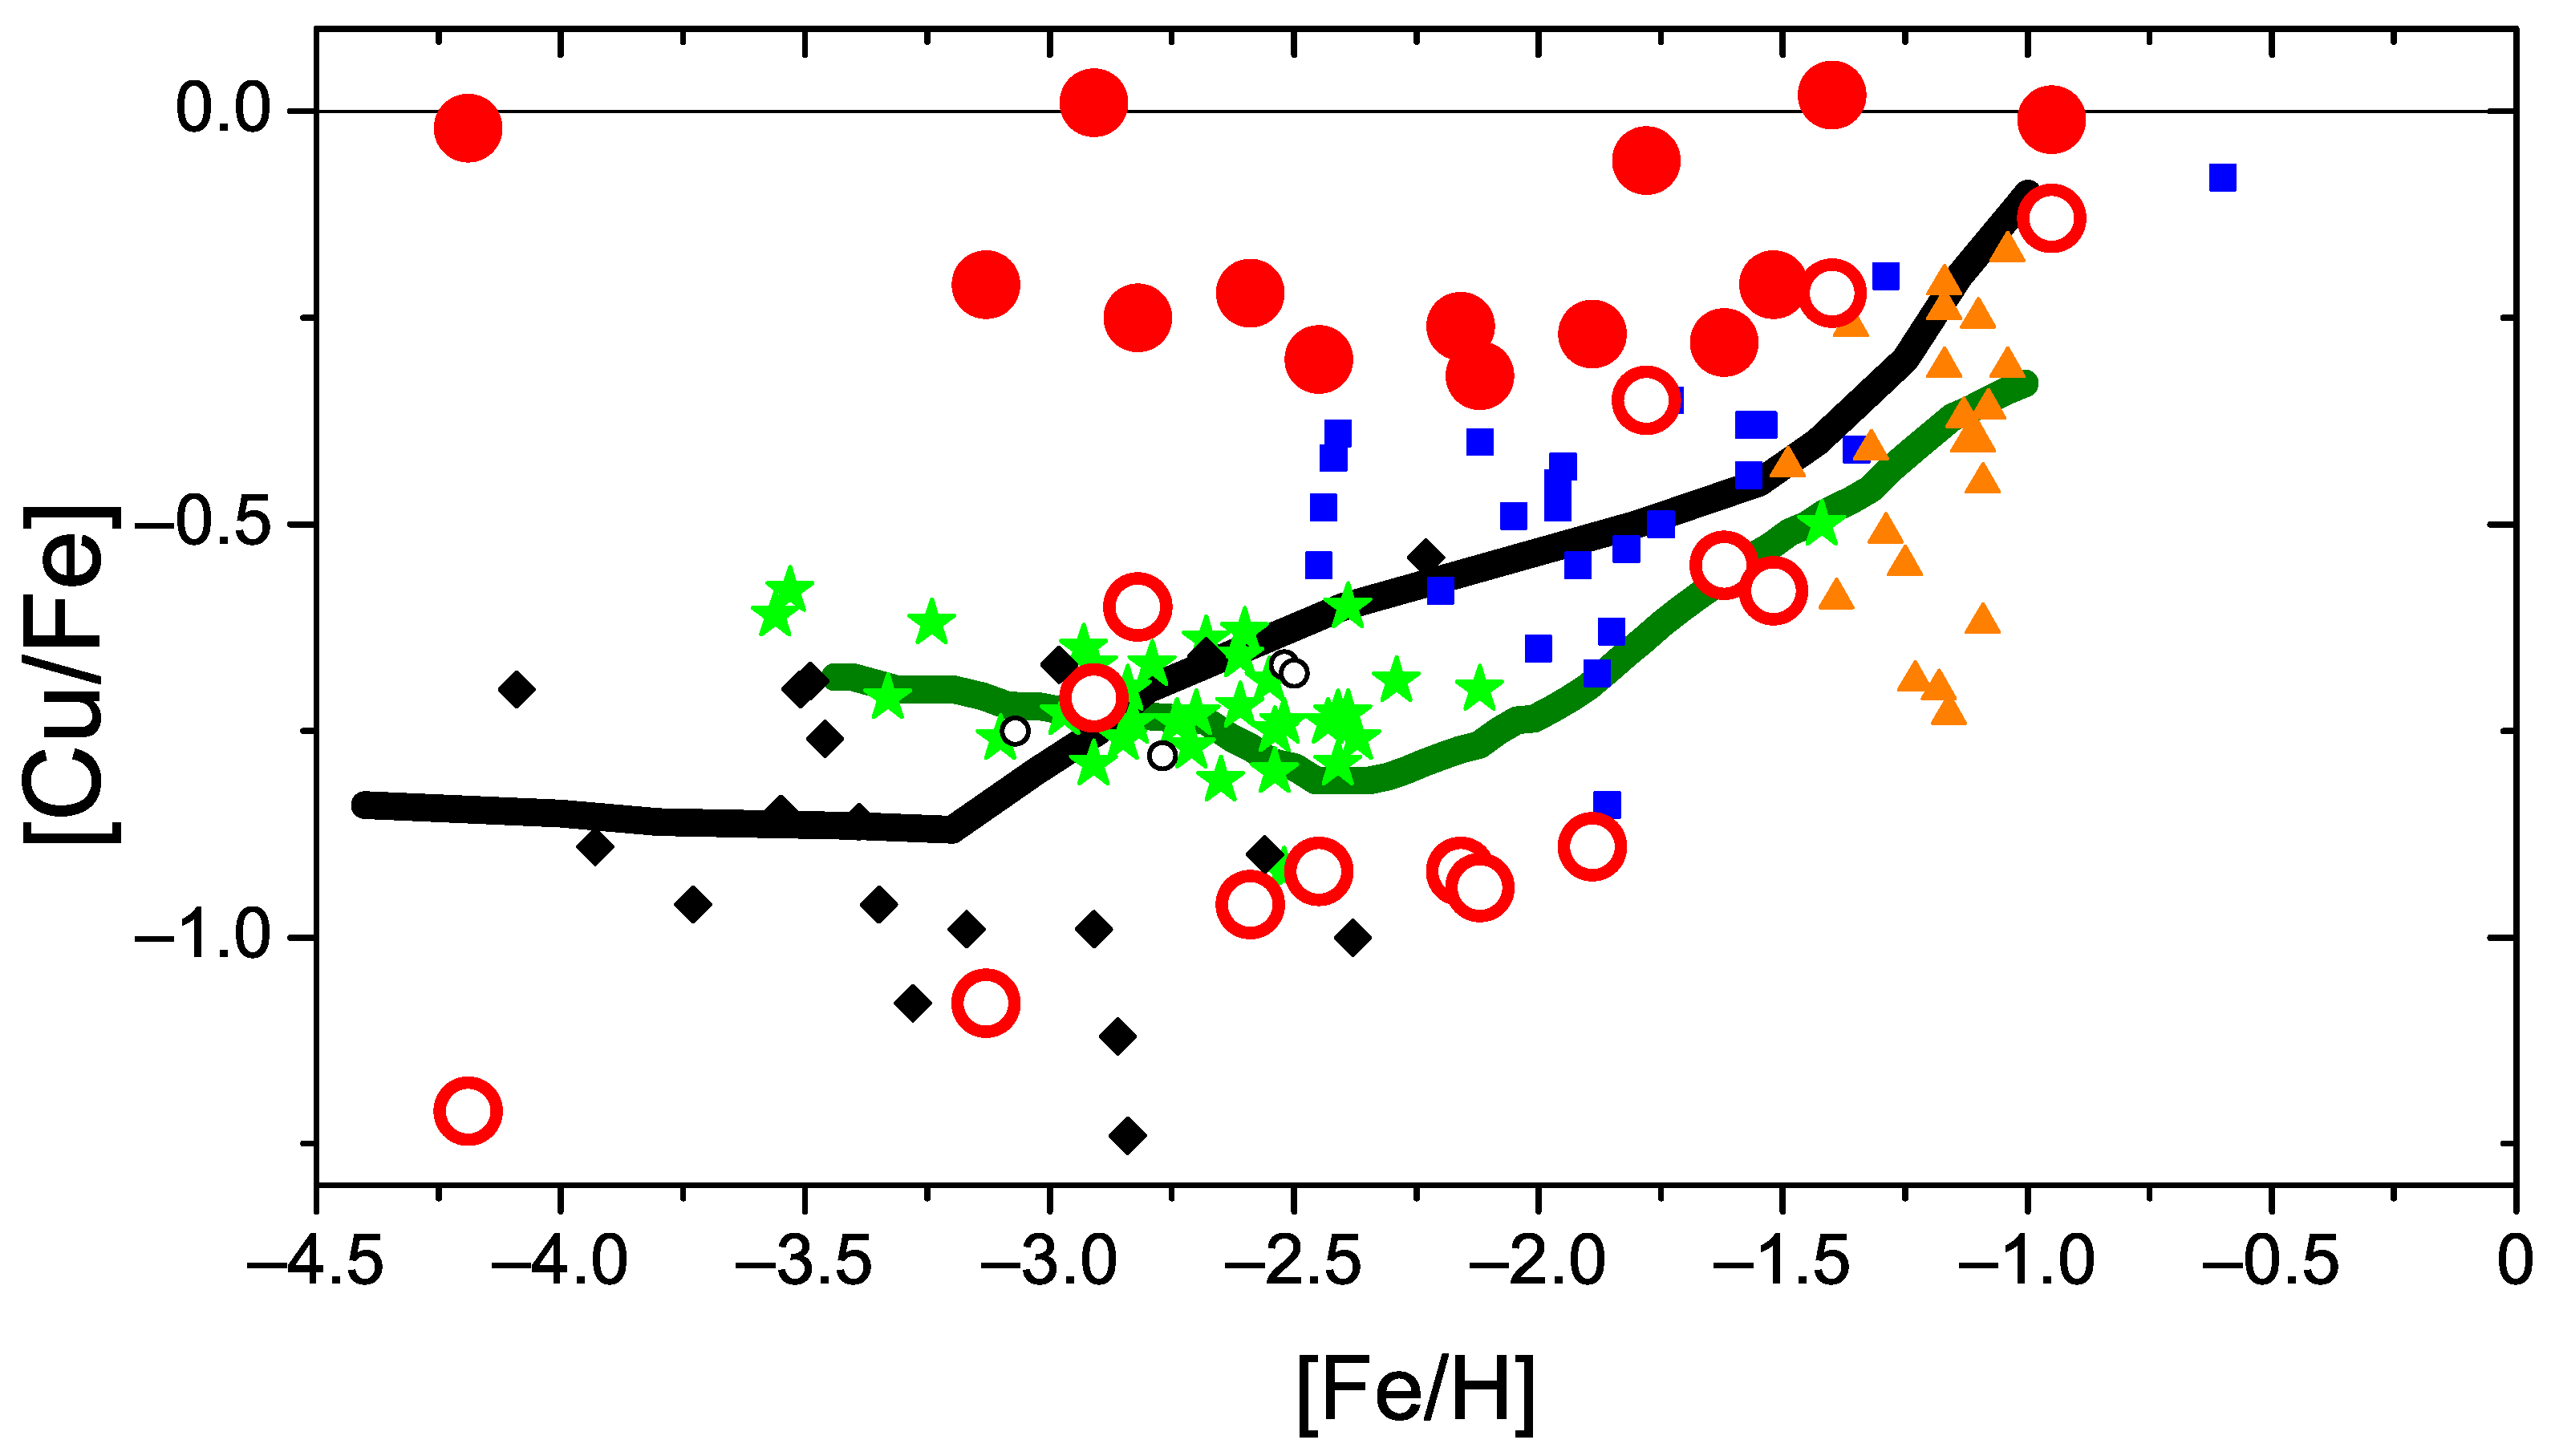
To further emphasize the importance of the two pioneering papers discussed in this section, which described the copper atomic model and its application to determining the abundance of this elements in the first stars of the Galaxy, in Figure 13 we reproduce the literature LTE data on the copper abundance in stars with metallicity below dex, along with the results of our non-LTE determination and the predictions of the Galactic chemical evolution model for copper. It is obvious that existing models of the copper Galactic evolution are unable to explain the abundance result in the domain of the old metal-poor stars. This example clearly demonstrates that, without properly accounting for the results of the non-LTE copper abundance determination, the presented Galactic chemodynamic models actually overlook an important source of copper nucleosynthesis in the Cosmos.
Figure 13.
Relative-to-iron copper abundance data as a function of metallicity for metal-poor stars. LTE data: Ref. [77]—small open circles, ref. [78]—diamonds, ref. [67]—triangles, ref. [79]—squares, ref. [65]—stars, refs. [68,76]—big red open circles. Non-LTE data: Refs. [68,76]—big red filled circles. Theoretical curves: [52]—olive solid line, [80]—black solid line.
3.2.3. New Perspectives for the Copper Research in Metal-Poor Stars
It is interesting to note that the nearly flat distribution of the relative copper abundance presented in Korotin et al. [76] exhibits a shallow dip visible in the metallicity region around [Fe/H] dex (Figure 13). A similar feature is observed in the compilative data on abundance distribution presented by [81]. These authors considered the effect of a new dataset on inelastic collisions of copper and hydrogen atoms on the derived copper non-LTE abundance and applied non-LTE corrections to the LTE copper abundance in stars previously analyzed by [65,67,76,79,82]. Using the new rate coefficients of inelastic collisions, the authors found significant differences with the results of previous calculations. Comparison of the LTE with non-LTE abundance data yields a striking result: the most metal-poor stars with [Fe/H] less than dex exhibit a copper abundance ratio [Cu/Fe] near solar or even supersolar. This discovery needs to be confirmed in future studies. If confirmed, it will have a decisive impact on our understanding of the Galactic chemical evolution of copper. A qualitatively similar conclusion was previously reached for one very metal-poor star studied by [83]. It should be noted that the authors used new copper–hydrogen collision rates from [72] to perform the non-LTE analysis of several metal-poor stars in the metallicity range from to dex and arrived at the following conclusions: the non-LTE effects are important for both the optical and ultraviolet lines of neutral copper. In the metallicity range from to dex (five studied metal-poor stars, Figure 5), the copper abundance decreases with metallicity decreasing, indicating secondary (metallicity-dependent) copper production. It should be noted that the statistics in this study are small and apparently insufficient to draw such a conclusion about the process of copper nuclei formation.
4. Discussion
Potassium resonance lines are significantly affected by non-LTE effects. The relative-to-iron potassium abundance determined in the LTE and non-LTE approximations often exhibits inconsistent behaviors, especially in the low-metallicity regime. A visual inspection of Figure 5 (upper panel) shows that the theoretical prediction of the potassium yield from rotating massive stars in the early Galaxy ([52]) diverges significantly from the observed LTE [K/Fe] abundance distribution in the low-metallicity domain, but the agreement is significantly better when non-LTE data are included (Figure 5, lower panel). However, this figure also indicates that an additional potassium source is still missing in the considered chemodynamical model of the early Galaxy.
As shown in previous considerations, the LTE copper abundance in the low-metallicity stars may provide incorrect evidence that copper behaves as a secondary element. The authors of [84] considered the origin of many chemical elements. Although copper was mentioned in their study, its abundance in old Galactic (halo) stars was not discussed, because the LTE abundance of this element was considered too low, and the theoretical predictions failed to explain such a low relative copper abundance [Cu/Fe]. For comparison with theoretical predictions, the authors used the copper abundance in the metal-poor star HD 84937 ([Fe/H] = ). This star was studied in detail by [85], who obtained a very low LTE value of [Cu/Fe] = dex. HD 84937 was also in the list of program stars in [68]. Non-LTE analysis of copper line profiles in the spectrum of this star revealed a copper abundance [Cu/Fe] = dex. Thus, taking into account the above, it can be argued that, from an astrophysical perspective, copper behaves like a primary chemical element. Its production in the early Galaxy is controlled by massive stars exploding as core-collapse supernovae and high-energy hypernovae. There is no need to propose special hypotheses to explain the low LTE abundance of this element in low-metallicity stars.
5. Summary
Now, taking into account new data on the non-LTE abundances of two odd-Z elements, potassium and copper, obtained in several studies, we can note that, in the low-metallicity regime, these elements appear to behave similarly. Old Galactic halo stars, over a wide metallicity range [Fe/H] from to dex, exhibit abundance ratios [El/Fe] quite close to the solar values. Applying the non-LTE approximation to the spectra of stars in this metallicity range reduces the inferred LTE potassium abundance and significantly increases the LTE copper abundance. This contrasts sharply with the previous view that copper was significantly underabundant in the early stages of the Galactic evolution.
Progress in the field of non-LTE analysis is developing rapidly. Several expert groups around the world are working on this topic. Models of many atoms and ions of various chemical elements are currently available for non-LTE analysis. There is no doubt that in the near future we will see new results on the non-LTE abundances of various chemical elements in stars of various types, which may in some aspects, improve or even change our understanding of the chemical evolution of the Universe.
Author Contributions
Conceptualization, S.M.A.; methodology, S.M.A. and S.A.K.; software, S.M.A. and S.A.K.; validation, S.M.A.; formal analysis, S.M.A. and S.A.K.; investigation, S.M.A.; resources, S.M.A. and S.A.K.; data curation, S.M.A. and S.A.K.; writing—original draft preparation, S.M.A.; writing—review and editing, S.M.A.; visualization, S.M.A. and S.A.K.; supervision, S.M.A.; project administration, S.M.A.; funding acquisition, none. All authors have read and agreed to the published version of the manuscript.
Funding
This research received no external funding.
Data Availability Statement
The data is available in a publicly accessible repository.
Acknowledgments
The authors would like to express their gratitude for the referees, whose numerous comments significantly improved the first version of our manuscript.
Conflicts of Interest
The authors declare no conflicts of interest.
References
- Schuler, S.C.; King, J.R.; Terndrup, D.M.; Pinsonneault, M.H.; Murray, N.; Hobbs, L.M. Oxygen from the λ7774 High-Excitation Triplet in Open Cluster Dwarfs: Hyades. Astrophys. J. 2006, 636, 432–444. [Google Scholar] [CrossRef] [Scilit]
- Schuler, S.C.; Hatzes, A.P.; King, J.R.; Kürster, M.; The, L.S. Hyades Oxygen Abundances from the λ6300 [O I] Line: The Giant-Dwarf Oxygen Discrepancy Revisited. Astron. J. 2006, 131, 1057–1073. [Google Scholar] [CrossRef] [Scilit]
- Andrievsky, S.M.; Korotin, S.A. The Origin of Copper in Cosmos. Azerbaijani Astron. J. 2025, 20, 15–20. [Google Scholar] [CrossRef] [Scilit]
- Iwamoto, K.; Mazzali, P.A.; Nomoto, K.; Umeda, H.; Nakamura, T.; Patat, F.; Danziger, I.J.; Young, T.R.; Suzuki, T.; Shigeyama, T.; et al. A hypernova model for the supernova associated with the γ-ray burst of 25 April 1998. Nature 1998, 395, 672–674. [Google Scholar] [CrossRef] [Scilit]
- Carlsson, M. A computer program for solving multi-level non-LTE radiative transferproblems in moving or static atmospheres. Upps. Astron. Obs. Rep. 1986, 33, 2+39+117. [Google Scholar]
- Castelli, F.; Kurucz, R.L. New Grids of ATLAS9 Model Atmospheres. In Proceedings of the Modelling of Stellar Atmospheres; Piskunov, N., Weiss, W.W., Gray, D.F., Eds.; Astronomical Society of the Pacific: San Francisco, CA, USA, 2003; Volume 210, p. A20. [Google Scholar]
- Korotin, S.A.; Andrievsky, S.M.; Luck, R.E. Oxygen abundances in early B-stars. Astron. Astrophys. 1999, 351, 168–176. [Google Scholar]
- Tsymbal, V. STARSP: A Software System For the Analysis of the Spectra of Normal Stars. In Proceedings of the M.A.S.S., Model Atmospheres and Spectrum Synthesis; Adelman, S.J., Kupka, F., Weiss, W.W., Eds.; Astronomical Society of the Pacific: San Francisco, CA, USA, 1996; Volume 108, p. 198. [Google Scholar]
- Ryabchikova, T.; Piskunov, N.; Kurucz, R.L.; Stempels, H.C.; Heiter, U.; Pakhomov, Y.; Barklem, P.S. A major upgrade of the VALD database. Phys. Scr. 2015, 90, 054005. [Google Scholar] [CrossRef] [Scilit]
- Drawin, H.W. Zur formelmäßigen Darstellung des Ionisierungsquerschnitts für den Atom-Atomstoß und über die Ionen-Elektronen-Rekombination im dichten Neutralgas. Z. Phys. 1968, 211, 404–417. [Google Scholar] [CrossRef] [Scilit]
- Steenbock, W.; Holweger, H. Statistical equilibrium of lithium in cool stars of different metallicity. Astron. Astrophys. 1984, 130, 319–323. [Google Scholar]
- Barklem, P.S.; Belyaev, A.K.; Guitou, M.; Feautrier, N.; Gadéa, F.X.; Spielfiedel, A. On inelastic hydrogen atom collisions in stellar atmospheres. Astron. Astrophys. 2011, 530, A94. [Google Scholar] [CrossRef] [Scilit]
- Barklem, P.S. Accurate abundance analysis of late-type stars: Advances in atomic physics. Astron. Astrophys. Rev. 2016, 24, 9. [Google Scholar] [CrossRef] [Scilit]
- Yakovleva, S.A.; Voronov, Y.V.; Belyaev, A.K. The Fine Structure of Alkali Metal Atoms in Inelastic Collisions with Hydrogen. Opt. Spectrosc. 2019, 127, 207–211. [Google Scholar] [CrossRef] [Scilit]
- Neretina, M.D.; Mashonkina, L.I.; Sitnova, T.M.; Yakovleva, S.A.; Belyaev, A.K. Influence of Collisions with Hydrogen Atoms on Non-LTE Effects for K I and Ca II in Stellar Atmospheres. Astron. Lett. 2020, 46, 621–629. [Google Scholar] [CrossRef] [Scilit]
- Lambert, D.L.; Warner, B. The abundances of the elements in the solar photosphere-II. Sodium, aluminium, phosphorous, sulphur and potassium. Mon. Not. R. Astron. Soc. 1968, 138, 181. [Google Scholar] [CrossRef] [Scilit]
- Gratton, R.G.; Sneden, C. Light element and NI abundance in field disk and halo stars. Astron. Astrophys. 1987, 178, 179–193. [Google Scholar]
- Chen, Y.Q.; Nissen, P.E.; Zhao, G.; Zhang, H.W.; Benoni, T. Chemical composition of 90 F and G disk dwarfs. Astron. Astrophys. Suppl. Ser. 2000, 141, 491–506. [Google Scholar] [CrossRef] [Scilit]
- Zhang, H.W.; Zhao, G. Chemical abundances of very metal-poor stars. Mon. Not. R. Astron. Soc. 2005, 364, 712–724. [Google Scholar] [CrossRef] [Scilit]
- Hawkins, K.; Masseron, T.; Jofré, P.; Gilmore, G.; Elsworth, Y.; Hekker, S. An accurate and self-consistent chemical abundance catalogue for the APOGEE/Kepler sample. Astron. Astrophys. 2016, 594, A43. [Google Scholar] [CrossRef] [Scilit]
- Reinhard, M.V.; Laird, J.B. Alpha Element Populations Among Local Halo Stars. Astron. J. 2024, 167, 6. [Google Scholar] [CrossRef] [Scilit]
- Barbuy, B.; Ernandes, H.; Friaça, A.C.S.; Camargo, M.S.; da Silva, P.; Souza, S.O.; Masseron, T.; Brauner, M.; García-Hernández, D.A.; Fernández-Trincado, J.G.; et al. Abundances of P, S, and K in 58 bulge spheroid stars from APOGEE. Astron. Astrophys. 2025, 700, A184. [Google Scholar] [CrossRef] [Scilit]
- Zhang, H.W.; Gehren, T.; Butler, K.; Shi, J.R.; Zhao, G. Potassium abundances in nearby metal-poor stars. Astron. Astrophys. 2006, 457, 645–650. [Google Scholar] [CrossRef] [Scilit]
- Ishigaki, M.N.; Tominaga, N.; Aoki, W.; Takiwaki, T.; Nakamura, K.; Iwamoto, N.; Nomoto, K.; Kobayashi, C. Potassium abundances in extremely metal poor stars: Implications for nucleosynthesis in the final stages of massive star evolution. arXiv 2025, arXiv:2508.20484. [Google Scholar] [CrossRef] [Scilit]
- de La Reza, R.; Mueller, E.A. The Potassium Abundance in the Solar Photosphere. Sol. Phys. 1975, 43, 15–32. [Google Scholar] [CrossRef] [Scilit]
- Asplund, M.; Amarsi, A.M.; Grevesse, N. The chemical make-up of the Sun: A 2020 vision. Astron. Astrophys. 2021, 653, A141. [Google Scholar] [CrossRef] [Scilit]
- Shchukina, N.G. Analysis of the solar spectrum of neutral potassium, with allowance for deviation from LTE. I—Initial estimates of level populations. Astrom. I Astrofiz. 1981, 45, 13–20. [Google Scholar]
- Shchukina, N.G.; Alexsandrova, I.I. On the importance of some parameters of the solar spectrum synthesis of neutral potassium under non-LTE conditions. I. Multi-level structure. Byulletin Solnechnye Dannye Akad. Nauk. SSSR 1982, 1982, 100–105. [Google Scholar]
- Shchukina, N.G. The Importance of Some Parameters in Non-Lte Solar Spectrum Synthesis of Neutral Potassium KI—Part Two. Byulletin Solnechnye Dannye Akad. Nauk. SSSR 1983, 1, 71. [Google Scholar]
- Shchukina, N.G. On the importance of some parameters of the solar spectrum synthesis of neutral potassium under non-LTE conditions. III. Temperature. Byulletin Solnechnye Dannye Akad. Nauk. SSSR 1985, 1985, 84–87. [Google Scholar]
- Shchukina, N.G. The effects of deviation from local thermodynamical equilibrium in the solar Fraunhofer lines. K I resonance line λ769.9 nm. Kinemat. I Fiz. Nebesnykh Tel 1987, 3, 40–48. [Google Scholar]
- Bruls, J.H.M.J.; Rutten, R.J.; Shchukina, N.G. The formation of helioseismology lines. I. NLTE effects in alkali spectra. Astron. Astrophys. 1992, 265, 237–256. [Google Scholar]
- Takeda, Y.; Kato, K.I.; Watanabe, Y.; Sadakane, K. Line-Profile Analysis of K{I} 7699 in the Sun and in Procyon. Publ. Astron. Soc. Jpn. 1996, 48, 511–528. [Google Scholar] [CrossRef] [Scilit]
- Ivanova, D.V.; Shimanskiĭ, V.V. Non-LTE Analysis of the Formation of KI Lines in the Spectra of A-K Stars. Astron. Rep. 2000, 44, 376–388. [Google Scholar] [CrossRef] [Scilit]
- Zhang, H.W.; Butler, K.; Gehren, T.; Shi, J.R.; Zhao, G. NLTE analysis of the solar potassium abundance. Astron. Astrophys. 2006, 453, 723–727. [Google Scholar] [CrossRef] [Scilit]
- Takeda, Y.; Zhao, G.; Chen, Y.Q.; Qiu, H.M.; Takada-Hidai, M. On the Abundance of Potassium in Metal-Poor Stars. Publ. Astron. Soc. Jpn. 2002, 54, 275–284. [Google Scholar] [CrossRef] [Scilit]
- Takeda, Y.; Kaneko, H.; Matsumoto, N.; Oshino, S.; Ito, H.; Shibuya, T. Potassium Abundances in Red Giants of Mildly to Very Metal-Poor Globular Clusters. Publ. Astron. Soc. Jpn. 2009, 61, 563–576. [Google Scholar] [CrossRef] [Scilit]
- Andrievsky, S.M.; Spite, M.; Korotin, S.A.; Spite, F.; Bonifacio, P.; Cayrel, R.; François, P.; Hill, V. Non-LTE abundances of Mg and K in extremely metal-poor stars and the evolution of [O/Mg], [Na/Mg], [Al/Mg], and [K/Mg] in the Milky Way. Astron. Astrophys. 2010, 509, A88. [Google Scholar] [CrossRef] [Scilit]
- Sugar, J.; Corliss, C. Atomic Energy Levels of the Iron-Period Elements: Potassium Through Nickel; American Chemical Society and the American Institute of Physics for the National Bureau of Standards: Washington, DC, USA, 1985. [Google Scholar]
- Wiese, W.L.; Smith, M.W.; Miles, B.M. Atomic Transition Probabilities. Vol. 2: Sodium Through Calcium. A Critical Data Compilation; National Bureau of Standards: Washington, DC, USA, 1969.
- Biemont, E.; Grevesse, N. Atomic Wavelengths and Transition Probabilities in the Infrared. Astron. Astrophys. 1973, 27, 163. [Google Scholar]
- Morton, D.C. Atomic Data for Resonance Absorption Lines. I. Wavelengths Longward of the Lyman Limit. Astrophys. J. Suppl. Ser. 1991, 77, 119. [Google Scholar] [CrossRef] [Scilit]
- Rahman-Attia, M.; Jaouen, M.; Laplanche, G.; Rachman, A. An application of the quantum defect method: Oscillator strengths and photoionisation cross sections of potassium. J. Phys. B Mol. Phys. 1986, 19, 897–909. [Google Scholar] [CrossRef] [Scilit]
- Aymar, M.; Luc-Koenig, E.; Combet Farnoux, F. Theoretical investigation on photoionization from Rydberg states of lithium, sodium and potassium. J. Phys. B Mol. Phys. 1976, 9, 1279–1291. [Google Scholar] [CrossRef] [Scilit]
- Hofsaess, D. Photoionization Cross Sections Calculated by the Scaled Thomas-Fermi Method (hv <= 50 eV). At. Data Nucl. Data Tables 1979, 24, 285. [Google Scholar] [CrossRef] [Scilit]
- van Regemorter, H. Rate of Collisional Excitation in Stellar Atmospheres. Astrophys. J. 1962, 136, 906. [Google Scholar] [CrossRef] [Scilit]
- Allen, C.W. Astrophysical Quantities; University of London, Athlone Press: London, England, UK, 1973. [Google Scholar]
- Sobelman, I.I.; Vainshtein, L.A.; Yukov, E.A. Excitation of Atoms and Broadening of Spectral Lines; Springer: Berlin/Heidelberg, Germany, 1981. [Google Scholar]
- Seaton, M.J. The Impact Parameter Method for Electron Excitation of Optically Allowed Atomic Transitions. Proc. Phys. Soc. 1962, 79, 1105–1117. [Google Scholar] [CrossRef] [Scilit]
- Korotin, S.A.; Andrievsky, S.M.; Caffau, E.; Bonifacio, P.; Oliva, E. Study of the departures from LTE in the unevolved stars infrared spectra. Mon. Not. R. Astron. Soc. 2020, 496, 2462–2473. [Google Scholar] [CrossRef] [Scilit]
- Spite, M.; Cayrel, R.; Plez, B.; Hill, V.; Spite, F.; Depagne, E.; François, P.; Bonifacio, P.; Barbuy, B.; Beers, T.; et al. First stars VI - Abundances of C, N, O, Li, and mixing in extremely metal-poor giants. Galactic evolution of the light elements. Astron. Astrophys. 2005, 430, 655–668. [Google Scholar] [CrossRef] [Scilit]
- Prantzos, N.; Abia, C.; Limongi, M.; Chieffi, A.; Cristallo, S. Chemical evolution with rotating massive star yields - I. The solar neighbourhood and the s-process elements. Mon. Not. R. Astron. Soc. 2018, 476, 3432–3459. [Google Scholar] [CrossRef] [Scilit]
- Zhao, G.; Mashonkina, L.; Yan, H.L.; Alexeeva, S.; Kobayashi, C.; Pakhomov, Y.; Shi, J.R.; Sitnova, T.; Tan, K.F.; Zhang, H.W.; et al. Systematic Non-LTE Study of the −2.6 ≤ [Fe/H] ≤ 0.2 F and G Dwarfs in the Solar Neighborhood. II. Abundance Patterns from Li to Eu. Astrophys. J. 2016, 833, 225. [Google Scholar] [CrossRef] [Scilit]
- Reggiani, H.; Amarsi, A.M.; Lind, K.; Barklem, P.S.; Zatsarinny, O.; Bartschat, K.; Fursa, D.V.; Bray, I.; Spina, L.; Meléndez, J. Non-LTE analysis of K I in late-type stars. Astron. Astrophys. 2019, 627, A177. [Google Scholar] [CrossRef] [Scilit]
- Spina, L.; Meléndez, J.; Karakas, A.I.; Ramírez, I.; Monroe, T.R.; Asplund, M.; Yong, D. Nucleosynthetic history of elements in the Galactic disk. [X/Fe]-age relations from high-precision spectroscopy. Astron. Astrophys. 2016, 593, A125. [Google Scholar] [CrossRef] [Scilit]
- Cayrel, R.; Depagne, E.; Spite, M.; Hill, V.; Spite, F.; François, P.; Plez, B.; Beers, T.; Primas, F.; Andersen, J.; et al. First stars V - Abundance patterns from C to Zn and supernova yields in the early Galaxy. Astron. Astrophys. 2004, 416, 1117–1138. [Google Scholar] [CrossRef] [Scilit]
- Roederer, I.U.; Preston, G.W.; Thompson, I.B.; Shectman, S.A.; Sneden, C.; Burley, G.S.; Kelson, D.D. A Search for Stars of Very Low Metal Abundance. VI. Detailed Abundances of 313 Metal-poor Stars. Astron. J. 2014, 147, 136. [Google Scholar] [CrossRef] [Scilit]
- Zatsarinny, O.; Tayal, S.S. Photoionization of potassium atoms from the ground and excited states. Phys. Rev. A 2010, 81, 043423. [Google Scholar] [CrossRef] [Scilit]
- Belyaev, A.K.; Yakovleva, S.A. Estimating inelastic heavy-particle-hydrogen collision data. I. Simplified model and application to potassium-hydrogen collisions. Astron. Astrophys. 2017, 606, A147. [Google Scholar] [CrossRef] [Scilit]
- Safronova, M.S.; Safronova, U.I.; Clark, C.W. Magic wavelengths for optical cooling and trapping of potassium. Phys. Rev. A 2013, 87, 052504. [Google Scholar] [CrossRef] [Scilit]
- Barklem, P.S.; Piskunov, N.; O’Mara, B.J. A list of data for the broadening of metallic lines by neutral hydrogen collisions. Astron. Astrophys. Suppl. Ser. 2000, 142, 467–473. [Google Scholar] [CrossRef] [Scilit]
- Bisterzo, S.; Gallino, R.; Pignatari, M.; Pompeia, L.; Cunha, K.; Smith, V. Cu and Zn in different stellar populations:. inferring their origin. Mem. Della Soc. Astron. Ital. 2004, 75, 741. [Google Scholar] [CrossRef] [Scilit]
- Cohen, J.G.; Christlieb, N.; McWilliam, A.; Shectman, S.; Thompson, I.; Melendez, J.; Wisotzki, L.; Reimers, D. New Extremely Metal-Poor Stars in the Galactic Halo. Astrophys. J. 2008, 672, 320–341. [Google Scholar] [CrossRef] [Scilit]
- Roederer, I.U.; Barklem, P.S. A New Test of Copper and Zinc Abundances in Late-type Stars Using Ultraviolet Cu II and Zn II Lines. Astrophys. J. 2018, 857, 2. [Google Scholar] [CrossRef] [Scilit]
- Sneden, C.; Boesgaard, A.M.; Cowan, J.J.; Roederer, I.U.; Den Hartog, E.A.; Lawler, J.E. Iron-peak Element Abundances in Warm Very Metal-poor Stars. Astrophys. J. 2023, 953, 31. [Google Scholar] [CrossRef] [Scilit]
- Shi, J.R.; Gehren, T.; Zeng, J.L.; Mashonkina, L.; Zhao, G. Statistical Equilibrium of Copper in the Solar Atmosphere. Astrophys. J. 2014, 782, 80. [Google Scholar] [CrossRef] [Scilit]
- Yan, H.L.; Shi, J.R.; Nissen, P.E.; Zhao, G. Non-LTE analysis of copper abundances for the two distinct halo populations in the solar neighborhood. Astron. Astrophys. 2016, 585, A102. [Google Scholar] [CrossRef] [Scilit]
- Andrievsky, S.; Bonifacio, P.; Caffau, E.; Korotin, S.; Spite, M.; Spite, F.; Sbordone, L.; Zhukova, A.V. Galactic evolution of copper in the light of NLTE computations. Mon. Not. R. Astron. Soc. 2018, 473, 3377–3384. [Google Scholar] [CrossRef] [Scilit]
- Liu, Y.P.; Gao, C.; Zeng, J.L.; Yuan, J.M.; Shi, J.R. Atomic Data of Cu I for the Investigation of Element Abundance. Astrophys. J. Suppl. Ser. 2014, 211, 30. [Google Scholar] [CrossRef] [Scilit]
- Sugar, J.; Musgrove, A. Energy Levels of Copper, Cu I through Cu XXIX. J. Phys. Chem. Ref. Data 1990, 19, 527–616. [Google Scholar] [CrossRef] [Scilit]
- Summers, H.P.; O’Mullane, M.G. The Atomic Data and Analysis Structure. In Ultrafast Phenomena XIV; Kobayashi, T., Okada, T., Kobayashi, T., Nelson, K.A., De Silvestri, S., Eds.; Springer: Berlin/Heidelberg, Germany, 2005; Volume 78, p. 399. [Google Scholar] [CrossRef] [Scilit]
- Belyaev, A.K.; Yakovleva, S.A.; Kraemer, W.P. Inelastic processes in copper-hydrogen collisions including fine-structure effects. Mon. Not. R. Astron. Soc. 2021, 501, 4968–4973. [Google Scholar] [CrossRef] [Scilit]
- Vernazza, J.E.; Avrett, E.H.; Loeser, R. Structure of the solar chromosphere. III. Models of the EUV brightness components of the quiet sun. Astrophys. J. Suppl. Ser. 1981, 45, 635–725. [Google Scholar] [CrossRef] [Scilit]
- Lodders, K.; Palme, H.; Gail, H.P. Abundances of the Elements in the Solar System. Landolt-Börnstein 2009, 4B, 712. [Google Scholar] [CrossRef] [Scilit]
- Kurucz, R.L.; Furenlid, I.; Brault, J.; Testerman, L. Solar Flux Atlas from 296 to 1300 nm; National Solar Observatory: Sunspot, NM, USA, 1984.
- Korotin, S.A.; Andrievsky, S.M.; Zhukova, A.V. Copper abundance from Cu I and Cu II lines in metal-poor star spectra: NLTE versus LTE. Mon. Not. R. Astron. Soc. 2018, 480, 965–971. [Google Scholar] [CrossRef] [Scilit]
- Honda, S.; Aoki, W.; Kajino, T.; Ando, H.; Beers, T.C.; Izumiura, H.; Sadakane, K.; Takada-Hidai, M. Spectroscopic Studies of Extremely Metal-Poor Stars with the Subaru High Dispersion Spectrograph. II. The r-Process Elements, Including Thorium. Astrophys. J. 2004, 607, 474–498. [Google Scholar] [CrossRef] [Scilit]
- Cohen, J.G.; Christlieb, N.; Thompson, I.; McWilliam, A.; Shectman, S.; Reimers, D.; Wisotzki, L.; Kirby, E. Normal and Outlying Populations of the Milky Way Stellar Halo at [Fe/H] < −2. Astrophys. J. 2013, 778, 56. [Google Scholar] [CrossRef] [Scilit]
- Caffau, E.; Lombardo, L.; Mashonkina, L.; Sitnova, T.; Bonifacio, P.; Matas Pinto, A.M.; Kordopatis, G.; Sestito, F.; Aguado, D.; Salvadori, S.; et al. The Pristine survey—XIX. Cu and Zn abundances in metal-poor giants. Mon. Not. R. Astron. Soc. 2023, 518, 3796–3812. [Google Scholar] [CrossRef] [Scilit]
- Kobayashi, C.; Karakas, A.I.; Lugaro, M. The Origin of Elements from Carbon to Uranium. Astrophys. J. 2020, 900, 179. [Google Scholar] [CrossRef] [Scilit]
- Caliskan, S.; Amarsi, A.M.; Racca, M.; Koutsouridou, I.; Barklem, P.S.; Lind, K.; Salvadori, S. Revisiting inelastic Cu + H collisions and the non-LTE Galactic evolution of copper. Astron. Astrophys. 2025, 696, A210. [Google Scholar] [CrossRef] [Scilit]
- Delgado Mena, E.; Tsantaki, M.; Adibekyan, V.Z.; Sousa, S.G.; Santos, N.C.; González Hernández, J.I.; Israelian, G. Chemical abundances of 1111 FGK stars from the HARPS GTO planet search program. II. Cu, Zn, Sr, Y, Zr, Ba, Ce, Nd, and Eu. Astron. Astrophys. 2017, 606, A94. [Google Scholar] [CrossRef] [Scilit]
- Xu, X.; Shi, J.; Wang, X. The Impact of Inelastic Collisions with Hydrogen on NLTE Copper Abundances in Metal-poor Stars. Astrophys. J. 2022, 936, 4. [Google Scholar] [CrossRef] [Scilit]
- Farouqi, K.; Frebel, A.; Thielemann, F.K. Deciphering the origins of the elements through galactic archeology. Eur. Phys. J. A 2025, 61, 207. [Google Scholar] [CrossRef] [Scilit]
- Sneden, C.; Cowan, J.J.; Kobayashi, C.; Pignatari, M.; Lawler, J.E.; Den Hartog, E.A.; Wood, M.P. Iron-group Abundances in the Metal-poor Main-Sequence Turnoff Star HD~84937. Astrophys. J. 2016, 817, 53. [Google Scholar] [CrossRef] [Scilit]
Disclaimer/Publisher’s Note: The statements, opinions and data contained in all publications are solely those of the individual author(s) and contributor(s) and not of MDPI and/or the editor(s). MDPI and/or the editor(s) disclaim responsibility for any injury to people or property resulting from any ideas, methods, instructions or products referred to in the content. |
© 2026 by the authors. Licensee MDPI, Basel, Switzerland. This article is an open access article distributed under the terms and conditions of the Creative Commons Attribution (CC BY) license.