


Highlights
What are the main findings?
- Paired brain tissue–serum metabolomics revealed 27 shared differential metabolites exhibiting three brain–blood coupling patterns (synchronous up-regulation, synchronous down-regulation, and “brain-up/serum-down”), from which 11 core metabolites and 21 core pathways were prioritized.
- Network toxicology predicted 8 BBB-penetrating metabolites with neurotoxic potential, and molecular docking together with 100 ns molecular dynamics simulations confirmed that xanthosine stably binds KRAS, MAPK3, and AKT1, linking purine disturbance to PI3K-Akt/MAPK signaling.
What are the implications of the main findings?
- This study proposes an “endogenous metabolic neurotoxicity” framework that reframes brain–blood metabolites not merely as passive biomarkers but as active contributors to CIRI, offering a new mechanistic perspective beyond conventional excitotoxicity and oxidative stress.
- The identified core metabolite panel holds promise as candidate biomarkers for early diagnosis and prognostic evaluation of ischemic stroke, while the neurotoxic metabolite–target axis provides novel intervention targets distinct from conventional anti-inflammatory and antioxidant strategies.
Abstract
Background: Cerebral ischemia–reperfusion injury (CIRI) remains a critical bottleneck underlying poor outcomes after ischemic stroke. However, the brain–blood metabolic coupling mechanism and the toxic role of endogenous metabolites have not been systematically elucidated. Most previous studies have treated differential metabolites as passive biomarkers of tissue injury, while their potential as active neurotoxic mediators that directly drive brain damage remains poorly understood. This study aimed to characterize brain–blood metabolic coupling and the neurotoxic mechanisms of differential metabolites in CIRI, and to identify candidate biomarkers with translational value. Methods: Thirty male specific pathogen-free Sprague–Dawley rats were randomly assigned to a sham-operated group or a middle cerebral artery occlusion/reperfusion (MCAO/R) model group, with 11 rats per group included in the final analysis. A paired brain tissue–serum design was employed, and UHPLC-MS/MS untargeted metabolomics was integrated with network toxicology, molecular docking, and molecular dynamics simulations to systematically dissect brain–blood metabolic coupling and metabolite toxicity in CIRI. Results: A total of 27 metabolites with differential abundance in both brain tissue and serum were identified. They showed three patterns: increased abundance in both compartments, decreased abundance in both compartments, and increased abundance in brain tissue with decreased abundance in serum. The two compartments shared 48 enriched pathways, and further prioritization identified 11 core metabolites and 21 core pathways. Network toxicology identified eight metabolites with in silico-predicted neurotoxic potential and BBB permeability, and linked their candidate targets to the PI3K-Akt, MAPK, and apoptosis pathways. Molecular docking and 100 ns molecular dynamics simulations supported the predicted binding poses and the stability of the selected metabolite–target complexes during the simulations. Conclusions: This study elucidates the brain–blood metabolic coupling mechanism of CIRI from the perspective of endogenous metabolic toxicity. Beyond serving as passive biomarkers, the eight prioritized metabolites are proposed as putative neurotoxic mediators that may contribute to CIRI by targeting the PI3K-Akt/MAPK signaling axes, based on computational prediction rather than experimental validation. The core metabolites identified in this study hold promise as candidate biomarkers for the early diagnosis and prognostic evaluation of ischemic stroke. The findings also provide a theoretical basis for precision intervention in CIRI and identify potential therapeutic targets.
1. Introduction
Ischemic stroke remains a leading cerebrovascular disease associated with high disability and mortality worldwide. According to the Global Burden of Disease (GBD) Study 2021, ischemic stroke accounted for 65.3% of all stroke cases, and its global prevalence increased from 33.2 million in 1990 to 68.4 million in 2021, with a further increase of 81% projected by 2050 [1,2,3,4]. Although intravenous thrombolysis and mechanical thrombectomy promptly restore cerebral perfusion and salvage neurons within the ischemic penumbra, reperfusion itself triggers secondary injury—including oxidative stress bursts, inflammatory cascade activation, neuronal apoptosis, and blood–brain barrier (BBB) disruption—collectively termed cerebral ischemia–reperfusion injury (CIRI), which represents a critical bottleneck limiting neurological recovery [5,6]. Metabolic reprogramming is an early and central cellular response to ischemic hypoxia, preceding structural pathological changes such as inflammation and apoptosis [7]. Following cerebral ischemia, impaired mitochondrial oxidative phosphorylation forces a rapid shift toward anaerobic glycolysis, accompanied by lactate accumulation, excitatory amino acid toxicity, and dysregulated lipid peroxidation. Upon reperfusion, a surge of oxygen-derived free radicals further amplifies metabolic imbalance, establishing a vicious cycle of “metabolic disturbance–oxidative damage–inflammatory activation” that drives progressive brain injury [8,9,10]. Accordingly, elucidating the core regulatory mechanisms of CIRI from a metabolic perspective holds substantial translational value.
However, previous metabolic studies of CIRI have largely been confined to either brain tissue or peripheral serum alone, capturing only unidirectional metabolic abnormalities within a single compartment and failing to capture the coupled interplay between cerebral injury and systemic metabolism [11,12]. As the primary target organ of ischemic injury, the brain can reshape the peripheral serum metabolome through BBB tight-junction opening, enhanced transcellular transport, and inflammatory mediator release. Conversely, aberrant peripheral metabolites may traverse the compromised BBB into the brain parenchyma, exacerbating neuronal damage and forming a bidirectional brain–blood metabolic coupling loop [13,14]. This coordinated dysregulation is a key driver of CIRI progression, yet systematic studies based on dual-sample integrated metabolomics remain scarce, and the core molecules, key pathways, and upstream–downstream mechanisms underlying this coupling remain poorly defined. Integrated metabolomics—by simultaneously profiling lesioned tissue and peripheral biofluids—overcomes the limitations of single-sample designs and enables precise identification of shared differential metabolites as well as compartment-specific alterations, offering a novel framework for deciphering brain–blood metabolic crosstalk.
Accordingly, the present study employed a middle cerebral artery occlusion/reperfusion (MCAO/R) rat model. Successful CIRI induction was first verified via neurological deficit scoring, cerebral infarct volume measurement, and histopathological examination. On this basis, UHPLC–MS/MS untargeted metabolomics was used to systematically characterize metabolic perturbations in brain tissue and serum in CIRI, identify differentially abundant metabolites shared by the two compartments and those specific to each compartment, identify enriched dysregulated pathways, and construct a brain–blood metabolic coupling network through bioinformatic integration. Notably, endogenously accumulated or depleted metabolites during ischemia–reperfusion are not merely passive biomarkers of pathology; they may directly mediate tissue injury through excitotoxicity, oxidative stress, membrane disruption, and aberrant signaling pathway activation, thereby exerting endogenous toxic effects [15,16]. To date, most CIRI metabolic studies have focused on pathway-level dysregulation, while the toxic potential, molecular targets, and injurious contributions of individual differential metabolites have not been systematically evaluated [17]. Network toxicology integrates computational chemistry, bioinformatics, and systems toxicology to enable high-throughput prediction of multi-dimensional toxicity endpoints, molecular targets, and regulatory pathways of endogenous metabolites based on structural information and biological interaction networks [18,19].
We further incorporated a network toxicology strategy to systematically predict the toxicity of the identified brain–blood shared differential metabolites and to construct a “metabolite–toxicity target–injury effect” association network, thereby complementing the mechanistic interpretation of brain–blood metabolic coupling and associated injury in CIRI from the perspective of endogenous metabolic toxicity. Building on this, molecular docking and 100 ns molecular dynamics (MD) simulations were further performed to validate, at the atomic level, the binding affinity, binding mode, and conformational stability of key neurotoxic metabolites with core signaling targets, thereby establishing a complete evidence chain from metabolomic discovery to molecular mechanistic validation (Figure 1). This study aims to provide specific metabolic biomarkers and potential intervention targets for the precision diagnosis and treatment of CIRI.
Figure 1.
Experimental workflow.
2. Materials and Methods
2.1. Laboratory Animals
Thirty male specific pathogen-free (SPF) Sprague–Dawley (SD) rats, weighing 220–250 g, were purchased from Hunan SJA Laboratory Animal Co., Ltd., Changsha, China, [SCXK (Xiang) 2021-0002; animal identification numbers: 430727261100566128, 430727261100517073]. The rats were housed in an SPF-grade animal facility under controlled temperature (22–25 °C), humidity (50–60%), and a 12 h light/dark cycle, with free access to food and water, and were acclimatized for 1 week before experimentation. All procedures were approved by the Experimental Animal Ethics Committee of the university (ethics approval no. HNUCM21-2603-58) and conducted in strict accordance with the guidelines for experimental animal ethical review.
2.2. Main Reagents and Instruments
Reagents. Methanol (CNW Technologies, CAS: 67-56-1), acetonitrile (CNW Technologies, CAS: 75-05-8), and isopropanol (CNW Technologies, CAS: 67-63-0) were used for metabolite extraction and chromatographic separation. 2,3,5-Triphenyltetrazolium chloride (TTC) staining solution was purchased from Sigma-Aldrich (cat. no. T8877). Rat IL-1β, IL-6, and TNF-α ELISA kits were obtained from Jianglai Biotechnology (cat. nos. JL20884, JL20896, and JL13202, respectively). Hematoxylin and eosin staining solutions were supplied by Beijing Zhongshan Golden Bridge Biotechnology (cat. nos. ZLI-9610 and ZLI-9613, respectively).
Instruments. Metabolomic profiling was performed on a Vanquish ultra-high-performance liquid chromatography system coupled to an Orbitrap Exploris 120 high-resolution mass spectrometer (Thermo Fisher Scientific, Waltham, MA, USA). Histological images were acquired using a NIKON ECLIPSE E100 upright optical microscope (Nikon, Tokyo, Japan). Tissue homogenization was carried out with a JXFSTPRP-24 homogenizer (Shanghai Jingxin, Shanghai, China). Samples were lyophilized using an LGJ-10C freeze dryer (Sihuan Furui, Beijing, China). Ultrasonic extraction was performed with a PS-60AL ultrasonic processor (Shenzhen Leidebang, Shenzhen, China). Paraffin embedding was conducted on a JB-P5 tissue embedder (Wuhan Junjie, Wuhan, China). Absorbance measurements were obtained using a SpectraMax M5 microplate reader (Molecular Devices, San Jose, CA, USA). All instruments were calibrated prior to use.
2.3. CIRI Model Establishment and Grouping
2.3.1. Animal Grouping, Randomization, and Blinding
After 7 days of acclimatization, the rats were randomly assigned to a sham-operated group (Sham) or a model group (Model), with 15 rats per group, using a random number table generated by a researcher who was not involved in subsequent surgery or data analysis. Group allocation was sealed in opaque envelopes and revealed only on the day of surgery to ensure allocation concealment. To minimize bias, blinding was maintained throughout the study: the surgeon was unaware of group assignment until immediately before the operation; neurological deficit scores were independently assessed by two blinded investigators and averaged; histological evaluations (TTC, HE, and Nissl staining) and metabolomic data analysis were performed by researchers blinded to group assignment. Unblinding occurred only after all data collection and analysis were completed.
2.3.2. MCAO Model Establishment
The MCAO model was established according to a previously described modified Longa suture method [20]. In the Model group, the right middle cerebral artery was occluded using a silicone-coated monofilament suture; in the Sham group, the carotid arteries were exposed without suture insertion. Neurological assessments, including the modified neurological severity score (mNss) and Zea Longa score, were initiated 24 h after surgery.
2.3.3. Model Validation and Exclusion Criteria
Animals meeting any of the following predefined criteria were excluded from the study: (i) intra- or postoperative death; (ii) failure to meet the neurological score thresholds for successful model induction at 24 h post-surgery; (iii) absence of infarct tissue on TTC staining; or (iv) severe complications (e.g., subarachnoid hemorrhage) or body weight loss exceeding 20% of baseline.
Neurological deficit scoring. At 1, 3, 5, and 7 days post-surgery, neurological injury was assessed using the mNss (range, 0–18; 0 = no deficit, 1–6 = mild, 7–12 = moderate, 13–18 = severe), alongside the Zea Longa score (0 = no deficit, 1 = forelimb flexion, 2 = decreased resistance to lateral push, 3 = circling toward the contralateral side, 4 = unconsciousness). Model success was defined as an mNss ≥ 4 and a Zea Longa score of 1–3. All scores were independently determined by two blinded investigators and averaged for analysis.
TTC staining. After euthanasia, whole brains were coronally sectioned into five 2 mm-thick slices, incubated in 2% TTC solution at 37 °C for 30 min in the dark (with one midway inversion), and fixed in 4% paraformaldehyde for 24 h. Images were captured, and infarct volume was quantified using ImageJ 1.52a software as follows: infarct volume (%) = (ischemic volume of the affected hemisphere/total volume of the contralateral normal brain) × 100%. Animals with no detectable infarct were excluded.
HE and Nissl staining. Whole brains were fixed in 4% paraformaldehyde, dehydrated through a graded ethanol series, cleared, and embedded in paraffin. Four-micrometer sections were stained with hematoxylin and eosin (H&E) or with toluidine blue for Nissl staining. Pathomorphological changes and neuronal injury in the ischemic cerebral cortex were examined under a light microscope by a blinded investigator.
2.3.4. Final Sample Inclusion
According to the above exclusion criteria, a total of 30 SPF-grade male Sprague–Dawley rats were initially enrolled and randomly assigned to the Sham group or the Model group (n = 15 per group) using a random number table. During the experiment, 8 rats were excluded: 3 rats in the Model group were identified as failed modeling because their Zea-Longa score was <1 or their mNss was <4 at 24 h after reperfusion, which did not meet the criteria for effective focal neurological deficit; the remaining 5 rats were excluded due to death during surgery or rearing, including 1 in the Model group (subarachnoid hemorrhage) and 4 in the Sham group (2 from anesthesia accident and 2 from inter-current fighting during rearing). After exclusion, 22 rats were finally included (Sham, n = 11; Model, n = 11). All excluded animals were not included in the statistical analysis, and no imputation was performed for missing data.
The included rats were divided into two independent sub-experiments according to the research purpose: (1) the MCAO/R model validation sub-experiment (n = 6 per group), used for longitudinal neurobehavioral assessment (mNss scoring and body weight monitoring for 7 consecutive days) as well as histopathological and biochemical examinations (TTC staining, HE staining, Nissl staining, and ELISA detection of serum IL-1β, IL-6, and TNF-α); and (2) the metabolomics sub-experiment (n = 5 per group), used for paired brain tissue–serum untargeted metabolomics analysis.
2.3.5. Sample Preparation
For the metabolomics sub-experiment (n = 5 per group), an in-paired design was adopted to simultaneously collect ischemic penumbra brain tissue and serum samples from each rat. At 24 h after surgery, rats were anesthetized with 2% sodium pentobarbital (40 mg/kg), and whole blood was collected from the abdominal aorta. Blood samples were left on ice for 30 min and then centrifuged at 4 °C and 3500 r/min for 15 min to separate serum, which was aliquoted and immediately stored at −80 °C. Meanwhile, on ice, the ischemic penumbra tissue in the right MCA-supplied region was dissected according to a rat brain atlas, snap-frozen in liquid nitrogen within 3 min of isolation, and transferred to −80 °C for storage. Before metabolomics analysis, 100 μL of serum was mixed with 3 volumes of pre-chilled acetonitrile for protein precipitation, vortexed, and centrifuged at 4 °C and 14,000× g for 15 min. Approximately 50 mg of brain tissue was homogenized in pre-chilled methanol–acetonitrile–water (2:2:1, v/v/v) on ice, subjected to ultrasonication, and centrifuged under the same conditions. The supernatants from both sample types were vacuum-dried and reconstituted in acetonitrile–water (1:1, v/v) for UHPLC-MS/MS analysis.
For the model validation sub-experiment (n = 6 per group), rats were deeply anesthetized with 2% sodium pentobarbital (40 mg/kg, i.p.) at 7 d after reperfusion. Blood was collected from the abdominal aorta, allowed to stand at room temperature for 2 h, and centrifuged at 3500 r/min for 15 min to separate serum. Serum was then heat-inactivated in a 56 °C water bath for 30 min, aliquoted, and stored at −80 °C for subsequent ELISA detection of IL-1β, IL-6, and TNF-α. The rats were then transcardially perfused via the left ventricle with approximately 200 mL of 37 °C normal saline to flush out blood until the effluent ran clear, followed by approximately 200 mL of ice-cold 4% paraformaldehyde in phosphate buffer (pH 7.4) for fixation. The brains were removed, and the ischemic penumbra in the right MCA-supplied region was dissected on ice according to a rat brain atlas, post-fixed for 24 h, dehydrated through a graded ethanol series, embedded in paraffin, and coronally sectioned (5 μm thickness) for HE staining and Nissl staining. For TTC staining, fresh brain slices were incubated in 2% TTC solution at 37 °C for 20 min in the dark, fixed in 4% paraformaldehyde, and photographed.
2.4. Untargeted Metabolomics and Multivariate Statistical Analysis
2.4.1. Metabolite Detection and Identification
- (1)
- Chromatographic and mass spectrometric conditions. Metabolomic profiling was performed on the Vanquish UHPLC system coupled to the Orbitrap Exploris 120 high-resolution mass spectrometer (Thermo Fisher Scientific, Waltham, MA, USA). Polar metabolites were separated on a Waters ACQUITY UPLC BEH Amide column (2.1 mm × 50 mm, 1.7 μm) [21], with mobile phase A consisting of 25 mmol/L ammonium acetate and 25 mmol/L ammonium hydroxide in water, and mobile phase B consisting of acetonitrile. Non-polar metabolites were separated on a Phenomenex Kinetex C18 column (2.1 mm × 100 mm, 2.6 μm), with mobile phase A consisting of 0.01% acetic acid in water and mobile phase B consisting of isopropanol–acetonitrile (1:1, v/v). Gradient elution parameters are summarized in Table 1. The injection volume was 2 μL and the autosampler was maintained at 4 °C to preserve sample stability, and the column oven temperature was set at 30 °C. Mass spectra were acquired in both positive and negative electrospray ionization (ESI) modes, with a sheath gas flow rate of 50 Arb, auxiliary gas flow rate of 15 Arb, capillary temperature of 320 °C, MS1 resolution of 60,000, MS2 resolution of 15,000, stepped normalized collision energy (SNCE) of 20/30/40, and spray voltages of +3.8 kV (positive) and −3.4 kV (negative).Table 1. Chromatographic elution parameters.
- (2)
- Raw data were converted to mzXML format using ProteoWizard and then processed with an R-based pipeline for peak detection, retention-time alignment, and normalization. To ensure data quality and instrumental stability, pooled quality control (QC) samples were prepared by mixing equal aliquots of supernatant from all serum and brain tissue samples, respectively, and one QC sample was injected after every 10 study samples throughout the analytical sequence. At the beginning of metabolite extraction, an isotopically (deuterium-) labeled internal standard mixture was added to the extraction solution to monitor extraction efficiency and correct for instrumental drift; the retention times and response intensities of all internal standards were highly stable in QC samples (RSD ranging from 0.14% to 0.49%, well below 10%). Procedural extraction blanks were also prepared and interspersed throughout the sequence to monitor carryover and cross-contamination; no prominent target metabolite peaks were detected in the extraction blanks, indicating negligible system carryover. QC samples clustered tightly and showed high correlation in the PCA score plot, confirming instrumental stability and the reliability of the acquired data. All samples were analyzed in randomized injection order to reduce time-related systematic bias.
Metabolites were identified by matching accurate masses (mass error < 5 ppm) and MS/MS fragmentation spectra against the BiotreeDB database (V3.0) [22] as the primary identification resource, supplemented by cross-validation against the public HMDB, MoNA, and NIST databases. The matching criteria were a mass error < 5 ppm and an MS/MS spectral similarity > 0.7. According to the Metabolomics Standards Initiative (MSI) hierarchy, all metabolites retained for subsequent analysis reached Level 2 (reliable structural identification based on retention time, accurate m/z, and MS/MS fragmentation spectra).
2.4.2. Differential Metabolite Screening and Visualization
Preprocessed data were imported into SIMCA (V18.0.1, Sartorius Stedim Data Analytics AB, Umea, Sweden) [23] for principal component analysis (PCA) and orthogonal partial least-squares discriminant analysis (OPLS-DA) after log transformation and mean-centering. Model robustness was validated by 200 permutation tests [24]. Differential metabolites were jointly screened using the following criteria: variable importance in projection (VIP) > 1 from the OPLS-DA model, raw p < 0.05 by Student’s t-test, and adjusted q < 0.05 after Benjamini–Hochberg false discovery rate (FDR) correction.
Differential metabolites were displayed in volcano plots, and Venn diagrams were used to intersect the differential metabolite sets from serum and brain tissue to obtain the shared brain–blood differential metabolites. Paired hierarchical clustering heatmaps were constructed for the shared metabolites in brain tissue and serum, supplemented by Log2FC bar charts indicating the direction of change; based on the concordance of fold-change direction between the two compartments, the shared metabolites were classified into concordant changes (synchronous up-regulation or down-regulation) and discordant changes (brain-up/serum-down). Pathway enrichment analysis was performed using the DAVID database [25] with hypergeometric testing, and p < 0.05 was set as the significance threshold.
2.4.3. Pathway Enrichment and Brain–Blood Metabolic Association Analysis
KEGG pathway enrichment analysis was performed separately for differential metabolites in brain tissue and serum, with significantly enriched pathways defined by p < 0.05 and FDR < 0.1, to annotate the biological functions and pathological processes involved. Enriched pathways from the two compartments were then compared; Venn diagrams were used to distinguish shared from sample-specific enriched pathways, while treemaps visualized the enrichment strength of specific pathways, which were further categorized by functional class. In addition, up- and down-regulated differential metabolites in brain tissue and serum were subjected to independent KEGG enrichment analysis, and the resulting up-/down-regulated pathway profiles were compared to reveal directional and functional differences in metabolic disturbance between the two compartments.
2.4.4. Screening of Core Metabolites and Key Pathways (Serum Pathway–Metabolite–Brain Pathway Network)
The differential metabolite results from brain tissue and serum were integrated with the KEGG enrichment data. Candidate CIRI-related metabolites and pathways were retained if they met the criterion of differential metabolite abundance in both compartments and membership in a significantly enriched pathway (p < 0.05, FDR < 0.1). Metabolites altered in only one compartment or lacking a significant brain–blood association were excluded. A “serum metabolic pathway–shared differential metabolite–brain metabolic pathway” association network was then constructed based on fold change (FC), variable importance in projection (VIP), and pathway enrichment significance, and visualized using Cytoscape [26] (V3.10.3). Core metabolites and key regulatory pathways mediating CIRI brain–blood metabolic coupling were ultimately selected according to network topological parameters (degree) combined with the magnitude of metabolite alteration.
2.5. Toxicity Prediction of Differential Metabolites by Network Toxicology
2.5.1. Metabolite Structure Preparation and Toxicity Prediction
The identified brain–blood shared endogenous differential metabolites were subjected to toxicity prediction. Standard chemical structures, SMILES codes, and basic physicochemical properties were retrieved from PubChem [27] (https://pubchem.ncbi.nlm.nih.gov/ (accessed on 3 September 2026)) and HMDB [24] (https://hmdb.ca/ (accessed on 3 September 2026)). After the structures were manually checked for accuracy and their molecular representations were standardized, a metabolite dataset was constructed for toxicity prediction. Multi-organ toxicity profiling—including hepatotoxicity, neurotoxicity, nephrotoxicity, respiratory toxicity, and cardiotoxicity—was performed using ProTox 3.0 [28] (https://tox.charite.de/ (accessed on 12 September 2026)) in combination with ADMETlab 2.0 [29], with toxicity class and probability output for each endpoint. Neurotoxicity was set as the primary evaluation criterion. All predictions were run with the platforms’ default training models and parameters; the predicted classification, confidence, and potential targets for each toxicity endpoint were retained. The results were visualized as a heatmap of predicted probabilities across multi-organ toxicity endpoints, with metabolites ranked by neurotoxicity probability to highlight high-risk candidates.
2.5.2. Target Screening of Neurotoxic Metabolites
Using the neurotoxic metabolites as input, potential molecular targets were retrieved and integrated from ChEMBL [30] (https://www.ebi.ac.uk/chembl/ (accessed on 14 September 2026)), SwissTargetPrediction, and STITCH (https://stitch-db.org/ (accessed on 14 September 2026)) to construct a compound target set. In parallel, CIRI-related targets were collected from five disease databases—GeneCards [31] (https://www.genecards.org/ (accessed on 15 September 2026)), the Therapeutic Target Database (TTD) [32] (http://db.idrblab.net/ttd/ (accessed on 15 September 2026)), Online Mendelian Inheritance in Man (OMIM) [33] (https://omim.org (accessed on 15 September 2026)), PharmGKB [34] (https://www.pharmgkb.org/ (accessed on 15 September 2026)), and DisGeNET [35] (https://www.disgenet.org (accessed on 15 September 2026))—using “cerebral ischemia–reperfusion” and its spelling variants as keywords. The intersection of metabolite targets and CIRI disease targets was taken to represent core targets jointly associated with neurotoxic metabolites and CIRI. These intersecting genes were then imported into STRING to construct a protein–protein interaction (PPI) network, with a minimum interaction confidence threshold of ≥0.7. The degree of each node was calculated using the NetworkAnalyzer plugin in Cytoscape, and the top 20 nodes ranked by degree were selected as key targets for visualization.
2.5.3. Construction of the “Metabolite–Target–Pathway–Disease” Network
Gene Ontology (GO) functional enrichment and KEGG pathway enrichment analyses were performed on the intersecting genes using DAVID, with p < 0.05 set as the significance threshold to identify significantly enriched biological processes and signaling pathways. A multidimensional “toxic metabolite–target–pathway–disease” interaction network integrating the neurotoxic metabolites, key targets, enriched pathways, and CIRI-related disease information was constructed in Cytoscape to visualize how toxic metabolites may influence CIRI-related pathways through key targets.
2.6. Molecular Docking
To evaluate the binding affinity and binding mode of core metabolites with potential targets, core genes were selected from the PPI network, and their crystal structures were retrieved from the PDB [36] (http://www.rcsb.org/ (accessed on 17 September 2026)). Receptor structures were prepared in PyMOL 2.4.0 by removing water molecules and co-crystallized ligands, adding polar hydrogens, and computing Gasteiger charges, followed by conversion to PDBQT format. The docking grid box was centered on the co-crystallized ligand to cover the entire binding pocket. Standard SMILES sequences of core metabolites were obtained from PubChem; three-dimensional conformers were generated using the RDKit ETKDGv3 algorithm, energy-minimized with the MMFF94 force field, and converted to PDBQT format after charge assignment via Meeko. Molecular docking was performed with AutoDock Vina 1.2.5, and the binding energy of the lowest-energy conformation was taken as the representative value, with −5.0 kcal/mol set as the empirical threshold for potential binding. Docking results were visualized as a heatmap, and the top five complexes with the lowest binding energies were further analyzed by three-dimensional binding-mode plots rendered with 3Dmol.js, annotated with hydrogen-bond lengths, interacting residues, and semi-transparent protein cartoons.
2.7. Molecular Dynamics Simulation
To validate the binding stability of the docked complexes, the top five complexes with the lowest binding energies were subjected to 100 ns molecular dynamics (MD) simulations. Receptor hydrogen atoms were added at pH 7.4 using PDBFixer. Ligands were taken from the optimal docking conformations and parameterized with the OpenFF 2.2.0 (Sage) force field, with partial charges assigned by the MMFF94 method. Proteins were parameterized with the AMBER ff14SB force field and water molecules with the TIP3P model. The systems were assembled in OpenMM, and their topologies were converted to GROMACS format. The systems were then solvated in cubic periodic boxes with a minimum solute-to-wall distance of 1.0 nm. NaCl was added at a concentration of 0.15 mol/L to neutralize the systems and maintain ionic strength. All simulations were performed in GROMACS 2024.3. Energy minimization was first carried out by the steepest-descent algorithm (maximum 50,000 steps, force convergence threshold of 1000 kJ·mol−1·nm−1).
Initial velocities were generated from a Maxwell–Boltzmann distribution at 300 K. The systems then underwent 100 ps of NVT equilibration at 300 K (V-rescale thermostat, with protein and non-protein groups coupled separately and a time constant of 0.1 ps), followed by 1 ns of NPT equilibration at 300 K and 1 bar (V-rescale thermostat and Parrinello–Rahman isotropic barostat, with a pressure coupling time constant of 5.0 ps). Production runs were then conducted for 100 ns under the same NPT conditions. The leap-frog integrator was used with a 2 fs time step; all bond lengths involving hydrogen atoms were constrained by LINCS. Long-range electrostatic interactions were computed by the particle mesh Ewald (PME) method, with a 1.0 nm cutoff for both electrostatics and van der Waals interactions, and long-range dispersion corrections applied to energy and pressure. Trajectories were saved every 10 ps. Before analysis, trajectories underwent the following sequential processing steps: correction for periodic boundary conditions to remove jumps (gmx trjconv -pbc nojump), cluster-based recentering of the protein–ligand complex (-pbc cluster), and rotational–translational fitting to the protein (-fit rot + trans) to remove overall translation and rotation.
Using the first frame of the fitted trajectory as reference, the protein root-mean-square deviation (RMSD) and the ligand RMSD relative to the protein were calculated. The radius of gyration (Rg) and per-residue root-mean-square fluctuation (RMSF) were also computed to assess conformational stability and binding mode.
2.8. Statistical Analysis
All data are expressed as the mean ± standard deviation (SD). Between-group comparisons were preceded by the Shapiro–Wilk normality test and Levene’s test for equality of variances. Normally distributed data with homogeneous variances were compared using the independent-samples Student’s t-test; data that failed either normality or homogeneity of variance were compared using the Mann–Whitney U non-parametric test. All statistical analyses were performed in GraphPad Prism 9.0 and R 4.2.1, with p < 0.05 considered statistically significant.
Interventionary studies involving animals or humans, and other studies that require ethical approval, must list the authority that provided approval and the corresponding ethical approval code.
In this section, where applicable, authors are required to disclose details of how generative artificial intelligence (GenAI) has been used in this paper (e.g., to generate text, data, or graphics, or to assist in study design, data collection, analysis, or interpretation). The use of GenAI for superficial text editing (e.g., grammar, spelling, punctuation, and formatting) does not need to be declared.
3. Results
3.1. Validation of the CIRI Model
At 24 h after reperfusion, rats in the Model group exhibited typical focal neurological deficits, including incomplete extension of the left forepaw, leftward circling during locomotion, and loss of balance with falling. Compared with the Sham group, the Model group showed a significantly higher modified neurological severity score (mNss; p < 0.01) and a markedly lower body weight (p < 0.01).
TTC staining revealed large pale infarct areas in the right cerebral hemisphere of the Model group (Figure 2A). HE staining showed marked cerebral edema, disorganized cellular arrangement, and extensive inflammatory cell infiltration in the ischemic penumbra of the Model group (Figure 2F); Nissl staining demonstrated a substantial loss of neurons and dissolution of Nissl bodies, indicating severe neuronal injury (Figure 2G), whereas the Sham group showed no obvious abnormalities. ELISA assays revealed significantly elevated serum levels of the pro-inflammatory cytokines IL-1β, IL-6, and TNF-α in the Model group (p < 0.01). Collectively, these findings—spanning neurological function, infarct volume, histopathology, and inflammatory status—confirm successful establishment of the MCAO/R model, supporting its use in subsequent metabolomic and network toxicology analyses.
Figure 2.
Validation of the rat cerebral ischemia–reperfusion injury model. (A) TTC staining of cerebral infarct volume n = 3; (B) line graphs of mNss scores and body weight changes over 7 days; (C) serum levels of IL-1β, IL-6, and TNF-α detected by ELISA n = 6, ** p < 0.01; (D,F) HE staining of brain tissue in the Sham and Model groups, respectively n = 3; (E,G) Nissl staining of brain tissue in the Sham and Model groups, respectively n = 3.
3.2. Metabolomic Data Quality Control and Multivariate Statistical Analysis
The total ion chromatograms (TICs) of serum and brain tissue samples are shown in Figure 3A–D. Under both positive and negative ionization modes, the retention times of chromatographic peaks were highly consistent across the five biological replicates within each group (deviation < 0.3 min), with good parallelism in peak shape and MS response intensity, indicating that the sample preparation workflow and UHPLC–MS/MS detection method were stable and reliable. PCA (Figure 3E–H) and OPLS–DA (Supplementary Figure S1) results showed that the Sham and Model groups exhibited clear intergroup separation and tight intragroup clustering in both serum and brain tissue, suggesting that CIRI induces marked remodeling of metabolic profiles in both brain tissue and peripheral serum. Both OPLS–DA models passed 200 permutation tests, with negative intercepts of the Q2 regression lines, confirming that the models were robust and free of overfitting. Regarding identification confidence, the shared differential metabolites included in the subsequent analysis all reached MSI Level 2 (based on retention time, accurate m/z < 5 ppm, and MS/MS fragmentation matching against HMDB/Metlin/KEGG databases); the MS/MS fragment ions of the core metabolites are provided in Supplementary Table S2.
Figure 3.
Quality control and multivariate statistical analysis of the metabolomic dataset. (A,B) Total ion chromatograms (TICs) of serum samples acquired in positive (ESI+) and negative (ESI−) modes, respectively; (C,D) TICs of brain tissue samples acquired in ESI+ and ESI− modes, respectively (n = 5 per group). (E,F) PCA score plots of serum and brain tissue, respectively; (G,H) OPLS-DA score plots of serum and brain tissue, respectively.
3.3. Screening of Differential Metabolites in Brain Tissue and Serum
Based on the screening criteria VIP > 1, p-Value < 0.05, differential metabolite sets were obtained separately for brain tissue and serum. In serum, a total of 566 differential metabolites were identified (193 up-regulated and 373 down-regulated), versus 277 in brain tissue (114 up-regulated and 163 down-regulated) (Figure 4A,B). To systematically characterize metabolic crosstalk between the local brain and peripheral circulation under CIRI, the two differential sets were jointly compared. Venn intersection analysis identified 36 metabolites with differential abundance in both brain tissue and serum during CIRI (Figure 4C).
Figure 4.
Screening and clustering analysis of differential metabolites. (A) Volcano plot of differential metabolites in serum; (B) volcano plot of differential metabolites in brain tissue; (C) Venn diagram of differential metabolites between serum and brain tissue; (D) expression distribution heatmap of brain–blood shared differential metabolites; (E) hierarchical clustering heatmap of shared differential metabolites in serum; and (F) hierarchical clustering heatmap of shared differential metabolites in brain tissue.
To improve annotation reliability and exclude exogenous compounds that might confound mechanistic interpretation, the 36 candidate-shared metabolites were manually curated based on chemical structure, database annotation, and biological origin; metabolites confirmed to be exogenous, synthetic, or microbially derived without mammalian endogenous metabolic basis were removed. Nine such non-endogenous metabolites were excluded, leaving 27 brain–blood shared differential metabolites for subsequent analysis (Table 2). Based on retention time, accurate mass (mass error < 5 ppm), and MS/MS spectral matching, the 27 metabolites were annotated on the TICs (Figure 3A–D; details in Supplementary Table S1), showing that CIRI induces marked metabolomic remodeling in both serum and brain tissue, with peak intensities of multiple annotated metabolites differing significantly between the Sham and Model groups.
Table 2.
The 27 brain–blood shared differential metabolites.
Hierarchical clustering of the 27 shared metabolites revealed compartment-specific patterns of metabolite abundance in brain tissue and serum (Figure 4D). In both compartments, the clustering heatmaps showed complete separation between the Sham and MCAO/R groups with good intra-group aggregation, and the adjacent Log2FC bars directly indicated the direction of alteration for each metabolite (Figure 4E,F). Based on the direction of abundance changes in brain tissue and serum, the 27 metabolites were classified into three groups: eight with increased abundance in both compartments, 12 with decreased abundance in both compartments, and seven with increased abundance in brain tissue and decreased abundance in serum. These findings indicate that CIRI-mediated metabolic disturbance is characterized by the coexistence of concordant systemic responses and compartment-specific remodeling, suggesting that CIRI not only induces local metabolic imbalance in the brain but also drives systemic metabolic remodeling in the periphery, reflecting a complex bidirectional brain–blood metabolic coupling relationship.
3.4. Pathway Enrichment and Shared Brain–Blood Pathway Analysis
KEGG pathway enrichment analysis identified 63 enriched pathways in brain tissue and 60 in serum, including 48 pathways shared by the two compartments. The top 20 enriched pathways ranked by p-Value were visualized as treemaps for both compartments (Figure 5A,B). Serum differential metabolites were primarily enriched in “Glycine, serine and threonine metabolism,” “Pantothenate and CoA biosynthesis,” “Pyrimidine metabolism,” “Glycerophospholipid metabolism,” and “Biosynthesis of amino acids”; brain tissue metabolites were mainly enriched in “Nucleotide metabolism,” “Purine metabolism,” “Thiamine metabolism,” “Nicotinate and nicotinamide metabolism,” and “Glycerophospholipid metabolism”. Venn intersection analysis revealed 48 shared enriched pathways between the two compartments (Figure 5C). Functional classification (Figure 5D) showed that amino acid metabolism-related pathways accounted for the highest proportion (25.0%), followed by carbohydrate metabolism (16.7%), cofactor and vitamin metabolism (14.6%), lipid metabolism (12.5%), and other categories (31.2%), indicating that CIRI-induced brain–blood metabolic remodeling involves multi-dimensional processes spanning amino acid, energy, and lipid metabolism.
Figure 5.
KEGG pathway enrichment analysis of differential metabolites in brain tissue and serum. (A,B) Treemaps of enriched pathways for serum and brain tissue, respectively (each square represents a pathway; square area is positively correlated with the Rich factor, and fill color intensity corresponds to −ln p-value); (C) Venn diagram of enriched pathways between serum and brain tissue; (D) functional classification pie chart of the 48 shared enriched pathways; and (E,F) independent KEGG enrichment analysis of up- and down-regulated differential metabolites in serum and brain tissue, respectively (x-axis: differential abundance score, negative = down-regulated, positive = up-regulated; dot size: number of enriched metabolites; color: KEGG pathway category; * p < 0.05, ** p < 0.01, *** p < 0.001).
Independent KEGG enrichment analysis was further performed on up- and down-regulated differential metabolites in brain tissue and serum to compare the directional distribution of enriched pathways (Figure 5E,F). In serum, Metabolic pathways, Biosynthesis of amino acids, Carbon metabolism, and Glycerophospholipid metabolism showed a down-regulation trend (differential abundance (DA) score < 0), whereas Nucleotide metabolism and Pyrimidine metabolism were overall up-regulated (DA score > 0). In brain tissue, Nucleotide metabolism, Purine metabolism, and Glycerophospholipid metabolism were overall down-regulated, while Biosynthesis of amino acids, Glycine, serine and threonine metabolism, and D-Amino acid metabolism were up-regulated. Further comparison revealed that some shared enriched pathways changed concordantly in both compartments, whereas certain amino acid- and nucleotide-related pathways showed opposite directional changes, suggesting that CIRI involves both common metabolic responses and pronounced compartment-specific metabolic remodeling between the brain and peripheral serum.
3.5. Screening of Core Metabolites and Key Metabolic Pathways
Based on the 27 brain–blood shared differential metabolites and 48 shared enriched pathways, a “metabolite–metabolic pathway” association network was further constructed to clarify the functional links between differential metabolites and dysregulated metabolic processes. As shown in Figure 6, some shared differential metabolites exhibited clear brain–blood metabolic alterations but failed to map directly to shared enriched pathways, suggesting relatively limited KEGG annotation and pathway-level biological association for these compounds. After functional prioritization, 11 core metabolites and 21 core metabolic pathways were ultimately selected (Figure 6). The 11 core metabolites displayed three expression patterns: 4 with synchronous brain–blood up-regulation (Phenylalanine, Uracil, Pantothenic acid, 3-Methylhistidine), 3 with synchronous down-regulation (Thiamine monophosphate (ThMP), Nicotinamide, 4-Guanidinobutyric acid), and 4 with a reverse “brain-up/serum-down” trend (Xanthosine, 5-Aminolevulinic acid, Mannitol, cis-11,14-Eicosadienoic acid). Functional mapping revealed that the core metabolites primarily cover amino acid metabolism, nucleotide metabolism, cofactor and vitamin metabolism, carbohydrate metabolism, lipid metabolism, and porphyrin metabolism. Among them, Phenylalanine, Uracil, Xanthosine, Pantothenic acid, ThMP, and Nicotinamide were each associated with multiple pathways, serving as key hub nodes connecting local brain injury with peripheral serum metabolic remodeling.
Figure 6.
“Serum pathway–metabolite–brain pathway” association network. Red diamond nodes represent significantly enriched metabolic pathways in serum (labeled with KEGG IDs), blue diamond nodes represent significantly enriched pathways in brain tissue, and green circular nodes represent brain–blood shared differential metabolites. Node size is positively correlated with the degree of connectivity.
3.6. Toxicity Prediction of Differential Metabolites
To reveal the potential injurious effects of differential metabolites in CIRI pathogenesis, toxicity prediction was performed on the 27 brain–blood shared endogenous differential metabolites using ProTox 3.0 and ADMETlab 2.0, covering hepatotoxicity, neurotoxicity, nephrotoxicity, respiratory toxicity, cardiotoxicity, and BBB permeability, with emphasis on the neurotoxic potential and BBB-penetrating capacity of the endogenous metabolites. The results showed that 8 of the 27 differential metabolites were predicted to possess explicit neurotoxic activity: N4-Acetylcytidine, Trigonelline, ThMP, Xanthosine, Uracil, Nicotinamide, 3-Methylhistidine, and Phenylalanine. The toxicity classes and predicted probabilities across all toxicity endpoints for these 8 metabolites are presented as a heatmap (Figure 7A). The neurotoxicity prediction probabilities of the 8 metabolites ranged from 0.53 to 0.87, with N4-Acetylcytidine showing the highest probability (0.87). Notably, all 8 metabolites exhibited BBB permeability prediction probabilities above 0.70, suggesting that these endogenous metabolites are capable of effectively penetrating the BBB and undergoing bidirectional transport between the brain and peripheral circulation, thereby providing a structural basis for brain–blood metabolic coupling under CIRI.
Figure 7.
Network toxicology prediction results. (A) Heatmap of multi-endpoint toxicity prediction; (B) bar chart of predicted probabilities for neurotoxicity and blood–brain barrier permeability; (C) intersection of metabolite targets and disease targets; (D) protein–protein interaction (PPI) network of the 452 intersecting targets; (E) PPI network of the top 100 targets ranked by degree; (F) PPI network of the top 20 core targets ranked by degree, with node color and size both positively correlated with degree; (G) GO functional enrichment analysis of intersecting targets: biological processes (red), cellular components (blue), and molecular functions (green); and (H) KEGG pathway enrichment analysis of intersecting targets.
3.7. Potential Targets Associated with Neurotoxic Metabolites and Enrichment Analysis
A total of 944, 37, and 443 potential targets were predicted from the ChEMBL, STITCH, and Swiss Target Prediction databases, respectively; after deduplication, 1363 metabolite-related targets were obtained. In parallel, 5056 disease-related genes were retrieved from five disease databases using CIRI as the keyword. Intersection of the metabolite targets and disease genes yielded 452 overlapping genes (Figure 7C), which were regarded as potential targets mediating neurotoxic injury in CIRI. These potential targets were imported into STRING to construct a protein–protein interaction (PPI) network, which was visualized and topologically analyzed in Cytoscape; hub targets were selected by degree value (Figure 7D–F). The top 20 targets ranked by degree were, in descending order: AKT1, HSP90AA1, STAT3, SRC, EGFR, MYC, CASP3, ESR1, PTEN, MAPK3, GAPDH, KRAS, CASP8, SIRT1, PIK3CA, ERBB2, MAPK1, JAK2, HDAC1, and STAT1 (Figure 7F).
GO enrichment analysis showed that, at the biological process level, the targets were mainly enriched in classical injury-response processes including inflammatory response, response to exogenous stimuli, negative regulation of apoptosis, and response to hypoxia, alongside significant enrichment of signal transduction terms such as calcium-mediated signaling, PI3K-Akt signaling, and ERK1/2 cascade regulation. At the cellular component level, the proteins encoded by the intersecting genes were mainly associated with GO terms related to the plasma membrane, dendrites, the postsynaptic membrane, and signal receptor complexes. At the molecular function level, enriched terms included protein kinase activity, tyrosine kinase activity, serine/threonine kinase activity, ATP binding, and enzyme binding (Figure 7G). KEGG pathway enrichment further revealed that the intersecting targets were significantly enriched in Pathways in cancer, Lipid and atherosclerosis, Neuroactive ligand–receptor interaction, and Apoptosis, while pathways including pancreatic cancer, proteoglycans in cancer, and the AGE-RAGE signaling pathway in diabetic complications also showed high significance (Figure 7H).
3.8. “Metabolite–Target–Pathway–Disease” Network Analysis
To visually represent the overall mechanism by which neurotoxic metabolites participate in CIRI through the regulation of key targets and pathways, a multidimensional “metabolite–target–pathway–disease” interaction network was constructed in Cytoscape by integrating the 8 metabolites, 452 intersecting targets, core enriched pathways, and CIRI disease information (Figure 8). Network topological analysis revealed that, at the metabolite level, 3-Methylhistidine exhibited the highest degree value (186), making it the most central metabolite in the network, followed by N4-Acetylcytidine (68), ThMP (49), and Trigonelline (49). At the gene target level, MAPK3, AKT1, AKT3, and MAPK1 shared the highest degree (15), followed by PIK3CB, PIK3CA, and PIK3CD (14), suggesting that the PI3K-Akt–MAPK signaling axis serves as the core molecular hub through which metabolites regulate CIRI. At the pathway level, Pathways in cancer (hsa05200) showed the highest degree (97), followed by Neuroactive ligand–receptor interaction (hsa04080, 56), Lipid and atherosclerosis (hsa05417, 51), and Apoptosis (hsa04210, 43). These pathways encompass core pathological processes of CIRI, including signal transduction, neurotransmitter regulation, lipid metabolic disturbance, and apoptosis, indicating that the 8 neurotoxic metabolites synergistically mediate ischemia–reperfusion-induced neuronal injury and metabolic disturbance by targeting key nodal genes within the PI3K-Akt, MAPK, neuroactive ligand–receptor interaction, and apoptosis pathways. This network provides a systematic molecular regulatory framework for elucidating the endogenous metabolic toxicity mechanism of CIRI.
Figure 8.
Multidimensional “metabolite–target–pathway–disease” interaction network. Orange nodes represent neurotoxic metabolites, green nodes represent intersecting gene targets, blue nodes represent core enriched pathways, and red nodes represent CIRI. Node size is positively correlated with degree, and connecting lines represent associations between nodes.
3.9. Molecular Docking Results
To assess the ability of metabolites identified by network toxicology as potentially neurotoxic to bind core CIRI targets, molecular docking was performed for eight metabolites against five target proteins: MAPK3 (ERK1), MAPK1 (ERK2), AKT1, PIK3CB, and KRAS. The binding-energy heatmap is shown in Figure 9A. The docking results revealed a clear gradient in binding energy across the 8 metabolites and 5 targets. Xanthosine had the most favorable predicted binding energy with KRAS (−8.06 kcal/mol) and also showed favorable predicted binding energies with MAPK3 (−7.63 kcal/mol) and AKT1 (−7.47 kcal/mol). Most metabolites had predicted binding energies below −5 kcal/mol. From the target perspective, MAPK3 showed the largest number of favorable docking scores among the tested targets, suggesting that the MAPK/ERK pathway may be a primary node of action for neurotoxic metabolites. The five complexes with the lowest binding energies were further examined using three-dimensional binding-mode analysis to characterize predicted ligand positions within the binding pockets, hydrogen-bond networks, and key interacting residues at the atomic level (Figure 9B–F). Overall, the docking results identified Xanthosine, N4-Acetylcytidine, and ThMP as the candidate metabolites with the most favorable predicted binding to key MAPK/PI3K-Akt pathway proteins. Among these metabolites, Xanthosine may interact with both the KRAS–ERK1/2 axis and AKT1-mediated survival signaling.
Figure 9.
Molecular docking results. (A) Heatmap of binding energies (kcal/mol) for the docking of eight metabolites with five target proteins; (B–F) three-dimensional binding modes of the top five complexes with the lowest binding energies: (B) Xanthosine–KRAS (4OBE, −8.06 kcal/mol); (C) Xanthosine–MAPK3 (2ZOQ, −7.63); (D) Xanthosine–AKT1 (4GV1, −7.47); (E) ThMP–MAPK3 (2ZOQ, −7.32); and (F) N4-Acetylcytidine–MAPK3 (2ZOQ, −7.17). Green stick models: Metabolites; cyan stick models: interacting pocket residues; yellow dashed lines: hydrogen bonds/polar contacts (bond length in Å).
3.10. Molecular Dynamics Simulation Results
To assess the reliability of the static docking results, the five complexes with the most favorable binding energies—Xanthosine–KRAS, Xanthosine–MAPK3, Xanthosine–AKT1, ThMP–MAPK3, and N4-Acetylcytidine–MAPK3—were subjected to 100 ns molecular dynamics simulations (Figure 10). RMSD analysis showed that protein backbone RMSDs for all five complexes reached a plateau within the first 10–20 ns and subsequently remained at 0.20–0.25 nm. Ligand RMSDs also reached plateaus after conformational adjustment, with Xanthosine–MAPK3 and ThMP–MAPK3 showing the lowest ligand RMSDs. Rg analysis showed that the radii of gyration of all five complexes remained within a steady range (1.53–2.16 nm) throughout the 100 ns simulation without a persistent increasing trend, indicating that the proteins maintained a well-folded state and did not undergo unfolding. RMSF analysis revealed that residue flexibility was mainly concentrated in loop and terminal regions, while the RMSF of core residues near the binding pocket was consistently below 0.2 nm, demonstrating that ligand binding did not induce abnormal flexibility in key regions.
Figure 10.
Stability analysis of the five complexes during 100 ns molecular dynamics simulations. Top row: time evolution of protein backbone (black) and ligand (red) RMSD; middle row: time evolution of complex radius of gyration (Rg); bottom row: per-residue root-mean-square fluctuation (RMSF) of each protein. Columns from left to right: Xanthosine (Xan)-KRAS, Xanthosine-MAPK3, Xanthosine-AKT1, ThMP-MAPK3, and N4-Acetylcytidine (N4AcC)-MAPK3.
4. Discussion
This study first validated the MCAO/R model through neurological scoring, TTC staining, and HE and Nissl staining. The results showed that rats in the Model group exhibited clear neurological deficits and cerebral histopathological damage, confirming successful and stable CIRI induction and providing a reliable foundation for subsequent brain and serum metabolomic analyses. Building on this, we employed a paired brain–serum sample design and integrated UHPLC-MS/MS untargeted metabolomics with network toxicology to systematically characterize metabolic disturbances and the brain–blood metabolic coupling mechanism under CIRI. Through toxicity prediction, target network analysis, molecular docking, and dynamics simulation, we further revealed the neurotoxic potential of differential metabolites and their key signaling pathways and molecular targets. The results demonstrated that CIRI induces significant and compartment-specific metabolic remodeling in both brain tissue and serum. After rigorous annotation curation, 27 endogenous shared differential metabolites were identified, displaying three patterns—synchronous up-regulation, synchronous down-regulation, and “brain-up/serum-down”—suggesting a complex bidirectional brain–blood metabolic coupling relationship. Network toxicology further showed that 8 of these metabolites possess explicit neurotoxic potential and can effectively penetrate the BBB, participating in CIRI pathogenesis by targeting core nodes of the PI3K-Akt, MAPK, and apoptosis pathways and forming a complete “metabolite–target–pathway–disease” regulatory network. Molecular docking and 100 ns molecular dynamics simulations further supported the predicted binding of core metabolites to key targets and the stability of the resulting complexes, with Xanthosine showing favorable docking energies and stable simulated interactions with KRAS, MAPK3, and AKT1.
Regarding brain–blood metabolic coupling characteristics, 74.1% (20/27) of the shared differential metabolites showed synchronous changes, indicating that CIRI-induced metabolic disturbance has a pronounced systemic character. At the pathway level, the two compartments shared 48 enriched pathways, dominated by amino acid metabolism (25.0%), carbohydrate metabolism (16.7%), cofactor and vitamin metabolism (14.6%), and lipid metabolism (12.5%), suggesting that brain–blood coordinated metabolic remodeling centers on three core substance classes: energy substrates, structural lipids, and cofactors. However, separate enrichment analyses of metabolites with increased and decreased abundance revealed marked compartment specificity: in serum, amino acid biosynthesis, carbon metabolism, and glycerophospholipid metabolism were overall down-regulated while nucleotide and pyrimidine metabolism were up-regulated; in brain tissue, nucleotide, purine, and glycerophospholipid metabolism were predominantly down-regulated while amino acid biosynthesis was up-regulated.
This differential pattern of “peripheral anabolic suppression versus central nucleotide catabolic enhancement” reflects a reprioritization of metabolic resource allocation between the brain and peripheral organs under ischemia [37]. Notably, the down-regulation of purine and nucleotide metabolism in brain tissue does not indicate active nucleic acid synthesis but rather reflects the direct consequence of massive ATP degradation and purine nucleotide pool depletion after ischemia [38], whereas the up-regulation of serum nucleotide and pyrimidine metabolism may represent a systemic response to peripheral immune cell activation and nucleic acid debris release following tissue injury [39,40].
Using these metabolite and pathway results, we selected 11 core metabolites through the metabolite–pathway association network and classified them into three functional groups. First, Pantothenic acid, ThMP, and Nicotinamide participate in coenzyme A synthesis, thiamine metabolism, and nicotinate/nicotinamide metabolism, respectively, collectively converging on core processes of the tricarboxylic acid cycle, oxidative phosphorylation, and redox homeostasis; their synchronous dysregulation suggests a global remodeling of energy production and redox capacity in CIRI. Second, Phenylalanine, 3-Methylhistidine, and 4-Guanidinobutyric acid cluster within amino acid metabolic networks, while Uracil and Xanthosine involve pyrimidine and purine metabolism, respectively, indicating that protein/amino acid metabolic remodeling coexists with aberrant nucleic acid and nucleotide turnover. Third, cis-11,14-Eicosadienoic acid, Mannitol, and 5-Aminolevulinic acid are associated with unsaturated fatty acid, carbohydrate, and porphyrin metabolism, respectively; fatty acid metabolic abnormalities are closely linked to membrane remodeling and lipid peroxidation, while alterations in porphyrin and carbohydrate metabolism further indicate that CIRI metabolic remodeling spans multiple dimensions, including membrane lipid homeostasis, basal substrate metabolism, and cellular redox environment.
Among the four metabolites with increased abundance in both compartments, phenylalanine is a well-established substrate of L-type amino acid transporter 1 (LAT1) and can competitively inhibit cerebral uptake of tryptophan and tyrosine [41]. Its pathological elevation exerts neurotoxicity through multiple mechanisms, including competition with large neutral amino acids for BBB transport, the suppression of dopamine and serotonin synthesis, the over-activation of GluN2B-containing NMDA receptors, and the induction of oxidative stress [42]. The synchronous elevation in Uracil is consistent with up-regulated pyrimidine metabolism, reflecting systemic activation of nucleic acid catabolism after ischemia; aberrant incorporation of uracil into DNA can induce hippocampal neuronal apoptosis via the DNA damage–p53 pathway, whereas its nucleoside form, uridine, mediates neuroprotection through P2Y receptors at physiological concentrations [43]. Pantothenic acid accumulation as a coenzyme A precursor may represent a compensatory response to energy failure; by generating acetyl-CoA, it supports acetylcholine synthesis and myelin fatty acid chain elongation, and may also regulate microglial JAK2/STAT3 inflammatory signaling and maintain glutathione reducing potential to exert neuroprotective effects [44]. 3-Methylhistidine, as a specific marker of myofibrillar protein degradation, indicates enhanced systemic skeletal muscle proteolysis after stroke [45]; its plasma levels are elevated in stroke patients but reduced in hypoxic–ischemic encephalopathy, suggesting its potential as a metabolic marker of neurological disease states [46,47]. It should be noted that, as an untargeted metabolomics study, the metabolite annotated as 3-methylhistidine was identified based on retention time and MS/MS spectral matching; in the absence of authentic standard co-injection comparison, the possibility of confusion with the dietary-derived isomer 1-methylhistidine cannot be completely excluded. Its biological interpretation as a marker of muscle protein degradation awaits confirmation by targeted MRM validation in future studies.
The three synchronously down-regulated metabolites all point to an energy metabolic crisis. ThMP is a coenzyme precursor for pyruvate dehydrogenase and α-ketoglutarate dehydrogenase; its depletion directly blocks tricarboxylic acid (TCA) cycle operation, and as the neutral form for thiamine transport across cell membranes, it constitutes an important component of thiamine supply to neural tissue [48]. The decline in Nicotinamide as an NAD+ precursor is closely associated with NAD+ consumption driven by excessive poly(ADP-ribose) polymerase-1 (PARP-1) activation after cerebral ischemia–reperfusion; NAD+ deficiency simultaneously impairs ATP production and sirtuin 1 (SIRT1)-mediated damage repair, whereas nicotinamide can maintain neuronal energy metabolism, suppress apoptosis, and promote remyelination through the NAD+ salvage pathway and hydroxycarboxylic acid receptor 2 (Hcar2)–sirtuin 3 (SIRT3)/PARP mechanisms [49]. 4-Guanidinobutyric acid, a metabolite generated from arginine and gamma-aminobutyric acid (GABA) via transamidation, can mimic GABAergic inhibitory effects to regulate neurotransmission; its reduction may weaken inhibitory neurotransmission and exacerbate excitotoxicity [50].
The four “brain-up/serum-down” reverse-pattern metabolites display striking compartment specificity. Xanthosine shows brain-specific elevation against a background of overall down-regulated purine metabolism, reflecting a redirection of purine metabolic flux: after cerebral ischemia, massive ATP degradation depletes the purine nucleotide pool, while its upstream molecule guanosine exerts neuroprotective effects in the MCAO model [51]; downstream salvage synthesis is constrained by energy depletion, causing nucleoside intermediates such as xanthosine to accumulate in the brain. Meanwhile, purines in blood can be rapidly taken up by erythrocytes and degraded to uric acid [52], generating the “brain-up/serum-down” compartmental difference. 5-Aminolevulinic acid (5-ALA), the first rate-limiting precursor of heme biosynthesis, shows brain elevation and serum reduction, suggesting the uncoupling of central and peripheral heme metabolism under CIRI: mitochondrial dysfunction in the brain feedback-activates ALA synthase to increase 5-ALA production, but downstream ferrochelatase is inhibited under oxidative stress, leading to 5-ALA retention and iron-dependent auto-oxidation that generates reactive oxygen species (ROS) and contributes to oxidative damage [53]. The serum reduction arises from altered hepatic heme synthesis demand and inflammatory mediator suppression of ALA-metabolizing enzymes; moreover, 5-ALA can saturate hepatic tryptophan pyrrolase—which uses heme as a cofactor—thereby enhancing tryptophan catabolism and reducing cerebral tryptophan uptake, exemplifying pathway crosstalk between peripheral heme synthesis and amino acid metabolism [54]. cis-11,14-Eicosadienoic acid 20:2n−6, an omega-6 polyunsaturated fatty acid (PUFA), shows brain elevation that directly reflects enhanced membrane phospholipid degradation triggered by cytosolic phospholipase A2 alpha (cPLA2α) activation after ischemia; neuronal membranes are rich in PUFAs (25–30% of total fatty acids) and are therefore particularly susceptible [55]. The released free PUFAs are oxidized via lipoxygenase (LOX) and Fenton reactions to generate lipid peroxides, which are further degraded into toxic aldehydes such as 4-hydroxynonenal (4-HNE) and malondialdehyde (MDA), driving ferroptosis [56]; its serum reduction reflects rapid peripheral uptake and metabolism of PUFAs, and clinical studies have confirmed that plasma PUFA profiles in acute ischemic stroke patients are closely associated with prognosis [57]. Collectively, these core metabolites and their associated pathways point to a systemic metabolic reprogramming in CIRI that is grounded in energy metabolic imbalance, characterized by amino acid and nucleotide metabolic remodeling, and accompanied by coordinated dysregulation of lipid, carbohydrate, and porphyrin metabolic networks, suggesting that CIRI-induced metabolic abnormalities exhibit multi-pathway synergy and functional module clustering.
Regarding endogenous metabolic toxicity, network toxicology predictions based on ProTox 3.0 and ADMETlab 2.0 revealed that 8 of the 27 brain–blood shared differential metabolites were predicted to possess explicit neurotoxic activity. This finding directly links brain–blood metabolic coupling to metabolic toxicity—while the traditional view regards endogenous metabolites merely as passive biomarkers of pathology, the recent concept of “endogenous neurotoxicity” proposes that metabolites accumulating under homeostatic imbalance can themselves directly mediate neuronal injury through excitotoxicity, oxidative stress, and mitochondrial dysfunction [58]. Moreover, all 8 metabolites exhibited high BBB permeability; ischemia-induced functional alterations in BBB transporters such as glucose transporter 1 (GLUT1), monocarboxylate transporter 1 (MCT1), and LAT1 [14,59,60] may provide the structural basis for toxic metabolite formation, suggesting that these metabolites can shuttle bidirectionally across the central–peripheral interface between brain tissue and the circulation, thereby breaching the anatomical isolation of the BBB and directly participating in central neurotoxic injury. Multi-organ toxicity prediction further showed (Figure 7A) that N4-Acetylcytidine had the highest predicted respiratory toxicity and Phenylalanine the highest cardiotoxicity, suggesting that aberrantly accumulated endogenous metabolites under CIRI may simultaneously mediate multi-organ injury in the heart, lung, and other systems, consistent with the clinical features of cardiac–cerebral comorbidity and systemic inflammatory response syndrome after stroke.
From a molecular mechanistic perspective, after ischemia–reperfusion, inhibition of the PI3K-Akt pathway weakens neuronal survival signaling, whereas activation of the MAPK cascade—particularly p38 and c-Jun N-terminal kinase (JNK)—promotes inflammatory cytokine release and apoptotic execution [61,62]. Concurrently, NAD+ depletion-driven PARP overactivation further aggravates energy failure and parthanatos, a programmed cell death modality [63]; together these constitute a cascade of “metabolic toxicity–signaling pathway dysregulation–neuronal death.” Network analysis of the “metabolite–target–pathway–disease” network revealed that multiple core metabolites, including 3-Methylhistidine, Phenylalanine, and Uracil, exhibited high connectivity, suggesting that they are not merely incidental peripheral metabolic byproducts but rather synergistically mediate CIRI through multiple dimensions—suppression of neuronal survival signaling, activation of inflammatory cascades, and execution of cell death—by targeting core genes within PI3K-Akt, MAPK, and apoptosis pathways, such as AKT1, MAPK3, STAT3, and CASP3 [20,61,64,65].
Notably, xanthosine displayed multi-target binding capacity toward KRAS, MAPK3, and AKT1 in molecular docking. This concurrent engagement of KRAS, the upstream initiator of the MAPK/ERK axis, and AKT1, the core kinase of the PI3K-Akt pathway, is consistent with its high connectivity in the multidimensional network. Given that xanthosine is a purine nucleoside and that the GDP/GTP-binding pocket of KRAS as well as the ATP-binding pockets of MAPK3 (ERK1) and AKT1 all harbor conserved purine-recognition regions, it is reasonable to speculate that xanthosine may mimic endogenous purine nucleotides (GDP/GTP or ATP) and interfere with nucleotide-dependent signaling at these targets through competitive occupancy. Nevertheless, this competitive mechanism remains hypothetical and requires validation by in vitro GTPase activity assays, kinase inhibition assays, and ligand–competition binding experiments [37,66]. The 100 ns molecular dynamics simulations further showed that the xanthosine–MAPK3 complex remained conformationally stable throughout the trajectory, with no abnormal increase in the flexibility of residues near the binding pocket, suggesting that this interaction is structurally grounded rather than a purely transient collision; however, its binding specificity remains to be confirmed by key-residue mutagenesis or competitive ligand experiments. Mechanistically, if brain-accumulated xanthosine after ischemia were indeed to engage functionally with the nucleotide-binding pocket of KRAS and the ATP-binding pockets of MAPK3 and AKT1, it could potentially establish a link between purine metabolic disturbance and signaling dysregulation by interfering with the RAS–ERK cascade and PI3K-Akt survival signaling. The net effect on downstream inflammation, apoptosis, and neuronal survival—whether inhibitory or activating—remains to be determined at the cellular and animal levels. These findings provide preliminary computational support for the hypothesis that endogenous metabolites may participate in CIRI regulation through direct binding to signaling proteins, suggesting that aberrantly accumulated purine metabolites may act not merely as pathological epiphenomena but as endogenous ligand-like molecules capable of engaging key signaling nodes. Nevertheless, this “metabolite hijacking of signaling pathways” model remains a working hypothesis awaiting experimental validation [67]. The stable binding of ThMP to MAPK3 is also noteworthy: its phosphate group may mimic the phosphate moiety of ATP, suggesting that thiamine metabolic disturbance may directly interfere with kinase signaling beyond the known impairment of energy metabolism, providing a novel molecular explanation for the neurotoxicity of ThMP depletion [68].
Taken together, the findings suggest that brain–blood metabolic coupling in CIRI may involve the transport of endogenous metabolites with neurotoxic potential across the compromised BBB and their interactions with key survival and apoptosis pathways, such as PI3K-Akt and MAPK. This “endogenous metabolic toxicity” perspective offers a conceptual framework for understanding CIRI that is distinct from the traditional excitotoxicity and oxidative stress paradigms, and provides candidate molecular targets for therapeutic intervention.
However, several limitations of the present study should be acknowledged. First, the metabolomics sample size was relatively limited (n = 5 per group), and only a single time point at 24 h after reperfusion was examined, which restricts the statistical power and the characterization of dynamic metabolic changes during CIRI. Second, all metabolite identifications were at MSI Level 2 (based on retention time, accurate m/z, and MS/MS spectral library matching) and were not confirmed by authentic standard co-injection; the precise structure, hydroxyl position, and double-bond geometry of several isomers (e.g., 3-methylhistidine versus 1-methylhistidine, hydroxylated isoleucine isomers, and 20:2 fatty acid isomers) could not be fully resolved under untargeted conditions, and glycerophospholipids were reported only at the sum-composition level. In addition, several metabolites in Table 2 (e.g., 4-hydroxyisoleucine and 1-phenyl-6,7-dihydroxy-isochroman) are likely of plant or microbial origin and may reflect confounders from feed, bedding, or gut microbiota, raising the possibility of false positives; the brain–serum Spearman correlation analysis was based on n = 10 observations, and the p-values for some correlations did not reach 0.05, so these should be regarded as trend-level evidence. At the mechanistic level, the neurotoxicity predictions, BBB permeability predictions, and binding to KRAS/MAPK3/AKT1 for the eight metabolites were all in silico inferences; molecular docking and 100 ns molecular dynamics simulations only demonstrated the structural feasibility of binding and cannot be equated with functional interactions. Moreover, the bidirectional brain–blood metabolic transport lacks direct evidence from isotope tracing, and the direction and rate of BBB leakage have not been directly measured. Finally, although the metabolites identified in this study may serve as potential diagnostic and prognostic biomarkers for ischemic stroke, the present findings are derived from an experimental animal model, and their clinical relevance remains to be further clarified.
To address these limitations, future studies will proceed in the following directions: (1) enlarging the animal sample size and incorporating multiple time points after reperfusion (e.g., 6 h, 24 h, 72 h, and 7 d) to delineate the dynamic evolution of brain–blood metabolic coupling; (2) applying targeted MRM quantification to the 11 core metabolites and 8 neurotoxic candidate metabolites, with authentic standard co-injection to confirm isomeric structures; (3) administering exogenous xanthosine and other metabolites in an OGD/R neuronal model, combined with siRNA knockdown of KRAS/MAPK3/AKT1, SPR/MST determination of true Kd values, and enzymatic activity assays to verify binding direction and functional effects; (4) directly validating the trans-BBB transport of candidate metabolites through in vitro bEnd.3/MDCK monolayer TEER measurements, Evans Blue extravasation, and isotope tracing; and (5) measuring core metabolite levels in a serum cohort of ischemic stroke patients, constructing ROC curves, and analyzing their correlation with NIHSS scores, infarct volume, and clinical prognosis, ultimately to facilitate the translational application of these findings.
5. Conclusions
Based on paired brain tissue and serum samples, this study employed an integrated metabolomics and network toxicology strategy to systematically reveal three typical patterns of brain–blood metabolic coupling in CIRI: increased abundance in both compartments, decreased abundance in both compartments, and increased abundance in brain tissue with decreased abundance in serum. A total of 27 endogenous shared differential metabolites and 11 core metabolites were identified, primarily involving coordinated dysregulation of amino acid, nucleotide, cofactor/vitamin, and lipid metabolic pathways. Network toxicology further revealed that 8 metabolites possess in silico-predicted neurotoxic potential and can penetrate the BBB, participating in CIRI pathogenesis by targeting core nodes of the PI3K-Akt, MAPK, and apoptosis pathways; molecular docking and molecular dynamics simulations validated the stable binding of Xanthosine and other metabolites to KRAS, MAPK3, and AKT1 at the atomic level. From the perspective of endogenous metabolic toxicity, this study provides a novel theoretical basis for elucidating the brain–blood metabolic coupling mechanism of CIRI. The core metabolites identified in this study hold promise as candidate biomarkers for the early diagnosis and prognostic evaluation of ischemic stroke; however, these findings are based on an animal model and require prospective validation in human cohorts before clinical translation. The metabolites with predicted neurotoxic potential and their associated signaling pathways also represent potential therapeutic targets for precision intervention in CIRI, beyond conventional anti-inflammatory and antioxidant strategies. These findings suggest that the prevention and treatment of CIRI should not be limited to symptomatic intervention at a single node but should target the overall regulation of brain–blood metabolic coupling; specifically, targeted clearance or blockade of neurotoxic metabolites and restoration of central–peripheral metabolic homeostasis may provide new avenues for comprehensive intervention in ischemic stroke.
Supplementary Materials
The following supporting information can be downloaded at https://www.mdpi.com/article/10.3390/metabo16110901/s1, Figure S1: Permutation tests of the OPLS-DA models for serum and brain tissue metabolomics.(A, B) Histograms of 200 permutation tests for serum (A) and brain tissue (B), with blue bars representing R2Y and red bars representing Q2. Serum: R2Y = 0.994, Q2 = 0.786; brain tissue: R2Y = 0.986, Q2 = 0.567; all p < 0.05. (C, D) Permutation test scatter plots for serum (C) and brain tissue (D), with blue dots representing R2Y, red squares representing Q2, and dashed lines representing regression lines. The intercepts of the Q2 regression lines were both negative (serum: −0.51; brain: −0.34), indicating that the models were free of overfitting; Figure S2: Screening of differential metabolites. A: Volcano plot of differential metabolites in serum. B: Volcano plot of differential metabolites in brain tissue. C: Venn diagram of differential metabolites between serum and brain tissue, with detailed information on the 36 shared differential metabolites; Figure S3: Screening and cluster analysis of the 27 differential metabolites. A: Hierarchical clustering heatmap of shared differential metabolites in serum samples. B: Hierarchical clustering heatmap of shared differential metabolites in brain tissue samples. C: Clustering information of the 27 shared brain–blood differential metabolites; Table S1: Detailed information on the annotation of 27 metabolites based on retention time, accurate mass-to-charge ratio (mass error < 5 ppm), and MS/MS spectral matching; Table S2. Details of 27 metabolites; Table S3: Spearman quantitative correlation analysis of the 27 shared differential metabolites between brain tissue and serum.
Author Contributions
Z.S.: Conceptualized and supervised the research, performed data analysis, and drafted the original manuscript. N.C.: Critically revised the manuscript for intellectual content and language refinement. S.T.: Conducted experimental testing, collected data, and maintained research records. J.Y. (Jingyi Yang): Curated datasets, validated experimental protocols, and provided technical support. S.C.: Executed laboratory procedures and assisted in experimental validation. Corresponding Authors, H.L. and J.Y. (Jingxin Yao): Oversaw the research direction, interpreted analytical results, and finalized manuscript revisions. W.L.: Coordinated project funding, co-supervised methodology, and approved the manuscript for submission. All authors have read and agreed to the published version of the manuscript.
Funding
This study was supported by the National Natural Science Foundation of China (81473567), the Hunan Natural Science Foundation (2023JJ30451 and 2025JJ50719), the Hunan Province Health Research Project (20256419), and Changsha Natural Science Foundation (kq2402178).
Institutional Review Board Statement
All experimental procedures involving animals were performed in strict accordance with the “Guide for the Care and Use of Laboratory Animals” and were approved by the Experimental Animal Ethics Committee of Hunan University of Chinese Medicine (approval no. HNUCM21-2603-58; approval date: 2026.2.20). The animals were purchased from Hunan SJA Laboratory Animal Co., Ltd. (production license no. SCXK (Xiang) 2021-0002; certificate no. 430727261100566128, 430727261100517073). Every effort was made to minimize animal suffering and to reduce the number of animals used.
Informed Consent Statement
Not Applicable.
Data Availability Statement
The detailed identification information of the 27 shared metabolites—including compound name, molecular formula, retention time, accurate mass, MS/MS fragment ions, and identification confidence level—is provided in Supplementary Table S1. Their quantitative changes in brain tissue and serum, including VIP values, fold changes, raw and FDR-adjusted p-values, and KEGG pathway annotations, are summarized in Supplementary Table S2.
Acknowledgments
The metabolomics part: TMT-labeled proteome quantification and data analysis was performed by Shanghai Baoshu Biotechnology Co., Ltd. (Shanghai, China). Guidance was provided by the team of Li Xiaojuan from the College of Traditional Chinese Medicine at Jinan University during the experimental testing and analysis process.
Conflicts of Interest
The authors declare no conflict of interest.
Abbreviations
The following abbreviations are used in this manuscript:
| 4-HNE | 4-Hydroxynonenal |
| ATP | Adenosine triphosphate |
| BBB | Blood–brain barrier |
| CIRI | Cerebral ischemia–reperfusion injury |
| CoA | Coenzyme A |
| cPLA2α | Cytosolic phospholipase A2 alpha |
| DA | Directional analysis |
| DAVID | Database for Annotation, Visualization, and Integrated Discovery |
| ESI | Electrospray ionization |
| FC | Fold change |
| FDR | False discovery rate |
| GABA | Gamma-aminobutyric acid |
| GLUT1 | Glucose transporter 1 |
| GO | Gene Ontology |
| HE | Hematoxylin–eosin |
| HMDB | Human Metabolome Database |
| IL-1β | Interleukin-1 beta |
| IL-6 | Interleukin-6 |
| JAK2/STAT3 | Janus kinase 2/signal transducer and activator of transcription 3 |
| KEGG | Kyoto Encyclopedia of Genes and Genomes |
| LAT1 | L-type amino acid transporter 1 |
| MAPK | Mitogen-activated protein kinase |
| MCAO/R | Middle cerebral artery occlusion/reperfusion |
| MDA | Malondialdehyde |
| MCT1 | Monocarboxylate transporter 1 |
| MD | Molecular dynamics |
| mNss | Modified neurological severity score |
| NAD+ | Nicotinamide adenine dinucleotide |
| OPLS-DA | Orthogonal partial least squares discriminant analysis |
| PARP | Poly(ADP-ribose) polymerase |
| PCA | Principal component analysis |
| PDB | Protein Data Bank |
| PI3K-Akt | Phosphatidylinositol 3-kinase–protein kinase B |
| PPI | Protein–protein interaction |
| PUFA | Polyunsaturated fatty acid |
| RMSD | Root-mean-square deviation |
| RMSF | Root-mean-square fluctuation |
| Rg | Radius of gyration |
| ROS | Reactive oxygen species |
| SD | Sprague–Dawley |
| SPF | Specific pathogen-free |
| TCA | Tricarboxylic acid |
| TMP | Thiamine monophosphate |
| TNF-α | Tumor necrosis factor alpha |
| TTC | 2,3,5-Triphenyltetrazolium chloride |
| UHPLC-MS/MS | Ultra-high-performance liquid chromatography–tandem mass spectrometry |
| VIP | Variable importance in projection |
| 5-ALA | 5-Aminolevulinic acid |
References
- Cheng, Y.; Lin, Y.; Shi, H.; Cheng, M.; Zhang, B.; Liu, X.; Shi, C.; Wang, Y.; Xia, C.; Xie, W. Projections of the Stroke Burden at the Global, Regional, and National Levels up to 2050 Based on the Global Burden of Disease Study 2021. J. Am. Heart Assoc. 2024, 13, e036142. [Google Scholar] [CrossRef] [Scilit]
- Liu, S.; Li, Y.; Lan, X.; Wang, L.; Li, H.; Gu, D.; Wang, M.; Liu, J. Global, regional, and national trends in ischaemic stroke burden and risk factors among adults aged 20 + years (1990–2021): A systematic analysis of data from the Global Burden of Disease study 2021 with projections into 2050. Front. Public Health 2025, 13, 1567275. [Google Scholar] [CrossRef] [Scilit]
- National Program for Stroke Prevention and Million Disability Reduction Initiative Expert Committee. China Stroke Prevention and Control Report 2024: An executive summary. Brain Circ. 2025, 11, 251–260. [Google Scholar] [CrossRef] [Scilit]
- Feigin, V.L.; Owolabi, M.O.; World Stroke Organization–Lancet Neurology Commission Stroke Collaboration Group. Pragmatic solutions to reduce the global burden of stroke: A World Stroke Organization–Lancet Neurology Commission. Lancet Neurol. 2023, 22, 1160–1206. [Google Scholar] [CrossRef] [Scilit]
- Guo, S.; Liu, R.; Cheng, S.; Liu, X.; Wu, J. Mechanisms and Therapeutic Targets of Ischemia—Reperfusion Injury in Stroke: A Narrative Review Focusing on Blood—Brain Barrier Dysfunction. Brain Sci. 2026, 16, 469. [Google Scholar] [CrossRef] [Scilit]
- Pan, J.; Konstas, A.-A.; Bateman, B.; Ortolano, G.A.; Pile-Spellman, J. Reperfusion injury following cerebral ischemia: Pathophysiology, MR imaging, and potential therapies. Neuroradiology 2007, 49, 93–102. [Google Scholar] [CrossRef] [Scilit]
- Wang, Y.; Ge, M.; Wang, J.; Xu, Y.; Wang, N.; Xu, S. Metabolic reprogramming in ischemic stroke: When glycolytic overdrive meets lipid storm. Cell Death Dis. 2025, 16, 788. [Google Scholar] [CrossRef] [Scilit]
- Liu, Y.; Hu, P.; Cheng, H.; Xu, F.; Ye, Y. The impact of glycolysis on ischemic stroke: From molecular mechanisms to clinical applications. Front. Neurol. 2025, 16, 1514394. [Google Scholar] [CrossRef] [Scilit]
- Xue, D.; Wei, C.; Zhou, Y.; Wang, K.; Zhou, Y.; Chen, C.; Li, Y.; Sheng, L.; Lu, B.; Zhu, Z.; et al. TRIOL Inhibits Rapid Intracellular Acidification and Cerebral Ischemic Injury: The Role of Glutamate in Neuronal Metabolic Reprogramming. ACS Chem. Neurosci. 2022, 13, 2110–2121. [Google Scholar] [CrossRef] [Scilit]
- D’Apolito, E.; Sisalli, M.J.; Tufano, M.; Annunziato, L.; Scorziello, A. Oxidative Metabolism in Brain Ischemia and Preconditioning: Two Sides of the Same Coin. Antioxidants 2024, 13, 547. [Google Scholar] [CrossRef] [Scilit]
- Baranovicova, E.; Kalenska, D.; Kaplan, P.; Kovalska, M.; Tatarkova, Z.; Lehotsky, J. Blood and Brain Metabolites after Cerebral Ischemia. Int. J. Mol. Sci. 2023, 24, 17302. [Google Scholar] [CrossRef] [Scilit]
- Liu, R.; Cao, S.; Cai, Y.; Zhou, M.; Gou, X.; Huang, Y. Brain and serum metabolomic studies reveal therapeutic effects of san hua decoction in rats with ischemic stroke. Front. Endocrinol. 2023, 14, 1289558. [Google Scholar] [CrossRef] [Scilit]
- Zhuang, H.; Tang, X.; Zhang, Y.; Han, Y.; Huang, Z.; Xin, J.; Yu, H. Metabolic reprogramming of oligodendrocyte lineage cells in ischemic stroke: Insights from literature review and a single-cell transcriptomic re-analysis. J. Cereb. Blood Flow Metab. 2026, 46, 3059–3069. [Google Scholar] [CrossRef] [Scilit]
- Li, C.; Ibrahim, M.M.; Fang, C. MFSD2A: A molecular nexus linking blood–brain barrier, lipid metabolism, and ischemia–reperfusion injury. Cell. Mol. Biol. Lett. 2025, 30, 148. [Google Scholar] [CrossRef] [Scilit]
- Sostare, E.; Lawson, T.N.; Saunders, L.R.; Colbourne, J.K.; Weber, R.J.M.; Sobanski, T.; Viant, M.R. Knowledge-Driven Approaches to Create the MTox700+ Metabolite Panel for Predicting Toxicity. Toxicol. Sci. 2022, 186, 208–220. [Google Scholar] [CrossRef] [Scilit]
- Sun, J.; Xiao, C.; Zhang, J.; Lin, F.; Xu, Y.; Li, Y.; Zhang, L.; Chen, W. Advances in metabolomics of biomarkers for ischemic stroke: From bench to clinic. Neural Regen. Res. 2026, 21, 3588–3597. [Google Scholar] [CrossRef] [Scilit]
- Ding, L.; Zhang, M.; Fan, B.; Deng, F.; Li, Z.; Han, Y.; Wu, Y.; Zeng, J.; Lu, L. Metabolomics reveals key biomarkers for ischemic stroke: A systematic review of emerging evidence. Front. Neurol. 2025, 16, 1630390. [Google Scholar] [CrossRef] [Scilit]
- Liao, Y.; Ding, Y.; Yu, L.; Xiang, C.; Yang, M. Exploring the mechanism of Alisma orientale for the treatment of pregnancy induced hypertension and potential hepato-nephrotoxicity by using network pharmacology, network toxicology, molecular docking and molecular dynamics simulation. Front. Pharmacol. 2022, 13, 1027112. [Google Scholar] [CrossRef] [Scilit]
- Zuo, X.; Wei, W.; Hou, X.; Cong, Z.; Zhang, Y.; Juan, Z. Network toxicology and experimental validation reveal TDCPP as an emerging environmental risk factor for chronic kidney disease. Int. J. Surg. 2026, 112, 11393–11403. [Google Scholar] [CrossRef] [Scilit]
- Song, Z.-G.; Liu, Y.-S.; Dai, S.-S.; Yin, S.-T.; Zeng, Y.; Liu, Y.-C.; Liu, J.-Y.; Li, J.-X.; Long, Y.-Y.; Feng, Y.-J.; et al. The integration strategy of Didang decoction against cerebral ischemia-reperfusion injury: Regulation of apoptosis-autophagy-inflammation network and validation of PI3K/Akt pathway. J. Ethnopharmacol. 2025, 353, 120277. [Google Scholar] [CrossRef] [Scilit]
- Wang, J.; Zhang, T.; Shen, X.; Liu, J.; Zhao, D.; Sun, Y.; Wang, L.; Liu, Y.; Gong, X.; Liu, Y.; et al. Serum metabolomics for early diagnosis of esophageal squamous cell carcinoma by UHPLC-QTOF/MS. Metabolomics 2016, 12, 116. [Google Scholar] [CrossRef] [Scilit]
- Zhou, Z.; Luo, M.; Zhang, H.; Yin, Y.; Cai, Y.; Zhu, Z.-J. Metabolite annotation from knowns to unknowns through knowledge-guided multi-layer metabolic networking. Nat. Commun. 2022, 13, 6656. [Google Scholar] [CrossRef] [Scilit]
- Wiklund, S.; Johansson, E.; Sjöström, L.; Mellerowicz, E.J.; Edlund, U.; Shockcor, J.P.; Gottfries, J.; Moritz, T.; Trygg, J. Visualization of GC/TOF-MS-based metabolomics data for identification of biochemically interesting compounds using OPLS class models. Anal. Chem. 2008, 80, 115–122. [Google Scholar] [CrossRef] [Scilit]
- Sherman, B.T.; Hao, M.; Qiu, J.; Jiao, X.; Baseler, M.W.; Lane, H.C.; Imamichi, T.; Chang, W. DAVID: A web server for functional enrichment analysis and functional annotation of gene lists (2021 update). Nucleic Acids Res. 2022, 50, W216–W221. [Google Scholar] [CrossRef] [Scilit]
- Wishart, D.S.; Guo, A.; Oler, E.; Wang, F.; Anjum, A.; Peters, H.; Dizon, R.; Sayeeda, Z.; Tian, S.; Lee, B.L.; et al. HMDB 5.0: The Human Metabolome Database for 2022. Nucleic Acids Res. 2022, 50, D622–D631. [Google Scholar] [CrossRef] [Scilit]
- Shannon, P.; Markiel, A.; Ozier, O.; Baliga, N.S.; Wang, J.T.; Ramage, D.; Amin, N.; Schwikowski, B.; Ideker, T. Cytoscape: A software environment for integrated models of biomolecular interaction networks. Genome Res. 2003, 13, 2498–2504. [Google Scholar] [CrossRef] [Scilit]
- Kim, S.; Chen, J.; Cheng, T.; Gindulyte, A.; Jia, H.; He, S.; Li, Q.; Shoemaker, B.A.; Thiessen, P.A.; Yu, B.; et al. PubChem 2023 update. Nucleic Acids Res. 2023, 51, D1373–D1380. [Google Scholar] [CrossRef] [Scilit]
- Banerjee, P.; Kemmler, E.; Dunkel, M.; Preissner, R. ProTox 3.0: A webserver for the prediction of toxicity of chemicals. Nucleic Acids Res. 2024, 52, W513–W520. [Google Scholar] [CrossRef] [Scilit]
- Xiong, G.; Wu, Z.; Yi, J.; Fu, L.; Yang, Z.; Hsieh, C.; Yin, M.; Zeng, X.; Wu, C.; Lu, A.; et al. ADMETlab 2.0: An integrated online platform for accurate and comprehensive predictions of ADMET properties. Nucleic Acids Res. 2021, 49, W5–W14. [Google Scholar] [CrossRef] [Scilit]
- Zdrazil, B.; Felix, E.; Hunter, F.; Manners, E.J.; Blackshaw, J.; Corbett, S.; de Veij, M.; Ioannidis, H.; Lopez, D.M.; Mosquera, J.F.; et al. The ChEMBL Database in 2023: A drug discovery platform spanning multiple bioactivity data types and time periods. Nucleic Acids Res. 2024, 52, D1180–D1192. [Google Scholar] [CrossRef] [Scilit]
- Stelzer, G.; Rosen, N.; Plaschkes, I.; Zimmerman, S.; Twik, M.; Fishilevich, S.; Stein, T.I.; Nudel, R.; Lieder, I.; Mazor, Y.; et al. The GeneCards Suite: From Gene Data Mining to Disease Genome Sequence Analyses. Curr. Protoc. Bioinform. 2016, 54, 1.30.1–1.30.33. [Google Scholar] [CrossRef] [Scilit]
- Zhou, Y.; Zhang, Y.; Zhao, D.; Yu, X.; Shen, X.; Zhou, Y.; Wang, S.; Qiu, Y.; Chen, Y.; Zhu, F. TTD: Therapeutic Target Database describing target druggability information. Nucleic Acids Res. 2024, 52, D1465–D1477. [Google Scholar] [CrossRef] [Scilit]
- Amberger, J.S.; Bocchini, C.A.; Schiettecatte, F.; Scott, A.F.; Hamosh, A. OMIM.org: Online Mendelian Inheritance in Man (OMIM®), an online catalog of human genes and genetic disorders. Nucleic Acids Res. 2015, 43, D789–D798. [Google Scholar] [CrossRef] [Scilit]
- Whirl-Carrillo, M.; Huddart, R.; Li, G.; Sangkuhl, K.; Thorn, C.F.; Whaley, R.; Klein, T.E. An Evidence-Based Framework for Evaluating Pharmacogenomics Knowledge for Personalized Medicine. Clin. Pharmacol. Ther. 2021, 110, 563–572. [Google Scholar] [CrossRef] [Scilit]
- Piñero, J.; Ramírez-Anguita, J.M.; Saüch-Pitarch, J.; Ronzano, F.; Centeno, E.; Sanz, F.; Furlong, L.I. The DisGeNET knowledge platform for disease genomics: 2019 update. Nucleic Acids Res. 2019, 48, D845–D855. [Google Scholar] [CrossRef] [Scilit]
- Burley, S.K.; Bhikadiya, C.; Bi, C.; Bittrich, S.; Chao, H.; Li, C.; Craig, P.A.; Crichlow, G.V.; Dalenberg, K.; Duarte, J.M.; et al. RCSB Protein Data Bank (RCSB.org): Delivery of experimentally-determined PDB structures alongside one million computed structure models of proteins from artificial intelligence/machine learning. Nucleic Acids Res. 2023, 51, D488–D508. [Google Scholar] [CrossRef] [Scilit]
- Schädlich, I.S.; Winzer, R.; Stabernack, J.; Tolosa, E.; Magnus, T.; Rissiek, B. The role of the ATP-adenosine axis in ischemic stroke. Semin. Immunopathol. 2023, 45, 347–365. [Google Scholar] [CrossRef] [Scilit]
- Faller, K.M.E.; Leach, J.; Johnston, P.; Holmes, W.M.; Macrae, I.M.; Frenguelli, B.G. Proof of concept and feasibility studies examining the influence of combination ribose, adenine and allopurinol treatment on stroke outcome in the rat. Brain Neurosci. Adv. 2017, 1, 2398212817717112. [Google Scholar] [CrossRef] [Scilit]
- Dunderdale, E.M.; Abt, E.R. Landscape of targets within nucleoside metabolism for the modification of immune responses. Front. Oncol. 2025, 15, 1483769. [Google Scholar] [CrossRef] [Scilit]
- Song, C.; Liu, Z.-J.; Xu, B.; Zou, R.; Hu, W. The Role of Uridine in Health and Disease. J. Inflamm. Res. 2025, 18, 10163–10179. [Google Scholar] [CrossRef] [Scilit]
- Singh, N.; Ecker, G.F. Insights into the Structure, Function, and Ligand Discovery of the Large Neutral Amino Acid Transporter 1, LAT1. Int. J. Mol. Sci. 2018, 19, 1278. [Google Scholar] [CrossRef] [Scilit]
- Song, W.S.; Kim, Y.S.; Bae, Y.-S.; Yoon, S.H.; Lim, J.M.; Kim, M.-H. GluN2B suppression restores phenylalanine-induced neuroplasticity and cognition impairments in a mouse model of phenylketonuria. J. Clin. Investig. 2025, 135, e184299. [Google Scholar] [CrossRef] [Scilit]
- Dobolyi, A.; Juhász, G.; Kovács, Z.; Kardos, J. Uridine function in the central nervous system. Curr. Top. Med. Chem. 2011, 11, 1058–1067. [Google Scholar] [CrossRef] [Scilit]
- Xu, J.; Patassini, S.; Begley, P.; Church, S.; Waldvogel, H.J.; Faull, R.L.M.; Unwin, R.D.; Cooper, G.J. Cerebral deficiency of vitamin B5 (d-pantothenic acid; pantothenate) as a potentially-reversible cause of neurodegeneration and dementia in sporadic Alzheimer’s disease. Biochem. Biophys. Res. Commun. 2020, 527, 676–681. [Google Scholar] [CrossRef] [Scilit]
- McKeran, R.O.; Halliday, D.; Purkiss, P.; Royston, P. 3-Methylhistidine excretion as an index of myofibrillar protein catabolism in neuromuscular disease. J. Neurol. Neurosurg. Psychiatry 1979, 42, 536–541. [Google Scholar] [CrossRef] [Scilit]
- Aquilani, R.; Costa, A.; Maestri, R.; Cotta Ramusino, M.; Pierobon, A.; Dossena, M.; Solerte, S.B.; Condino, A.M.; Torlaschi, V.; Bini, P.; et al. Mini Nutritional Assessment May Identify a Dual Pattern of Perturbed Plasma Amino Acids in Patients with Alzheimer’s Disease: A Window to Metabolic and Physical Rehabilitation? Nutrients 2020, 12, 1845. [Google Scholar] [CrossRef] [Scilit]
- Ancona, C.; Valerio, E.; Mainini, N.; Favali, A.; D’errico, I.; Lasagni, C.; Stocchero, M.; Pirillo, P.; Giordano, G.; Sartori, S.; et al. Urinary metabolome at birth in patients with hypoxic–ischemic encephalopathy treated with therapeutic hypothermia and long-term neurodevelopmental outcomes: A 7-year follow up. J. Transl. Med. 2025, 23, 1345. [Google Scholar] [CrossRef] [Scilit]
- Patrini, C.; Reggiani, C.; Laforenza, U.; Rindi, G. Blood-brain transport of thiamine monophosphate in the rat: A kinetic study in vivo. J. Neurochem. 1988, 50, 90–93. [Google Scholar] [CrossRef] [Scilit]
- Wuerch, E.; Urgoiti, G.R.; Yong, V.W. The Promise of Niacin in Neurology. Neurotherapeutics 2023, 20, 1037–1054. [Google Scholar] [CrossRef] [Scilit]
- Adkins, D.E.; McClay, J.L.; Vunck, S.A.; Batman, A.M.; Vann, R.E.; Clark, S.L.; Souza, R.P.; Crowley, J.J.; Sullivan, P.F.; Oord, E.J.C.G.v.D.; et al. Behavioral metabolomics analysis identifies novel neurochemical signatures in methamphetamine sensitization. Genes Brain Behav. 2013, 12, 780–791. [Google Scholar] [CrossRef] [Scilit]
- Tasca, C.I.; Lanznaster, D.; Oliveira, K.A.; Fernández-Dueñas, V.; Ciruela, F. Neuromodulatory Effects of Guanine-Based Purines in Health and Disease. Front. Cell. Neurosci. 2018, 12, 376. [Google Scholar] [CrossRef] [Scilit]
- Frenguelli, B.G.; Dale, N. Purines: From Diagnostic Biomarkers to Therapeutic Agents in Brain Injury. Neurosci. Bull. 2020, 36, 1315–1326. [Google Scholar] [CrossRef] [Scilit]
- Kuryata, O.; Akimov, O.; Riabushko, M.; Kostenko, H.; Kostenko, V.; Mishchenko, A.; Nazarenko, S.; Solovyova, N.; Kostenko, V. Therapeutic potential of 5-aminolevulinic acid in metabolic disorders: Current insights and future directions. iScience 2024, 27, 111477. [Google Scholar] [CrossRef] [Scilit]
- Daya, S.; Nonaka, K.O.; Buzzell, G.R.; Reiter, R.J. Heme precursor 5-aminolevulinic acid alters brain tryptophan and serotonin levels without changing pineal serotonin and melatonin concentrations. J. Neurosci. Res. 1989, 23, 304–309. [Google Scholar] [CrossRef] [Scilit]
- Yang, B.; Fritsche, K.L.; Beversdorf, D.Q.; Gu, Z.; Lee, J.C.; Folk, W.R.; Greenlief, C.M.; Sun, G.Y. Yin-Yang Mechanisms Regulating Lipid Peroxidation of Docosahexaenoic Acid and Arachidonic Acid in the Central Nervous System. Front. Neurol. 2019, 10, 642. [Google Scholar] [CrossRef] [Scilit]
- Qing-Zhang, T.; Peng, L. Ferroptosis in ischemic stroke: Animal models and mechanisms. Zool. Res. 2024, 45, 1235–1248. [Google Scholar] [CrossRef] [Scilit]
- Song, T.-J.; Cho, H.-J.; Chang, Y.; Choi, K.; Jung, A.-R.; Youn, M.; Shin, M.-J.; Kim, Y.-J. Low Plasma Proportion of Omega 3-Polyunsaturated Fatty Acids Predicts Poor Outcome in Acute Non-Cardiogenic Ischemic Stroke Patients. J. Stroke 2015, 17, 168. [Google Scholar] [CrossRef] [Scilit]
- Kahlhofer, J.; Teis, D. The human LAT1–4F2hc (SLC7A5–SLC3A2) transporter complex: Physiological and pathophysiological implications. Basic Clin. Pharmacol. Toxicol. 2023, 133, 459–472. [Google Scholar] [CrossRef] [Scilit]
- Zhu, K.; Yao, H.; Hei, J.; Li, S.; Ye, T.; Jiang, W.; Wang, S.; Luo, Z.; Martin, T.; Zhou, J.; et al. Tumor exosomal miR-221-3p induces glycolysis through the LIFR/GLUT1 pathway to destroy the cerebral vascular endothelial cell barrier and promote breast cancer brain metastasis. J. Transl. Med. 2025, 23, 1333. [Google Scholar] [CrossRef] [Scilit]
- Han, Y.; Sun, Y.; Peng, S.; Tang, T.; Zhang, B.; Yu, R.; Sun, X.; Guo, S.; Ma, L.; Li, P.; et al. PI3K/AKT pathway: A potential therapeutic target in cerebral ischemia-reperfusion injury. Eur. J. Pharmacol. 2025, 998, 177505. [Google Scholar] [CrossRef] [Scilit]
- Guo, X.; Wang, Y.; Tao, W.; Wu, G.; Li, X.; Wang, J.; Zhang, S.; Ren, Z.; Zhou, P. Neuroprotective mechanisms of A-971432: Targeting S1PR5 to modulate PI3K/Akt and MAPK pathways in cerebral ischemia/reperfusion injury. Int. Immunopharmacol. 2025, 156, 114700. [Google Scholar] [CrossRef] [Scilit]
- Khoury, N.; Koronowski, K.B.; Young, J.I.; Perez-Pinzon, M.A. The NAD+-Dependent Family of Sirtuins in Cerebral Ischemia and Preconditioning. Antioxid. Redox Signal. 2018, 28, 691–710. [Google Scholar] [CrossRef] [Scilit]
- Dai, X.-Y.; Liu, L.; Song, F.-H.; Gao, S.-J.; Wu, J.-Y.; Li, D.-Y.; Zhang, L.-Q.; Liu, D.-Q.; Zhou, Y.-Q.; Mei, W. Targeting the JAK2/STAT3 signaling pathway for chronic pain. Aging Dis. 2024, 15, 186. [Google Scholar] [CrossRef] [Scilit]
- Duan, W.-L.; Gu, L.-H.; Guo, A.; Wang, X.-J.; Ding, Y.-Y.; Zhang, P.; Zhang, B.-G.; Li, Q.; Yang, L.-X. Molecular mechanisms of programmed cell death and potential targeted pharmacotherapy in ischemic stroke (Review). Int. J. Mol. Med. 2025, 56, 103. [Google Scholar] [CrossRef] [Scilit]
- Dale, N.; Frenguelli, B. Release of Adenosine and ATP During Ischemia and Epilepsy. Curr. Neuropharmacol. 2009, 7, 160–179. [Google Scholar] [CrossRef] [Scilit]
- Milanesi, R.; Coccetti, P.; Tripodi, F. The Regulatory Role of Key Metabolites in the Control of Cell Signaling. Biomolecules 2020, 10, 862. [Google Scholar] [CrossRef] [Scilit]
- Medeiros, R.d.C.N.; Moraes, J.O.; Rodrigues, S.D.C.; Pereira, L.M.; Aguiar, H.Q.d.S.; de Cordova, C.A.S.; Júnior, A.Y.; de Cordova, F.M. Thiamine Deficiency Modulates p38MAPK and Heme Oxygenase-1 in Mouse Brain: Association with Early Tissue and Behavioral Changes. Neurochem. Res. 2020, 45, 940–955. [Google Scholar] [CrossRef] [Scilit]
- Bunik, V.; Aleshin, V.; Nogues, I.; Kähne, T.; Parroni, A.; Contestabile, R.; Di Salvo, M.L.; Graf, A.; Tramonti, A. Thiamine-dependent regulation of mammalian brain pyridoxal kinase in vitro and in vivo. J. Neurochem. 2022, 161, 20–39. [Google Scholar] [CrossRef] [Scilit]
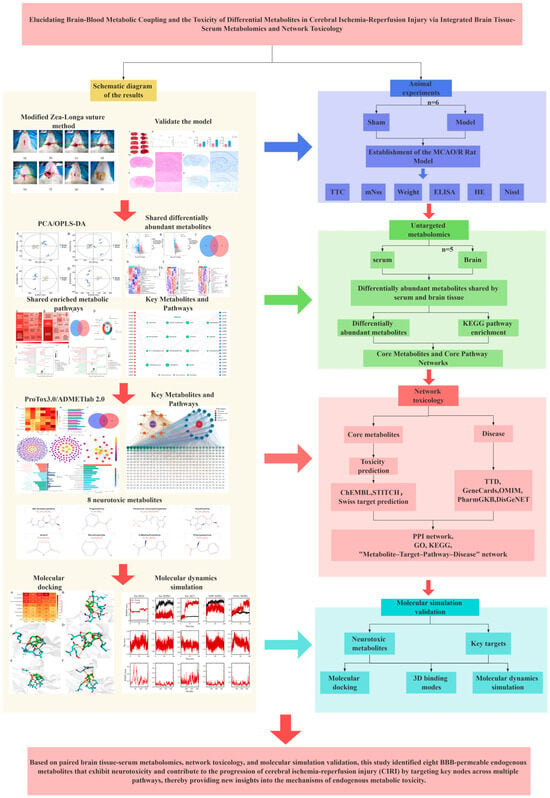
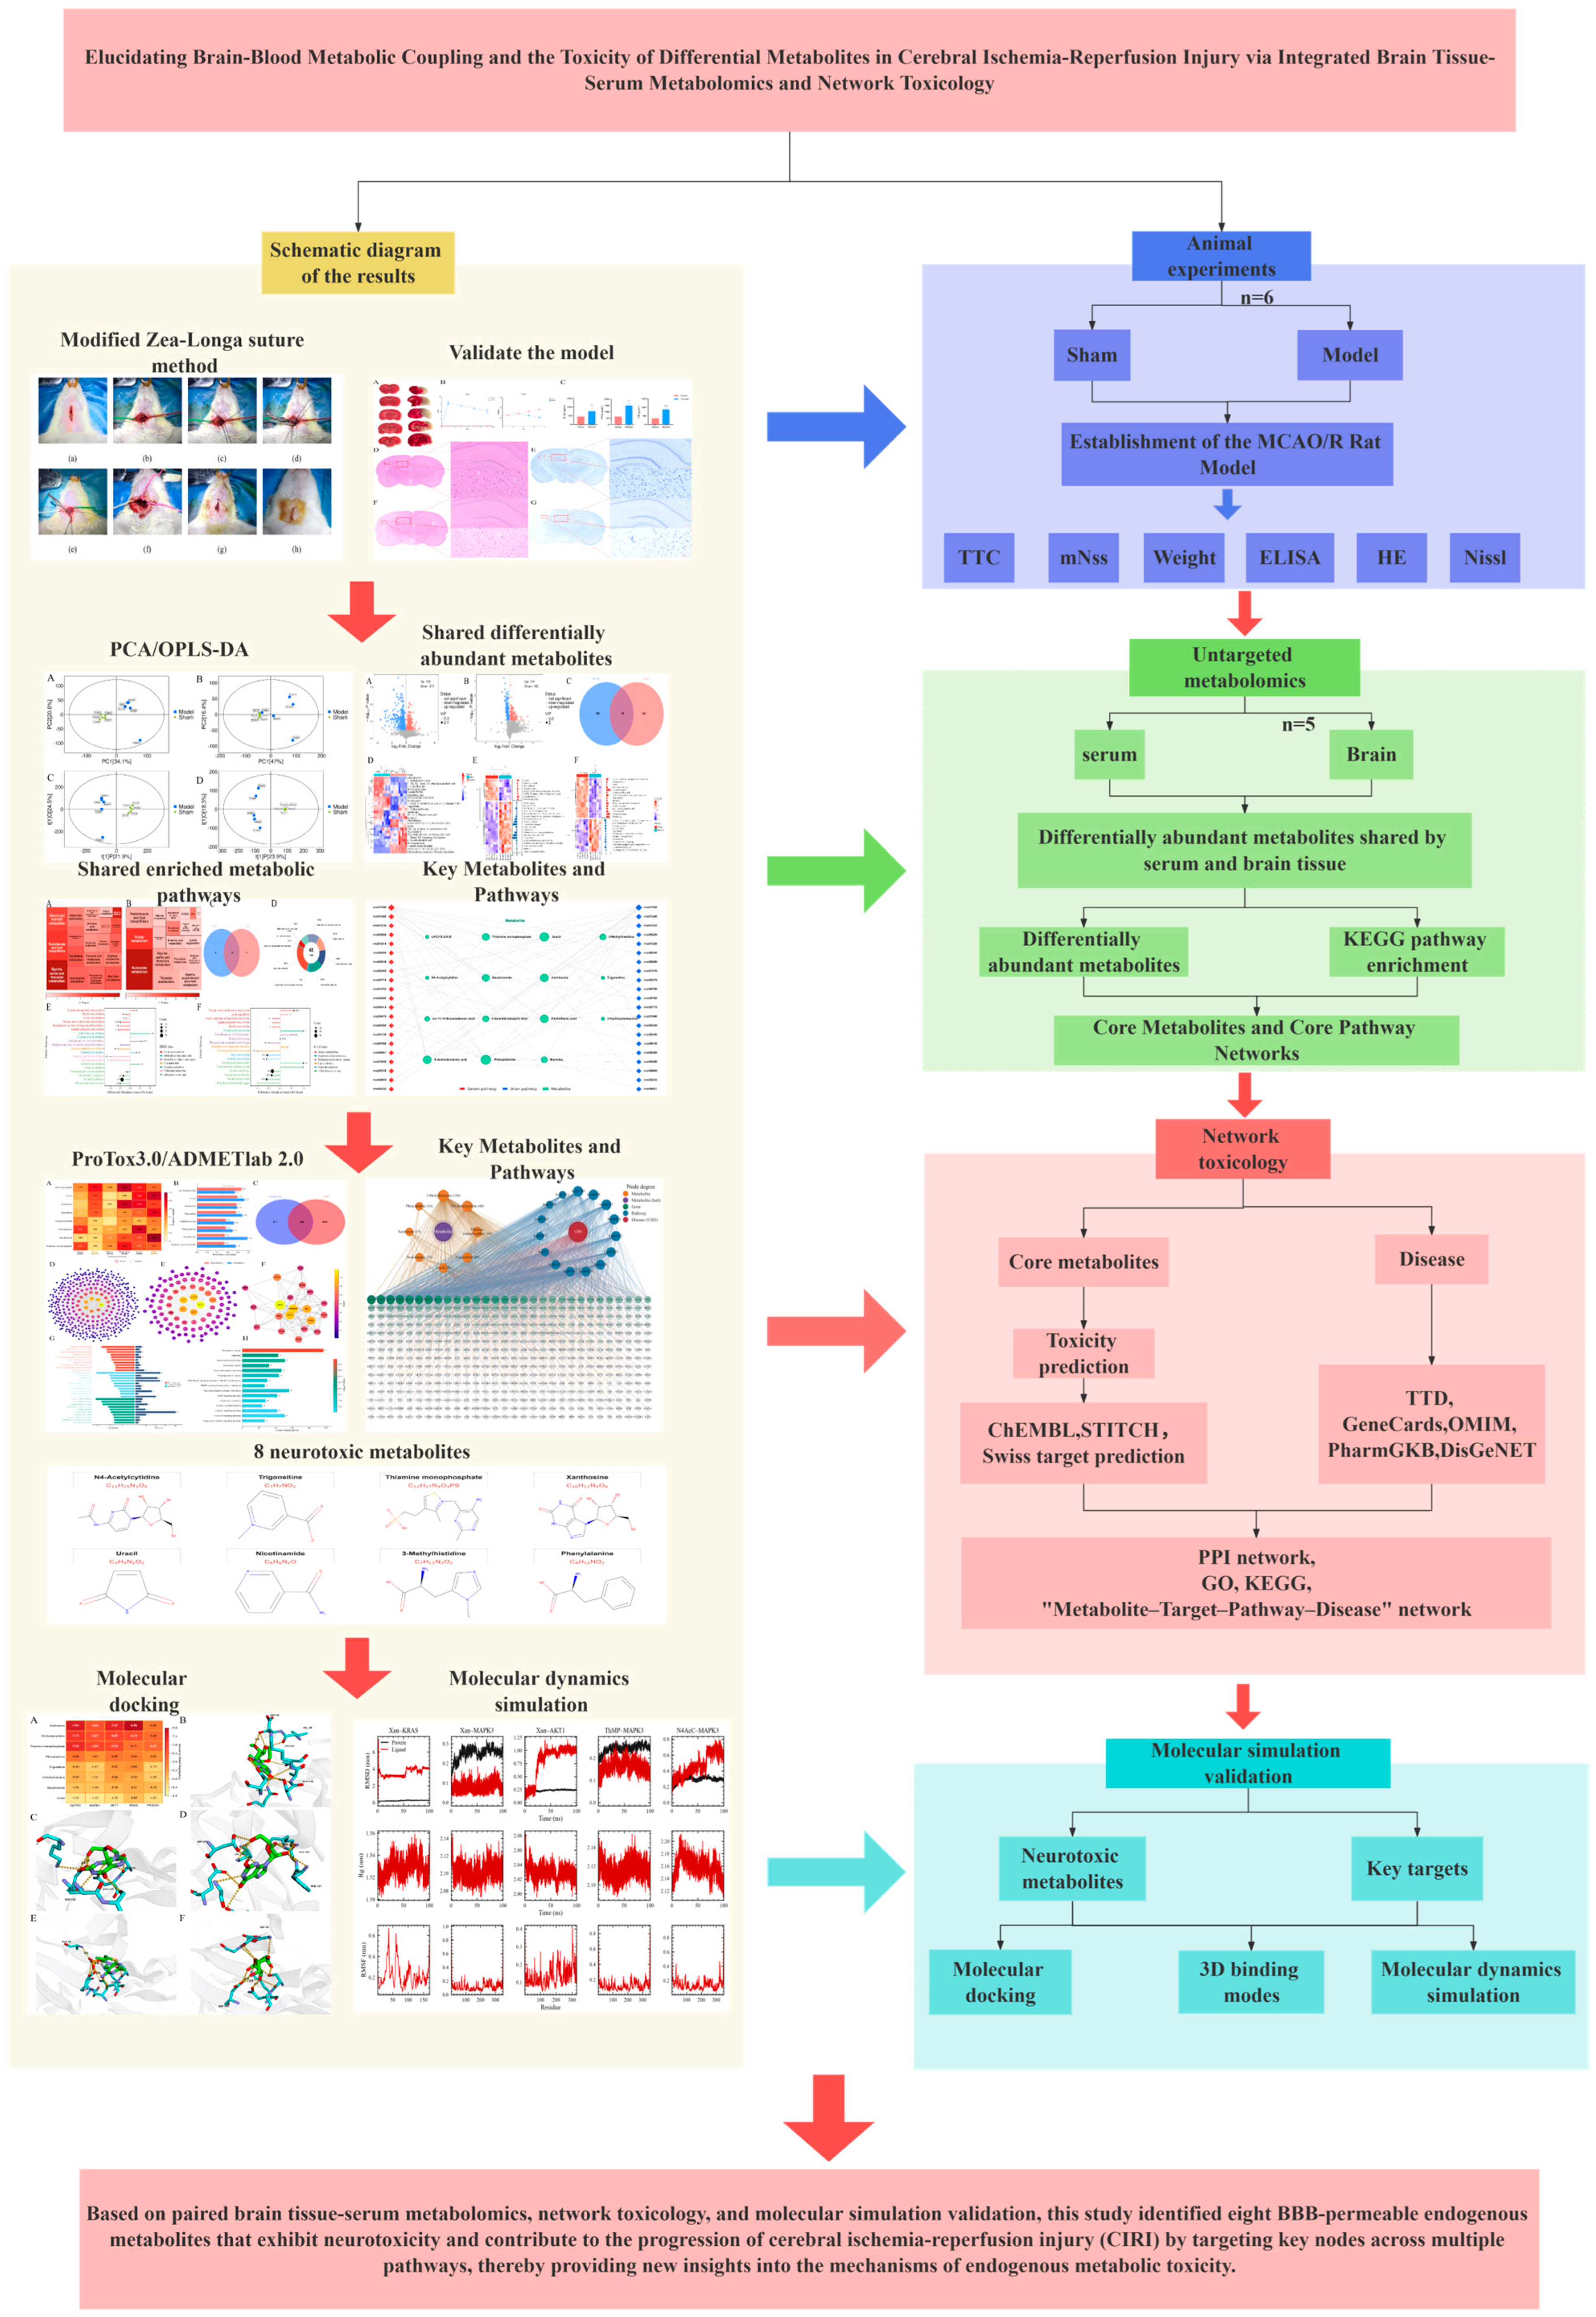
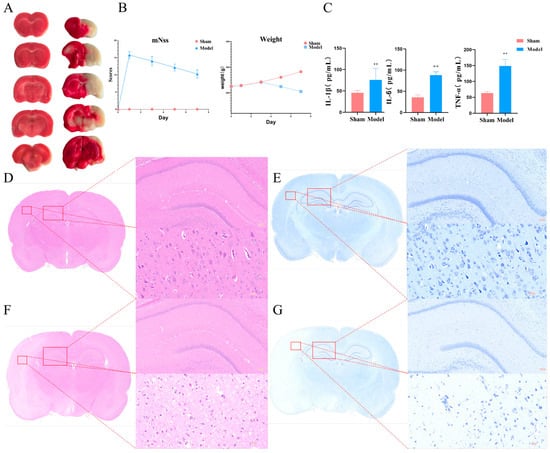
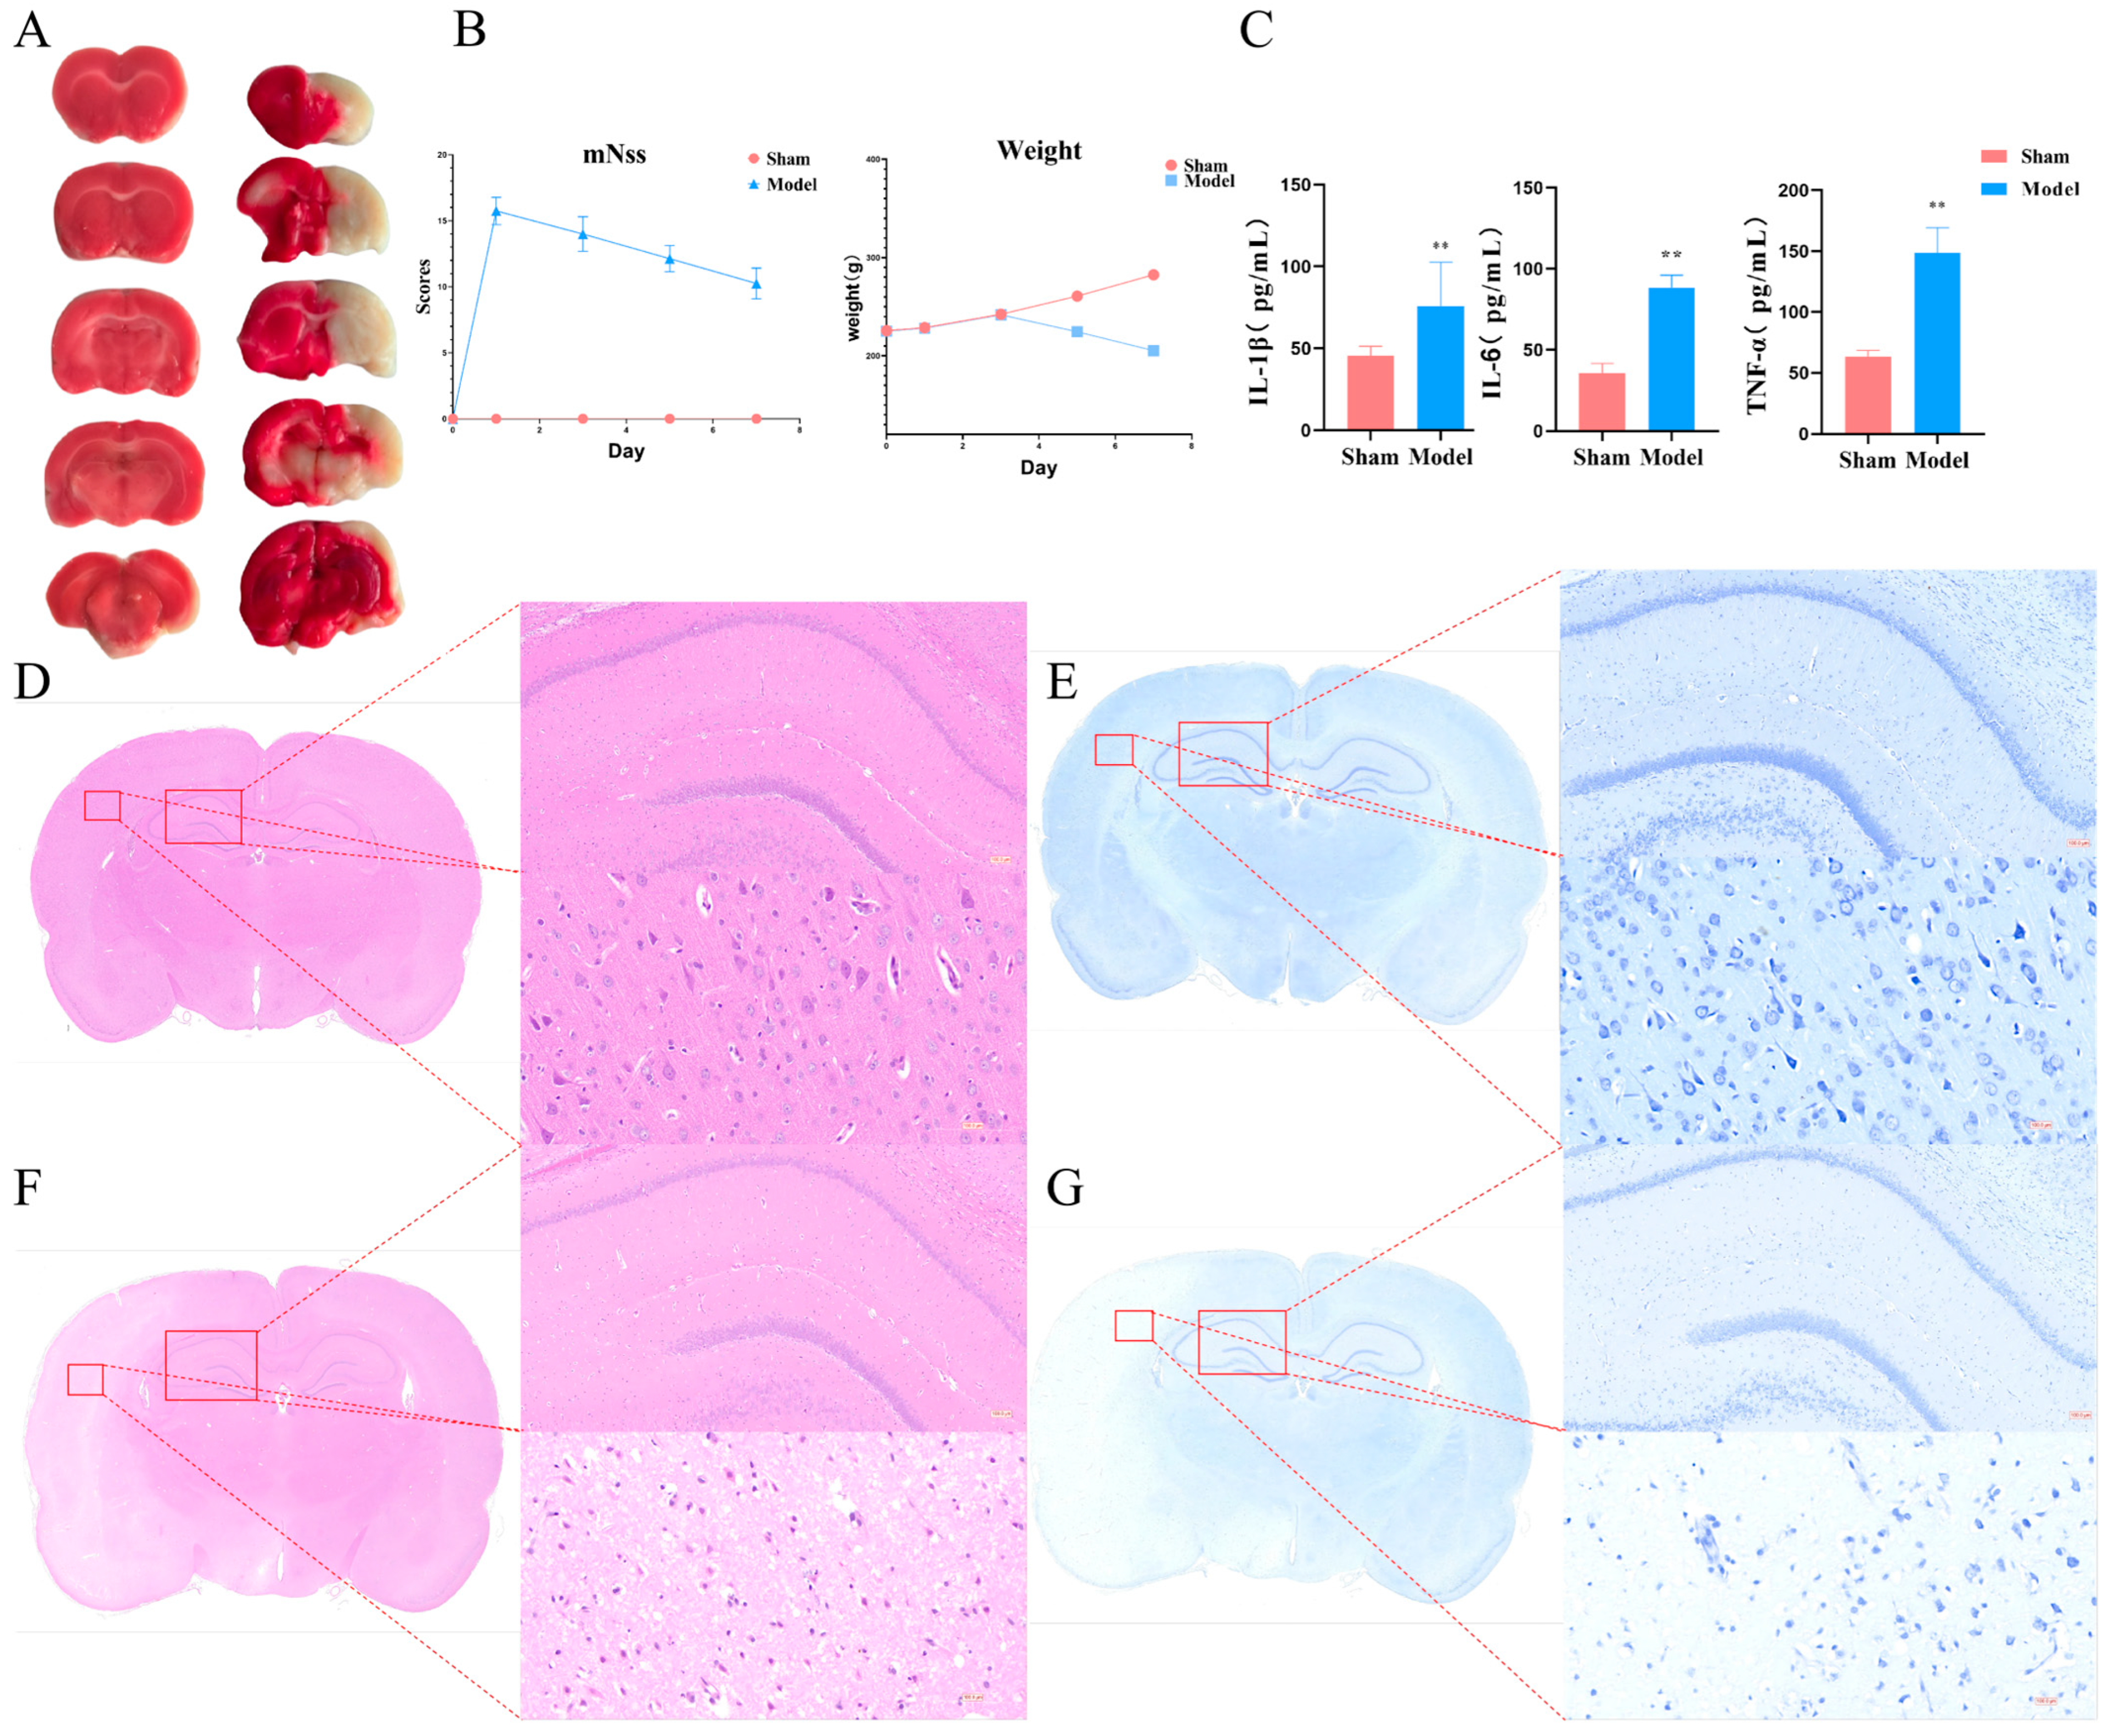
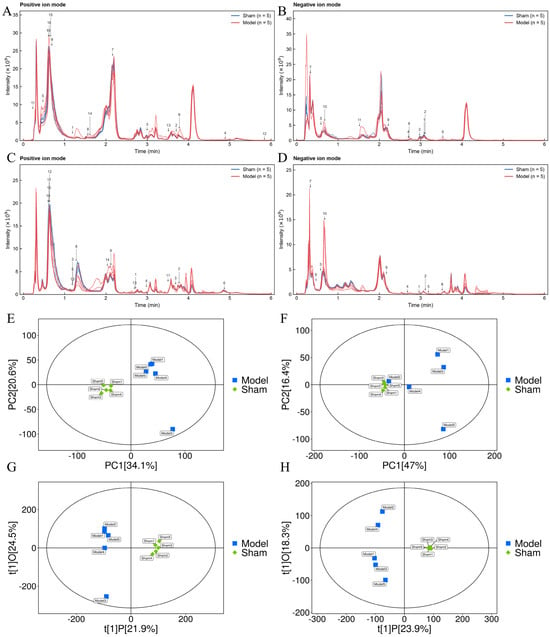
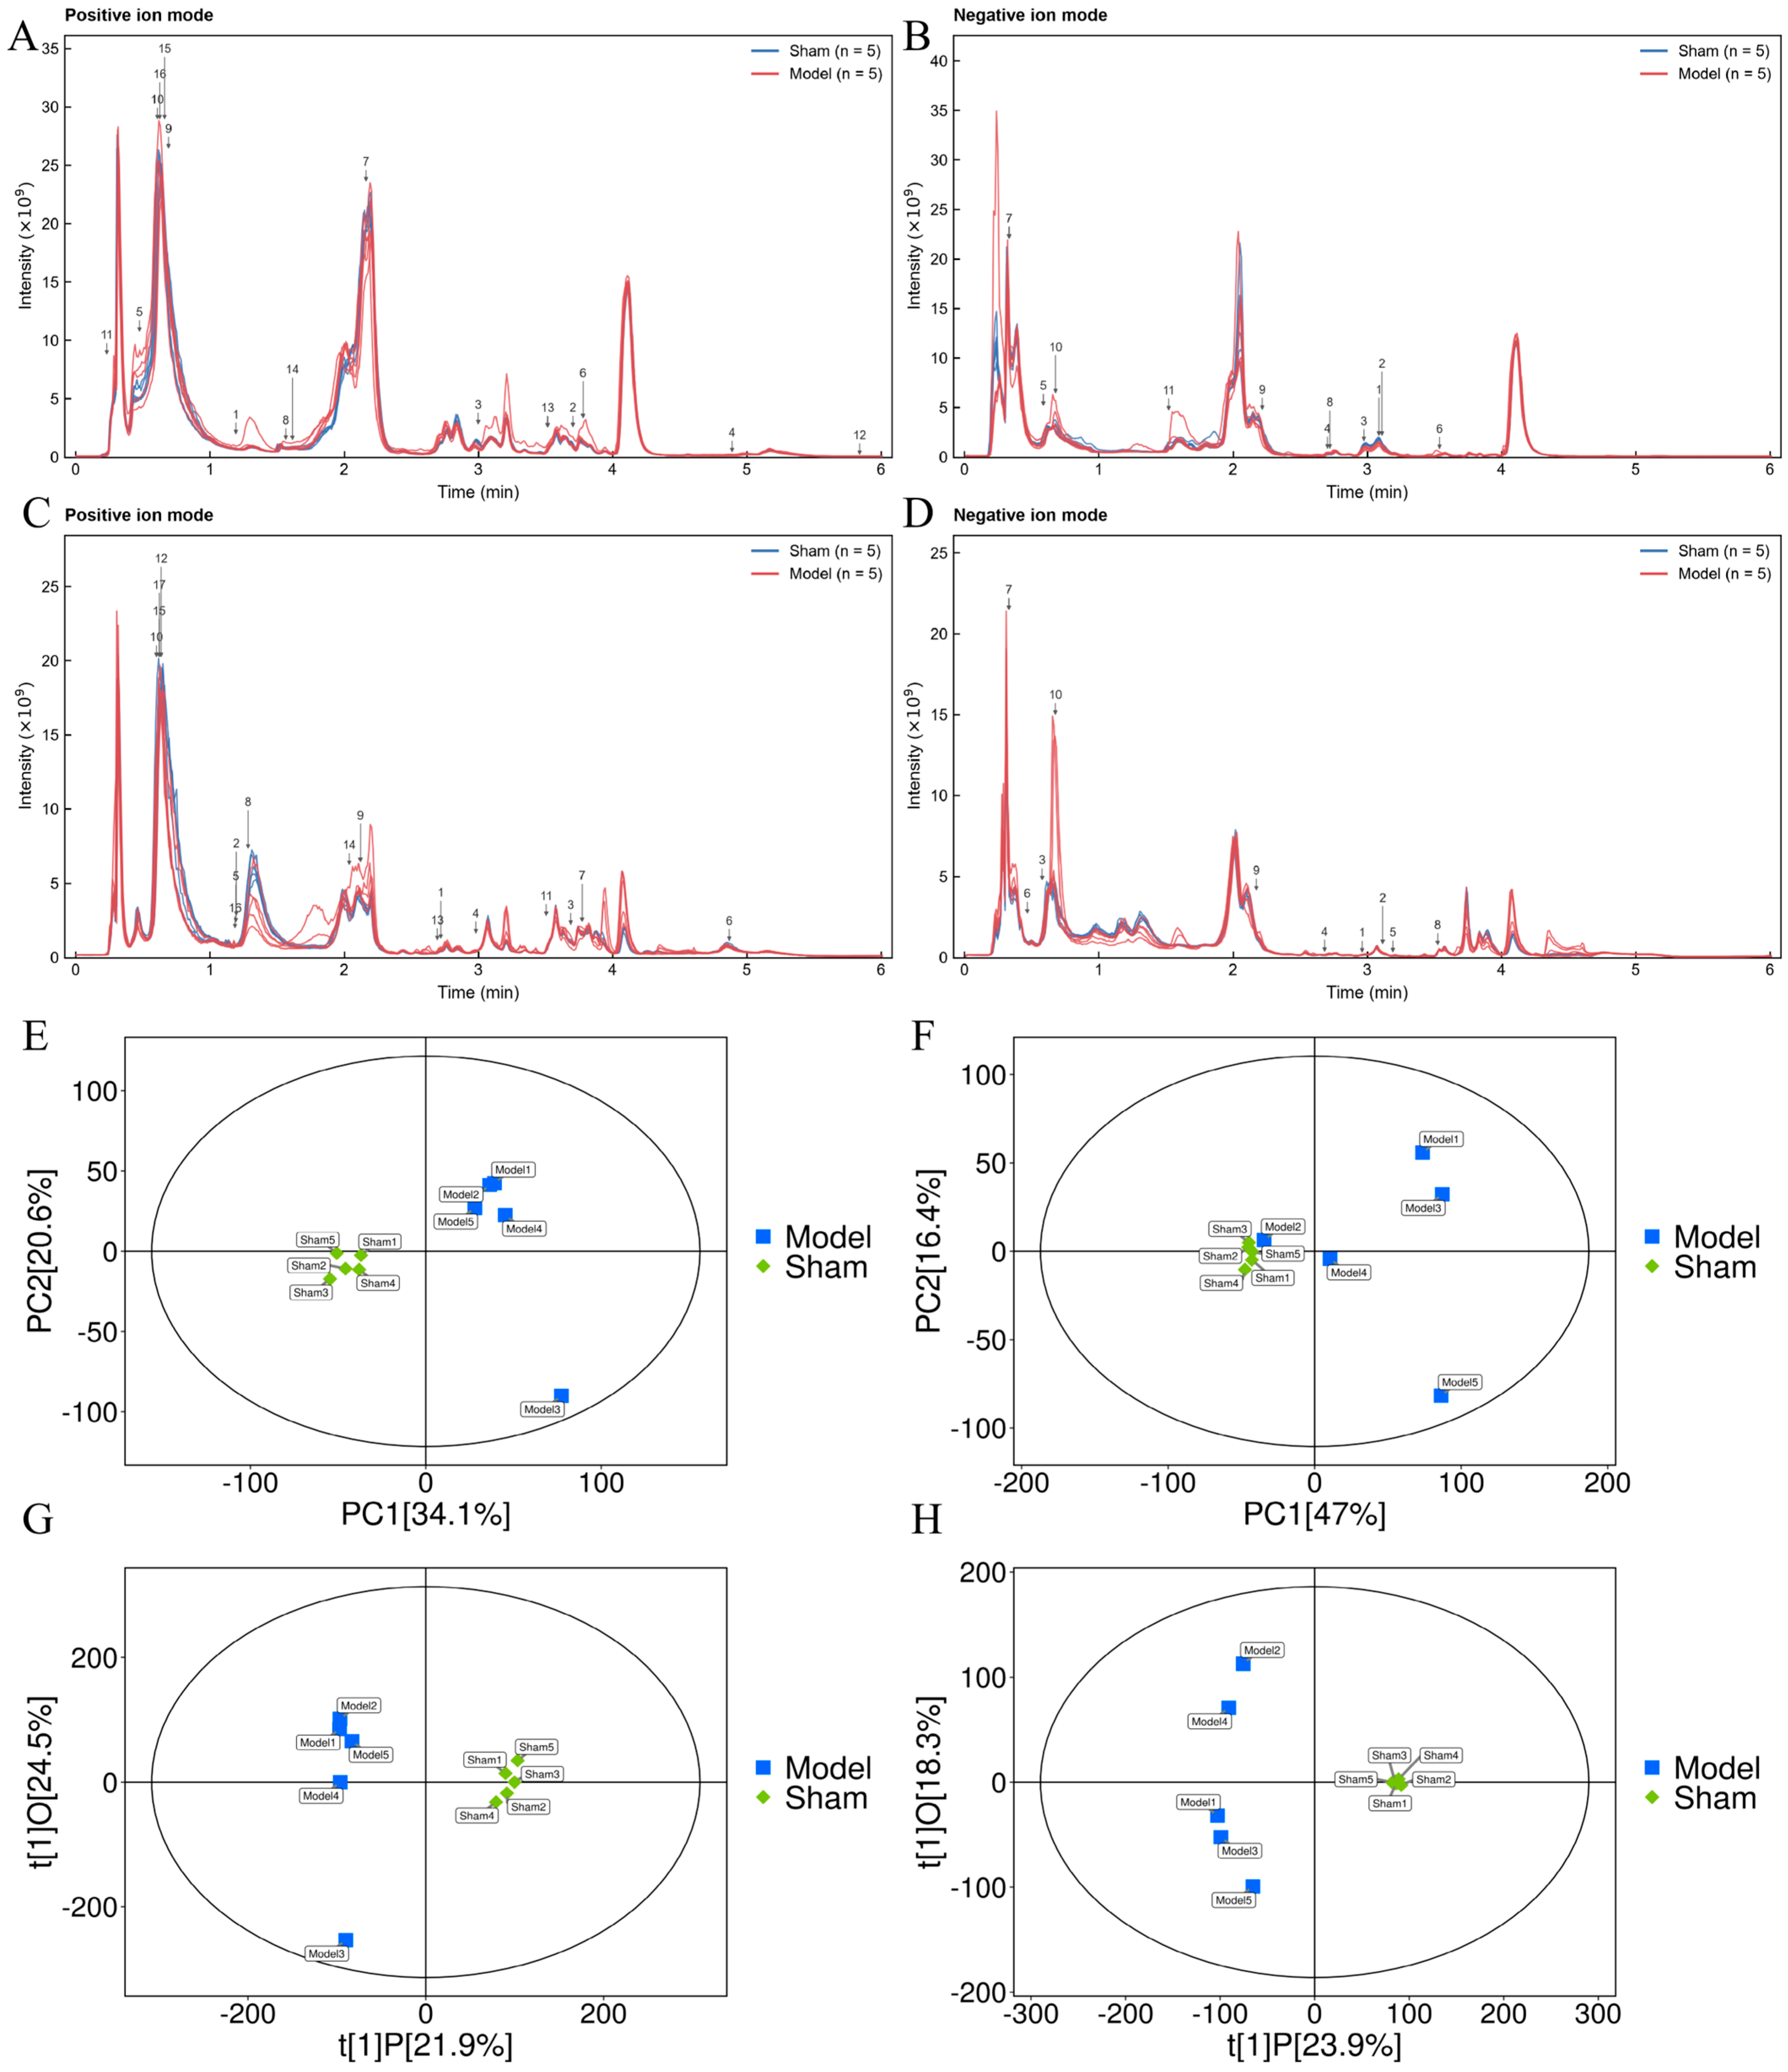
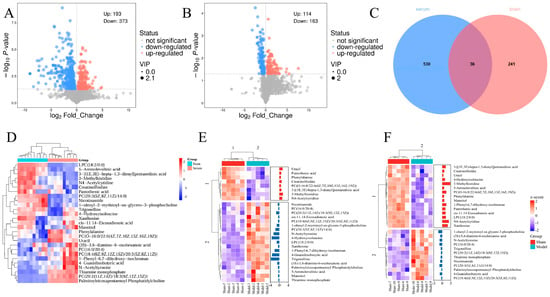
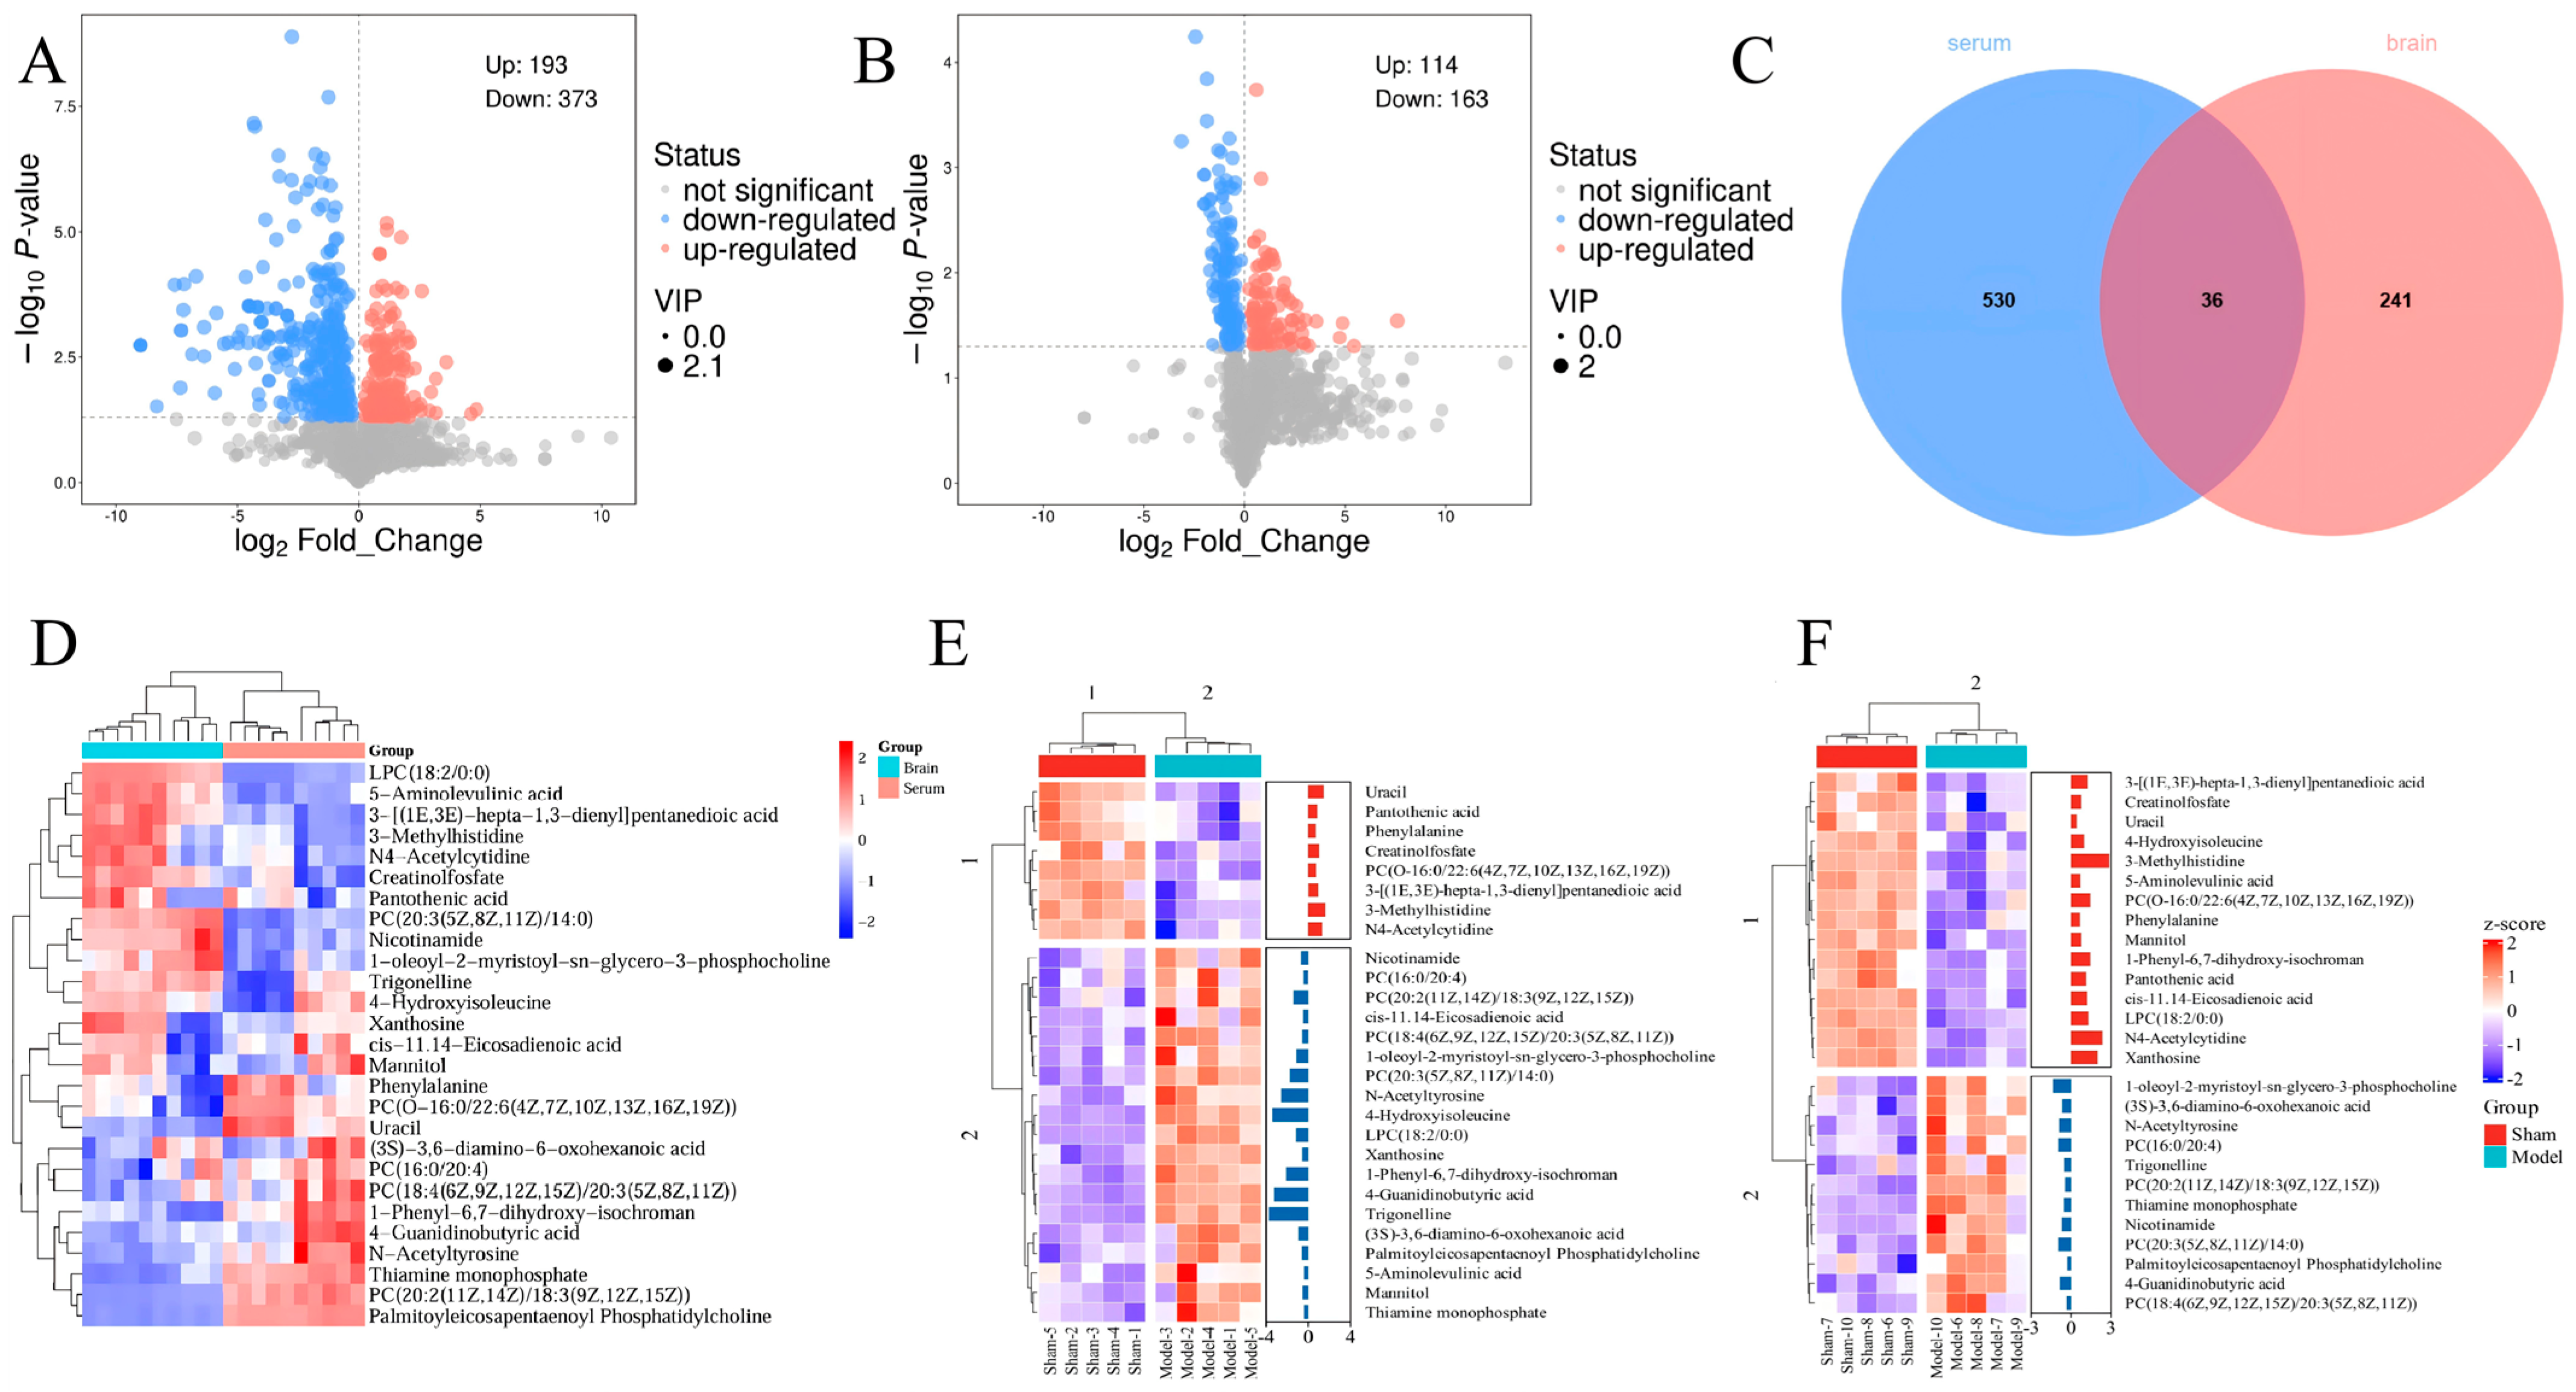
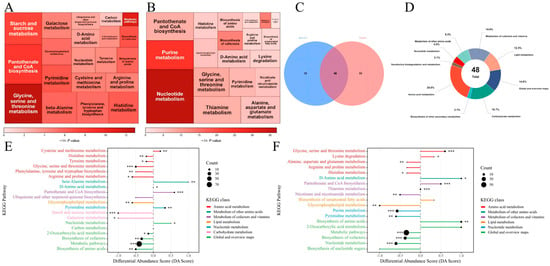
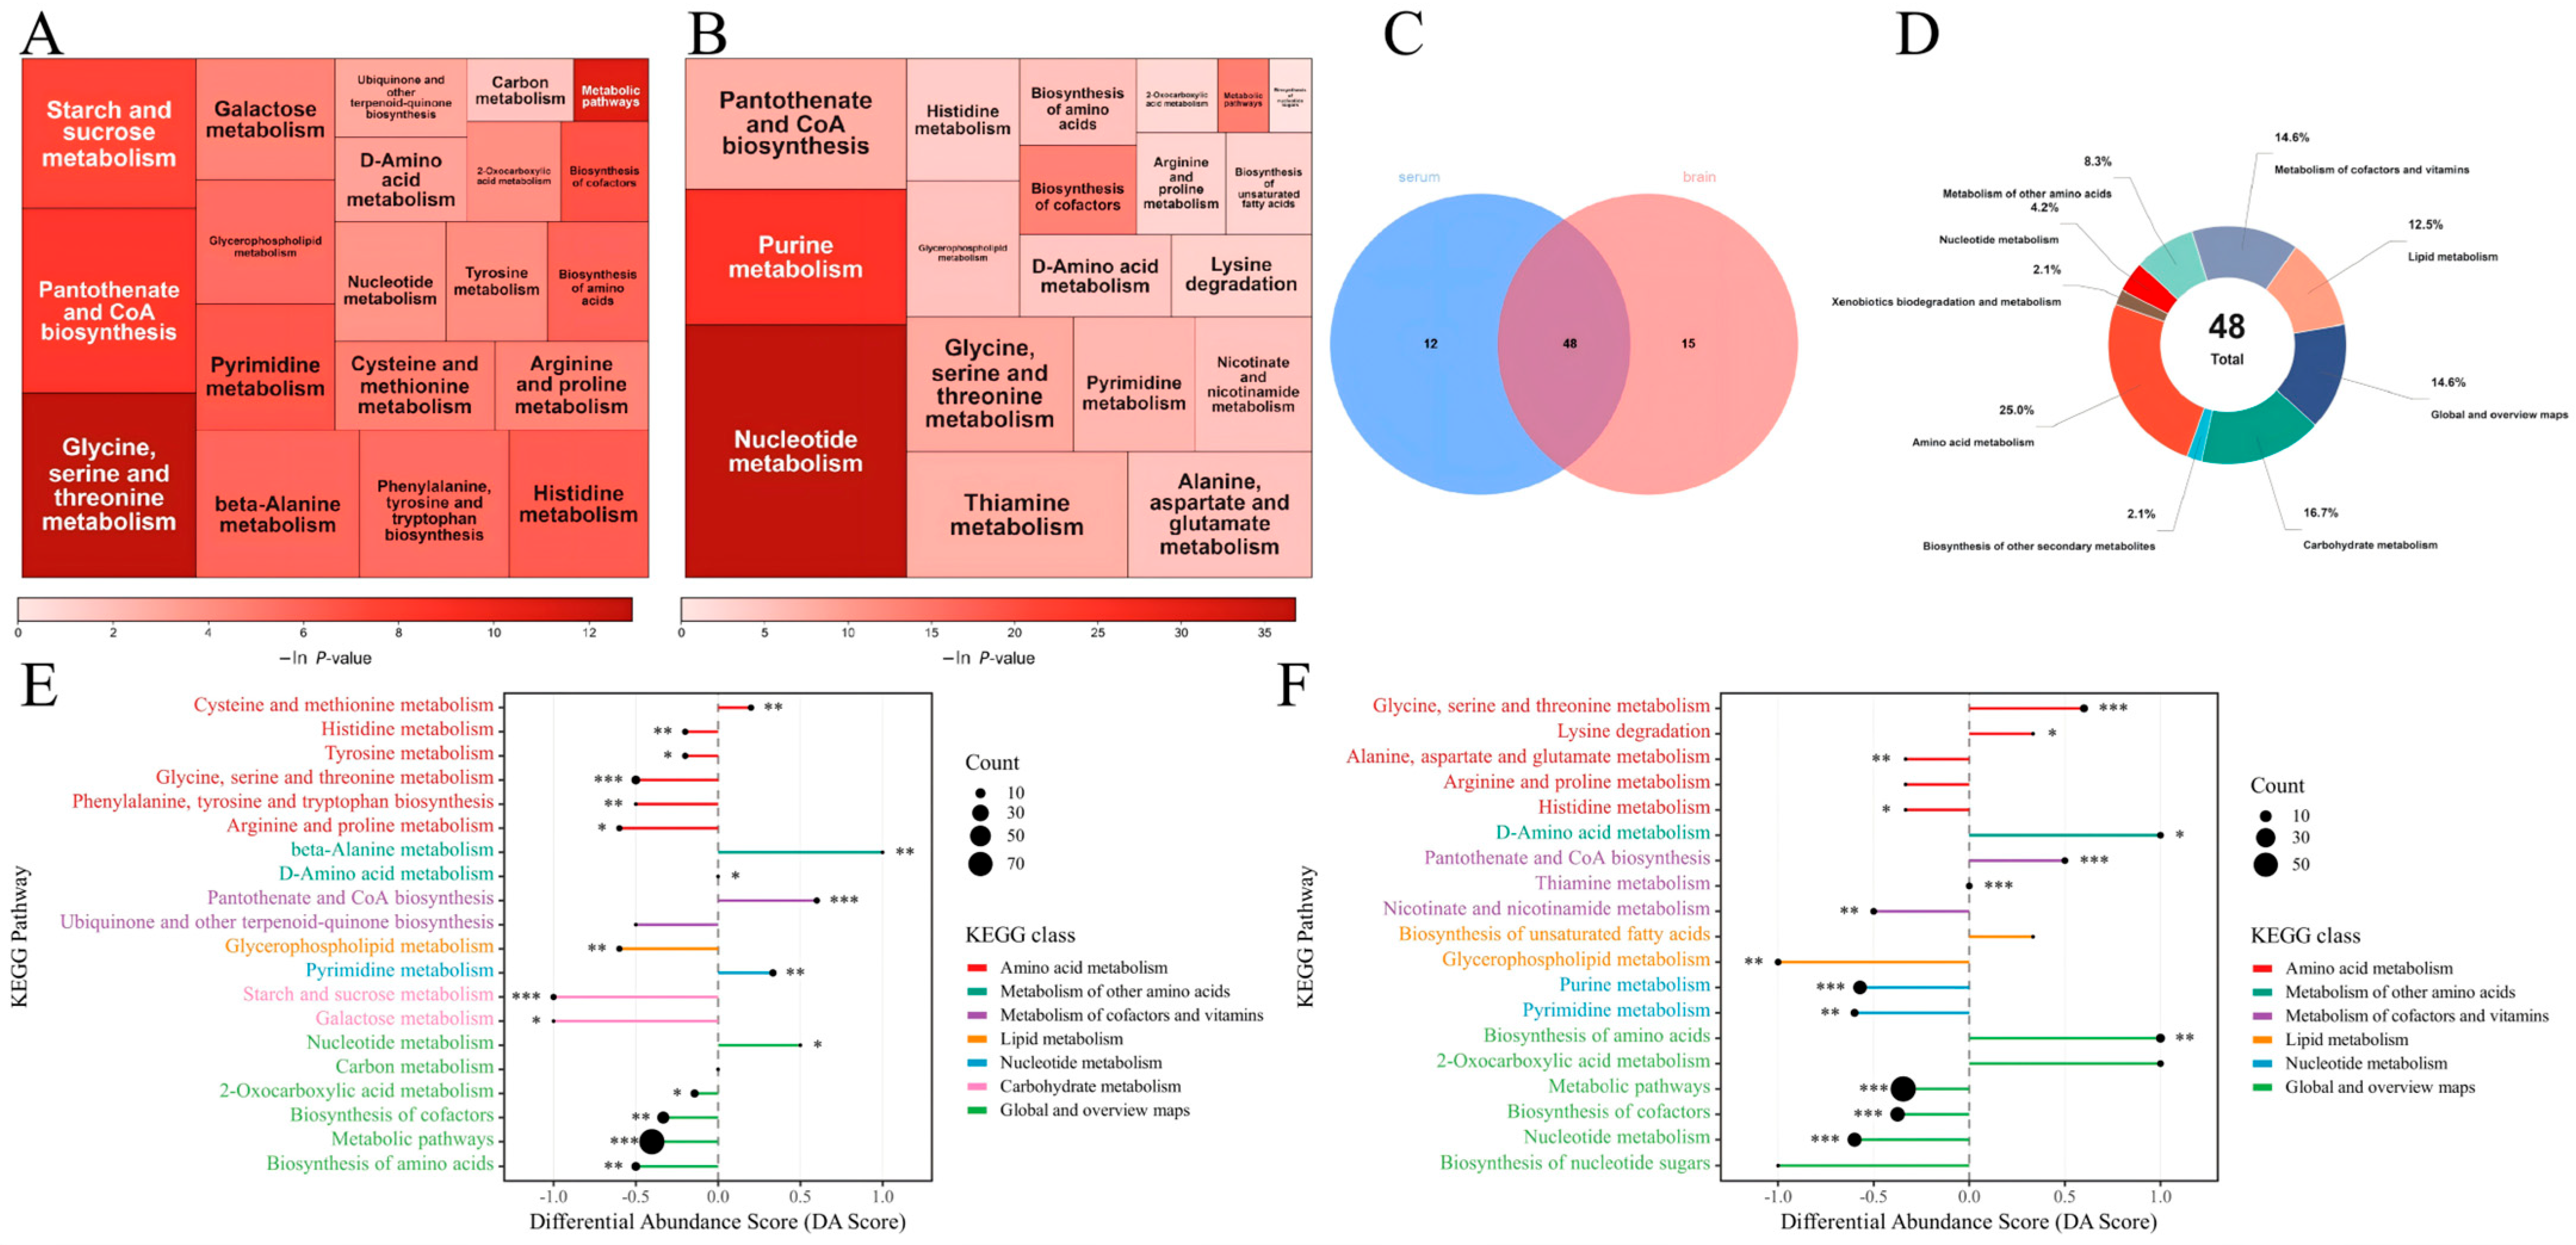
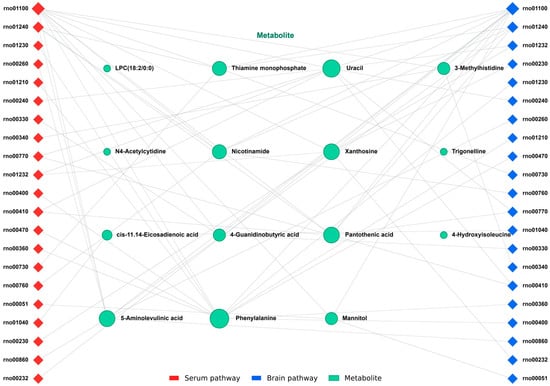
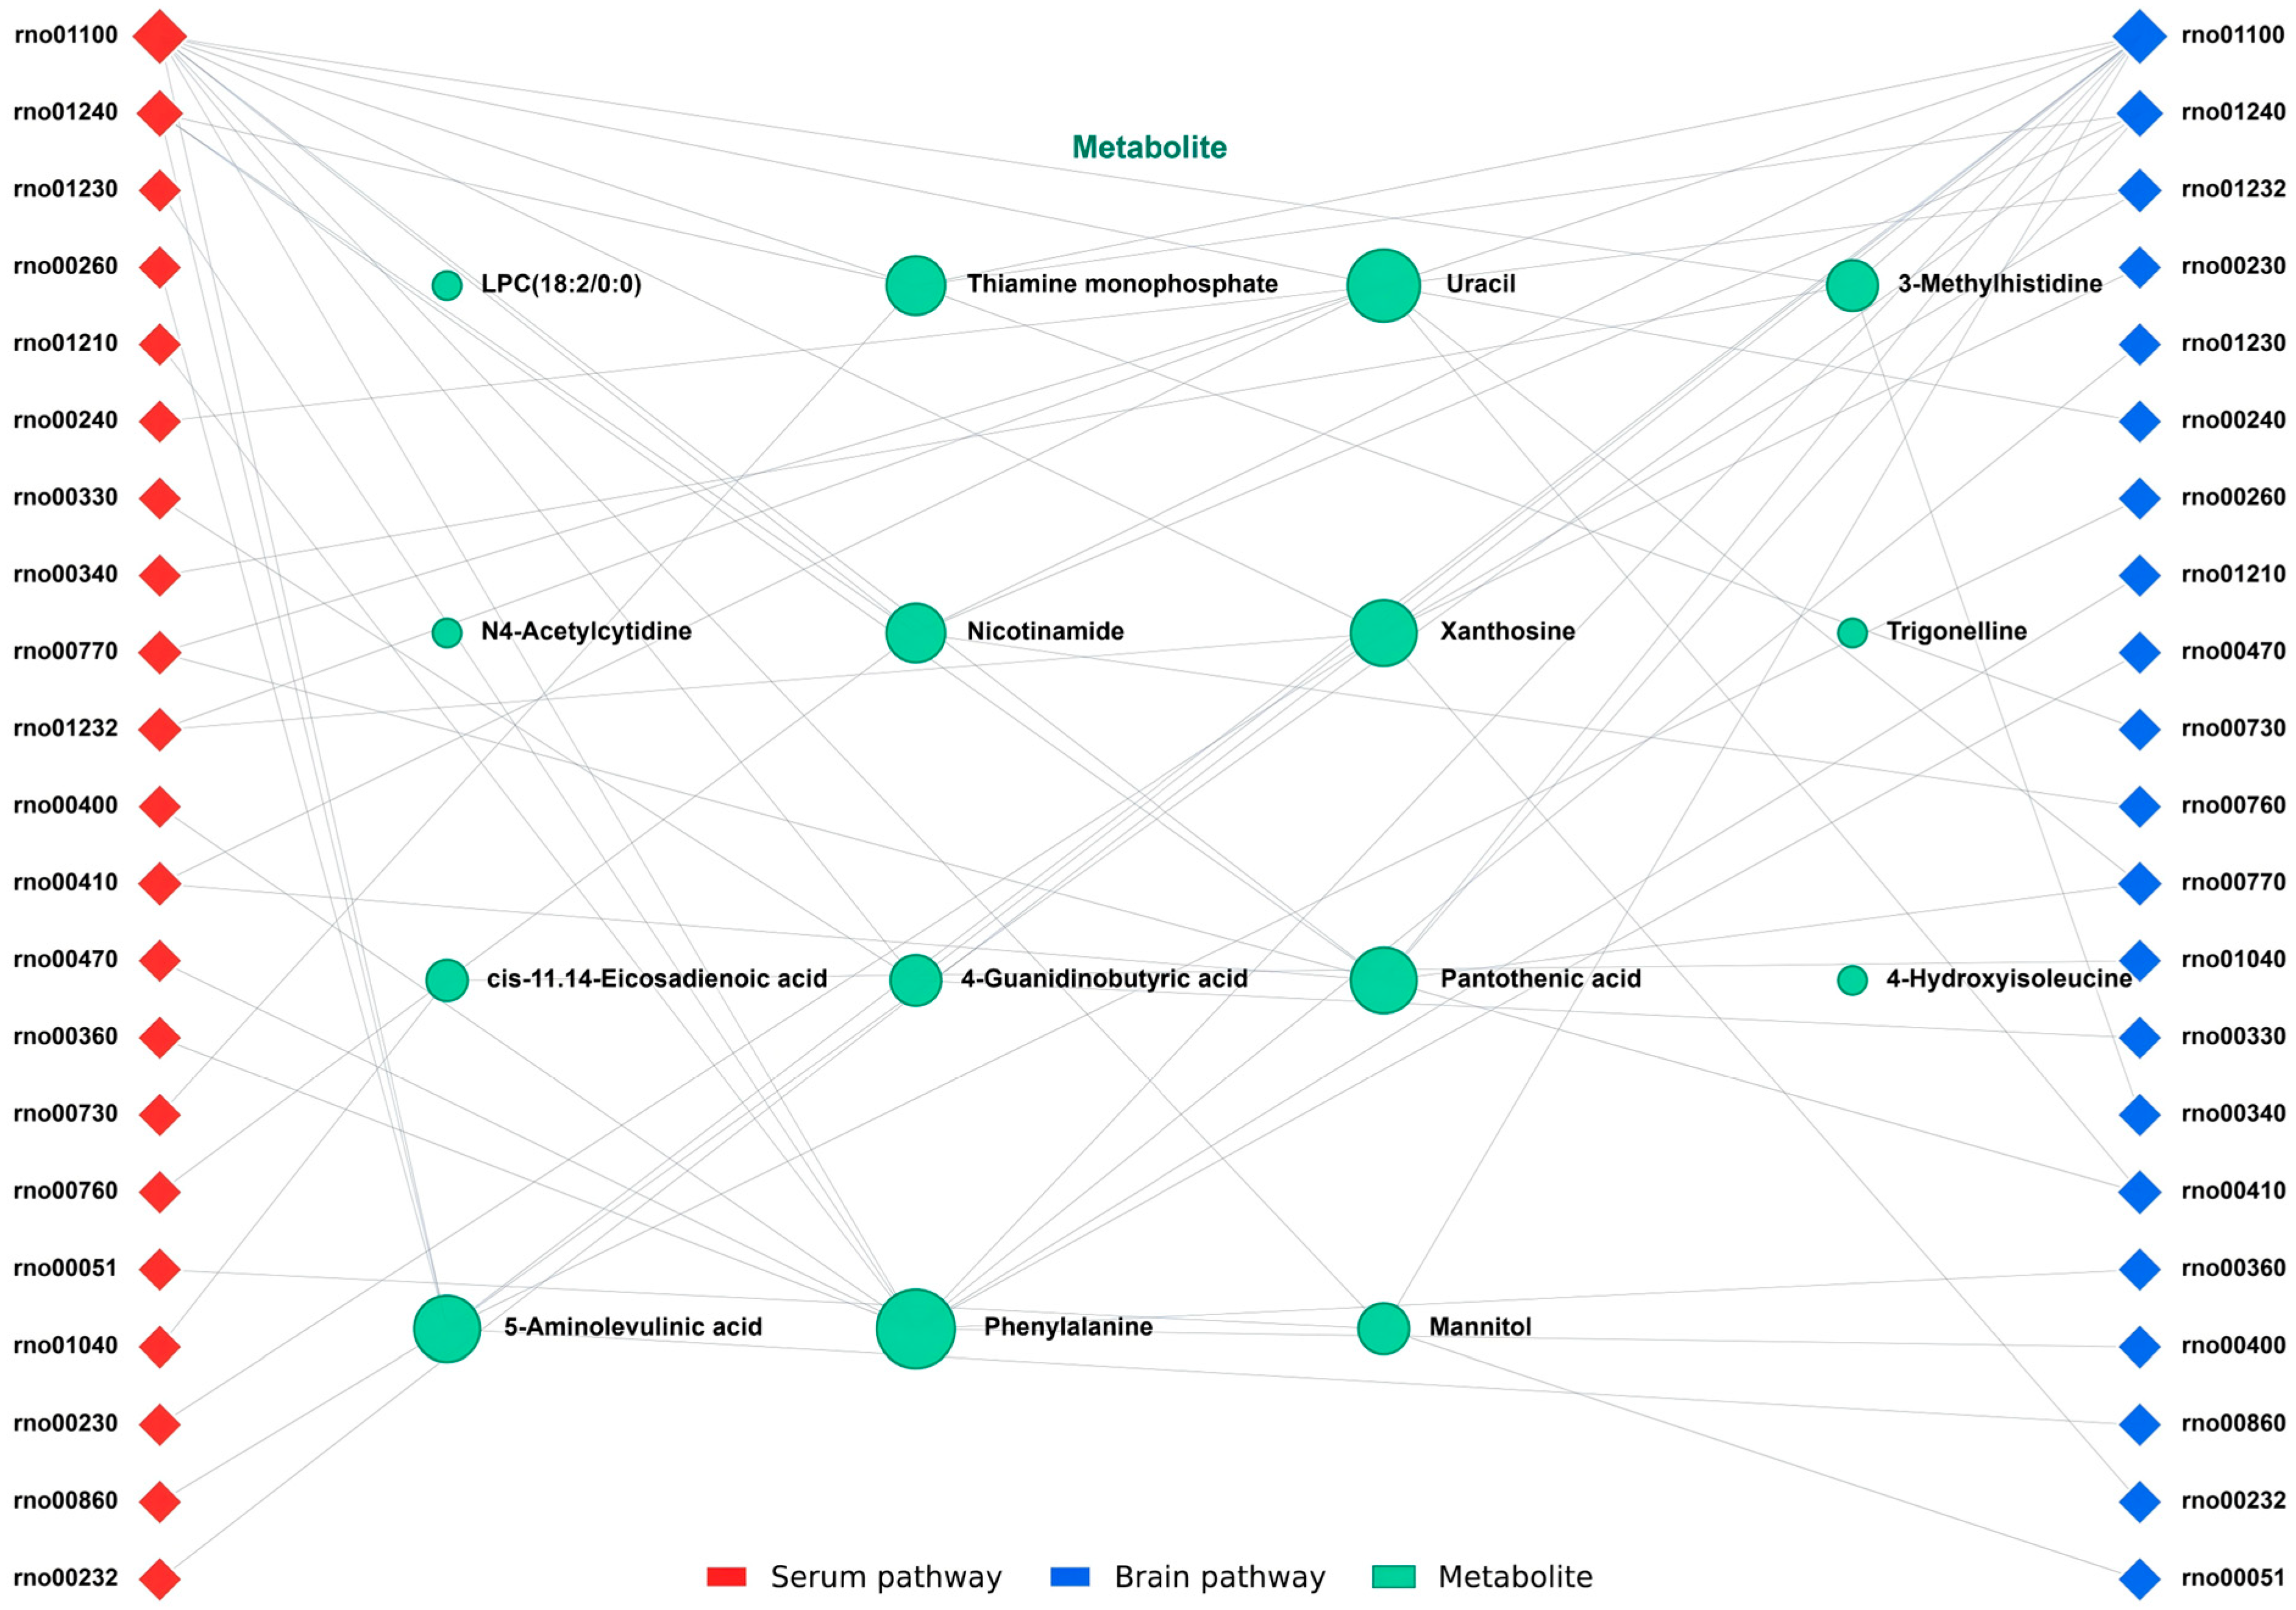
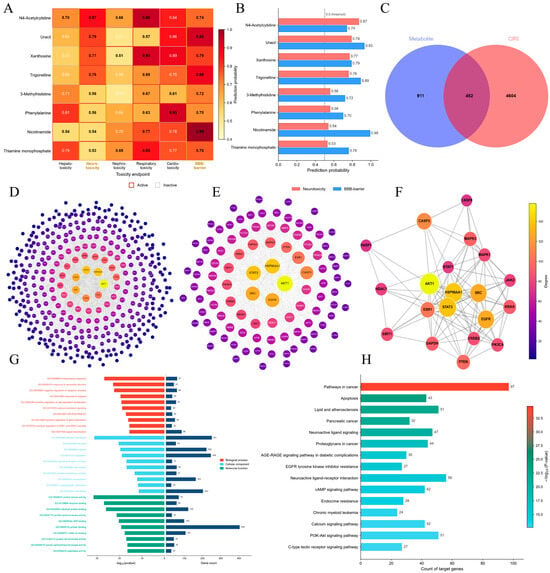
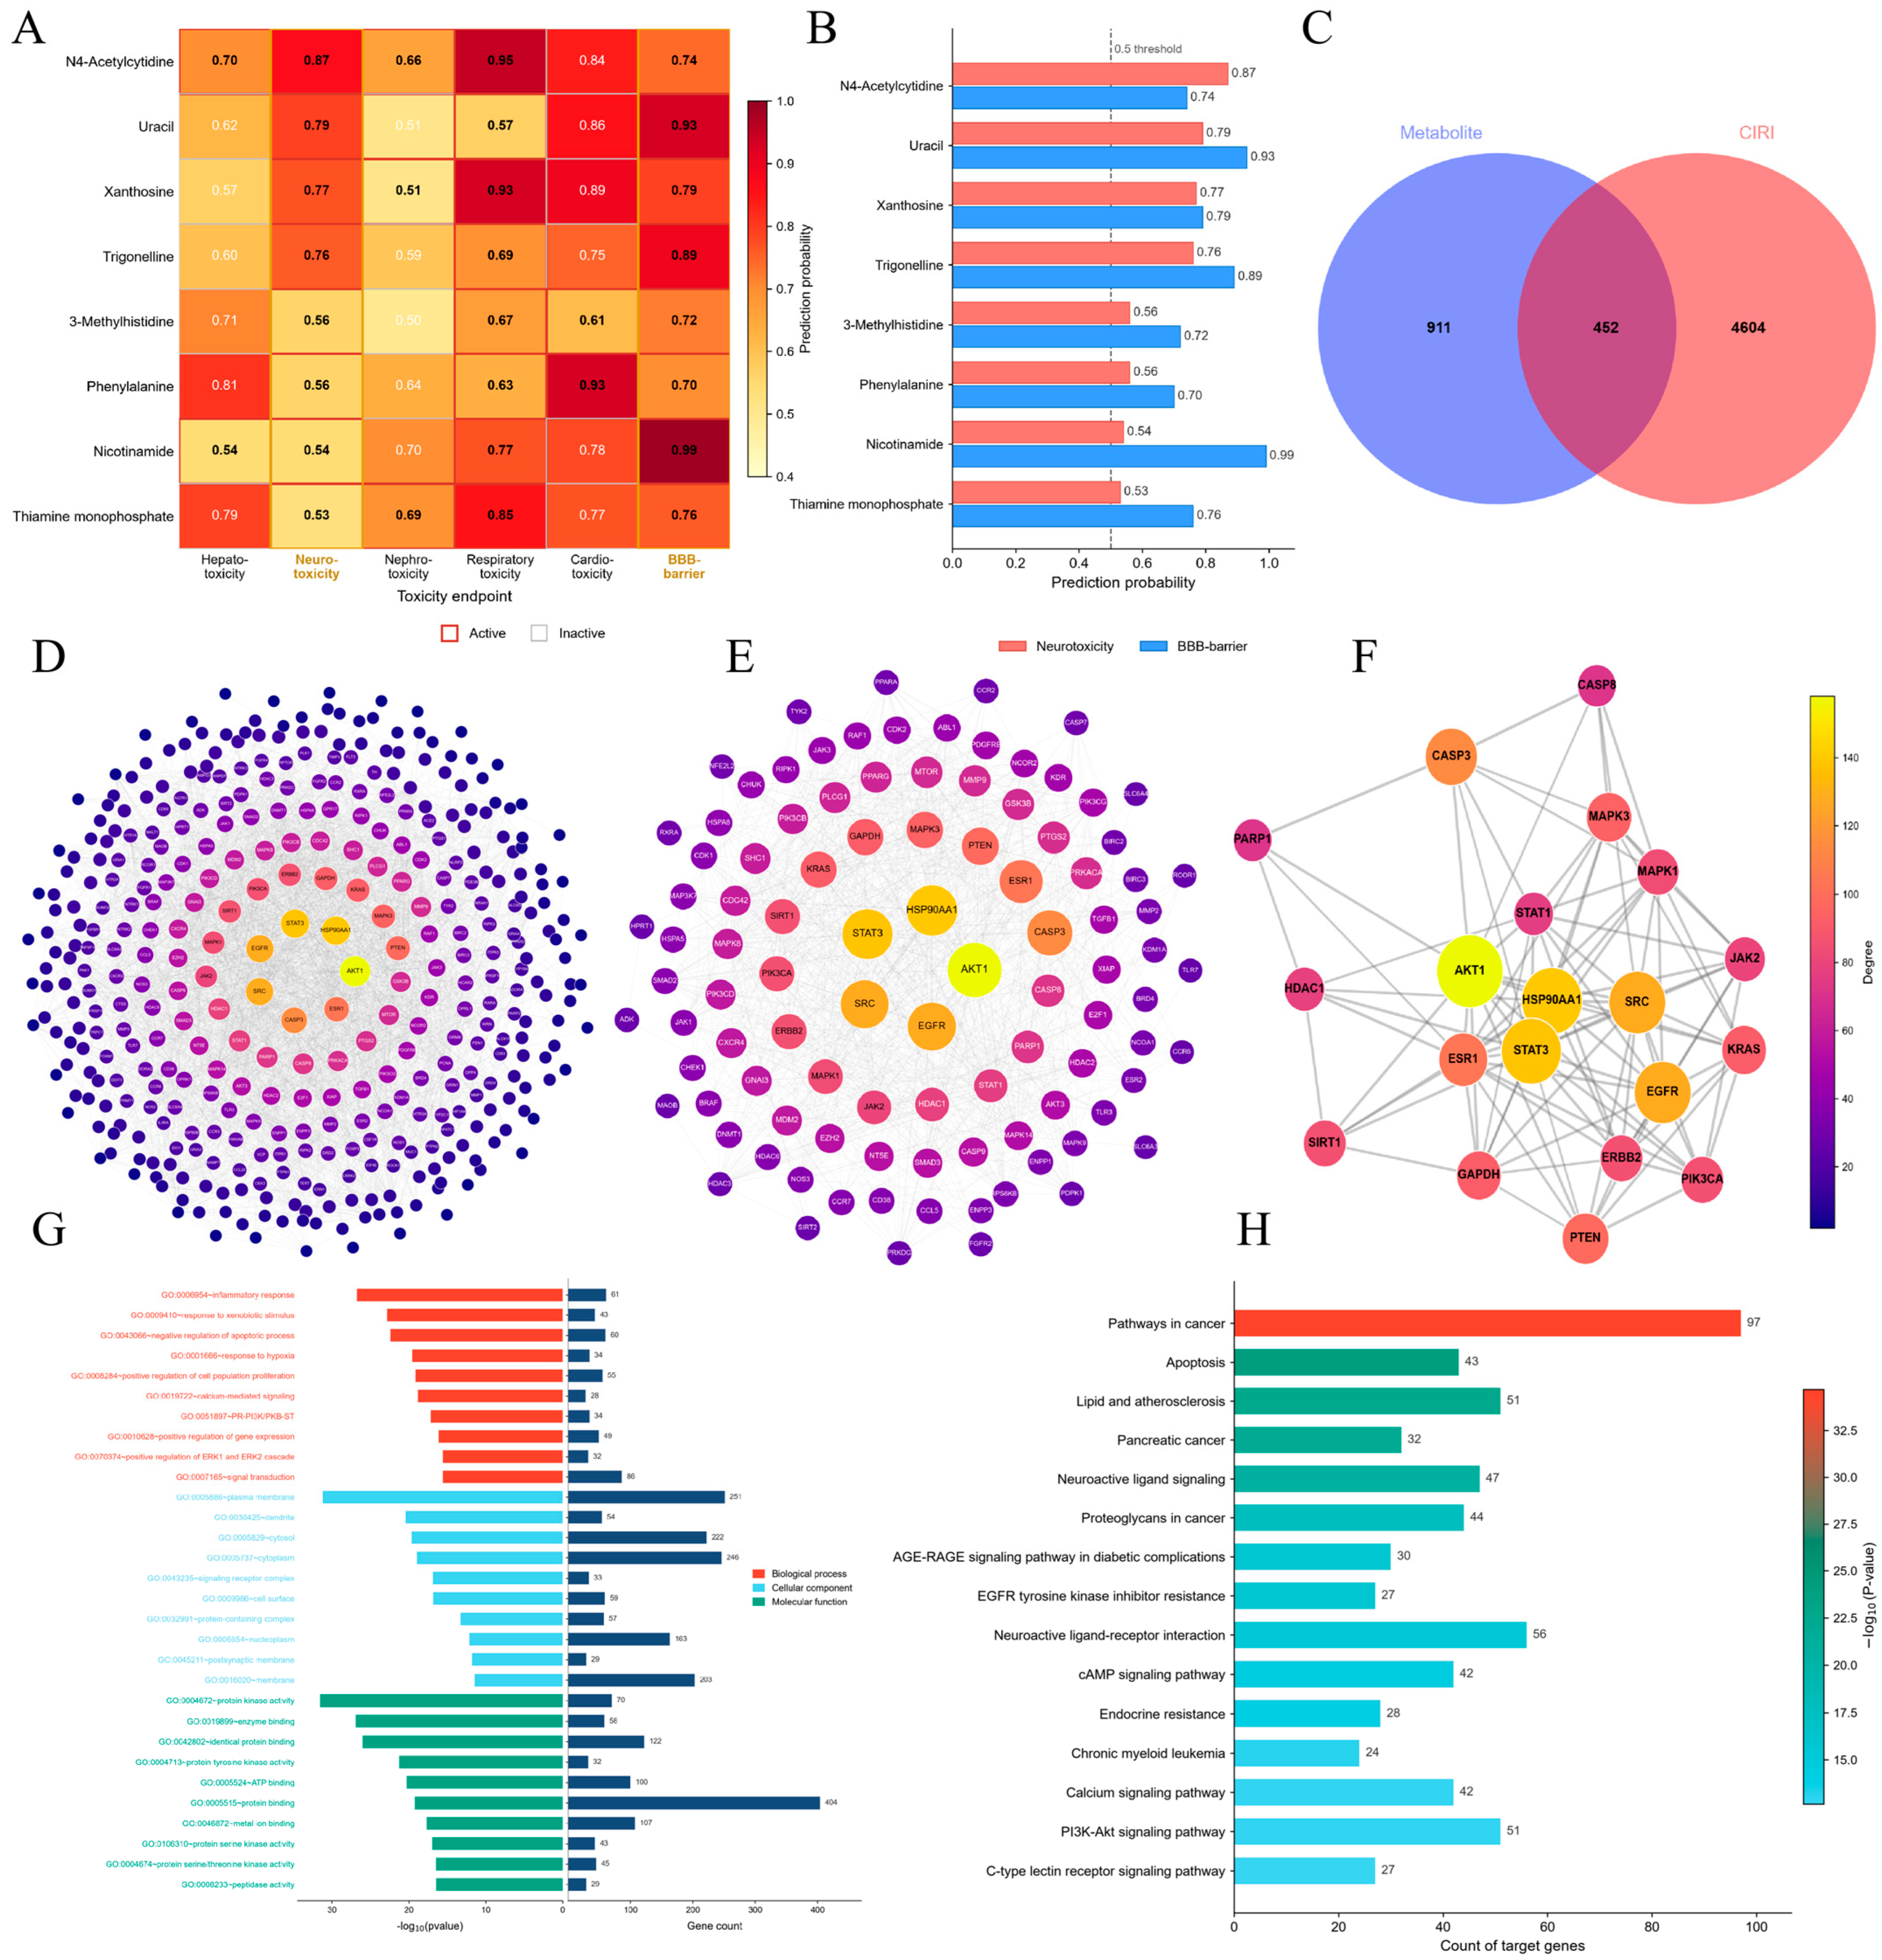
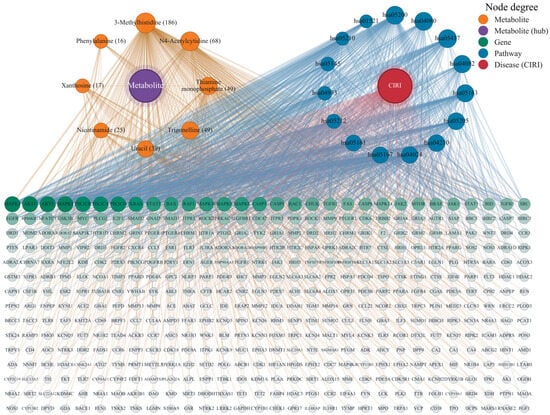
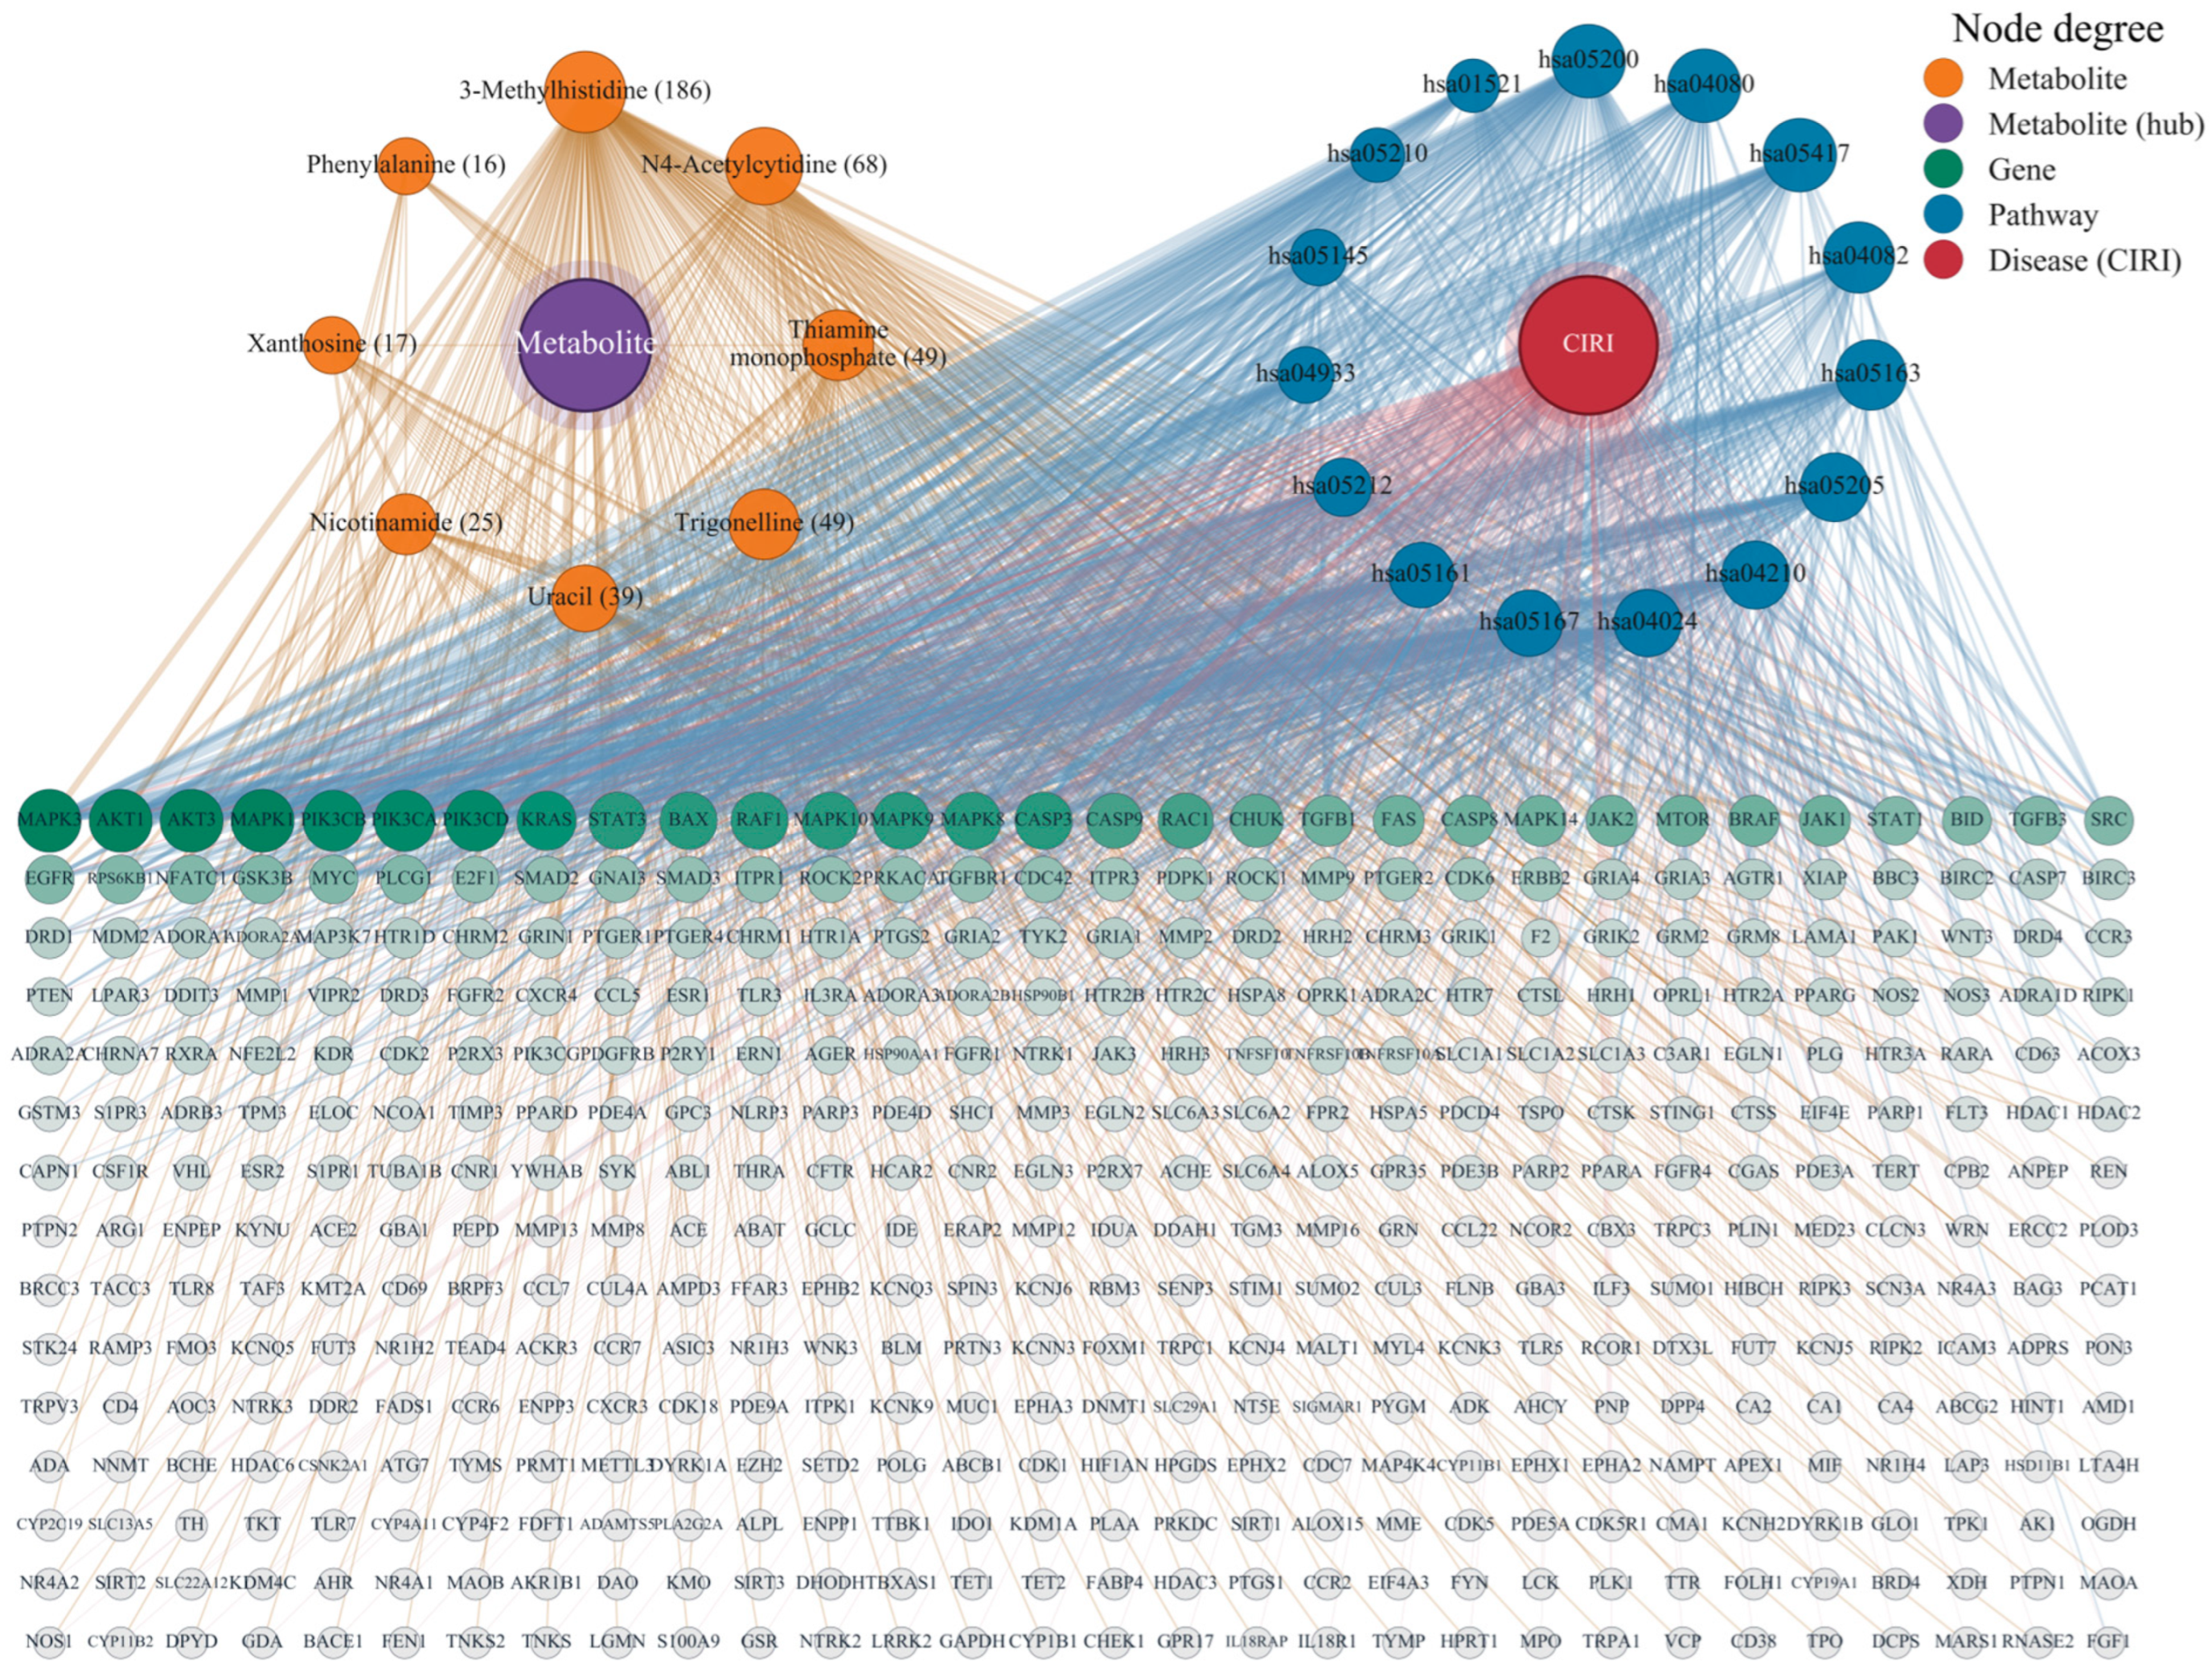
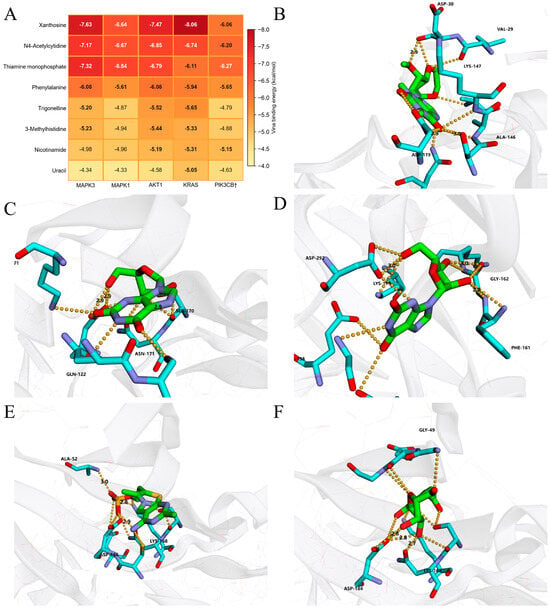
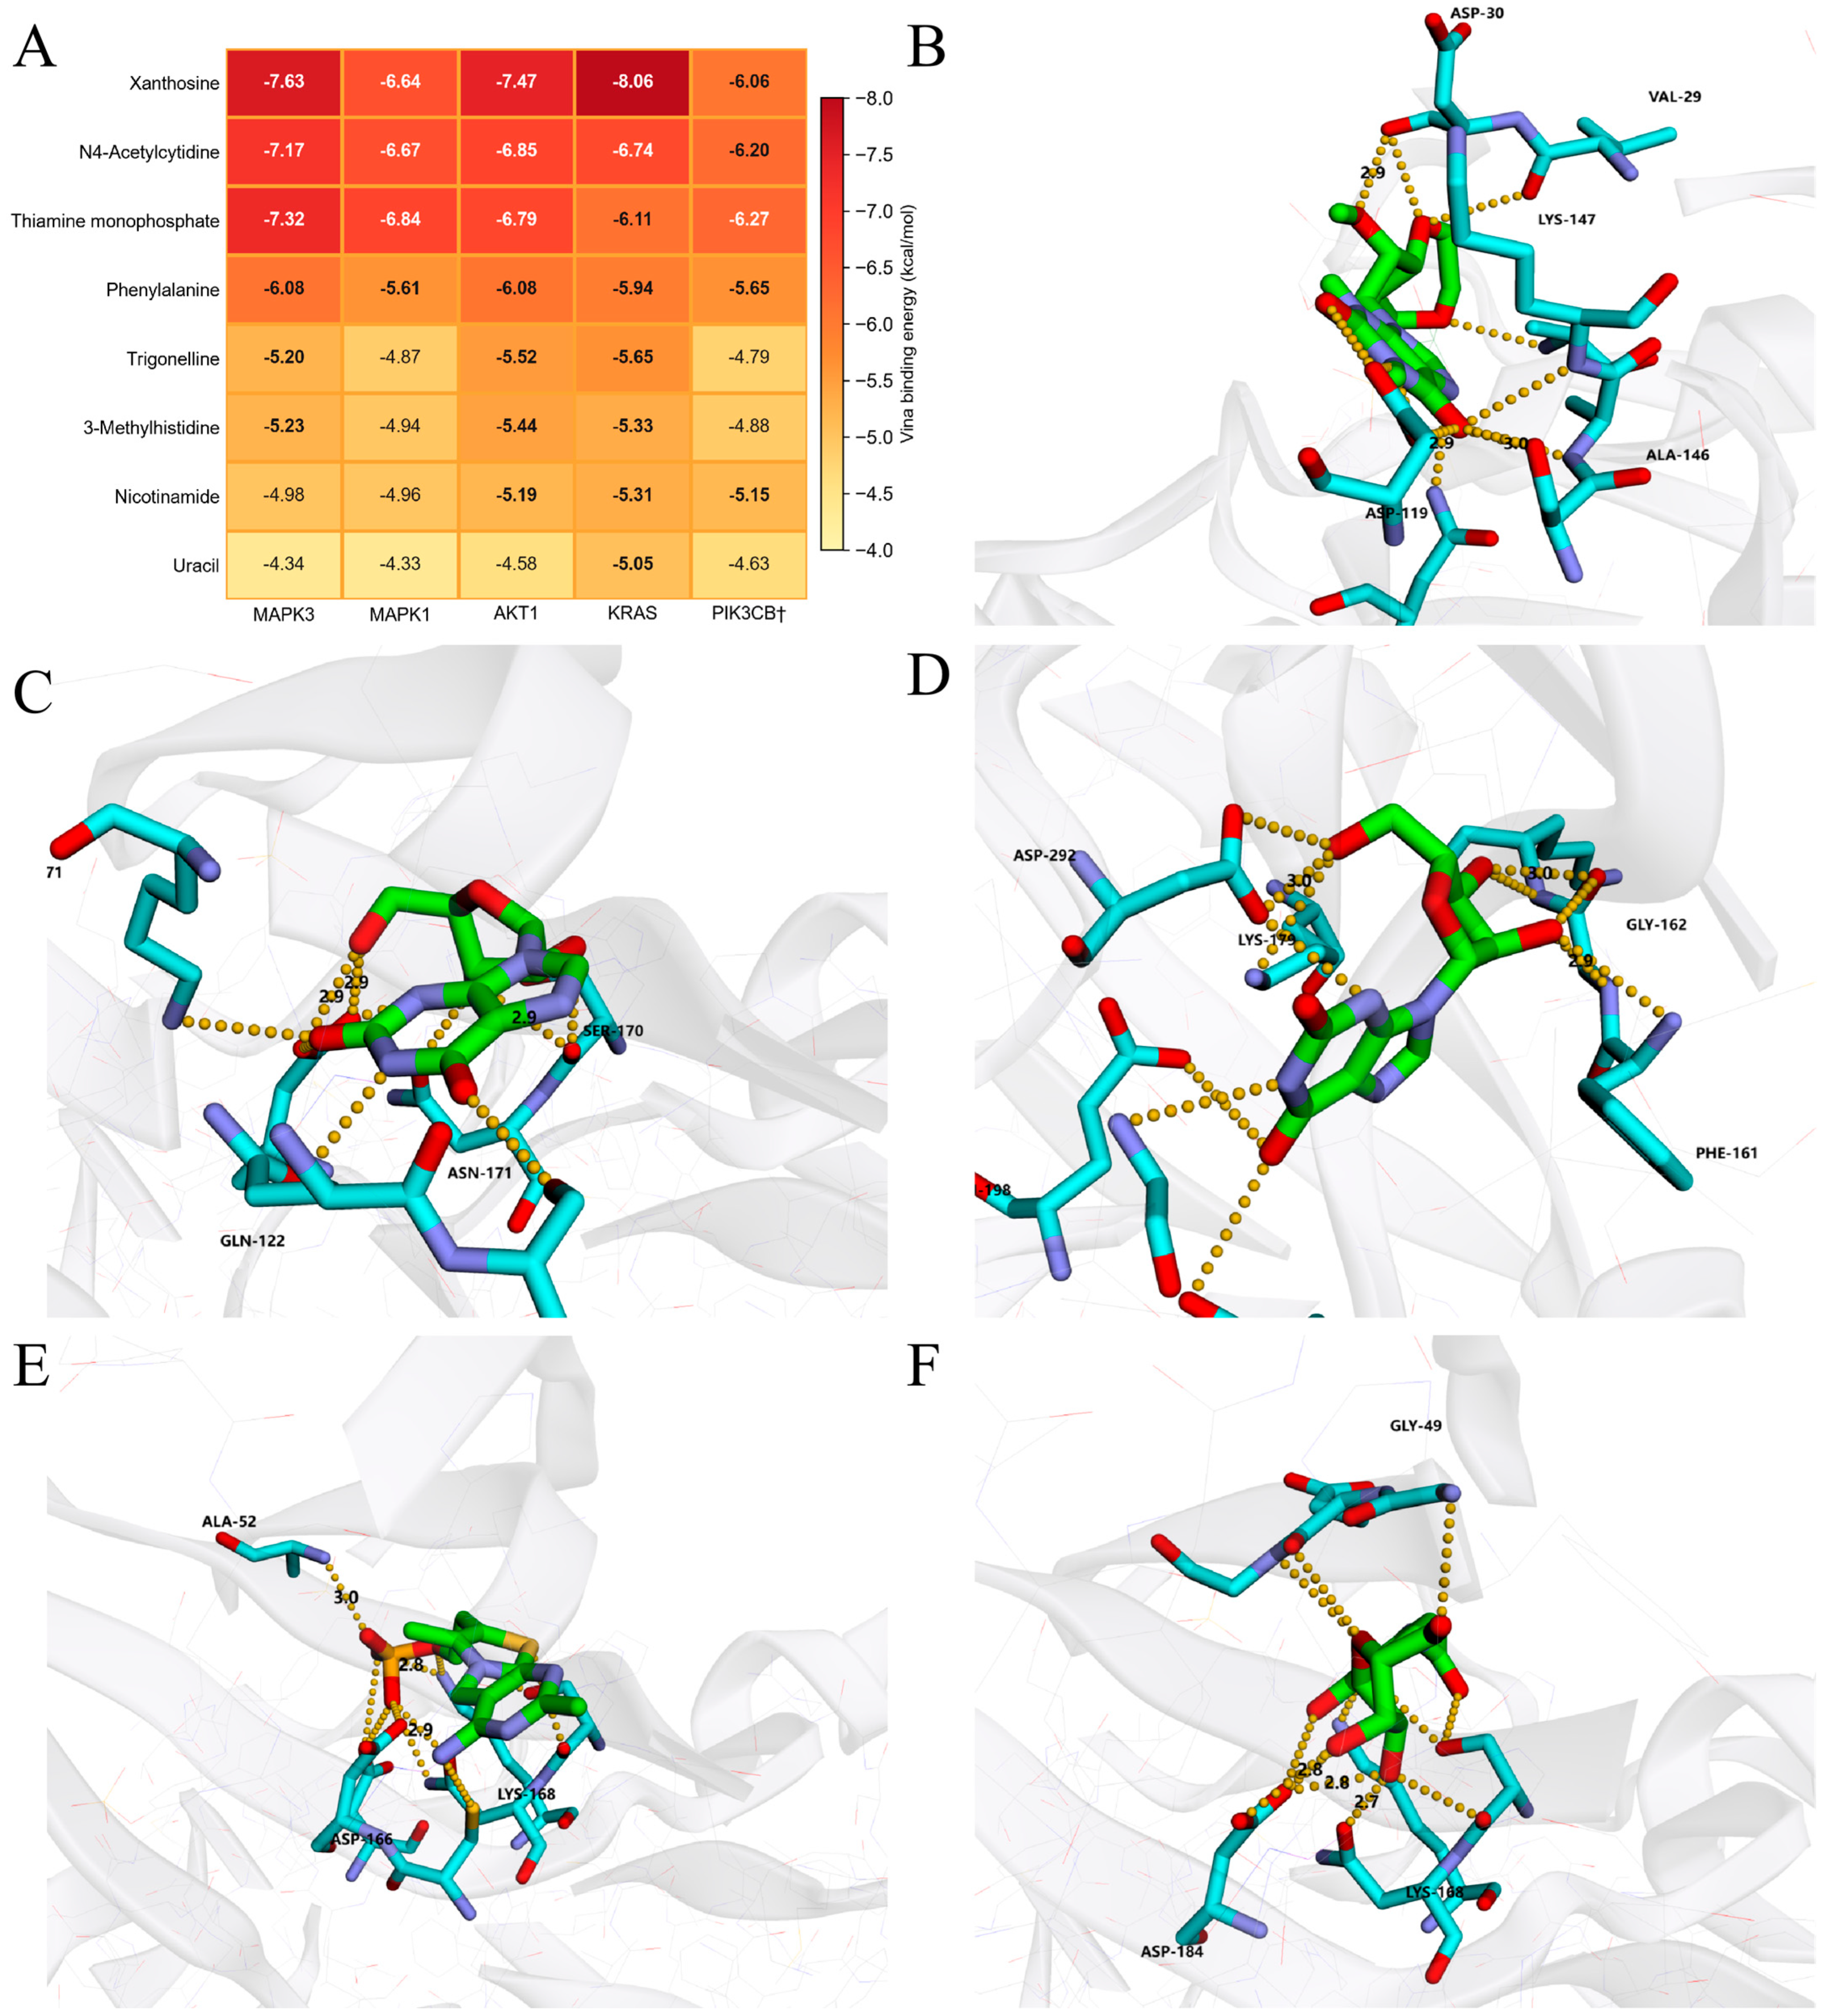
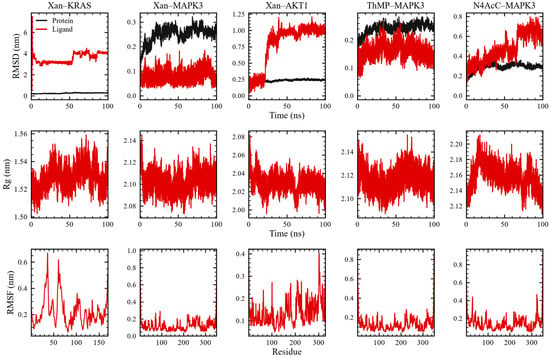
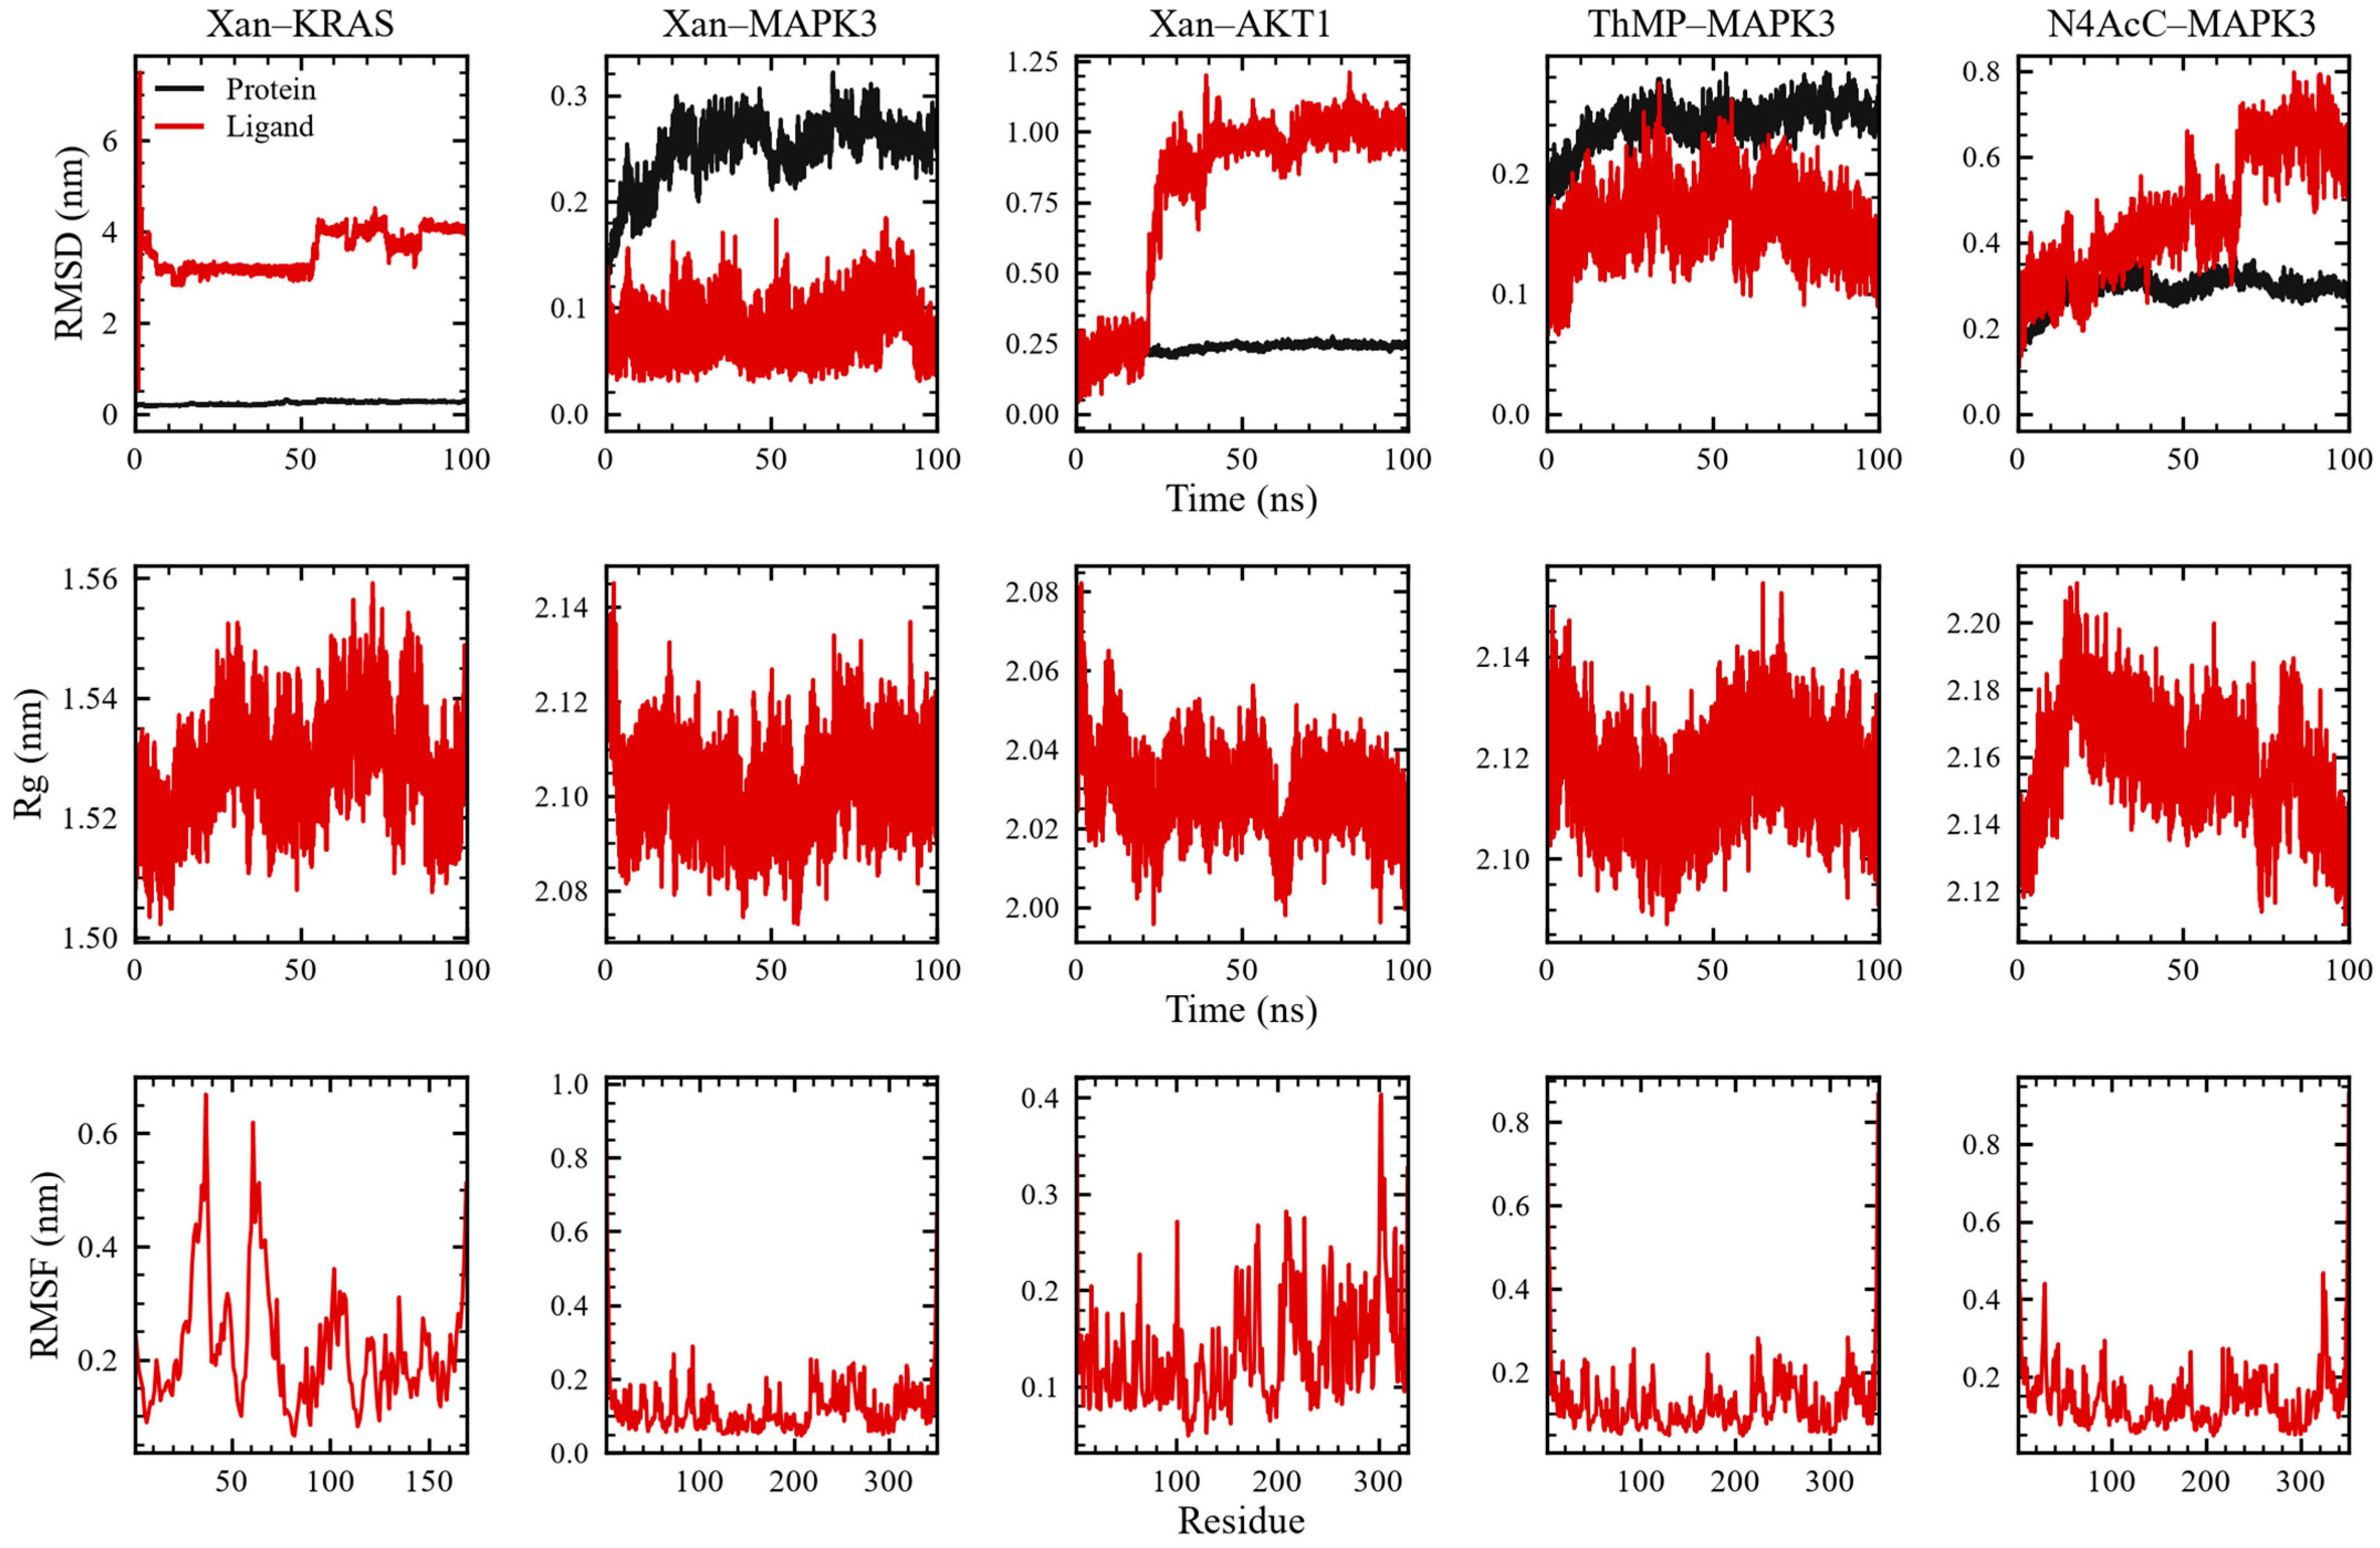

Disclaimer/Publisher’s Note: The statements, opinions and data contained in all publications are solely those of the individual author(s) and contributor(s) and not of MDPI and/or the editor(s). MDPI and/or the editor(s) disclaim responsibility for any injury to people or property resulting from any ideas, methods, instructions or products referred to in the content. |
© 2026 by the authors. Licensee MDPI, Basel, Switzerland. This article is an open access article distributed under the terms and conditions of the Creative Commons Attribution (CC BY) license.