


Abstract
Background: Fibroblast activation and extracellular matrix (ECM) remodeling are central to ventricular remodeling in heart failure (HF), but fibroblast heterogeneity complicates the prioritization of disease-associated genes. We integrated single-cell and bulk transcriptomic data to prioritize HF fibroblast-associated candidates and evaluate their predicted network effects. Methods: High-dimensional weighted gene co-expression network analysis (hdWGCNA) was performed on GSE288222 fibroblasts, and module-HF associations were evaluated at the subject level. Candidate screening, classifier comparison, and TreeSHAP ranking were conducted in three bulk myocardial cohorts. We assessed robustness using training-fitted batch correction, fully nested cross-validation, repeated feature ranking, and nested leave-one-cohort-out analysis. Candidate-level and fixed-model performance were evaluated in GSE55296 and GSE42955. Hallmark single-sample gene set enrichment analysis (ssGSEA) assessed tissue-level pathway associations. A shared fibroblast network from GSE226314 was analyzed by scTenifoldKnk. Results: The Fibro-M1 module (303 genes) was positively associated with HF across 12 subjects (r = 0.919, FDR = 9.77 × 10⁻⁵), and leave-one-subject-out correlations ranged from 0.910 to 0.934. Seventy-four genes entered machine learning, and TreeSHAP prioritized SMOC2, FNDC1, KCNN3, SFRP4, and LUM. Training-fitted preprocessing recovered the same five-gene set; the internal-test AUC was 0.961 (95% CI, 0.924–0.999), and the fully nested five-fold AUC was 0.940 (95% CI, 0.907–0.972). In GSE42955 (24 HF samples and five controls), the locked five-gene SVM yielded an AUC of 0.875 (95% CI, 0.662–1.000). In GSE55296, SMOC2 and SFRP4 were replicated at the expression level, whereas fixed-reference five-gene discrimination was not maintained (AUC = 0.492; 95% CI, 0.240–0.745). Nested leave-one-cohort-out AUCs ranged from 0.863 to 0.959, but selected features differed among rotations. In the pooled fibroblast network, the five virtual knockouts yielded 1, 0, 1, 2, and 2 significant genes, respectively; recurrence of DCN varied across pooled and stratified networks. Conclusions: Integrating fibroblast co-expression structure with multi-cohort transcriptomics prioritized SMOC2, FNDC1, KCNN3, SFRP4, and LUM as HF-associated candidates. Their cross-cohort evidence and predicted network effects were heterogeneous, and model transportability depended on the evaluation platform. The recurrent DCN signal suggests a shared extracellular-matrix network response that deserves further study.
1. Introduction
Heart failure (HF) is the end stage of cardiovascular disease, with persistently high rates of morbidity and mortality worldwide [1]. Although guideline-directed medical therapy centered on quadruple therapy has significantly improved the prognosis of patients with heart failure with reduced ejection fraction (HFrEF) [2], a substantial proportion of elderly patients still face a high risk of mortality and readmission even after optimized treatment. In addition, evidence-based disease-modifying therapies for heart failure with preserved ejection fraction (HFpEF) remain limited [3]. Therefore, a deeper understanding of the molecular mechanisms of heart failure and the identification of new therapeutic targets and biomarkers remain critical scientific challenges in cardiovascular medicine.
Cardiac fibrosis is a key pathological change in HF progression [4]. Cardiac fibroblasts (CFs), the primary effector cells in this process, maintain the balance between ECM synthesis and degradation under physiological conditions, thereby preserving myocardial structure and mechanical stability. However, under pathological stimuli such as persistent pressure overload or ischemic injury, CFs are activated and differentiate into myofibroblasts, secreting large amounts of ECM components such as collagen; this increases myocardial stiffness and impairs diastolic function, ultimately accelerating HF progression [5]. In recent years, single-cell transcriptomic studies have shown that cardiac fibroblasts comprise functionally distinct subpopulations that exert different functions during HF progression [6]. In a mouse model of pressure overload, single-cell RNA sequencing identified six CF subpopulations, one of which is specific to the HF stage [7], indicating its involvement in HF development. Therefore, resolving CF heterogeneity and identifying key regulatory genes are important for understanding myocardial fibrosis and discovering anti-fibrotic targets [8].
Advances in single-cell RNA sequencing have provided cell-level transcriptional information for resolving fibroblast heterogeneity [9]. hdWGCNA can identify co-expressed gene modules, thereby focusing the analysis on gene sets with shared expression patterns. hdWGCNA has been used to analyze co-expression modules in fibroblasts from heart failure after myocardial infarction [10], and machine learning can evaluate and prioritize the contribution of candidate features to disease discrimination [11]. scTenifoldKnk, based on single-cell gene regulatory networks, can further predict network perturbation effects after removal of target nodes. These methods have been applied to integrated analysis of fibroblast-related candidate genes in ischemic cardiomyopathy [12]. However, few HF studies have incorporated fibroblast co-expression modules, multi-cohort feature screening, and virtual knockout prediction into a single analytical framework.
Against this background, we developed a cell-type-informed computational framework for candidate prioritization in HF. GSE288222 was used to define subject-level HF-associated fibroblast co-expression modules, and three bulk myocardial cohorts were used for training-restricted screening, classifier comparison, and out-of-fold TreeSHAP ranking. Robustness was examined through repeated resampling, preprocessing sensitivity analyses, nested leave-one-cohort-out analysis, and two independent cohorts with different platform characteristics. GSE226314 fibroblasts were used to predict network changes after virtual knockout. This study aimed to prioritize fibroblast-associated genes by integrating complementary transcriptomic evidence and to generate experimentally testable hypotheses about their network effects.
2. Materials and Methods
2.1. Data Sources and Processing
All data were obtained from the NCBI Gene Expression Omnibus (GEO). GSE288222 comprised left-ventricular tissue from 6 patients with end-stage HF and 6 non-diseased donors (52,967 cells before quality control) and was used for the cardiac single-cell atlas and fibroblast co-expression analysis. Age, sex, and HF etiology were not reported in GEO for these subjects. GSE226314 provided 15,700 fibroblasts from 14 non-failing donors and 11,180 fibroblasts from 13 patients with HF before left ventricular assist device (LVAD) implantation; post-LVAD samples were excluded. GSE57338, GSE79962, and GSE26887 were used as discovery bulk myocardial cohorts. Of 51 GSE79962 samples, 20 sepsis-associated cardiomyopathy samples were excluded, leaving 11 ischemic cardiomyopathy (ICM), 9 non-ischemic dilated cardiomyopathy (DCM), and 11 non-failing control samples. GSE55296 (10 controls, 13 DCM, and 13 ICM) was used for cross-platform candidate replication and preprocessing sensitivity analysis. GSE42955, selected as an additional evaluation cohort using explicit eligibility criteria (human left ventricle, HF and non-failing controls, complete five-gene coverage, and a platform represented in the discovery cohorts), comprised 24 HF samples (12 DCM and 12 ICM) and 5 normal hearts.
2.2. Single-Cell RNA Sequencing Data Processing and Cell Clustering
Raw count matrices for GSE288222 were read in separately for each subject and processed in R (version 4.6.1) with Seurat (version 5.5.1). Quality control retained cells with 200–5000 detected genes, mitochondrial transcript proportion ≤ 10%, and hemoglobin-related transcript proportion ≤ 5% [13]. DoubletFinder (version 2.0.6) was used to detect doublets in each subject, with an expected doublet rate of 5% [14]. Cells that passed quality control were normalized with LogNormalize (scale factor 10,000), and 2000 highly variable genes were selected using the vst method. After ScaleData processing, principal component analysis (PCA) was performed, and Harmony (version 2.0.5) was used to correct inter-subject technical variation with the subject as a covariate [15]. A shared nearest-neighbor graph was built in the Harmony low-dimensional space, and clustering was performed with the Louvain algorithm. Clustree (version 0.5.1) was used to evaluate clustering resolution from 0.1 to 1.2 in increments of 0.1, and 0.1 was selected. UMAP was used to visualize the low-dimensional structure [16]. FindAllMarkers was used to identify marker genes for each cluster, which were then manually annotated in combination with previously reported cardiac cell lineage markers. Preliminarily annotated fibroblasts were extracted and re-normalized, followed by highly variable gene selection, PCA, and clustering (resolution 0.5). FindAllMarkers was used to identify marker genes for each subpopulation, and these markers were combined with highly expressed genes for state annotation. After removing contaminating cells with cardiomyocyte, endothelial, or mesothelial-like features, high-confidence fibroblasts were retained for downstream analysis.
2.3. Weighted Gene Co-Expression Network Analysis and Module-Disease Association
A weighted gene co-expression network was constructed with hdWGCNA (version 0.4.12) using the final set of retained fibroblasts [17]. The 2000 highly variable genes selected by the vst method were used as network inputs, and metacells were constructed within subjects and disease groups (k = 25; maximum number of shared cells = 10) to stabilize sparse expression for network estimation. A signed Pearson network was built from normalized metacell expression. Candidate soft thresholds were even numbers from 1 to 10 and 12 to 30; a soft threshold of 6 was selected based on a scale-free topology fit index R2 > 0.8 and network connectivity. The minimum module size was 50, and the module merging cut height was 0.15. Module eigengenes were first calculated for cells and then averaged within each subject. Pearson correlations between these subject-level eigengenes and disease group (HF = 1, control = 0) were calculated across the 12 subjects, and module p values were adjusted using the Benjamini–Hochberg method [18]. Only non-gray modules with subject-level FDR < 0.05 entered candidate screening. Leave-one-subject-out analyses and sensitivity analyses excluding subjects below prespecified retained-fibroblast thresholds were used to assess whether the Fibro-M1 association was driven by an individual subject or very small cell contribution.
2.4. Bulk Transcriptomic Data Preprocessing and Candidate Gene Screening
GEOquery (version 2.80.0) was used to read the GSE57338, GSE79962, and GSE26887 expression matrices and annotations [19]. Probes were mapped using the corresponding GEO platform annotation file; when multiple probes mapped to one gene, the probe with the largest within-cohort interquartile range was retained. Expression values were on a log2 scale and were quantile-normalized within each cohort using limma (version 3.68.4) [20]. The primary discovery matrix was merged across genes shared by all three cohorts and adjusted with ComBat using cohort as the batch variable without disease group as a covariate. In the primary analysis, ComBat parameters were estimated before the 258/110 training/internal-test split. A training-fitted preprocessing analysis was subsequently performed to assess the influence of this procedure. In a leakage-sensitivity analysis, we restarted from the pre-ComBat matrices and estimated gene-specific additive cohort offsets using only the 258 training samples, without outcome labels and with GSE57338 as the reference. These fixed training-derived offsets were applied to the training and internal-test samples. Wilcoxon screening, single-gene ROC filtering, out-of-fold TreeSHAP ranking, and SVM fitting were restricted to the training data. A fully nested five-fold analysis additionally repeated batch-offset estimation, feature screening, ranking, and model fitting within every outer training fold. Cohort composition, platform, tissue source, and processing differences were recorded in the GEO source records and in the sample-level audit files provided in Code S1 (09_auditdiscovery_bulk).
After preprocessing of the discovery cohorts, stratified random sampling by dataset and disease group divided the 368 samples into a training set of 258 (151 HF, 107 Control) and an internal test set of 110 (65 HF, 45 Control), with a random seed of 20260801. Candidate gene screening, classifier comparison, feature ranking, and model hyperparameter tuning used only training set labels. Centering and scaling parameters for modeling were estimated within each cross-validation training fold. Final centering and scaling parameters for the five-gene SVM were estimated from the full training set and applied to the internal test set.
Candidate gene screening was performed only in the training set. The 303 Fibro-M1 module genes were intersected with genes detected in all three discovery cohorts, yielding 224 genes. For each gene, a two-sided Wilcoxon rank-sum test was used to compare HF and control, and 164 genes with nominal p < 0.05 were retained. pROC (version 1.19.0.1) was then used to calculate single-gene ROC AUC [21]. ROC direction was automatically determined by the data, and 74 genes with AUC > 0.70 were retained as candidate features for machine learning (Table S1). This two-stage prescreening reduced the training-set feature space from 224 to 74 genes.
2.5. Classifier Comparison and Candidate Gene Prioritization
Ten classifiers were compared in the training set: partial least squares (PLS), gradient boosting machine, glmBoost, radial basis kernel support vector machine (SVM), XGBoost, K-nearest neighbors, neural network, random forest, decision tree, and logistic regression. Except for XGBoost, models were evaluated with caret (version 7.0.1) using five-fold cross-validation repeated five times, with ROC AUC as the optimization metric. Centering and scaling were performed within each training fold. Decision trees, neural networks, and the remaining models were tuned using preset grids or tuneLength = 3. XGBoost evaluated 12 preset hyperparameter combinations using the same repeated cross-validation indices, and the mean and standard deviation of AUC across validation folds were reported. The reported classifier-comparison AUC was the mean validation AUC across five repeats of five-fold cross-validation. Candidate gene ranking used five-fold out-of-fold TreeSHAP with XGBoost [22,23], with the combination that achieved the highest mean validation AUC among the 12 evaluated. In each round, the center and standard deviation were estimated using only the four training folds; the model was fitted, and TreeSHAP contributions were calculated in the held-out fold. Mean absolute SHAP values across all out-of-fold samples were aggregated, and the top five genes were selected as final candidate genes. This process was repeated with 50 random seeds, and the frequency of each gene in the top five was recorded. Stability analysis was restricted to the 74 candidate genes prescreened from the training set.
2.6. Model Development and Validation
The radial basis kernel SVM, selected in the discovery training set by comparing ten classifiers, was fitted using the five highest-ranked TreeSHAP genes. Sigma and C were optimized by five-fold cross-validation repeated five times in the training set, and the model was refitted on the complete training set. The initial GSE55296 analysis standardized each gene across all 36 samples. A frozen-reference analysis was then used to evaluate the model under sample-independent preprocessing. A frozen reference quantile distribution was estimated from the 258 discovery training samples using the 16,295 genes shared with GSE55296. Each internal-test and GSE55296 sample was independently mapped to this reference before applying the prespecified five-gene SVM; single-sample invariance was verified by processing GSE55296 samples separately. Candidate-level replication in GSE55296 used two-sided Wilcoxon rank-sum tests with Benjamini–Hochberg correction and single-gene ROC analysis. The same locked reference, five genes, and SVM were applied to GSE42955 without re-estimating preprocessing or model parameters. Overall HF-control performance and exploratory DCM-control and ICM-control subgroup performance were calculated.
Nested leave-one-cohort-out analysis evaluated transportability of the complete screening workflow. In each rotation, one cohort was held out in turn. Classifier selection was not repeated in either nested analysis; the radial basis kernel SVM served as the base classifier. XGBoost hyperparameters were held fixed in both nested analyses and were not re-tuned. Wilcoxon screening, single-gene ROC filtering, out-of-fold TreeSHAP ranking, top-five selection, and SVM tuning were repeated using only the other two cohorts, and the resulting model was applied to the held-out cohort. Label-free gene-wise standardization still used the overall expression distribution of the held-out cohort. Both choices were derived from all three cohorts, so the cohort held out in a given rotation was included in the data used to make them. This analysis quantified the cohort-level transportability of the complete screening and modeling workflow.
2.7. Hallmark ssGSEA
Single-sample gene set enrichment analysis (ssGSEA) was used to calculate scores for the 50 Hallmark gene sets from MSigDB [24]. The input was the 368-sample bulk myocardial expression matrix after within-cohort quantile normalization, merging, and ComBat correction [25]. Pathway scores were scaled to 0–1. Two-sided Wilcoxon rank-sum tests compared HF and Control samples, with Benjamini–Hochberg correction across 50 pathways. To avoid numerical cancellation to zero for extreme normal-approximation statistics, two-sided Wilcoxon tail probabilities were evaluated directly on the log scale using the same rank, tie, and continuity corrections as the standard asymptotic test. Two-sided Spearman correlations evaluated associations between the five candidate genes and pathway scores, with correction across all 250 gene-pathway tests. FDR < 0.05 was considered statistically significant. These analyses were performed at the bulk myocardial tissue level.
2.8. GSE226314 Network and Virtual Knockout
GSE226314 fibroblasts from 14 non-failing donors (15,700 cells) and 13 patients with HF before LVAD implantation (11,180 cells) were combined to estimate a shared fibroblast wild-type (WT) network; post-LVAD cells were excluded. The pooled cells provided a shared WT reference for comparing the five virtual-knockout perturbations. The 1000 Seurat vst highly variable genes, including all five candidate genes, were CPM-normalized before network inference.
Ten directed networks were inferred with scTenifoldNet (version 1.4) by randomly sampling 500 cells per network (q = 0.9, nComp = 3, scaleScores = TRUE, symmetric = FALSE) and integrated by tensor decomposition (K = 3, maxIter = 1000, maxError = 1 × 10⁻⁵, nDecimal = 3; seed = 1). For each virtual knockout, all outgoing edges of the target gene were set to zero. The WT and knockout networks were aligned with d = 2, and differential regulation was assessed with dRegulation in scTenifoldKnk (version 1.1) [26]. After excluding the knocked-out gene, BH FDR < 0.05 defined statistical significance. To assess sensitivity to pooling, donor-only and pre-LVAD-HF-only networks were reconstructed using the same fixed 1000-gene universe and inference settings, with three networks of 300 cells per clinical group and prespecified random seeds. These reduced resampling networks were used for group-stratified sensitivity analysis.
2.9. Statistical Analysis and Reproducibility
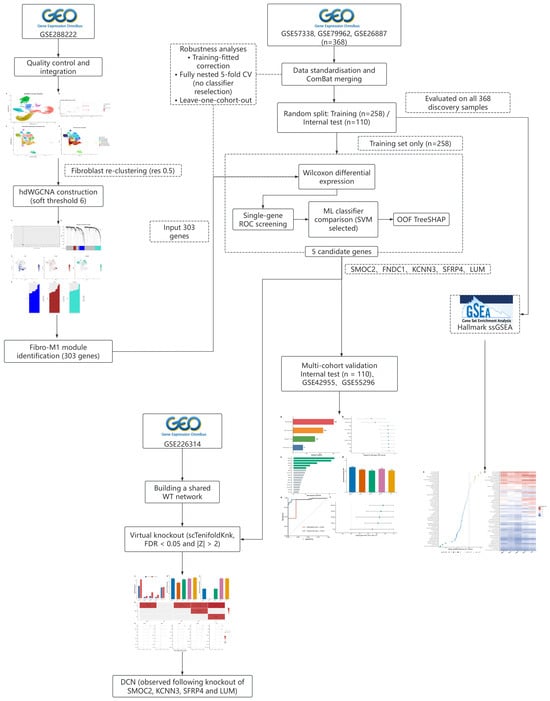
Candidate gene expression and bulk myocardial Hallmark scores were compared between HF and Control using two-sided Wilcoxon rank-sum tests. Subject-level module eigengenes and disease group were analyzed by Pearson correlation, and candidate gene-pathway associations were assessed by two-sided Spearman correlation. Benjamini–Hochberg correction was applied to module associations, 50 Hallmark comparisons, 250 gene-pathway correlations, five candidate-level replication tests within each external cohort, and each virtual-knockout analysis. ROC AUCs and 95% confidence intervals (CIs) were calculated with pROC using the DeLong method; PR AUC intervals used 2000 stratified bootstrap resamples. Paired DeLong tests compared predictions from alternative preprocessing procedures applied to the same samples. Except for prespecified training-set candidate screening, which used nominal p < 0.05, followed by AUC > 0.70, statistical significance was defined as FDR < 0.05. All analyses were two-sided. Random seeds and exact software versions are reported in Table S2, and analysis scripts are provided in Code S1. The overall study design is shown in Figure 1.
Figure 1.
Overview of the study design.
3. Results
3.1. Fibroblasts from Patients with Heart Failure Exhibit Significant Transcriptomic Remodeling
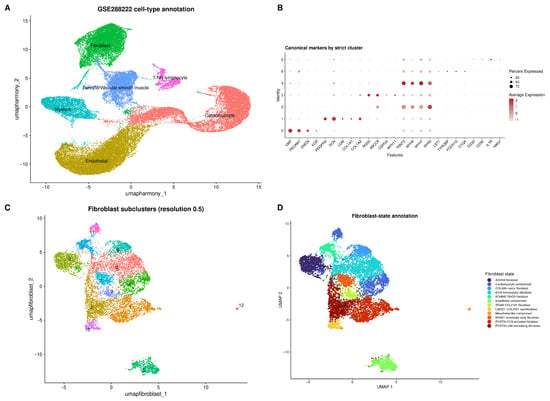
GSE288222 initially contained 52,967 cells, and 44,533 high-quality cells were retained after quality control. UMAP dimensionality reduction and clustering identified six major cell clusters, annotated by canonical marker genes as fibroblasts (8535), cardiomyocytes (12,153), endothelial cells (13,270), myeloid cells (4223), pericytes/vascular smooth muscle cells (4925), and T/NK lymphocytes (1427) (Figure 2A,B). After Harmony correction, cells from different donors were uniformly mixed, and cluster analysis showed a stable clustering structure at a resolution of 0.1 (Figure S1).
Figure 2.
Single-cell atlas and fibroblast heterogeneity in heart failure. (A) UMAP of six major cardiac cell populations, each shown in a distinct color and labeled in place. (B) Expression of canonical lineage markers; the numbers on the y-axis are cluster IDs, dot size indicates the percentage of expressing cells, and color indicates average expression. (C) Fibroblast reclustering; numbers indicate cluster IDs assigned at resolution 0.5, and colors distinguish the subclusters. (D) Fibroblast state annotation; colors correspond to the states and contaminant classes listed in the legend.
Reclustering of the preliminarily annotated fibroblasts identified cell states including homeostatic matrix, POSTN-CCN activation, POSTN-LUM remodeling, ADH1B, COL6A6 matrix, and immediate early response (Figure 2C,D). After removing 1613 contaminating cells with cardiomyocyte, endothelial, or mesothelial features, 6922 high-confidence fibroblasts were retained.
3.2. hdWGCNA Identification of Fibroblast Co-Expression Modules Associated with Heart Failure
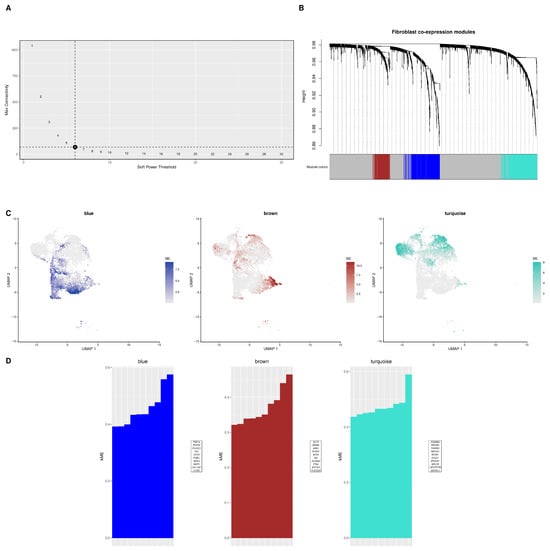
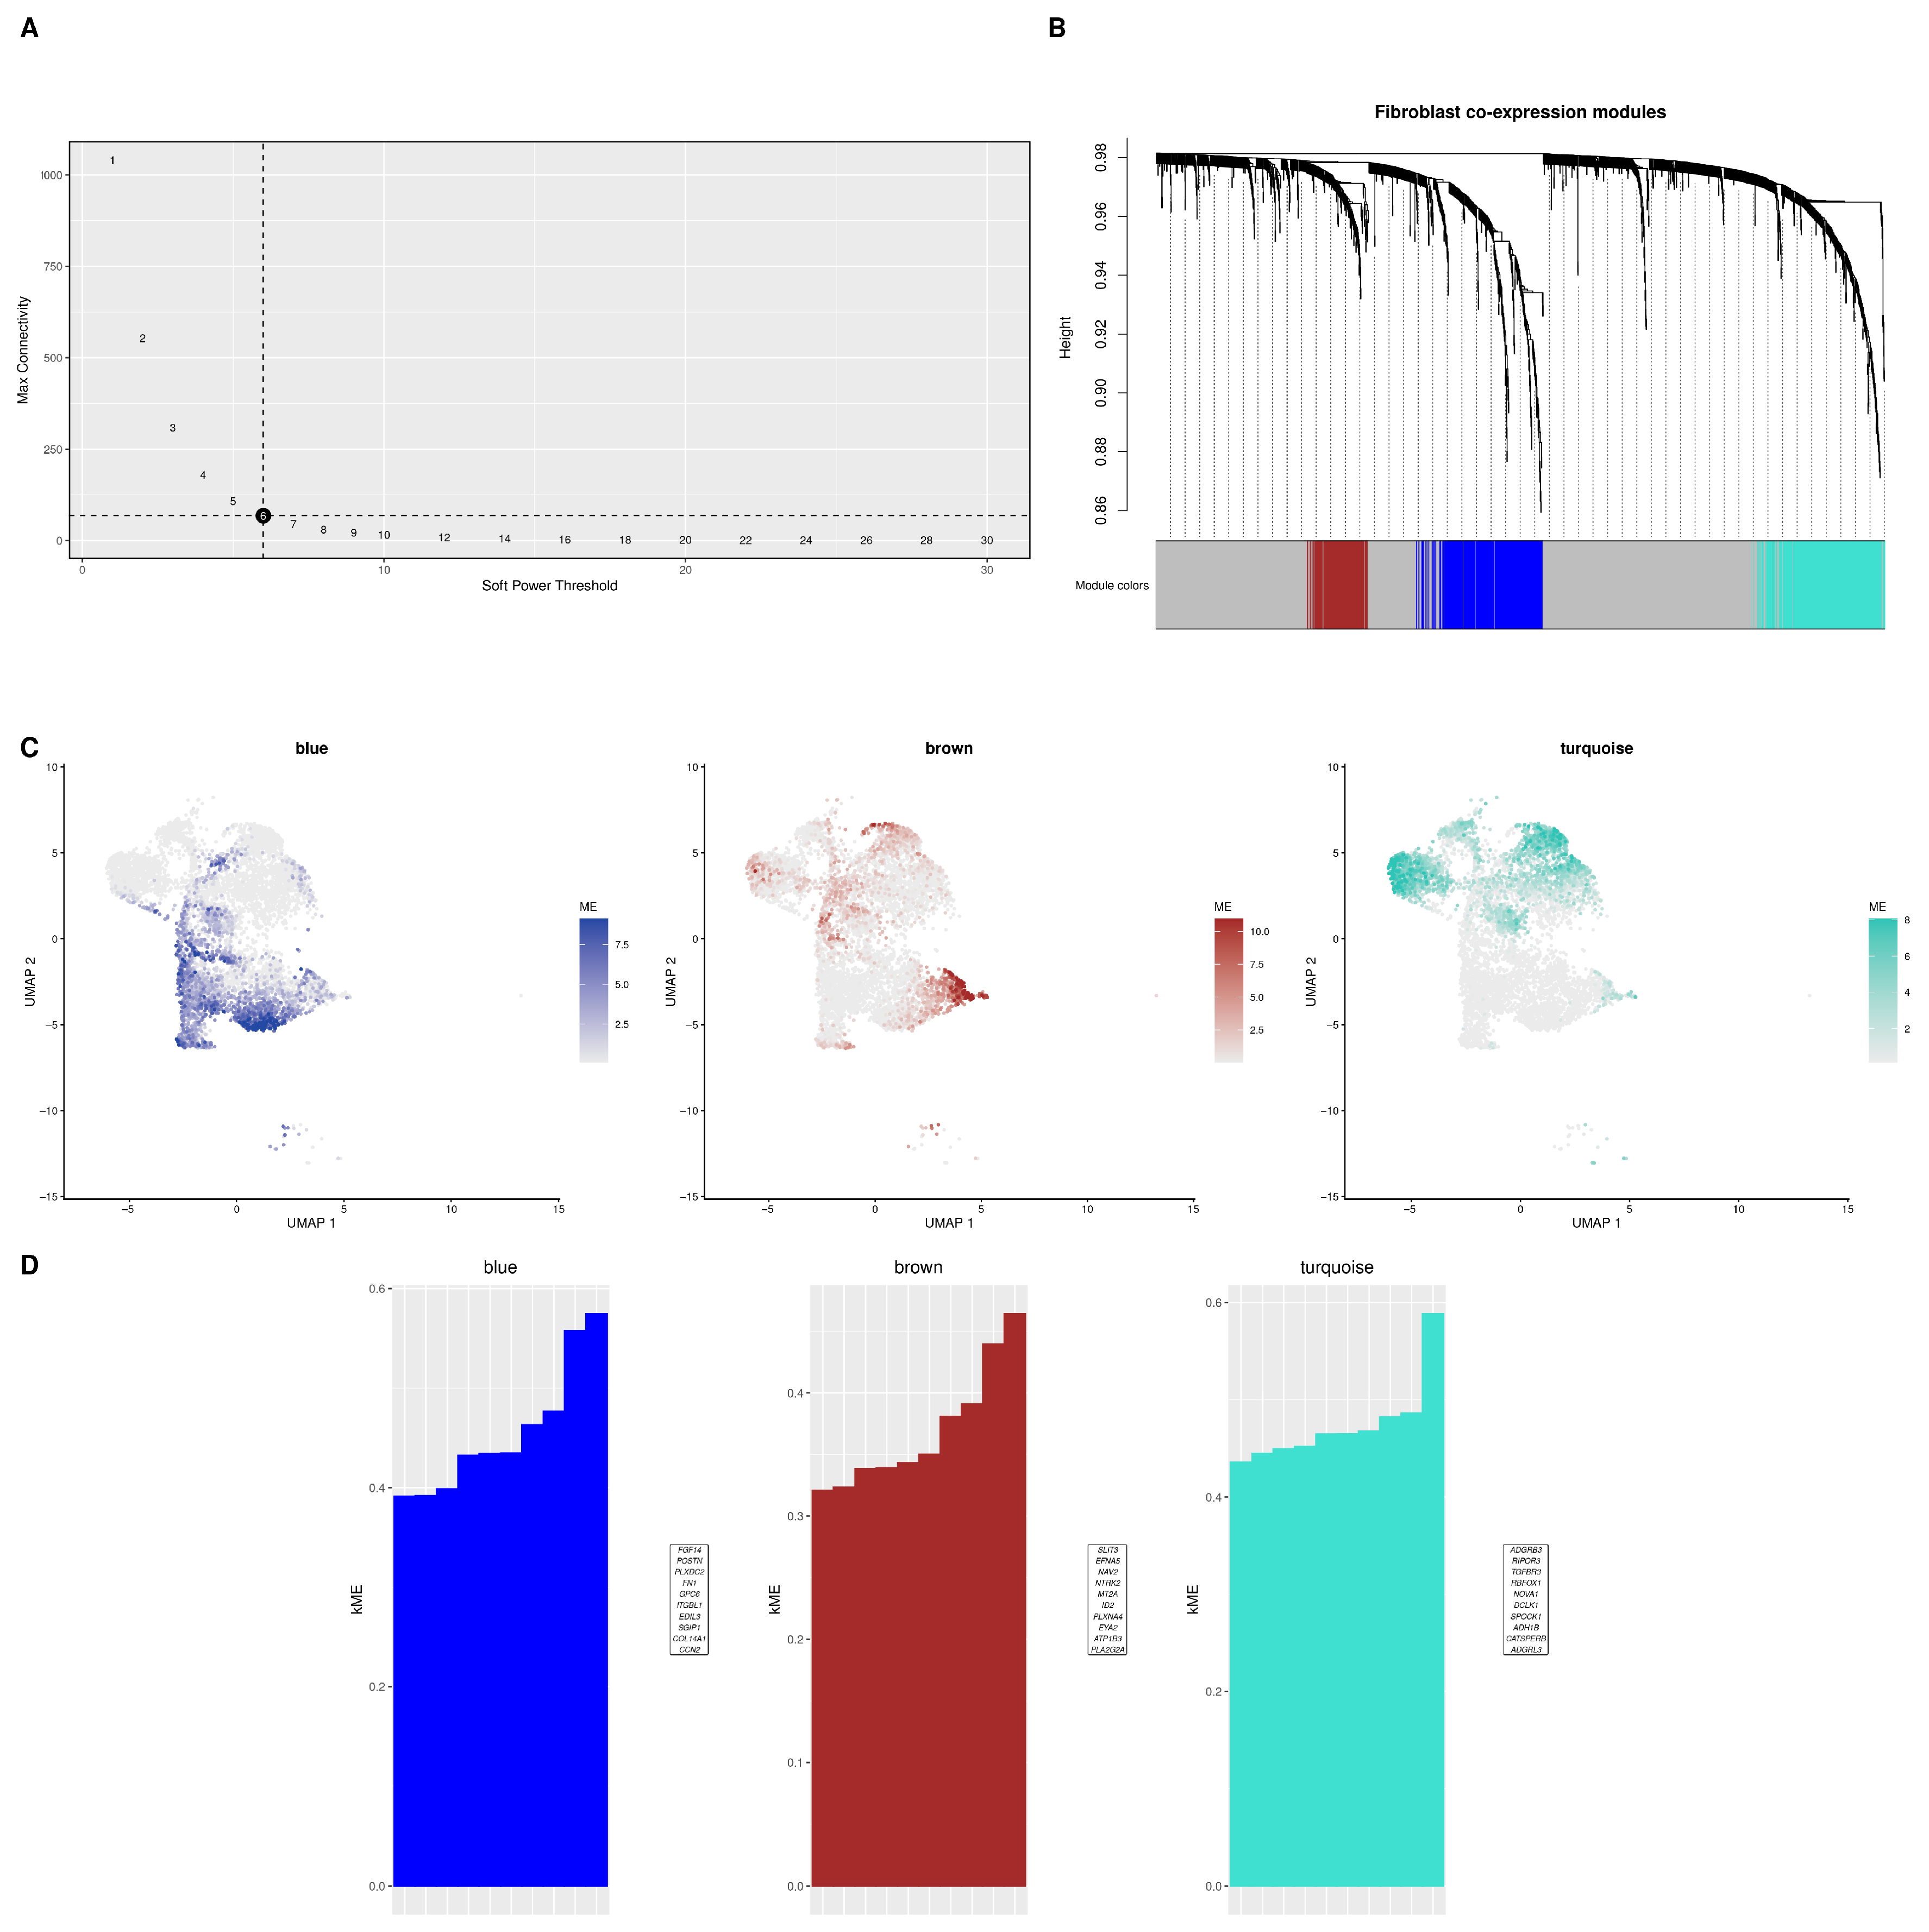
Three non-gray co-expression modules were identified from 6922 fibroblasts and named blue (303 genes), turquoise (329 genes), and brown (156 genes). The three modules showed distinct distribution patterns in the fibroblast UMAP space (Figure 3A–C).
Figure 3.
hdWGCNA identifies co-expression modules associated with HF in fibroblasts. (A) Soft threshold selection; numbers beside the points are the candidate soft-threshold powers, and the dashed lines mark the selected power (6) and its connectivity level. (B) Gene clustering tree and module partitioning; dotted vertical lines link each gene to its module color. (C) Distribution of module eigengenes for the blue, brown, and turquoise modules in the fibroblast UMAP. (D) Representative genes with high connectivity in each module.
Subject-level module-trait analysis showed that the blue module was positively associated with HF (r = 0.919, p = 2.44 × 10⁻⁵, FDR = 9.77 × 10⁻⁵). The turquoise module showed a negative trend that did not reach the corrected threshold (r = −0.621, p = 0.031, FDR = 0.062), and the brown module was not associated with HF (r = −0.014, FDR = 0.967). The blue module was designated Fibro-M1, and its 303 genes entered candidate screening (Figure 3D). Across 12 leave-one-subject-out analyses, the Fibro-M1/HF correlation ranged from 0.910 to 0.934, with all nominal p values below 0.001. Excluding subjects with fewer than 25, 50, or 100 retained fibroblasts yielded correlations of 0.918, 0.934, and 0.943, respectively (Figure S1D; Table S3).
3.3. Machine Learning Prioritizes Five Candidate Genes and Evaluates Their Cross-Cohort Evidence
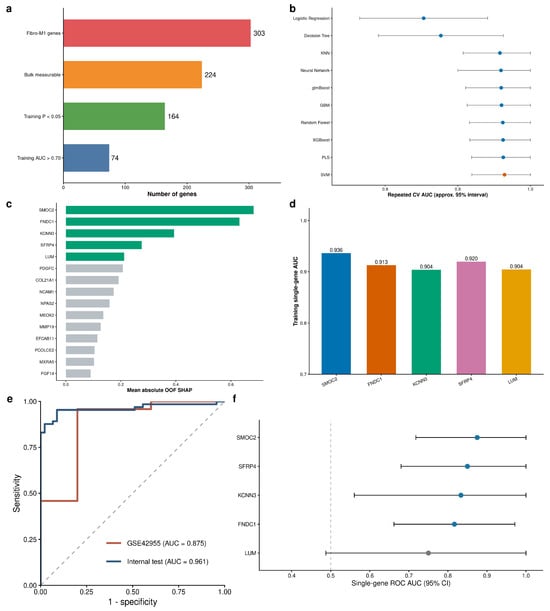
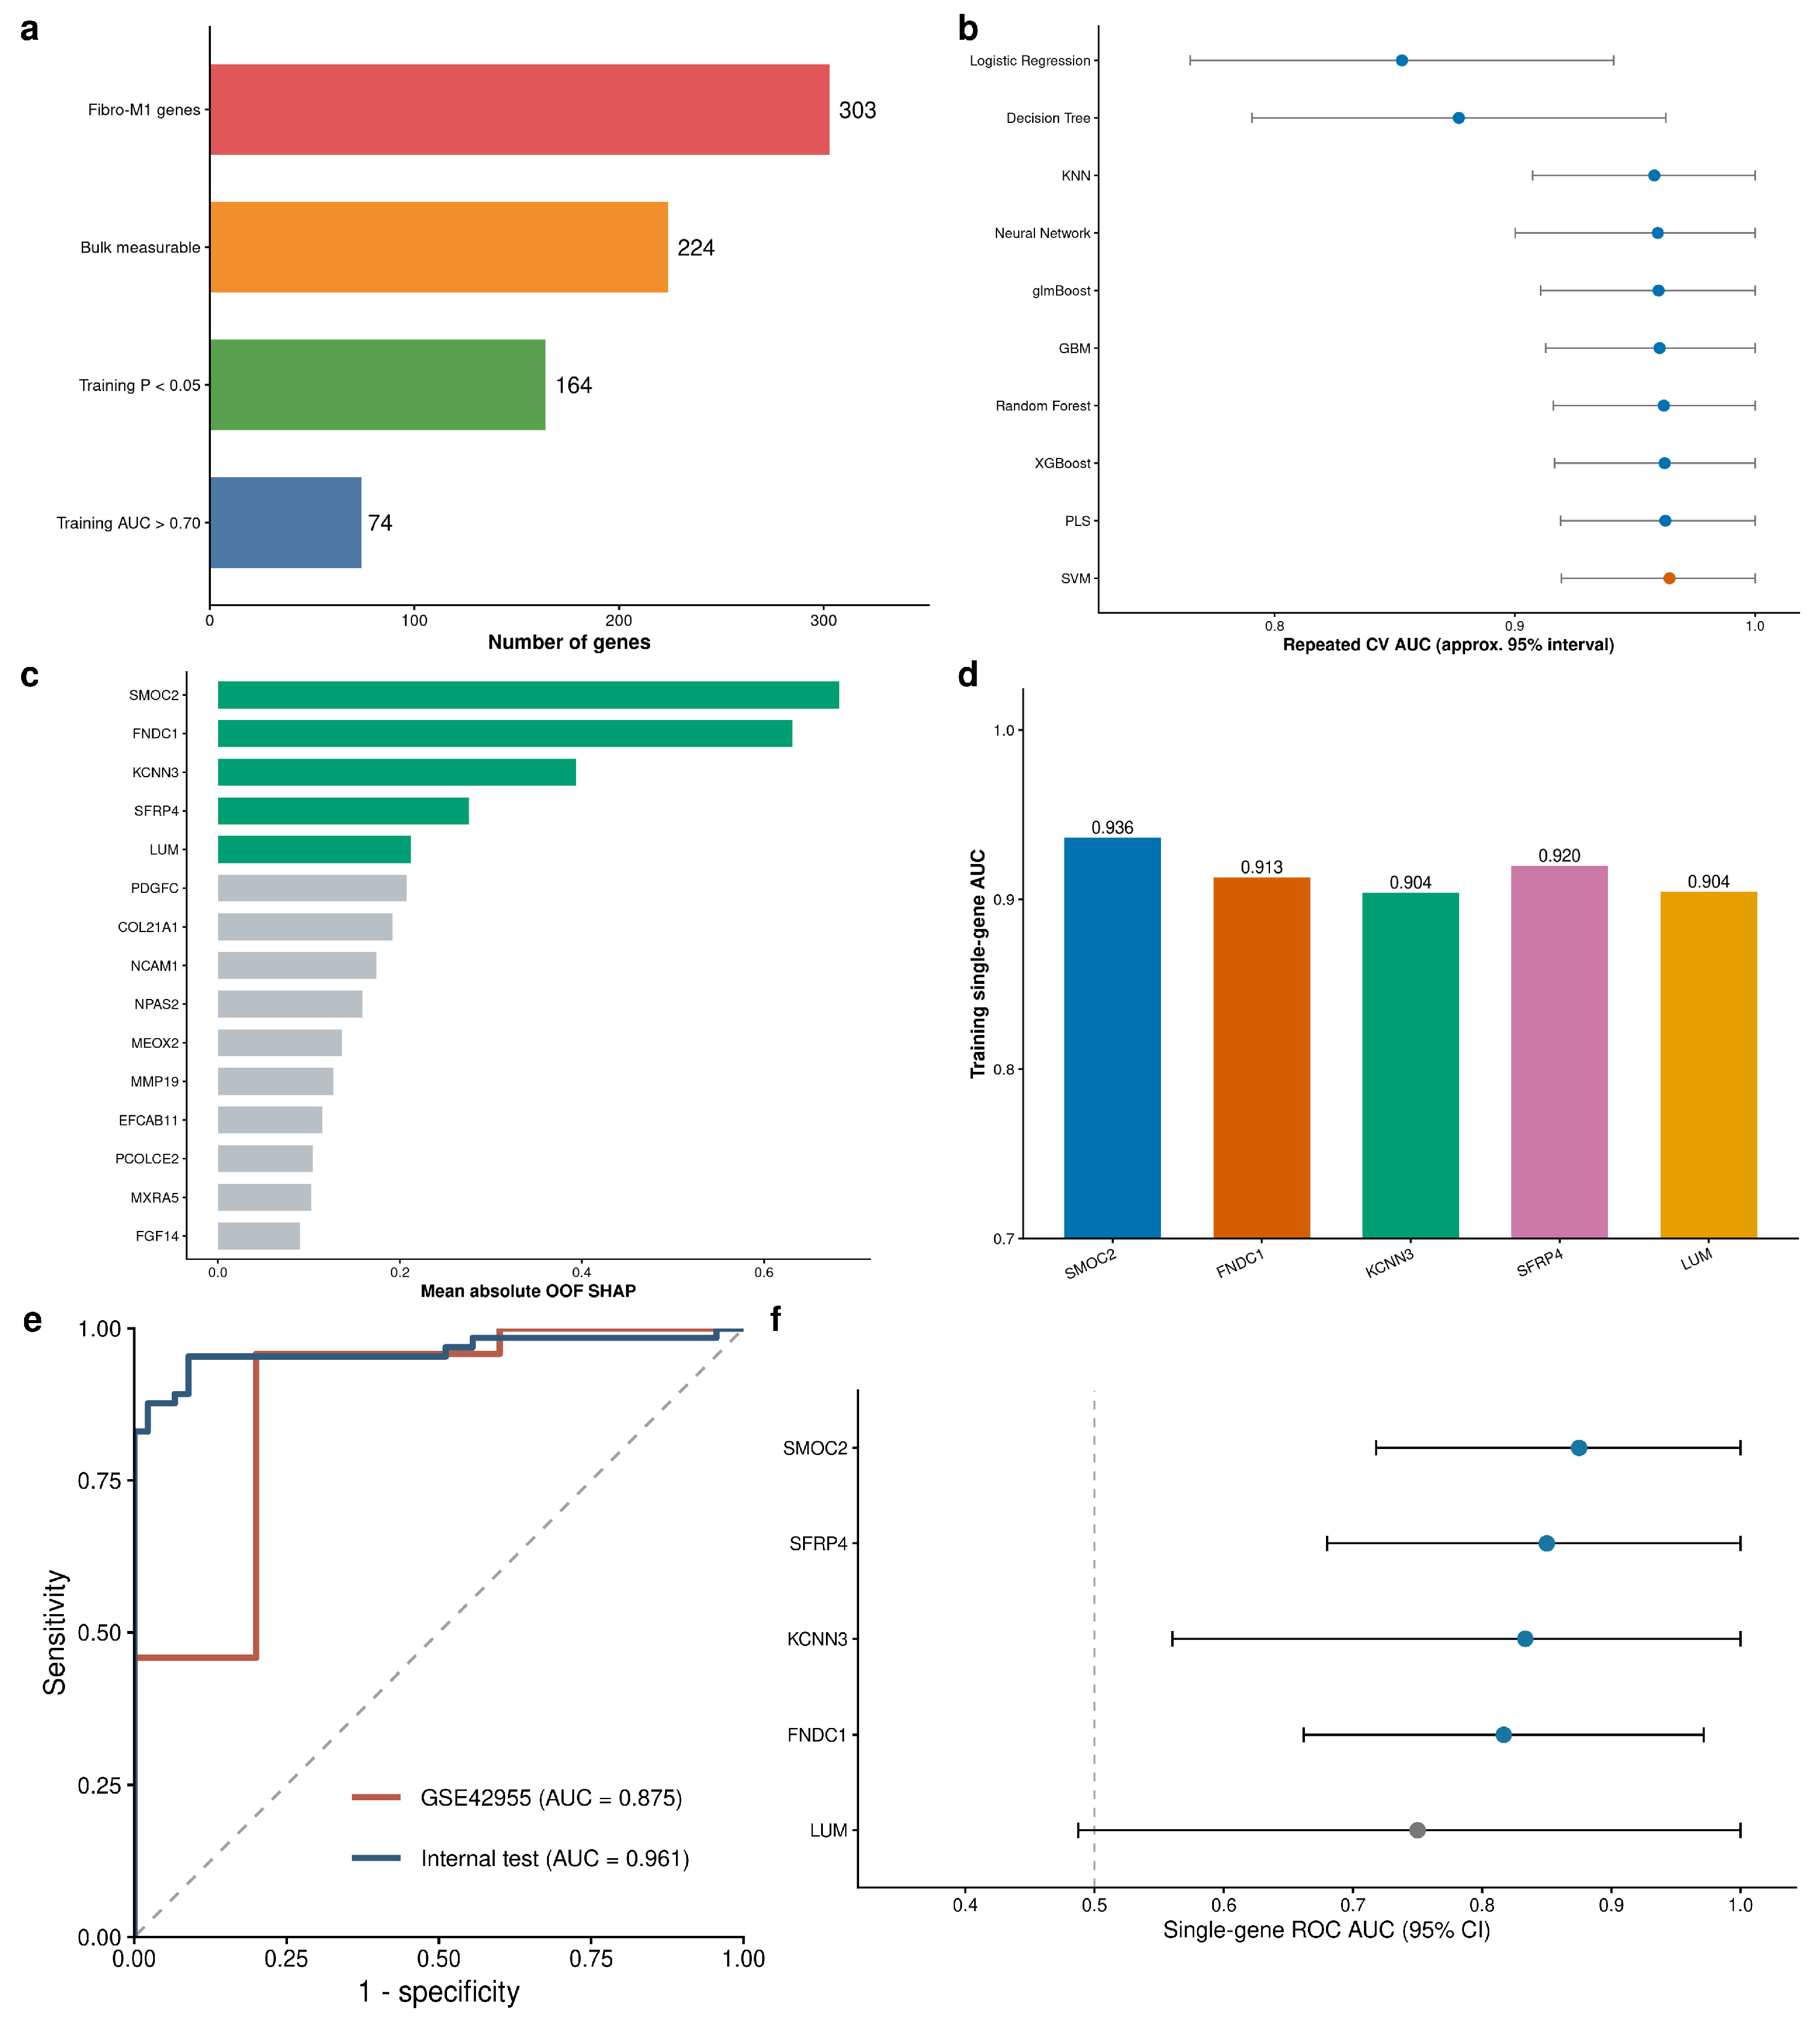
Of the 303 Fibro-M1 module genes, 224 were detected in all three bulk myocardial transcriptomic cohorts (GSE57338, GSE79962, and GSE26887). In the training set, 164 genes were differentially expressed between HF and Control (p < 0.05), and 74 of these had a single-gene AUC greater than 0.70 and entered machine learning analysis (Figure 4a).
Figure 4.
Fibro-M1 candidate gene prioritization and external evaluation. (a) Training-set candidate screening workflow. (b) Results of cross-validation performance of ten classifiers; the SVM selected for the final model is shown in orange and the remaining classifiers in blue. (c) Top 15 genes ranked by out-of-fold TreeSHAP; the five prioritized genes are shown in green and the remaining candidates in gray. (d) Training-set single-gene AUCs for the five prioritized genes. (e) ROC curves for the training-fitted internal test set and the locked five-gene SVM in GSE42955; the gray dashed diagonal indicates no discrimination (AUC = 0.5). (f) Single-gene ROC AUCs and 95% CIs for the five candidates in GSE42955; blue indicates FDR < 0.05 and gray indicates FDR ≥ 0.05; the gray dashed vertical line marks an AUC of 0.5. GSE42955 contained 24 HF samples and five controls.
Repeated five-fold cross-validation of the 10 classifiers showed that the radial basis kernel SVM had the highest mean validation AUC (AUC = 0.9644) (Figure 4b). Five-fold out-of-fold TreeSHAP analysis with XGBoost showed that SMOC2, FNDC1, KCNN3, SFRP4, and LUM had mean absolute SHAP values of 0.6826, 0.6313, 0.3933, 0.2757, and 0.2117, respectively (Figure 4c; Table S4a). Across 50 repeated analyses, SMOC2, FNDC1, KCNN3, and LUM ranked in the top five 100% of the time, and SFRP4 did so 98% of the time, indicating good stability of candidate gene ranking (Figure S2A). In the training set, the single-gene AUCs for the five genes were 0.9365, 0.9130, 0.9040, 0.9199, and 0.9045, respectively (Figure 4d).
In the leakage-sensitivity analysis, training-fitted batch offsets retained 74 candidate genes and recovered the same five-gene set, although the order changed to FNDC1, SMOC2, SFRP4, LUM, and KCNN3. The internal-test ROC AUC was 0.9614 (95% CI, 0.9238–0.9989), compared with 0.9545 (95% CI: 0.9126–0.9965) in the original analysis (paired DeLong p = 0.216); sample-level probabilities were highly correlated (Spearman rho = 0.986). Repeating preprocessing, screening, ranking, and fitting within a fully nested five-fold analysis yielded an AUC of 0.9397 (95% CI, 0.9072–0.9721) (Figure S3; Table S5). In GSE55296, SMOC2 and SFRP4 were increased in HF and yielded single-gene AUCs of 0.8423 (FDR = 0.0044) and 0.8731 (FDR = 0.0033), respectively, whereas FNDC1, KCNN3, and LUM were not significant after correction. Whole-cohort z-scoring produced an exploratory five-gene AUC of 0.8192, but fixed training-reference processing retained internal performance (AUC = 0.9621; 95% CI, 0.9250–0.9991) and did not maintain discrimination in GSE55296 (AUC = 0.4923; 95% CI, 0.2398–0.7448; paired DeLong p = 4.68 × 10⁻⁵) (Figure S4; Table S6). In the additional same-platform GSE42955 cohort, four candidates (SMOC2, SFRP4, KCNN3, and FNDC1) were replicated after multiple-testing correction, and the locked five-gene SVM yielded an AUC of 0.875 (95% CI, 0.662–1.000). GSE42955 included 24 HF samples and five controls (Figure 4e,f; Table S7).
Nested leave-one-cohort-out analysis yielded ROC AUCs of 0.876 (95% CI, 0.832–0.919), 0.959 (95% CI, 0.899–1.000), and 0.863 (95% CI, 0.711–1.000) when GSE57338, GSE79962, and GSE26887 were held out, respectively. The selected sets were SFRP4/SMOC2/SGIP1/NRK/PENK, SMOC2/KCNN3/FNDC1/NCAM1/LMO7, and SMOC2/FNDC1/LUM/KCNN3/SFRP4. Thus, the workflow retained disease-related discrimination across cohort rotations, but the selected features varied; only the GSE26887-held-out rotation recovered the complete reported five-gene set (Figure S2B; Table S4b).
3.4. Differences in Hallmark Pathways and Correlations Among Candidate Genes in the Bulk Myocardial Transcriptome
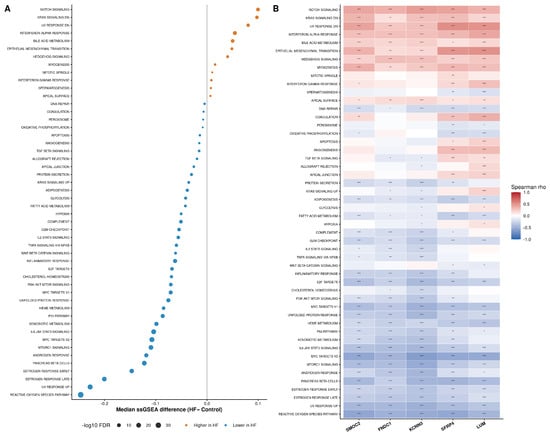
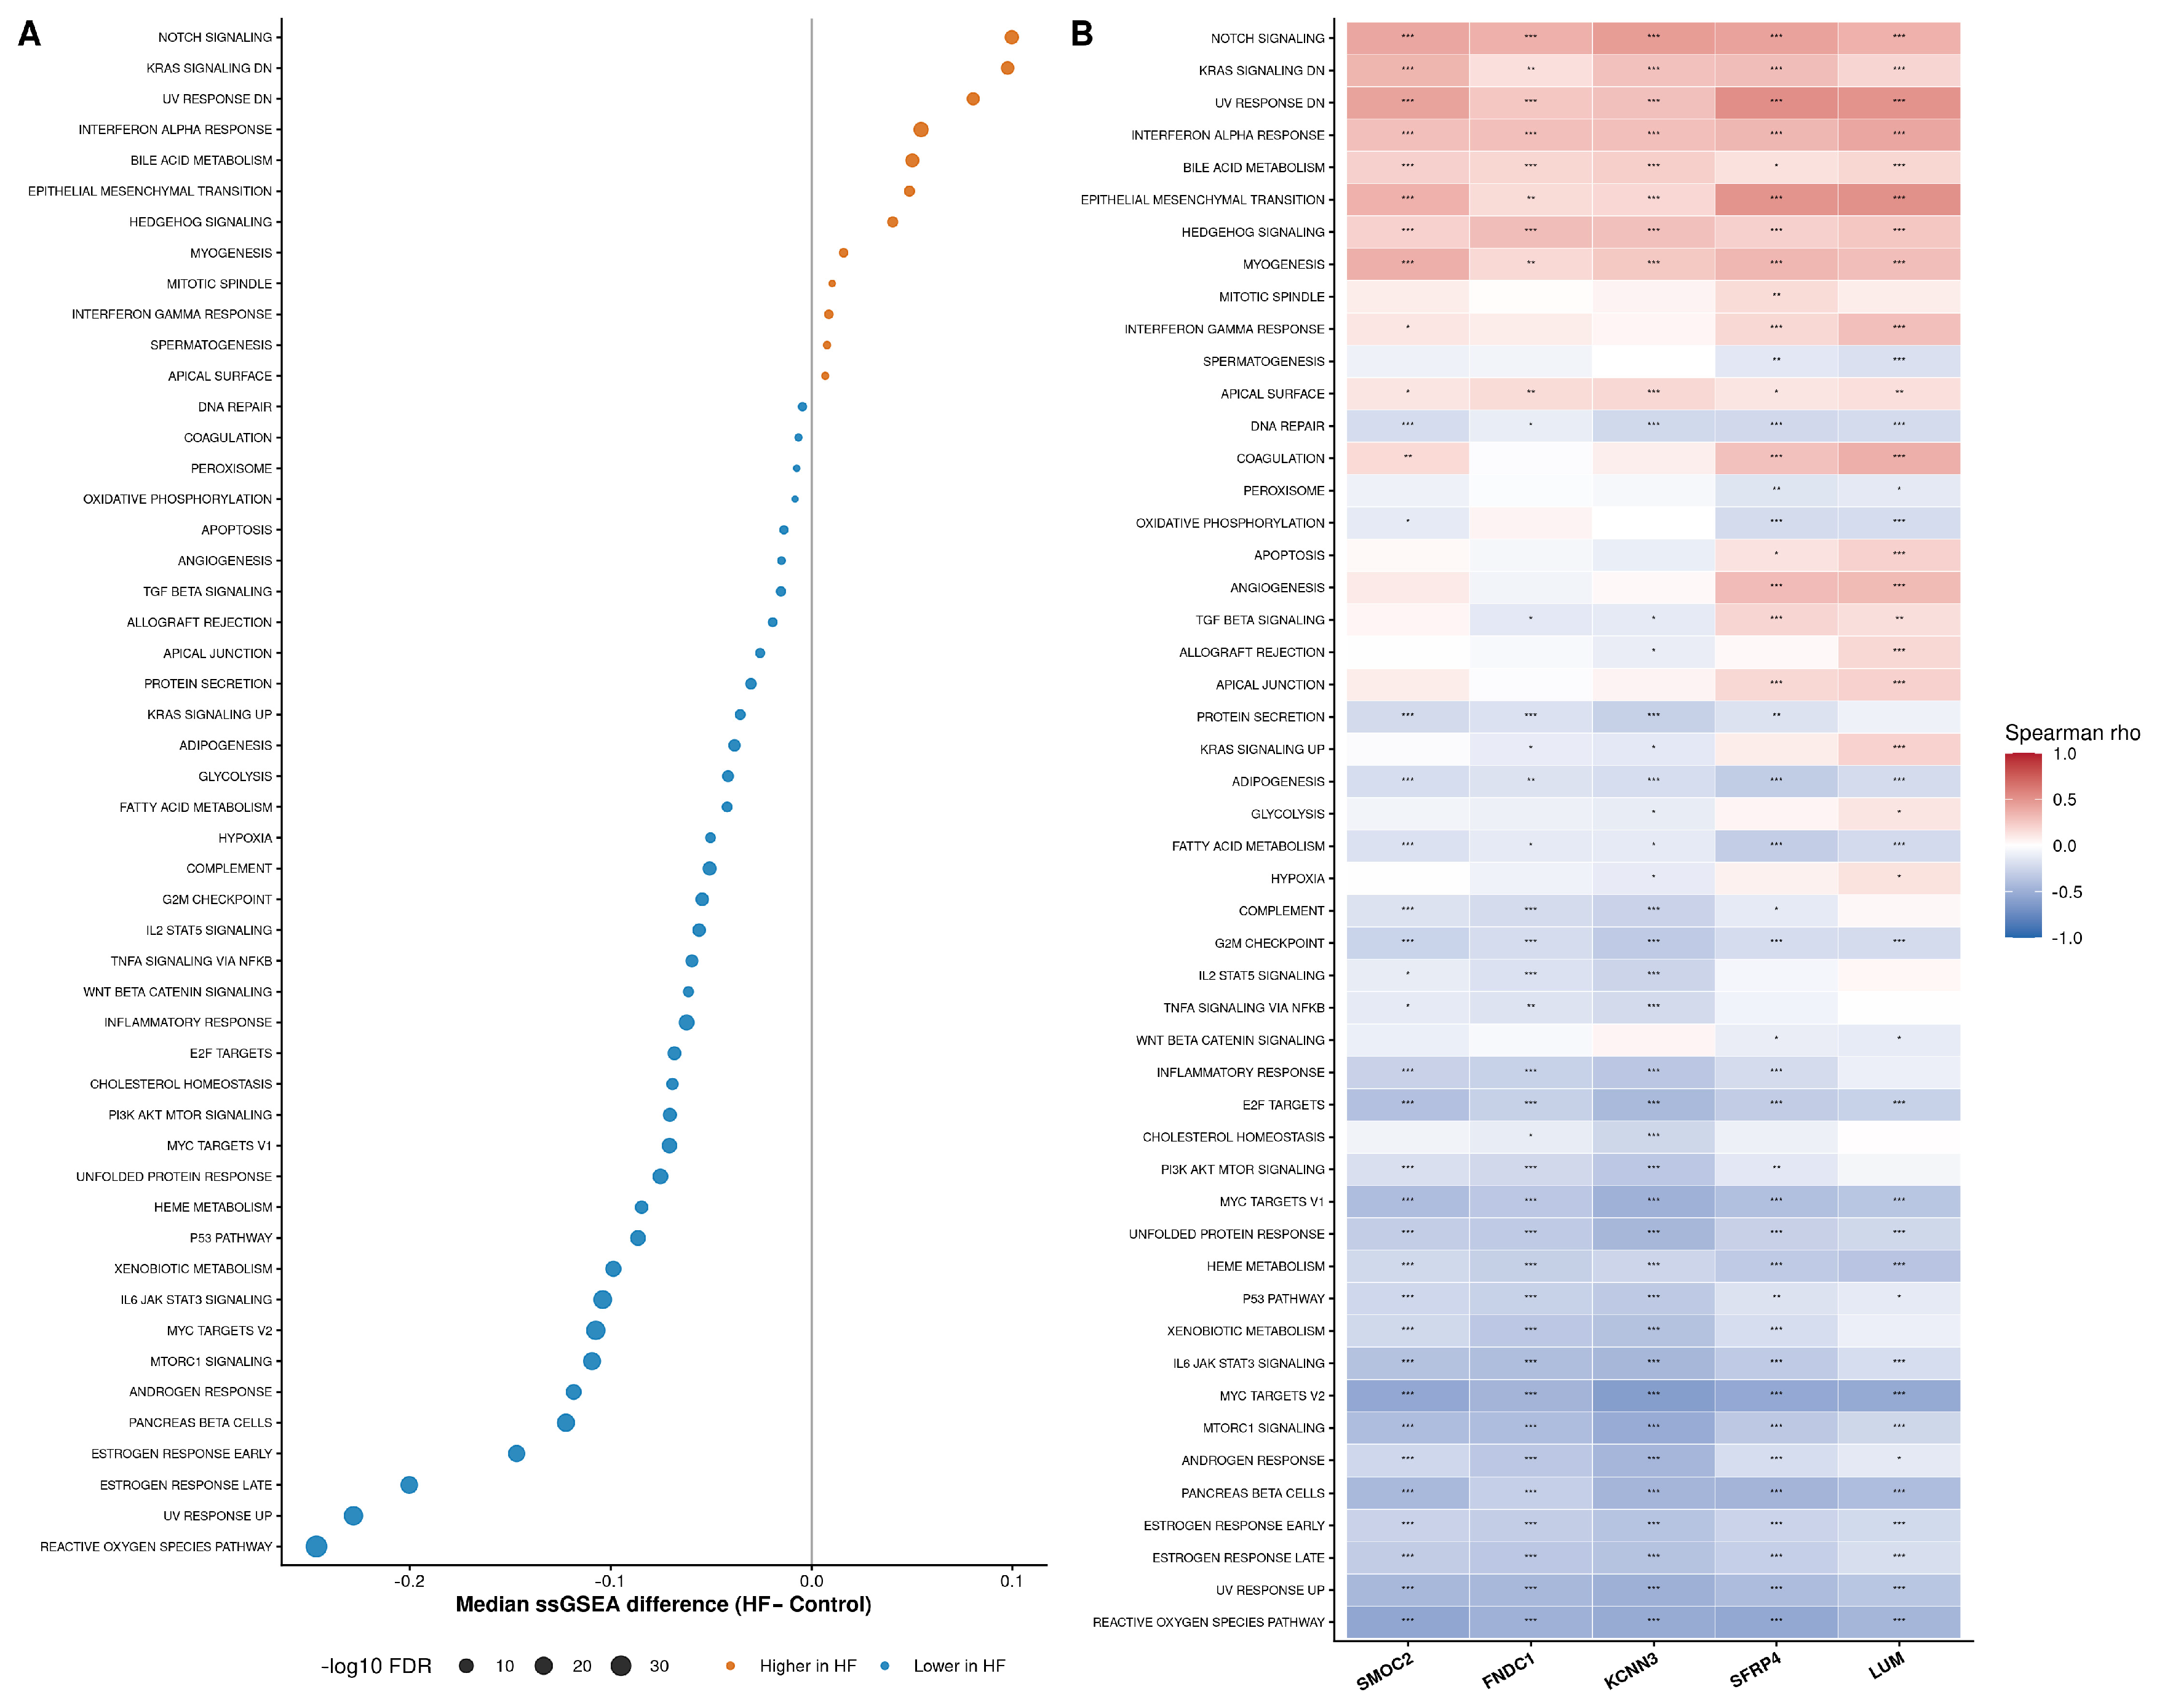
Among the 50 Hallmark pathways, 38 showed significant differences in ssGSEA scores between HF and Control (FDR < 0.05). Significantly lower scores in HF included the reactive oxygen species (ROS) pathway (median, 0.567 in Control versus 0.320 in HF; p = 1.10 × 10−36; FDR = 5.52 × 10⁻³⁵), IL6/JAK/STAT3 signaling (0.342 versus 0.238; p = 3.40 × 10⁻²³; FDR = 4.26 × 10⁻²²), mTORC1 signaling (0.351 versus 0.242; p = 2.62 × 10⁻²⁰; FDR = 2.19 × 10⁻¹⁹), MYC target V2 (0.313 versus 0.205; p = 1.07 × 10⁻²⁵; FDR = 1.79 × 10⁻²⁴), and the early and late estrogen-response gene sets (FDR = 1.26 × 10⁻¹⁶ and 1.14 × 10⁻¹⁸, respectively). Interferon-α response (0.177 versus 0.231; p = 4.90 × 10⁻¹²), Notch signaling (0.295 versus 0.395; p = 2.37 × 10⁻⁹), and the KRAS signaling-downregulated gene set (0.445 versus 0.543, p = 1.01 × 10⁻⁷) had higher scores in HF samples (Figure 5A; Table S8a).
Figure 5.
Correlation between the five candidate genes and Hallmark pathways. (A) Based on three bulk myocardial transcriptomic cohorts (GSE57338, GSE79962, and GSE26887). (B) Spearman correlation between the five candidate genes and Hallmark pathway scores. *, **, and *** indicate FDR < 0.05, <0.01, and <0.001, respectively, after Benjamini–Hochberg correction across all 250 tests.
Spearman correlation analysis between the expression of the five candidate genes and activity scores of the 50 pathways showed that SMOC2 had the strongest correlation with the ROS pathway (rho = −0.555, FDR_global = 5.16 × 10⁻²⁹), and FNDC1 was also highly correlated with the ROS pathway (rho = −0.484, FDR_global = 8.57 × 10⁻²²). KCNN3, SFRP4, and LUM all had the strongest correlations with the MYC target V2 pathway (rho = −0.610, −0.545, and −0.533, respectively; all FDR_global < 1 × 10⁻²⁷) (Figure 5B; Table S8b).
3.5. Predicted Network Effects of Virtual Knockout of Five Candidate Genes
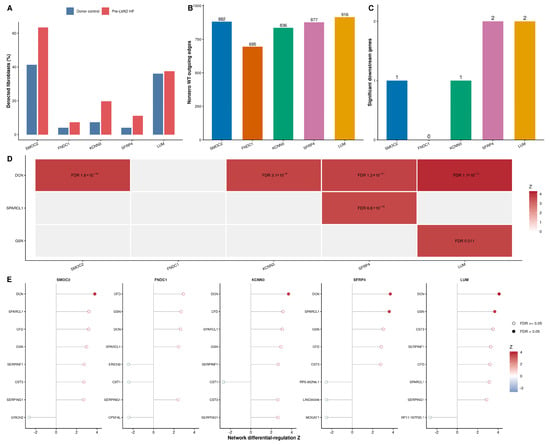
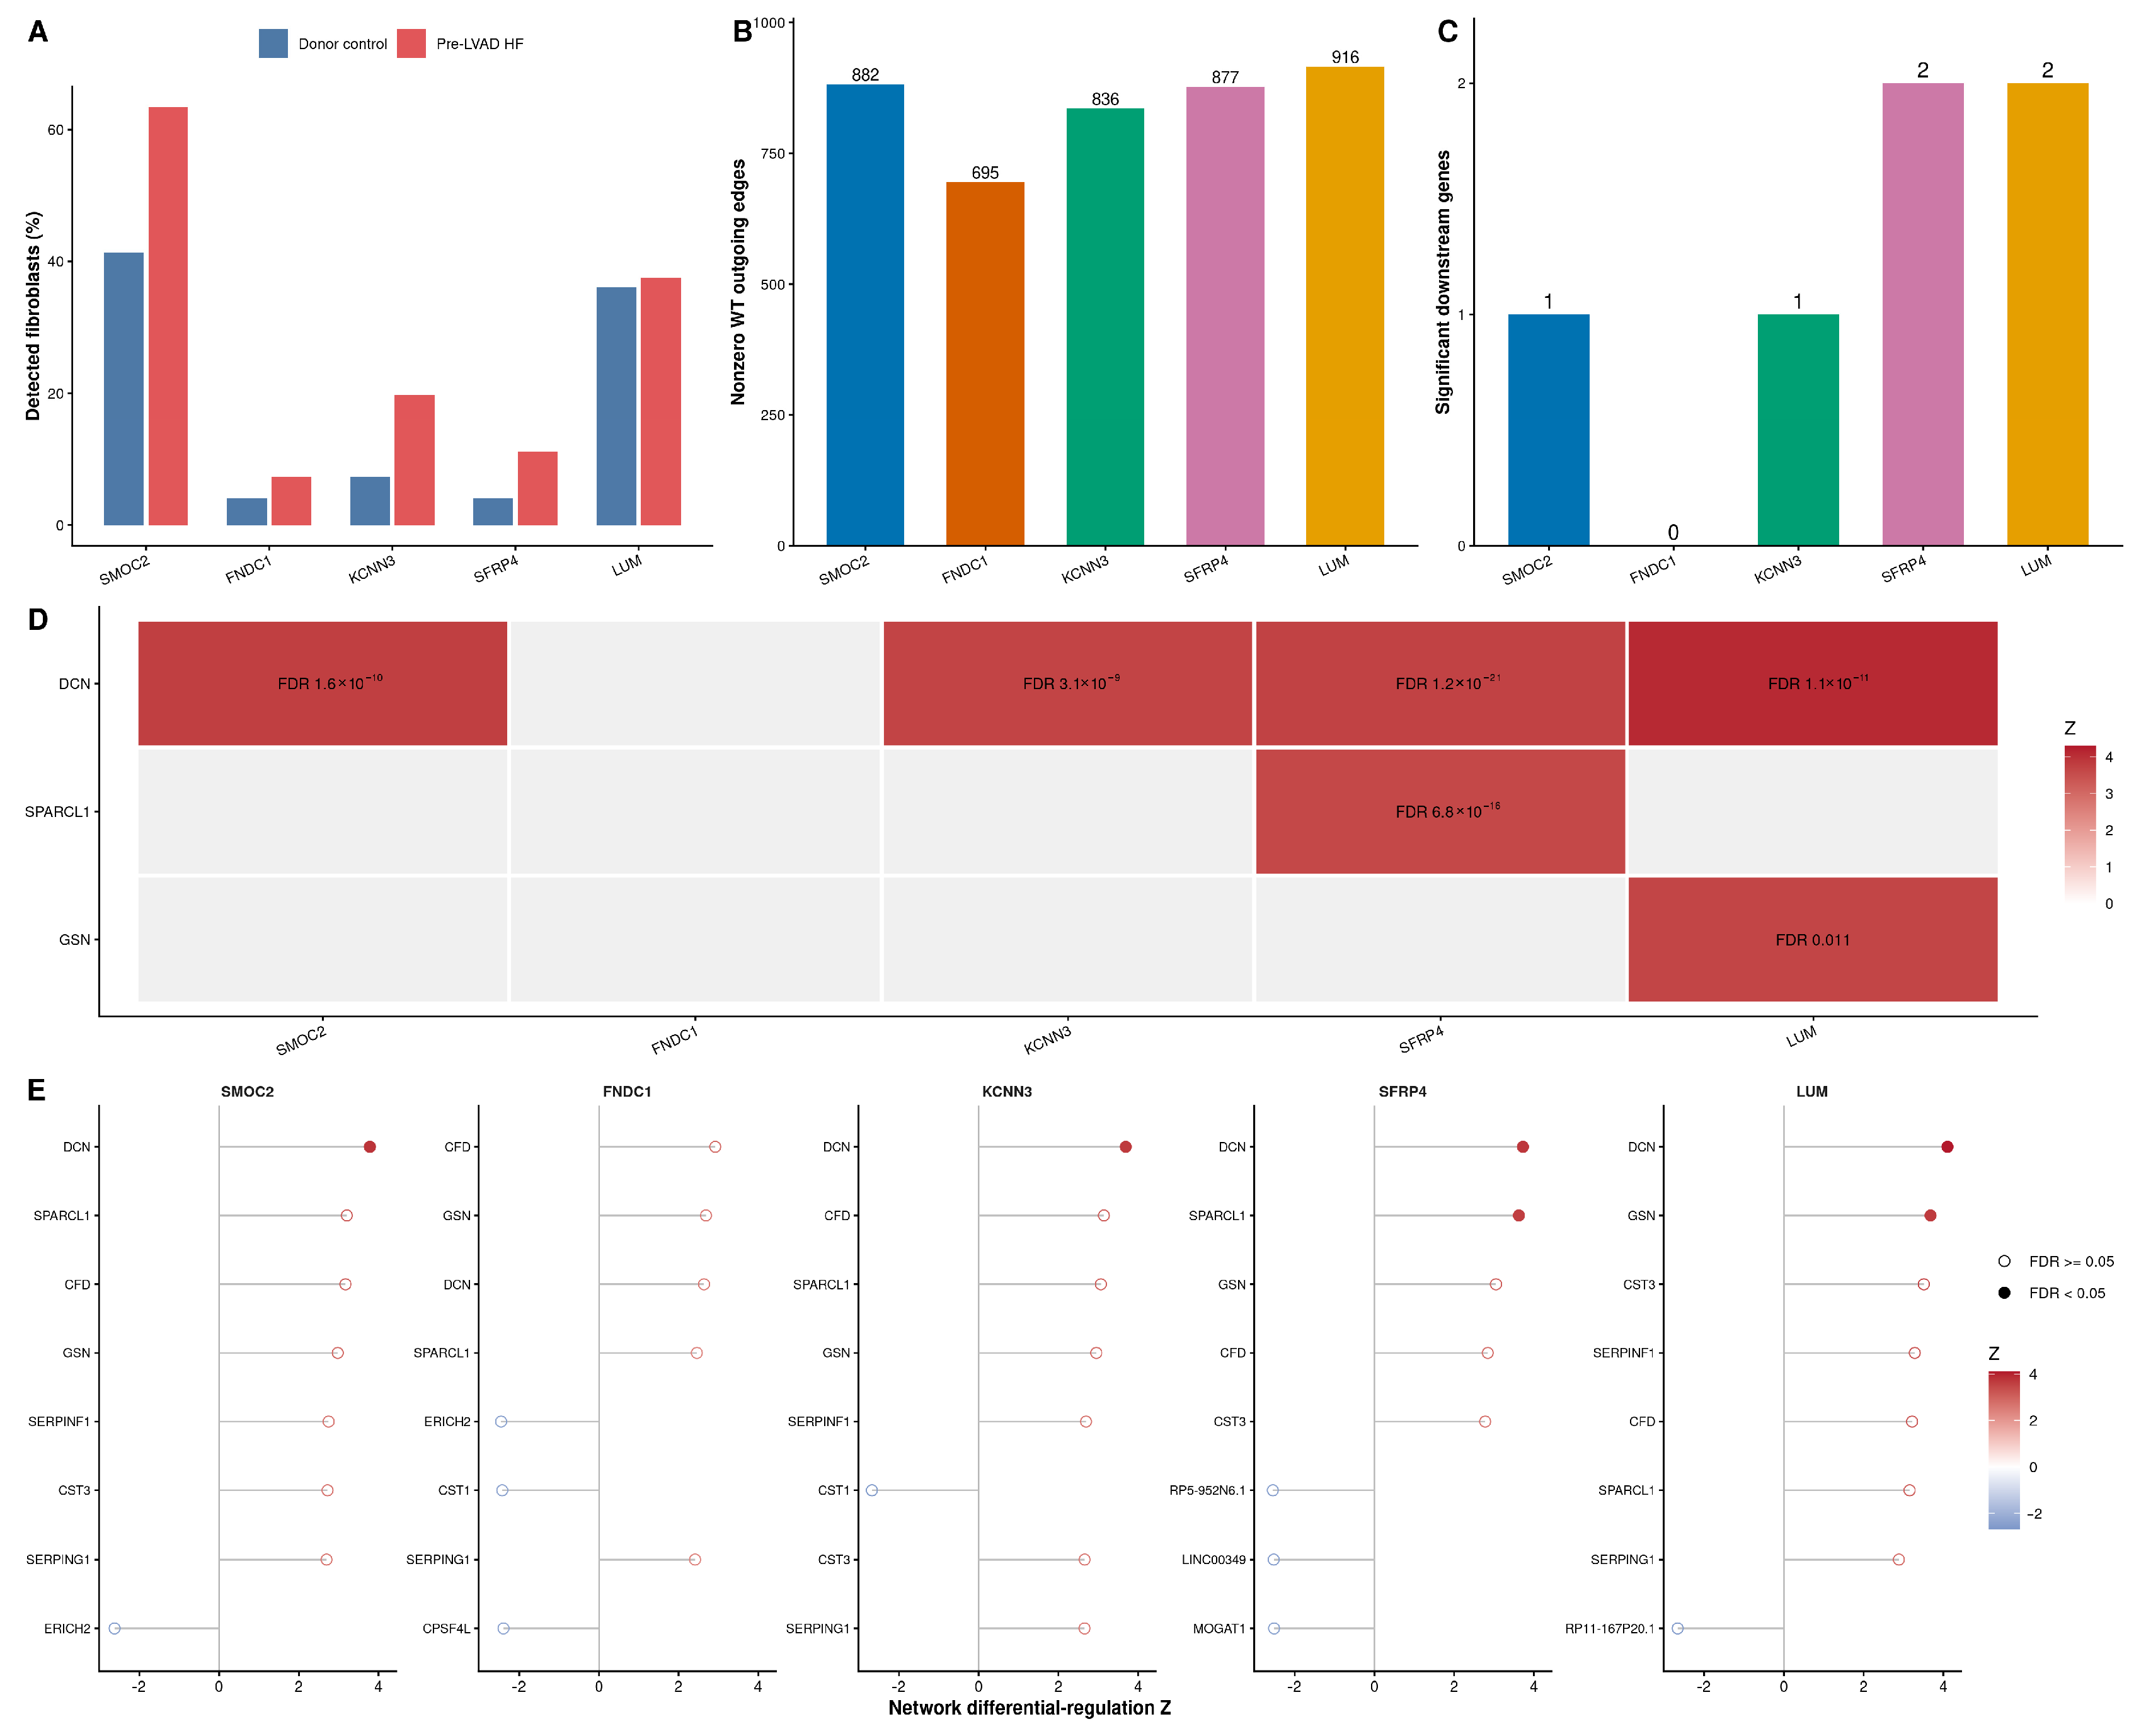
The principal GSE226314 shared fibroblast WT network contained 26,880 cells, including 15,700 fibroblasts from 14 non-failing donors and 11,180 fibroblasts from 13 patients with HF before LVAD implantation. The five candidates were detected in 5.45–50.52% of pooled cells and were all included among the fixed 1000 highly variable genes (Figure 6A). Their numbers of nonzero outgoing edges were 882, 695, 836, 877, and 916, respectively (Figure 6B). The pooled network served as the common WT reference for the five perturbation analyses.
Figure 6.
Virtual knockout analysis of the shared GSE226314 fibroblast network. (A) Detection rates of the five candidates in non-failing donor and pre-LVAD HF fibroblasts. (B) Number of nonzero outgoing edges in the pooled WT network. (C) Number of significant genes after each virtual knockout. (D) Network differential-regulation results for DCN, SPARCL1, and GSN. (E) Eight genes with the largest absolute network differential-regulation Z-scores after knockout. Solid dots indicate FDR < 0.05 and open dots indicate FDR ≥ 0.05. The shared WT network combined non-failing donor and pre-LVAD HF fibroblasts. Network differential-regulation scores represent predicted changes following computational gene knockout.
In the pooled network, virtual knockout of SMOC2, FNDC1, KCNN3, SFRP4, and LUM identified 1, 0, 1, 2, and 2 significant genes, respectively. DCN was significant after SMOC2, KCNN3, SFRP4, and LUM knockout; SPARCL1 was additionally significant after SFRP4 knockout, and GSN after LUM knockout. No gene reached FDR < 0.05 after FNDC1 knockout (Figure 6C–E; Figure S5; Table S9). In the stratified sensitivity analysis, DCN was significant after all five knockouts in the HF-only network and after SMOC2, FNDC1, KCNN3, and LUM knockout in the donor-only network, but not after SFRP4 knockout. Variation in the FNDC1 and SFRP4 results across network definitions indicates sensitivity to network construction (Table S10).
4. Discussion
This study integrated single-cell transcriptomics, fibroblast co-expression analysis, multi-cohort machine learning, and virtual knockout to prioritize five HF-associated genes: SMOC2, FNDC1, KCNN3, SFRP4, and LUM. The Fibro-M1 module linked cell-type-specific co-expression patterns to disease-associated signals in bulk myocardial cohorts. Repeated feature ranking identified a stable candidate set, whereas cross-cohort analyses revealed platform-dependent differences in model performance. Virtual knockout further distinguished the predicted network effects of the five candidates and identified recurrent involvement of DCN in extracellular-matrix-related network responses.
Machine learning analysis of the Fibro-M1 module identified five priority candidate genes: SMOC2, FNDC1, KCNN3, SFRP4, and LUM. Repeated cross-validation consistently prioritized the five candidates, although their relative contributions varied. Leave-one-cohort-out analysis further showed that the screening and modeling workflow retained some disease discrimination ability after switching training and test cohorts. SMOC2 was re-selected in all three rounds, suggesting relatively high cross-cohort stability. At the same time, the selected features differed across rounds, which may reflect transcriptomic heterogeneity from different HF etiologies, sample composition, and detection platforms. Collectively, the five genes represent candidates supported by complementary but quantitatively different lines of evidence.
Multi-omics studies have revealed molecular mechanisms of cardiac fibrosis and fibroblast subpopulation heterogeneity at the systems level [27]. Previous studies have reported associations between these genes and phenotypes related to cardiovascular remodeling, fibrosis, or HF in cardiovascular tissue, animal models, cell experiments, or public transcriptomes [28,29,30,31,32]. Animal and cell studies suggest that SMOC2 is involved in multi-organ fibrosis [28,33]. In myocardial infarction-related models, METTL3-mediated m6A modification may affect cardiac fibroblast phenotypes by stabilizing SMOC2 expression [34]; SMOC2 inhibition is associated with attenuated ILK/p38 signaling and reduced collagen deposition [29]; and SMOC2 may affect lipid peroxidation and post-infarction fibrosis through the LKB1/AMPKα/FOXO3 pathway [35]. Public data analyses have listed FNDC1 as a candidate HF feature [30,36,37]. KCNN3 encodes the small-conductance calcium-activated potassium channel SK3, whose expression in dilated cardiomyopathy ventricular tissue is associated with left ventricular function [31] and has also been listed as a candidate gene in ischemic HF transcriptomic studies [38]. SFRP4 has been reported to be associated with Wnt, oxidative stress, mitochondrial function, and TGF-β/SMAD3-related fibrosis [32,39,40]. Lumican, encoded by LUM, colocalizes with fibrillar collagen and is highly expressed in cardiomyopathy fibroblasts [32,41]; public data analyses also suggest that LUM is associated with HF-related phenotypes [36,42]. Together, these studies provide biological context for the candidate genes identified in our analysis and support their further investigation in HF fibroblasts.
Decorin (DCN), produced predominantly by fibroblasts, binds TGF-β and contributes to collagen-fibril organization [43]. Previous experimental studies linked increased DCN with reduced collagen-1 secretion under profibrotic stimulation and linked DCN deficiency with greater collagen deposition, including in right-ventricular pressure overload. In the present study, DCN recurred across several virtual knockouts and network definitions, which raises the hypothesis that the predicted perturbations converge near a DCN-related extracellular-matrix program. scTenifoldKnk models changes in a co-expression-derived regulatory manifold after computational edge removal. The recurrent DCN signal therefore identifies a network-level association that can guide subsequent perturbation experiments.
The contrast between FNDC1’s high TreeSHAP rank and its pooled virtual-knockout result shows that classification contribution and network perturbation capture different properties of a candidate gene. FNDC1 had no significant pooled-network result (minimum FDR = 0.078), but DCN was significant after FNDC1 knockout in both reduced stratified networks. SFRP4 showed the opposite form of network sensitivity, with a pooled result and an HF-only result but no significant donor-only DCN effect. The context-dependent FNDC1 and SFRP4 results further indicate that predicted network effects vary with network composition. These findings distinguish the candidates by both predictive contribution and network response.
Hallmark pathway analysis was based on 368 samples from three combined bulk myocardial transcriptomic cohorts. In HF samples, scores for ROS, IL6/JAK/STAT3, mTORC1, and MYC target V2 gene sets were reduced, whereas Notch signaling and interferon-α response scores were elevated. SMOC2 and FNDC1 showed stronger correlations with the ROS pathway score, and KCNN3, SFRP4, and LUM showed stronger correlations with the MYC target V2 score. These ssGSEA associations describe pathway variation at the myocardial tissue level and provide functional context for the candidate genes across the bulk cohorts.
The main contribution of this study is a cell-type-informed framework that connects subject-level fibroblast modules with reproducible tissue-level associations, cross-cohort candidate prioritization, and predicted network responses. Earlier studies have linked several candidates to cardiac remodeling, fibrosis, or HF-related phenotypes. Here, a subject-level fibroblast module defined the candidate space, bulk cohorts assessed reproducible tissue-level disease association and classification contribution, independent cohorts tested expression and model transportability, and fibroblast networks provided computational perturbation hypotheses. Each evidence layer addresses a distinct aspect of candidate assessment: fibroblast modules define the disease-relevant search space, bulk cohorts evaluate reproducibility and predictive contribution, and single-cell networks characterize potential perturbation responses. Their integration provides a structured basis for selecting genes for subsequent functional studies.
This study has four main limitations. First, Fibro-M1 was derived from 6 patients with HF and 6 controls, and clinical covariates such as age, sex, and HF etiology were unavailable in GEO; larger subject-level single-cell cohorts are needed to establish module generalizability. Second, cross-cohort performance varied with preprocessing strategy and platform, and external validation was inconsistent between the two independent cohorts, GSE55296 and GSE42955. GSE42955 was a small cohort of 24 HF samples and five controls, and its limited sample size reduced the precision of its performance estimate. Third, bulk myocardial associations cannot be assigned exclusively to fibroblasts, and scTenifoldKnk results cannot establish direct or causal regulation. Cell-type-resolved datasets and experimental perturbation will be required to determine the biological roles of the prioritized candidates and the relevance of the DCN-related network signal. Fourth, three aspects of the analysis may make the reported performance appear better than it would be in new samples. ComBat parameters were estimated on all 368 samples before the 258/110 split, the classifier type and the XGBoost hyperparameters used for gene ranking were fixed before cross-validation, and label-free standardization in the leave-one-cohort-out analysis used the expression distribution of the held-out cohort without disease labels. No external-cohort sample informed any of these choices.
5. Conclusions
By integrating subject-level fibroblast co-expression analysis, multi-cohort transcriptomics, machine-learning prioritization, and virtual network perturbation, this study identified SMOC2, FNDC1, KCNN3, SFRP4, and LUM as HF-associated candidate genes. Cross-cohort analyses revealed both reproducible candidate-level signals and platform-dependent model performance. The recurrent DCN signal suggests a shared extracellular-matrix network response that deserves further study.
Supplementary Materials
The following supporting information can be downloaded at: https://www.mdpi.com/article/10.3390/metabo16110900/s1, Figure S1, single-cell quality control, clustering stability, and Fibro-M1 subject-level sensitivity analyses; Figure S2, candidate-ranking stability and nested leave-one-cohort-out analysis; Figure S3, training-fitted preprocessing and fully nested sensitivity analyses; Figure S4, GSE55296 frozen-reference sensitivity analysis; Figure S5, complete volcano plots of virtual knockout for the five candidate genes; Table S1, screening results for the Fibro-M1 module genes in the training set; Table S2, software versions and random seeds; Table S3, GSE288222 subject characteristics, fibroblast counts, and module sensitivity; Table S4, TreeSHAP stability and nested leave-one-cohort-out results; Table S5, discovery-cohort composition and leakage-sensitivity analyses; Table S6, GSE55296 candidate replication and frozen-reference sensitivity; Table S7, internal and external model evaluation; Table S8, Hallmark ssGSEA results; Table S9, virtual knockout results for the five candidate genes; Table S10, donor-only and HF-only network sensitivity results; Code S1: Analysis scripts for single-cell processing, sensitivity analyses, and virtual knockout.
Author Contributions
Conceptualization, X.L. and Y.Z.; Methodology, L.L.; Software, L.L.; Validation, L.L.; Formal Analysis, L.L.; Investigation, L.L.; Data Curation, L.L.; Writing—Original Draft Preparation, X.L.; Writing—Review and Editing, L.L. and Y.Z.; Visualization, X.L. and L.L.; Supervision, Y.Z.; Project Administration, X.L. and Y.Z.; Funding Acquisition, Y.Z. All authors have read and agreed to the published version of the manuscript.
Funding
This research was funded by the National Natural Science Foundation of China, grant number 82305092, and the Scientific Research Program of Furong Laboratory, grant number 2025PT5018.
Institutional Review Board Statement
Not applicable.
Informed Consent Statement
Not applicable.
Data Availability Statement
All datasets analyzed in this study are publicly available in GEO under accession numbers GSE288222, GSE226314, GSE57338, GSE79962, GSE26887, GSE55296, and GSE42955. Processed analysis tables and analysis scripts supporting the results are provided in the Supplementary Materials (Tables S1–S10, Code S1).
Acknowledgments
During the preparation of this manuscript, the authors used DeepSeek-V4.1-Flash to assist with language polishing. The authors have reviewed and edited the content and take full responsibility for the content of the publication.
Conflicts of Interest
The authors declare no conflicts of interest.
Abbreviations
The following abbreviations are used in this manuscript:
| DCM | dilated cardiomyopathy |
| DCN | decorin |
| ECM | extracellular matrix |
| FDR | false discovery rate |
| GEO | Gene Expression Omnibus |
| hdWGCNA | high-dimensional weighted gene co-expression network analysis |
| HF | heart failure |
| HFpEF | heart failure with preserved ejection fraction |
| HFrEF | heart failure with reduced ejection fraction |
| ICM | ischemic cardiomyopathy |
| LVAD | left ventricular assist device |
| MSigDB | Molecular Signatures Database |
| SHAP | SHapley Additive exPlanations |
| ssGSEA | single-sample gene set enrichment analysis |
| SVM | support vector machine |
| UMAP | uniform manifold approximation and projection |
| VST | variance stabilizing transformation |
| WT | wild type |
| XGBoost | extreme gradient boosting |
References
- Savarese, G.; Becher, P.M.; Lund, L.H.; Seferovic, P.; Rosano, G.M.C.; Coats, A.J.S. Global burden of heart failure: A comprehensive and updated review of epidemiology. Cardiovasc. Res. 2023, 118, 3272–3287, Correction in Cardiovasc. Res. 2023, 119, 1453. https://doi.org/10.1093/cvr/cvad026. [Google Scholar] [CrossRef] [Scilit] [PubMed]
- Greene, S.J.; Xu, H.; Chiswell, K.; Felker, G.M.; Lewsey, S.C.; Divanji, P.H.; Goertz, H.-P.; Heitner, S.B.; Shreay, S.; Pandey, A.; et al. One-Year Outcomes in Patients Hospitalized for Heart Failure With Reduced Ejection Fraction Prescribed Quadruple Medical Therapy at Discharge. JAMA Cardiol. 2026, 11, 293–297. [Google Scholar] [CrossRef] [Scilit] [PubMed]
- Tanaka, A.; Node, K. Disease modifying therapies in heart failure: An update. QJM Int. J. Med. 2025, 118, 629–630. [Google Scholar] [CrossRef] [Scilit] [PubMed]
- Dutta, S.; Chen, S.; Ahmad, W.; Huang, W.; Liang, J.; Wang, Y. Targeting Cardiac Fibroblast Plasticity for Antifibrotic and Regenerative Therapy in Heart Failure. Cells 2026, 15, 112. [Google Scholar] [CrossRef] [Scilit] [PubMed]
- Chimenti, I.; Pagano, F.; Cozzolino, C.; Icolaro, F.; Floris, E.; Picchio, V. The Role of Cardiac Fibroblast Heterogeneity in Myocardial Fibrosis and Its Novel Therapeutic Potential. Int. J. Mol. Sci. 2025, 26, 5882. [Google Scholar] [CrossRef] [Scilit] [PubMed]
- Youness, M.; Ekhteraei-Tousi, S.; Nagaraju, C.K.; Puertas, R.D.; Thienpont, B.; Rega, F.; Sipido, K.R.; Roderick, H.L. Location and aetiology are determinants of fibroblast activation and heterogeneity in the failing human heart. Genome Med. 2025, 17, 155. [Google Scholar] [CrossRef] [Scilit] [PubMed]
- Komuro, J.; Hashimoto, H.; Katsuki, T.; Kusumoto, D.; Katoh, M.; Ko, T.; Ito, M.; Katagiri, M.; Kubota, M.; Yamada, S.; et al. Heart failure-specific cardiac fibroblasts contribute to cardiac dysfunction via the MYC-CXCL1-CXCR2 axis. Nat. Cardiovasc. Res. 2025, 4, 1135–1151. [Google Scholar] [CrossRef] [Scilit] [PubMed]
- Patrick, R.; Janbandhu, V.; Tallapragada, V.; Tan, S.S.M.; McKinna, E.E.; Contreras, O.; Ghazanfar, S.; Humphreys, D.T.; Murray, N.J.; Tran, Y.T.H.; et al. Integration mapping of cardiac fibroblast single-cell transcriptomes elucidates cellular principles of fibrosis in diverse pathologies. Sci. Adv. 2024, 10, eadk8501. [Google Scholar] [CrossRef] [Scilit] [PubMed]
- Cheng, C.; Chen, W.; Jin, H.; Chen, X. A Review of Single-Cell RNA-Seq Annotation, Integration, and Cell-Cell Communication. Cells 2023, 12, 1970. [Google Scholar] [CrossRef] [Scilit] [PubMed]
- Wang, X.; Mu, X.; Li, X.; Yang, C.; Cai, Y.; Liu, C.; Liu, Z.; He, Z. Construction of a deep learning model and identification of the pivotal characteristics of FGF7- and MGST1-positive fibroblasts in heart failure post-myocardial infarction. Int. J. Biol. Macromol. 2025, 310, 143171. [Google Scholar] [CrossRef] [Scilit] [PubMed]
- Zhu, Y.; Chen, B.; Zu, Y. Identifying OGN as a Biomarker Covering Multiple Pathogenic Pathways for Diagnosing Heart Failure: From Machine Learning to Mechanism Interpretation. Biomolecules 2024, 14, 179. [Google Scholar] [CrossRef] [Scilit] [PubMed]
- Yu, G.; Kan, T.; Shen, J.; Zhang, Y.; Wang, C.; Guo, Z.; Chen, F. Integrated Single-Cell and Machine Learning Analysis Identifies Fibroblast-Associated Hub Genes and Potential Therapeutics in Ischemic Cardiomyopathy. Chem. Biol. Drug Des. 2026, 107, e70329. [Google Scholar] [CrossRef] [Scilit] [PubMed]
- Liu, T.; Qiao, H.; Ren, L.; Ye, X.; Zou, Q.; Zhang, Y. Deciphering cancer therapy resistance via patient-level single-cell transcriptomics with CellResDB. Commun. Biol. 2025, 8, 1049. [Google Scholar] [CrossRef] [Scilit] [PubMed]
- McGinnis, C.S.; Murrow, L.M.; Gartner, Z.J. DoubletFinder: Doublet Detection in Single-Cell RNA Sequencing Data Using Artificial Nearest Neighbors. Cell Syst. 2019, 8, 329–337.e4. [Google Scholar] [CrossRef] [Scilit] [PubMed]
- Korsunsky, I.; Millard, N.; Fan, J.; Slowikowski, K.; Zhang, F.; Wei, K.; Baglaenko, Y.; Brenner, M.; Loh, P.-R.; Raychaudhuri, S. Fast, sensitive and accurate integration of single-cell data with Harmony. Nat. Methods 2019, 16, 1289–1296. [Google Scholar] [CrossRef] [Scilit] [PubMed]
- Becht, E.; McInnes, L.; Healy, J.; Dutertre, C.-A.; Kwok, I.W.H.; Ng, L.G.; Ginhoux, F.; Newell, E.W. Dimensionality reduction for visualizing single-cell data using UMAP. Nat. Biotechnol. 2018, 37, 38–44. [Google Scholar] [CrossRef] [Scilit] [PubMed]
- Morabito, S.; Reese, F.; Rahimzadeh, N.; Miyoshi, E.; Swarup, V. hdWGCNA identifies co-expression networks in high-dimensional transcriptomics data. Cell Rep. Methods 2023, 3, 100498. [Google Scholar] [CrossRef] [Scilit] [PubMed]
- Korthauer, K.; Kimes, P.K.; Duvallet, C.; Reyes, A.; Subramanian, A.; Teng, M.; Shukla, C.; Alm, E.J.; Hicks, S.C. A practical guide to methods controlling false discoveries in computational biology. Genome Biol. 2019, 20, 118. [Google Scholar] [CrossRef] [Scilit] [PubMed]
- Davis, S.; Meltzer, P.S. GEOquery: A bridge between the Gene Expression Omnibus (GEO) and BioConductor. Bioinformatics 2007, 23, 1846–1847. [Google Scholar] [CrossRef] [Scilit] [PubMed]
- Ritchie, M.E.; Phipson, B.; Wu, D.; Hu, Y.; Law, C.W.; Shi, W.; Smyth, G.K. limma powers differential expression analyses for RNA-sequencing and microarray studies. Nucleic Acids Res. 2015, 43, e47. [Google Scholar] [CrossRef] [Scilit] [PubMed]
- Robin, X.; Turck, N.; Hainard, A.; Tiberti, N.; Lisacek, F.; Sanchez, J.-C.; Müller, M. pROC: An open-source package for R and S+ to analyze and compare ROC curves. BMC Bioinform. 2011, 12, 77. [Google Scholar] [CrossRef] [Scilit] [PubMed]
- Chen, T.; Guestrin, C. XGBoost: A Scalable Tree Boosting System. In Proceedings of the 22nd ACM SIGKDD International Conference on Knowledge Discovery and Data Mining, San Francisco, CA, USA, 13–17 August 2016; pp. 785–794. [Google Scholar] [CrossRef] [Scilit]
- Lundberg, S.M.; Lee, S.I. A Unified Approach to Interpreting Model Predictions. In Proceedings of the Advances in Neural Information Processing Systems 30 (NeurIPS 2017), Long Beach, CA, USA, 4–9 December 2017; pp. 4765–4774. Available online: https://proceedings.neurips.cc/paper_files/paper/2017/hash/8a20a8621978632d76c43dfd28b67767-Abstract.html (accessed on 1 September 2026).
- Hänzelmann, S.; Castelo, R.; Guinney, J. GSVA: Gene set variation analysis for microarray and RNA-seq data. BMC Bioinform. 2013, 14, 7. [Google Scholar] [CrossRef] [Scilit] [PubMed]
- Leek, J.T.; Johnson, W.E.; Parker, H.S.; Jaffe, A.E.; Storey, J.D. The sva package for removing batch effects and other unwanted variation in high-throughput experiments. Bioinformatics 2012, 28, 882–883. [Google Scholar] [CrossRef] [Scilit] [PubMed]
- Osorio, D.; Zhong, Y.; Li, G.; Xu, Q.; Yang, Y.; Tian, Y.; Chapkin, R.S.; Huang, J.Z.; Cai, J.J. scTenifoldKnk: An efficient virtual knockout tool for gene function predictions via single-cell gene regulatory network perturbation. Patterns 2022, 3, 100434. [Google Scholar] [CrossRef] [Scilit] [PubMed]
- Ghazal, R.; Wang, M.; Liu, D.; Tschumperlin, D.J.; Pereira, N.L. Cardiac Fibrosis in the Multi-Omics Era: Implications for Heart Failure. Circ. Res. 2025, 136, 773–802. [Google Scholar] [CrossRef] [Scilit] [PubMed]
- Wang, Y.; Yang, H.; Su, X.; Cao, A.; Chen, F.; Chen, P.; Yan, F.; Hu, H. TGF-β1/SMOC2/AKT and ERK axis regulates proliferation, migration, and fibroblast to myofibroblast transformation in lung fibroblast, contributing with the asthma progression. Hereditas 2021, 158, 47. [Google Scholar] [CrossRef] [Scilit] [PubMed]
- Huang, R.; Fang, Z.; Lei, Y.; Jiang, H. Suppression of SMOC2 alleviates myocardial fibrosis via the ILK/p38 pathway. Front. Cardiovasc. Med. 2023, 9, 951704. [Google Scholar] [CrossRef] [Scilit] [PubMed]
- Du, M.; He, S.; Liu, J.; Yuan, L. Uncovering key biomarkers, potential therapeutic targets and development of deep learning model in heart failure. PLoS ONE 2025, 20, e0330780. [Google Scholar] [CrossRef] [Scilit] [PubMed]
- Ortega, A.; Tarazón, E.; Roselló-Lletí, E.; Gil-Cayuela, C.; Lago, F.; González-Juanatey, J.-R.; Cinca, J.; Jorge, E.; Martínez-Dolz, L.; Portolés, M.; et al. Patients with Dilated Cardiomyopathy and Sustained Monomorphic Ventricular Tachycardia Show Up-Regulation of KCNN3 and KCNJ2 Genes and CACNG8-Linked Left Ventricular Dysfunction. PLoS ONE 2015, 10, e0145518. [Google Scholar] [CrossRef] [Scilit] [PubMed]
- Huang, X.; Zhao, X.; Li, Y.; Feng, Y.; Zhang, G.; Wang, Q.; Xu, C. Combining Bulk and Single Cell RNA-Sequencing Data to Identify Hub Genes of Fibroblasts in Dilated Cardiomyopathy. J. Inflamm. Res. 2024, 17, 5375–5388. [Google Scholar] [CrossRef] [Scilit] [PubMed]
- Xin, C.; Lei, J.; Wang, Q.; Yin, Y.; Yang, X.; Guerrero, J.A.M.; Sabbisetti, V.; Sun, X.; Vaidya, V.S.; Bonventre, J.V. Therapeutic silencing of SMOC2 prevents kidney function loss in mouse model of chronic kidney disease. iScience 2021, 24, 103193. [Google Scholar] [CrossRef] [Scilit] [PubMed]
- He, Y.; Pan, X.; Liu, Z.; Zuo, P.; Sheng, Z.; Hao, C.; Tao, Z.; Chen, Z.; Song, J.; Ma, G.; et al. METTL3 Silencing Suppresses Cardiac Fibrosis Post Myocardial Infarction via m6A Modification of SMOC2. J. Cell. Mol. Med. 2025, 29, e70829. [Google Scholar] [CrossRef] [Scilit] [PubMed]
- Xing, Y.; Yan, L.; Liang, G.; Xie, S.; Li, M.; Zhao, N.; Zhao, Y.; Deng, W.; Yang, Q. SMOC2 accelerates myocardial fibrosis following myocardial infarction by promoting lipid peroxidation through inhibition of the LKB1/AMPKα/FOXO3 pathway. J. Adv. Res. 2026. Epub ahead of print. [Google Scholar] [CrossRef] [Scilit] [PubMed]
- Yan, W.; Li, Y.; Wang, G.; Huang, Y.; Xie, P. Clinical application and immune infiltration landscape of stemness-related genes in heart failure. ESC Heart Fail. 2025, 12, 250–270. [Google Scholar] [CrossRef] [Scilit] [PubMed]
- Zhao, Y.; Zhang, R.; Zha, K.; Li, Y.; Li, H.; Wang, Y.; Dai, S.; Zeng, Y. Explainable machine learning-driven identification of heart failure biomarkers: A multi-model feature selection approach with SHAP-based interpretability. Sci. Rep. 2026, 16, 23957. [Google Scholar] [CrossRef] [Scilit] [PubMed]
- Yu, Y.; Liu, X.; Xue, Y.; Li, Y. Identification of immune-related genes for the diagnosis of ischemic heart failure based on bioinformatics. iScience 2023, 26, 108121. [Google Scholar] [CrossRef] [Scilit] [PubMed]
- Ren, M.; Ye, X.; Ouyang, C.; Da, Q.; Xue, W.; Chen, P. JMJD2A mediates transcriptional activation of SFRP4 and regulates oxidative stress and mitochondrial dysfunction in heart failure. Pathol. Int. 2024, 74, 210–221. [Google Scholar] [CrossRef] [Scilit] [PubMed]
- Li, W.; Wang, M.; Ruan, Z.; Ren, Y.; Zhu, L.; Zhang, B. SFRP4 Knockdown Attenuates Dsg2-Deficient Arrhythmogenic Cardiomyopathy by Down-Regulating TGF-β and Smad3. Biochem. Genet. 2026, 64, 1002–1017. [Google Scholar] [CrossRef] [Scilit] [PubMed]
- Rixon, C.; Andreassen, K.; Shen, X.; Erusappan, P.M.; Almaas, V.M.; Palmero, S.; Dahl, C.P.; Ueland, T.; Sjaastad, I.; Louch, W.E.; et al. Lumican accumulates with fibrillar collagen in fibrosis in hypertrophic cardiomyopathy. ESC Heart Fail. 2023, 10, 858–871. [Google Scholar] [CrossRef] [Scilit] [PubMed]
- Li, C.; Hao, R.; Li, C.; Liu, L.; Ding, Z. Integration of single-cell and bulk RNA sequencing data using machine learning identifies oxidative stress-related genes LUM and PCOLCE2 as potential biomarkers for heart failure. Int. J. Biol. Macromol. 2025, 300, 140793. [Google Scholar] [CrossRef] [Scilit] [PubMed]
- Akazawa, Y.; Vaidyanathan, S.; Dewar, M.B.; Yazaki, K.; Dauz, J.; Honjo, O.; Sun, M.; Kabir, G.; Jankov, R.P.; Heximer, S.P.; et al. Homeostatic Role of Decorin in Right Ventricular Pressure Overload and Pulmonary Hypertension Induced Remodeling. JACC Basic Transl. Sci. 2025, 10, 323–341. [Google Scholar] [CrossRef] [Scilit] [PubMed]
Disclaimer/Publisher’s Note: The statements, opinions and data contained in all publications are solely those of the individual author(s) and contributor(s) and not of MDPI and/or the editor(s). MDPI and/or the editor(s) disclaim responsibility for any injury to people or property resulting from any ideas, methods, instructions or products referred to in the content. |
© 2026 by the authors. Licensee MDPI, Basel, Switzerland. This article is an open access article distributed under the terms and conditions of the Creative Commons Attribution (CC BY) license.