


Abstract
3D digitization of museum artifacts is essential for both their virtual presentation and re-exhibition in the event of damage or loss. Given the number of artifacts that can be exhibited in a museum, the effectiveness of single-digitization practices under designed conditions is limited in terms of realism. In this study, a highly detailed sine quadrant object was digitized in a museum environment using photogrammetry and structured-light scanning (SLS) techniques. 3D models were generated from point clouds derived in photogrammetry and directly obtained from SLS. In the qualitative assessment based on the distinguishability of linear and edge details, the photogrammetric technique was found to be better; in the quantitative assessment based on the reference length values on the artifact, SLS was better, while photogrammetry was also found to be adequate. The maximum difference values for photogrammetry and SLS were 0.40 and 0.27 cm, respectively, while the average difference values were 0.24 cm and 0.10 cm. Additionally, cloud-to-cloud distance analysis revealed that two-point clouds overlapped quite well geometrically. Point clouds were also compared in terms of homogeneity using outlier detection analysis. This analysis showed that noise in the photogrammetric point cloud had a wider distribution over the artifact. In terms of data acquisition and processing time, SLS was found to be better, while the cost was comparable. After evaluating the techniques from various perspectives, photogrammetry was found to be preferable for modeling in a museum environment due to the priority need for high texture quality from the end-user’s perspective. In this respect, SLS is highly dependent on hardware capability for both data acquisition and processing.
1. Introduction
Ownership of cultural heritage (CH) has constantly changed due to social, political, and commercial relations among various civilizations. Therefore, CH is not only a value of its location but also a common value shared by all humanity and is considered a tangible reflection of history [1]. Historical artifacts (HAs), which are the physical equivalent of CH, are preserved in museums. It is necessary to preserve and pass on HAs, which bear the traces of the past, to future generations. This is essential for the continuous and sustainable transmission of cultural tradition. However, during museum preservation, artifacts can be damaged or destroyed due to deformation over time and external factors such as earthquakes [2,3]. For this reason, virtual museums (VMs) are created to ensure accessibility from anywhere at any time and to ensure the sustainability of the exhibition [4,5]. In VMs, artifacts can be examined through virtual tours. In this context, the digital documentation and recording of HAs is necessary for repair and, if required, re-presentation. Although 360° cameras are frequently preferred in creating VMs due to their ability to view wide areas from a limited point, low cost, and quick and easy integration into web environments, the scale problem, the flexibility of examining the artifact, and the limited level of detail for small objects constitute significant disadvantages in remote access for research purposes [6,7]. To minimize these disadvantages, high-accuracy 3D models of the HAs are required [8,9].
Point cloud data is generally used to produce 3D models of HAs [10]. Each point in the point cloud generally contains thematic and metric information. Thematic information consists of the reflectance values in the visible region of the electromagnetic spectrum of the point. Metric information represents the 3D positional value of the point. Depending on the quality of thematic and metric information, the techniques used in point cloud production have advantages and disadvantages relative to one another. If the object to be digitized is a HA in a museum, photogrammetry and structured-light scanning (SLS) are prominent approaches. In photogrammetry, photographs of the object to be modeled can be taken from different angles using relatively lower-cost sensors. Point clouds are generated from high-resolution images captured by non-metric cameras using image-matching algorithms. The variability of algorithm performance with respect to object structure when deriving the point cloud, and the gaps in complex regions that are not sufficiently covered by the photographs, are among the best-known disadvantages of photogrammetry. In SLS, on the other hand, the direct acquisition of the point cloud enables faster modeling. Although metric information has high spatial accuracy, the low resolution of integrated cameras is a disadvantage for thematic information. The irregularity of possible linearity in edge details and the brightness generated on the model due to reflection are other known disadvantages of SLS [11,12,13,14]. SLS differs from the well-known laser scanning technique in terms of the equipment and methodology used. SLS uses a structured-light 3D scanner, and it is a handheld device. This device does not emit a laser beam to the target surface. Instead, projected light is utilized, but the resulting data is still a point cloud.
In the literature, various studies have been conducted on the 3D digitization of HAs in museums using photogrammetry and SLS [15,16,17]. Artifacts exhibited in museum environments are generally smaller than those found outdoors. Among those exhibited in museums, sculptures and tombs are larger than others. Those kept in showcases are mostly compact. These can be very small artifacts, such as coins, as well as artifacts containing letters, writing, symbols, and motifs. While non-metric cameras are used for photogrammetric modeling of museum works [18], structured-light 3D scanners are used for SLS [19]. Among studies in the literature, the 3D modeling of the world’s first known length-measuring instrument using photogrammetry and SLS is an important reference source [20]. Although SLS model better reflected the object due to the higher number of points per unit, no significant difference was found in terms of qualitative and quantitative aspects. Similar results were obtained when comparing the 3D models of the female figure produced using both techniques [21]. In the study conducted by [22], four different small-sized objects were modeled with photogrammetry and SLS. As a result of the detailed analyses, it was stated that the object’s structure and texture are important factors in choosing which technique to apply, and no significant difference was observed between the methods in metric accuracy. In a study in which various museum objects were 3D digitized [23], it was revealed that photogrammetry is a reliable and effective technique for handling complex textures and structural features. In a study in which photogrammetric photography was implemented intensively, similar to SLS data acquisition, a sharp, saturated texture was achieved in the 3D modeling of small artifacts [24]. In a study in which museum-exhibited skulls were digitized using a structured-light 3D scanner, it was noted that the time required for data collection was a disadvantage, and the accuracy assessment was uncertain [25].
Photogrammetry and SLS techniques were compared by [26] to obtain digital copies of HAs at the British Museum. A turntable was used to collect data on small objects, and relatively large objects, such as sarcophagi with details like writing and motifs, were also 3D-modeled. Although SLS produced denser point clouds, no significant difference was observed in the discrepancy analysis between the two techniques. SLS produced much better results for the distinguishability of details on sarcophagi, and they stated that the photo shooting distance should be closer to achieve results comparable. However, it was noted that radiometric properties are also an important factor in HA restoration, and that photogrammetry is more useful in this respect. Ref. [27] emphasized that the software used in the production of 3D models of small-sized HAs is important in terms of accessibility, model quality and time. In another study in which small archeological artifacts were documented, although photogrammetry was generally found to be more flexible, the quantitative results showed similar performance [28].
In the study conducted by [29], 3D modeling applications were carried out on a cuneiform tablet fragment using a Digital Single Lens Reflex (DSLR) camera, a phone camera, and a structured-light 3D scanner. It was stated that both photo-based models were positively comparable to the model from SLS, which is much more expensive in terms of hardware. It was stated that photographing small objects on a turntable contributed to achieving high performance at low cost. In the study conducted by [30], it was stated that an artificial lighting system that provides equal lighting for objects around the turntable produced better 3D models than those previously reported in the literature. Ref. [31] stated that smartphone cameras can be used in the production of accurate and low-cost 3D models in a short time and will benefit the preservation of small and medium-sized artifacts. The contributions of photogrammetric 3D models to VM creation were discussed in detail by [32]. Ref. [33] 3D modeled various historical measuring instruments using photogrammetry and SLS for usability in a VM. While the accuracy in quantity varies from object to object, no significant difference was found between the techniques. Visual quality also varies depending on the techniques for different objects.
Given studies in the literature on the digitization of HAs in museums, it is evident that some aspects have not been sufficiently addressed. As stated by [15], photogrammetry is mostly preferred in the production of 3D models created for display in VMs. However, there is not enough guiding research on what the preference should be when the required data for 3D digitization is collected in the museum environment. Photographing or scanning of artifacts was generally carried out in external areas with special lighting conditions. Museums have strict rules for preserving artifacts. Although artifacts can be taken outside with the required permissions for individual applications, the number of artifacts exhibited in a museum can run into the hundreds. If 3D modeling of all artifacts for presentation in a VM is considered, it is not realistic to remove and digitize each artifact individually from its preservation area. Given that not all objects can be moved, study number [34] stands out as an examination of generating the 3D models of HAs in a museum environment under uncontrolled lighting conditions. However, textured versions of both photogrammetry and SLS-based models were not been presented. In this context, the answer to the question of which technique would be more effective for 3D modeling under museum conditions remains unclear.
Another issue is the structure and content of the artifact to be 3D digitized and modeled. The artifacts investigated in the literature are not excessively complex in terms of detail level [20,21,22,23,24]. The 3D modeling of complex objects, including writing, motifs, and linear details, has not been sufficiently addressed. In this study, photogrammetry and SLS techniques were applied to a sine quadrant object under museum conditions to address the identified shortcomings in the literature. The efficiency of the methods was demonstrated by modeling a small sine-quadrant object containing numerous textual, point, and linear details, primarily under yellow light on a reflective surface in the museum. In addition to qualitative and quantitative comparisons, a comprehensive evaluation of time and cost was conducted, creating a guiding resource for modeling a large number of HAs for VM creation.
2. Materials and Methods
2.1. Study Object
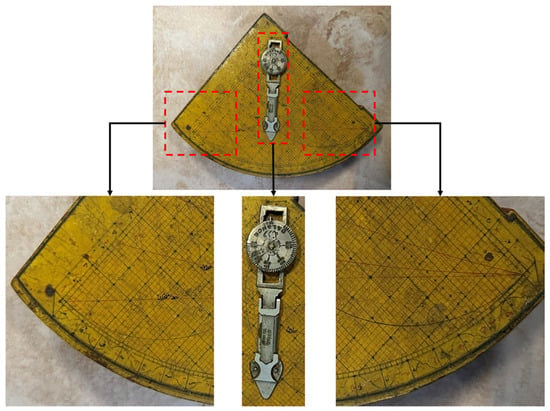
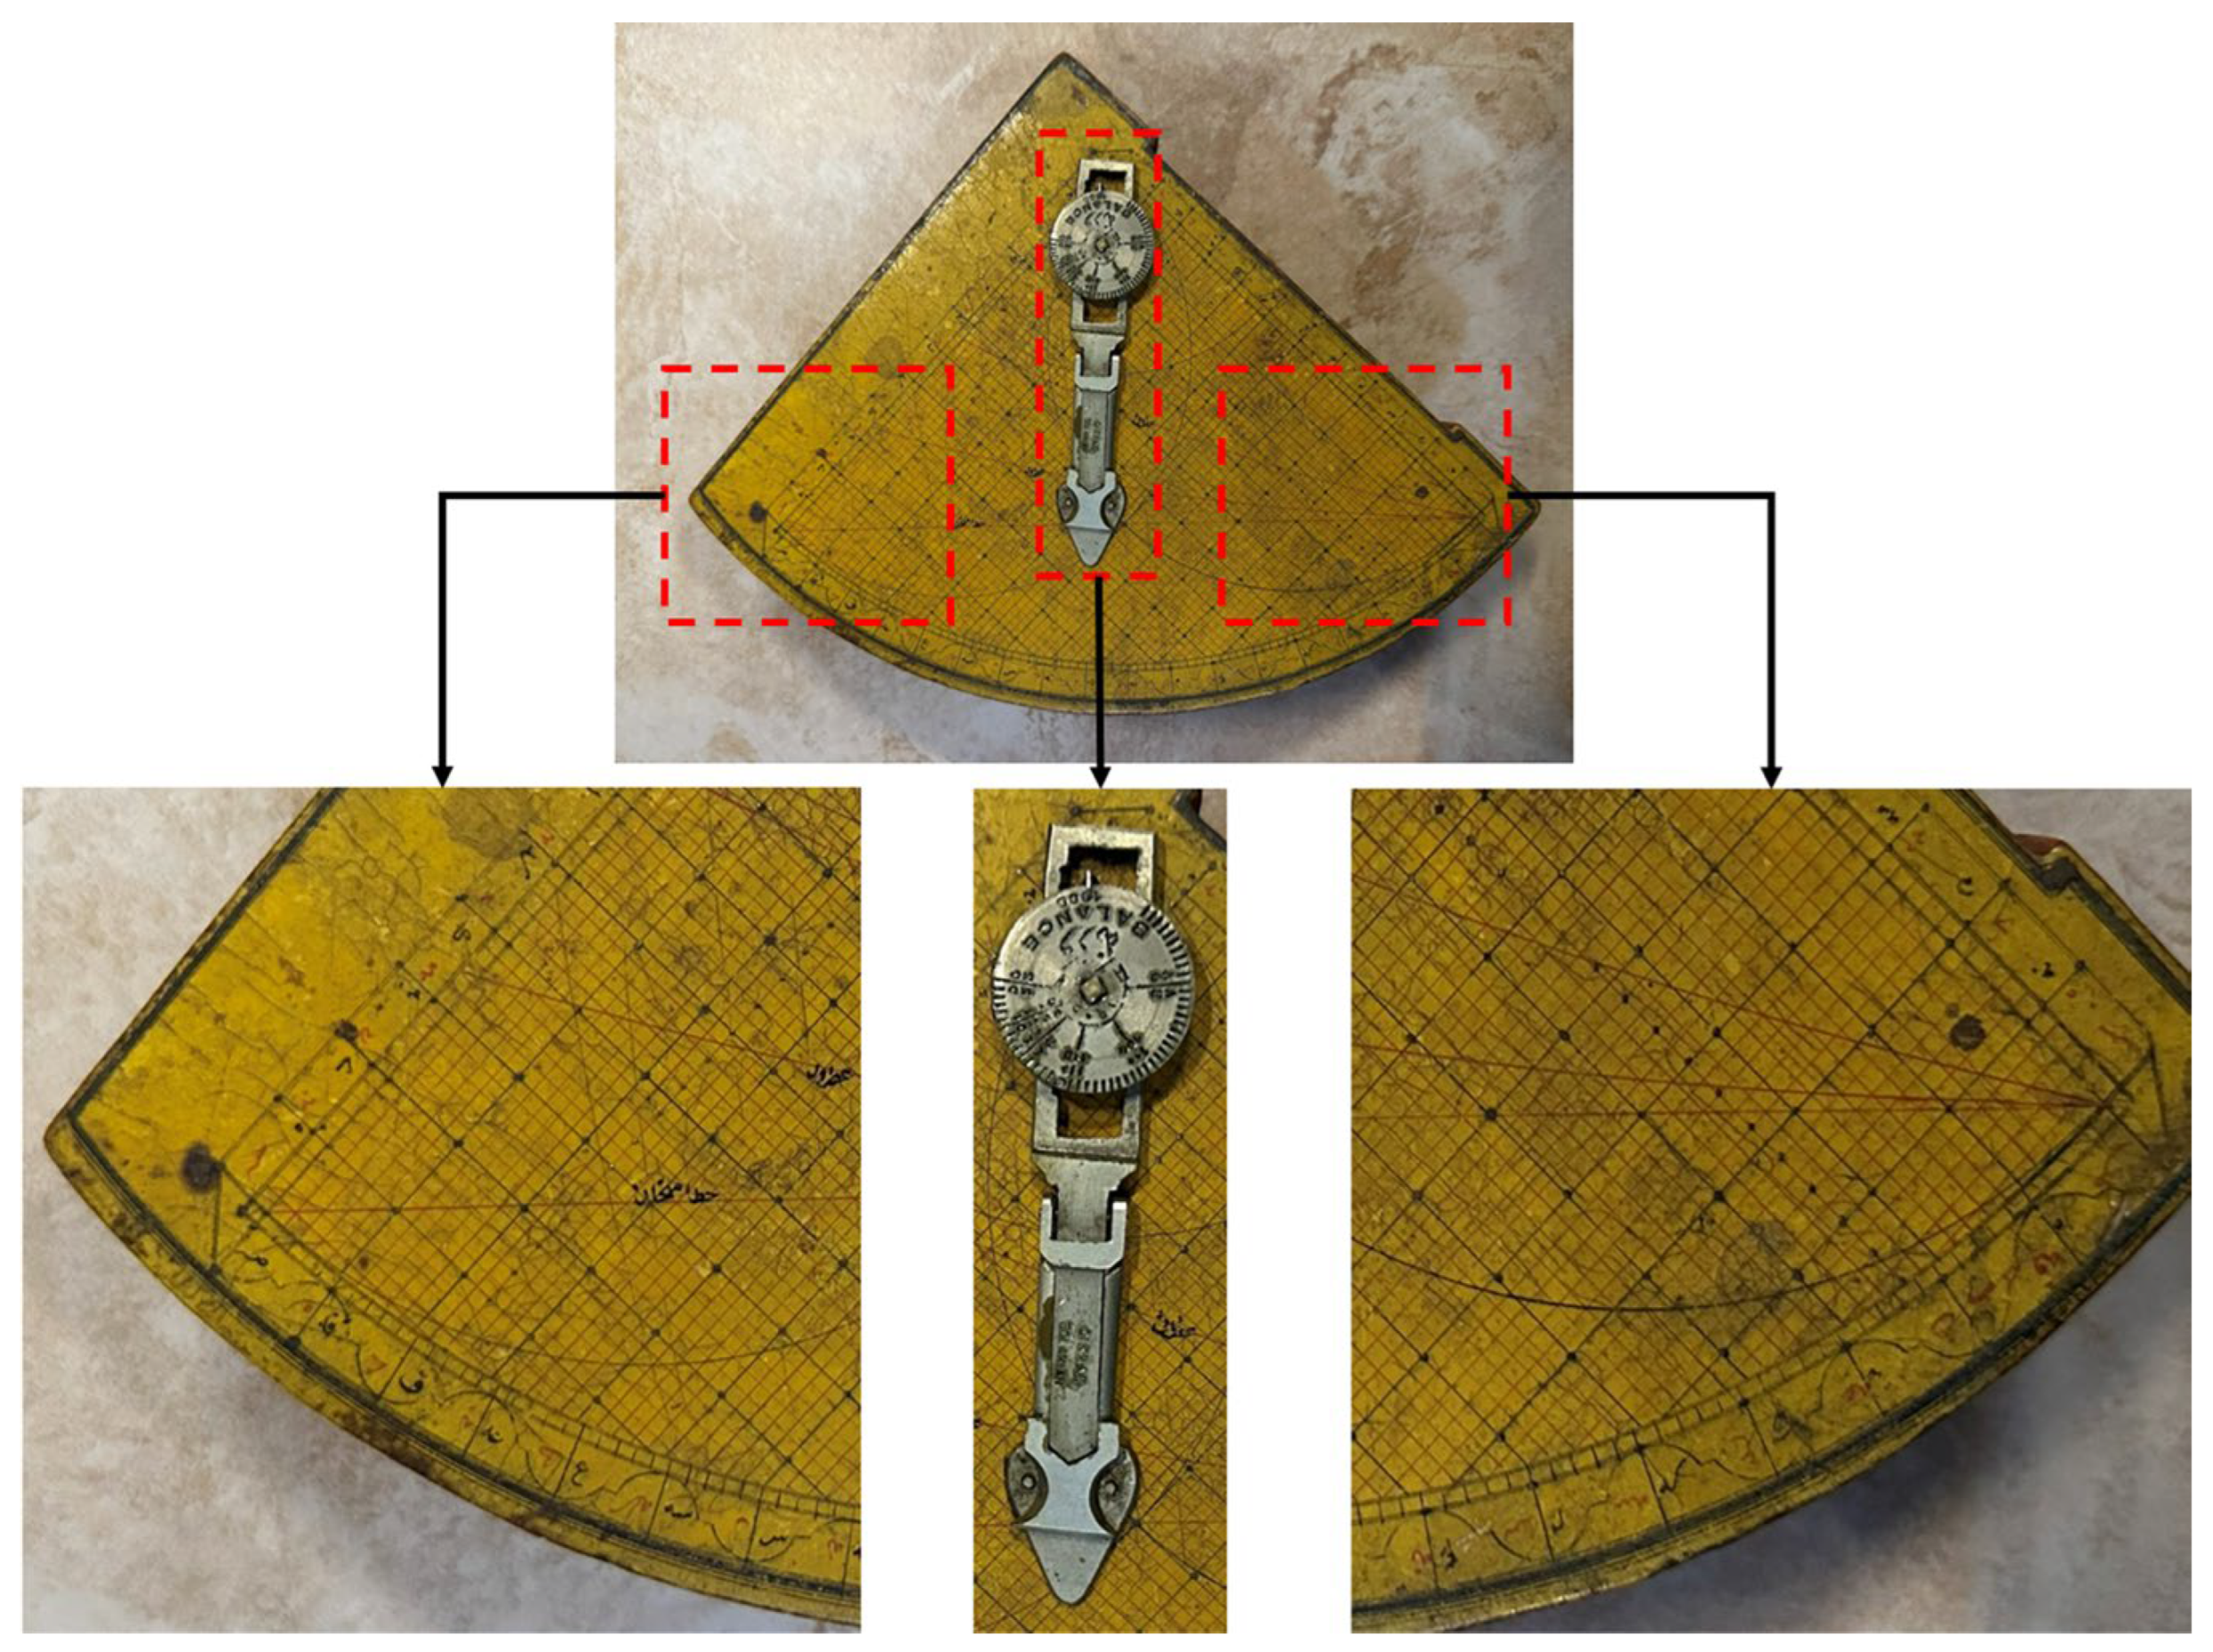
The object used to assess the effectiveness of 3D digitization techniques is the sine quadrant exhibited at the Tokat Museum, Türkiye. The sine quadrant, inventory number 241, was brought to the museum in 1930 and is kept in a glass showcase, as shown in Figure 1. According to ethnographic artifact inventory records, the artifact consists of two parts. The wooden part was made of boxwood. The quarter-circle-shaped piece was painted yellow on both sides and red on the edges. The lines were spaced 1 cm apart and the curves intersecting these lines at different angles were used to calculate the altitudes of the stars and determine spatial information. The following statements were included in the special section where the artwork is displayed: “This gadget, named as “Rubu Tahta”, is used for determining time (clock). There are divisions, markings and numbers on gradient boards made of wood in a quarter circle. By placing a bronze plummet over a gradient board, time is estimated.” Therefore, when evaluated together with the information in the ethnographic artifact inventory, it was understood that the artifact has various names and was used for different purposes.
Figure 1.
Sine quadrant object displayed in Tokat Museum.
Apart from the information obtained from the Tokat Museum, the quadrant is a multifunctional measuring instrument developed in the Islamic world during the Middle Ages, used for astronomy, geography, and measurement. It is fundamentally based on trigonometric calculations [35]. Its features, including a circular arc, two reference axes (one horizontal and one vertical), sine and cosine scales, sighting holes for the sun and stars, and secant components, demonstrate that it is theoretically the ancestor of photogrammetry and theodolite measurements. Its survival to the present day is concrete evidence of the Islamic mathematical-astronomical tradition in the history of science.
The reason for choosing the sine quadrant, also called an astrolabe or altitude board, is due to the object’s dimensions and structural content. The artifact has compact dimensions among those exhibited in the Tokat Museum. Given the 13.5 cm radius of the quarter circle, it is a small object for 3D modeling. In terms of content, the color variation on the artifact is limited. Furthermore, there are numerous points and line details and inscriptions on a yellow background. All these features can serve as a reference for determining which technique is most suitable for 3D modeling other objects in museum conditions. It is also significant that, to our knowledge, it has not yet been analyzed using photogrammetry and SLS techniques.
2.2. Data Collection: Photogrammetry
In photogrammetry, 3D objects are measured and modeled from 2D photographs. In this context, overlapping photographs are taken during the data collection phase. Today, photogrammetric applications are performed using Structure-from-Motion (SfM) technology. In SfM, the exposure center, rotations, and 3D point cloud are automatically estimated from overlapping photographs. Common features in photographs of the same scene obtained from different perspectives are identified, and a point cloud is generated by matching the images. The point cloud is a derived dataset in photogrammetric technique. A solid model is produced by connecting the points from this dataset. The solid model is then converted into a textured model using the captured photographs. If control points are used for scaling, the resulting 3D model is also metrically accurate and precise.
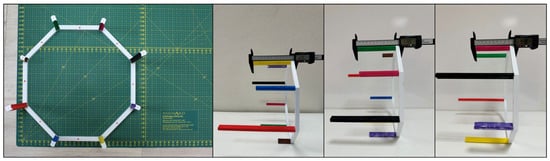
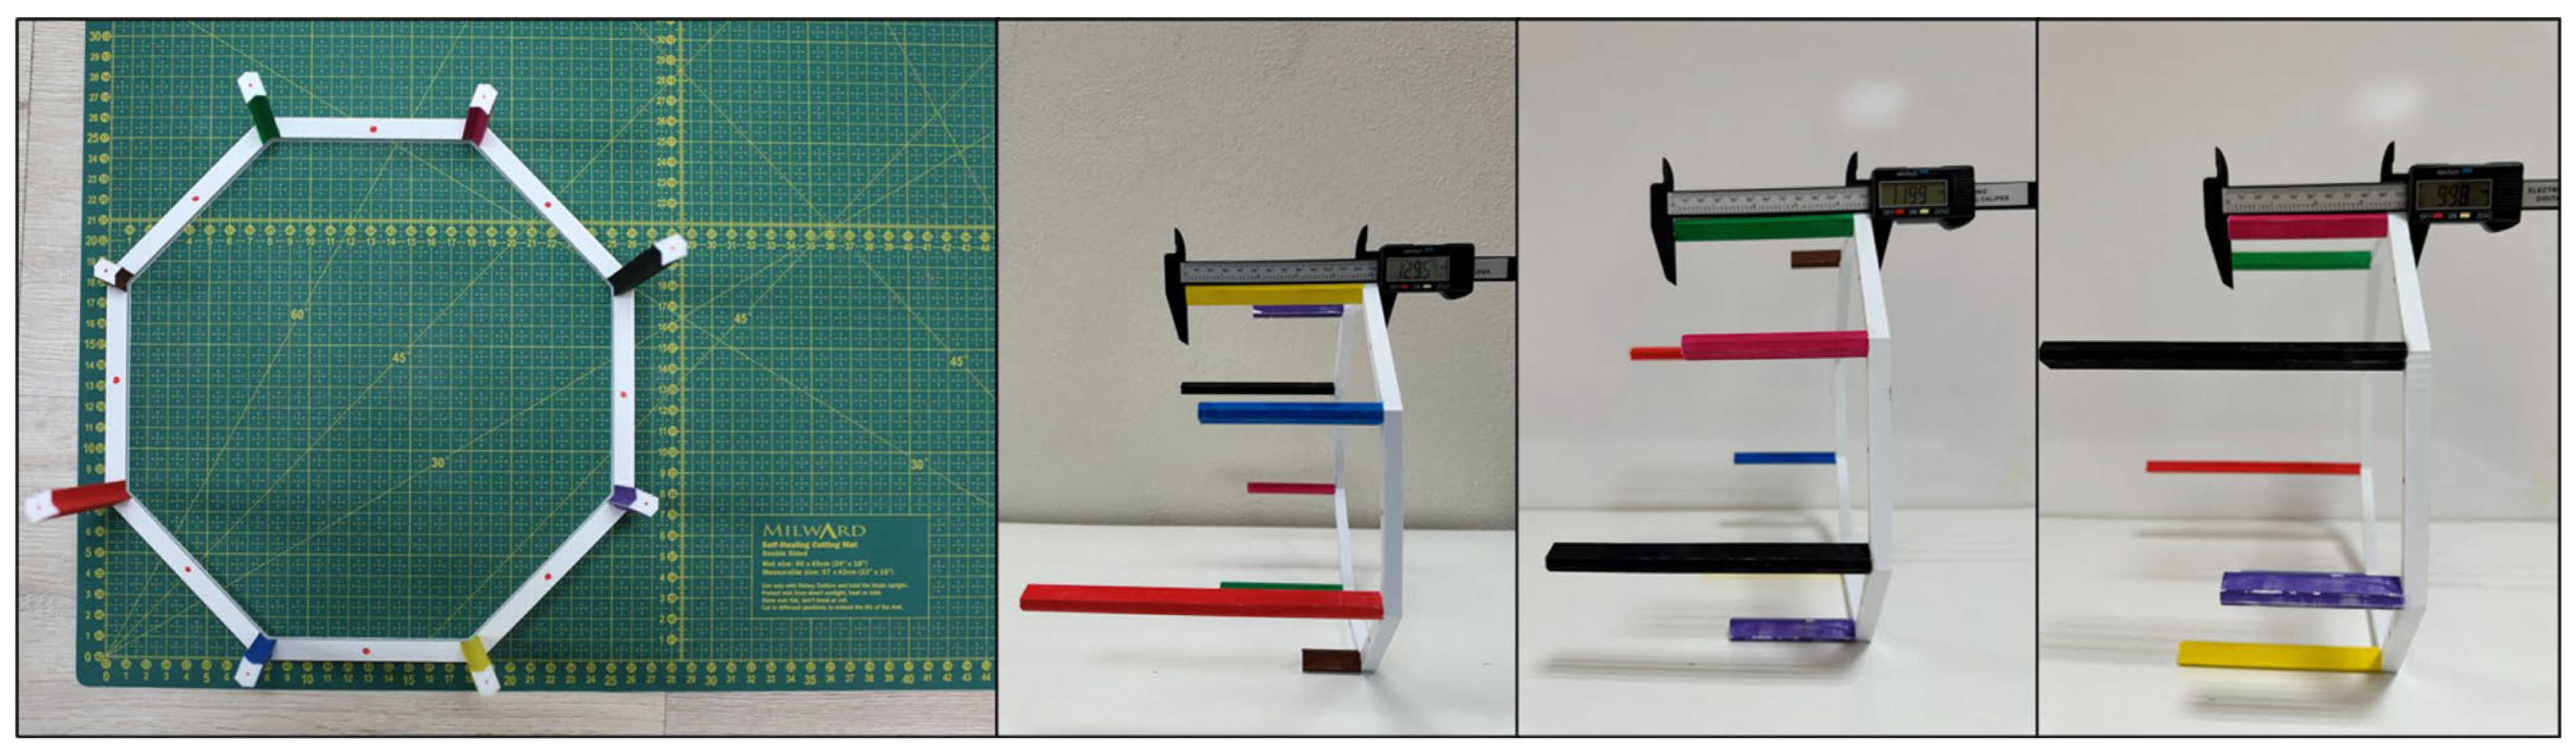
A 3D test area was designed before the photo shooting. This test area has an octagonal structure with columns of varying heights at each corner. The test area was produced using a Creality K1 Max 3D printer, and the accuracy of the dimensions specified in the design was verified with a precision caliper. Each column was painted in a different color. Because image matching algorithms cannot achieve the desired performance with low-color-variability objects, additional color variation was introduced during the photographic process. The upper midpoint of each column was marked in red as a ground control point (GCP). GCPs were also marked on the skeleton between each pair of columns. Marking GCPs on the HA by gluing or fixing is not feasible according to the artifact’s preservation procedures. Furthermore, such a procedure would require a total station to scale the artifact’s 3D model, which is inefficient in a museum environment. Therefore, the designed test area was coordinated by placing it on a measuring mat as presented in Figure 2. To improve clarity of the test area, the column heights are presented in Table 1. Horizontal coordinates were calculated using both axes. Vertical coordinates were calculated using the dimensions of the columns and the width of the octagonal skeleton. The thickness of the octagonal structure is 1 cm. The heights of the columns range from 4 cm to 20 cm. The height of the points on the octagonal frame was calculated directly as 1 cm, while the heights of the points on the columns were calculated as column height + 1 cm. This made it possible to scale the photogrammetric 3D model during the data processing phase after the photograph was taken.
Figure 2.
Scaling the test area on the mat and validation with precise caliper, including frame thickness.
Table 1.
Information regarding 3D test area.
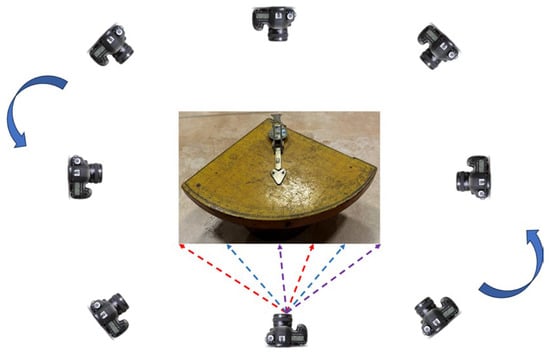
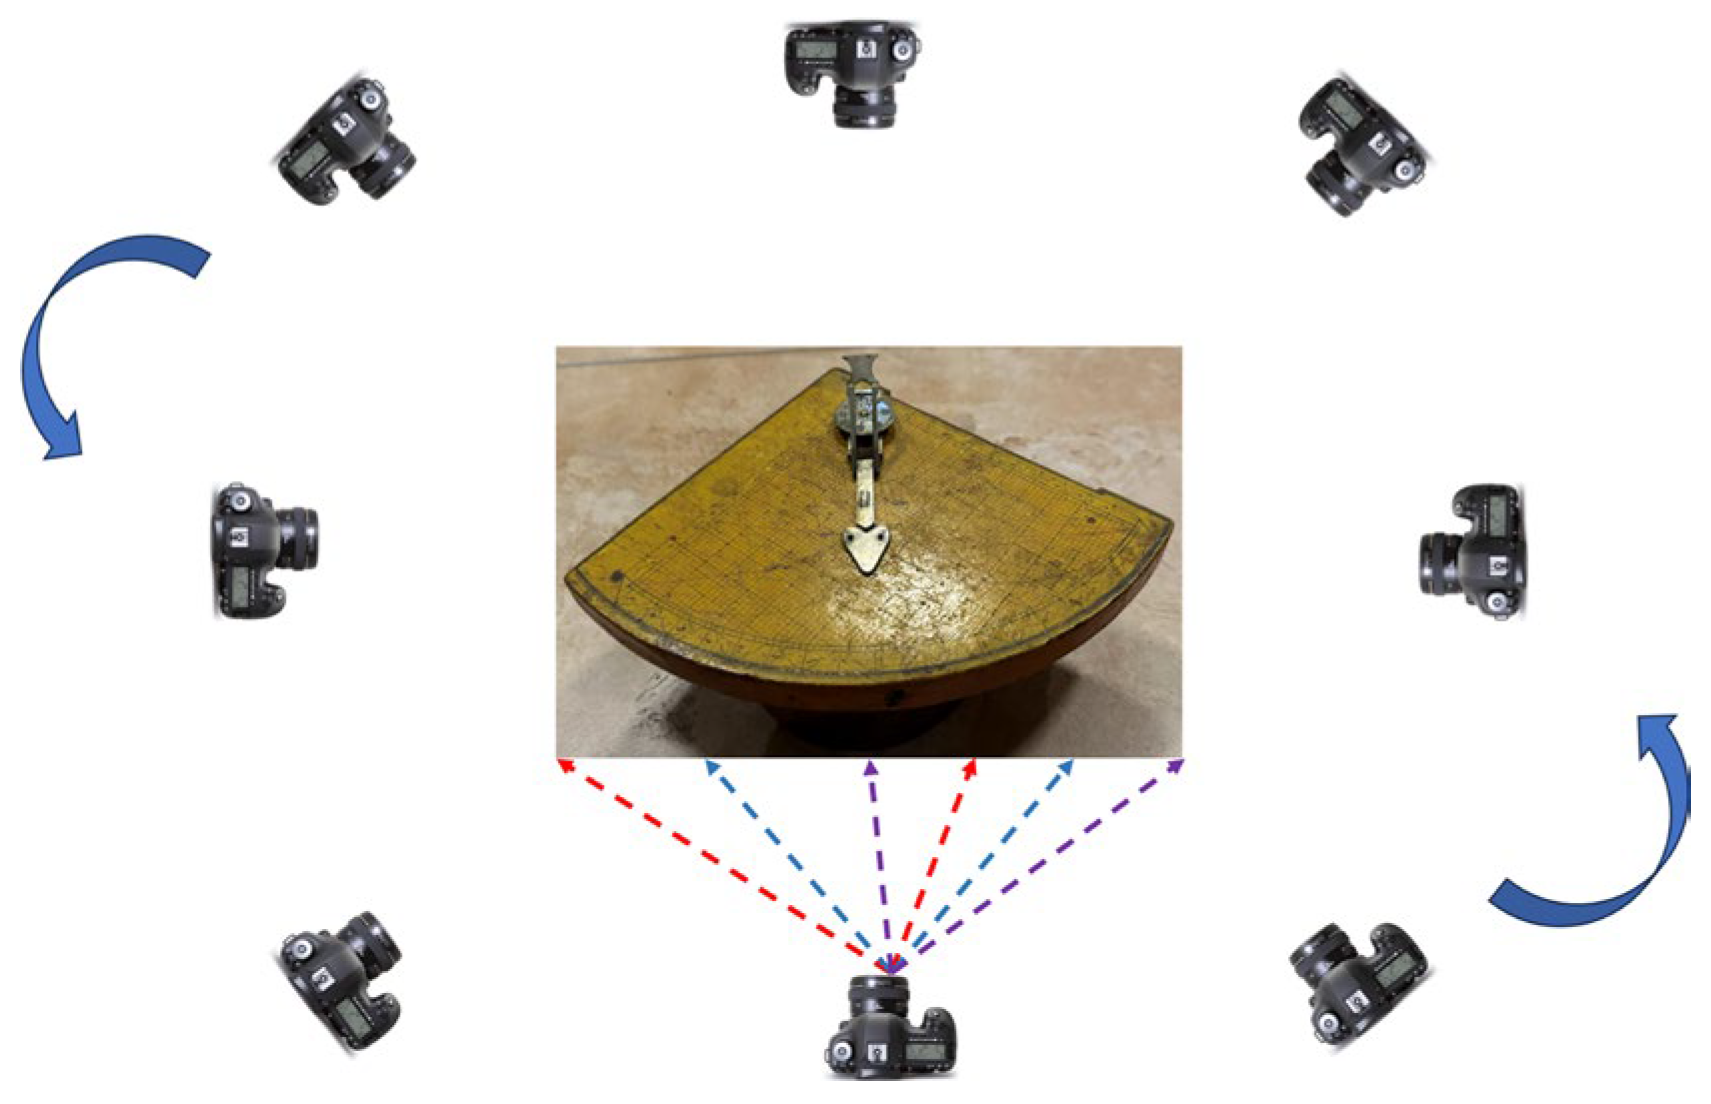
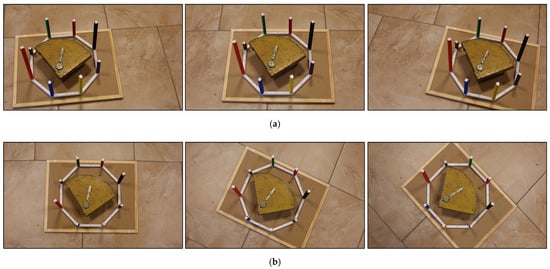
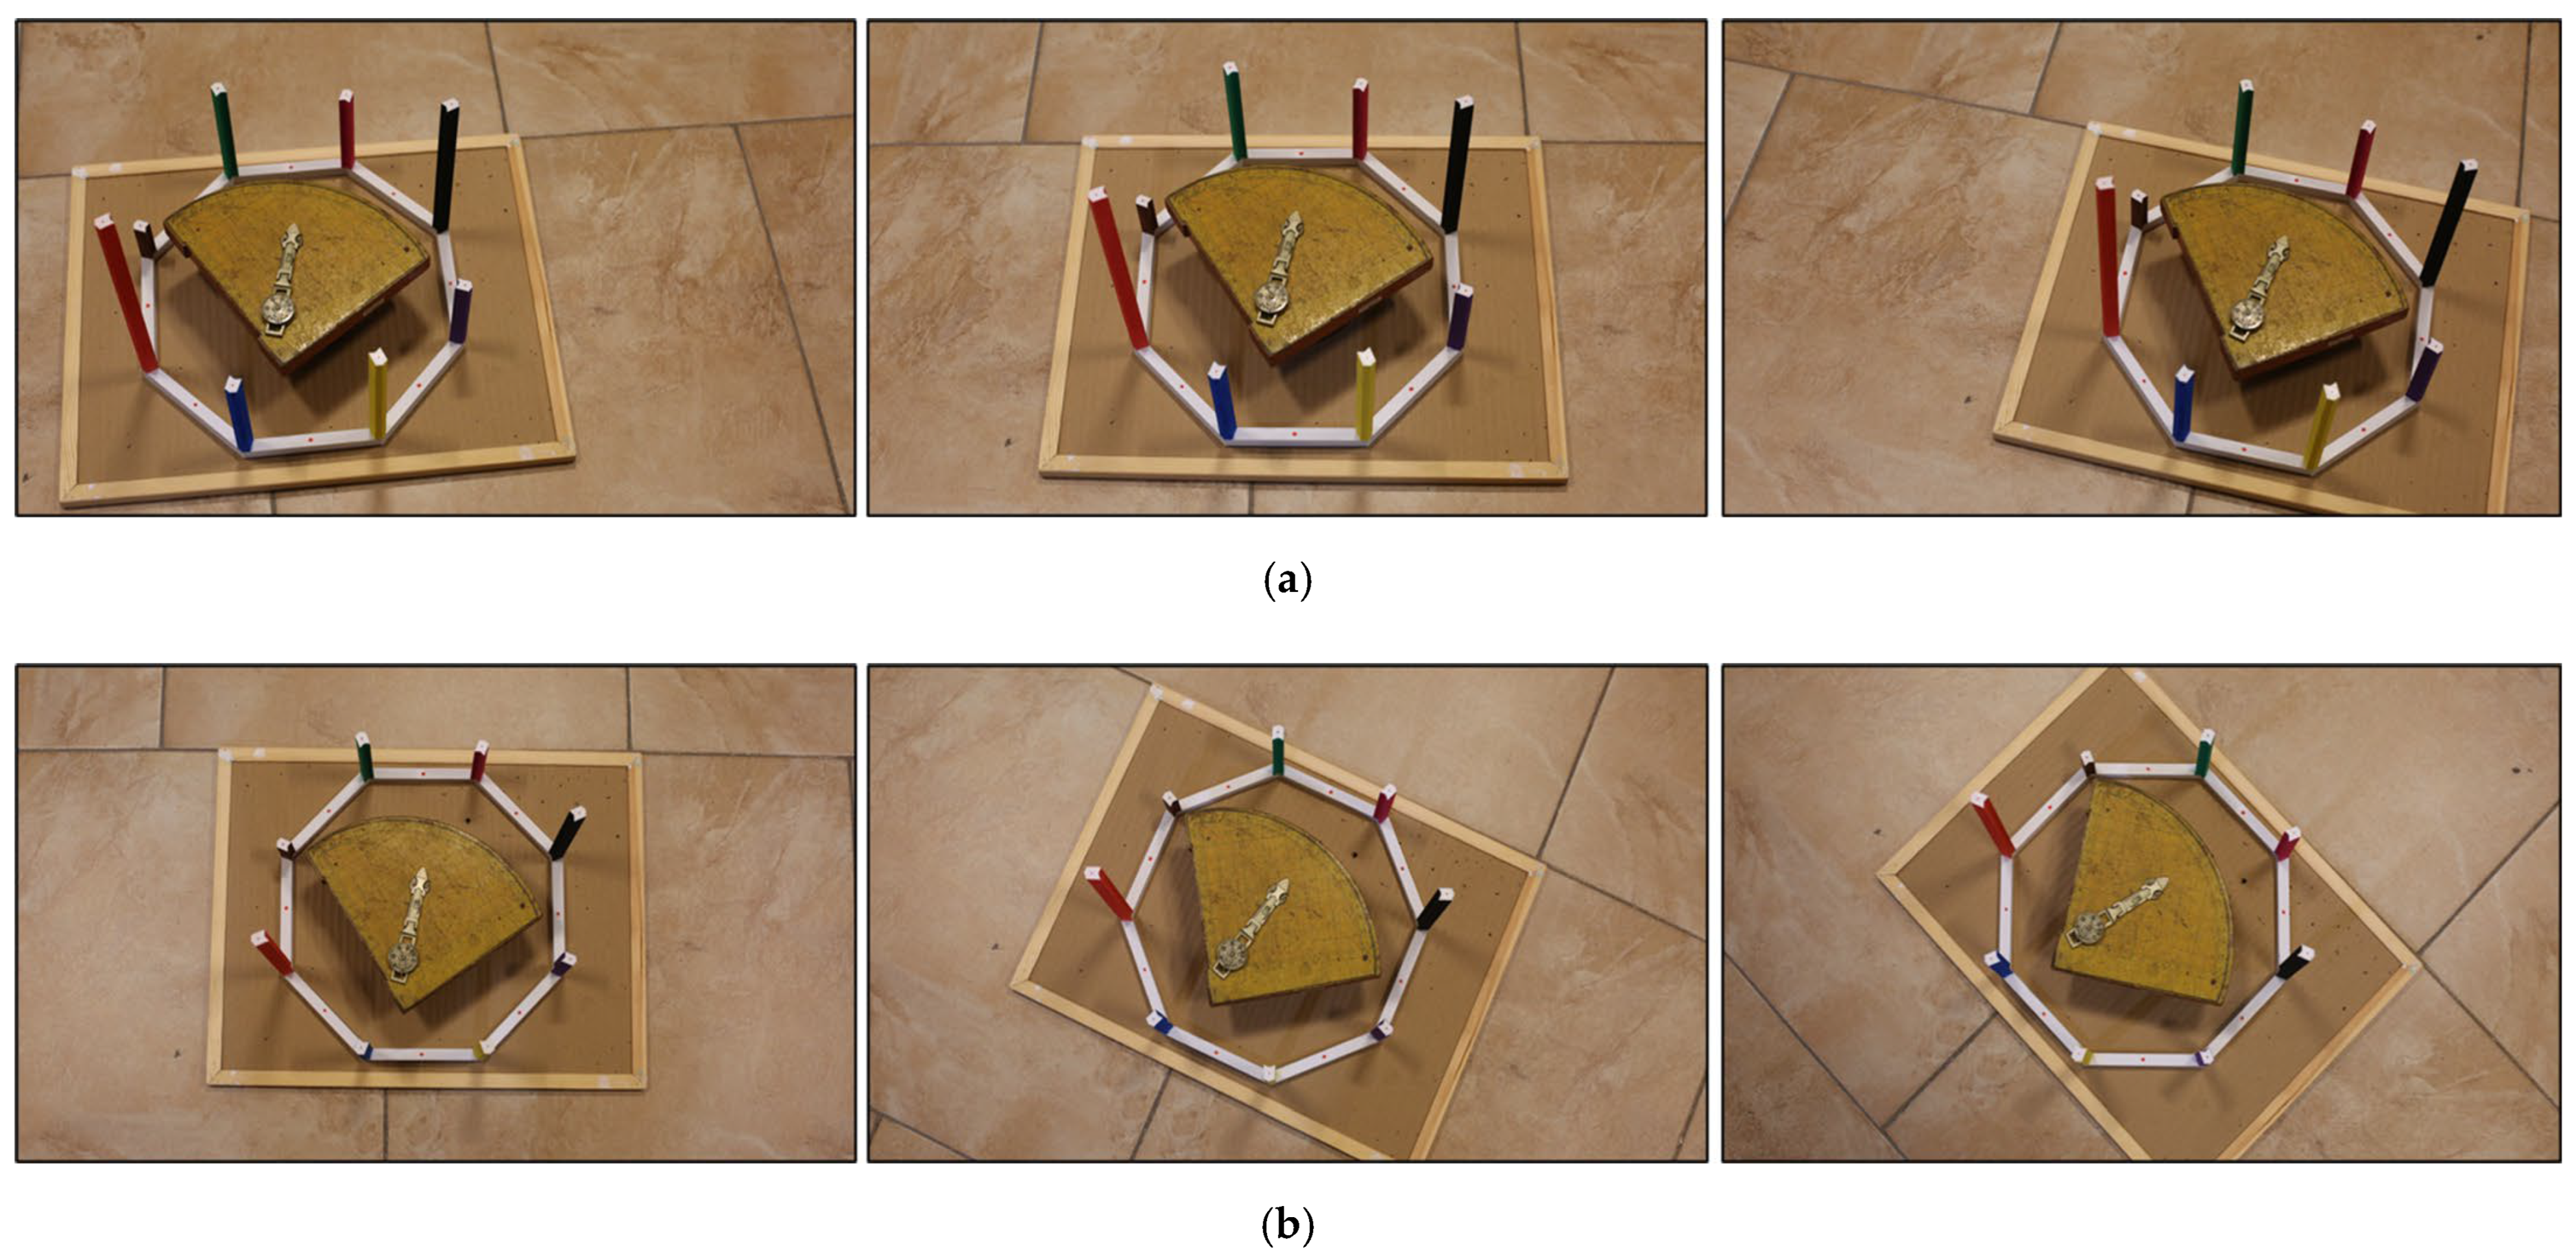
The photo shooting was performed as shown in Figure 3. At each camera position, 3 photos were taken with the camera facing left, directly in front, and to the right. Normally, the photo-shooting principle for an SfM application is as described in [36]. The basic principle is that there should be an overlap between photographs taken in succession. However, in this study, three photos were taken at each shooting point with an overlap between them. Depending on the direction of movement, the photo obtained at any shooting center with the camera facing directly in front of the object and to the right overlapped with the photo obtained at the next shooting center with the camera facing left. Thus, a better match was aimed for by increasing the standard overlap ratios. These photographs were oblique type. In addition, to minimize areas not visible in the photographs, the photo-shooting approach described in [36] was used, with the camera positioned higher. These photographs were vertical. Examples of the photographs taken are presented in Figure 4.
Figure 3.
Oblique photo-shooting: The red arrow represents the camera focusing to the left, the blue arrow represents focusing directly in front, and the purple arrow represents focusing to the right.
Figure 4.
(a) Oblique photographs; (b) Vertical photographs.
The camera used for the photo-shooting was Canon EOS 5D Mark III, belonging to the Department of Geomatics Engineering at Tokat Gaziosmanpasa University. This is a DSLR camera and was equipped with a fixed 50 mm focal length lens. This combination was chosen because having a single focal length reduces the amount of movement in the camera mechanism, thereby improving clarity and sharpness in the photographs. Although it was possible to perform pre-calibration with the software’s calibration pattern, factors such as the number of photos taken, the photo-shooting distance, and the photo angle can lead to different parameters being obtained in repeated pre-calibrations. For this reason, camera calibration was performed along with block adjustment by using points on the test area. The parameters calculated through calibration are presented in Table 2. The photo shooting distance for 3D model production was approximately 80 cm. The overlap rate between the photos was also approximately 80%. The photogrammetric photography process produced a total of 67 photographs: 48 oblique and 19 verticals.
Table 2.
Camera calibration parameters.
2.3. Data Collection: SLS
In SLS, the data acquisition phase was completed much more quickly than in photogrammetry. The 3D scanner used was the Scantech iReal 2E, belonging to the Department of Geomatics Engineering at Istanbul Technical University. This 3D scanner, which belongs to the structured-light scanner category, is also a handheld device. Thanks to its mobility, it is a device that can be easily used in the documentation of HAs. The disadvantage of this device, which has high geometric accuracy, is that it cannot collect data as desired on reflective surfaces. The scanner used in the study collects data in an integrated manner with iReal 3D software v3.0.0.
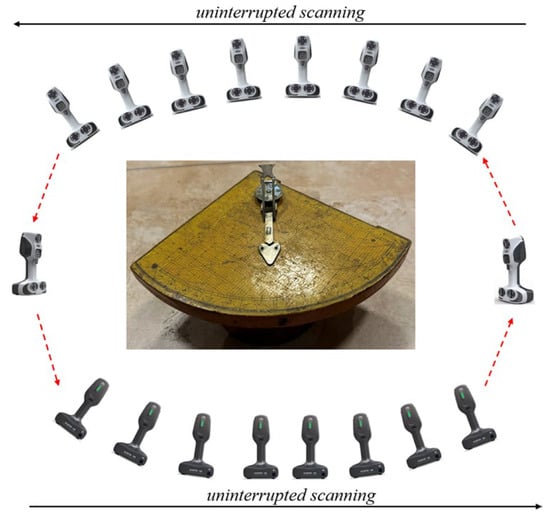
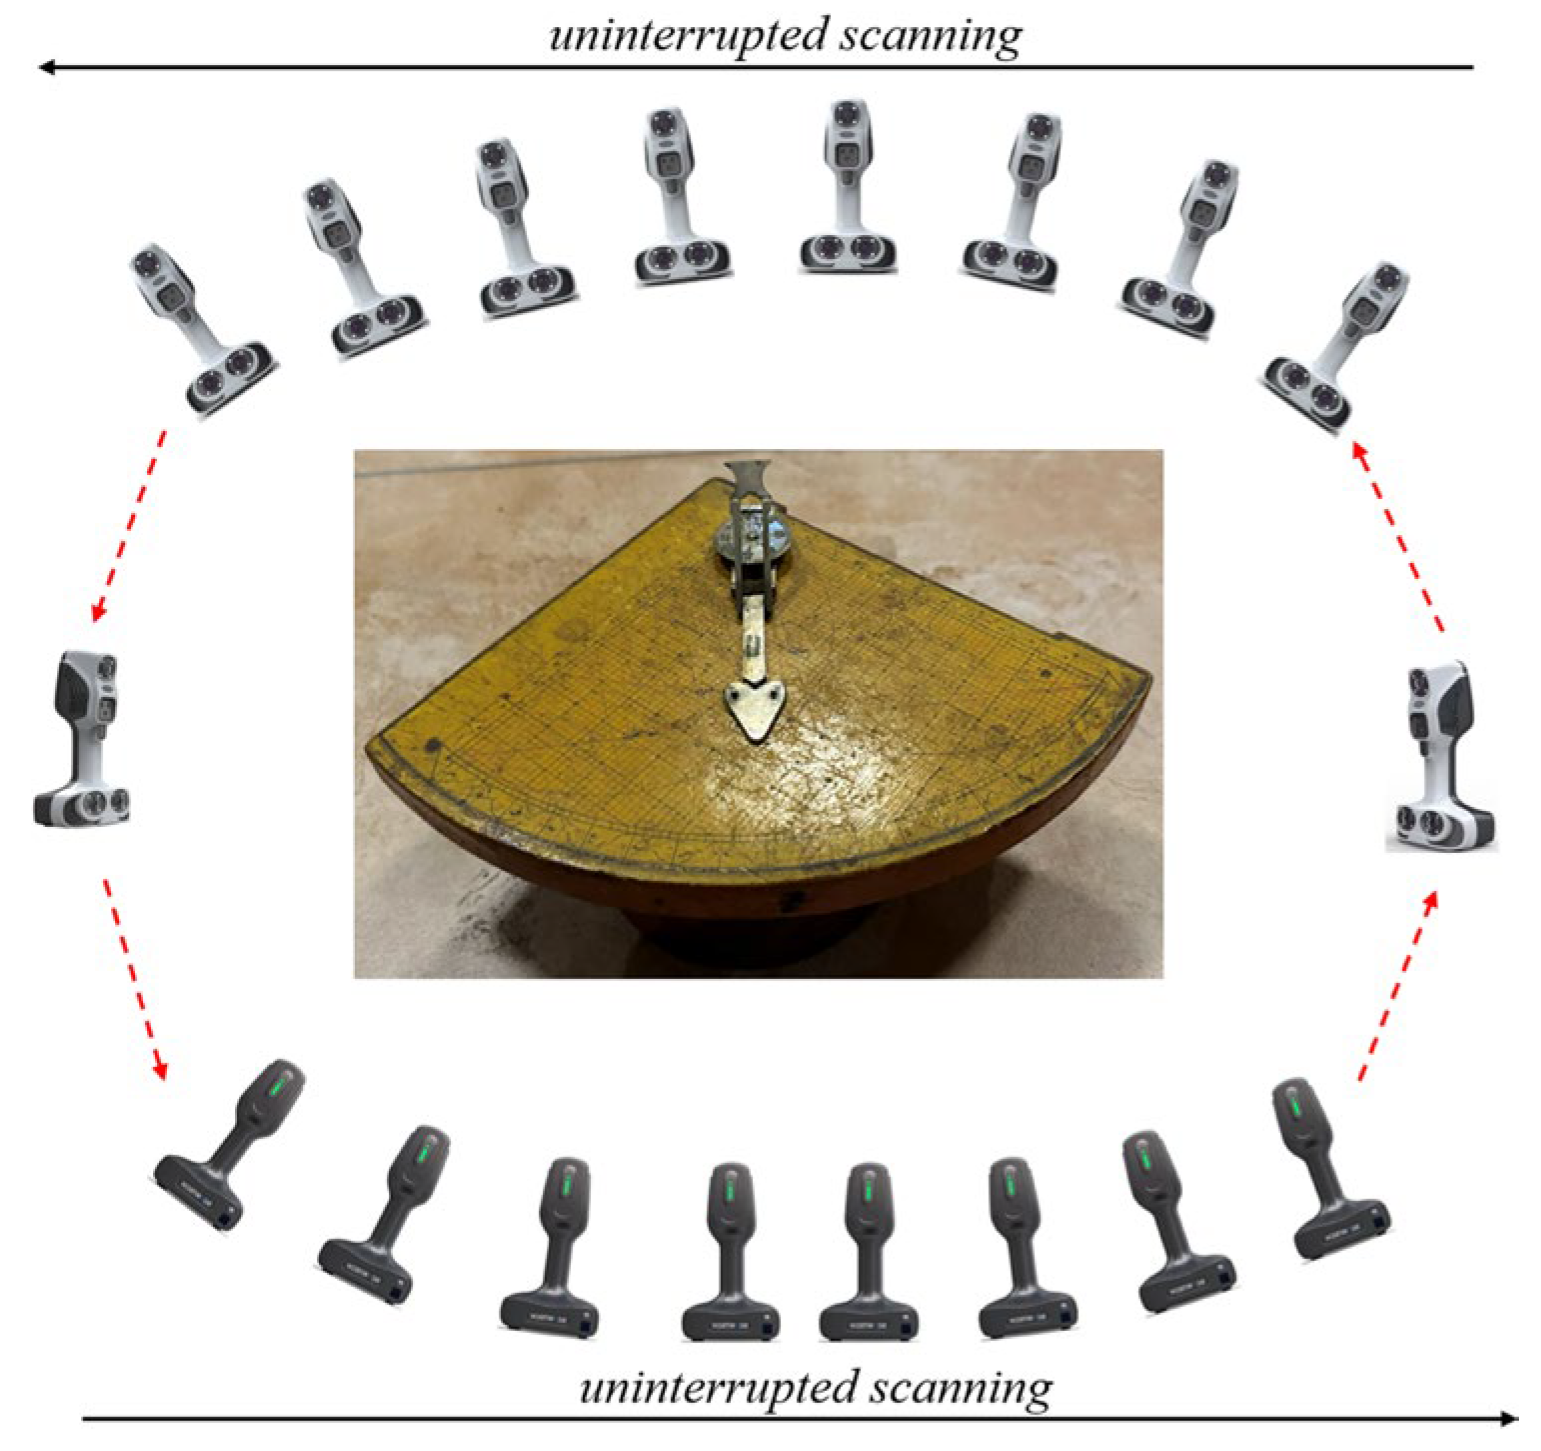
Before data acquisition with the Scantech iReal 2E, the device was calibrated. The calibration process was completed by the scanner detecting coded points from different angles on a calibration object with a specific pattern. Afterwards, the scanning process was carried out by rotating around the object as illustrated in Figure 5. At this point, the fundamental difference between SLS and photogrammetric techniques in data acquisition is that a point cloud is obtained directly. Therefore, because it contains no derivation errors, data with high metric accuracy are collected. Furthermore, no object, such as a test area, is needed to scale the 3D model. The parameters set before the scan are presented in Table 3. With the Scantech iReal 2E, it was possible to produce data at higher resolutions (e.g., 0.2 mm or 0.5 mm). However, since data collection is integrated with the software on the computer, the feasibility of the resolution value also depends on the computer’s capacity. Because interruptions/discontinuities occurred when acquiring data at higher resolutions, the highest feasible resolution of 0.7 mm were implemented.
Figure 5.
Continuous scanning around the artifact.
Table 3.
SLS parameters.
3. Results and Discussion
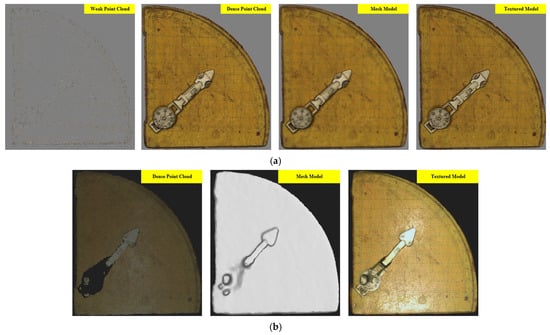
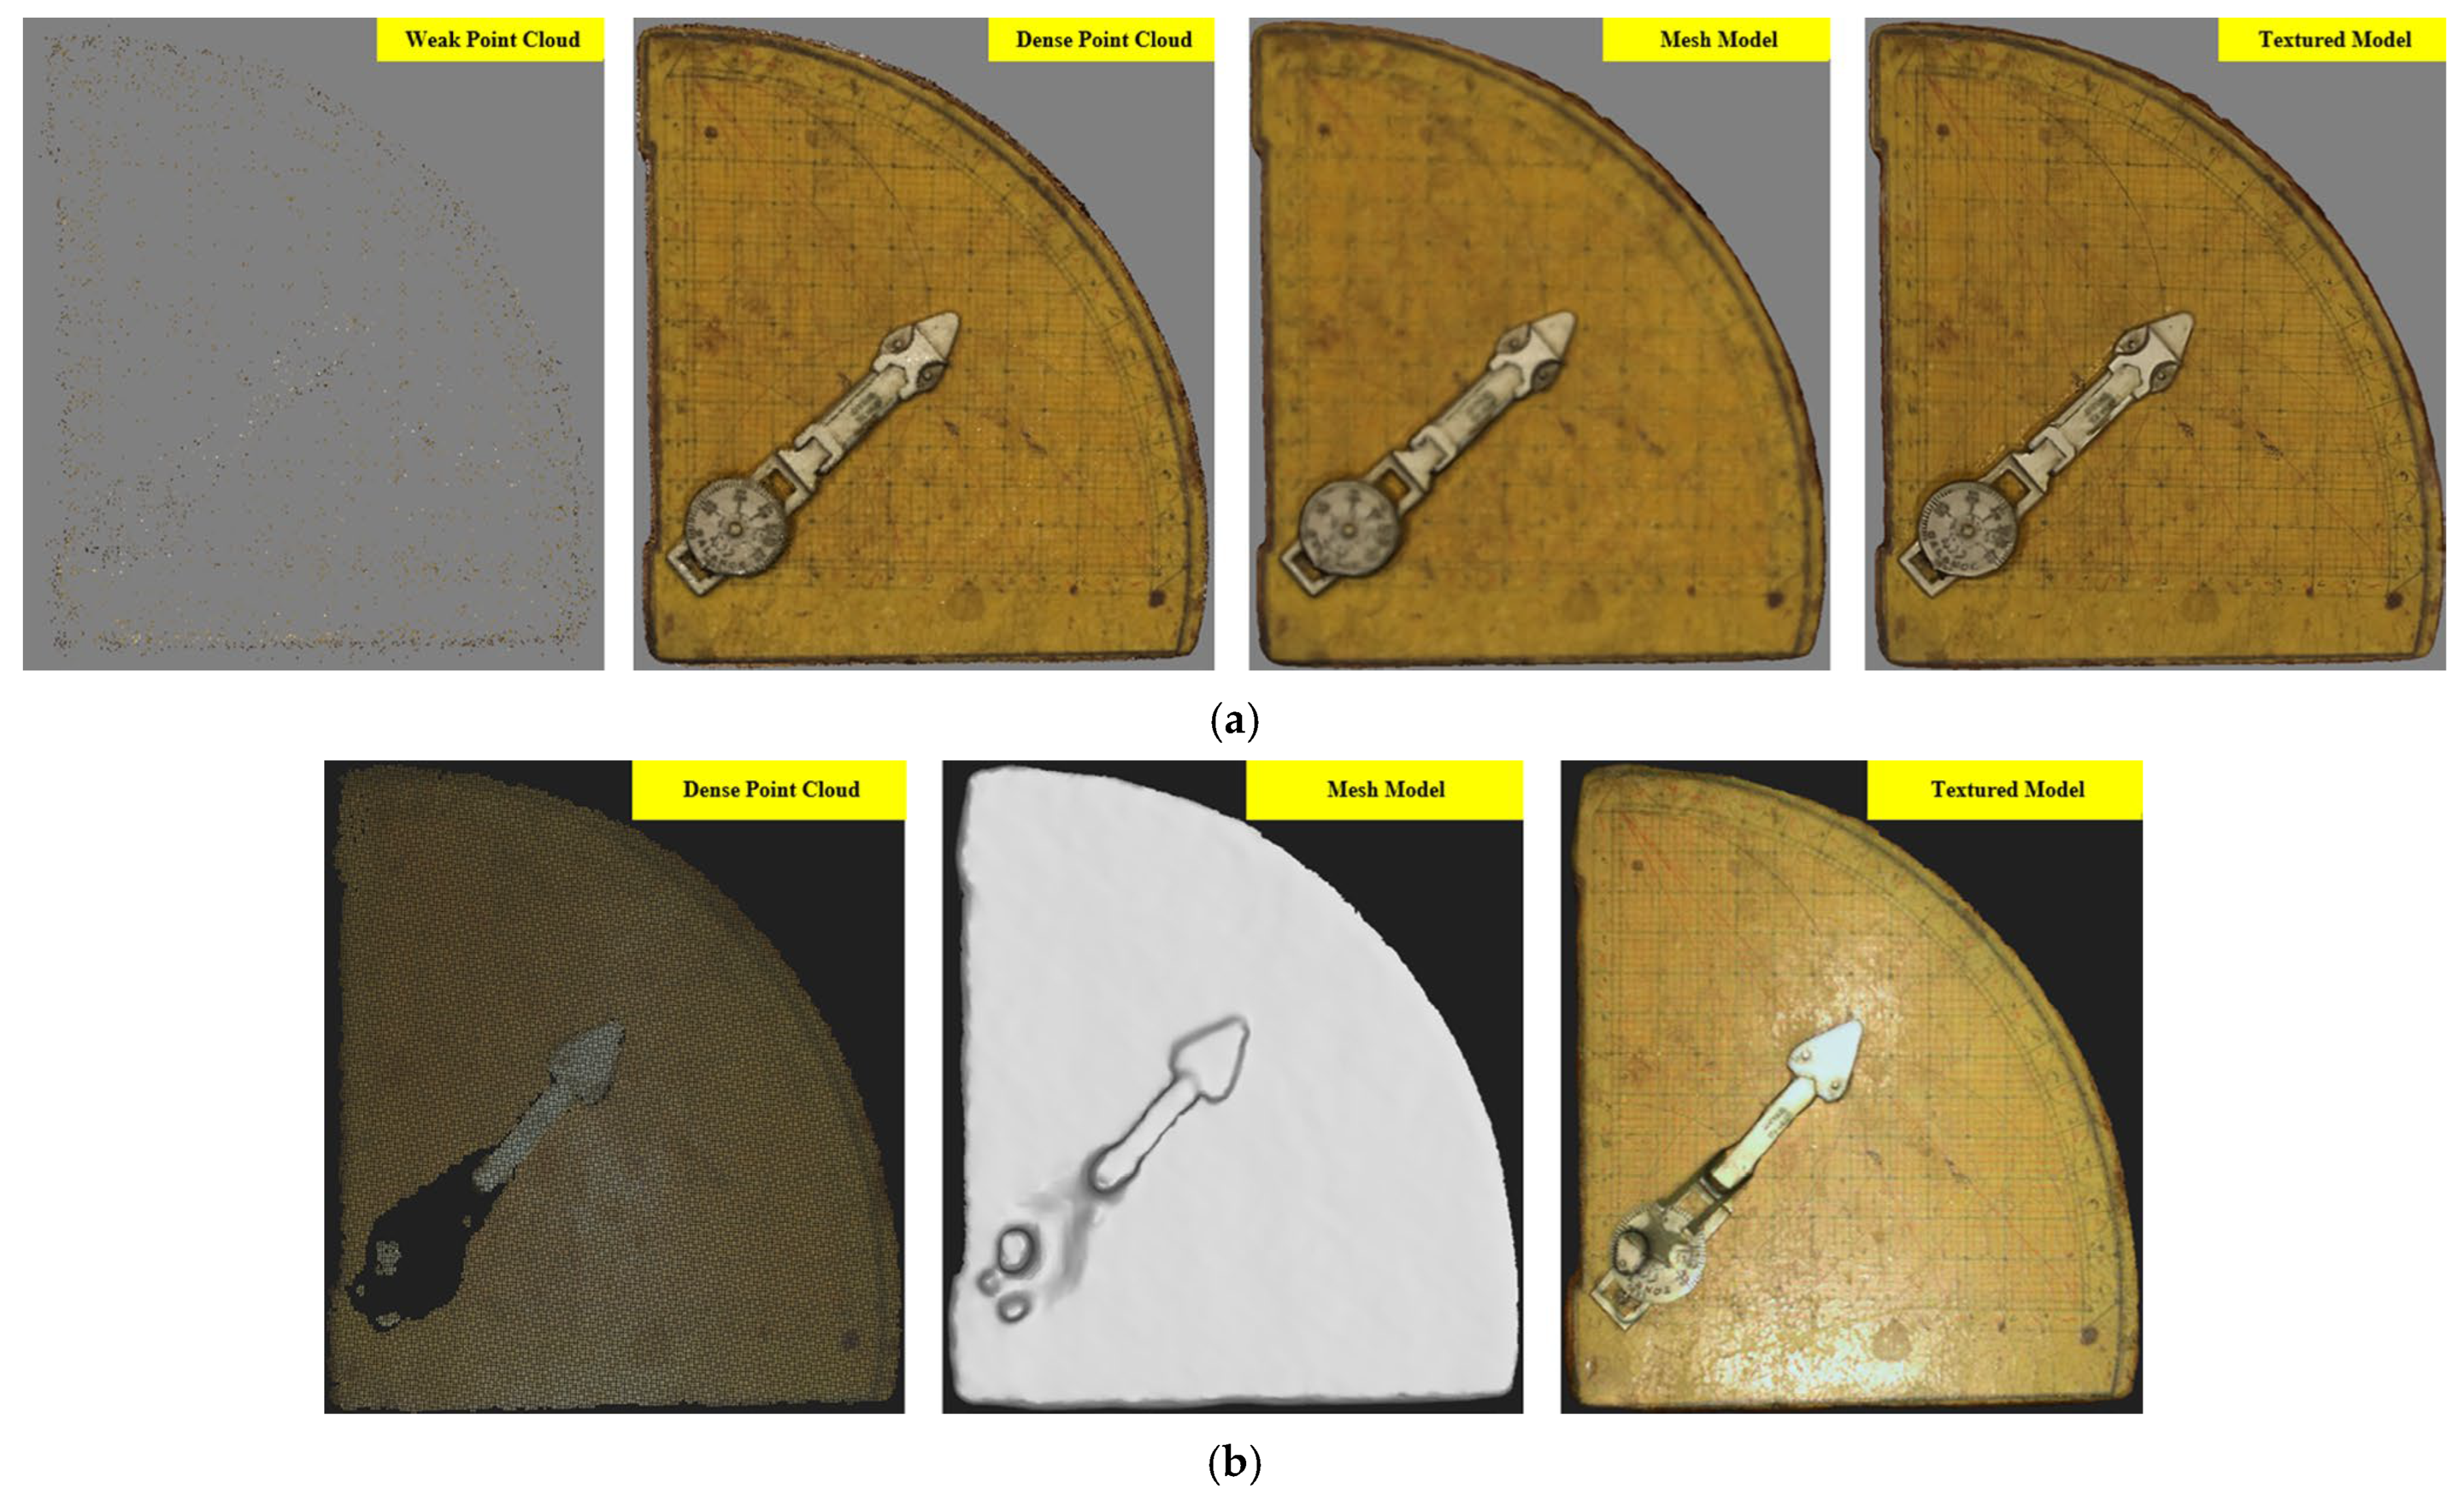
Data collected using photogrammetric techniques were evaluated in Agisoft Photoscan 2.3.0, which is the software most often preferred for producing 3D models in VMs [15]. Data collected using SLS were evaluated in iReal 3D software. Point clouds obtained with both techniques were also evaluated in the analyses using Cloud Compare 2.13.2 and Python 3.9.21. In photogrammetry, a point cloud was derived from the photographs. Solid and texture models were then generated from the derived point cloud and scaled using a 3D test area. The processes performed on the point cloud in SLS were the same. However, the basic point cloud is obtained directly, not derived. Furthermore, there is no need for external scaling because the point cloud obtained by SLS had accurate and precise metric information. The 3D models obtained using both techniques were compared in terms of quality and quantity. Additionally, the efficiency of the techniques was evaluated in terms of time and cost. These evaluations were conducted in the context of applications performed in a museum environment and those likely to be carried out under similar conditions, rather than specifically for the planned workspace. The pipeline for both techniques is visually presented in Figure 6.
Figure 6.
Data processing steps: (a) Photogrammetry; (b) SLS.
3.1. Qualitative Assessment
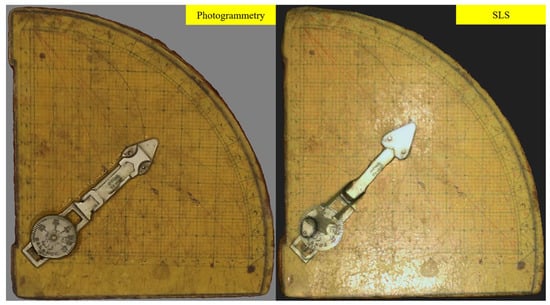
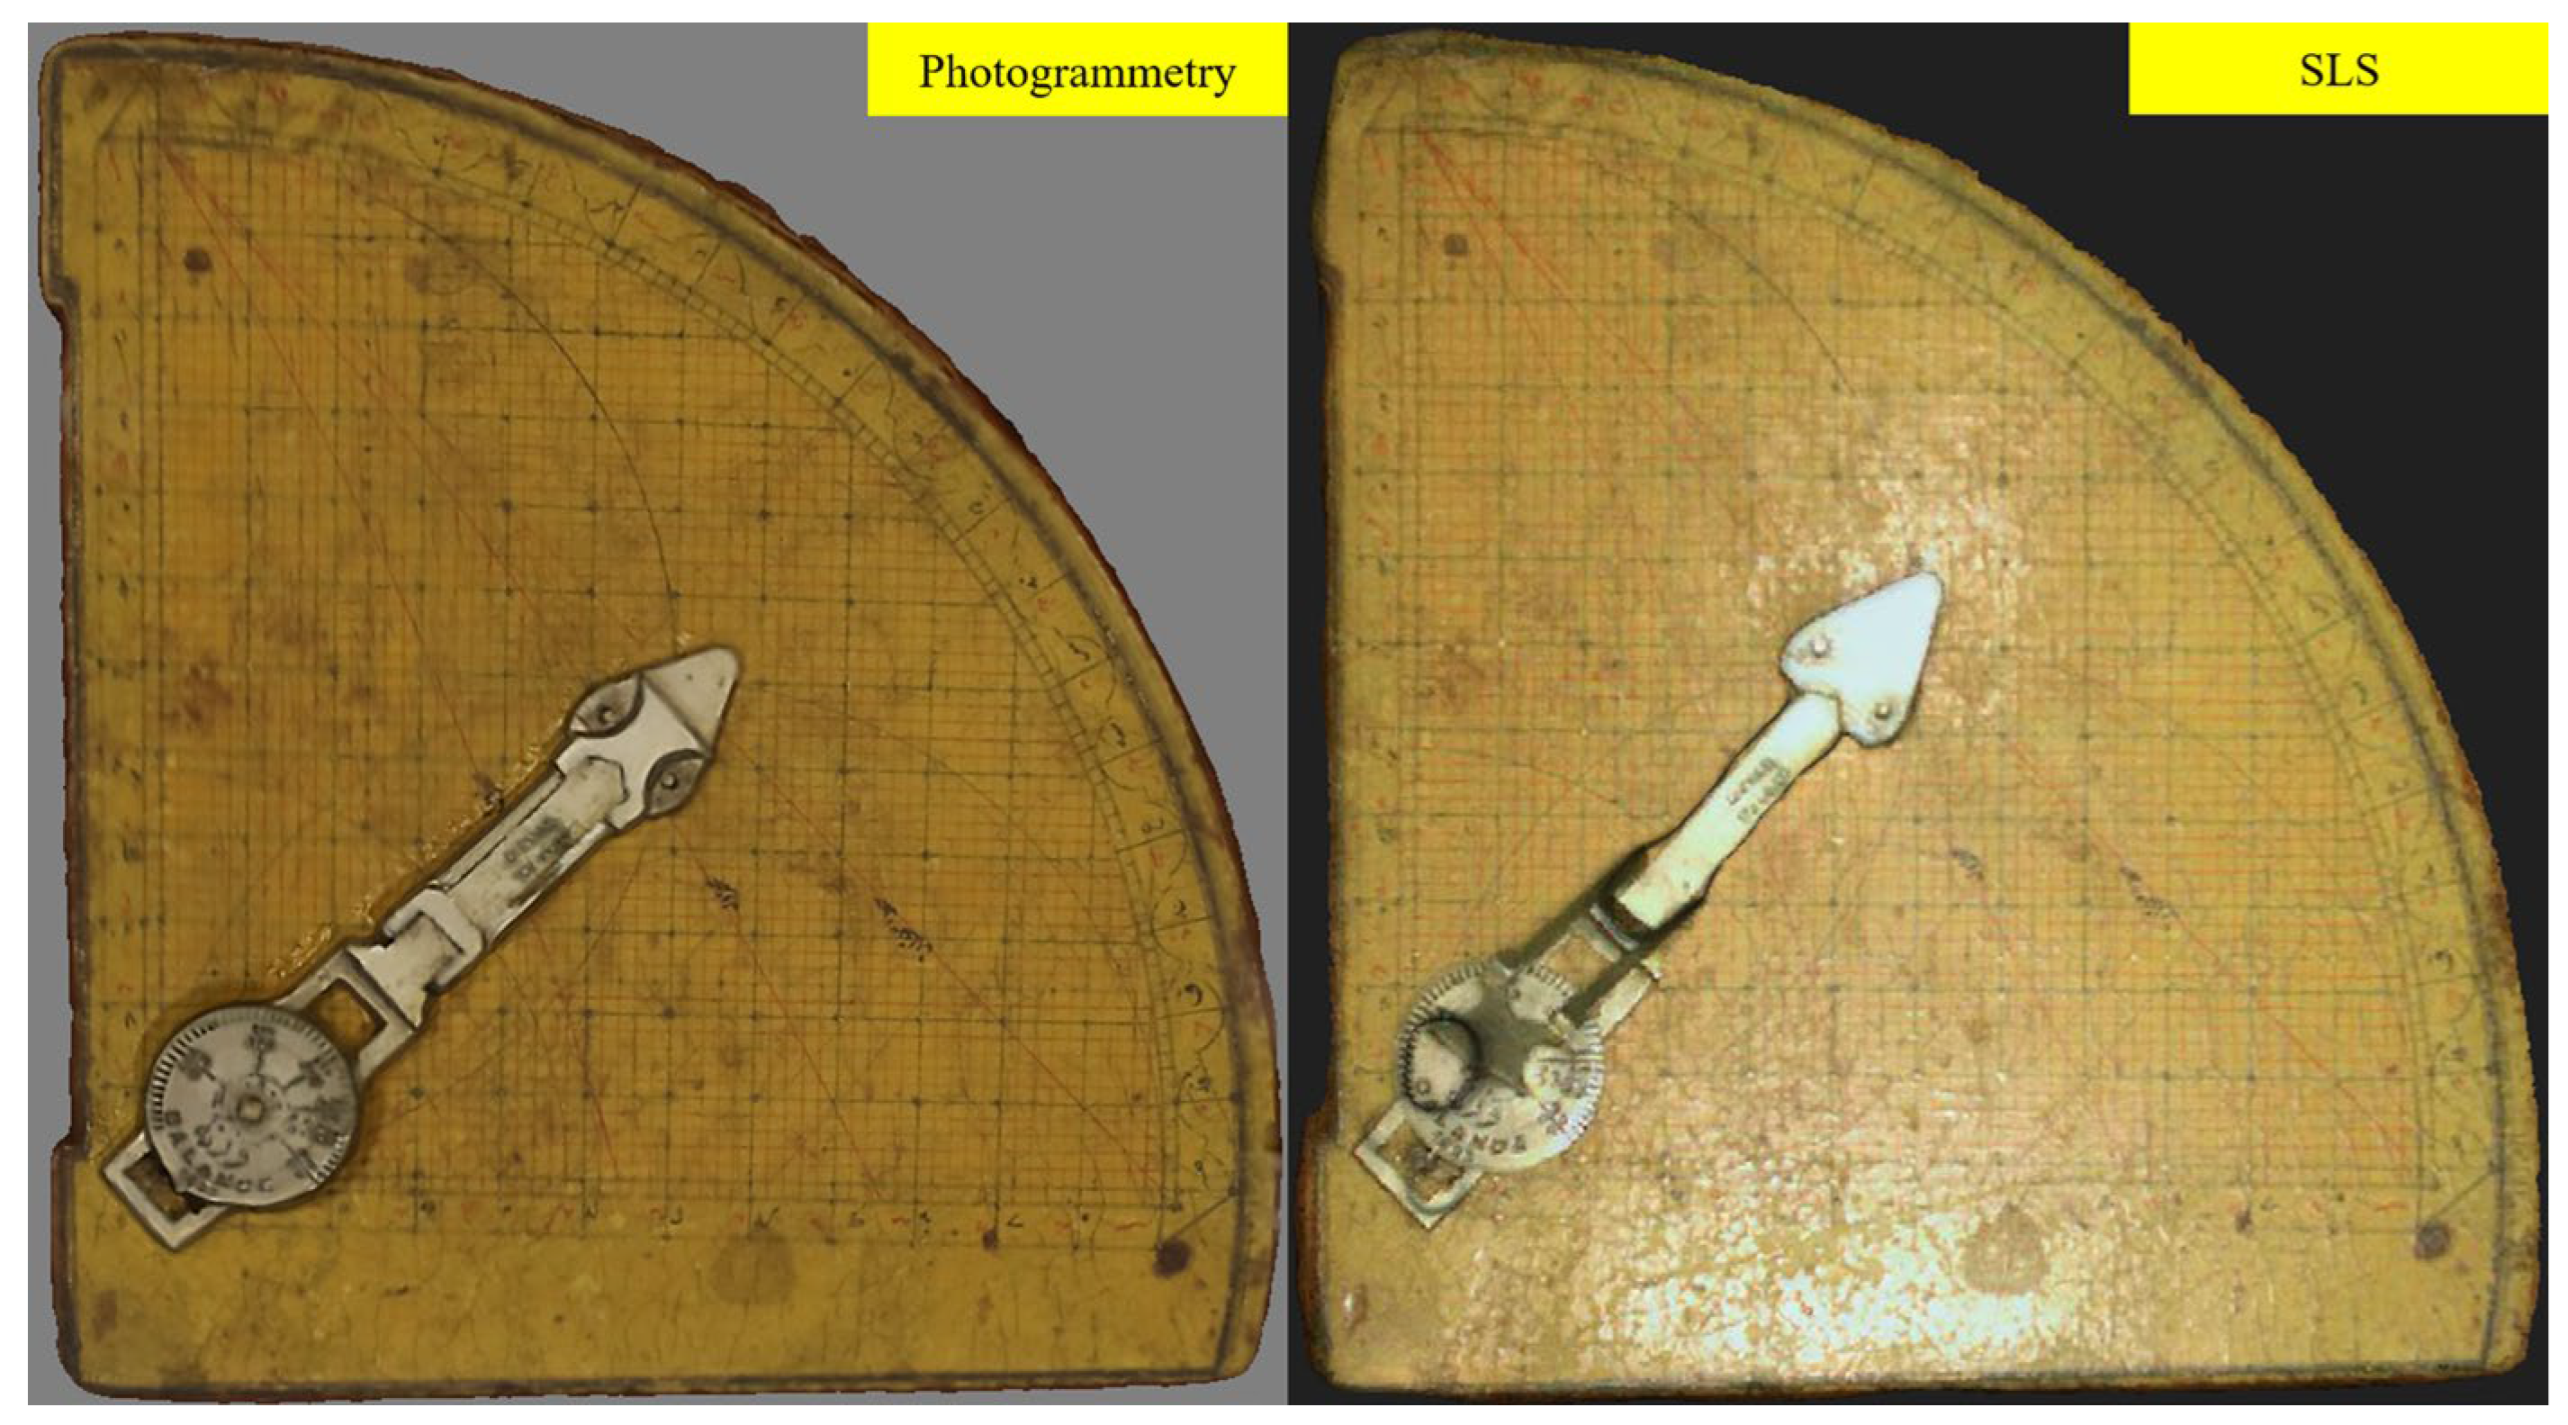
Qualitative comparisons of 3D sine quadrant models obtained using photogrammetry and SLS techniques are based on visual interpretation. The modeled object contains numerous textual motifs, as well as dense linear and point details. The secant segment on the artifact also contains various inscriptions. The data acquisition equipment used was taken into consideration in the visual comparison of the products. Furthermore, the potential variability of 3D models obtained using both techniques in cases of repeated data collection was examined. Similarities and differences with the literature were discussed depending on the environmental conditions in which the required data was collected. 3D artifact models produced by both techniques are presented side-by-side in Figure 7.
Figure 7.
3D models of the sine quadrant.
When the 3D models are examined as a whole, the model produced using the photogrammetric technique is seen to have better clarity. The photogrammetric model is significantly higher quality in terms of color saturation and the distinguishability of details.
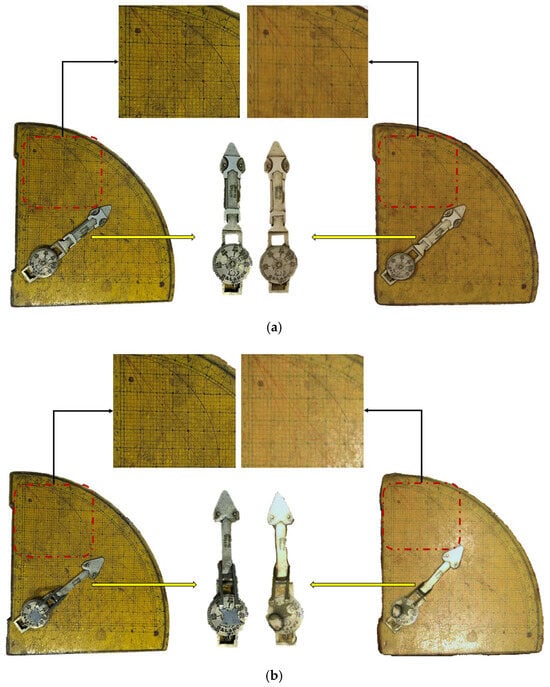
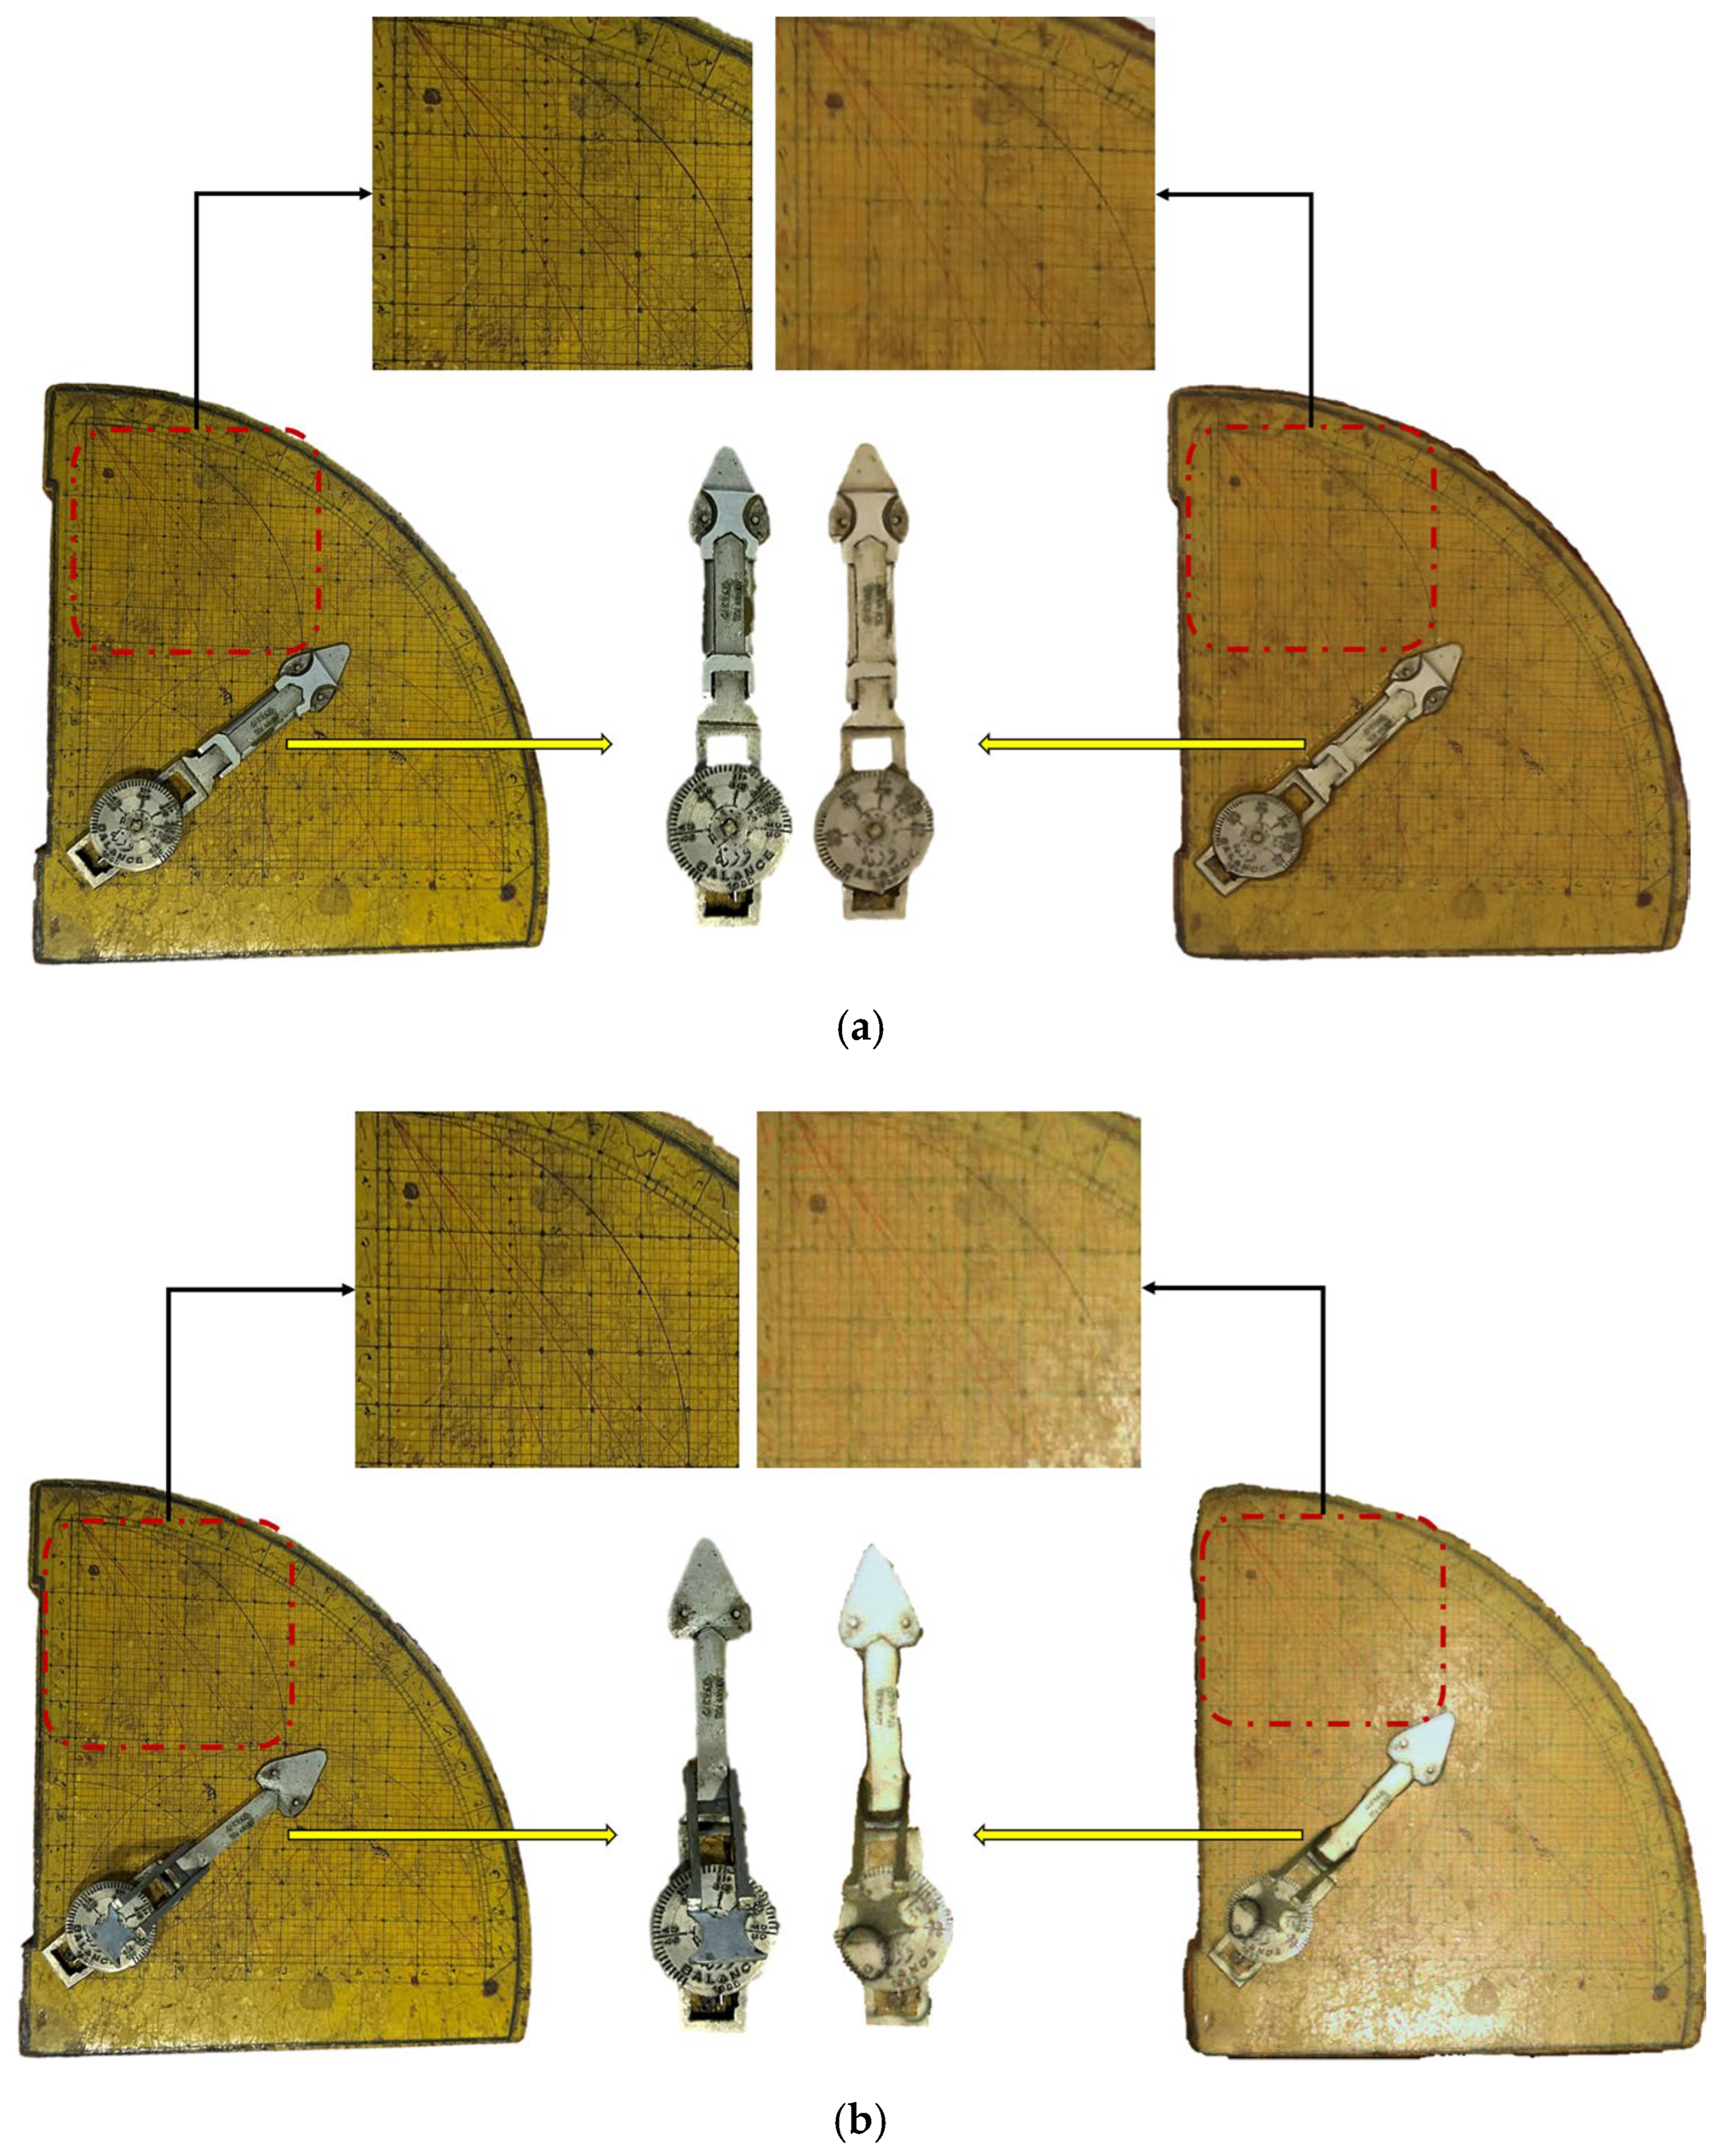
Figure 8 focused on a section with a high concentration of fine details of different types, as well as the secant and its surroundings. The left side of the image represents a single photograph, while the right side represents a 3D model. Point and linear details on the artifact were much more pronounced in the photogrammetric model. This clarity made the cells of the sine quadrant more distinct.
Figure 8.
Detailed examination of the edge and writing details: (a) Photogrammetry; (b) SLS.
When the secant segment is considered alone, it was evident that the photogrammetric model reflects edge details considerably better. It should be noted at this point that the secant was closed in the photogrammetric model, while it was open in the SLS-based model. This situation is not thought to affect the objectivity of the comparison. Because in the SLS-based model, the linearity in the remaining part after the secant is open was not as straight as in photogrammetry. In fact, the visual evaluation of the SLS-based model was performed with a photograph showing the secant in the open position as demonstrated in Figure 8b. Given the inscriptions on the small circle on the secant, it was evident that the photogrammetric model offers better interpretability.
The results of the qualitative evaluation contradict study [20], which stated that SLS qualitatively reflected the object better due to the number of points per unit, and study [24], which stated that there was no significant difference between the methods in the visual quality of small objects. However, the superiority of the photogrammetry-based model over SLS in terms of visual quality is evident in studies [37,38] as in this study.
There are several possible reasons for these similarities and differences. One of these is the data acquisition hardware used in the photogrammetric workflow. Using a 50 mm focal length lens allowed the sine quadrant to occupy the majority of the frame within the photographic distance. As the focal length decreases, the area covered in the photograph increases. Low-budget cameras often have short focal lengths, which makes it difficult for the target object to be the primary focus area in the photograph. However, a 50 mm focal length allows for closer shooting than shorter focal lengths, which has improved the aforementioned visual quality. This point is highlighted in study number [26], which is stated that for photogrammetry to compete with SLS in terms of detail distinguishability, the photo acquisition distance must be short.
One reason for the difference in detail representation between the methods is that the data was collected in a museum environment. Unlike almost all of the literature [15,24], the data required for modeling was collected in an environment where lighting was not controlled. The responses of data acquisition equipment to the available conditions may therefore have differed from those in previous studies. When it comes to modeling hundreds of objects in a museum, it is impossible to completely transfer the HAs to a specific modeling area. Therefore, data collection under museum conditions is necessary. Study number [34], which is one of the rare studies in terms of data collection under museum conditions, found the SLS-based model to be more suitable in terms of quality, but textured models obtained with both techniques are not presented. In this context, this study provides more reliable results for realistic evaluation.
Another possible reason for the lower visual quality in SLS was the use of an integrated camera. While DSLR cameras used in photogrammetry have very high resolutions, the resolutions of cameras integrated into structured-light 3D scanners are generally low. Since high-resolution photographs captured in photogrammetry were used during the production of a textured model from the solid one, SLS may be insufficient at this point, a situation also mentioned by [33]. This is why a photogrammetric approach was used to convert a mesh model produced with SLS into a textured form [39,40]. Furthermore, research in [33] states that there may be deficiencies in the model’s appearance due to the reflection effect in SLS, which is evident in Figure 7 and Figure 8b. The object examined in this study was also quite different from those discussed in the aforementioned studies in terms of content and level of detail. Since a similar object was not 3D-modeled under museum conditions, it was quite normal and expected for the results to differ from those reported in the literature. Generally speaking, apart from the environment in which the data was collected, data acquisition equipment and the type of object were factors affecting the qualitative quality of the final product, as demonstrated by [22,33].
In terms of the equipment used, a separate evaluation is necessary for this specific study in order to maintain objectivity. Scantech iReal 2E is a budget-friendly device among structured-light 3D scanners on the market today. Its current scanning capability is lower than that of current 3D scanners. Besides its accuracy, its detail resolution is lower than that of newer generation devices [39,40,41]. Furthermore, while newer devices produce much sharper geometry using advanced scanning technologies, the infrared structured light in the iReal 2E provides limited data. Considering previous studies, the qualitative quality of the model obtained with SLS in this study is not surprising. Similar quality 3D models have been produced in studies using iReal 2E or equivalent devices [33,37,38]. Considering these factors, it is clear that a sine quadrant model to be produced with a newer generation device would reveal more distinct linear details in SLS.
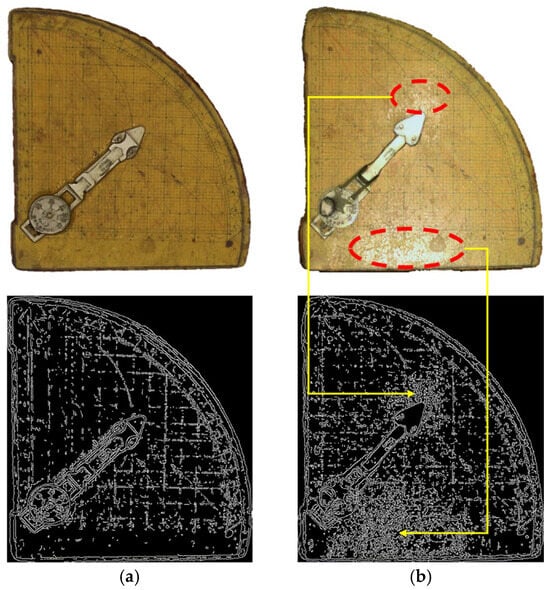
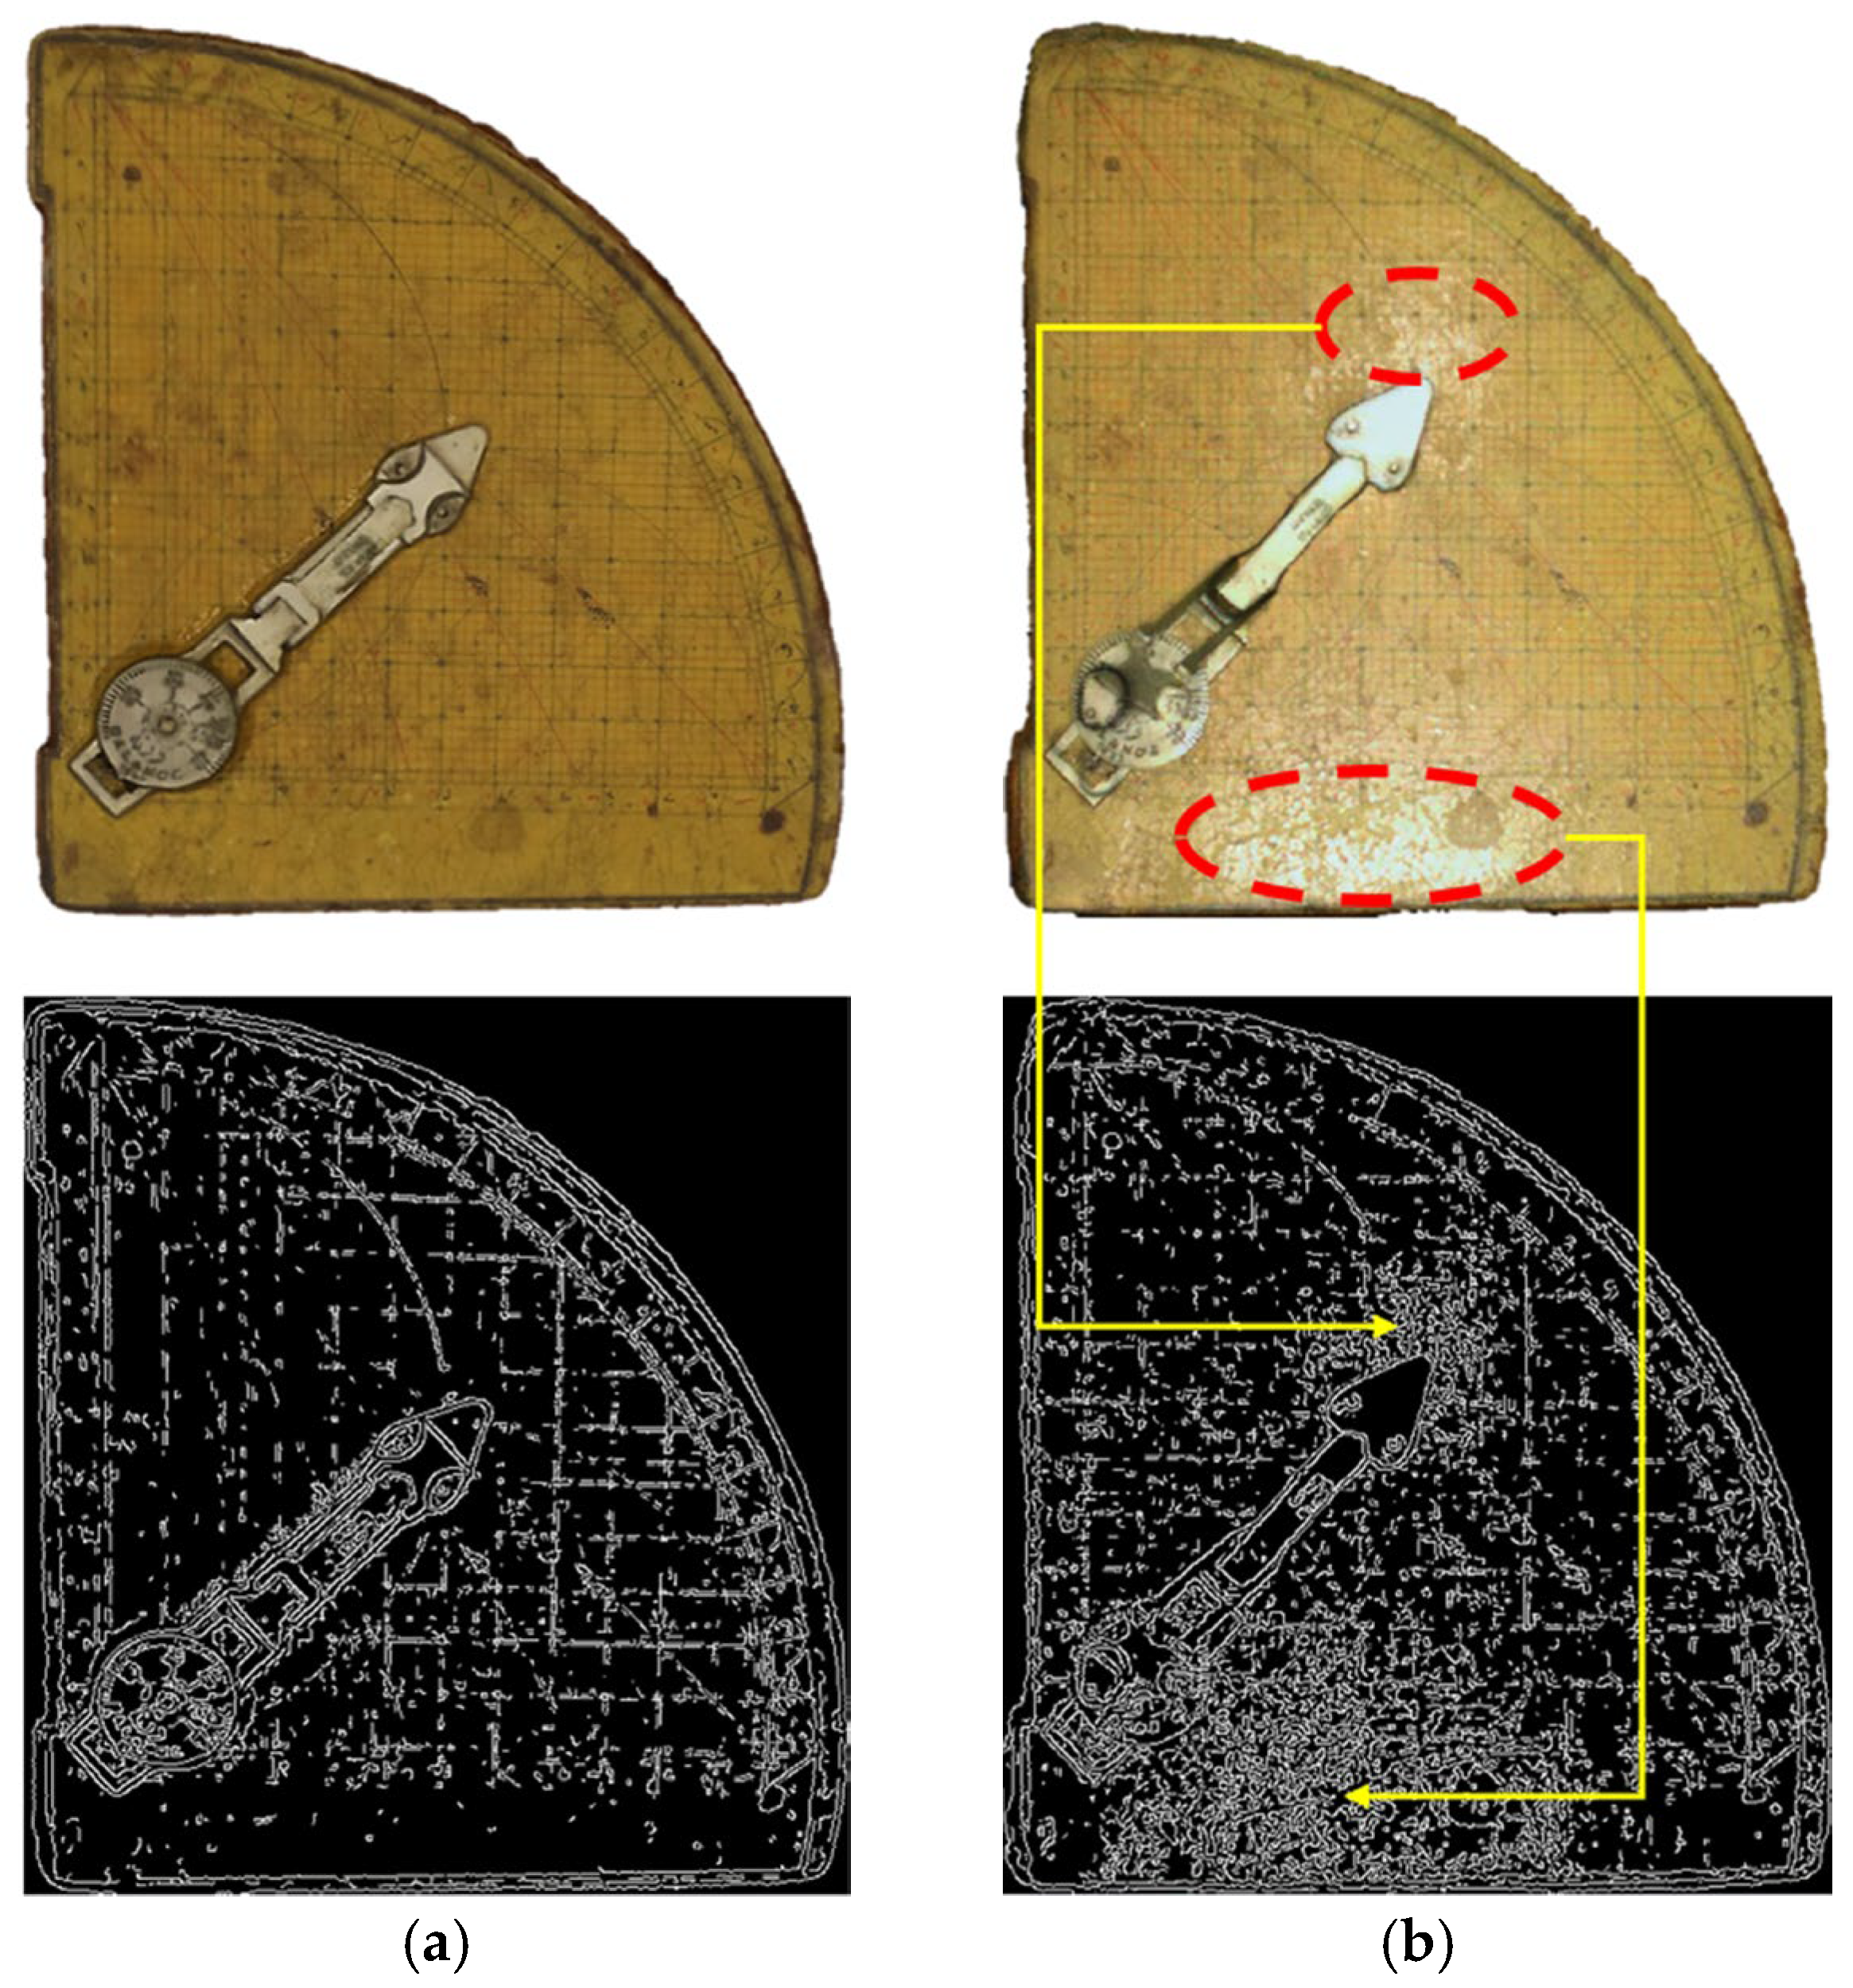
In the qualitative analysis, visual interpretations were supported by edge detection. For this purpose, the Canny algorithm [42] was used. Although Canny is an older algorithm, it remains a fundamental algorithm with improved versions being proposed today [43]. Canny was chosen because of its ease of application and its suitability for the purpose of this study. It was thought that more distinct edge detection could be achieved with a higher-quality model. For images converted to grayscale, a value of 75 was used for a low threshold and 100 for a high threshold.
When the comparative results are examined in Figure 9, it is seen that more distinct edges were achieved on the model obtained with the photogrammetric technique. For the model obtained with SLS, combinations performed with different parameters did not yield significantly different results. This situation reveals that better texture information improves to the detection of linear details in the final product. Additionally, the areas where the reflection effect is prominent in the model obtained by SLS are the same areas that appear complex in edge detection. Therefore, the reflection effect stands out as a significant negative factor not only for the visual assessment but also for the user who will be extracting details from the artifact.
Figure 9.
Canny results: (a) Photogrammetry; (b) SLS.
3.2. Quantitative Assessment
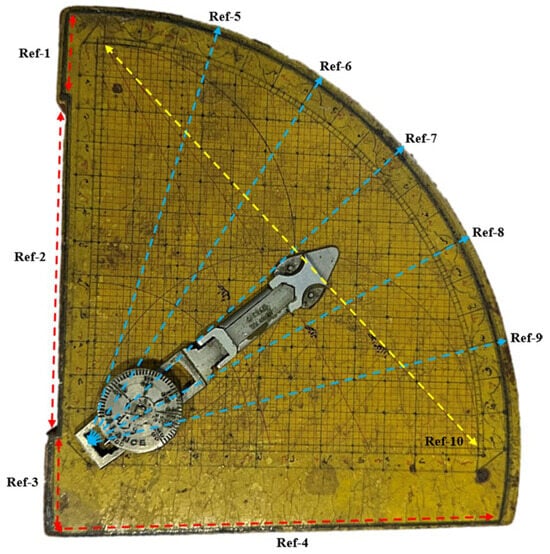
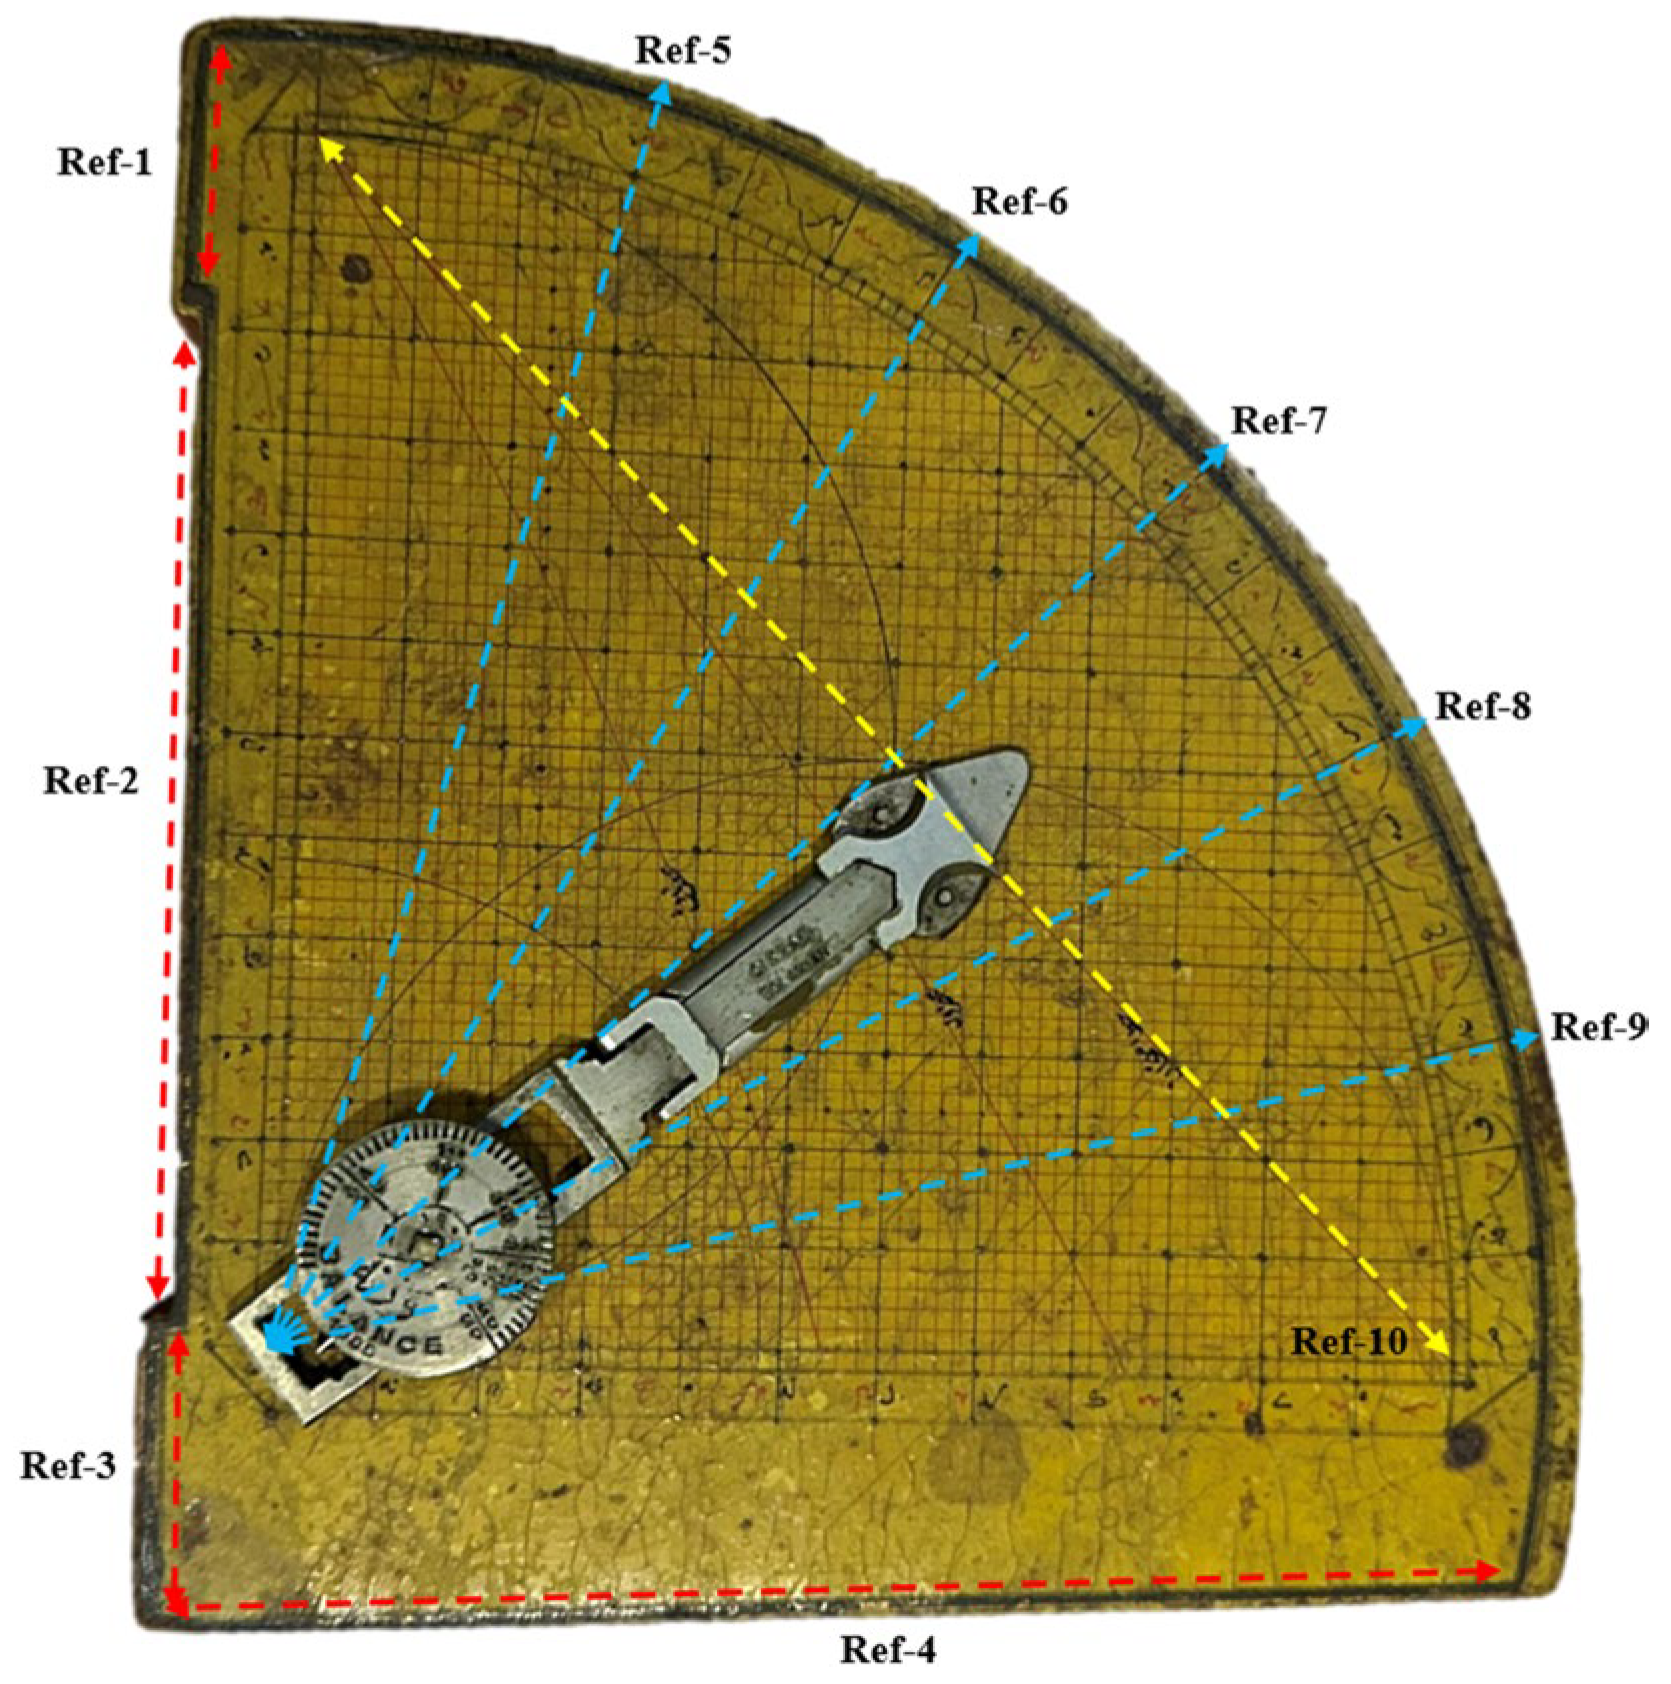
Quantitative evaluation of 3D sine quadrant models produced using photogrammetric and SLS techniques was performed by comparing length measurements taken on the object with the values in the model. Comparing physical measurements of an object with values measured on a 3D model is a routinely used approach in researching digitization techniques [41]. Reference distance values were obtained from the regions presented in Figure 10 using a ruler during the data collection phase. Since a small number of measurements in a limited area would not adequately reflect the accuracy of the entire surface, values of varying lengths were considered from different regions.
Figure 10.
Length measurements on the artifact for metric comparison.
Reference distance values were compared with the values measured on the models. The difference values calculated based on the reference values are presented in Table 4. Distance values obtained by SLS were closer to reference values than those obtained by photogrammetry. These results were similar to studies in the literature [15,17,33], indicating that SLS provides higher spatial accuracy. The maximum distance difference in SLS was 0.27 cm, while this value was 0.40 cm in photogrammetry. For the differences obtained depending on 10 length values, the average value was 0.10 cm in SLS and 0.24 cm in photogrammetry. Based on these values, the root mean squared error was calculated as 0.26 cm and 0.13 cm for photogrammetry and SLS, respectively. These differences were consistent with the results obtained [33]. However, the distance differences between photogrammetry and SLS on the same reference lines were not significant [20,21,22,26,28].
Table 4.
Length measurements and difference values (cm).
In this context, it can be said that the 3D models of the sine quadrant obtained with both techniques are sufficient in terms of metric accuracy. When evaluated in the context of exhibition in a VM, the metric differences between the two techniques are too small to be significant for the user.
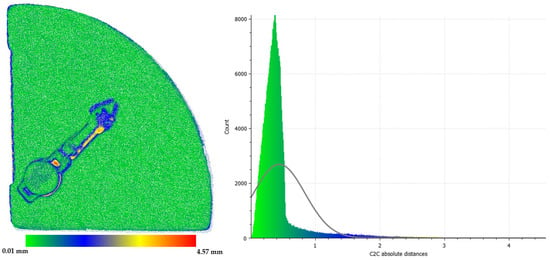
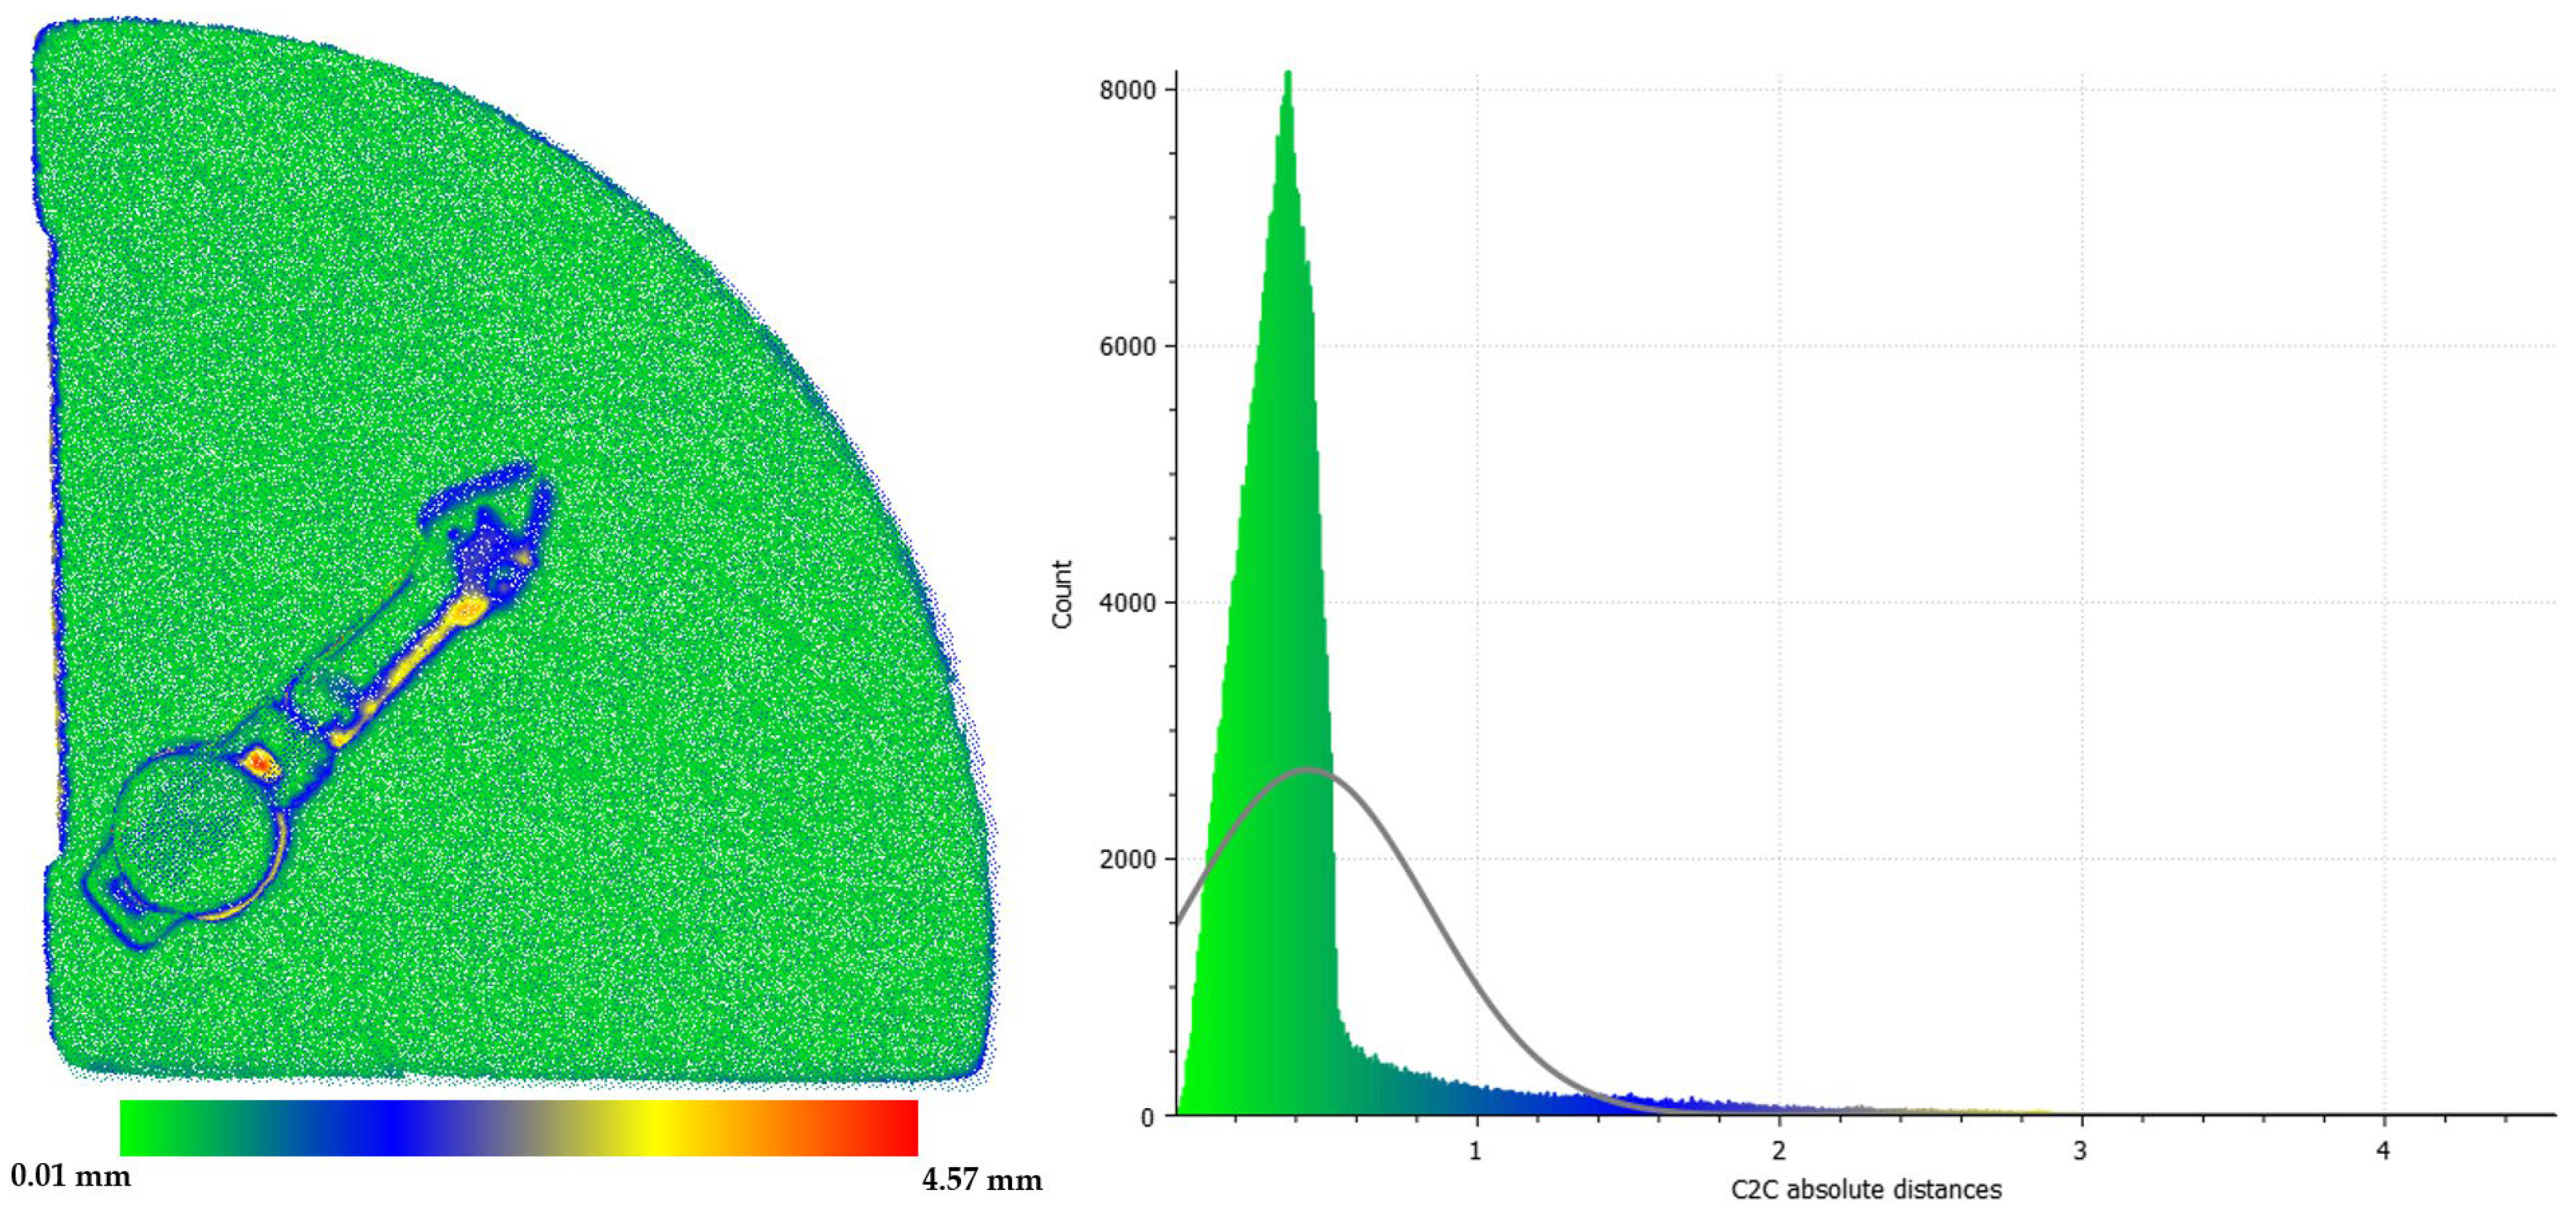
Another method used to compare point clouds produced with different techniques is cloud-to-cloud distance (C2C) analysis. This analysis provides a comprehensive comparison between all points representing the surface. In this context, the SLS-based point cloud was accepted as a reference. The photogrammetric point cloud was registered using 3 common control points according to this dataset. In this step, a rough geometric fit was achieved between the two datasets. To increase the accuracy of the alignment and ensure a high degree of overlap, the Iterative Closest Point (ICP) algorithm was applied to the registered point clouds. Thus, the closest points between the two-point clouds were iteratively matched. A high-accuracy overlap was achieved by minimizing the transformation parameters. After ICP, C2C analysis was applied to quantitatively evaluate the geometric differences between the two-point clouds. In this analysis, the closest distance of each point in the photogrammetric point cloud to the reference SLS-based point cloud was calculated, and the consistency and accuracy level between the two datasets were statistically analyzed using the obtained distance values. The surface difference map and histogram obtained based on C2C were presented in Figure 11.
Figure 11.
Surface difference map and histogram of C2C values.
Considering the C2C values, the minimum value was calculated as 0.012 mm, while the maximum value was 4.566 mm. The average distance between the two-point clouds was calculated as 0.442 mm, and the standard deviation as 0.399 mm. These values are consistent with the studies [34,37,38], which conducted similar comparisons. Although Cloud Compare allows for scale adjustment both during the initial registration and the subsequent ICP step, these values demonstrate the suitability of the scaling approach applied in the photogrammetric technique. When the surface difference map is examined, it was seen that the differences were concentrated in the outer edge parts and secant boundaries of the object. At this point, the histogram obtained based on the C2C values is decisive in terms of quantitative evaluation. When the results of the C2C distance analysis are evaluated under the assumption of Gaussian Distribution, the calculated average and standard deviation values quantitatively express the geometric agreement between the two-point clouds. The average value (0.442113) shows the average distance of the points in the photogrammetric point cloud to the reference SLS point cloud. This value indicates that the systematic difference or mean deviation between the datasets was approximately 0.44 mm. While a mean value close to zero represents an ideal match, a value of 0.44 indicates a certain level of, but negligible, geometric difference between the two datasets. The standard deviation (0.399072) represents the spread of the distance values around the mean. A standard deviation of approximately 0.40 mm revealed that a significant portion of the points show a relatively limited distribution around the mean, indicating that the error distribution was not very wide. This suggests that the applied ICP-based process provided a reasonable agreement between the two datasets, and that certain differences arising from the measurement method, data density, or surface characteristics were not significant.
3.3. Outlier Detection Analysis
Statistical Outlier Removal (SOR) is a technique that enables the statistical identification of points in a point cloud that are noisy or anomalous [44]. It is independent of the technique used to obtain the point cloud and is used to obtain a cleaner dataset. Its basic principle is based on the distance of a point from its surroundings. A point with an anomalous distance from its surroundings is considered an outlier. For each point in the point cloud, the average distance to the nearest neighbor is calculated. The statistical distribution of these calculated distance values is then derived. Points at the extremes of the distribution are categorized as outliers and eliminated, resulting in a clearer dataset [45]. It can be used with datasets containing numerous points across large areas, such as aerial lidar [46], as well as for the small objects included in this study.
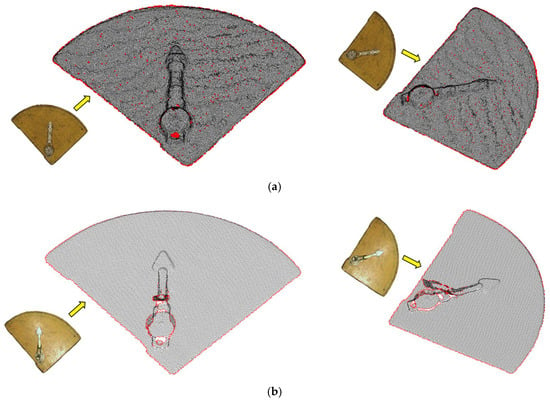
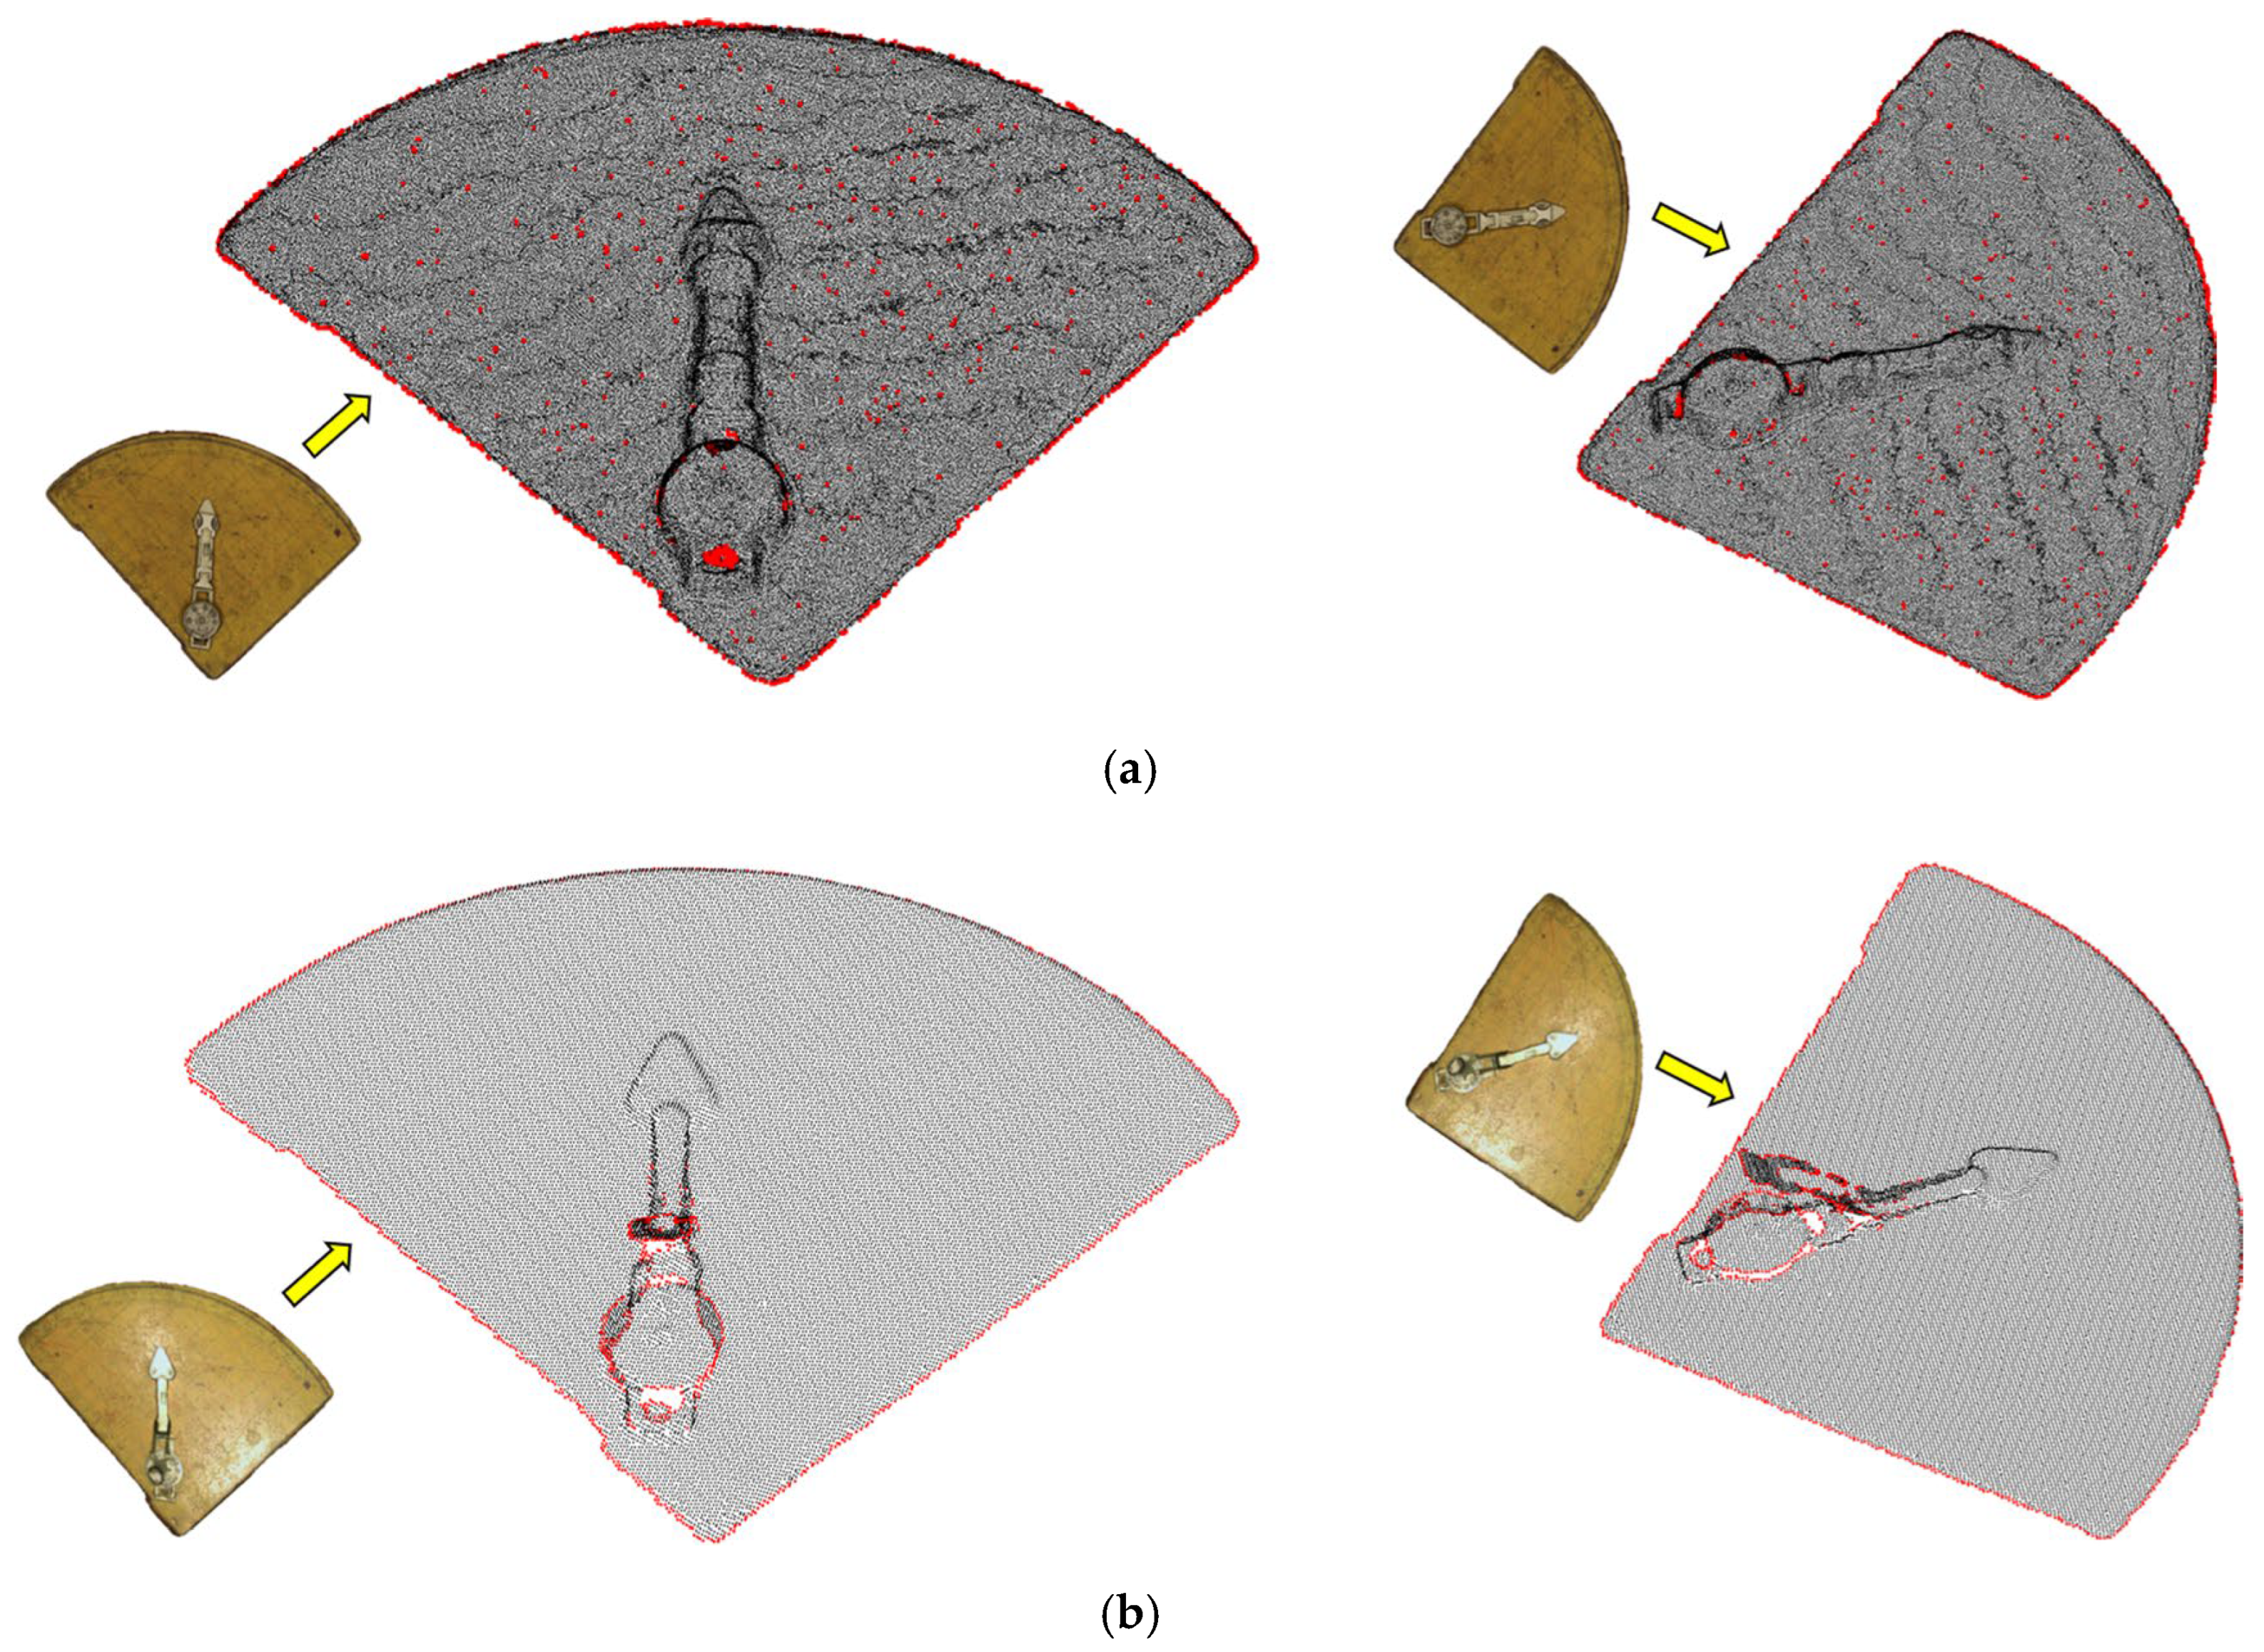
The Open3D library in Python was used for SOR. For each point cloud obtained using each technique, the number of neighbors parameter was set to 20 and the standard deviation multiplier to 2. The distributions on the object were examined by overlaying the outliers with the remaining clean point cloud. The red dots represent the outliers, their distributions are presented in Figure 12, and the statistical values are shown in Table 5.
Figure 12.
Outliers on the point cloud: (a) Photogrammetry; (b) SLS.
Table 5.
Number of points which are outlier and clean.
Figure 12 shows that outliers exhibit a general distribution across the photogrammetric point cloud. Except for the outer edges of the artifact, outliers are found on the secant and top surface. Although the total number of outliers is similar to that in SLS, their visual prominence is greater. This indicates that the smooth top surface, without any removal, appears rougher in the photogrammetric model compared to SLS.
In SLS, no outliers are detected on the artifact’s upper surface. As with the photogrammetric point cloud, outliers are present on the outer edge of the artifact. Although outliers are found on the secant, this may be due to the secant being in an open position during SLS. Since the outlier character becomes more pronounced as the distance of a point from its neighbors increases, points on the upper part of the secant may have remained at the edges of the distribution due to their distance from those on the ground. Therefore, the number of outliers in SLS is likely lower than indicated in Table 3. Considering these evaluations, it is clear that SLS, being a more user-independent technique than photogrammetry, provides a more homogeneous dataset.
Table 5 shows an approximately tenfold difference in the number of points across the point clouds. In this table, the photogrammetric point cloud is a dense point cloud obtained by densifying the weak point cloud. Although the literature states that SLS provides more points per unit, the opposite is true in this study. One possible reason for this is the use of both oblique and vertical photographs in photogrammetric data acquisition and the fact that data processing is performed at ultra settings. In terms of SLS, in addition to the adjustable distance limitation in the museum environment and resolution restriction due to hardware capability during scanning, the software loses its ability to produce a much more detailed point cloud. As previously mentioned, if it were possible to scan at a higher resolution (such as 0.2 mm) with a 3D scanner, the numerical values listed for SLS in Table 5 could be in the millions. However, it is not thought that a much denser point cloud in SLS will easily eliminate the disadvantage stemming from the camera resolution integrated into the scanner.
A significant factor influencing the number of points is the amount of data collected. It is evident that some studies with similar objectives obtained data containing millions of points. Photogrammetric methods, with hundreds of photographs, and SLS, with dozens of scans, offer the possibility of highly detailed data [24,26,41,47]. The important nuance here is the purpose for which the 3D model is produced. When it comes to presenting a HA in a VM via a 3D model, examining models containing a large number of polygons on online platforms with portable devices is not efficient [15]. For this reason, it may be necessary to achieve the goal with a more limited dataset, similar to this study [15,40]. In addition, regardless of the technique, it is seen that data collection time takes hours and data processing time takes days in studies using very high number of points [41], which is not preferable when it comes to 3D documentation of all objects in a museum to create a VM. Additionally, the dimensions of the digitized object are also a factor affecting the number of points [48]. A larger object will naturally contain many more points, depending on the number of photographs or scans taken. From this perspective, the data density obtained for the sine quadrant is consistent with reference number [49], where a better 3D scanner was used in an external environment where lighting is controlled for the HA in the museum.
3.4. Time and Cost Analysis
The evaluation of techniques in terms of time and cost was carried out considering the possibility of modeling other HAs objects in the museum environment within the scope of creating a VM. The entire process of obtaining a 3D model primarily involves data collection and data processing stages. In photogrammetric techniques, data collection was performed with a DSLR camera, while in SLS, it was performed with a handheld 3D scanner. Considering the sine quadrant object, taking photographs took longer than SLS. The need to take photographs from different angles, the necessity of a certain degree of overlap between successive photographs, and the need to maintain a constant distance between the object and the camera during each photograph required more movement from the user. This increased the data collection time compared to SLS. Although SLS is said to be less efficient in terms of time for data acquisition [25], collecting data for the sine quadrant in SLS took a maximum of 15–20 s. However, considering the qualitative assessment of the 3D models, the longer time required for the data collection stage is not considered a reason to avoid the photogrammetric technique.
In SLS, the scanner was handheld and rotated around the object during the scanning process. The cable connections between the scanner and the computer, and the museum environment’s unsuitable conditions for moving equipment freely, made data collection in SLS difficult. If the object to be modeled is on a rotating turntable, the scanner will remain fixed, and scanning can be performed while the object rotates at a slow speed. This is because moving the object at a constant speed using a rotary table yields much better results than moving the data acquisition equipment [26,29,30]. In this case, the visual quality of the model obtained with SLS is highly likely to be better than what was achieved. If this equipment is used, the scanner’s time advantage will be significant when modeling a large number of objects in the museum environment. However, not every HAs in the museum is suitable for placement on a turntable. Therefore, under the current lighting conditions, it is still possible for texture loss due to reflection effects to occur in the SLS.
Another time-related issue is data processing. As with data collection, evaluating data obtained using photogrammetric techniques in Agisoft Photoscan software took much longer than with SLS. In 3D model production from photographs, unlike SLS, there is a process of matching the photographs to generate a weak point cloud, and then densifying this weak point cloud to produce a dense point cloud. While these processes are not present in SLS, photogrammetric techniques require operating at ultra-high settings to produce high-quality models in both quantitative and qualitative terms. This situation causes the model production process, which takes approximately 5 min from start to finish with SLS, to take at least 2 h with photogrammetric techniques. Given the large number of HAs in the museum, longer data processing times of photogrammetry are a drawback as in the [41]. This disadvantage of SLS will become apparent with large objects. The iReal3D software, which evaluates the data obtained with SLS, uses a very high amount of RAM on the computer. For example, when evaluating data obtained by scanning a sine quadrant at a closer distance and high resolution, the software crashes due to insufficient RAM. Considering other objects to be included in the VM, especially large objects, high-quality model production with SLS requires a computer with ultra-high capacity.
From a cost perspective, there are hardware and software costs involved. In terms of hardware, the handheld 3D scanner used in the project costs approximately twice as much as the camera used. However, for a more up-to-date scanner that will yield better results, this range is much wider. Many cameras which can be used in photogrammetric applications are available at much lower cost and can achieve similar results. From a software perspective, the Scantech iReal 2E hardware comes bundled with iReal3D software while in photogrammetry, hardware and software are independent of each other in this sense.
4. Conclusions
To our knowledge, a similar study of a sine quadrant object, not previously addressed in the literature, was conducted using photogrammetry and SLS techniques to create a 3D model. Furthermore, unlike previous studies, data collection for modeling purposes was conducted in a museum environment. The 3D models produced using both techniques serve as a reference for future VM creation projects that require modeling numerous objects in a museum environment. The resulting models were compared in detail with respect to quality, quantity, time, and cost. No significant quantitative difference was found between the techniques. Qualitatively, the photogrammetric approach yielded significantly higher quality results from a user perspective. In SLS, the insufficient resolution of the camera integrated into the scanner, along with reflection effects, was a factor that reduced the visual quality of the model. In photogrammetry, the significantly longer data acquisition time compared to SLS was the most significant disadvantage. A common solution to overcome these negative effects in both techniques is to position the HA on a turntable. Photographing the object, which moves at a low and constant speed, with a camera positioned at a fixed location will significantly reduce the time required for data acquisition. In SLS, this situation can reduce reflective effects to some extent. Generally speaking, the sine quadrant object, due to its detailed content, can serve as a reference in selecting techniques for 3D modeling other objects in museum conditions. Considering its user-friendly design in a VM, inability to efficiently handle high volumes of data, and the priority given to textural quality from the user’s perspective, the photogrammetric technique appears more appealing.
Author Contributions
Conceptualization, A.H.I. and D.Z.S.; methodology, A.H.I. and D.Z.S.; software, A.H.I.; writing—original draft preparation, A.H.I. and D.Z.S.; writing—review and editing, A.H.I. and D.Z.S.; supervision, D.Z.S. All authors have read and agreed to the published version of the manuscript.
Funding
This study is supported by the Scientific Research Project Fund of Tokat Gaziosmanpasa University under project number 2024/77.
Data Availability Statement
The study conducted at the museum was carried out in accordance with an ethical permission protocol signed by the authors and the Tokat Museum management. Accordingly, the use and sharing of the data, except for scientific research to be conducted by the authors, is prohibited.
Acknowledgments
The authors thank the staff of Tokat Museum Directorate for their support during the data collection phase.
Conflicts of Interest
The authors declare no conflicts of interest.
Abbreviations
The following abbreviations are used in this manuscript:
| 3D | 3 Dimensional |
| CH | Cultural Heritage |
| DSLR | Digital Single Lens Reflex |
| GCP | Ground Control Point |
| HA | Historical Artifact |
| SfM | Structure from Motion |
| SLS | Structured-Light Scanning |
| SOR | Statistical Outlier Removal |
| VM | Virtual Museum |
References
- Doni, M.; Fierascu, I.; Fierascu, R.C. Recent Developments in Materials Science for the Conservation and Restoration of Historic Artifacts. Appl. Sci. 2024, 14, 11363. [Google Scholar] [CrossRef] [Scilit]
- Ferrari, L. Emergency Response for Architectural Heritage in Seismic Areas: An Integrated Approach to Safety and Conservation. Heritage 2024, 7, 4678–4696. [Google Scholar] [CrossRef] [Scilit]
- Topçu, F.; Karademir, N. Keeping Memories Alive and Living Again An Evaluation on Nurdağı Open Air Earthquake Museum. J. Geogr. 2025, 50, 47–64. [Google Scholar] [CrossRef] [Scilit]
- Meier, C.; Berriel, I.S.; Nava, F.P. Creation of a Virtual Museum for the Dissemination of 3D Models of Historical Clothing. Sustainability 2021, 13, 12581. [Google Scholar] [CrossRef] [Scilit]
- Caciora, T.; Jubran, A.; Ilies, D.C.; Hodor, N.; Blaga, L.; Ilies, A.; Grama, V.; Sebesan, B.; Safarov, B.; Ilies, G.; et al. Digitization of the Built Cultural Heritage: An Integrated Methodology for Preservation and Accessibilization of an Art Nouveau Museum. Remote Sens. 2023, 15, 5763. [Google Scholar] [CrossRef] [Scilit]
- Valente, R.; Barazzetti, L.; Previtali, M.; Roncoroni, F. Digital Documentation in Narrow Burial Spaces Using a 360° Borescope Prototype. Heritage 2023, 6, 3998–4014. [Google Scholar] [CrossRef] [Scilit]
- Meier, C.; Saorín, J.L.; Díaz Parrilla, S.; Bonnet De León, A.; Melián Díaz, D. User Experience of Virtual Heritage Tours with 360° Photos: A Study of the Chapel of Dolores in Icod de Los Vinos. Heritage 2024, 7, 2477–2490. [Google Scholar] [CrossRef] [Scilit]
- Parfenov, V.; Igoshin, S.; Masaylo, D.; Orlov, A.; Kuliashou, D. Use of 3D Laser Scanning and Additive Technologies for Reconstruction of Damaged and Destroyed Cultural Heritage Objects. QuBS 2022, 6, 11. [Google Scholar] [CrossRef] [Scilit]
- Moskvin, A.; Moskvina, M.; Kuzmichev, V. A study on levels of details for presenting 3D models of historical costumes online. Digit. Appl. Archaeol. Cult. Herit. 2025, 36, e00399. [Google Scholar] [CrossRef] [Scilit]
- Yang, S.; Xu, S.; Huang, W. 3D Point Cloud for Cultural Heritage: A Scientometric Survey. Remote Sens. 2022, 14, 5542. [Google Scholar] [CrossRef] [Scilit]
- Barszcz, M.; Montusiewicz, J.; Paśnikowska-Łukaszuk, M.; Sałamacha, A. Comparative Analysis of Digital Models of Objects of Cultural Heritage Obtained by the “3D SLS” and “SfM” Methods. Appl. Sci. 2021, 11, 5321. [Google Scholar] [CrossRef] [Scilit]
- Moon, D.; Chung, S.; Kwon, S.; Seo, J.; Shin, J. Comparison and Utilization of Point Cloud Generated from Photogrammetry and Laser Scanning: 3D World Model for Smart Heavy Equipment Planning. Autom. Constr. 2019, 98, 322–331. [Google Scholar] [CrossRef] [Scilit]
- Marín-Buzón, C.; Pérez-Romero, A.M.; León-Bonillo, M.J.; Martínez-Álvarez, R.; Mejías-García, J.C.; Manzano-Agugliaro, F. Photogrammetry (SfM) vs. Terrestrial Laser Scanning (TLS) for Archaeological Excavations: Mosaic of Cantillana (Spain) as a Case Study. Appl. Sci. 2021, 11, 11994. [Google Scholar] [CrossRef] [Scilit]
- Molina Rozalem, J.F.; Medina, J.R.; Acosta, I. Laser Scanning and Photogrammetry for Graphic Analysis and Heritage Documentation: The Lopera Tower, a 14th-Century Castilian Fortress. Appl. Sci. 2025, 15, 8737. [Google Scholar] [CrossRef] [Scilit]
- Hernández-Muñoz, Ó. Analysis of Digitized 3D Models Published by Archaeological Museums. Heritage 2023, 6, 3885–3902. [Google Scholar] [CrossRef] [Scilit]
- Chapinal-Heras, D.; Díaz-Sánchez, C.; Gómez-García, N.; España-Chamorro, S.; Pagola-Sánchez, L.; de Corselas, M.P.L.; Zafiria, M.E.R.Á. Photogrammetry, 3D modelling and printing: The creation of a collection of archaeological and epigraphical materials at the university. Digit. Appl. Archaeol. Cult. Herit. 2024, 33, e00341. [Google Scholar] [CrossRef] [Scilit]
- Williams, R.; Thompson, T.; Orr, C.; Taylor, G. Developing a 3D strategy: Pipelines and recommendations for 3D structured light scanning of archaeological artefacts. Digit. Appl. Archaeol. Cult. Herit. 2024, 33, e00338. [Google Scholar] [CrossRef] [Scilit]
- Farella, E.M.; Morelli, L.; Rigon, S.; Grilli, E.; Remondino, F. Analysing Key Steps of the Photogrammetric Pipeline for Museum Artefacts 3D Digitisation. Sustainability 2022, 14, 5740. [Google Scholar] [CrossRef] [Scilit]
- Merella, M.; Farina, S.; Scaglia, P.; Caneve, G.; Bernardini, G.; Pieri, A.; Collareta, A.; Bianucci, G. Structured-Light 3D Scanning as a Tool for Creating a Digital Collection of Modern and Fossil Cetacean Skeletons (Natural History Museum, University of Pisa). Heritage 2023, 6, 6762–6776. [Google Scholar] [CrossRef] [Scilit]
- Duran, Z.; Aydar, U. Digital Modeling of World’s First Known Length Reference Unit: The Nippur Cubit Rod. J. Cult. Herit. 2012, 13, 352–356. [Google Scholar] [CrossRef] [Scilit]
- Koutsoudis, A.; Vidmar, B.; Arnaoutoglou, F. Performance Evaluation of a Multi-Image 3D Reconstruction Software on a Low-Feature Artefact. J. Archaeol. Sci. 2013, 40, 4450–4456. [Google Scholar] [CrossRef] [Scilit]
- Adamopoulos, E.; Rinaudo, F.; Ardissono, L. A Critical Comparison of 3D Digitization Techniques for Heritage Objects. Int. J. Geo-Inf. 2020, 10, 10. [Google Scholar] [CrossRef] [Scilit]
- Nicolae, C.; Nocerino, E.; Menna, F.; Remondino, F. Photogrammetry Applied to Problematic Artefacts. Int. Arch. Photogramm. Remote Sens. Spat. Inf. Sci. 2014, XL-5, 451–456. [Google Scholar] [CrossRef] [Scilit]
- Marshall, M.E.; Johnson, A.A.; Summerskill, S.J.; Baird, Q.; Esteban, E. Automating Photogrammetry for the 3D Digitisation of Small Artefact Collections. Int. Arch. Photogramm. Remote Sens. Spat. Inf. Sci. 2019, XLII-2/W15, 751–757. [Google Scholar] [CrossRef] [Scilit]
- Kuzminsky, S.C.; Gardiner, M.S. Three-Dimensional Laser Scanning: Potential Uses for Museum Conservation and Scientific Research. J. Archaeol. Sci. 2012, 39, 2744–2751. [Google Scholar] [CrossRef] [Scilit]
- Patrucco, G.; Bambridge, P.; Giulio Tonolo, F.; Markey, J.; Spanò, A. Digital Replicas of British Museum Artefacts. Int. Arch. Photogramm. Remote Sens. Spat. Inf. Sci. 2023, XLVIII-M-2–2023, 1173–1180. [Google Scholar] [CrossRef] [Scilit]
- Nabil, M.; Saleh, F. 3D Reconstruction from Images for Museum Artefacts: A Comparative Study. In Proceedings of the 2014 International Conference on Virtual Systems & Multimedia (VSMM); IEEE: Hong Kong SAR, China, 2014; pp. 257–260. [Google Scholar]
- Alby, E.; Smigiel, E.; Assali, P.; Grussenmeyer, P.; Kauffmann-Smigiel, I. Low-Cost Solutions for Dense Point Clouds of Small Objects: Photomodeler Scanner vs. David Laserscanner. In Proceedings of the 22nd CIPA Symposium, Kyoto, Japan, 11–15 October 2009; pp. 11–15. [Google Scholar]
- Collins, T.; Woolley, S.I.; Gehlken, E.; Ch’ng, E. Automated Low-Cost Photogrammetric Acquisition of 3D Models from Small Form-Factor Artefacts. Electronics 2019, 8, 1441. [Google Scholar] [CrossRef] [Scilit]
- Sapirstein, P. A High-Precision Photogrammetric Recording System for Small Artifacts. J. Cult. Herit. 2018, 31, 33–45. [Google Scholar] [CrossRef] [Scilit]
- Gaiani, M.; Apollonio, F.I.; Fantini, F. Evaluating Smartphones Color Fidelity and Metric Accuracy for the 3D Documentation of Small Artifacts. Int. Arch. Photogramm. Remote Sens. Spat. Inf. Sci. 2019, XLII-2/W11, 539–547. [Google Scholar] [CrossRef] [Scilit]
- Loaiza Carvajal, D.A.; Morita, M.M.; Bilmes, G.M. Virtual Museums. Captured Reality and 3D Modeling. J. Cult. Herit. 2020, 45, 234–239. [Google Scholar] [CrossRef] [Scilit]
- Atik, M.E.; Duran, Z.; Yanalak, M.; Seker, D.Z.; Ak, A. 3D Modeling of Historical Measurement Instruments Using Photogrammetric and Laser Scanning Techniques. Digit. Appl. Archaeol. Cult. Herit. 2023, 30, e00286. [Google Scholar] [CrossRef] [Scilit]
- Russo, M.; Senatore, L.J. Low-Cost 3D Techniques for Real Sculptural Twins in the Museum Domain. Int. Arch. Photogramm. Remote Sens. Spatial Inf. Sci. 2022, XLVIII-2/W1-2022, 229–236. [Google Scholar] [CrossRef] [Scilit]
- Zainal, B.; Ismail, M.R. Trigonometric Solutions Using Sine Quadrant. Procedia-Soc. Behav. Sci. 2010, 8, 721–728. [Google Scholar] [CrossRef] [Scilit]
- Westoby, M.J.; Brasington, J.; Glasser, N.F.; Hambrey, M.J.; Reynolds, J.M. ‘Structure-from- Motion’ Photogrammetry: A Low-Cost, Effective Tool for Geoscience Applications. Geomorphology 2012, 179, 300–314. [Google Scholar] [CrossRef] [Scilit]
- Giménez-El-Amrani, A.; Sanz-Garcia, A.; Villalba-Rojas, N.; Mirabet, V.; Valverde-Navarro, A.; Escobedo-Lucea, C. The Untapped Potential of 3D Virtualization Using High Resolution Scanner-Based and Photogrammetry Technologies for Bone Bank Digital Modeling. Comput. Biol. Med. 2024, 183, 109340. [Google Scholar] [CrossRef] [Scilit] [PubMed]
- Díez Díaz, V.; Mallison, H.; Asbach, P.; Schwarz, D.; Blanco, A. Comparing Surface Digitization Techniques in Palaeontology Using Visual Perceptual Metrics and Distance Computations between 3D Meshes. Palaeontology 2021, 64, 179–202. [Google Scholar] [CrossRef] [Scilit]
- Bitelli, G.; Forte, A.; Tini, M.A.; Belfiori, F.; Tirincanti, A. High-Detail 3D Reconstruction and Digital Strategies for the Enhancements of Archaeological Properties in Museums. Heritage 2025, 8, 49. [Google Scholar] [CrossRef] [Scilit]
- Rattanarungrot, S.; White, M.; Chairungsee, S. Enhancing Cultural Heritage Accessibility Through Three-Dimensional Artifact Visualization on Web-Based Open Frameworks. Informatics 2025, 12, 37. [Google Scholar] [CrossRef] [Scilit]
- Ruiz, R.M.; Torres, M.T.M.; Allegue, P.S. Comparative Analysis Between the Main 3D Scanning Techniques: Photogrammetry, Terrestrial Laser Scanner, and Structured Light Scanner in Religious Imagery: The Case of The Holy Christ of the Blood. J. Comput. Cult. Herit. 2022, 15, 1–23. [Google Scholar] [CrossRef] [Scilit]
- Canny, J. A computational approach to edge detection. IEEE Trans. Pattern Anal. Mach. Intell. 2009, PAMI-8, 679–698. [Google Scholar]
- Agrawal, H.; Desai, K. Canny edge detection: A comprehensive review. Int. J. Tech. Res. Sci. 2024, 9, 27–35. [Google Scholar] [CrossRef] [Scilit]
- Rusu, R.B.; Marton, Z.C.; Blodow, N.; Dolha, M.; Beetz, M. Towards 3D point cloud based object maps for household environments. Robot. Auton. Syst. 2008, 56, 927–941. [Google Scholar] [CrossRef] [Scilit]
- Balta, H.; Velagic, J.; Bosschaerts, W.; De Cubber, G.; Siciliano, B. Fast statistical outlier removal based method for large 3D point clouds of outdoor environments. IFAC-PapersOnLine 2018, 51, 348–353. [Google Scholar] [CrossRef] [Scilit]
- Carrilho, A.C.; Galo, M.; Santos, R.C. Statistical outlier detection method for airborne LiDAR data. Int. Arch. Photogramm. Remote Sens. Spat. Inf. Sci. 2018, 42, 87–92. [Google Scholar] [CrossRef] [Scilit]
- Apollonio, F.I.; Fantini, F.; Garagnani, S.; Gaiani, M. A Photogrammetry-Based Workflow for the Accurate 3D Construction and Visualization of Museums Assets. Remote Sens. 2021, 13, 486. [Google Scholar] [CrossRef] [Scilit]
- Montusiewicz, J.; Miłosz, M.; Kęsik, J.; Żyła, K. Structured-Light 3D Scanning of Exhibited Historical Clothing—A First-Ever Methodical Trial and Its Results. Herit. Sci. 2021, 9, 74. [Google Scholar] [CrossRef] [Scilit]
- Montusiewicz, J.; Milosz, M.; Sarnowski, W.; Kayumov, R. Quality Assessment of Digital 3D Models of Museum Artefacts from the Mobile LiDAR iPhone and Structured Light Scanners. Appl. Sci. 2026, 16, 2100. [Google Scholar] [CrossRef] [Scilit]

Disclaimer/Publisher’s Note: The statements, opinions and data contained in all publications are solely those of the individual author(s) and contributor(s) and not of MDPI and/or the editor(s). MDPI and/or the editor(s) disclaim responsibility for any injury to people or property resulting from any ideas, methods, instructions or products referred to in the content. |
© 2026 by the authors. Licensee MDPI, Basel, Switzerland. This article is an open access article distributed under the terms and conditions of the Creative Commons Attribution (CC BY) license.