


Abstract
Reliable performance monitoring is indispensable for FM broadcast time service systems, yet systematic evaluation and long-term operational data in practical scenarios remain scarce. This study addresses the gap and verifies the actual service capability of the FM broadcast time service system deployed in 10 key Chinese cities. We established a systematic monitoring model, applied the GUM to evaluate measurement uncertainty, and conducted continuous, multi-site monitoring and statistical analysis over 24 months. Results show the expanded measurement uncertainty of all stations ranges from 62.768 μs to 80.646 μs (k = 2), meeting the 100 μs requirement, and long-term monitoring confirms the system achieves sub-millisecond timing accuracy in practical operation. This work fills the gap in long-term operational data for FM broadcast timing technology, provides a standardized uncertainty evaluation method for the monitoring system, and lays a robust theoretical and data foundation for the technology’s optimization and wide adoption, thereby enhancing user confidence in FM broadcast time services.
1. Introduction
Subsidiary Communication Authorization (SCA) broadcasting is an auxiliary communication service that uses an additional frequency modulation (FM) channel to transmit a variety of information [1,2]. As a mature frequency-division multiplexing technology, it is widely applied to deliver traffic updates, financial data, meteorological forecasts, and radio paging messages [3,4,5]. FM broadcast timing (FMBT) technology provides a civilian broadcast time service by embedding timecode information into SCA channel carrier frequencies for broadcast time transfer [6].
Compared with other mainstream timing technologies, FMBT features distinctive application advantages. Satellite timing technologies such as GNSS achieve a high accuracy of 20–500 ns yet are susceptible to electromagnetic interference and signal blockage in urban canyons, indoor environments, and battlefield scenarios with electronic warfare [7,8], while FMBT leverages the wide coverage and strong penetration of terrestrial FM signals to ensure stable operation in satellite-denied environments. In terms of single-station coverage, low-frequency time code-based BPC timing offers approximately 1 ms accuracy [9,10] with a wider coverage range, while FMBT delivers superior sub-millisecond precision and directly reuses extensively deployed FM base stations, thus avoiding extra infrastructure investment. Enhanced Loran (eLoran) also provides sub-millisecond accuracy and excellent anti-interference performance but relies on dedicated high-power transmitters, resulting in high deployment and maintenance costs [11,12,13]. By contrast, FMBT enables low-cost, rapid deployment via in-depth reuse of existing FM infrastructure, with prominent advantages in regional timing applications. Additionally, FMBT has slightly lower accuracy than long-wave BPL timing but far greater flexibility in construction and deployment. Therefore, FMBT can effectively supplement the coverage gaps of traditional timing technologies including BPC and BPL, thus serving as a key complementary technology for building a more robust, comprehensive and high-precision national timing system [14,15,16].
The development of FMBT technology has advanced stepwise from theoretical method formulation and reception technology analysis to signal system design and technical feasibility validation, thereby furnishing a solid basis for its large-scale application. In 2017, Hu [6] presented the fundamental FMBT method and validated the feasibility of its core technologies, while Ke [17] concurrently analyzed the feasibility of the corresponding signal reception technology for FMBT systems. Taken together, these studies confirmed the technical feasibility of FMBT and built its preliminary theoretical and technical framework. Building on this, Hu et al. [18] tailored the spread spectrum codes, signal frame structures and BPSK modulation schemes to the SCA channel characteristics in 2020, and conducted single-point field tests at a 20 km transmission range in 2021 [19], which proved the technology’s sub-millisecond timing accuracy under ideal conditions. These efforts completed the design and feasibility validation of the FMBT signal and transmission system, paving the way for its practical application. In 2022, the National Time Service Center (NTSC) deployed a regional FM broadcast time service system across 10 key cities including Nanjing, Chengdu, and Chongqing, signifying FMBT’s official transition from theoretical research to engineering application. As this system was put into operation, timing performance monitoring emerged as a critical technical demand. In 2024, Zhao et al. [20] tackled the signal reception issues arising from the complex SCA channel environment. They proposed a combined matched filtering and cross-correlation algorithm to enhance reception performance. Additionally, they designed a full signal processing workflow for the monitoring receiver and validated its applicability and demodulation precision via experiments, thus further advancing the development of FMBT monitoring technology.
Although FMBT technology has made significant advancements across its entire technical chain, including method development, system design, and performance monitoring, noticeable technical gaps remain in the performance evaluation of operational systems. These gaps impede the technology’s further practical implementation and precision optimization, thereby precluding comprehensive assessment of operational FMBT systems. They manifest in three interrelated dimensions: First, there is no systematic monitoring framework or tailored measurement model for operational FMBT systems, with existing research mostly focusing on single technical link verification without an integrated evaluation system for the overall performance of operational FMBT systems. Second, empirical data of FMBT systems in real operational settings are inadequate, particularly regarding long-term continuous monitoring data from multi-site deployment scenarios. The available test data from Hu et al. [19] and Zhao et al. [20] are largely derived from short-term field tests, which cannot capture the dynamic performance variations in FMBT systems under the impact of complex and variable environmental factors in actual operation. Third, the reliability of FMBT monitoring results lacks the support of standardized measurement uncertainty assessment. For other mature timing systems in China, research on measurement uncertainty evaluation is relatively well-established: Chen et al. [21] pioneered the application of the Guide to the Expression of Uncertainty in Measurement (GUM) to uncertainty evaluation for BPL long-wave timing monitoring, yielding quantitative results for the uncertainty of BPL timing monitoring; Qi et al. [22] further extended the GUM method to analyze the uncertainty of BPC timing monitoring systems under diverse propagation space conditions. Nevertheless, this standardized uncertainty evaluation approach has not been adopted in the FMBT monitoring field, resulting in a lack of quantifiable accuracy metrics for reliable assessment of FMBT monitoring results. This directly restricts the large-scale deployment of FMBT technology and undermines user confidence in its timing accuracy.
To address the aforementioned research gaps and support the stable operation and large-scale application of FM broadcast time service systems, this study is dedicated to developing a systematic monitoring and evaluation system for such operational systems. The core research motivation is to build a reliable technical approach for characterizing the operational performance of FM broadcast time service systems in complex environments, fill the gaps in long-term operational data and standardized evaluation methods, and offer solid theoretical and data support for system optimization, practical deployment and integration into the national time service system.
Against this backdrop, the core contributions of this study are explicitly summarized as follows:
- The development of a customized holistic monitoring model: A systematic FMBT monitoring and measurement model is built to decompose and integrate error sources throughout the monitoring process (i.e., broadcast transmission delay, propagation delay, and processing delay), enabling comprehensive characterization of timing deviations in operational systems.
- Innovative application of the GUM method: This study pioneers the application of GUM to FMBT monitoring, with targeted test schemes designed for Type A (signal propagation delay uncertainty) and Type B (reference time source, equipment calibration, and measurement module error) uncertainties. This allows quantitative estimation of each component and establishes a credible accuracy benchmark for monitoring results.
- Provision of long-term multi-site operational empirical data: Based on 24-month continuous monitoring data from 10 stations of the NTSC regional system, statistical analysis is conducted on key performance indicators (accuracy, stability, and data fluctuation range), bridging the gap in long-term operational performance data in existing research.
- Integration and extension beyond existing research: This study integrates a systematic monitoring model, standardized uncertainty evaluation, and long-term multi-site verification to construct a complete evaluation framework for operational FM broadcast time service systems. It extends existing research from technical verification under laboratory/ideal conditions to systematic performance assessment in actual operational environments.
This study offers a reliable theoretical foundation and experimental evidence for the in-depth investigation of FMBT performance, accurate evaluation of its time service capabilities, and optimization of operational and maintenance strategies, laying a solid groundwork for the wider adoption and application of FMBT technology.
2. Materials and Methods
To address the three key research gaps identified in the Introduction, this section describes the operating principle and composition of the FMBT monitoring system, and then presents a systematic timing deviation monitoring model and a standardized measurement uncertainty (MU) evaluation method based on GUM, thereby providing a methodological basis for subsequent performance verification.
2.1. Operating Principle of FMBT Monitoring Station
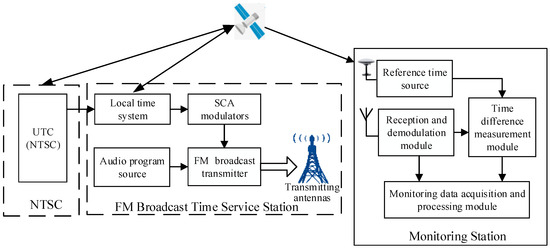
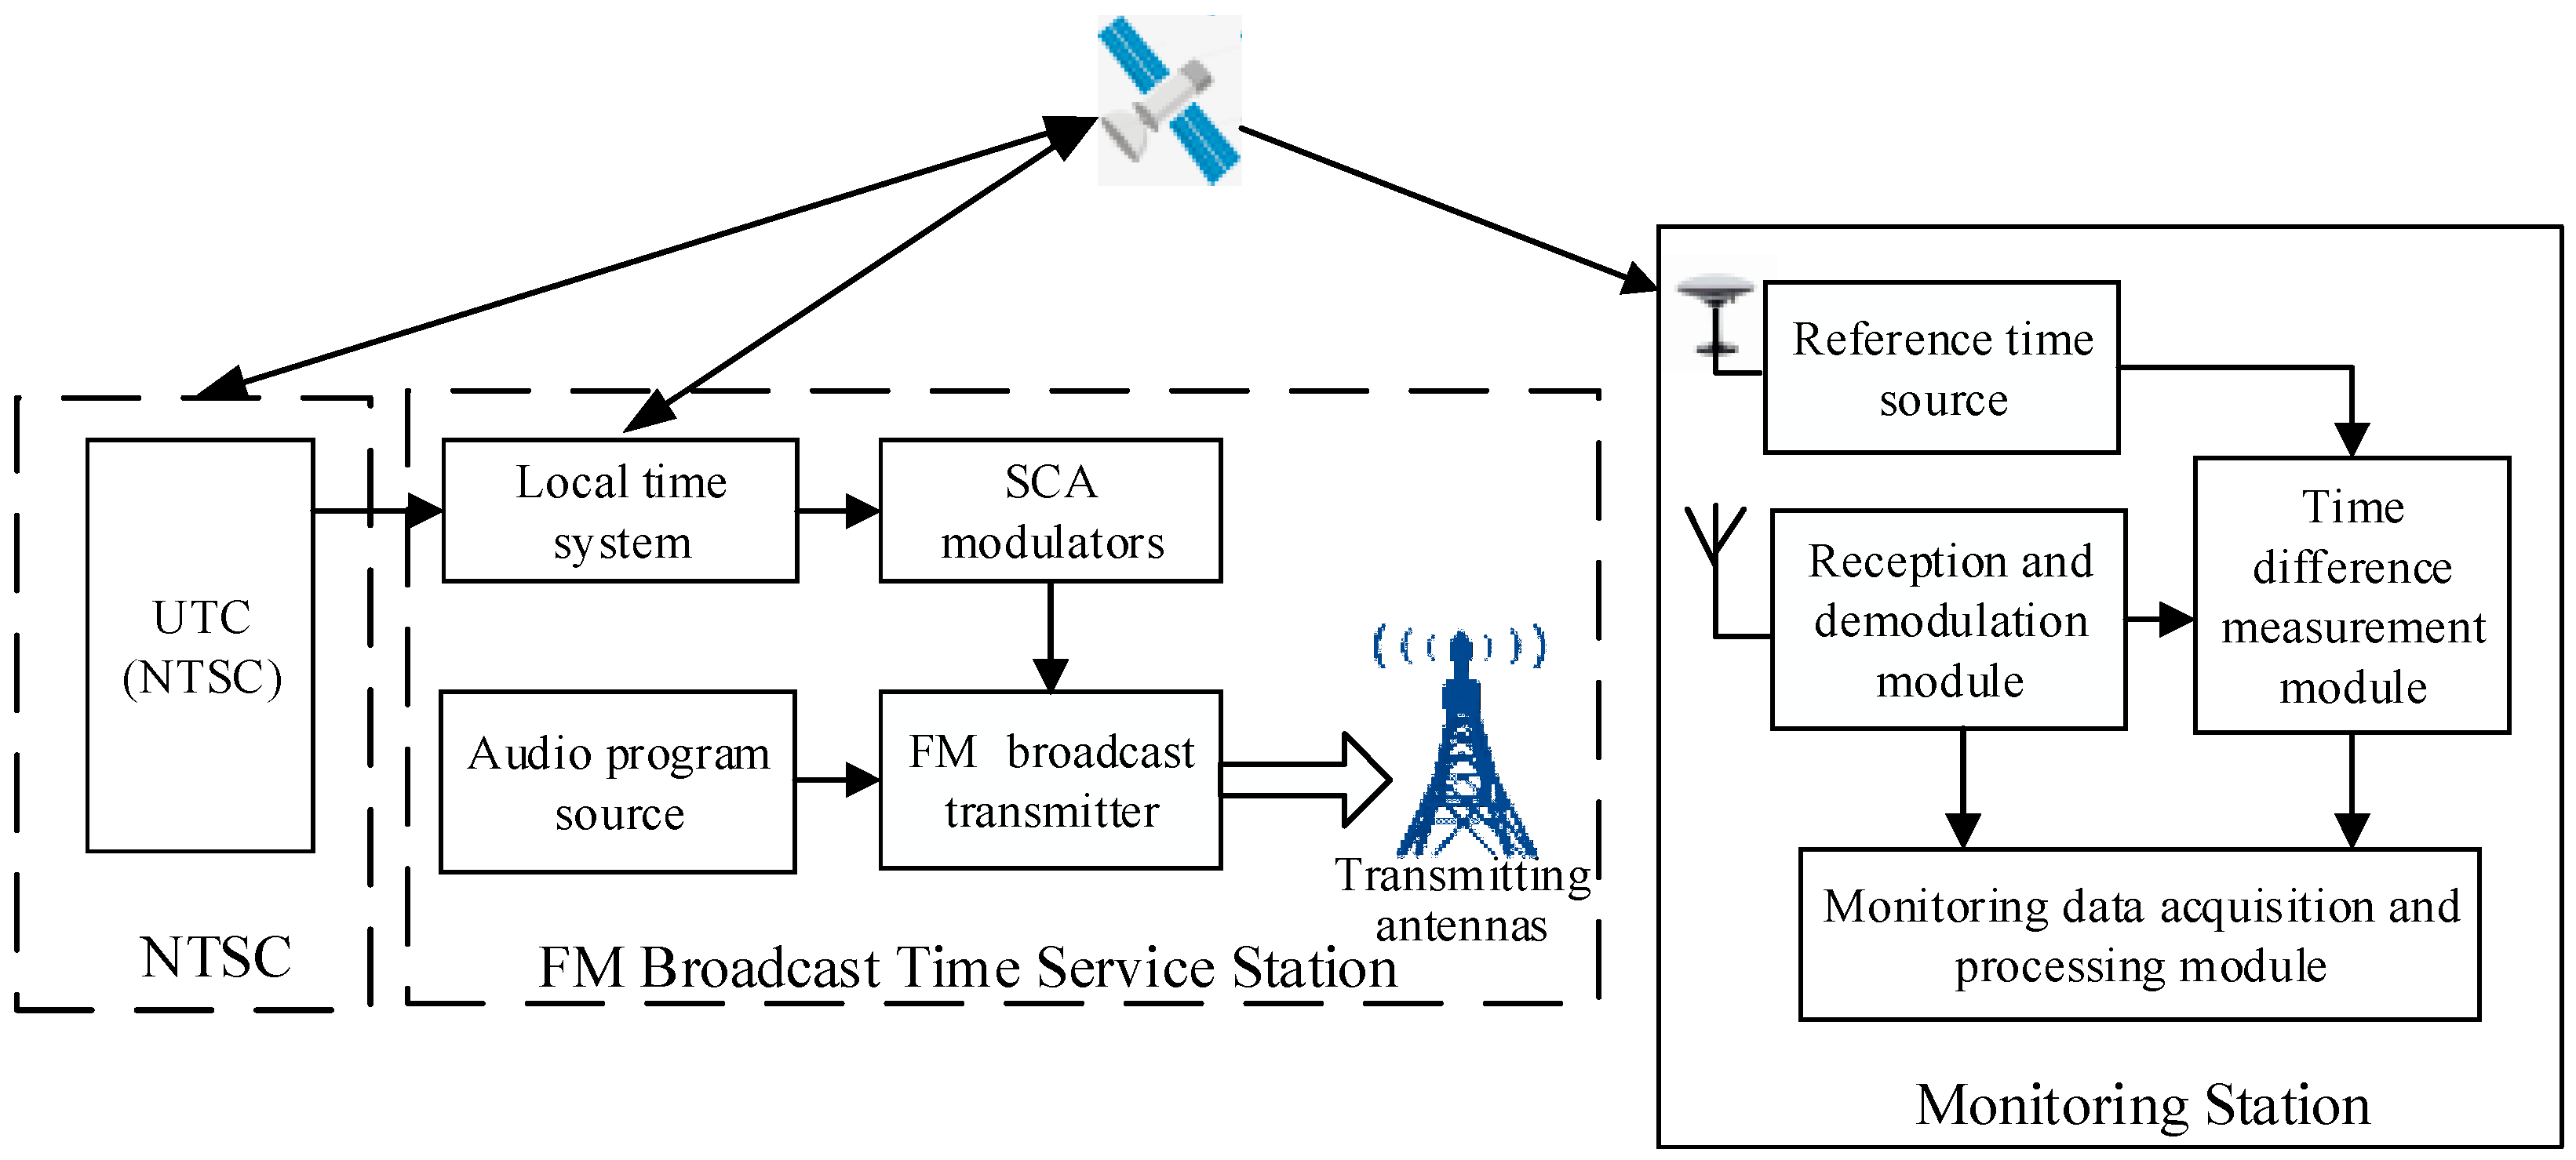
FMBT broadcasts standard time by modulating time information onto the SCA subcarrier for transmission via FM broadcast antennas. The system time of the FM broadcasting station is synchronized to the China standard time UTC (NTSC) via satellite common-view technology. The ranging code and timing information are modulated onto the SCA subcarrier (67 kHz) using binary phase shift keying (BPSK) and superimposed with the audio signal. The composite signal is then FM-modulated for broadcasting [6]. The reception demodulation module receives the FM broadcast signal carrying the standard time information, measures the quality parameters of the broadcast timing signal such as the operating frequency, signal level, and signal-to-noise ratio (SNR), and outputs the processed data to the monitoring data acquisition and processing module. The broadcast 1PPS signal is generated by demodulating the broadcast timing signal and compared with the reference 1PPS signal using the time difference measurement module. The timing deviation of the broadcast time signal is derived and stored in the acquisition and processing module. The operating principle of an FMBT monitoring station is shown in Figure 1.
Figure 1.
Schematic illustration of the operating principle of the monitoring station.
2.2. System Composition
In 2022, the NTSC established ten FM broadcast timing stations in Nanjing, Chengdu, Chongqing, Hangzhou, Shanghai, Wuxi, Guiyang, Lanzhou, Nanchang, and Shenzhen to provide time services. The transmitted timing signals cover an area comparable to that of audio broadcasts [23]. The FM broadcast band in China spans 87.5–108.0 MHz, with each station operating on a distinct frequency, as detailed in Table 1.
Table 1.
Operating frequencies of time service stations.
According to the transmission characteristics of FM broadcast signals [24,25], the FMBT monitoring system deploys monitoring stations within the coverage areas of each broadcast time service station. Concurrently, a central monitoring and processing facility is established at the NTSC, which receives raw monitoring data—including the timing deviation, signal quality parameters, and equipment status—from the monitoring stations. The monitoring center performs statistical analysis on the monitored data and evaluates the timing performance of the broadcast time service system. Moreover, it provides real-time data access for the time service system and its users.
To accurately evaluate the timing performance of the FM broadcast and analyze the timing integrity, the FMBT monitoring system assesses the broadcast time service system by monitoring the signal level, SNR, and timing deviation. The signal level and SNR reflect signal quality, while timing deviation directly indicates the timing performance of the broadcast time service system. The timing deviation of the broadcast time service system is defined as the deviation between the broadcast timing signal and UTC (NTSC). The mean timing deviation represents the central tendency of the broadcast time relative to UTC (NTSC), i.e., timing accuracy. The standard deviation of the timing deviation measurement reflects the dispersion of the broadcast time relative to UTC (NTSC), i.e., timing stability [26,27]. The timing performance of the broadcast time service system can be comprehensively evaluated by analyzing indicators such as timing accuracy and stability.
2.3. Broadcast Timing Monitoring Model
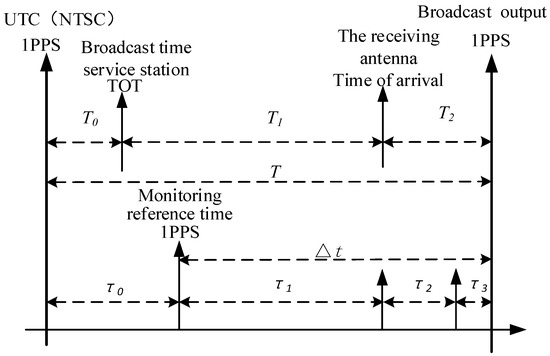
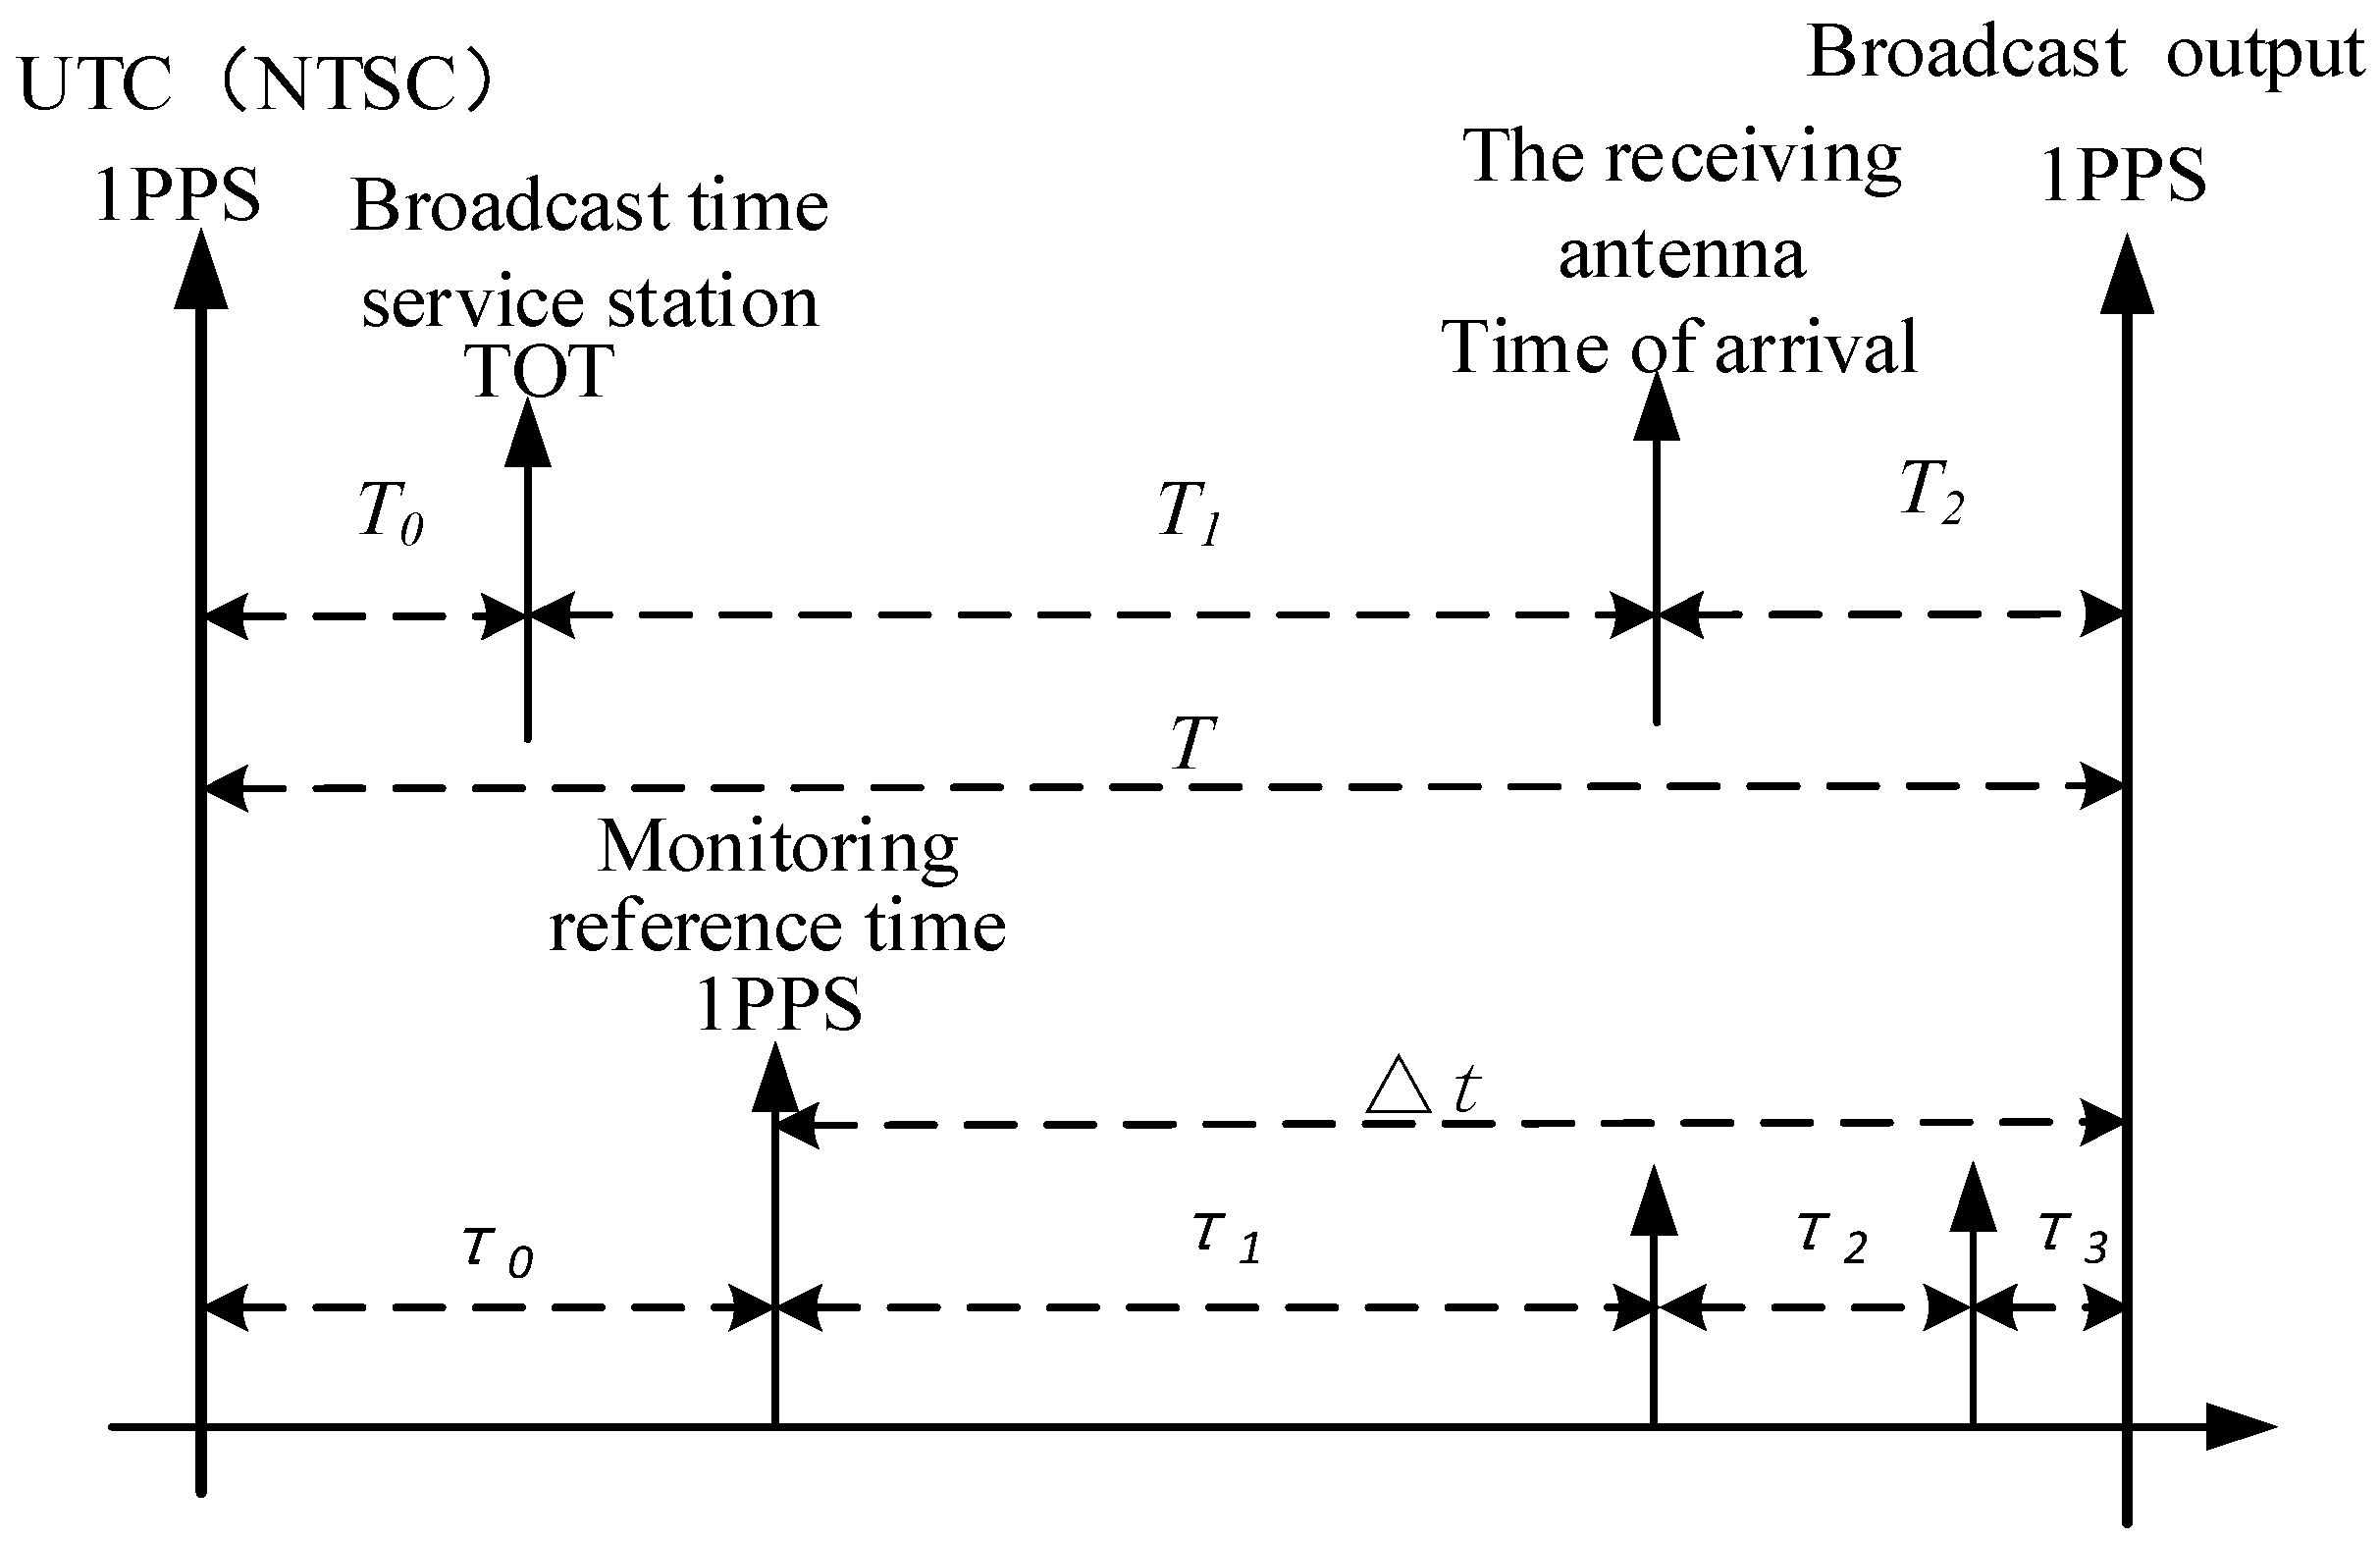
MU of timing deviation is a core metric for assessing the performance of an FMBT monitoring system. The measurement model for timing deviation is illustrated in Figure 2, where T0 is the time offset between the transmission time (TOT) of the broadcast timing transmitter and UTC (NTSC) (negative for advance, positive for delay relative to UTC (NTSC)), T1 is the residual error in correcting signal propagation delay from the transmitter to the receiving antenna, and T2 is the residual error in correcting processing delay introduced by the receiving antenna, transmission cable, and terminal equipment. The broadcast timing deviation T combines the broadcast time offset T0, the residual error in correcting the signal propagation delay T1, and the residual error in correcting the processing delay T2, and directly reflects the timing performance of the broadcast time service system. It can be expressed as
T = T0 + T1 + T2
Figure 2.
Schematic of the measurement model for timing deviation monitoring.
For monitoring purposes, let denote the time offset between the reference time signal of the monitoring equipment and UTC (NTSC), and the measured timing deviation between the broadcast timing signal and the monitoring reference. Based on the timing monitoring principle illustrated in Figure 1 and the timing deviation model given by Equation (1), the measured timing deviation encompasses the signal propagation delay , the receiver demodulation error , and the time difference measurement error . Thus, the broadcast timing deviation T in the monitoring measurement model is expressed as
2.4. Evaluation of MU
2.4.1. Applicability Analysis
MU is a key indicator for assessing the reliability of measurement results in metrology, and the GUM method is the most widely accepted approach for MU evaluation [28]. Two critical preconditions must be satisfied for the effective application of GUM: first, the target measurement model must be linear or convertible into a linear model; second, the probability distribution of the model’s output quantity should approximate a normal or t-distribution [29,30].
Theoretically, the timing deviation measurement model of the FMBT monitoring system is a typical linear model, where each error component acts independently on the total timing deviation. This structural characteristic fully meets the linearity requirement for the application of the GUM method.
Timing deviation T, which combines systematic errors and random errors from multiple sources, can be decomposed into n independent minor error components, such as channel multipath random error , device thermal noise , time delay error caused by temperature and humidity fluctuations , reference source phase noise , and sampling quantization error . Among these, is an additional random disturbance to signal propagation delay ; is a random term superimposed on systematic error; is an independent random error; serves as an additional random disturbance in the model term ; and is an additional random disturbance in the model terms and . Accordingly, timing deviation incorporating these error components can be written as:
where represents the total systematic error, including systematic deviations of key terms such as and in the measurement model, and stands for the sum of all independent random error components.
These error components satisfy three conditions that are consistent with the model properties. First, error components are independent: for , meaning no linear correlation between individual error terms. Second, their magnitudes are compatible: to are all at the nanosecond (ns) level, matching the physical characteristics of small random error sources; only the receiving and demodulation systematic error dominated by in is at the microsecond (μs) level, while its accompanying random part remains at the ns level and does not compromise the normality of the overall deviation distribution. Third, the finite variance condition holds: the variance of the combined random error equals the sum of variances of individual components, which agrees well with real monitoring scenarios without extreme errors.
According to the Lindeberg–Lévy central limit theorem (L–L CLT) [31], when the number of independent error sources is sufficiently large, the conditions for applying the theorem are satisfied, and the standardized variable can then be expressed as:
where is the mean value of timing deviation, and is the mathematical expectation of random error . Since positive and negative random errors are mutually offset, their mean value is close to zero, so is approximately equal to the total systematic error ; is the standard deviation of timing deviation, indicating that timing deviation T asymptotically follows a normal distribution ) as . In this study, timing deviation error sources are divided into more than 10 independent minor types, including channel multipath, device thermal noise, temperature and humidity fluctuations, reference source phase noise, sampling quantization error, calibration residual error, link attenuation fluctuation, electromagnetic interference coupling, clock synchronization deviation, and demodulation algorithm error. Meanwhile, extreme errors are effectively restrained through equipment calibration and link optimization, which fully meets the application requirements of the L-L CLT.
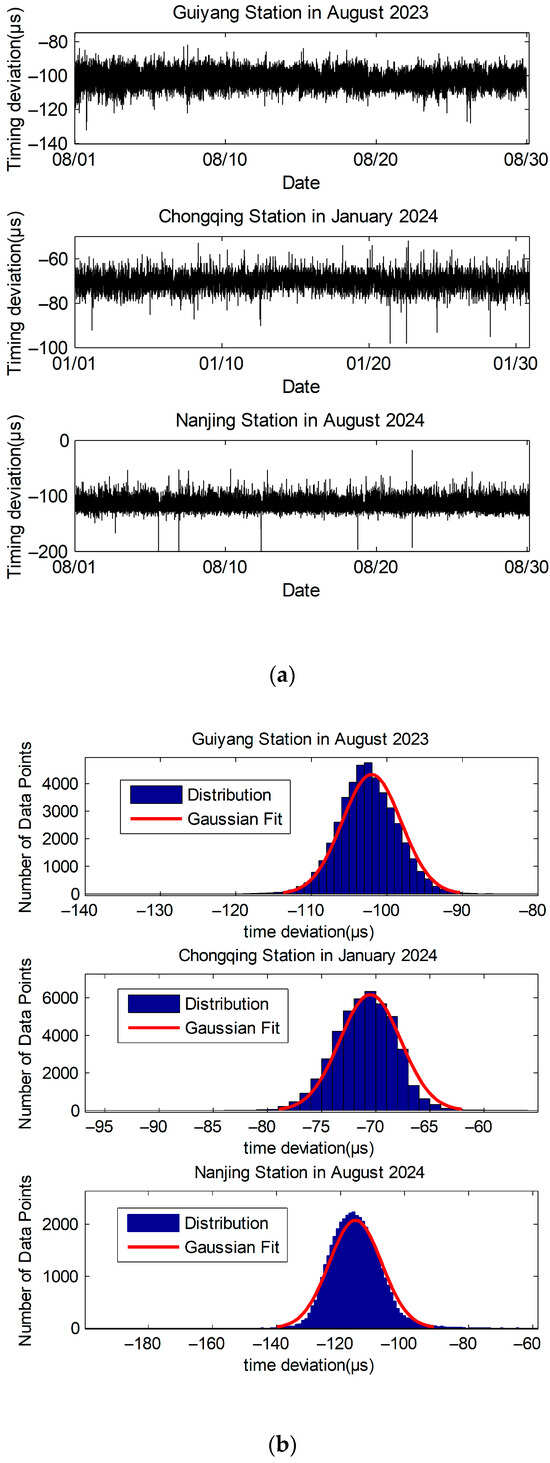
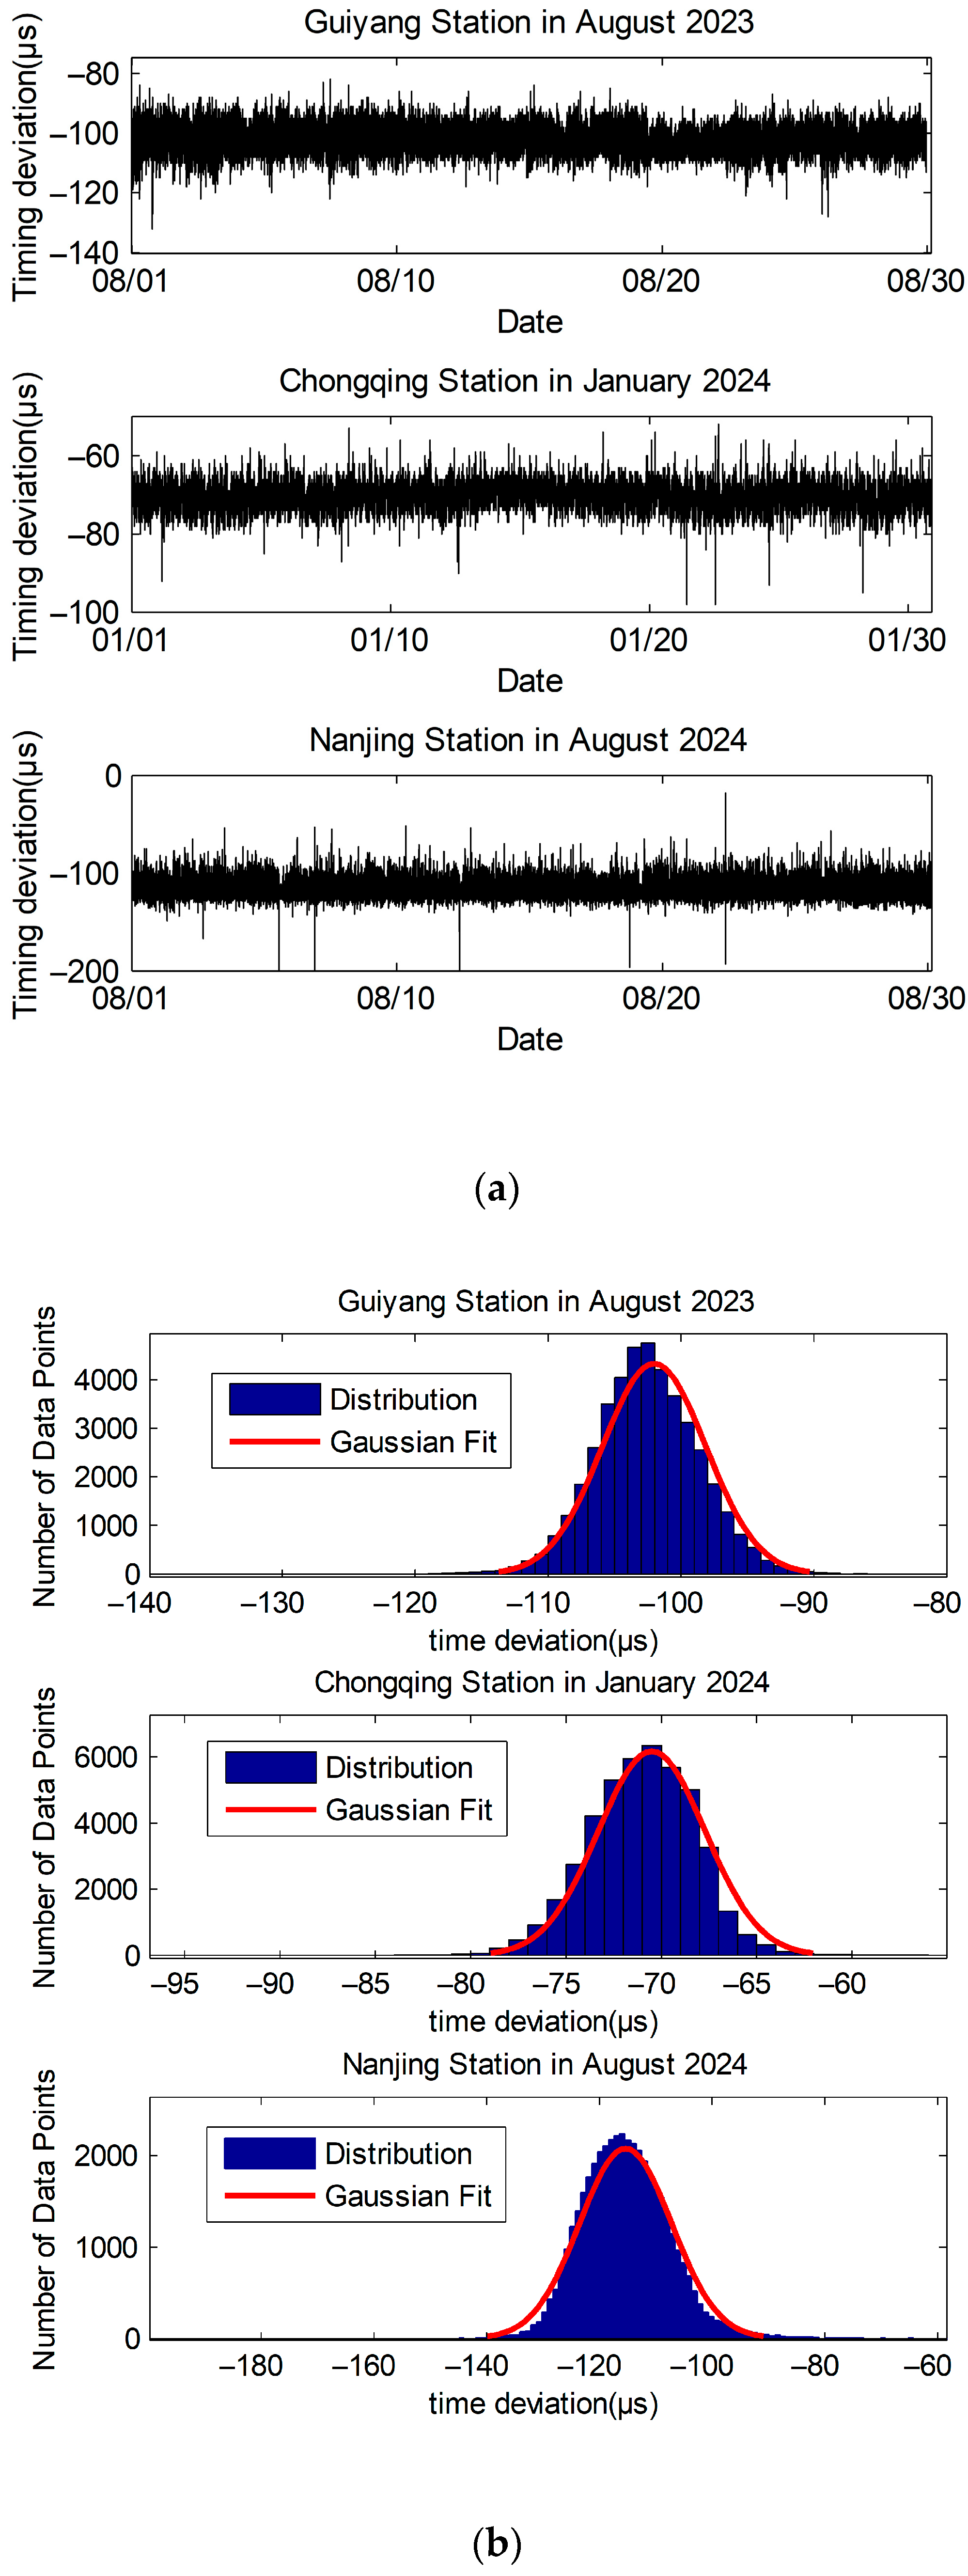
To validate the above theoretical conclusions, this study designed a multi-dimensional verification scheme. In the spatial aspect, monitoring stations under diverse geographical environments and signal quality conditions were selected, including Nanjing Station in the eastern plain with high SNR, Chongqing Station in the western mountainous area with medium SNR, and Guiyang Station in the southwestern plateau with low SNR, which cover complex and varied signal propagation environments. In the temporal aspect, three distinct periods were randomly chosen: August 2023, January 2024, and August 2024. For each period, approximately 44,640 datasets were collected at a frequency of one measurement per minute over 31 consecutive days, ensuring that the sample size meets the requirements of large-sample statistical rules and fully covers influencing factors across different environments and seasons.
The verification results are shown in Figure 3: Figure 3a illustrates the timing deviation monitored at different stations, intuitively reflecting the temporal variation characteristics across stations and periods. Figure 3b presents a histogram of the actual data distribution, with the red curve representing the fitted normal distribution. Observation clearly shows that the measured data distributions of the three stations across different periods are highly consistent with the normal curve, showing no significant skewness, abnormal kurtosis, or anomalous peaks, thereby demonstrating typical normal distribution characteristics. The above multi-station and multi-period verification results fully confirm the stability and approximate normality of monitoring data distribution under different geographical environments and seasonal conditions, verifying the applicability of the GUM method in broadcast timing monitoring scenarios and further demonstrating the rationality and feasibility of applying GUM for uncertainty evaluation.
Figure 3.
Monitored data at different stations across different months: (a) Timing deviation; (b) Probability distribution of the timing deviation.
2.4.2. Definition and Physical Interpretation of Uncertainty Components
The measurement accuracy of FMBT deviation is influenced by multiple error sources. Random errors mainly arise from channel transmission processes, while systematic errors originate from the measurement reference and signal processing channels. Based on the established FMBT deviation monitoring model and the GUM method’s Type A and Type B uncertainty evaluation rules, the MU components are divided into two distinct categories [32]. The physical nature of each component is explained in detail below.
Type A uncertainty arises from random time-delay variations caused by dynamic environmental interference during SCA channel propagation. In actual operation, multipath effects in urban canyons and indoor scenarios lead to signal superposition and interference. Electromagnetic noise such as industrial interference and radio-frequency interference disturbs the phase stability of signals. Changes in ambient temperature and humidity further cause fluctuations in channel dielectric characteristics. Together, these factors lead to random variations in signal propagation delay. According to stochastic process theory, such variations follow a normal distribution and can be quantified through statistical methods using multiple repeated measurements. In addition, the distribution characteristics of measurement data are positively correlated with the intensity of physical interference: stronger interference leads to a wider range of time-delay fluctuations and a higher Type A uncertainty value.
Unlike Type A uncertainty induced by random factors, Type B uncertainty arises from systematic errors and includes three components, each with clear physical mechanisms and theoretical support. The reference time source error is mainly caused by time-frequency stability deviations of crystal oscillators and atomic clocks. As indicated by time-frequency reference theory, frequency drift and phase noise of the reference source directly lead to offsets in the time transfer reference, and the error magnitude is closely related to the inherent performance parameters of the reference source, including frequency stability and aging rate. Equipment calibration error represents the systematic deviation of measuring instruments. According to instrument metrology theory, nonlinear characteristics in the hardware circuits of standard sources and devices under test during calibration, as well as inconsistencies between the calibration environment and the actual operating environment, lead to discrepancies in calibration results and further contribute to Type B uncertainty. Measurement module error is essentially reflected as distortion and delay deviations in signal processing. Based on signal processing theory, filtering delay from the filter module, quantization error from the sampling module, and phase distortion from the demodulation module change the temporal characteristics of signals, ultimately forming corresponding Type B uncertainty components.
2.4.3. Uncertainty Evaluation for the FMBT Monitoring System
On the basis of the definitions and physical interpretations of uncertainty components in Section 2.4.2, this section performs a step-by-step uncertainty evaluation for the FMBT monitoring system.
Type A uncertainty of broadcast timing deviation is assessed through statistical analysis of measured data [25], and its core characteristic is the experimental standard deviation, which roughly quantifies the uncertainty caused by signal propagation delay . In contrast, Type B uncertainty evaluation depends on probability distributions obtained from experience or other information, with its key feature being the estimated standard deviation. Specifically, the Type B uncertainty in broadcast timing deviation monitoring comes from the reference time source and the calibration errors of the receiving, demodulation, and time difference measurement equipment modules and . After evaluating Type A and Type B uncertainties, the combined uncertainty can be calculated, followed by the expanded uncertainty. Detailed analyses of each uncertainty component are given below.
- Type A Uncertainty Evaluation
Type A uncertainty is closely related to signal propagation delay, and its evaluation is based on statistical analysis of measured data. According to the GUM framework, Type A standard uncertainty is defined as the standard deviation of the mean (standard error), which characterizes the uncertainty of the estimated mean value rather than the variability of individual measurements. It is calculated as the sample standard deviation divided by and can be expressed as:
where represents the i-th measurement of the timing deviation, is the arithmetic mean, is the sample standard deviation, and n stands for the number of measurement sampling points.
- 2.
- Type B Uncertainty Evaluation
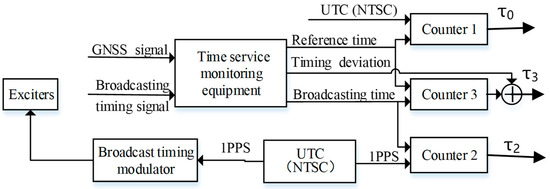
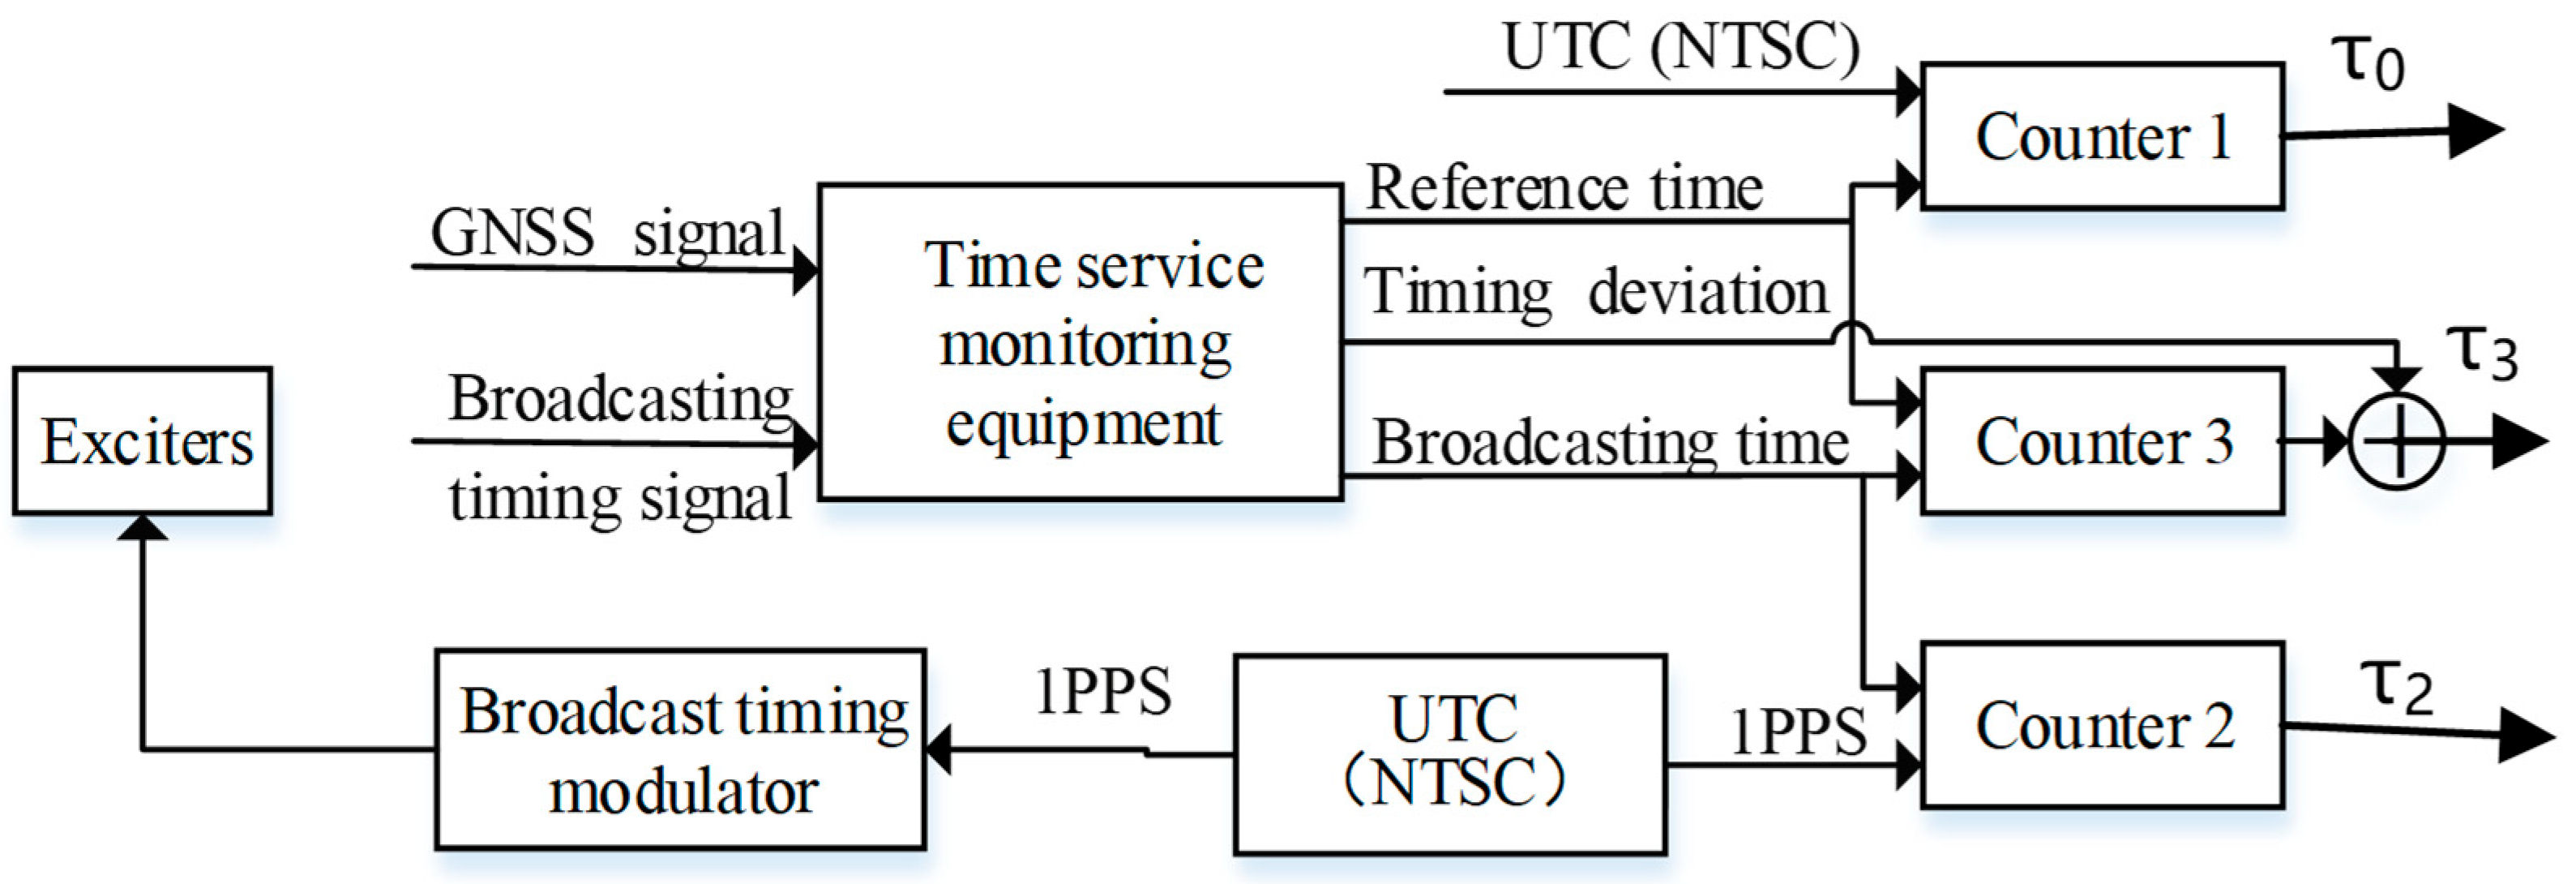
Type B uncertainty mainly stems from the systematic time offset between the reference time signal of the monitoring equipment and UTC (NTSC), the processing delay error, and the error of the time difference measurement module. These uncertainties are characterized once during factory calibration through statistical analysis of repeated measurements using simulated signal sources. The resulting root-mean-square (RMS) values are subsequently adopted as fixed standard uncertainties for routine monitoring. The connection diagram of the test equipment is shown in Figure 4. The delay of all connected cables was calibrated during this procedure. A simulated broadcast timing signal was generated by a modulator and transmitted using an exciter. The monitoring equipment received the simulated timing signal, and the time interval counters were used to obtain measurement data for establishing these fixed Type B uncertainties.
Figure 4.
Connection diagram of the test equipment for Type B uncertainty evaluation.
The uncertainty is introduced by the systematic time offset between the reference time signal of the monitoring equipment and UTC (NTSC). As a Type B component, it is characterized once during factory calibration through n repeated measurements using Counter 1. The RMS value of the measured absolute time offset is calculated as the standard uncertainty. The measurement resolution of the counter is 25 ps, which is negligible at the ns level. The uncertainty can be expressed as
where is the absolute time offset of the i-th measurement by Counter 1.
The uncertainty is introduced by the processing delay error of the broadcast timing monitoring equipment. During factory calibration, the analog signal generated by the exciter was received and processed by the monitoring equipment. The processing delay refers to the time difference between the reference 1PPS (UTC (NTSC)) of the broadcast timing modulator and the 1PPS of the received and demodulated broadcast timing signal. This delay was measured using Counter 2, and the RMS value was obtained as a fixed Type B uncertainty. The uncertainty can be expressed as
where is the processing delay of the i-th measurement by Counter 2.
The uncertainty in is caused by the error of the time difference measurement module in the monitoring equipment. It is characterized once during factory calibration by calculating the RMS value of the difference between the timing deviation measured by Counter 3 and that measured by the monitoring equipment itself. The uncertainty can be expressed as
where is the i-th difference between the time deviation measured by Counter 3 and the monitoring equipment.
- 3.
- Combined and Expanded Uncertainty
As per the GUM, in the FMBT monitoring model, the input variables are uncorrelated, and the combined uncertainty can be evaluated as
For the FMBT monitoring system, assuming a normal distribution with 95% confidence level, the expanded uncertainty U can be expressed as
Thus, the broadcast timing deviation measurement value T lies within the interval [ − U, + U] with a 95% confidence level.
3. Results
3.1. Measured Results of Monitoring Performance
3.1.1. Type A Uncertainty
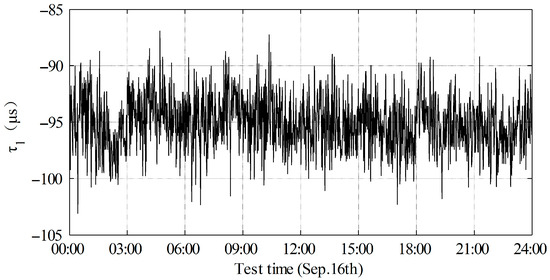
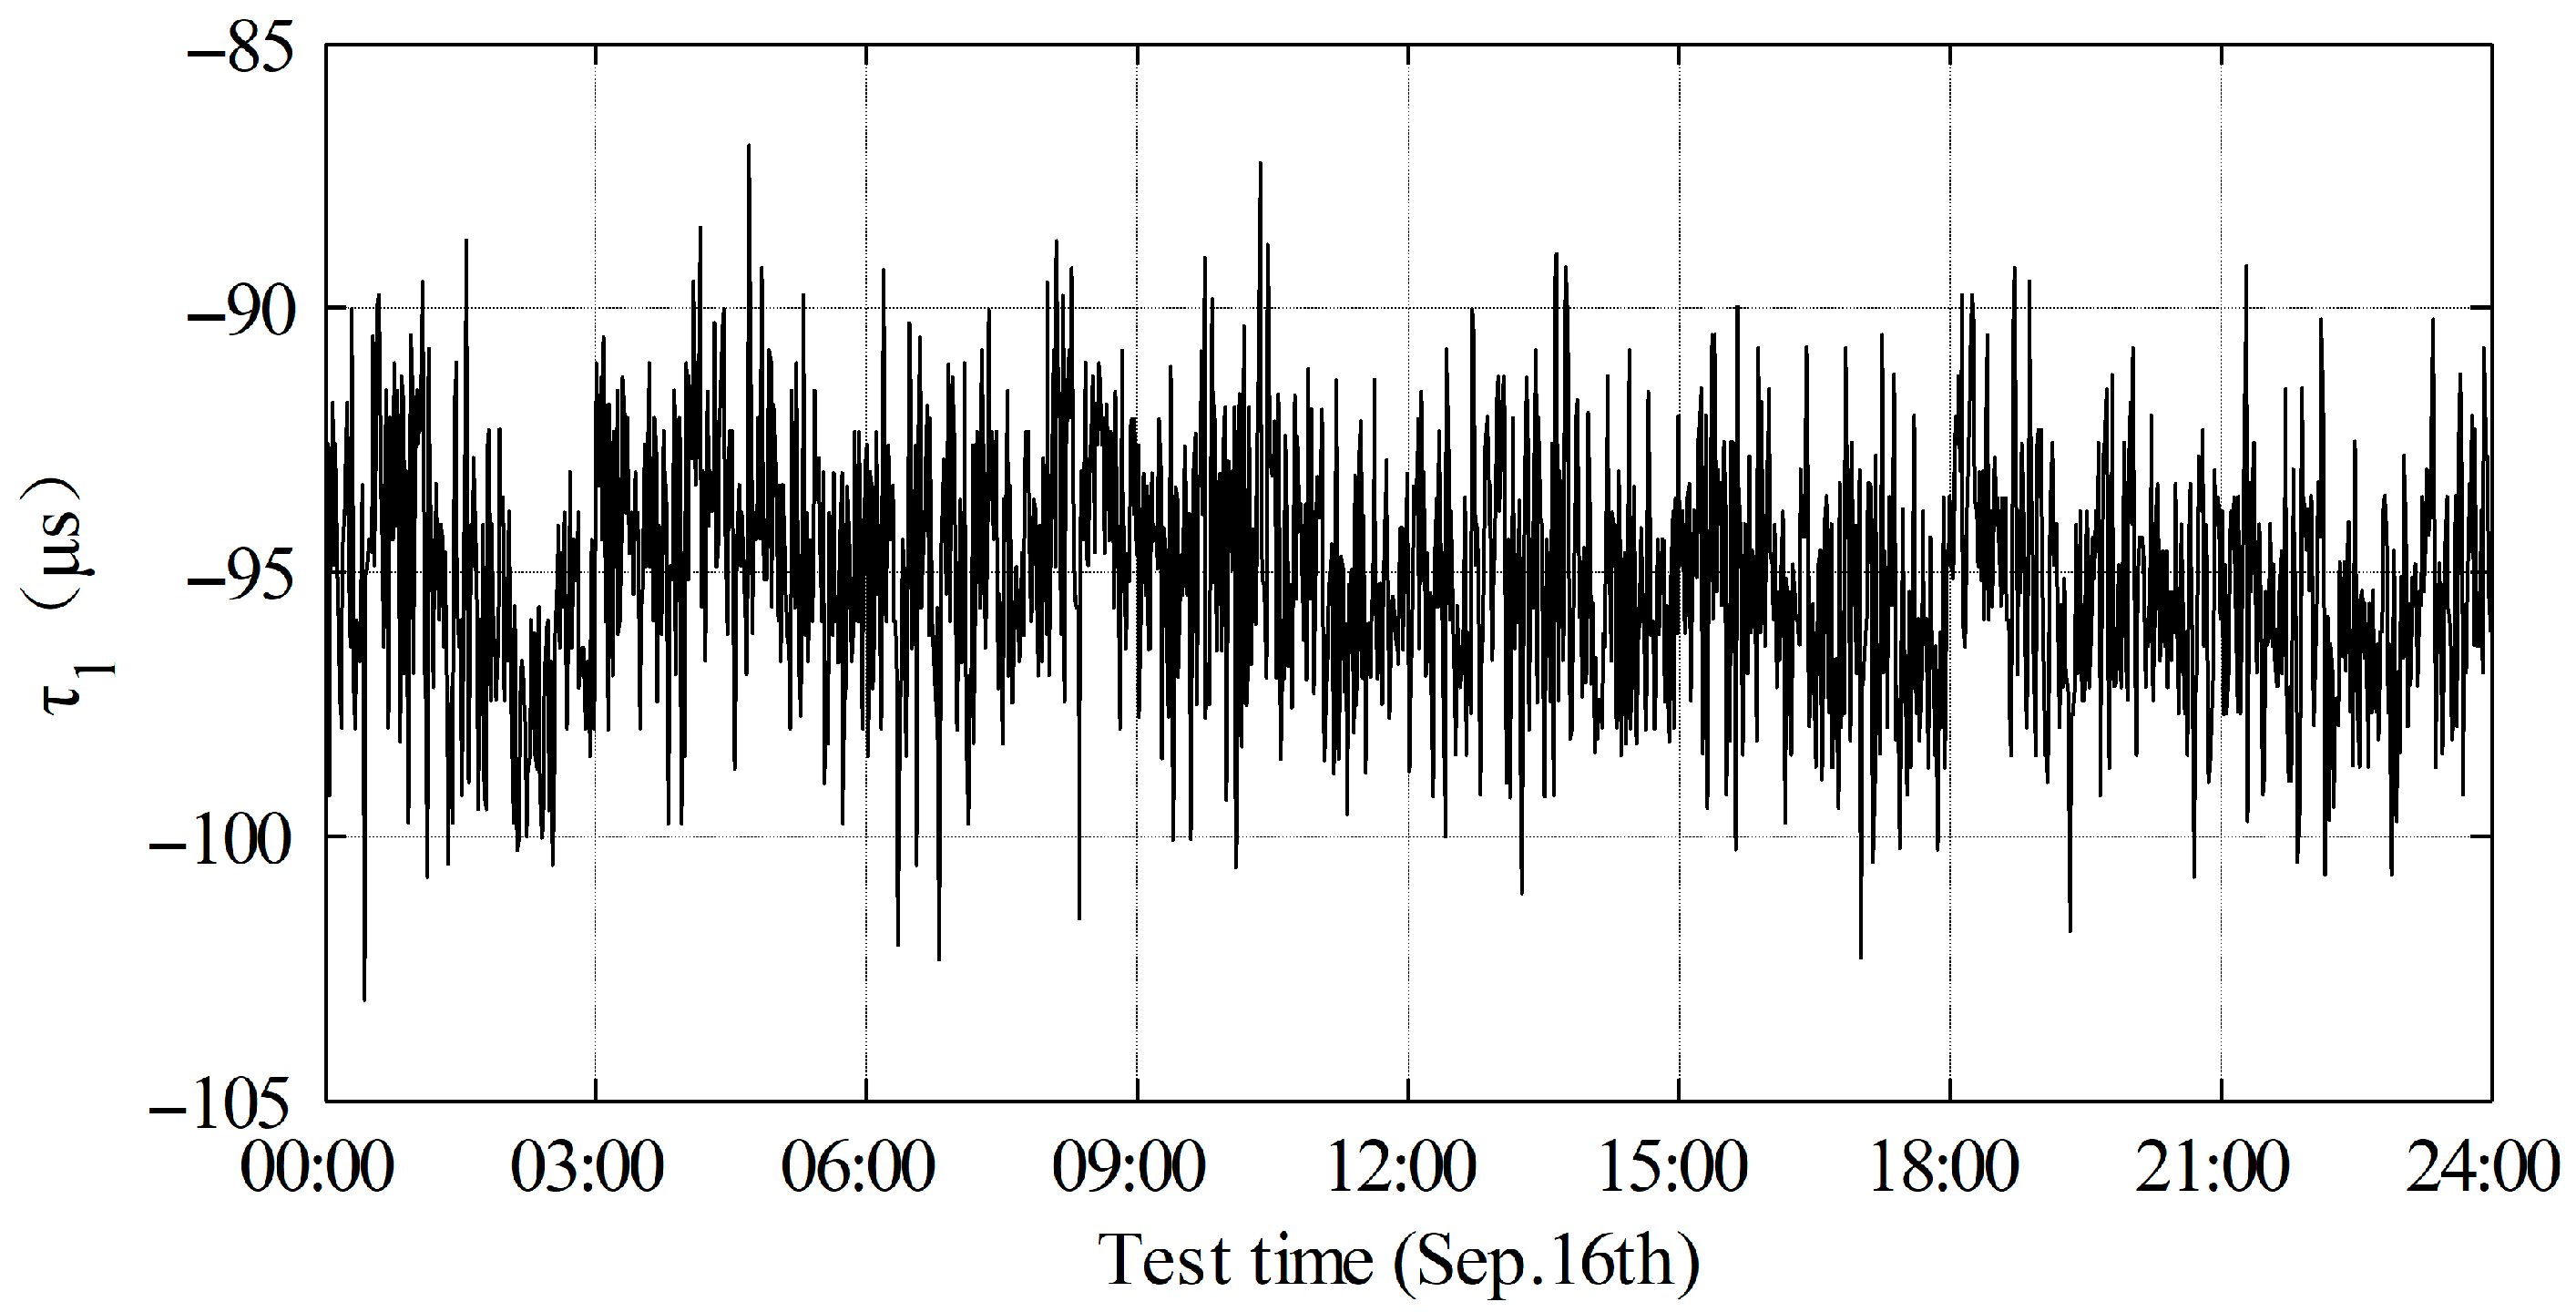
As a representative example, the Type A uncertainty associated with signal propagation delay at the Nanjing monitoring station is assessed in accordance with the method established in Section 2 and Equations (5) and (6). The computation is carried out using 24 h continuous measurement data randomly selected on 16 September 2022, with a total of sampling points. The processed results from the monitoring equipment are illustrated in Figure 5, yielding a Type A uncertainty of = 58 ns for this station.
Figure 5.
Propagation delay measurements at Nanjing Station in September 2022.
To validate the long-term robustness of the monitoring system, multi-period Type A uncertainty evaluations were performed at five geographically representative stations using datasets from September 2022, 2023, and 2024. For each period, was obtained from 24 h continuous propagation delay measurements randomly selected on a single day in September each year. The results are summarized in Table 2.
Table 2.
Multi-site and multi-period Type A uncertainty.
3.1.2. Type B Uncertainty
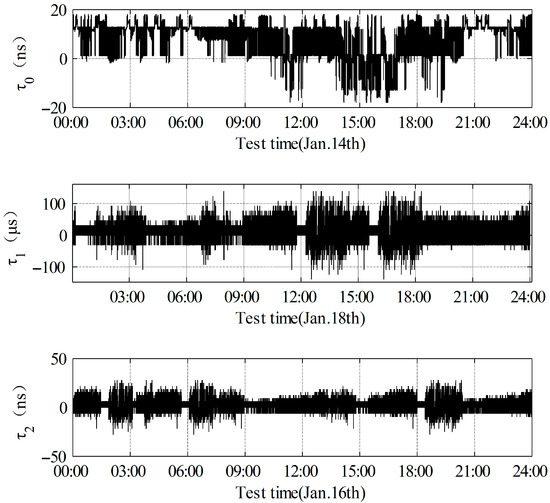
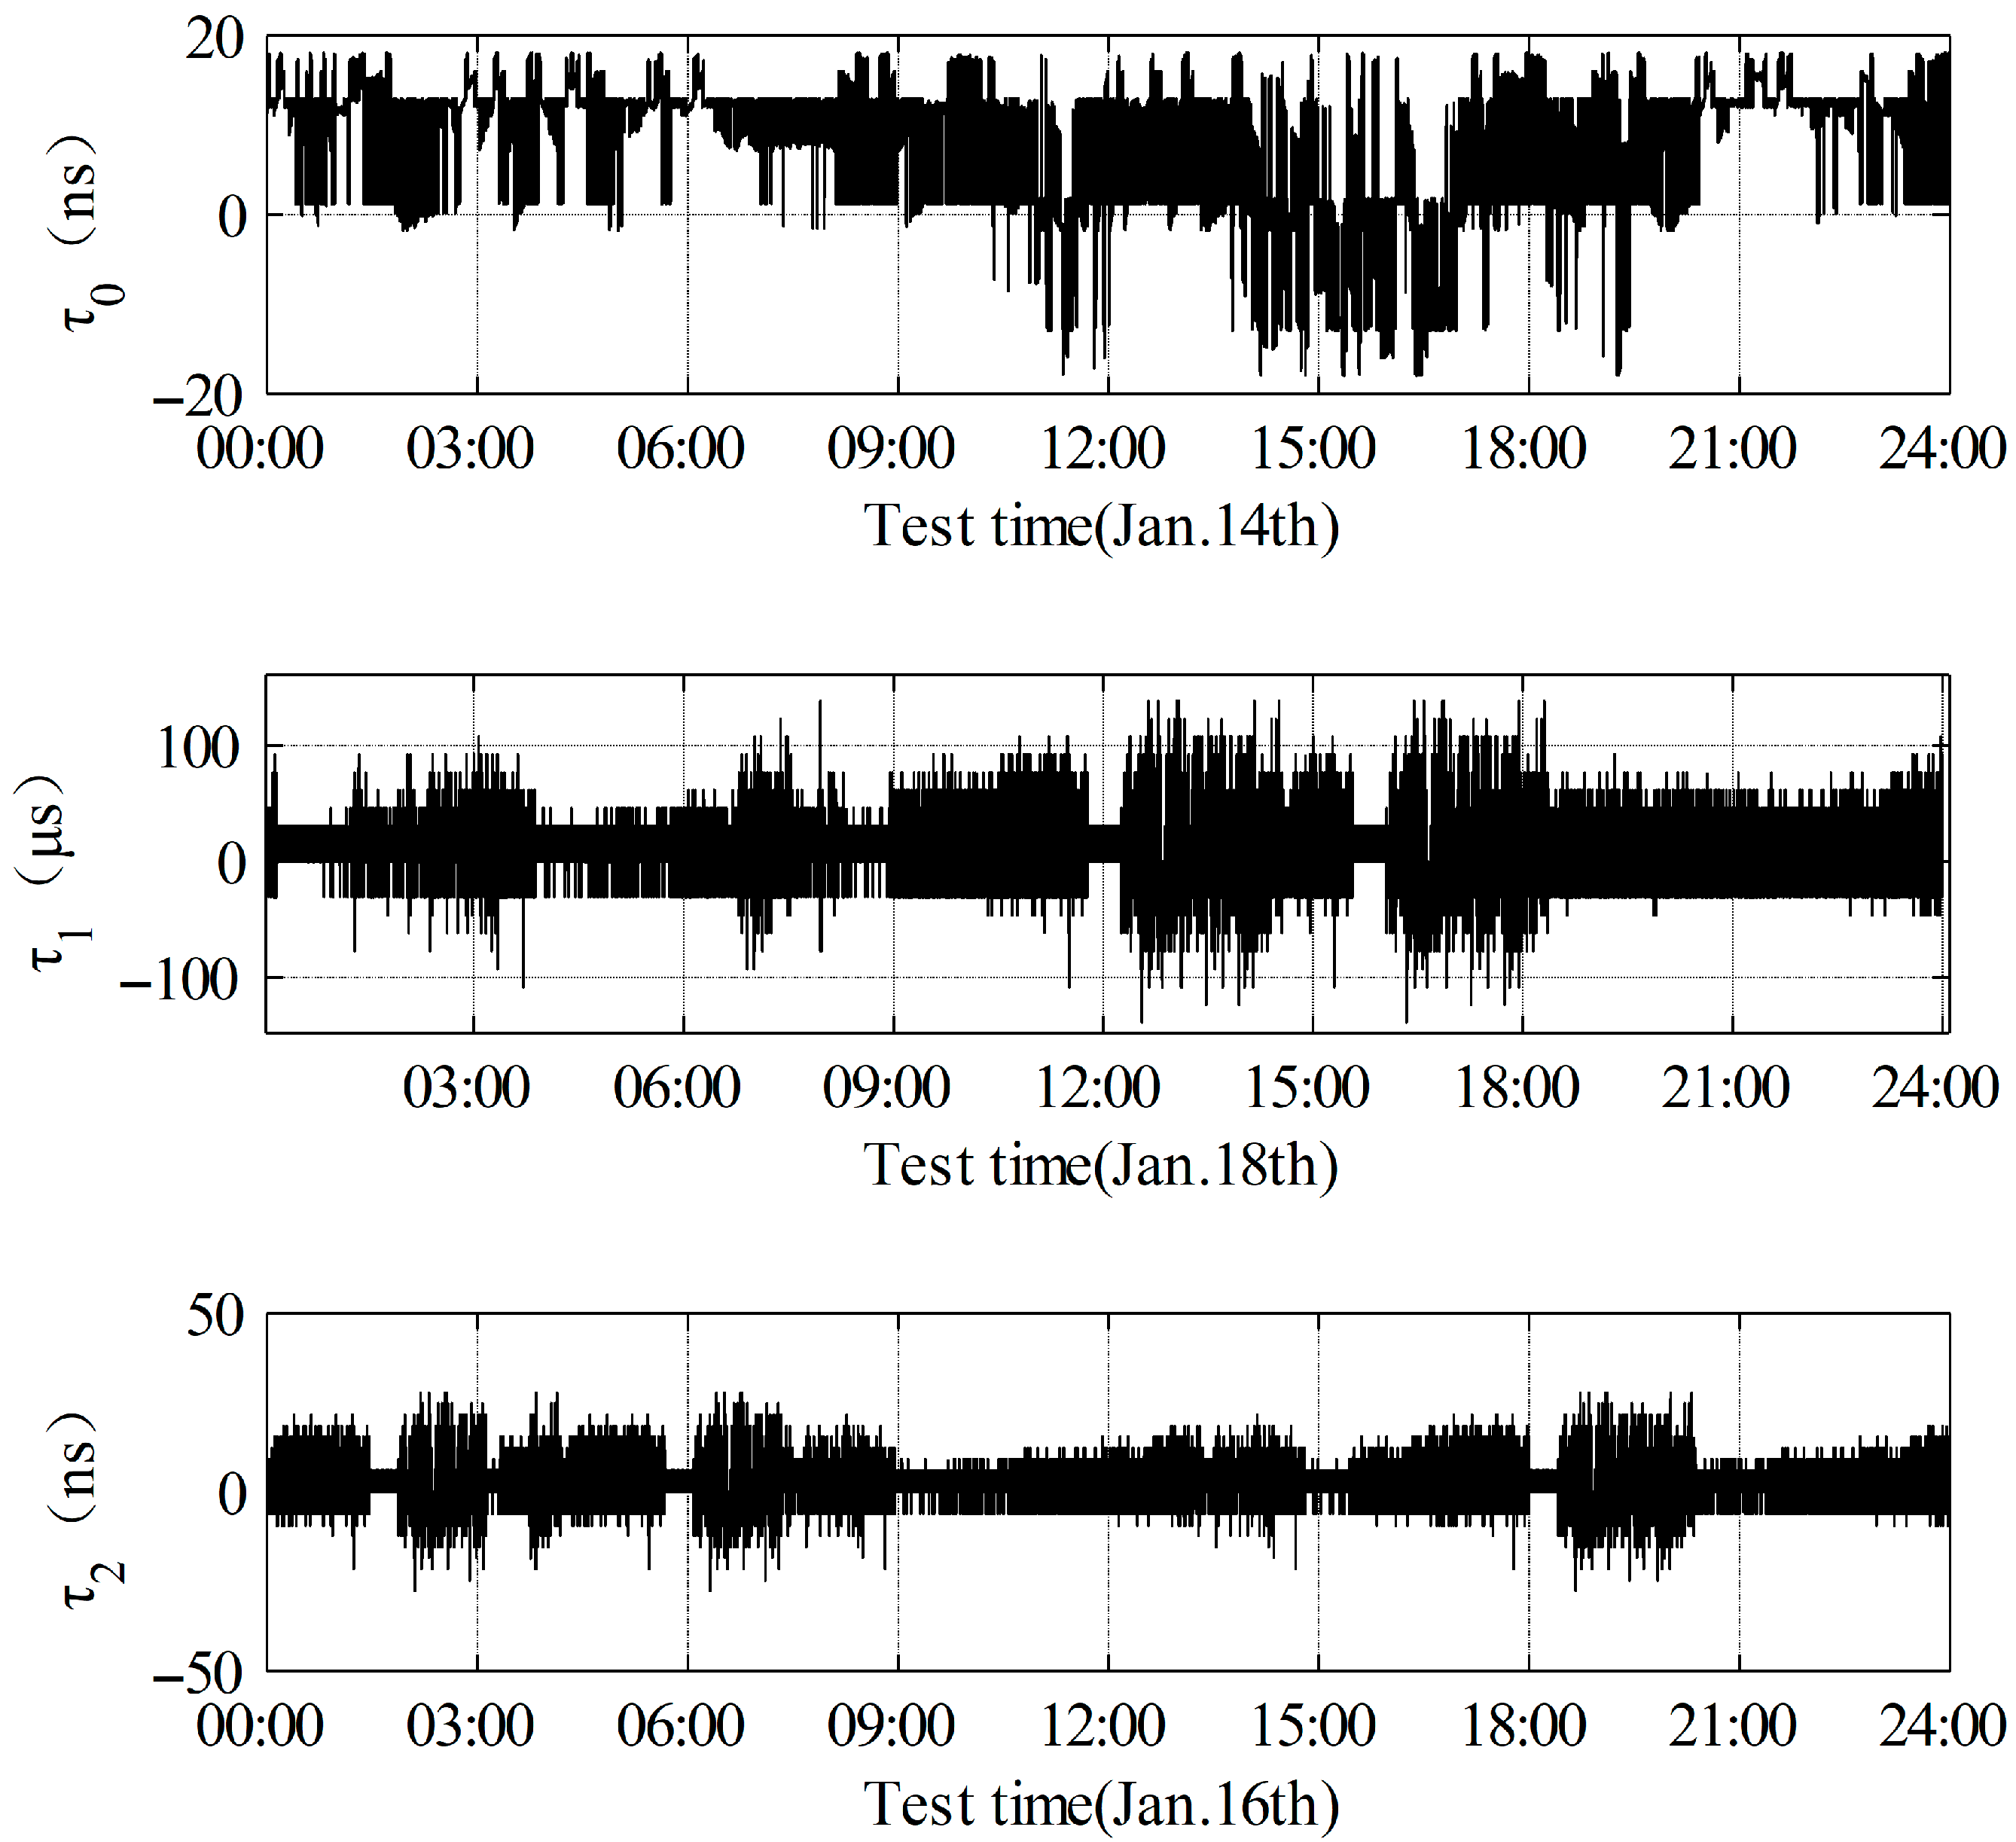
In January 2022, a test platform as illustrated in Figure 4 was established in Wuhan. The Type B uncertainty evaluation for all monitoring stations was performed strictly according to the procedure detailed in Section 2.4.3. Figure 6 presents the measured data for the Type B uncertainty evaluation of the equipment at the Nanjing monitoring station, with a total of n = 86,400 sampling points. All equipment was uniformly calibrated on this platform before factory delivery, ensuring consistent Type B uncertainty components across sites and avoiding repeated on-site calibration during operation.
Figure 6.
Measured data for Type B uncertainty evaluation of the Nanjing monitoring station equipment.
3.1.3. Comprehensive Analysis of MU
Based on the above Type A and Type B uncertainty evaluation methods for single and representative stations, the comprehensive MU of all ten monitoring stations was calculated in accordance with Equations (10) and (11), with the detailed results presented in Table 3. The inter-station differences in reflect the inherent geographical and propagation environment variations among different sites. Type B uncertainties , , and are systematic error terms that were uniformly calibrated via the platform in Figure 4 prior to delivery. The combined uncertainty was computed according to Equation (10), and the expanded uncertainty was adopted, corresponding to a 95% confidence level. As shown in Table 3, the MU of each station is dominated by the processing delay error (μs level), while the other components are at the ns level; their contributions to the combined uncertainty are therefore negligible. The dominant component is consistent across all stations, with the expanded uncertainty U ranging from 62.768 μs to 80.646 μs, all below 100 μs. Combined with the results in Table 2, which show that the values of the representative stations vary by no more than 100 ns over three years, the FMBT monitoring system demonstrates excellent generality and long-term stability in practical deployment.
Table 3.
Measurement uncertainties of monitoring stations.
3.2. Monitoring Results and Analysis of Timing Performance
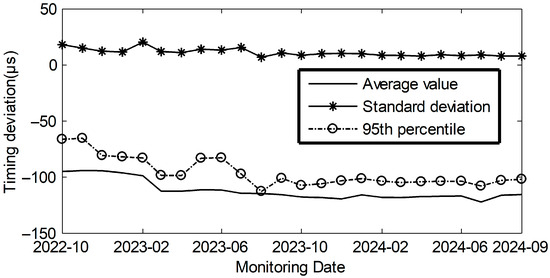
Following the establishment of the FMBT monitoring system, continuous monitoring was implemented. The mean timing deviation characterizes timing accuracy, the standard deviation reflects timing stability, and the 95th percentile represents the threshold below which 95% of the data fall. These indicators are critical for evaluating the fluctuation characteristics of the monitoring data. Figure 7 presents the 24-month statistical monitoring data of Nanjing Station (October 2022–September 2024). The monthly mean timing deviation ranges from −80 μs to −120 μs, with a standard deviation of approximately 10 μs and a 95th percentile within −60 μs to −100 μs. The timing deviation fluctuated more smoothly after October 2023, which can be attributed to the optimization of the monitoring antenna installation position after one year of system operation. Statistical analysis was conducted on the timing deviation data of all stations from October 2022 to September 2024, with the results summarized in Table 4.
Figure 7.
Statistical analysis of monitored data at Nanjing Station.
Table 4.
Statistical values of test data for each monitoring station.
To clarify the nature of the measured timing deviation and distinguish key timing metrics, it is noted that the mean timing deviation ranging from −294.860 μs to −71.848 μs across all stations represents the systematic offset of the FMBT system. This offset arises from the interplay between inherent SCA signal characteristics and station-specific geographical factors, and thus does not constitute the ‘true timing error’ of the FMBT system. As the direct embodiment of timing accuracy (a core component of overall timing precision), all the systematic offset values are controlled below 500 μs, which fully verifies that the FMBT system achieves the expected sub-millisecond timing precision. The measurement uncertainty of the timing monitoring system, with as its core component and the expanded uncertainty less than 100 μs, only serves to characterize the reliability of the measured timing data, and does not represent the timing error of the time service system. Additionally, the standard deviation of the timing deviation reflects the timing stability, which is independent of the aforementioned fixed systematic offsets.
Notably, Nanchang Station shows a significantly larger mean timing deviation (−294.860 μs) despite its high signal level (64 dBμV) and SNR (34 dB). Quantitative analysis demonstrates that this systematic offset is quantitatively consistent with the station’s unique geographical and climatic conditions, and detailed causal interpretation is presented in Section 4. Given a typical transmitter-receiver distance of 30 km, the hilly terrain surrounding Nanchang (elevation variations of 50–150 m) introduces a path extension coefficient of approximately 1.15–1.20, resulting in an additional path length of 4.5–6.0 km and a corresponding propagation delay of 15–20 μs. Furthermore, the subtropical humid climate (mean annual relative humidity: 75–80%) yields an atmospheric refractivity of 340–360 N-units, approximately 15% higher than inland stations, contributing an additional group delay of 30–40 μs over the 30 km path. The complex terrain also induces significant multipath effects; based on the ITU-R P.1407 model for hilly environments [33], the cumulative systematic delay from dominant reflection paths is estimated at 120–150 μs. The combined contribution of these factors (165–210 μs) quantitatively accounts for the observed 195 μs deviation from the other stations’ mean (−100 μs). The standard deviation of timing deviation at Nanchang (5.580 μs) is the lowest among all stations, indicating highly stable propagation conditions. This stability, combined with the high SNR (34 dB), rules out signal quality degradation as the cause of the large average deviation, reinforcing the systematic delay explanation.
Long-term monitoring and statistical analysis show that the mean timing deviation of all stations is less than 500 μs, with the 95th percentile ranging from −287.082 μs to −25.450 μs. These results effectively verify the sub-millisecond timing accuracy objective proposed in the preliminary design of the FM broadcast time service system [6], and the measured sub-millisecond performance (mean timing deviation < 500 μs) demonstrates the superiority of FMBT over BPC (≈1 ms accuracy) [9,10] in terms of timing precision. Meanwhile, FMBT can achieve sub-millisecond timing accuracy comparable to that of eLoran [11,12,13], and its terrestrial signal nature ensures stable operation in satellite-denied scenarios where GNSS [7,8] is generally unavailable. Under practical operating conditions (low electromagnetic interference, high SNR, and pre-calibrated delays), the FM broadcast time service system can realize stable sub-millisecond accuracy with favorable overall performance. These field results also illustrate the necessity of further investigation into propagation delay estimation models and anti-interference schemes to enhance the practical timing performance for end-users in complex environments.
4. Discussion
The above experimental findings present the timing performance of the FM broadcast time service system under various geographical, topographical and electromagnetic environments. Based on multi-site and long-term monitoring data of the system, this section further analyzes the key performance properties, inter-station discrepancies and their potential influencing factors, as well as the limitations of the current work and corresponding improvement strategies.
The quantitative insights from Section 3.2 enable a deeper analysis of the underlying physical mechanisms and system limitations. Timing deviations in FM broadcast time service systems are composed of global common errors and station-specific individual errors, both of which are closely related to the signal propagation environment, terrain conditions and electromagnetic interference intensity. These connections are clearly demonstrated in the aforementioned experimental results.
First, (Type A standard uncertainty) reflects the reliability of monitoring data acquisition under specific environmental conditions, as evidenced by the spatial and temporal variability observed in Table 2 and Table 3. It shows significant spatial variability (15–66 ns) and temporal variations across stations. Spatially, higher values in dense urban areas (Nanjing, Shanghai) arise from aggravated multipath effects and electromagnetic interference, while lower values in mountainous regions (Chengdu, Chongqing) indicate more stable monitoring conditions despite lower SNR. Temporally, variations are driven by seasonal atmospheric turbulence, fog, and urban development, with Chongqing showing the largest fluctuation (67 ns) and Nanchang remaining most stable (14 ns). Importantly, all values stay at the ns level, negligible compared to the μs-level Type B uncertainty, confirming that monitoring data reliability is consistently high across all stations.
Second, dominates the combined uncertainty across all stations, with values ranging from 31.384 μs to 40.323 μs. This indicates that processing delay errors in the receiving and demodulation module constitute the primary constraint on the measurement accuracy of the monitoring system. Because reflects systematic delays inherent to the monitoring hardware (rather than the broadcast link), the expanded uncertainty U (less than 100 μs) primarily characterizes the measurement reliability of the monitoring system, rather than the timing accuracy of the FM broadcast time service system. This conclusion is consistent with the error source decomposition analysis in Section 2.4, suggesting that subsequent hardware optimization should prioritize reducing the processing delay of the receiving and demodulation module, focusing on correcting systematic errors from hardware modules rather than random errors from environmental factors.
Third, Table 4 indicates that Nanchang Station presents a much larger mean timing deviation (−294.860 μs) than other stations, even though it has a high signal level (64 dBμV) and SNR (34 dB) as well as the lowest standard deviation of timing deviation (5.580 μs) among all stations. This contrast between large systematic offset and low timing deviation standard deviation reflects the FMBT service’s propagation stability, distinct from the monitoring system’s stability (14 ns) discussed above. This systematic offset is attributed to the station’s location in complex mountainous and hilly terrain with high humidity: terrain-induced path elongation, high-humidity atmospheric effects, and multipath jointly contribute ~165–210 μs systematic delay, quantitatively accounting for the observed deviation. This low standard deviation corroborates that the large deviation stems from systematic delay rather than random instability, thereby necessitating targeted correction in lieu of statistical suppression.
Three main limitations persist in this work. First, the single-station-per-city arrangement prevents spatial distribution mapping of regional timing performance, hindering the identification of weak service areas. Second, the model addresses fixed errors but neglects dynamic errors from extreme weather and seasonal variations. Although remains stable at the ns level (Table 2), indicating high monitoring reliability, the FMBT system itself exhibits time-varying propagation errors that require dynamic compensation. Third, validation is limited to ordinary urban environments, lacking performance data from complex scenarios such as industrial parks and intelligent transportation systems.
To overcome these limitations, three targeted improvement directions are proposed. First, dense monitoring nodes will be deployed in key regions (eastern plains and western mountainous areas) with real-time environmental sensing, enabling spatial mapping of regional timing performance and identification of weak service areas. Second, a dynamic error compensation mechanism will be established based on multi-site collaborative analysis and regression of environmental factors (SNR, terrain, weather), targeting systematic delay corrections. Hardware optimization will focus on reducing (processing delays), while adaptive algorithms will compensate for time-varying propagation delays. Third, validation will extend to complex scenarios (industrial parks, high-speed transportation) using the GUM-based evaluation framework to develop scenario-specific optimization strategies.
5. Conclusions
To fill the critical research gaps of operational FM broadcast time service systems outlined in the Introduction, namely the absence of systematic monitoring frameworks, long-term field empirical data, and standardized uncertainty evaluation protocols, this study conducts in-depth research on monitoring model construction, uncertainty quantitative analysis, and long-term multi-site performance verification.
A systematic monitoring model for FMBT is established to decompose and characterize key error sources throughout the monitoring process, including broadcast transmission delay, propagation delay, and processing delay. This model enables comprehensive and accurate characterization of timing deviations in practical operational scenarios, providing a rigorous theoretical foundation for subsequent timing performance measurement and evaluation. A standardized MU evaluation methodology based on the GUM is developed: targeted test schemes are designed for Type A (, characterizing monitoring repeatability) and Type B uncertainties (dominated by processing delay ), yielding an expanded uncertainty U < 100 μs that benchmarks the monitoring system’s measurement reliability, distinct from the timing accuracy of the broadcast service. This methodology establishes a reliable uncertainty benchmark, addressing the long-standing lack of standardized references in this field.
Two-year continuous multi-site monitoring across ten geographically diverse stations confirms that the FM broadcast time service system maintains stable sub-millisecond timing accuracy in long-term operation, with the mean timing deviation of each station remaining below 500 μs. The Nanchang case further illustrates that large systematic delays induced by complex terrain can coexist with high timing stability (i.e., low standard deviation), thereby necessitating targeted correction strategies over statistical averaging. This verification fully validates the system’s technical feasibility and long-term operational stability, offering solid empirical support for its engineering application and large-scale popularization.
The findings of this study possess significant theoretical and practical value: they enhance the operational reliability of FM broadcast time service systems and improve the practical timing accuracy for end-users, while filling the gaps in long-term field data and standardized evaluation methods for the technology. Moreover, the established monitoring and performance validation framework lays a crucial foundation for advancing FMBT technology and its integration into the national time service system.
As an emerging terrestrial timing technology, FMBT still faces challenges from complex reception environments. Future research will focus on multi-site collaborative analysis and adaptive compensation outlined in Section 4 to mitigate time-varying environmental impacts, targeting a 10–20% reduction in the standard deviation of timing deviation through real-time environmental feedback and digital compensation. These efforts aim to facilitate deployment in complex scenarios such as industrial networks and intelligent transportation systems, further expanding the application scope of this technology.
Author Contributions
Y.G.: Conceptualization; Methodology; Software; Writing—original draft; Writing—review and editing. X.Z.: Data curation; Formal analysis; Investigation. C.H.: Validation; Investigation. S.W.: Formal analysis; Supervision. Y.X.: Methodology; Supervision. Y.H.: Funding acquisition; Resources. All authors have read and agreed to the published version of the manuscript.
Funding
This work was funded by the Basic Research Program of Natural Sciences of Shaanxi Province (Grant No. 2024JC-DXWT-01).
Data Availability Statement
The original contributions presented in this study are included in the article. Further inquiries can be directed to the corresponding author.
Conflicts of Interest
The authors declare no conflicts of interest.
References
- GB/T 4311–2000; Technical Specifications for FM Sound Broadcasting at VHF. The State Bureau of Quality and Technical Supervision: Beijing, China, 2000.
- GY/T 268.1–2013; Digital Audio Broadcasting in FM Band—Part 1: Framing Structure, Channel Coding and Modulation for Digital Broadcasting Channel. The State Press and Publication Administration of Radio, Film, and Television: Beijing, China, 2013.
- Gao, L.; Liu, J.; Huang, Y.H.; Men, A.D. An Experimental Implementation of China Digital Radio (CDR) Broadcasting in Hubei. IEEE Trans. Broadcast. 2022, 68, 797–801. [Google Scholar] [CrossRef] [Scilit]
- Lee, J.-S. TV Datacasting System: New Opportunities in the Audio Subcarrier. IEEE Trans. Broadcast. 1999, 45, 116–121. [Google Scholar] [CrossRef] [Scilit]
- Anderson, D.A.; Sapiro, R.E.; Raithel, G. An Atomic Receiver for AM and FM Radio Communication. IEEE Trans. Antennas Propag. 2021, 69, 2455–2462. [Google Scholar] [CrossRef] [Scilit]
- Hu, Z.P. Study on the Timing Method and Key Technology of FM Broadcasting. Ph.D. Thesis, University of Chinese Academy of Sciences, National Time Service Center, Beijing, China, 2017. [Google Scholar]
- Zhu, L.; Zhang, H.J.; Li, X.H.; Zhu, F.; Liu, Y. GNSS Timing Performance Assessment and Results Analysis. Sensors 2022, 22, 2486. [Google Scholar] [CrossRef] [Scilit] [PubMed]
- Wang, L.; Chen, L.; Li, B.Y.; Liu, Z.; Li, Z.; Lu, Z. Development Status and Challenges of Anti-Spoofing Technology of GNSS/INS Integrated Navigation. Front. Phys. 2024, 12, 1425084. [Google Scholar] [CrossRef] [Scilit]
- Cao, H.Z.; Wu, J.F.; Guan, X.L.; Zhao, D.; Xing, Y.; Zhou, Z.; Li, Y.; Yin, K. Design of BPC LF Time Code Signal Generator Based on ARM Architecture Micro-Controller and FPGA. Electronics 2025, 14, 3128. [Google Scholar] [CrossRef] [Scilit]
- Wang, X. Research on Monitoring and Assessment Method of Low-Frequency Timecode Signal Quality and Timing Performance. Ph.D. Thesis, University of Chinese Academy of Sciences, National Time Service Center, Beijing, China, 2023. [Google Scholar]
- Kang, T.; Park, S.; Son, P.-W.; Seo, J. Enhancing eLoran Timing Accuracy via Machine Learning with Meteorological and Terrain Data. IEEE Access 2025, 13, 112067–112080. [Google Scholar] [CrossRef] [Scilit]
- Di, J.C.; Fu, J.; Xu, B.; Wu, M.; Liu, L.; Jin, X. Timing Performance Testing and Regularity Analysis of eLoran System. Appl. Sci. 2024, 14, 6580. [Google Scholar] [CrossRef] [Scilit]
- Yang, C.; Guo, X.H.; Li, S.F.; Hu, Z. Design and Performance Evaluation of eLoran Monitoring System. Appl. Sci. 2024, 14, 7350. [Google Scholar] [CrossRef] [Scilit]
- Yin, K.X.; Wu, J.F.; Ning, R.Z.; Chen, Y.; Liu, Q.; Wang, K. Preliminary Evaluation and Analysis of Differential Technology Performance of eLoran Timing System. Electronics 2025, 14, 789. [Google Scholar] [CrossRef] [Scilit]
- Dong, J.M.; Wang, Z.H.; Dou, J.Y.; Zhang, Y.; Yu, S.; Luo, B. Two-Way Fiber-Optic Time Synchronization System Based on Feedforward-Feedback Phase Compensation. IEEE Photonics Technol. Lett. 2025, 37, 1121–1124. [Google Scholar] [CrossRef] [Scilit]
- Wang, P. Joint Optimization of Channel-Coding and Modulation for Digital FM Broadcasting. Ph.D. Thesis, Tsinghua University, Department of Electrical Engineering, Beijing, China, 2011. [Google Scholar]
- Ke, X.Y. The Key Techniques of Receiver for the FM Radio Time Service. Master’s Thesis, University of Chinese Academy of Sciences, National Time Service Center, Beijing, China, 2017. [Google Scholar]
- Hu, Z.P.; Li, S.F.; Xiang, Y. Research on a New FM Broadcasting Timing Signal System. J. Electron. Inf. Technol. 2020, 42, 1661–1665. [Google Scholar] [CrossRef]
- Hu, Z.P.; Li, S.F.; Xiang, Y. Time Information Transmission Based on FM Broadcast Signal. IEEE Access 2021, 9, 16360–16364. [Google Scholar] [CrossRef] [Scilit]
- Zhao, X.; Gao, Y.Y.; Wang, S.H.; Huang, C.; Xiang, Y.; Hua, Y. Research on Monitoring and Receiving Technology Based on FM Broadcast Timing. In Proceedings of the Fourth International Conference on Signal Image Processing and Communication (ICSIPC 2024), Xi’an, China, 17–19 May 2024; pp. 450–456. [Google Scholar] [CrossRef] [Scilit]
- Chen, Y.M.; Li, X.H.; Huang, L.X.; Wang, X.; Liu, C.; Zhao, F.; Hua, Y.; Feng, P. GUM Method for Evaluation of Measurement Uncertainty: BPL Long Wave Time Service Monitoring. Measurement 2022, 189, 110459. [Google Scholar] [CrossRef] [Scilit]
- Qi, Z.; Huang, L.X.; Chen, Y.M.; Zhao, F.; Wang, X.; Liu, Q.; Ren, X.; Gao, Y.; Feng, P. Evaluation of Measurement Uncertainty in BPC Time Service Monitoring and Study on Time Service Performance and Characteristics. Measurement 2025, 257, 118803. [Google Scholar] [CrossRef] [Scilit]
- Huang, M.; Yang, D.R.; Zhu, D.; Yang, M.; Yang, J. FM Broadcast Monitoring Using Artificial Intelligence. Radio Sci. 2020, 55, 1–6. [Google Scholar] [CrossRef] [Scilit]
- Kutzner, J.A.; Lung, D. Predicting ATSC 3.0 Broadcast Coverage. IEEE Trans. Broadcast. 2016, 62, 281–288. [Google Scholar] [CrossRef] [Scilit]
- GY/T 196-2003; Technical Specifications for Coverage Networks of FM Sound Broadcasting. The State Press and Publication Administration of Radio, Film, and Television: Beijing, China, 2003.
- Johnson, P.B.; Novick, A.N.; Lombardi, M.A. Measuring the Timing Accuracy of Satellite Time and Location (STL) Receivers. In Proceedings of the Precise Time and Time Interval Systems and Applications Meeting (ION PTTI 2023), Long Beach, CA, USA, 23–26 January 2023; pp. 207–215. [Google Scholar] [CrossRef] [Scilit]
- Chen, Y. Research of eLoran Time Service Monitoring Evaluation Method and System Design. Ph.D. Thesis, University of Chinese Academy of Sciences, National Time Service Center, Beijing, China, 2022. [Google Scholar]
- Mahmoud, G.M.; Hegazy, R.S. Comparison of GUM and Monte Carlo Methods for the Uncertainty Estimation in Hardness Measurements. Int. J. Metrol. Qual. Eng. 2017, 8, 14. [Google Scholar] [CrossRef] [Scilit]
- Cox, M.; O’Hagan, A. Meaningful Expression of Uncertainty in Measurement. Accredit. Qual. Assur. 2022, 27, 19–37. [Google Scholar] [CrossRef] [Scilit]
- Harris, P.M.; Cox, M.G. On a Monte Carlo Method for Measurement Uncertainty Evaluation and Its Implementation. Metrologia 2014, 51, S176–S182. [Google Scholar] [CrossRef] [Scilit]
- Papoulis, A.; Pillai, S.U. Probability and Random Variables. In Probability, Random Variables, and Stochastic Processes, 4th ed.; McGraw-Hill: New York, NY, USA, 2002; pp. 72–435. [Google Scholar]
- Fei, Y.T. Measurement Uncertainty. In Error Theory and Data Processing, 7th ed.; China Machine Press: Beijing, China, 2010; pp. 82–99. [Google Scholar]
- Recommendation ITU-R P.1407-6; Multipath Propagation and Parameterization of Its Characteristics. International Telecommunication Union: Geneva, Switzerland, 2017.

Disclaimer/Publisher’s Note: The statements, opinions and data contained in all publications are solely those of the individual author(s) and contributor(s) and not of MDPI and/or the editor(s). MDPI and/or the editor(s) disclaim responsibility for any injury to people or property resulting from any ideas, methods, instructions or products referred to in the content. |
© 2026 by the authors. Licensee MDPI, Basel, Switzerland. This article is an open access article distributed under the terms and conditions of the Creative Commons Attribution (CC BY) license (https://creativecommons.org/licenses/by/4.0/).