


Abstract
Recent advances in immersive computing and artificial intelligence have enabled the development of adaptive, human-centered digital healthcare systems. This paper presents CareSync, an emotion-aware, data-driven architecture for personalized interventions and Multimedia Information Retrieval within the Healthcare Metaverse. Built on the SenseCare KM-EP platform, the CareSync framework integrates distributed healthcare services to orchestrate real-time, multi-source data processing, multimodal feature extraction, and semantic graph generation. This work advances T-Rehab, the platform’s metaverse-based telerehabilitation subsystem, by proposing a workflow for integrating multimedia information retrieval (MIR), physiological sensing, and markerless kinematic analytics within a metaverse-based healthcare environment, and by implementing this workflow as a functional real-time system. The implementation integrates camera-based physiological sensing, including POS-based remote photoplethysmography (rPPG) heart rate estimation with bandpass autocorrelation, chest-motion respiratory rate estimation with RIIV cross-validation, and RMSSD-based stress heuristics, with markerless biomechanical analysis. Using MediaPipe and Leap Motion tracking, the platform further assesses facial emotions, pain-related behavioral cues, and full-body kinematics, including joint angles, range of motion, movement symmetry, and repetition counting, enabling detailed real-time monitoring during immersive telerehabilitation sessions. For data indexing and retrieval, structured session outcome summaries and co-occurrence graphs are generated from telemetry and vitals, supporting both exact filter queries and graph-similarity ranking for sessions preserved via non-video 3D avatar replays. Actionable information is surfaced through real-time linear-trend and threshold-based alerts that monitor system-estimated indicators of participant stability, safety, and affect. The updated T-Rehab was evaluated on the (N = 26) participant cohort from the rPPG-10 benchmark dataset (27 subjects in total, with Subject 4 excluded). The evaluation compared five rPPG methods, GREEN, CHROM, POS, PCA, and ICA, using synchronized 30-s windows and the ECG reference. The results identified GREEN as the best-performing method, achieving the lowest mean absolute error (MAE) of 17.74 BPM. Furthermore, the participant-level evaluation and consistent 30-s windowing provide a transparent and reproducible basis for comparing non-contact heart-rate estimation methods. The results are intended as a methodological benchmark and should not be interpreted as demonstrating clinical accuracy.
1. Introduction
The integration of the Metaverse and Artificial Intelligence (AI) is transforming digital healthcare from traditional video-based telemedicine into immersive and adaptive environments. These technologies enable remote therapy and personalized rehabilitation, but current systems still lack real-time monitoring of patient states and efficient management of complex clinical data. The absence of affective, physiological, and structured session retrieval capabilities limits personalized interventions and historical analysis.
To bridge this gap, modern digital healthcare frameworks require robust pipelines capable of processing unstructured, multi-source multimedia data, including spatial interaction vectors and complex biological signals, at ultra-low latencies. A critical theoretical foundation for this multi-source data processing is the Generic Multimedia Analysis Framework (GMAF) [1]. GMAF provides a standardized architecture for parsing heterogeneous multimedia inputs, structural features, and semantic layers into a unified graph-based metadata format, which enables the indexing and retrieval of complex sessions.
However, extracting semantic structures from concurrent high-frequency streams, such as markerless motion data alongside time-series bio-signals, historically imposes a significant computational bottleneck. To maintain the strict real-time thresholds required for immersive medical deployment without relying on heavy external hardware dependencies, the current architecture presented in this work introduces an optimized, web-native implementation framework designed for efficient feature extraction and graph construction. This allows the framework to scale across multiple concurrent streams, transforming raw sensor inputs and behavioral interactions into high-level semantic graphs to achieve rapid execution times entirely within a lightweight runtime environment.
Deploying this technology within a clinical healthcare setting requires a highly scalable, flexible, and event-driven application layer. To achieve this, the CareSync architecture utilizes an asynchronous orchestration framework. This backend handles real-time data streaming, ingesting high-frequency physiological streams along with physical kinematic telemetry to coordinate the core multimedia processing pipeline.
The resulting structured semantic metadata graphs are then managed using a schema-flexible persistence layer. This data model provides the high-throughput storage system required to handle the continuous, unpredictable, and complex data structures generated by immersive Metaverse interactions, 3D avatar replays, and multimodal sensor fusions without sacrificing query latency during session retrieval.
In this paper, we present CareSync, a data-driven healthcare ecosystem built on the SenseCare KM-EP infrastructure. We extend its telerehabilitation subsystem, T-Rehab, by replacing simulated data with a real-time multimodal sensing and multimedia retrieval pipeline. The system combines contactless physiological monitoring (heart rate, respiratory rate, and stress estimation) with markerless motion analysis using using MediaPipe Tasks Vision v0.10.14 (Face Landmarker and Pose Landmarker Lite, float16, model version 1) for facial and body/joint tracking, and Ultraleap Hyperion tracking software (LeapSDK v5) with the original Leap Motion Controller (Developer Edition) for hand and wrist tracking, used under the non-commercial research/demonstration terms of the Ultraleap Tracking SDK Agreement (Ultraleap Limited, updated 22 March 2022). It extracts facial, eye, head, and full-body movement features and stores them using a graph-based indexing framework for efficient session retrieval. This integrated approach supports real-time adaptive rehabilitation and scalable management of rehabilitation sessions.
To investigate the implementation feasibility of the proposed CareSync framework and evaluate its physiological signal processing component, this study addresses three primary research questions:
RQ1: To what extent can the updated T-Rehab prototype feasibly be implemented within the CareSync framework to integrate physiological signals and markerless motion data for multimodal rehabilitation monitoring and analysis?
RQ2: How can multimedia retrieval be implemented within the updated T-Rehab prototype to support the indexing and retrieval of heterogeneous rehabilitation session data within the CareSync framework?
RQ3: Which rPPG method provides the most accurate heart-rate estimation in the updated T-Rehab prototype when compared with synchronized ECG reference measurements?
2. Related Work
Digital healthcare systems that support remote consultation, rehabilitation, and training increasingly depend on three complementary technical capabilities: multimedia information retrieval (MIR) to store, index, and retrieve the video, sensor, and extended reality (XR) recordings such systems generate; physiological sensing to capture a patient’s bodily and emotional state, ideally without physical contact; and markerless kinematic analytics to quantify movement quality without the cost and intrusiveness of marker-based motion capture. This section reviews prior work along each of these three axes, situates it within the broader affective-computing-and-XR framework established by prior systems in this research line, and identifies the gap addressed by the present work.
2.1. Affective Computing and Extended Reality in Remote Healthcare
Remote healthcare, rehabilitation, and training all confront similar issues, such as low patient engagement, limited hands-on experience, high costs, and difficulty monitoring patients during unsupervised sessions. Existing systems often solve these concerns by incorporating emotion and vital sign monitoring by video or sensor into remote healthcare activities. The CareSync framework [2] integrates affective computing with serious games to support adaptive healthcare applications. It demonstrated how emotion-aware interactions can improve patient engagement and personalize therapeutic interventions. The present work builds upon this foundation by extending these concepts to the updated T-Rehab framework. TheraSense applies deep learning to facial video for real-time emotion recognition during mental health teleconsultation, integrated into a clinical knowledge-management platform to support practitioner decision-making. Building on this pipeline, the T-Rehab system extends affect sensing into a semi-immersive virtual reality (VR) tele-rehabilitation setting, combining facial-expression analysis with contactless heartbeat monitoring so that clinicians can track a patient’s emotional and cardiovascular state while they perform a personalized rehabilitation exercise in VR. This is one instantiation of a broader pattern in clinical XR: a recent review of practical considerations for clinical XR deployments notes that extended reality shows strong promise across surgical simulation, training, and patient assessment, but that realizing this promise requires addressing clinical efficacy, technical, and regulatory challenges together rather than in isolation [3]. Complementary review work on XR for neuromusculoskeletal rehabilitation similarly finds that immersive, interactive environments are increasingly recommended specifically because they sustain patient motivation and adherence, a persistent weakness of traditional repetitive rehabilitation exercise [4].
While this line of work establishes the feasibility of combining affect sensing with immersive delivery, it stops short of the other two capabilities this paper addresses: it treats the resulting session recordings as an isolated system output rather than as multimedia to be retrieved and queried [5], and it tracks movement only qualitatively through game mechanics rather than through validated kinematic measurement.
To enable low-latency patient affective monitoring without heavy GPU demands, recent work leverages lightweight hybrid models. For instance, TriViT-Lite merges MobileNet with compact Vision Transformers and texture-aware attention to extract subtle facial micro-expressions efficiently [6]. CareSync builds on this efficiency by linking visual affect with real-time kinematic and physiological tracking in WebXR.
2.2. Multimedia Information Retrieval for Health and Extended Reality Recordings
Storing, indexing, and retrieving the audiovisual and sensor data collected during remote consultations or rehabilitation is essential for long-term clinical use. Early studies on video-based emotion monitoring in mental healthcare showed that facial-expression data should be stored in a structured patient data management system rather than analyzed and discarded [2]. TheraSense addresses this requirement by integrating data storage and management through a knowledge-management portal.
The retrieval problem becomes considerably harder once the recorded medium is not flat video but an XR or virtual-world session, since such recordings encode spatial, avatar, and interaction data that conventional video retrieval was not designed for. One dedicated line of work addresses this directly: a benchmark dataset of metaverse recordings supports evaluation of retrieval methods over this data type [7], subsequent research in multimedia information retrieval has investigated the integration of multimedia content into retrieval pipelines and the characterization of users’ information needs and search intent [8,9]. Related work has addressed the computational scalability of graph-based similarity search for large-scale and high-dimensional datasets [10,11]. These developments provide a foundation for indexing, organizing, and retrieving multimodal rehabilitation session data according to both structured attributes and similarity-based representations.
Independently, a separate research group has developed the open-source vitrivr retrieval stack specifically for querying multimedia collections from inside virtual and mixed-reality environments, including systems for browsing video content within a VR headset and for extending multimedia retrieval interaction into mixed-reality settings more broadly [12]. That two independent groups have converged on dedicated retrieval infrastructure for immersive recordings indicates that XR-generated multimedia is now recognized field-wide as a distinct retrieval problem rather than an extension of conventional video retrieval.
Healthcare queries are typically iterative rather than static. For example, a query like “shoulder mobility exercise” is only clinically significant after taking into account aspects like posture, contraindications, patient condition, and session stage. As a result, retrieval systems should offer clinically informed, iterative query refining rather than relying just on general purpose video retrieval.
2.3. Physiological Sensing for Remote Health Monitoring
A second requirement is capturing physiological signals without physical contact, particularly important inside an XR headset or during an unsupervised home session where wearable sensors are impractical. T-Rehab’s use of contactless heartbeat monitoring alongside facial affect recognition is one example of this within a rehabilitation context [13]. This connects to a substantial body of work on remote photoplethysmography (rPPG) [14,15], which extracts heart rate, heart rate variability, and related vitals from ordinary video by detecting subtle skin-color changes linked to blood flow. A recent survey positions rPPG as a key enabling technology for remote healthcare precisely because it requires only off-the-shelf cameras, while identifying motion and lighting artifacts as its main practical limitation [16]. Recent methodological work addresses this limitation directly: physiology-informed correction algorithms that constrain heart-rate estimates using cardiac dynamics substantially reduce measurement error [17], and hybrid frequency- and time-domain algorithms improve robustness for contactless pulse-rate estimation in remote patient-care settings [18]. Broader reviews of deep-learning-based contactless physiological measurement cover heart rate, heart rate variability, respiratory rate, and blood oxygen saturation, while noting that the field still lacks standardized evaluation protocols for telehealth deployment [19]. Recent studies highlight a shift toward multimodal contactless vital-sign monitoring, combining visual and radio-frequency sensing, and using datasets collected under cognitive or emotional stress instead of at rest [20]. This is particularly relevant for XR rehabilitation systems that monitor both emotions and vital signs during therapy sessions.
Beyond optical sensing, contactless physiological tracking has expanded to commodity acoustic devices. Recent techniques use smartphone-based Angle of Arrival (AoA) clustering to isolate chest-wall motion for simultaneous heart rate and breathing detection [21]. In contrast, CareSync uses a single optical camera pipeline to capture cardiovascular metrics, respiration, and biomechanics concurrently without active acoustic emission.
2.4. Markerless Kinematic Analytics
Assessing movement quality is essential for tracking rehabilitation progress but has traditionally relied on expensive marker-based motion capture systems. Markerless motion capture, using pose estimation or depth cameras, offers a lower-cost alternative for home-based and XR rehabilitation. Recent studies show that these systems provide reliable and accurate measurements for many rehabilitation and movement assessment tasks [22,23]. For upper-limb rehabilitation, recent studies show that markerless pose estimation can accurately track arm movements across different ranges of motion [24]. It also shows close agreement with traditional optical motion capture systems in stroke rehabilitation [25]. This differentiable-biomechanics approach, which jointly optimizes pose estimates against musculoskeletal constraints, together with probabilistic multi-view methods that provide calibrated uncertainty estimates, represents the current methodological frontier for making markerless capture clinically trustworthy for gait and movement analysis [26].
Existing XR rehabilitation systems support affect and physiological monitoring but lack validated movement analysis and multimedia retrieval. This work addresses these limitations by extending T-Rehab with markerless kinematic analysis and multimedia information retrieval, creating a unified tele-rehabilitation framework.
3. System Design and Methodology
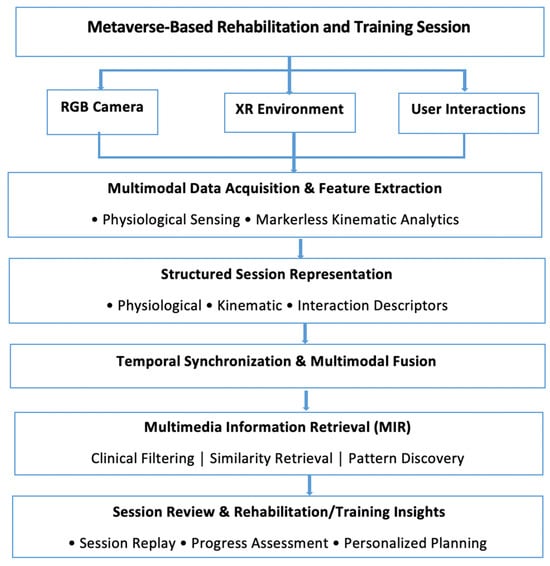
Figure 1 illustrates the conceptual workflow of the proposed framework for integrating multimedia information retrieval (MIR), physiological sensing, and markerless kinematic analytics within a metaverse-based healthcare environment. The workflow transforms multimodal information generated during immersive rehabilitation and training into structured, time-aligned data that supports retrospective analysis, multimodal information retrieval, and visualization of rehabilitation sessions.
Figure 1.
End-to-end conceptual workflow from multimodal data acquisition to structured data integration, retrieval, and visualization in metaverse-based rehabilitation and training.
The workflow begins with a Metaverse-Based Rehabilitation and Training Session, where the participant performs therapeutic exercises in an immersive virtual rehabilitation environment. During the session, multiple complementary information sources are generated simultaneously. The RGB camera continuously captures the participant’s body movements without requiring wearable sensors or physical markers, while the virtual rehabilitation environment provides the therapeutic context by managing rehabilitation exercises, virtual objects, and environmental events. at the same time, user interactions record participant engagement, task execution, system feedback, and rehabilitation and training events. Together, these sources provide a comprehensive representation of participants’ physical activities and interactions during rehabilitation and training in the metaverse.
The collected information is processed through the multimodal data acquisition and feature extraction stage. Markerless kinematic analytics estimates body pose, joint trajectories, and movement quality from the RGB video stream, whereas physiological sensing derives health indicators, including heart rate, respiratory rate, stress level, and emotional state, using privacy-preserving vision-based analysis. In parallel, interaction events generated during rehabilitation and training are transformed into structured behavioral descriptors representing participant engagement and task performance.
Since these heterogeneous modalities operate at different sampling frequencies and describe complementary aspects of rehabilitation and training, they are integrated through temporal synchronization and multimodal fusion.
All extracted information is aligned using a common session timeline, enabling physiological responses, movement characteristics, and rehabilitation and training events to be analyzed together throughout the immersive session.
The synchronized information is subsequently organized into a structured session representation containing physiological descriptors, kinematic descriptors, interaction descriptors, and rehabilitation and training-related events. Rather than storing raw multimedia recordings, the framework maintains compact symbolic and numerical representations that preserve temporal relationships while reducing storage requirements and limiting the exposure of raw visual data. This design supports efficient indexing, replay, and retrieval while reducing the storage and privacy risks associated with retaining raw video recordings.
The structured repository serves as the foundation for multimedia information retrieval, enabling rehabilitation and training sessions to be retrieved using exact attribute-based filtering and similarity-based retrieval. Exact filtering identifies sessions that satisfy predefined conditions, whereas similarity retrieval identifies rehabilitation and training sessions exhibiting comparable physiological responses, movement patterns, and interaction behaviors. Because retrieval is performed over structured descriptors rather than raw multimedia content, the retrieved results remain computationally efficient and interpretable. The source document specifically motivates explainable retrieval based on structured representations rather than opaque learned similarity models.
Finally, the retrieved information supports session review and rehabilitation and training-related analysis. Users can replay rehabilitation and training sessions, examine movement characteristics alongside physiological responses, investigate safety-related events, and compare session-level information across multiple sessions. These capabilities provide a structured basis for reviewing multimodal session data and exploring rehabilitation and training patterns. Consequently, the proposed framework integrates multimedia information retrieval, physiological sensing, and markerless kinematic analytics into a unified architecture for multimodal rehabilitation and training monitoring, visualization, and analysis within the metaverse.
4. Implementation
Building upon our previously proposed T-Rehab framework [13], this work extends the platform with a comprehensive multimodal recording, indexing, retrieval, and visualization pipeline for immersive rehabilitation sessions. While the original T-Rehab system provided the virtual rehabilitation environment and interaction mechanisms, the present implementation introduces several new capabilities, including privacy-preserving camera-based physiological monitoring, structured multimodal session recording, graph-based multimedia representation and similarity retrieval, three-dimensional session animation replay, and longitudinal trend analysis. These extensions enable clinicians not only to monitor rehabilitation sessions in real time but also to retrieve, compare, replay, and analyze historical sessions using multimodal information.
4.1. Multimodal Monitoring Module
The extended T-Rehab framework incorporates a client-side multimodal monitoring module that estimates physiological, biomechanical, and behavioral indicators throughout rehabilitation sessions. All processing is performed locally within the user’s browser using MediaPipe Tasks Vision (Face Landmarker and Pose Landmarker executed through WebAssembly). Consequently, raw camera frames never leave the client device, and only derived numerical measurements and symbolic events are transmitted to the server.
4.1.1. Emotion Estimation
Emotion is estimated from MediaPipe facial blendshape coefficients using a heuristic mapping between facial action patterns and six emotional categories: happy, sad, angry, surprised, fearful, and neutral. Composite emotion scores are obtained from weighted combinations of relevant blendshape activations and are temporally smoothed using an exponential moving average (α = 0.25) to reduce frame-to-frame fluctuations. The dominant emotion together with its confidence score is subsequently recorded as part of the multimodal session data.
4.1.2. Skeletal Tracking and Gesture Monitoring
Body movements are captured from MediaPipe Pose landmarks. Joint angles for the shoulders, elbows, hips, and knees are computed geometrically for every frame and continuously evaluated against participant-specific thresholds to classify movements as safe, caution, or unsafe.
Since wrist articulation is not available through MediaPipe Pose, wrist flexion measurements are obtained from Leap Motion hand tracking whenever available, with mouse or touch interaction serving as an alternative input modality. Rehabilitation events, including exercise repetitions, augmented reality transitions, milestone achievements, game events, and safety notifications are explicitly logged as timestamped interaction events.
4.1.3. Remote Physiological Monitoring
The proposed extension equips T-Rehab with camera-based physiological monitoring without requiring wearable sensors.
Heart rate is estimated using remote photoplethysmography (rPPG). Mean RGB values extracted from three facial regions are processed using the Plane-Orthogonal-to-Skin (POS) algorithm to suppress illumination and motion artifacts. The resulting pulse signal undergoes detrending, normalization, zero-phase band-pass filtering, and autocorrelation analysis to estimate heart rate. A signal-quality metric is computed simultaneously to quantify measurement reliability.
Respiratory rate is estimated through the fusion of two complementary signals. The primary estimate is derived from chest motion computed from shoulder landmarks, whereas the secondary estimate exploits respiratory-induced intensity variation (RIIV) extracted from the rPPG signal. Agreement between both estimates increases the confidence associated with the reported respiratory rate.
4.1.4. Pain and Stress Estimation
The extended implementation also introduces heuristic wellness indicators.
Pain is estimated by combining facial-expression analysis with joint safety assessment. Facial pain indicators are computed from weighted facial action patterns and fused with joint safety classifications to produce a normalized pain score.
Stress is estimated through a multi-factor heuristic model that combines heart-rate elevation relative to an individual baseline, blink-rate variation, emotional state, gaze instability, and heart-rate variability (RMSSD). The resulting score provides a continuous indication of the system-estimated stress level during rehabilitation and training sessions.
Since emotion, pain, stress, heart rate, and respiratory rate are intended to support rehabilitation and training monitoring rather than clinical diagnosis, the user interface presents these measurements as heuristic wellness and physiological indicators, together with confidence measures when available.
4.2. Privacy-Preserving Session Recording
A major extension introduced in this work is the implementation of a privacy-preserving recording subsystem. Unlike conventional tele-rehabilitation platforms that store video or audio recordings, T-Rehab records only structured multimodal information extracted locally from the client.
Each rehabilitation session generates three synchronized temporal streams:
- Vitals, containing physiological and wellness indicators such as emotion, pain, stress, heart rate, respiratory rate, gaze, blink rate, and additional derived measurements.
- Telemetry, containing timestamped joint angles together with their corresponding movement safety classifications.
- Interactions, containing timestamped rehabilitation events including exercise repetitions, game events, augmented reality transitions, and safety notifications.
All records are timestamped relative to the beginning of the rehabilitation session, enabling synchronized playback and direct comparison across multiple rehabilitation sessions.
Three-Dimensional Session Replay
Instead of replaying recorded video, T-Rehab visualizes rehabilitation sessions directly from the stored telemetry stream. The replay engine reuses the same Three.js avatar employed during live rehabilitation, ensuring visual consistency between live monitoring and session review.
Interactive controls allow users to pause and resume playback, adjust the playback speed, and navigate through the session timeline. When navigating to an arbitrary timestamp, the replay engine updates the avatar using the corresponding recorded joint-angle values, allowing the movement state at that timestamp to be visualized without replaying intermediate frames. Because the stored telemetry contains local per-joint angles without global position, root orientation, segment lengths, or depth information, the resulting visualization represents relative joint movement rather than an absolute, spatially calibrated three-dimensional body pose. No reconstruction error against a ground-truth motion reference has been measured.
4.3. Session Indexing and Retrieval
To facilitate efficient exploration of recorded rehabilitation sessions, the extended T-Rehab framework implements complementary structured and graph-based retrieval mechanisms.
4.3.1. Structured Outcome Indexing
Following completion of each rehabilitation session, the recorded multimodal streams are summarized into a set of session-level descriptors. These descriptors are divided into two categories according to their evidentiary status: logged descriptors and heuristic composite descriptors.
Logged descriptors. Points earned, repetitions completed, and the session completion ratio (i.e., repetitions completed relative to the prescribed protocol target) are directly derived from logged events and represent deterministic counts or ratios rather than heuristic estimates. Repetition counting is performed using a threshold-crossing rule applied to the joint-angle signal. Although this counting rule has not been independently validated against manual annotations, the resulting repetition count represents the system’s recorded tally. Similarly, hyperextension events are counted directly from telemetry frames in which a tracked joint is classified as unsafe according to predefined safety thresholds. While the resulting count is directly logged, the underlying safety thresholds are based on clinician-defined limits rather than being automatically derived within the system.
Heuristic composite descriptors. The stability and balance scores are session-level composite measures calculated from bilateral joint-angle symmetry and hand/wrist motion smoothness, respectively, and normalized to a 0–100 scale. Neither measure was derived from or validated against an established clinical assessment instrument and should therefore be interpreted as an unvalidated proxy measure. Similarly, average pain, average stress, and dominant emotion are heuristic estimates and should not be interpreted as clinically validated measurements.
The descriptor referred to as a fatigue indicator is more precisely defined as a co-occurrence count of session frames in which the stress and pain heuristics simultaneously exceed predefined thresholds. Because this measure combines two unvalidated heuristics and relies on manually specified thresholds, it is not presented as a physiological measure of fatigue. Instead, it is described as an exertion-proxy flag with no validated clinical basis and is distinct from established fatigue or perceived-exertion instruments such as the Borg Rating of Perceived Exertion (RPE) scale.
Together, these descriptors form a structured session index that enables deterministic retrieval of rehabilitation sessions using conventional database filtering. Sessions can be queried according to rehabilitation protocol, logged performance measures, heuristic physiological or emotional descriptors, temporal constraints, and safety-related events. Filtering based on heuristic descriptors reflects the system’s internal estimates and should not be interpreted as retrieval based on confirmed clinical outcomes. This indexing mechanism provides deterministic, filter-based access to session records rather than similarity-based ranking.
4.3.2. Graph-Based Session Similarity
To complement structured outcome-based retrieval, the extended T-Rehab framework introduces a graph-based multimedia representation that captures co-occurrence relationships among heterogeneous rehabilitation events. Rather than relying solely on aggregated session statistics, this representation models the joint occurrence of physiological, biomechanical, and interaction events within a bounded time window throughout an immersive rehabilitation session. This representation is intended to capture which events tend to co-occur, not their order or fine-grained timing, and its current formulation has a number of open methodological limitations, discussed at the end of this section.
Each recorded session is transformed into a weighted, undirected co-occurrence graph, where nodes represent discretized rehabilitation states extracted from the multimodal streams. Pain and stress scores (0–100) are mapped to three fixed, equal-width bins—low (<33), medium (33–65), and high (≥66)—using hand-set thresholds that have not been tuned against an empirical score distribution. Joint safety is classified against predefined participant-specific limits into caution (within a fixed 5° margin of the limit) and unsafe (outside the limit); the safe state, which dominates most sessions, is deliberately excluded as a node to avoid a high-frequency, low-information state collapsing similarity scores across sessions. Emotional state is represented directly as one of six undiscretized categorical labels (happy, sad, angry, surprised, fearful, neutral). Rehabilitation interaction events (e.g., exercise start/stop) are included as additional nodes.
Two nodes were connected when their corresponding events occurred within a fixed three-second co-occurrence window. The edge weight was incremented by one for each observed co-occurrence during a session. The three-second window and the discretization thresholds were defined heuristically and were not empirically optimized; sensitivity to alternative window sizes and bin boundaries remains to be investigated. Edge weights represent raw co-occurrence counts and are not normalized for session duration or total event frequency. Consequently, sessions with longer durations may yield denser graphs and higher absolute edge weights. Session similarity was computed using weighted Jaccard similarity, which partially reduces the influence of differences in absolute event counts through its min–max formulation. The resulting graph therefore represents the frequency of event co-occurrences within a fixed temporal window rather than event order or precise temporal dynamics. Accordingly, the proposed similarity measure should be considered an exploratory representation, and further validation against baseline methods, relevance benchmarks, and expert assessment of interpretability is required before drawing conclusions regarding retrieval performance.
Similarity between two rehabilitation sessions is computed using the weighted Jaccard similarity coefficient:
where E denotes the union of the edges present in the graphs of the two sessions, and w_i(e) represents the raw co-occurrence count associated with edge e in graph G_i. Edges absent from a session graph are assigned a weight of zero. If neither session contains any edges, the similarity is undefined, and the corresponding session pair is excluded from the ranking. Otherwise, the similarity score ranges from 0 to 1, with higher values indicating greater similarity in the co-occurrence patterns of multimodal states between the two sessions.
Because edge weights are raw, unnormalized co-occurrence counts, this measure is not fully invariant to session duration or overall event frequency: the min/max structure prevents a single very high weight in one session from disproportionately inflating the numerator, but a longer or more event-dense session will still tend to produce larger absolute weights that dominate the denominator relative to a shorter session exhibiting an otherwise identical pattern. This limitation is discussed further in Section 6.2, where duration- or frequency-based normalization of edge weights is identified as an important direction for future work.
4.4. Multimodal Visualization and Clinical Analytics
The visualization layer integrates temporal, spatial, and graph-based representations within a unified dashboard to support the exploratory analysis of rehabilitation and training session data. It presents physiological measurements together with system-derived outputs, including emotion, pain, stress, joint-safety classification, and graph-based similarity. Outputs generated by heuristic components are presented as system estimates and should not be interpreted as clinically validated measurements.
4.4.1. Live Multimodal Monitoring
During active rehabilitation sessions, the dashboard displays a continuously updating multimodal timeline showing estimated emotion, pain, stress, heart rate, respiratory rate, and rehabilitation interaction events. This live view provides an overview of the session as it unfolds and enables simultaneous inspection of physiological measurements, estimated affective states, and rehabilitation events.
4.4.2. Session Review
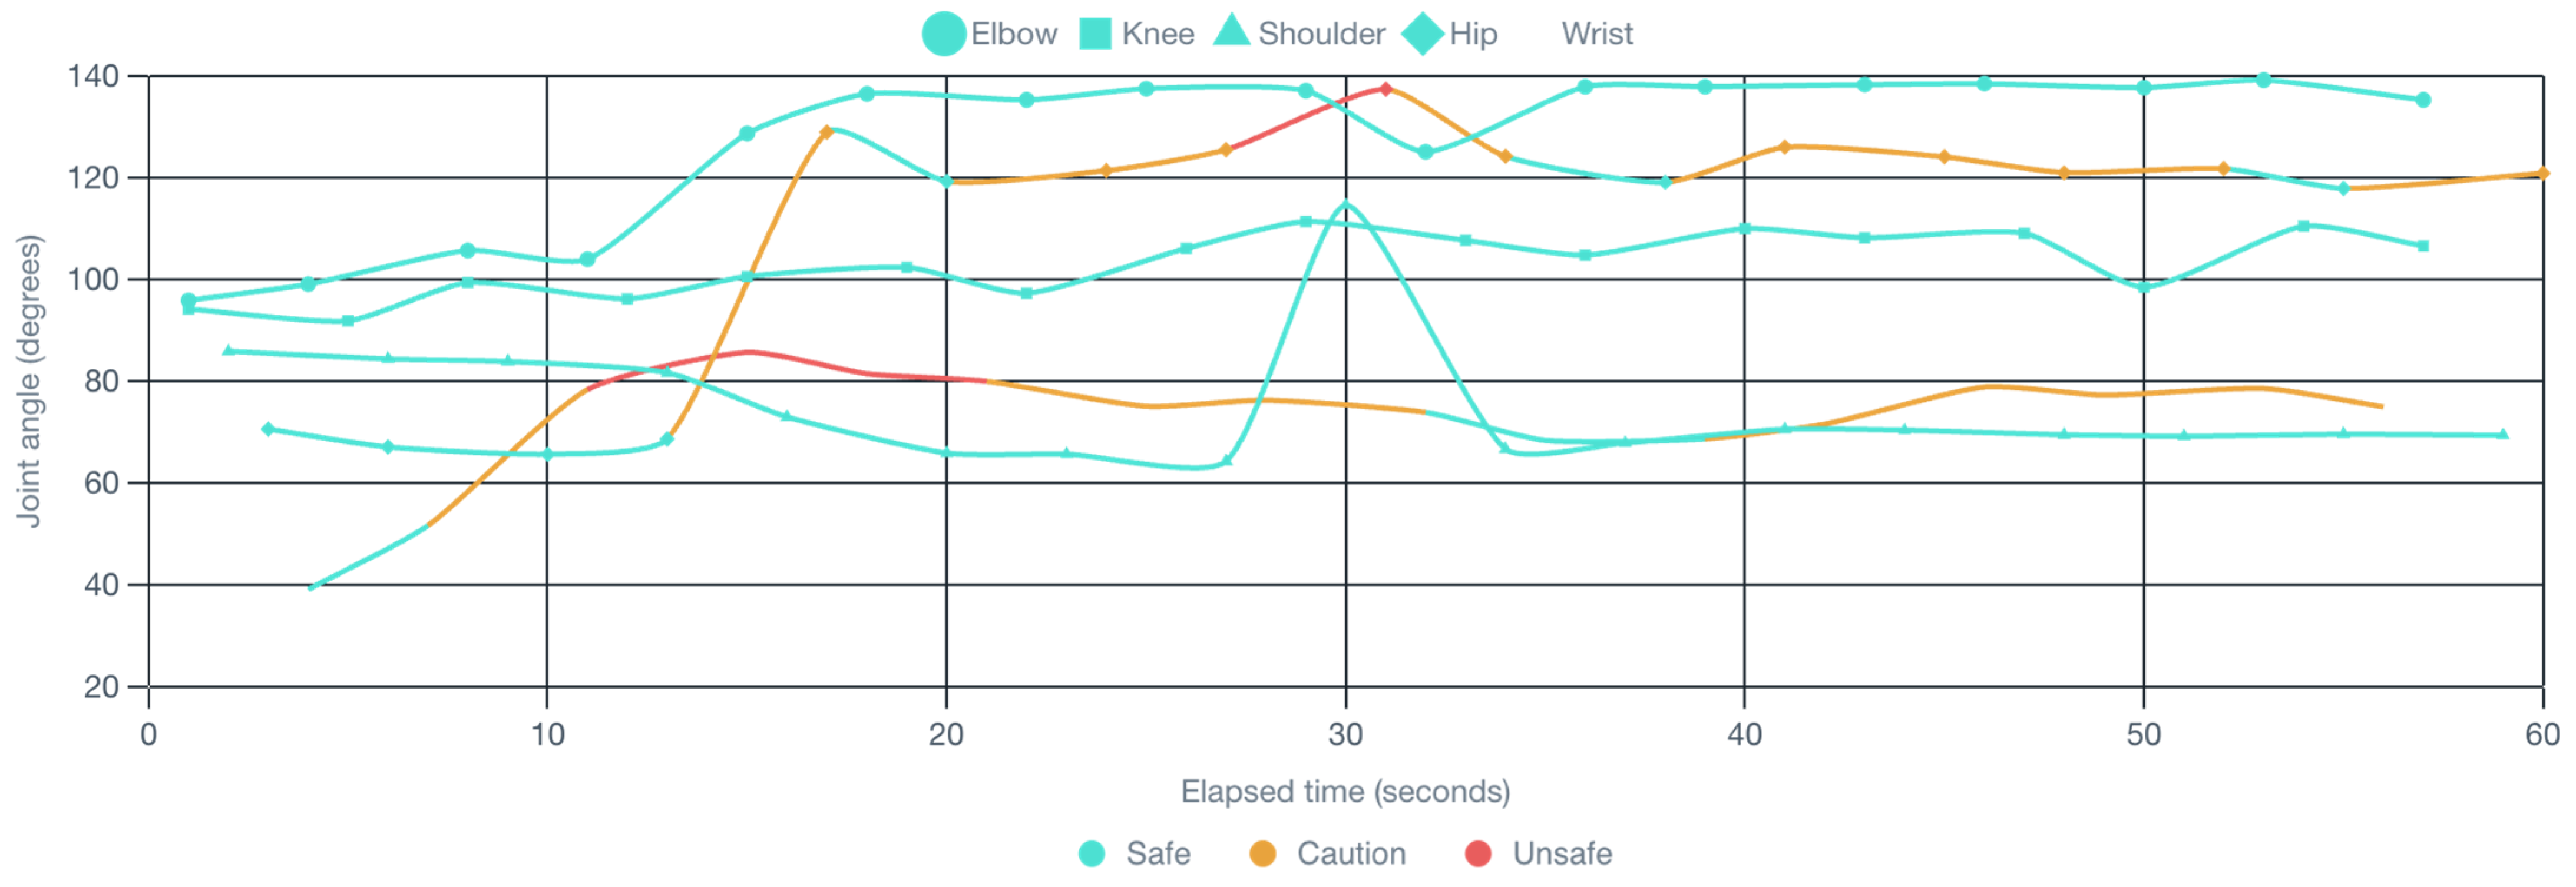
Completed rehabilitation sessions are visualized using synchronized Chart.js visualizations. The first chart presents heart rate, respiratory rate, estimated emotion, pain, and stress, together with rehabilitation events over time. The second chart displays joint-angle trajectories for all monitored joints, with movement segments color-coded according to the safety classification. This visualization enables reviewers to identify movement segments associated with predefined safety thresholds.
A summary panel accompanies these visualizations and presents rehabilitation duration, stability score, balance score, average pain, average stress, dominant emotion, and recorded safety events. The stability, balance, pain, stress, and emotion measures are derived from the system’s heuristic processing and are presented as descriptive session-level indicators rather than validated clinical indices.
4.4.3. Three-Dimensional Animation Replay
The recorded per-joint angle telemetry is visualized as an animated Three.js avatar synchronized with the physiological measurements and rehabilitation timeline. Because the recorded telemetry contains local per-joint angles without global position, root orientation, segment lengths, or depth information, the animation represents relative joint movement over time rather than an absolute, spatially calibrated three-dimensional body pose. It is therefore intended as an angle-driven visualization aid for reviewing movement timing and patterns rather than as a validated 3D motion-capture reconstruction.
4.4.4. Similarity Visualization
Graph-based retrieval results are displayed as ranked lists of similar rehabilitation sessions together with node-link diagrams representing the corresponding session graphs. Node size reflects occurrence frequency, while edge thickness represents co-occurrence weight. The visualization also highlights the highest-weight shared edges identified during similarity computation, providing a candidate explanatory view of the co-occurring states contributing to the similarity score. This graph-based similarity approach has not yet been benchmarked against baseline retrieval methods, and the interpretability of the shared-edge representation has not been evaluated with clinicians.
4.4.5. Longitudinal Trend Analysis
The extended implementation provides descriptive longitudinal analytics across multiple completed rehabilitation sessions. Linear trend analysis is performed for average pain, average stress, stability score, and balance score, while rule-based analyses identify recurring safety events and recurring negative-emotion patterns.
These analyses summarize changes in the system’s estimated measures over time and are intended to support exploratory review of rehabilitation and training history. They do not constitute predictive or diagnostic models, and trends in heuristic outputs should not be interpreted as independently confirmed changes in clinical status. Clinical utility and clinician-facing usability remain subjects for future evaluation.
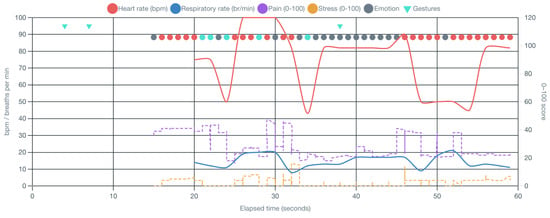
Figure 2 illustrates an example of the multimodal timeline generated by the extended T-Rehab framework during developer-conducted feasibility testing. The visualization integrates physiological measurements, estimated affective states, and rehabilitation interaction data into a synchronized temporal view. Heart rate (beats per minute) and respiratory rate (breaths per minute) are plotted on the left vertical axis, while estimated pain and stress scores are displayed on the right vertical axis using a normalized 0–100 scale. Estimated emotional states are represented as discrete colored points at a fixed vertical position for readability, while rehabilitation gestures and interaction events are displayed as markers above the timeline. The visualization illustrates the system’s ability to synchronize and display multimodal outputs and is not intended to represent participant or clinical evaluation. Interactive tooltips provide the timestamp and recorded value for each plotted point.
Figure 2.
Example of the multimodal timeline generated during developer-conducted feasibility testing. Heart rate and respiratory rate directly measured physiological signals, shown as solid lines, are plotted on the left vertical axis, while estimated pain and stress scores, derived heuristic estimates, shown as dashed lines, are displayed on the right vertical axis using a normalized 0–100 scale. Estimated emotion states and rehabilitation gesture events are represented as markers at fixed vertical positions to improve readability while remaining synchronized with the temporal axis. Interactive tooltips enable inspection of the corresponding timestamps and recorded values for individual measurements and events.
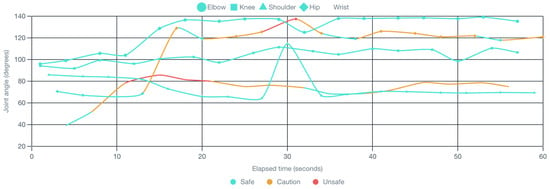
Figure 3 presents the joint-angle visualization generated from the recorded telemetry stream during developer-conducted feasibility testing. Each curve represents the temporal evolution of a tracked joint angle throughout the rehabilitation session. Color encodes the computed movement-safety status rather than joint identity, with cyan indicating movements within the predefined safe range, amber denoting caution, and coral indicating joint positions classified as unsafe according to the predefined rehabilitation thresholds. Individual joints remain distinguishable through the legend and can be interactively enabled or disabled to facilitate inspection of specific joint trajectories. This representation supports visual identification of segments associated with safety-threshold crossings while preserving the temporal evolution of joint kinematics.
Figure 3.
Representative example of joint-angle visualization generated from the recorded telemetry stream during developer-conducted feasibility testing. Each line represents a tracked joint, while line segments and data points are colored according to the computed movement-safety status (cyan = safe, amber = caution, coral = unsafe), rather than joint identity. Individual joint trajectories can be selectively displayed using the interactive legend, facilitating detailed inspection of specific joint movements. The figure illustrates the system’s processing and visualization of joint-angle telemetry and predefined safety classifications and does not represent participant or clinical evaluation.
5. Experimental Evaluation and Results
This section presents the experimental evaluation of the multimodal monitoring components integrated into the extended T-Rehab framework. A quantitative assessment was conducted to evaluate the performance of the physiological sensing component of the updated T-Rehab prototype [27,28]. The evaluation focuses on validating the accuracy and robustness of the proposed bio-heuristic remote photoplethysmography (rPPG) pipeline for contactless physiological monitoring. Heart rate (HR) estimations is quantitatively evaluated against synchronized physiological reference sensors.
5.1. Evaluation Protocol
The evaluation was conducted using the public rPPG-10 reference database [29] containing synchronized facial video recordings and physiological measurements. The dataset originally included 27 healthy Portuguese university students, of whom 26 (12 male and 14 female; 22.5 ± 1.2 years) were analyzed. Subject_4 was excluded due to significant artifacts in the video and ECG data.
Each participant contributed a 10-min (600 s) facial video, divided into three ROIs: the forehead, right cheek (Cheek1), and left cheek (Cheek2). These ROIs represent repeated spatial observations within the same recording. The videos are provided in AVI format at 64 × 64 pixels. Synchronized ECG recordings, provided in NumPy (.npy) format, were used as the physiological reference for heart-rate evaluation.
The evaluation compared the heart-rate estimation performance of five conventional rPPG methods: GREEN [30], Chrominance-based method (CHROM) [31], Plane-Orthogonal-to-Skin (POS) [32], Principal Component Analysis (PCA) [33], and Independent Component Analysis (ICA) [34]. These methods were selected because they represent established approaches for extracting pulse-related information from RGB facial video.
GREEN uses temporal variations in the green channel of the RGB signal as a direct estimate of the blood volume pulse (BVP). This approach is based on the observation that the green channel generally contains strong pulse-related information in facial skin recordings. CHROM extracts pulse-related information from normalized color variations across the RGB channels. It constructs chrominance signals through linear combinations of the color channels and combines them to reduce the influence of common illumination variations and skin-color components. POS projects the temporally normalized RGB signal onto a plane orthogonal to the estimated skin-tone direction. This projection emphasizes subtle color variations associated with blood-volume changes while reducing components related to the dominant skin color. PCA transforms the temporal RGB signals into orthogonal principal components ordered according to their variance. A component can then be selected as the candidate pulse signal based on its spectral characteristics. PCA is therefore used to separate the dominant signal variations in the RGB observations and identify components containing pulse-related information. ICA treats the temporal RGB signals as mixtures of underlying sources and attempts to separate them into statistically independent components. The component exhibiting the strongest pulse-related spectral characteristics is selected as the rPPG signal. ICA is a blind source-separation approach commonly applied to rPPG signal extraction.
The processing pipeline was implemented in Python 3.12.5 and the resulting measurements were exported to a structured JSON file for subsequent visualization and analysis. Each available ROI video was processed independently and divided into consecutive, non-overlapping 30-s windows. For each window, the mean RGB values were extracted from the corresponding facial region and processed using the five rPPG methods. A common band-pass range of 0.70–3.00 Hz (42–180 BPM) was applied, and the final heart-rate estimate was obtained from the dominant peak of the power spectral density within this physiological range. For each 30-s window, the corresponding ECG segment was processed to obtain the reference heart rate using QRS peak detection. The ECG reference and rPPG estimates were then compared using mean absolute error (MAE), root mean square error (RMSE), mean bias, and the percentage of estimates within ±5% of the ECG reference.
5.2. Physiological Validation of the rPPG Pipeline
The dominant spectral frequency was converted to heart rate as:
where 60fpeak is the dominant frequency in Hz.
HRrPPG = 60fpeak
The heart-rate deviation is calculated as:
where Di represents the signed deviation for window i, and HRECG is the reference heart rate measured by ECG.
Di = ∣HRrPPG,i − HRECG,i∣
The absolute heart-rate error is calculated as:
AEi = ∣HRrPPG,i − HRECG,i∣
The mean absolute error (MAE) across N valid windows is calculated as:
The root mean square error (RMSE) is calculated as:
where (HR_{rPPG,i}) denotes the heart rate estimated by the rPPG method for analysis window (i), (HR_{ECG,i}) denotes the corresponding ECG reference value, and (N) represents the total number of valid analysis windows.
The mean bias is calculated as:
Finally, the relative error for each window is calculated as:
An estimate is considered to fall within the 5% tolerance threshold when:
REi ≤ 5%
The percentage of estimates within the 5% tolerance threshold is then calculated as:
where N_() is the number of valid windows satisfying the 5% criterion and N is the total number of valid windows.
5.3. Evaluation Dataset and Processing Coverage
The complete processing pipeline generated results for 78 ROI videos, corresponding to 1554 complete 30-s windows. Each ROI was treated as an independent signal source, while incomplete windows shorter than 30 s were excluded from the analysis. The resulting measurements were stored in the generated JSON file, including the synchronized ECG reference, raw and filtered heart-rate estimates, estimation errors, and processing status for each rPPG method and 30-s analysis window. The complete set of results is provided in the JSON file as Supplementary Materials.
5.4. Heart-Rate Comparison
Table 1 summarizes the performance of the five evaluated rPPG methods against the ECG reference. The comparison includes the number of valid estimates, MAE, RMSE, mean bias, and the percentage of estimates within ±5% of the ECG reference.
Table 1.
Performance comparison of the evaluated rPPG methods against the ECG reference.
The method achieving the lowest MAE was identified as the best-performing method. In the evaluated dataset, the best-performing method was GREEN with an MAE of 17.74 BPM. This result indicates that GREEN produced the smallest average absolute deviation from the ECG reference among the evaluated rPPG approaches.
Table S1 presents representative window-level heart-rate estimation results for the standardized 30-s analysis windows, including the ECG reference and the estimates obtained using GREEN, CHROM, POS, PCA, and ICA.
Due to the large number of analyzed windows, the complete results for all 1554 windows are provided in Supplementary Table S1. These window-level measurements constitute the basis for the aggregate performance metrics reported in Table 1.
5.5. ECG Reference Versus rPPG Methods
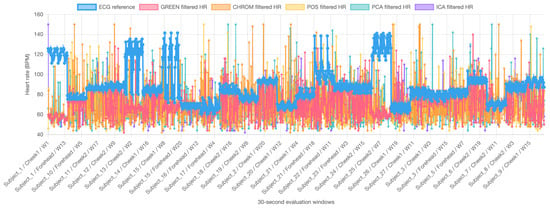
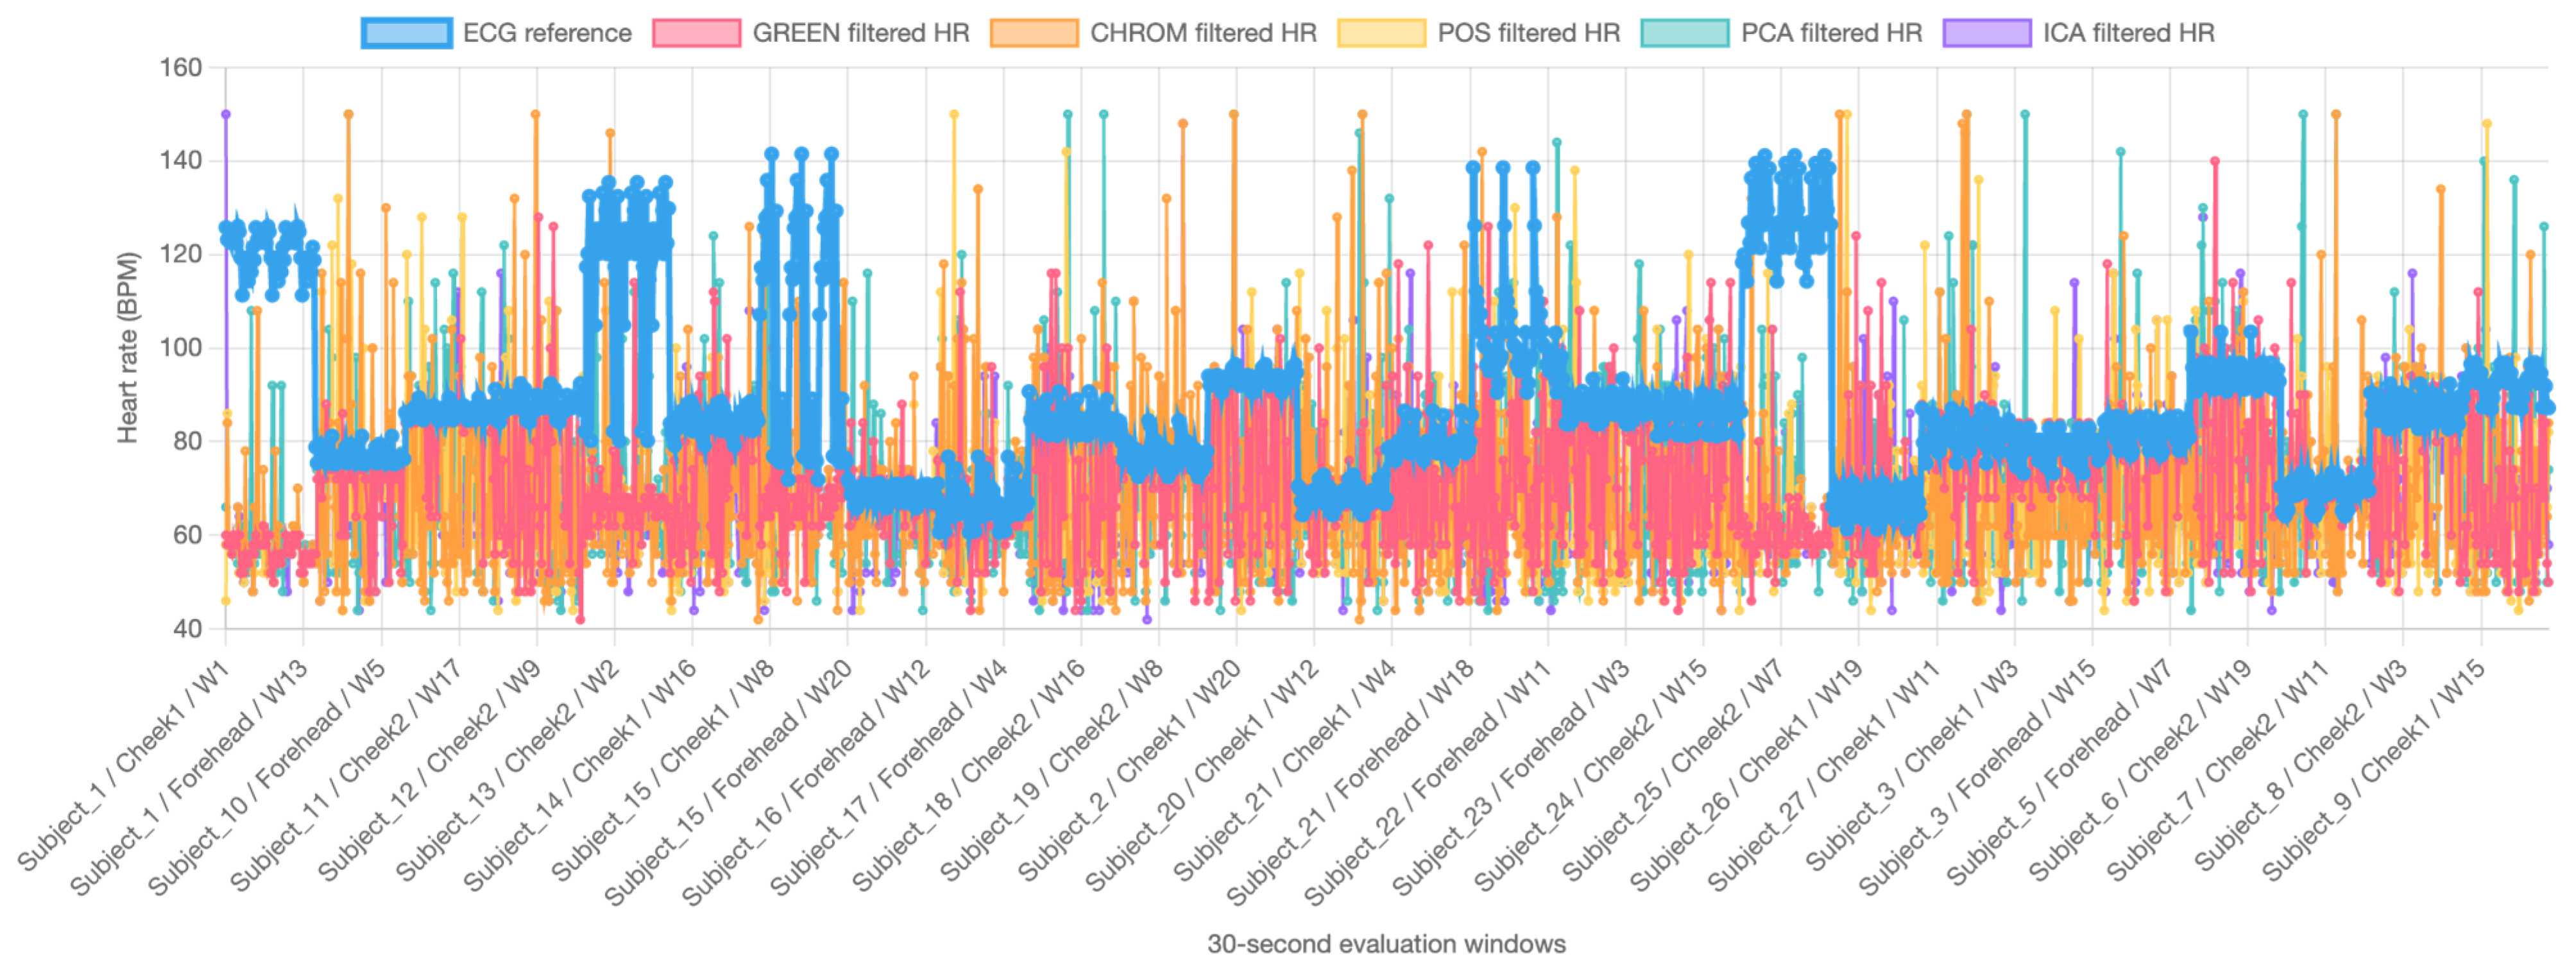
Figure 4 presents the heart-rate measurements across the processed 30-s windows, comparing the ECG reference with the filtered estimates produced by GREEN, CHROM, POS, PCA, and ICA. The figure provides a temporal comparison of the different methods and illustrates their variation relative to the ECG reference throughout the evaluated recordings.
Figure 4.
rPPG heart-rate estimates across 30-s evaluation windows for the evaluated methods (GREEN, CHROM, POS, PCA, and ICA).
The filtered estimates represent the final heart-rate values obtained after applying the common physiological-band processing described in Section 5.1. Differences between the rPPG estimates and the ECG reference are quantified using the error metrics reported in Table S1.
According to the chosen error criterion, the technique with the lowest MAE, GREEN, achieves the closest level of agreement with the ECG reference.
5.6. Error Distribution
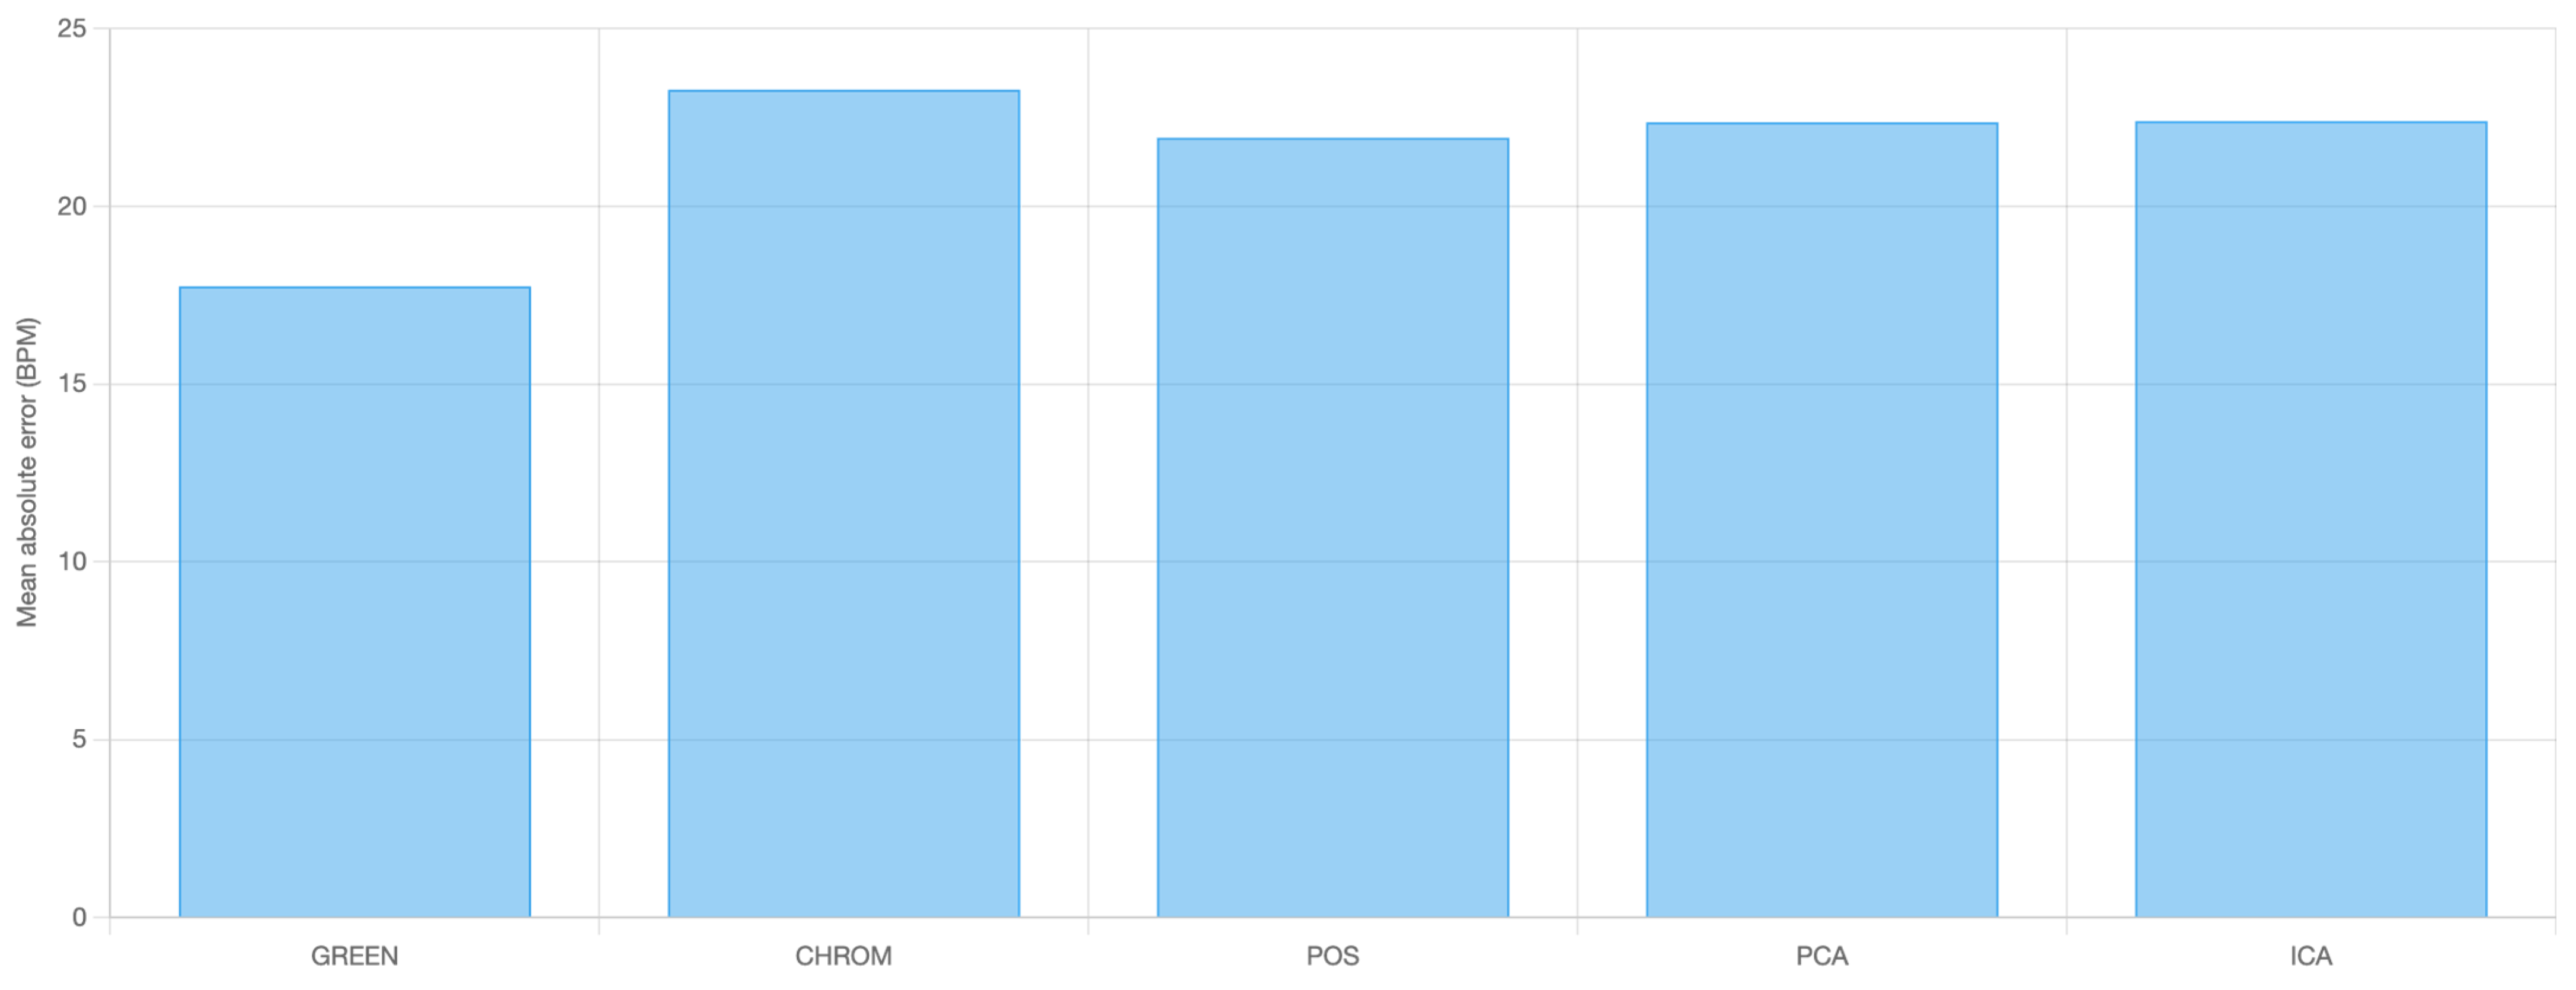
Figure 5 presents the error distribution of the evaluated rPPG methods relative to the ECG reference. The comparison is based on the absolute errors calculated for each valid 30-s window.
Figure 5.
Aggregate mean absolute error (MAE) comparison of the evaluated rPPG methods against the ECG reference across valid 30-s window used for the rPPG evaluation.
The results show differences in estimation error between the five methods. GREEN achieved the lowest MAE (17.74 BPM), indicating the smallest average absolute error among the evaluated approaches. The remaining methods exhibited higher average deviations according to their corresponding MAE values reported in Table 1.
These results provide a quantitative comparison of the evaluated rPPG methods but should not be interpreted as demonstrating clinical accuracy or clinical suitability.
5.7. ICA Processing and Convergence
The ICA implementation successfully converged for 1519 of the 1554 processed windows (97.75%), while 35 windows (2.25%) did not converge after the configured retry strategy. Converged cases included the initial configuration and the subsequent higher-iteration/tolerance configurations.
For ICA, component selection was performed using an ECG-independent spectral criterion based on physiological-band power. Therefore, the ECG reference was used only for subsequent evaluation and was not used to select the ICA component.
5.8. Results Generation and Reproducibility
The evaluation follows a reproducible Python-to-JSON workflow. The Python implementation performs signal extraction, rPPG processing, filtering, spectral analysis, ECG reference estimation, and error calculation. The resulting JSON file stores the measurements and evaluation metadata for each ROI and 30-s window.
Although the recordings had a duration of approximately 10 min, the evaluation was performed using consecutive, non-overlapping 30-s analysis windows extracted independently from each ROI recording. Heart-rate estimation was conducted within the 0.70–3.00 Hz physiological frequency band (42–180 BPM), and the ECG signal was processed to obtain the reference heart rate for each corresponding window. The same 30-s window configuration and frequency range were applied consistently across all five evaluated rPPG methods, GREEN, CHROM, POS, PCA, and ICA. Incomplete windows shorter than 30 s were excluded from the analysis, resulting in 1554 complete windows from 78 ROI recordings.
6. Discussion
This section discusses the updated T-Rehab implementation within the CareSync framework, distinguishing the demonstrated technical feasibility of the integrated prototype from the quantitative evaluation of its physiological sensing component.
6.1. Interpretation of Results
The implementation of the updated T-Rehab prototype within the CareSync framework demonstrates the feasibility of integrating heterogeneous rehabilitation data and processing components within a unified workflow. The implemented system combines physiological sensing, markerless kinematic analysis, interaction events, multimodal visualization, session replay, longitudinal analysis, and graph-based retrieval. The end-to-end implementation demonstrates that these components can operate together to generate, structure, visualize, and retrieve derived rehabilitation-session information within the proposed workflow.
In addition to demonstrating implementation feasibility, the physiological sensing component was quantitatively evaluated using the rPPG-10 benchmark dataset. Five rPPG methods, GREEN, CHROM, POS, PCA, and ICA, were compared against synchronized ECG reference measurements using standardized 30-s analysis windows. Among the evaluated methods, GREEN achieved the lowest MAE of 17.74 BPM. This result provides an empirical basis for comparing the implemented approaches and selecting an appropriate method for physiological monitoring within T-Rehab.
The combination of implementation demonstration and quantitative rPPG evaluation provides complementary evidence for the updated prototype. The implementation demonstrates the technical feasibility of the integrated multimodal workflow, while the rPPG evaluation provides quantitative evidence for the performance of its physiological sensing component.
To summarize, the results demonstrate the feasibility of the updated T-Rehab prototype within the CareSync framework and its ability to combine multimodal sensing, markerless movement analysis, structured session representation, visualization, replay, and multimedia retrieval in a coherent rehabilitation workflow. The proposed architecture provides a foundation for further development and broader evaluation of intelligent, multimodal rehabilitation applications in metaverse-based healthcare.
6.2. Limitations and Future Work
The current implementation provides a strong technical foundation for the continued development of T-Rehab within CareSync. Future work will extend the quantitative evaluation to additional recording conditions and rehabilitation scenarios, including variations in movement, illumination, camera configuration, and user characteristics.
Although the different data streams use a common software time base, cross-modal synchronization has not yet been quantitatively validated. Future work will investigate synchronization accuracy using controlled reference events detectable across the relevant streams.
The graph-based retrieval component also provides a foundation for further evaluation. Future studies will compare the proposed similarity mechanism with established baseline approaches and investigate the usefulness of its shared co-occurrence patterns for explaining retrieval results.
In summary, the updated T-Rehab implementation demonstrates the technical feasibility of the proposed multimodal rehabilitation workflow within CareSync, while the rPPG analysis provides a quantitative comparison of alternative physiological sensing approaches. Future work will focus on validating the framework through clinical scenarios and user studies, evaluating multimodal retrieval and synchronization performance, and further investigating how the proposed human-centered approach can improve the effectiveness, interpretability, privacy, and usability of immersive healthcare applications.
7. Ethics and Data Governance
Although T-Rehab is designed to operate without retaining persistent raw video, the derived data generated during a rehabilitation session may remain sensitive. These data can include physiological measurements, estimated emotional or pain-related indicators, body and joint trajectories, facial or body-derived representations, and interaction events. Accordingly, their collection and processing should be governed by appropriate consent, data-protection, access-control, and retention procedures.
For research or clinical deployment, participants should provide informed consent covering the collection and processing of physiological, motion, interaction, and derived behavioral data, including potential secondary use where applicable. The use of publicly available benchmark data in the present physiological evaluation is subject to the conditions and licensing requirements of the corresponding dataset. Data should be pseudonymized where possible, stored using appropriate encryption, and made accessible only to authorized users. Retention periods and deletion procedures should be defined according to the applicable institutional and legal requirements.
Removing persistent raw video does not eliminate privacy or re-identification risks. Derived trajectories, physiological measurements, facial or body representations, and temporally linked interaction records may still contain information that could contribute to identifying or profiling an individual, particularly when combined with other data sources. Such risks should therefore be considered in system design and deployment.
Potential demographic and skin-tone biases also require consideration, particularly for camera-based physiological estimation such as remote photoplethysmography (rPPG). The present evaluation uses a public benchmark dataset and is intended to assess technical heart-rate estimation performance; it does not establish generalizable clinical performance across demographic groups or skin tones. Future evaluations should therefore include more diverse populations and explicitly assess performance differences across relevant demographic characteristics.
The present work does not claim clinical validation or autonomous clinical decision support. The CareSync framework, through the T-Rehab prototype, demonstrates the technical feasibility of multimodal sensing, data integration, retrieval, visualization, and physiological signal processing for rehabilitation-related applications. Clinical utility, safety, and effectiveness would require separate evaluation involving appropriate participants, clinical protocols, and qualified healthcare professionals.
8. Conclusions
This paper presented CareSync, a multimodal healthcare framework that integrates multiple healthcare prototypes within a unified architecture. The updated T-Rehab prototype focuses on rehabilitation and training in the metaverse by integrating multimedia information retrieval, physiological sensing, and markerless kinematic analytics within a unified workflow. During metaverse-based rehabilitation sessions, heterogeneous information is generated through RGB cameras, the virtual rehabilitation environment, and user interactions. These sources are transformed into physiological, kinematic, and interaction descriptors and represented along a common temporal timeline.
A central contribution of T-Rehab within CareSync is the use of a structured session representation that preserves temporal relationships between physiological responses, body movements, and interaction events without requiring persistent storage of raw video. This approach addresses important storage and bandwidth considerations while retaining the information required for session replay, multimodal analysis, and retrieval.
The resulting representation also provides a foundation for multimedia information retrieval. In addition to exact clinical filtering, the framework supports the identification of similar sessions based on shared physiological, kinematic, and behavioral patterns. The structured graph-based representation further provides a basis for examining the co-occurring patterns contributing to session similarity, supporting more transparent exploration of retrieved sessions.
The updated T-Rehab implementation was further evaluated through a quantitative comparison of five rPPG methods, GREEN, CHROM, POS, PCA, and ICA, against synchronized ECG reference measurements using standardized 30-s analysis windows. Among the evaluated methods, GREEN achieved the lowest mean absolute error (MAE) of 17.74 BPM, providing the best heart-rate estimation performance under the evaluated configuration. This evaluation complements the implementation demonstration by providing quantitative evidence for the physiological sensing component of T-Rehab.
Finally, the integration of multimodal sensing, markerless movement analysis, structured session representation, visualization, session replay, and multimedia retrieval demonstrates the technical feasibility of the updated T-Rehab prototype within the broader CareSync framework. The proposed approach provides a foundation for further development and evaluation of intelligent, multimodal rehabilitation and training applications in metaverse-based healthcare.
Supplementary Materials
The following supporting information can be downloaded at: https://www.mdpi.com/article/10.3390/electronics15194407/s1, Supplementary Table S1: Complete window-level heart-rate estimation results for all 1554 analyzed 30-s windows; Supplementary Dataset S1: Generated JSON file containing the complete window-level evaluation results and associated processing metadata.
Author Contributions
Conceptualization, M.H.; methodology, H.H.; software, H.H.; validation, H.H. and M.H.; formal analysis, H.H.; investigation, H.H.; resources, M.H.; data curation, H.H.; writing—original draft preparation, H.H.; writing—review and editing, H.H.; visualization, B.V.; supervision, M.H.; project administration, P.S. and B.V. All authors have read and agreed to the published version of the manuscript.
Funding
This research received no external funding.
Data Availability Statement
The original contributions presented in this study are included in the article/Supplementary Material. Further inquiries can be directed to the corresponding authors.
Conflicts of Interest
The authors declare no conflicts of interest.
References
- Wagenpfeil, S.; Kevitt, P.M.; Hemmje, M. Smart Multimedia Information Retrieval. Analytics 2023, 2, 198–224. [Google Scholar] [CrossRef] [Scilit]
- Hadjar, H. Supporting Healthcare Applications with Affective Computing and Applied Gaming. Ph.D. Thesis, FernUniversität in Hagen, Hagen, Germany, 2026. [Google Scholar] [CrossRef]
- Morgan, J.W.; Patel, R.A.; Campbell, S. Practical considerations of clinical XR (AR/VR) deployments. Front. Virtual Real. 2025, 6, 1517402. [Google Scholar] [CrossRef] [Scilit]
- Moevus, A.; Vu, A.K.; Menezes, K.R.S.; Levin, M.F.; Kairy, D. Enhancing Extended Reality Technology for Neuromusculoskeletal Rehabilitation: Recommendations for the Development of Clinically Relevant Serious Games. J. Pers. Med. 2026, 16, 111. [Google Scholar] [CrossRef] [Scilit]
- Hadjar, H.; Mckevitt, P.; Hemmje, M. Home-based Immersive Web Rehabilitation Gaming with Audiovisual Sensors. In Proceedings of the ECCE ‘22: Proceedings of the 33rd European Conference on Cognitive Ergonomics; ACM International Conference Proceeding Series; Association for Computing Machinery: New York, NY, USA, 2022; pp. 1–7. [Google Scholar] [CrossRef] [Scilit]
- Riaz, W.; Ji, J.; Ullah, A. TriViT-Lite: A Compact Vision Transformer–MobileNet Model with Texture-Aware Attention for Real-Time Facial Emotion Recognition in Healthcare. Electronics 2025, 14, 3256. [Google Scholar] [CrossRef] [Scilit]
- Steinert, P.; Wagenpfeil, S.; Frommholz, I.; Hemmje, M.L. 256 Metaverse Records Dataset. In MM ‘24: Proceedings of the 32nd ACM International Conference on Multimedia; Association for Computing Machinery: New York, NY, USA, 2024; pp. 4256–4263. [Google Scholar] [CrossRef] [Scilit]
- Lew, M.S.; Sebe, N.; Djeraba, C.; Jain, R. Content-based multimedia information retrieval: State of the art and challenges. ACM Trans. Multimed. Comput. Commun. Appl. (TOMM) 2006, 2, 1–19. [Google Scholar] [CrossRef] [Scilit]
- Kofler, C.; Larson, M.; Hanjalic, A. User Intent in Multimedia Search: A Survey of the State of the Art and Future Challenges. ACM Comput. Surv. (CSUR) 2016, 49, 36. [Google Scholar] [CrossRef] [Scilit]
- Shimomura, L.C.; Oyamada, R.S.; Vieira, M.R.; Kaster, D.S. A survey on graph-based methods for similarity searches in metric spaces. Inf. Syst. 2021, 95, 101507. [Google Scholar] [CrossRef] [Scilit]
- Wang, M.; Xu, X.; Yue, Q.; Wang, Y. A comprehensive survey and experimental comparison of graph-based approximate nearest neighbor search. Proc. VLDB Endow. 2021, 14, 1964–1978. [Google Scholar] [CrossRef] [Scilit]
- Spiess, F.; Scharowski, N.; Haller, A.; Memeti, Z.; Schuldt, H.; Brühlmann, F. Bringing Video Browsing to Virtual Reality: Empirical Evaluation of a Novel Multimedia Drawer. In ICMR ‘24: Proceedings of the 2024 International Conference on Multimedia Retrieval; Association for Computing Machinery: New York, NY, USA, 2024; pp. 293–301. [Google Scholar] [CrossRef] [Scilit]
- Hadjar, H.; Vu, B.; Hemmje, M. Empowering Recovery: The T-Rehab System’s Semi-Immersive Approach to Emotional and Physical Well-Being in Tele-Rehabilitation. Electronics 2025, 14, 852. [Google Scholar] [CrossRef] [Scilit]
- Rouast, P.V.; Adam, M.T.P.; Chiong, R.; Cornforth, D.; Lux, E. Remote heart rate measurement using low-cost RGB face video: A technical literature review. Front. Comput. Sci. 2018, 12, 858–872. [Google Scholar] [CrossRef] [Scilit]
- Ma, X.; Tobón, D.P.; El Saddik, A. Remote Photoplethysmography (rPPG) for Contactless Heart Rate Monitoring Using a Single Monochrome and Color Camera. In Smart Multimedia; McDaniel, T., Berretti, S., Curcio, I.D.D., Basu, A., Eds.; Springer International Publishing: Cham, Switzerland, 2020; pp. 248–262. [Google Scholar]
- Sakib, S.; Hasan, Z.; Roy, N. A State-Of-The-Art Survey of Remote Photoplethysmography for Contactless Health Parameters Sensing. WIREs Data Min. Knowl. Discov. 2025, 15, e70039. [Google Scholar] [CrossRef] [Scilit]
- Tian, Y.; Li, S.; Zhu, Y.; Elgendi, M.; Lam, E.Y. Adaptive physiology-informed correction for reliable remote photoplethysmography heart-rate monitoring. npj Digit. Med. 2026, 9, 233. [Google Scholar] [CrossRef] [Scilit]
- van Putten, L.D.; Ahmed, A.; Wegerif, S. Remote photoplethysmography for contactless pulse rate monitoring: Algorithm development and accuracy assessment. Physiol. Meas. 2025, 46, 115004. [Google Scholar] [CrossRef] [Scilit]
- Chen, W.; Yi, Z.; Lim, L.J.R.; Lim, R.Q.R.; Zhang, A.; Qian, Z.; Huang, J.; He, J.; Liu, B. Deep learning and remote photoplethysmography powered advancements in contactless physiological measurement. Front. Bioeng. Biotechnol. 2024, 12, 1420100. [Google Scholar] [CrossRef] [Scilit]
- Hassanpour, A.; Yang, B. Contactless Vital Sign Monitoring: A Review Towards Multi-Modal Multi-Task Approaches. Sensors 2025, 25, 4792. [Google Scholar] [CrossRef] [Scilit]
- Vincent, K.; Khan, I.; Sun, K.; Shao, Y.; Liang, Z.; Ullah, A.; Gong, T. Smartphone-Based Acoustic Sensing for Breathing and Heartbeat Detection via AoA Clustering in Indoor Environments. Sensors 2026, 26, 4591. [Google Scholar] [CrossRef] [Scilit]
- Chougule, A.; Dowsett, M.; Ekundayomi, D.; Machesney, A.; Mather, T.; Gompels, B.; McDonnell, S. Accuracy and Validity of 3D Markerless Motion Capture Compared to Marker-Based Systems for Lower-Limb Biomechanical Assessment: A Systematic Review. Sensors 2026, 26, 3956. [Google Scholar] [CrossRef] [Scilit]
- Yoma, M.; Llurda-Almuzara, L.; Herrington, L.; Jones, R. Reliability and validity of lower extremity and trunk kinematics measured with markerless motion capture during sports-related and functional tasks: A systematic review. J. Sports Sci. 2025, 43, 1703–1730. [Google Scholar] [CrossRef] [Scilit]
- Francia, C.; Donno, L.; Motta, F.; Cimolin, V.; Galli, M.; LoMauro, A. Accuracy and Reliability of Markerless Human Pose Estimation for Upper Limb Kinematic Analysis Across Full and Partial Range of Motion Tasks. Appl. Sci. 2026, 16, 1202. [Google Scholar] [CrossRef] [Scilit]
- Cotton, R.J. Differentiable Biomechanics Unlocks Opportunities for Markerless Motion Capture. In 2025 International Conference on Rehabilitation Robotics (ICORR); IEEE: New York, NY, USA, 2025; pp. 44–51. [Google Scholar] [CrossRef] [Scilit]
- Cotton, R.J.; Sinz, F. Biomechanical Reconstruction with Confidence Intervals from Multiview Markerless Motion Capture. In 2025 47th Annual International Conference of the IEEE Engineering in Medicine and Biology Society (EMBC), Copenhagen, Denmark, 14–18 July 2025; IEEE: New York, NY, USA, 2025; pp. 1–7. [Google Scholar] [CrossRef] [Scilit]
- Ferdiansyah, F.; Suroso, J.S. Evaluation of knowledge management system to improve the performance of employees at PT Data Citra Mandiri. In 2017 International Conference on Applied Computer and Communication Technologies (ComCom); IEEE: New York, NY, USA, 2017; pp. 1–6. [Google Scholar] [CrossRef] [Scilit]
- Calingaert, P. System performance evaluation: Survey and appraisal. Commun. ACM 1967, 10, 12–18. [Google Scholar]
- Rodrigues, G.; Garcia, N. rPPG-10, Version 1; Mendeley Data: London, UK, 2025. [Google Scholar] [CrossRef]
- Verkruysse, W.; Svaasand, L.O.; Nelson, J.S. Remote plethysmographic imaging using ambient light. Opt. Express 2008, 16, 21434–21445. [Google Scholar] [CrossRef] [Scilit]
- De Haan, G.; Jeanne, V. Robust pulse rate from chrominance-based rPPG. IEEE Trans. Biomed. Eng. 2013, 60, 2878–2886. [Google Scholar] [CrossRef] [Scilit]
- Wang, W.; den Brinker, A.; Stuijk, S.; Haan, G. Algorithmic Principles of Remote PPG. IEEE Trans. Biomed. Eng. 2016, 64, 1479–1491. [Google Scholar] [CrossRef] [Scilit]
- Lewandowska, M.; Ruminski, J.; Kocejko, T.; Nowak, J. Measuring pulse rate with a webcam a non-contact method for evaluating cardiac activity. In Federated Conference on Computer Science and Information Systems (FedCSIS); IEEE: New York, NY, USA, 2011. [Google Scholar]
- Poh, M.-Z.; McDuff, D.J.; Picard, R.W. Non-contact, automated cardiac pulse measurements using video imaging and blind source separation. Opt. Express 2010, 18, 10762–10774. [Google Scholar] [CrossRef] [Scilit]

Disclaimer/Publisher’s Note: The statements, opinions and data contained in all publications are solely those of the individual author(s) and contributor(s) and not of MDPI and/or the editor(s). MDPI and/or the editor(s) disclaim responsibility for any injury to people or property resulting from any ideas, methods, instructions or products referred to in the content. |
© 2026 by the authors. Licensee MDPI, Basel, Switzerland. This article is an open access article distributed under the terms and conditions of the Creative Commons Attribution (CC BY) license.